
Influencing Health Behaviors via Short Message Service ...
135
Influencing Health Behaviors via Short Message Service (SMS): Evidence for Best Practices From Dar Es Salaam, Tanzania and Xi’an China Citation Heitner, Jesse. 2016. Influencing Health Behaviors via Short Message Service (SMS): Evidence for Best Practices From Dar Es Salaam, Tanzania and Xi’an China. Doctoral dissertation, Harvard T.H. Chan School of Public Health. Permanent link http://nrs.harvard.edu/urn-3:HUL.InstRepos:27201737 Terms of Use This article was downloaded from Harvard University’s DASH repository, and is made available under the terms and conditions applicable to Other Posted Material, as set forth at http:// nrs.harvard.edu/urn-3:HUL.InstRepos:dash.current.terms-of-use#LAA Share Your Story The Harvard community has made this article openly available. Please share how this access benefits you. Submit a story . Accessibility
Transcript of Influencing Health Behaviors via Short Message Service ...

Influencing Health Behaviors via Short Message Service (SMS): Evidence for Best Practices From Dar Es Salaam, Tanzania and Xi’an China
CitationHeitner, Jesse. 2016. Influencing Health Behaviors via Short Message Service (SMS): Evidence for Best Practices From Dar Es Salaam, Tanzania and Xi’an China. Doctoral dissertation, Harvard T.H. Chan School of Public Health.
Permanent linkhttp://nrs.harvard.edu/urn-3:HUL.InstRepos:27201737
Terms of UseThis article was downloaded from Harvard University’s DASH repository, and is made available under the terms and conditions applicable to Other Posted Material, as set forth at http://nrs.harvard.edu/urn-3:HUL.InstRepos:dash.current.terms-of-use#LAA
Share Your StoryThe Harvard community has made this article openly available.Please share how this access benefits you. Submit a story .
Accessibility
INFLUENCING HEALTH BEHAVIORS VIA SHORT MESSAGE SERVICE (SMS): EVIDENCE FOR BEST PRACTICES FROM DAR ES SALAAM, TANZANIA AND
XI’AN CHINA
JESSE HEITNER
A Dissertation Submitted to the Faculty of The Harvard T.H. Chan School of Public Health
in Partial Fulfillment of the Requirements for the Degree of Doctor of Science
in the Department of Global Health and Population Harvard University
Boston, Massachusetts.
May 2016

ii
Dissertation Advisor: Dr. David Canning Jesse Heitner
INFLUENCING HEALTH BEHAVIORS VIA SHORT MESSAGE SERVICE (SMS): EVIDENCE FOR BEST PRACTICES FROM DAR ES SALAAM, TANZANIA AND
XI’AN, CHINA
Abstract
Text messaging, also known as short message services (SMS), is a burgeoning innovation
area showing promise in eliciting health behavior changes. This dissertation details two
intervention trials that each comparatively tests the efficacy of different text message sets
intended to improve behaviors.
In light of pervasive road traffic injuries amongst young men in Tanzania, the first
intervention tested messaging strategies aimed at increasing helmet wearing amongst commercial
motorcycle taxi drivers. Participants (N=391) were randomized to receive either: 1) social
norming messages emphasizing society’s positive stance on helmets; 2) fear appeal messages
emphasizing the dangers of riding without helmets, or 3) control messages. After 6-weeks, the
odds of drivers reporting wearing their helmet “on every trip” was 1.58 times higher in the social
norming group than amongst controls, though this difference was not significant after accounting
for multiple hypothesis testing. There was little difference between fear appeal recipients and
controls.
In light of China’s excessive caesarean section rate of up to 54.9%, the second trial tested
messaging strategies aimed at reducing unnecessary caesareans. This quasi-randomized trial
assigned pregnant women (N= 4,375) to receive one of four message sets: 1) Limited “Basic”
messages, 2) A set primarily regarding Care-Seeking, 3) A set primarily regarding good prenatal
Home Practices, or 4) All Texts. Amongst women that acknowledged receiving program texts,

iii
care-seeking messages alone were associated with reduced odds of caesarean delivery (OR=0.71,
p=.045). Assignment to receive All Texts was associated with strongly reduced odds (OR =
0.65, p=0.008).
Last, an observational study utilizing the Xi’an data investigated the association
newborns being born small for gestational age (SGA) and women’s levels of family support.
Adjusted logistic regression found that high support was associated with reduced odds of SGA
(OR =0.681 p=.013). Mediation analysis suggested this association was at least partially
mediated by better nutrition supplementation and more moderate exercise.
These results suggest SMS interventions may be useful tools in eliciting behavior change
surrounding helmet wearing and mode of delivery. Some message types may outperform others,
and family support may be a useful leverage point. Further investigation is warranted.

iv
TABLE OF CONTENTS
List of Tables ………………………………………………………………………………… v Acknowledgments …………………………………………………………………………… vi Chapter I: Background and motivation for SMS interventions to improve healthy behavior in developing country contexts………………………………………………………………….. 1 Chapter II: The Impact Of Text Message (SMS) Reminders on Helmet Use Among Motorcycle Drivers In Dar es Salaam, Tanzania ………………………………………………………… 16 Appendix 2.1: SMS Message Bank ………………………………………………………… 31 Chapter III: The Effect on Cesarean Section Rates of an SMS Based Educational Intervention for Pregnant Women in Xi’an China …………………………………………………………… 42 Appendix 3.1: SMS Messages, by General Topic, Treatment Group, and Timing ……….... 80 Appendix 3.2: Messages Regarding Delivery Advice by Treatment Arm………………….. 81 Chapter IV: The Association of Familial Support with Birth Weight and Prenatal Behaviors In A Cohort from Xi’an China……………………………………………………………………. 86 Appendix 4.1: Formulation and Implementation of Mikolajczyk et al.’s SGA Cutoff ...…. 125 Appendix 4.2: Range and N of All Regression Variables…………………………………. 127
v
LIST OF TABLES
Table 1.1: Published SMS Interventions for Behavior Change from Literature Review …….…. 8 Table 2.1: Balance Check for All Observed Baseline Variables………………………….……. 24 Table 2.2: Percentage of Drivers Reporting Helmet Use Every Trip (All Time Points) ………..27 Table 2.3: Percent of Drivers Reporting Helmet Use Every Trip at 6 Weeks, by Baseline Behavior………………………………………………………………………………….……... 28 Table 2.4: Pairwise Treatment Group Comparisons of Odds of Consistent Helmet Wearing (Using Coefficient Results of Unadjusted Logistic Regression………………………….…….. 30 Table 2.5: Pairwise Treatment Group Comparisons of Odds of Consistent Helmet Wearing (Using Coefficient Results of Adjusted Logistic Regression……………………………….….. 32 Table 3.1A: Balance Check, All Baseline Variables, All Enrollees………………………….... 56 Table 3.1A: Balance Check, All Baseline Variables, Women With Follow-up Surveys……... 60 Table 3.2: Birth Method Rates By Treatment Assignment …………………………………… 66 Table 3.3: Unadjusted Logistic Regression of Caesarean Birth on Treatment Assignment....... 68 Table 3.3: Covariate-Adjusted Logistic Regression of Caesarean Birth on Treatment Group... 70 Table 4.1A Selected Dichotomous Follow-Up Variables, Pre-Imputation ……………..…… 107 Table 4.1B Exercise Frequency at Follow-Up, Pre-Imputation ……………………………… 107 Table 4.2: Adjusted and Unadjusted Odds Ratios of SGA with High Family Support …...…. 108 Table 4.3 Full Model Results of Logistic Regression of SGA on High Family Support ……. 109 Table 4.4: Unadjusted Logistic Regressions: Prenatal Behaviors on High Family Support .... 113 Table 4.5: Adjusted Logistic Regressions: Prenatal Behaviors on High Family Support …… 114

vi
ACKNOWLEDGMENTS
This dissertation would not have been possible without the following, to whom I give deep and sincere thanks: My dissertation committee members, Dr. David Canning, Dr. Margaret McConnell, and Dr. Till Barnighausen, whose advice and guidance made this research much more solid. Dr. Yanfang Su, who reached out to me, gave me opportunity, and entrusted me with a great deal of responsibility. The EMI Team, whose collaborative efforts made this research possible. Special thanks to Ben Campbell, Changzheng Yuan, Zhongliang Zhou, and Dan Wang. The Sumner L. Felberg Fellowship, for financial support during my studies. Barbara Heil, who, simply put, is invaluable. My fellow cohort Members, Susan, Stacy, Mathieu, Mitchell, and Andrea, for great company along the way. Tura Linderholm, for good advice. My family, whose contributions cannot begin to be listed in this space.

1
CHAPTER I
Background and motivation for SMS interventions to improve healthy behavior in developing country contexts
The use of text messages, also known as short message services (SMS), in public health and
clinical settings has recently received the attention of several systematic reviews, as has mobile
health (mHealth) more generally. This dissertation will report the findings of two new SMS
intervention trials both designed to test the efficacy of SMS interventions for improving health
behaviors in low and middle-income settings as well as to test the comparative efficacy of
different styles of text messages. The first trial is a randomized controlled trial in Dar Es Salam,
Tanzania investigating the use of SMS to potentially increase the wearing of motorcycle helmets
amongst motorcycle taxi drivers in the city. The second is a quasi-randomized control trial in
Xi’an China investigating the use of SMS to promote various healthier behaviors amongst
pregnant women in Gaoling County, and in particular for this dissertation the reduction of
unnecessary elective cesarean section deliveries. This dissertation will also use the same data
from Xi’an to explore predictors and motivators of healthy behavior more generally in a
subsequent chapter.
Most major health behavior theories (such as the Health Belief Model, Social Cognitive Theory,
the Theory of Planned Behavior, The Theory of Reasoned Action, and the Transtheoretical
Model) make no specific reference the potential of SMS technology, and often predate
widespread SMS usage. In this study, SMS technology is seen as a vehicle for behavioral
interventions, rather than an intervention of itself. Understanding and predicting in what
contexts certain content may be effective and why, however, has a great deal of relation to
behavioral theory. This dissertation does not attempt to discern which of the many behavioral

2
theories are most predictive in our study contexts, nor review the extensive field of health
behavior theory in any breadth. Rather, it aims to test what specific message content and social
factors are associated with the best behaviors and outcomes in our study contexts. Readers
wishing to connect the experimental and observational findings of this dissertation to behavioral
theory to theorize how the findings contained best fit within or inform behavioral theory are
referred to (Lippke and Ziegelmann, 2008; Noar and Zimmerman, 2005) as primers.
This chapter will discuss the current state of the evidence regarding the use of SMS interventions
for public health, with a particular spotlight on SMS interventions for maternal and child health.
It will show that that SMS interventions are a promising area of exploration for health
promotion, but more and better powered studies than have been done previously are warranted
before coming to any sweeping conclusions regarding their efficacy.
Chapter II will discuss findings of a randomized controlled trial was conducted in Dar es Salaam,
Tanzania, in which 391 motorcycle taxi drivers were randomized to either a control group, or to
a group receiving one of two different types of helmet wearing promotion messages. The first
group received social norming messages aimed at emphasizing society’s positive stance on
helmet wearing; the second received fear appeal messages that emphasized the dangers of riding
without a helmet. The primary outcome is the percent of respondents in each group self-reporting
that they consistently wore their motorcycle helmet on every trip over the previous week at the
study’s end-line. According to the Global Burden of Disease 2010 Study, road traffic injuries are
the second leading cause of Disability-Adjusted Life Years form men aged 15-24 in Tanzania
(Murray et al., 2013). Adherence to helmet use as remained dangerously low despite tighter

3
helmet wearing laws (Chalya et al., 2013; United Republic of Tanzania, 2009). The purpose of
this study was to comparatively determine which sorts of messages motorcyclists in Dar es
Salaam would find most motivating for increased helmet wearing in future campaigns to
promote helmet usage.
Chapter III will discuss the effect of an SMS based educational intervention for 1,952 pregnant
women in Gaoling County in Xi’an, China. China has an extremely high caesarean section
delivery rate, potentially up to 54.9% (Liu et al., 2014). The purpose of this study is to evaluate
the impact of different informational text messages (SMS) informational messages regarding
prenatal health and delivery mode on rates of caesarean section delivery in the study population,
in order to inform future interventions targeted at lowering caesarean delivery rates on the most
important messages that influence women to deliver vaginally. Participants were assigned into
one of four groups, each receiving a different set of messages, including 1) a comparison group
that received only a few “basic” messages, 2) a group receiving messages primarily regarding
care-seeking, 3) a group receiving messages primarily regarding good home prenatal practices,
and 4) a group receiving all text messages. The “Basic” message group was sent no messages
regarding mode of delivery. The “Care Seeking” message group was sent seven relevant
messages, generally focusing on describing proper indications for caesarean, and cautions
regarding risks of caesareans. The “Home Practices” group received fifteen relevant messages,
generally focusing on inspiring confidence in vaginal delivery and discussing non-anesthetic
ways to reduce and cope with pain during delivery. The “All Texts” group was sent all texts in
both other intervention groups.

4
Finally, Chapter IV will discuss the association of Familial Support on Prenatal Behaviors and
Small for Gestational age in the same cohort of 1,952 women in Xi’an China described in
Chapter III. This chapter does not assess the effect of the SMS intervention as the previous
chapter does, but rather assess if social support from a woman’s family is associated with better
birth outcomes as measured by small for gestational age. Further, the study investigates whether
such an association might be mediated through an association with better health behaviors, and if
so, which ones. In 2015, China had 16.55 Million new births (National Bureau of Statistics of
China, 2016). With the recent relaxations in China’s one child policy, this number could grow
considerably in the next few years. Understanding the current influences of newborn health in
China, particularly as influenced by modifiable health behaviors, could potentially benefit
millions of new parents and health practitioners during years that could see a baby boom within
the country.
Background SMS for Maternal and Child Health
Only two review papers have focused specifically on the use of mHealth for maternal and
newborn health. A 2011 review paper by Noordam and colleagues evaluated the use of mHealth
specifically within the context of Low and Middle Income Countries (LMIC). A main finding of
the paper was that “Robust studies providing evidence on the impact of introducing mobile
phones to improve the quality or increase the use of maternal health services are lacking.”
(Noordam et al., 2011). Another 2011 review by Tamrat and Kachnowski took a broader scope
and reviewed mHealth programs for both maternal and newborn health around the world. The
authors concluded that “mHealth presents a new and pervasive platform for addressing prenatal
5
and newborn health,” but also pointed out that a “relative scarcity of articles with a quantitative
design challenged the ability to statistically corroborate the impact of mHealth.” (Tamrat and
Kachnowski, 2012). Evidence from the studies in these reviews and more recent publications
indicate that though it seems promising that mHealth interventions can help mothers feel more
prepared, evidence on actual health behaviors or health outcomes is unclear, and larger-scale
evaluations seem warranted (Evans et al., 2012; Jareethum et al., 2008; Lund et al., 2012;
Naughton et al., 2012). However, despite this scarcity of maternal and child health specific
evidence, much more can be posited about the use potential uses of mHealth for maternal and
child health than these limited findings would suggest. Substantial literature suggests that the
use of text messages can be an effective intervention for generating several types of behavior
change in recipients, as detailed below. Particularly studied are clinic attendance and vaccination
rates, but other behavioral studies have also showed good promise.
SMS for Clinic Attendance
One well-studied area is the effect of SMS appointment reminders on on-time clinic attendance.
Guy and colleagues recently conducted a systematic review of the effect of SMS reminders on
clinic attendance that covered studies published by June 2010. Meta-analysis concluded that
there was significant heterogeneity of effect size by study design (RTCs vs. observational
studies), though not by clinic type, message timing, or age of target group. The summary
measure from the RTCs was an odds ratio of attendance of 1.48 (1.23-1.72). These findings echo
a broader 2011 review by Hasvold and Wootton that covered SMS, phone, and automated phone
calls. All studies except one (the same as in Guy and colleague’s review) suggested a positive

6
effect, with an average reduction of 34% in clinic non-attendance (Hasvold and Wootton, 2011).
In one study too recent to be included in either review, Lin and colleagues (Lin et al., 2012),
randomized 258 parent child pairs from the Childhood Cataract Program of the Chinese Ministry
of Health to either receive SMS mobile phone appointment reminders or not. Re-scheduling was
not permitted, except in cases of additional serious procedures being required. The SMS
reminders significantly increased appointment attendance, and the authors found that the number
needed to remind to gain 1 additional visit was 3.
SMS for Vaccinations
Another area showing great promise for SMS interventions is in vaccination rates. There are no
recent systematic reviews specifically focused on the use of text messaging to improve
immunization uptake; however, a large body of evidence suggests text messages could be a
useful tool for increasing immunization rates. A 2007 Cochrane review of reminders to improve
immunization rates (Jacobson Vann and Szilagyi, 2005), which included all formats for reminder
systems and reviewed 47 studies, found that increases in immunization rates due to reminders
were in the range of 1 to 20 percentage points, and that for childhood vaccinations the OR was
1.47 (1.28 – 1.68). It found that all types of reminders were effective (postcards, letters,
telephone, or autodailer calls) with telephone being both the most effective and most costly.
However, research specific to SMS intervention efficacy published since the 2007 update of the
Cochrane review is limited and provides only mixed evidence on its impact on immunization
rates. Kharbanda and colleagues performed a non-randomized trial comparing those patients of

7
nine participating New York City pediatric clinical sites whose parents enrolled in an SMS
reminder system to those parents whose parents did not self-enroll. While there was a large
significant difference in uptake between those whose parents enrolled and those who did not, an
intent-to-treat analysis comparing vaccination rates amongst all patients whose parents were
offered enrollment to all patents in the pre-intervention analysis found only a small and
statistically insignificant increase in vaccination rates (Kharbanda et al., 2011). A 2012 RTC of
204 pregnant mothers in the U.S. found only a 1.7% (-11.1, 14.5%) increase in vaccination rates
for seasonal flu between the study arm that received pregnancy-related general preventative
health information via SMS and the study arm that received that received the same general
messages as well as extra messages regarding the importance of influenza vaccination (Moniz et
al., 2013). A 2012 pilot RTC of 90 newborns in Kansas found no statistical difference in
vaccination status at 2, 4, or 6 months between children whose parents received a standard
appointment card at the previous appointment and those who received both the appointment card
and a reminder text message 7 days prior to the immunization due date (Ahlers-Schmidt et al.,
2012). However the authors note that control group parents had higher annual income than
intervention parents, suggesting that children in the control arm may have been more likely than
intervention parents to immunize their children prior to the intervention.
In the most promising findings published since the Cochrane review, Stockwell and colleagues
(Stockwell et al., 2012) randomized parents of 9213 children and adolescents in pediatric clinics
in New York City to a text message intervention aimed at increasing influenza vaccination. The
intervention group received a series of 5 weekly, automated test message influenza vaccine

8
reminders. Analysis of all participants at the fall review date showed 53.6% of the intervention
group and 50.6% of the usual care group were vaccinated (RD=3.0%, (0.94, 5.10%).
The authors stat that to their knowledge, their trial “is the first large, population-based
randomized controlled trial of the effectiveness of text message vaccine reminders.”
SMS for Other Behavior Change
Three systematic reviews have been published which have examined the use of text messaging as
a vehicle for behavior change (Cole-Lewis and Kershaw, 2010; Fjeldsoe et al., 2009; Wei et al.,
2011). These reviews have overlapped in the studies on which they draw, but each also has a
unique set of studies not represented in the other reviews. However, none of them draw on the
attendance rate or immunization rate literature. Table 1.1 lists the studies represented in each
systematic review, and each paper is briefly summarized below.
Table 1.1: Published SMS Interventions for Behavior Change from Literature Review
First Author Year
Intervention Target Study design
Study Size
Fjeldsoe et al., 2009
Cole-Lewis & Kershaw 2010
Wei, Hollin, & Kachnowski 2011
Dunbar 2003 Antiretroviral Adherence pilot 25 Y
Kwon 2004 Diabetes self-management pre-post 185 Y
Marquez 2004
Hypertension medication compliance
randomized cluster 104 Y
Márquez Contreras 2004
Hypertension tablet adherence RCT 104 Y
Obermayer 2004 Smoking cessation pre-post 46 Y Y
Vahatalo 2004 Diabetes self-management
nonparallel, non-RCT 200 Y
Bramley** 2005 Smoking cessation RCT 1705 Y
Ostojic 2005 Asthma self-management RCT 16 Y Y Y
Rodgers ** 2005 Smoking cessation RCT 1705 Y Y Y

9
Table 1.1 (Continued)
Rodgers ** 2005 Smoking cessation RCT 1705 Y Y Y
Franklin 2006 Diabetes self-management RCT 92 Y Y Y
Rami 2006 Diabetes self-management
randomized crossover 36 Y Y
Robinson 2006 Bulimia nervosa outpatient care pre-post 21 Y
Benhamou 2007 Diabetes Management
randomized crossover 30 Y
Hurling 2007 Physical Activity RCT 77 Y
Joo 2007
Anti-obesity behavior modification pre-post 927 Y
Kim (a) ++ 2007 Diabetes self-management RCT 60 Y Y Y
Kim (b) ++ 2007 Diabetes Management
quasi- experimental 60 Y
Kollman 2007 Diabetes self-management pre-post 10 Y
Logan 2007
Hypertension self management in diabetic patients pre-post 33 Y
Kim(a)++, ^ 2008
Diabetes Management
quasi- experimental 60 Y Y
Kim (b) ++ 2008 Diabetes Management
quasi- experimental 60 Y
Mao 2008 Medication adherence pilot 100 Y
Shapiro 2008 Childhood weight loss control RCT 58 Y
Spaniel 2008 Schizophrenia relapse prevention pre-post 45 Y
Yoon ++, ^ 2008 Diabetes Management
quasi- experimental 60 Y Y
Armstrong 2009 Sunscreen use RCT 70 Y
Cho 2009 Diabetes Management RCT 75 Y
Cocosila 2009 Adherence to vitamin regimen RCT 102 Y Y
Gerber 2009 Weight loss control pilot 95 Y Haapala 2009 Weight Loss RCT 126 Y Y
Hanauer 2009 Diabetes Management RCT 40 Y Y
Haug 2009 Smoking cessation RCT 174 Y
Khokhar 2009 Breast self-examination pre-post 106 Y
Miloh 2009 Immunosuppressant adherence pre-post 41 Y

10
Table 1.1 (Continued)
Newton 2009 Physical Activity RCT 78 Y
Ollivier 2009
Malaria chemoprophylaxis adherence RCT 424 Y
Patrick 2009 Weight Loss RCT 65 Y Y
Shapiro 2009 Bulimia nervosa self-monitor pre-post 31 Y
Strand-bygaard 2010
Asthma treatment adherence RCT 26 Y
** These papers come from the same study. ++ These papers come from the same study. ^ Cole-Lewis & Kershaw describe these as quasi-experimental; Wei et al describes them as RCTs Fjeldsoe et al.
In the earliest of the three papers on the subject, Fjelsoe and colleagues (Fjeldsoe et al., 2009)
collected evidence based on the inclusion criteria that the intervention 1) be delivered primarily
via SMS, 2) target a change in health behavior, 3) have at least a pre-post design, and 4) be
published in English in a peer-reviewed journal. Their search found 14 studies that met their
inclusion criteria. The authors found that significant, positive behavior change effects were found
in eight studies, five studies demonstrated positive but not statistically significant trends, and that
one found no trend. However, the authors state that “The broad range of study designs used and
the varying use of specific SMS characteristics in interventions limit the conclusions that can be
drawn from this review.” They recommend that “Future studies should use adequate sample sizes
to provide sufficient statistical power for detecting hypothesized effects.”
Cole-Lewis & Kershaw
In a 2010 study, Cole-Lewis & Kershaw (Cole-Lewis and Kershaw, 2010) review the use of text
messaging as a tool for disease prevention and management. The authors searched for
randomized or quasi-experimental controlled trials that used text messaging as the primary

11
(though not necessarily only) intervention for disease prevention or management, finding 17
articles representing 12 studies met their inclusion criteria. The authors report that three of the
twelve studies were not sufficiently powered to detect a difference in the primary outcome, and
were thus inconclusive, but that “Eight of the 9 sufficiently powered studies found evidence to
support text messaging as a tool for behavior change in disease prevention … and management.”
(Cole-Lewis and Kershaw, 2010). The significant behavioral changes included greater
prevalence of non-smoking by smokers and more frequent monitoring and reporting of blood
glucose via text message compared with email. Significant clinical outcomes included greater
weight loss in obese adults and larger declines in hemoglobin A1c levels in diabetics.
Inconclusive behavioral results were found for adherence to using vitamins by healthy college
students and physical activity as measured by daily step count. Inconclusive clinical results were
found for peak expiratory levels in asthmatic adults.
Wei, Hollin, & Kachnowski
In the most recent review, Wei Hollin & Kachnowski reviewed the literature on text messaging
for clinical and healthy behavior interventions (Wei et al., 2011). The authors excluded studies
that were part of a package of which text messaging was only a component. Their final review
included 24 articles that met their inclusion criteria; 7 were on medication adherence, 8 on
clinical care management, and 9 on preventative behavior modification. The authors found that
10 of the 16 RCTS found significant improvements, and the remaining 6 suggested positive
trends. Of the 5 pre-post studies, 4 found significant benefits and the other suggested a positive
trend. Of the 3 feasibility pilots, all reported satisfaction and acceptability. Discussing the whole

12
set of research papers, the authors note that many studies were under-powered, and evaluation
periods too short to make valid inferences about long-term efficacy.
LMIC Specific Evidence
Nearly all of the above data comes from developed countries. In order to get a view of what may
be the effect of SMS interventions in LMIC, two studies have conducted systematic reviews
focused on LMIC SMS interventions which, unlike the above studies, pull heavily from the grey
literature (Déglise et al., 2012; Gurman et al., 2012). The results of these studies are presented
next.
Deglise et al
Focusing only in developing countries, the authors of this 2012 review examined SMS-supported
interventions in four areas: prevention, surveillance, disease-management, and patient
compliance. The authors found 98 SMS interventions, only 31 of which were evaluated. With
regards to prevention, only four reported an evaluation, all of which were in the grey literature.
The authors note that all evaluations were about process outcomes, and none included
information about behavior change. Overall, the authors conclude that text messaging improved
the process of care and was well accepted by both health workers and target populations.
However, they also conclude there was a lack of high-quality intervention studies in the peer-
reviewed literature, especially on clinical outcomes, with most outcomes reporting process or
satisfaction (Déglise et al., 2012).

13
Gurman et al.
The authors reviewed 44 articles in full, 16 of which reported evaluation data. Of the
interventions presented in Gurman and colleagues review which are not already discussed above,
there are two which quantitatively compare the SMS intervention results with a control. The
first is a Kenyan trial on adherence to antiretroviral treatments, which reported significantly
improved non-adherence (RR=0.81, (0.69, 0.94)) and lower occurrence of virologic failure
(RR=0.84, (0.71, 0.99)) (Lester et al., 2010). Gurman and colleagues also report that the South
African Project Masiluleke bulk text messaging of 1 million texts per day for a year was
responsible for a 300% increase to an HIV hotline (Gurman et al., 2012)
Current SMS Evidence Summary & Conclusions
SMS interventions are an effective means at increasing kept appointments, though they may or
may not be as effective as voice reminders. Vaccine and immunization reminders have been
generally found to be effective in increasing uptake, though the range of effectiveness is broad
and SMS-specific evidence is scarce. Several small trials have failed to find significant effects in
intent-to-treat analysis, but two very large trials found significant effects. Other behavior
changes seem possible, and the literature is almost universally suggestive of positive effects.
However, findings are often insignificant due to small sample sizes and insufficient statistical
power. Also, significant positive change is more often found in process outcomes than in health
outcomes. To date, no known studies have been published experimentally testing the use of an
SMS intervention aiming to increase motorcycle helmet use have been published, nor are have
any studies investigating an SMS intervention targeting change in pregnant women’s mode of
14
delivery been published. Larger scale studies are recommended to further investigate the
possibilities of SMS effectiveness.
BIBLIOGRAPHY Ahlers-Schmidt, C.R., Chesser, A.K., Nguyen, T., Brannon, J., Hart, T.A., Williams, K.S.,
Wittler, R.R., 2012. Feasibility of a randomized controlled trial to evaluate Text Reminders for Immunization Compliance in Kids (TRICKs). Vaccine 30, 5305–5309. doi:10.1016/j.vaccine.2012.06.058
Chalya, P.L., Dass, R.M., Mchembe, M.D., Mbelenge, N., Ngayomela, I.H., Chandika, A.B., Gilyoma, J.M., Mabula, J.B., 2013. Citywide trauma experience in Mwanza, Tanzania: a need for urgent intervention. J. Trauma Manag. Outcomes 7, 1.
Cole-Lewis, H., Kershaw, T., 2010. Text messaging as a tool for behavior change in disease prevention and management. Epidemiol. Rev. 32, 56–69.
Déglise, C., Suggs, L.S., Odermatt, P., 2012. SMS for disease control in developing countries: a systematic review of mobile health applications. J. Telemed. Telecare 18, 273–281.
Evans, W.D., Wallace, J.L., Snider, J., 2012. Pilot evaluation of the text4baby mobile health program. BMC Public Health 12, 1031. doi:10.1186/1471-2458-12-1031
Fjeldsoe, B.S., Marshall, A.L., Miller, Y.D., 2009. Behavior Change Interventions Delivered by Mobile Telephone Short-Message Service. Am. J. Prev. Med. 36, 165–173.
Gurman, T.A., Rubin, S.E., Roess, A.A., 2012. Effectiveness of mHealth behavior change communication interventions in developing countries: a systematic review of the literature. J. Health Commun. 17, 82–104.
Hasvold, P.E., Wootton, R., 2011. Use of telephone and SMS reminders to improve attendance at hospital appointments: a systematic review. J. Telemed. Telecare 17, 358.
Jacobson Vann, J.C., Szilagyi, P., 2005. Patient reminder and recall systems to improve immunization rates. Status Ed. No Change Conclusions.
Jareethum, R., Titapant, V., Tienthai, C., Viboonchart, S., Chuenwattana, P., Chatchainoppakhun, J., 2008. Satisfaction of Healthy Pregnant Women Receiving Short Message Service via Mobile Phone for Prenatal Support: A Randomized Controlled Trial. J Med Assoc Thai 91, 458–63.
Kharbanda, E.O., Stockwell, M.S., Fox, H.W., Andres, R., Lara, M., Rickert, V.I., 2011. Text message reminders to promote human papillomavirus vaccination. Vaccine 29, 2537–2541.
Lester, R.T., Ritvo, P., Mills, E.J., Kariri, A., Karanja, S., Chung, M.H., Jack, W., Habyarimana, J., Sadatsafavi, M., Najafzadeh, M., 2010. Effects of a mobile phone short message service on antiretroviral treatment adherence in Kenya (WelTel Kenya1): a randomised trial.
Lin, H., Chen, Weirong, Luo, L., Congdon, N., Zhang, X., Zhong, X., Liu, Z., Chen, Wan, Wu, C., Zheng, D., Deng, D., Ye, S., Lin, Z., Zou, X., Liu, Y., 2012. Effectiveness of a short message reminder in increasing compliance with pediatric cataract treatment: a randomized trial. Ophthalmology 119, 2463–2470. doi:10.1016/j.ophtha.2012.06.046

15
Lippke, S., Ziegelmann, J.P., 2008. Theory-Based Health Behavior Change: Developing, Testing, and Applying Theories for Evidence-Based Interventions. Appl. Psychol. Int. Rev. 57, 698–716.
Liu, Y., Li, G., Chen, Y., Wang, X., Ruan, Y., Zou, L., Zhang, W., 2014. A descriptive analysis of the indications for caesarean section in mainland China. BMC Pregnancy Childbirth 14.
Lund, S., Hemed, M., Nielsen, B.B., Said, A., Said, K., Makungu, M.H., Rasch, V., 2012. Mobile phones as a health communication tool to improve skilled attendance at delivery in Zanzibar: a cluster-randomised controlled trial. BJOG Int. J. Obstet. Gynaecol. 119, 1256–1264. doi:10.1111/j.1471-0528.2012.03413.x
Moniz, M.H., Hasley, S., Meyn, L.A., Beigi, R.H., 2013. Improving Influenza Vaccination Rates in Pregnancy Through Text Messaging: A Randomized Controlled Trial. Obstet. Gynecol.
Murray, C.J., Vos, T., Lozano, R., Naghavi, M., Flaxman, A.D., Michaud, C., Ezzati, M., Shibuya, K., Salomon, J.A., Abdalla, S., others, 2013. Disability-adjusted life years (DALYs) for 291 diseases and injuries in 21 regions, 1990–2010: a systematic analysis for the Global Burden of Disease Study 2010. The lancet 380, 2197–2223.
National Bureau of Statistics of China, 2016. China’s Economy Realized a Moderate but Stable and Sound Growth in 2015 [WWW Document]. URL http://www.stats.gov.cn/english/PressRelease/201601/t20160119_1306072.html (accessed 3.7.16).
Naughton, F., Prevost, A.T., Gilbert, H., Sutton, S., 2012. Randomized controlled trial evaluation of a tailored leaflet and SMS text message self-help intervention for pregnant smokers (MiQuit). Nicotine Tob. Res. Off. J. Soc. Res. Nicotine Tob. 14, 569–577. doi:10.1093/ntr/ntr254
Noar, S.M., Zimmerman, R.S., 2005. Health Behavior Theory and cumulative knowledge regarding health behaviors: are we moving in the right direction? Health Educ. Res. 20, 275–290.
Noordam, A.C., Kuepper, B.M., Stekelenburg, J., Milen, A., 2011. Improvement of maternal health services through the use of mobile phones. Trop. Med. Int. Heal. TM IH 16, 622–626. doi:10.1111/j.1365-3156.2011.02747.x
Stockwell, M.S., Kharbanda, E.O., Martinez, R.A., Vargas, C.Y., Vawdrey, D.K., Camargo, S., 2012. Effect of a text messaging intervention on influenza vaccination in an urban, low-income pediatric and adolescent population: a randomized controlled trial. JAMA J. Am. Med. Assoc. 307, 1702–1708. doi:10.1001/jama.2012.502
Tamrat, T., Kachnowski, S., 2012. Special delivery: an analysis of mHealth in maternal and newborn health programs and their outcomes around the world. Matern. Child Health J. 16, 1092–1101. doi:10.1007/s10995-011-0836-3
United Republic of Tanzania, 2009. National Road Safety Policy. Ministry of Infrastructure Development, Dar es Salaam.
Wei, J., Hollin, I., Kachnowski, S., 2011. A review of the use of mobile phone text messaging in clinical and healthy behaviour interventions. J. Telemed. Telecare 17, 41–48.

16
CHAPTER II The Impact Of Text Message (SMS) Reminders On Helmet Use Among Motorcycle Drivers In
Dar es Salaam, Tanzania ABSTRACT
Objective: To evaluate the impact of text message (SMS) reminders on helmet use among
motorcycle taxi drivers in Dar es Salaam, Tanzania.
Design: A randomized controlled trial was conducted to measure the impact of two different
types of SMS messages promoting consistent helmet use. Adherence to helmet use was evaluated
by self-report through surveys conducted at baseline, 3 weeks and 6 weeks.
Setting: Participants were 391 commercial motorcycle taxi drivers across the three districts of
Dar es Salaam, Tanzania, recruited via convenience sampling at motorcycle taxi hubs where
drivers congregate to attract passengers.
Methods: Participants were randomized into one of three groups, each receiving a different set
of messages: 1) social norming messages aimed at emphasizing society’s positive stance on
helmet wearing, and; 2) fear appeal messages that emphasized the dangers of riding without a
helmet, and 3) control group messages, which included basic road safety messages unrelated to
helmet use. Every participant received the control messages. Texts were delivered in Kiswahili
via MightyText, a mass-messaging platform, during off-peak hours for the drivers.
Results: Over a 6-week period, the odds of self-reporting consistent helmet use was estimated to
be 1.58 times higher in the social norming group than in the control group (p=.043), though this

17
difference is not significant for a Type I error rate of α=.05 after accounting for multiple testing
by either the Holm-Bonferroni method or by Fisher’s Least Significant Difference. There was
little difference between fear appeal and control group recipients (OR= 1.03, p=.466). Subgroup
analysis suggests that both fear control and social norming message types might have been
associated with increased helmet use among participants who did not consistently wear helmets
at baseline (OR= 1.66, OR=1.84), but this was not significant for a Type I error rate of α=.05
(p=.109, p=.071). Amongst those who were consistent wearers at baseline, the social norming
messages performed better than the fear appeal messages, and this difference reached traditional
significance (p=.029), but is not significant for a Type I error rate of α=.05 after accounting for
multiple testing.
Conclusions: The use of SMS reminders may improve helmet use among motorcycle drivers
when framed as social norming messages. Both fear appeal and social norming messages might
have an effect on inconsistent wearers, but social norming messages seemed to outperform fear
appeal messages, particularly amongst drivers who were already consistent helmet users. Given
that nearly half of the drivers in our sample did not consistently wear their helmets on every trip,
strategies to increase consistent usage could be an important benefit to public safety.
Trial Registration: clinicaltrials.gov Identifier: NCT02120742
18
I. Background
Road traffic injury is a pressing and neglected public health issue in Tanzania, particularly for
young men. According to the Global Burden of Disease 2010 Study, road traffic injury is the
second leading cause of Disability-Adjusted Life Years (DALYs) for men ages 15-24 in the
country (Murray et al., 2012). Men are particularly at high risk of road traffic injuries because
nearly all drivers of motorcycle taxis (in Kiswahili, “bodabodas,” or for short, “bodas”), a major
form of public transportation in the country, are men.
Studies have shown that helmet use can significantly reduce disability and death resulting from
road traffic injuries (Liu et al., 2004). Because of this, efforts have been made by the Tanzanian
government to develop tighter helmet use laws (United Republic of Tanzania, 2009). However,
adherence to helmet use has remained dangerously low throughout the country (Chalya et al.,
2012; Okyere, n.d.). This is partly because enforcement of laws is so limited (United Republic of
Tanzania, 2009).
One promising intervention to promote helmet use is the introduction of SMS reminders
delivered to boda drivers. There is substantial evidence that mobile health interventions utilizing
SMS can lead to behavior change. For instance, in the largest study of its kind, texts reminding
participants not to smoke significantly increased the chances that someone would stop smoking
in a smoking cessation program (Free et al., 2011). Other studies have shown that text reminders
can dramatically improve adherence to medication regimens (Park et al., n.d.; Vervloet et al.,
2012). Because of the high prevalence of cell phone and SMS use in Tanzania, especially among

19
young people, the context is appropriate for such an intervention (Lancaster, 2015). To address
the pervasive issue of limited helmet use, we implemented an innovative program, which
delivers SMS messages to boda drivers over a 6-week period, reminding and persuading them to
wear their helmets. To date, no program like this has been implemented and rigorously
evaluated. This study fills a critical research gap by evaluating this unique SMS program in the
form of a randomized, controlled trial. The literature suggests that it takes approximately 21 to
42 days to form a new habit, so the 6-week study period was determined to be a sufficient time
period to measure changes in helmet use (Burns, 2008; Nikolajsen and Jensen, 2001). The rate if
consistent helmet wearing at the study’s 6-week endpoint is the primary outcome of interest in
this study.
In addition to evaluating whether text reminders increase helmet use, this study also aims to
measure which type of message leads to the greatest increase in helmet use. Substantial evidence
from the field of behavioral psychology shows that the framing of messages affects the level of
behavior change. For instance, recent studies have shown that messages informing college
students that a majority of their peers do not binge drink can lead to a significant decrease in
binge drinking (Rosenberg, 1364389203). This type of messaging, based on what is referred to
as the social norming model, could prove a more effective way of communicating road safety
messages, particularly for men, than a longstanding health communication method, which is an
appeal to fear. Findings from two recent studies support this idea by showing that road safety
advertisements threats of social consequences, such as the threat of losing one’s driving license,
were more effective at changing young males’ driving behaviors than were advertisements
depicting harsh physical consequences (Harré et al., 2005; Lennon et al., 2010). The fear appeal

20
method, while historically prominent in the field of public health, has more recently shown to be
ineffective in leading to behavior change, especially among young men (Wundersitz et al.,
2010). For example, a study by Woolley et al. demonstrated that men often dissociate their own
speeding behaviors from a social problem and therefore perceive related fear appeals as being
directed more towards others than themselves (Wundersitz et al., 2010). This is consistent with a
broader trend in the psychology of aging literature wherein younger adults are more motivated
by potential rewards than loss aversion, a balance that reverses in older adulthood (Ebner et al.,
2006). In this study, we test social norming and fear appeal messages against a control and
against each other to see which, if either, has a greater impact on helmet use.
II. Study Design
We conducted a randomized, controlled trial to evaluate the impact of a SMS program on helmet
use among boda drivers in Dar es Salaam, Tanzania. This study was approved by the
Institutional Review Board (Committee for the Protection of Human Subjects) at Dartmouth
College, USA, and the Ethics Review Committee at Muhimbili University of Health and Allied
Sciences (MUHAS), Tanzania. Participants were recruited in a convenience sample from the
general population of boda drivers in three districts of in Dar es Salaam. Boda drivers were
approached at boda stands, which are defined as having three or more boda drivers waiting for
clients. The inclusion criteria required participants to be 18 years or older, to own a mobile
telephone with SMS capabilities, to demonstrate the ability to retrieve SMS messages, and to
have access to a helmet. Pre-intervention power calculations indicated that 385 participants
would be needed to detect a 20 percentage point increase in consistent helmet use over an

21
anticipated baseline of 32.4% being consistent users. In total, 391 participants were recruited
into the study. There were no incentives to join the study.
All participants were informed that they would receive three SMS messages a week. Based on a
pre-study questionnaire, it was determined that the best time to deliver SMS messages was
between 6am and 7am, during off-peak hours. Participants were randomized into three different
arms using a random number generator, with each group receiving a different types of message:
1) social norming (for example, “Most of your peers properly wear their helmet every day – do
you?”); 2) fear appeal (for example, “If you do not wear your helmet while driving, you will
increase your chances of injury”); and 3) control, which included basic road safety messages (for
example, “This is a short reminder to not speed while driving your boda”). Groups 1 and 2
received the control message in addition to their group-specific messages. The information in
the social-norming messages and that in the fear appeal messages was designed to be both
motivational and accurate, and was based on literature review on motorcycle helmet use and road
safety in Tanzania and the surrounding region. Participants received the intervention between
May and June 2014. Three texts per week were delivered in the local language, Kiswahili, using
a mass-messaging platform called MightyText. Texts were sent Monday, Wednesday, and
Friday mornings. For the complete list of messages in English and Swahili, and the literature
source for each message, please see Appendix 2.1.
Randomization proceeded in a four-step process that was designed to create matched triplets of
drivers and to randomly assign one member from each triplet to each of the three study arms.
The four steps were as follows: First, a logistic regression of consistent helmet use on

22
demographic and other driving habit covariates was used to create a propensity score for
predicting baseline helmet use. Second, participants were stratified into two groups: those who
at baseline reported they had consistently worn their helmet on all trips in the past two weeks,
and those who reported inconsistent use. Third, within each stratum, triplets of 3 participants
were made by beginning with the individual with the lowest propensity score in the stratum, and
assigning the 3 individuals with the lowest, then next 3 lowest, etc. to the same “propensity
triplet”. One individual with the highest score remained unmatched into a triplet. Fourth and
finally, for each triplet an integer from 1 to 6 was randomly drawn with replacement. Each
integer represented one of the 6 permutations by which three (ordered) individuals may be
assigned one each to three different treatments: (ABC, ACB, BAC, BCA, CAB, CBA). The
individuals in the triplet were thereby simultaneously assigned to an arm of the study, with one
member of each triplet in each treatment arm. The last individual with the highest score was
similarly assigned, and treated as the lowest score in their own triplet.
Matching in this fashion had two aims: First, it created equally sized treatment arms which
maximized statistical power across the planned group comparisons. Secondly, it was intended to
balance the drivers’ unobservable propensity to wear helmets across treatment arms by ensuring
that baseline helmet use and predicted helmet use were balanced across treatment arms. By
stratifying randomization by baseline helmet wearing, we assured that equal numbers of
consistent wearers and inconsistent wearers were in each study arm. Within both strata, matching
into triplets based on close propensity scores prior to random assignment assured that estimated
propensity to consistently wear helmets was also evenly distributed across treatment arms as
each member of the “propensity triplet” went to each treatment arm. Matching on a propensity

23
score constructed from observable covariates has been shown to be sufficient to remove bias
from all covariates used to construct the propensity score (Rosenbaum and Rubin, 1983).Though
this technique was originally conceived to improve causal inference in observational studies,
matching on relevant covariates before treatment assignment in randomized experiments is now
a common practice that can increase efficiency of estimation and the power of hypothesis tests
(Greevy et al., 2004). Moreover, inadvertently matching on irrelevant covariates prior to a
random assignment does not harm statistical efficiency or power (Greevy et al., 2004).
Participant adherence to helmet use was captured through self-report surveys at baseline, at the
three week midpoint of the experiment, and at six weeks at the conclusion of the experiment.
III. Study Population Baseline Characteristics
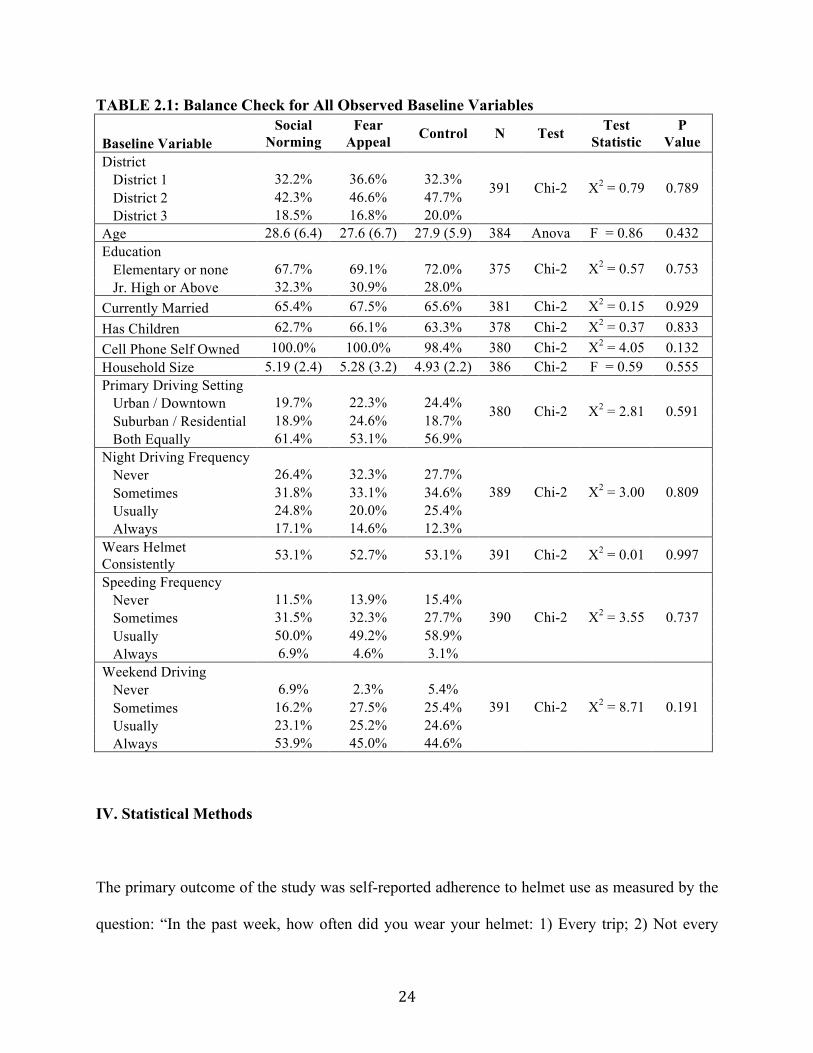
The baseline characteristics of the study population are shown in Table 2.1 for all observed
variables. The mean age of participants was 28, all participants were men, and a majority had at
most an elementary level education. At baseline, approximately 53% of participants claimed that
they wore their helmet on every trip, which was more than the 32% anticipated from previous
literature review and on which our power calculations were based. There were no statistically
significant differences across treatments for any observed variable. Self-reporting of consistent
helmet wearing was perfectly balanced across treatment arms by the stratified design of the
randomization method.
24
TABLE 2.1: Balance Check for All Observed Baseline Variables
Baseline Variable Social
Norming Fear
Appeal Control N Test Test Statistic
P Value
District District 1 32.2% 36.6% 32.3% District 2 42.3% 46.6% 47.7% District 3 18.5% 16.8% 20.0%
391 Chi-2 X2 = 0.79 0.789
Age 28.6 (6.4) 27.6 (6.7) 27.9 (5.9) 384 Anova F = 0.86 0.432 Education Elementary or none 67.7% 69.1% 72.0% Jr. High or Above 32.3% 30.9% 28.0%
375 Chi-2 X2 = 0.57 0.753
Currently Married 65.4% 67.5% 65.6% 381 Chi-2 X2 = 0.15 0.929 Has Children 62.7% 66.1% 63.3% 378 Chi-2 X2 = 0.37 0.833 Cell Phone Self Owned 100.0% 100.0% 98.4% 380 Chi-2 X2 = 4.05 0.132 Household Size 5.19 (2.4) 5.28 (3.2) 4.93 (2.2) 386 Chi-2 F = 0.59 0.555 Primary Driving Setting Urban / Downtown 19.7% 22.3% 24.4% Suburban / Residential 18.9% 24.6% 18.7% Both Equally 61.4% 53.1% 56.9%
380 Chi-2 X2 = 2.81 0.591
Night Driving Frequency Never 26.4% 32.3% 27.7% Sometimes 31.8% 33.1% 34.6% Usually 24.8% 20.0% 25.4% Always 17.1% 14.6% 12.3%
389 Chi-2 X2 = 3.00 0.809
Wears Helmet Consistently 53.1% 52.7% 53.1% 391 Chi-2 X2 = 0.01 0.997
Speeding Frequency Never 11.5% 13.9% 15.4% Sometimes 31.5% 32.3% 27.7% Usually 50.0% 49.2% 58.9% Always 6.9% 4.6% 3.1%
390 Chi-2 X2 = 3.55 0.737
Weekend Driving Never 6.9% 2.3% 5.4% Sometimes 16.2% 27.5% 25.4% Usually 23.1% 25.2% 24.6% Always 53.9% 45.0% 44.6%
391 Chi-2 X2 = 8.71 0.191
IV. Statistical Methods
The primary outcome of the study was self-reported adherence to helmet use as measured by the
question: “In the past week, how often did you wear your helmet: 1) Every trip; 2) Not every

25
trip.” The adherence rate in each group was defined as the percentage of participants who
reported that they have used their helmet on all boda trips. Our primary outcome was to compare
this rate between experimental groups and between each experimental group and the control. A
secondary outcome was heterogeneity of treatment effect by baseline helmet use habits.
A reliance on self-reports potentially introduces measurement error due to possible social-
desirability bias. Because helmet use is legally required, participants may have reported wearing
them frequently so as to be viewed positively (and compliant with the law). However, no
technologically feasible way to objectively monitor helmet use on all trips was readily apparent.
We aimed to overcome the social desirability bias by insuring that the survey responses were
anonymous. One indication that this strategy may have been successful is shown in survey
respondent’s self-reported frequency of speeding; interestingly, 56% of respondents were willing
to admit to exceeding speed limits “frequently” or “always.” Another 30% reported speeding at
least “sometimes.” Speeding would be expected to be subject to the same social desirability bias,
as helmet use, but many respondents were willing to self-report this behavior in the anonymous
survey.
With 391 participants, the study was 80% powered to detect a 23-percentage point increase in the
proportion of drivers who always wear their helmets. This power calculation included adjusting
for the goal of remaining significant after Bonferroni correction for multiple testing to ensure the
ability to make all three possible comparisons between the two treatment and control groups.
The study plan indicated that in the final analysis the Holm-Bonferroni algorithm would be used
to correct for multiple hypothesis testing, which yields uniformly more power than the

26
Bonferroni correction while still controlling the familywise error rate. However, the Holm-
Bonferroni algorithm, while simple to perform post-hoc, is actually quite complicated to properly
incorporate into prior power calculations, and the simpler Bonferroni correction was used instead
to find a minimum bound to the study's power. Both forms of the Bonferroni method have been
criticized as being overly stringent, sacrificing unnecessary power to absolutely ensure the
desired maximum Type I error rate. As such, this study also performed Fisher’s Least Significant
Difference (Fisher’s LSD) as a sensitivity check. Fisher’s LSD has been criticized as flawed for
more than three group comparisons (Hayter, 1986), but is appropriate in this setting as it only
makes three group comparisons.
To investigate the effect of treatment arm assignment, several specifications logistic regression
of consistent helmet use on treatment assignment were run. All statistical analyses were
performed using R version 3.0.2. Unadjusted and covariate adjusted regressions were both
modeled, and all specifications were structured to estimate an intent to treat effect. Details
individual specifications will be discussed further below. For all group comparisons in all
specifications, statistical significance of group difference was performed by permutation analysis
in the following steps. First, the specification was run on all data using the true treatment
assignment. Next, the analysis was re-run with each triplet of individuals (falsely) re-randomized
with replacement to one of the six possible permutations of treatment assignments for that triplet.
In permutation analysis, re-randomization must occur at the same level as in the true
randomization design. Performing this analysis with many permutations wherein analyzed
treatment assignment had no relation to the intervention or associated outcomes recreates the
distribution of the null hypothesis in which treatment and outcomes are unrelated. The analysis
27
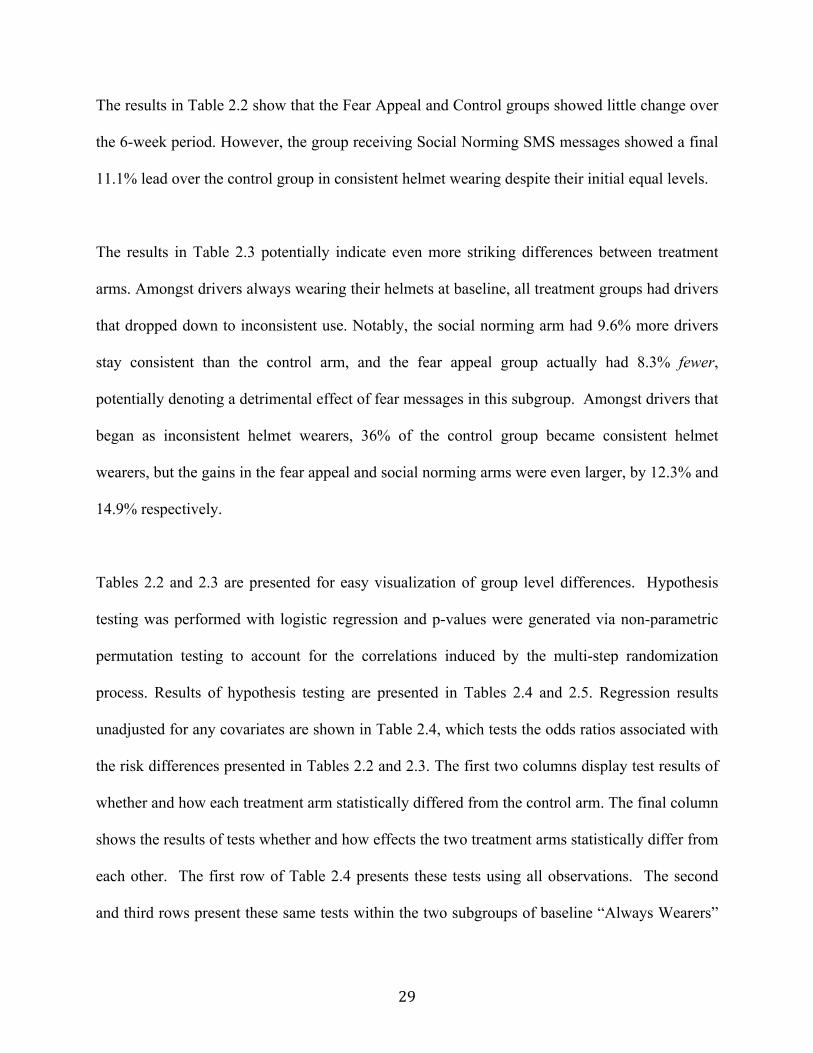
was run with 5000-10000 permutations (depending on the specification), and significance was
assessed by the percentage of runs in which the null distribution yielded results of larger
magnitude than that of the true treatment assignment. Permutations tests such as this have been
shown to be valid for conducting any test of a null hypothesis of no treatment effect within an
experimental sample, conditional on the single requirement that treatment has been randomly
assigned (Anderson, 2001).
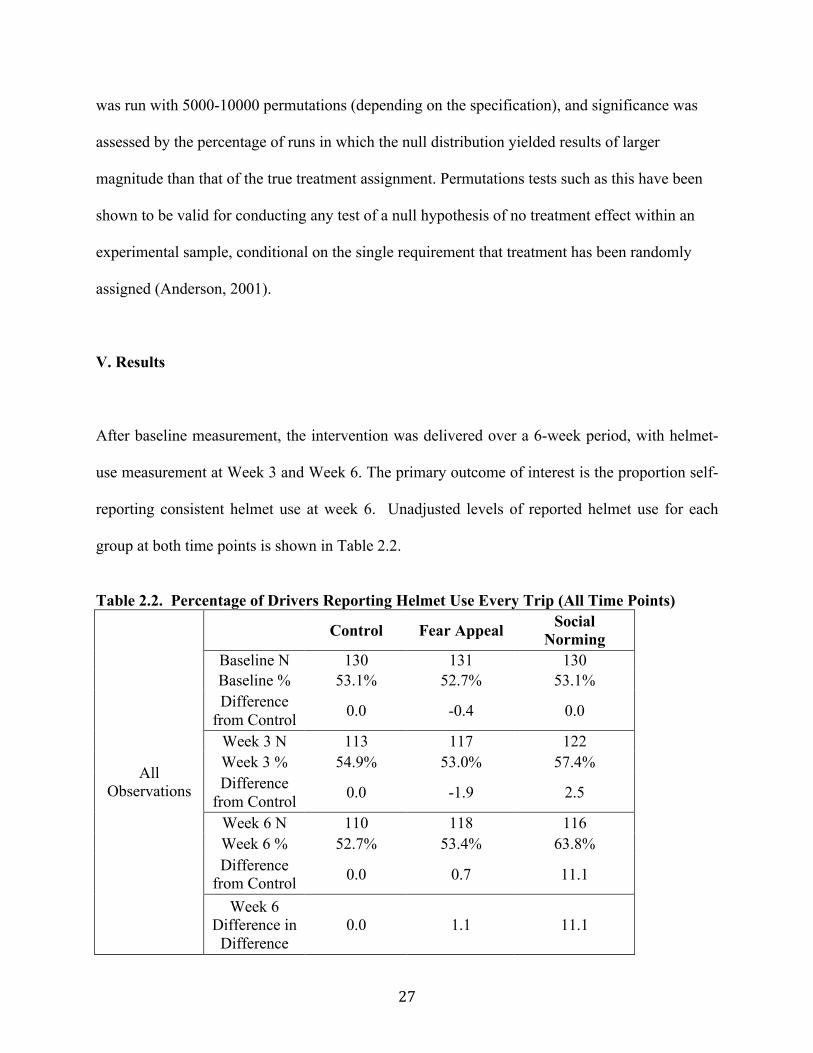
V. Results
After baseline measurement, the intervention was delivered over a 6-week period, with helmet-
use measurement at Week 3 and Week 6. The primary outcome of interest is the proportion self-
reporting consistent helmet use at week 6. Unadjusted levels of reported helmet use for each
group at both time points is shown in Table 2.2.
Table 2.2. Percentage of Drivers Reporting Helmet Use Every Trip (All Time Points)
Control Fear Appeal Social Norming
Baseline N 130 131 130 Baseline % 53.1% 52.7% 53.1% Difference
from Control 0.0 -0.4 0.0
Week 3 N 113 117 122 Week 3 % 54.9% 53.0% 57.4% Difference
from Control 0.0 -1.9 2.5
Week 6 N 110 118 116 Week 6 % 52.7% 53.4% 63.8% Difference
from Control 0.0 0.7 11.1
All Observations
Week 6 Difference in
Difference 0.0 1.1 11.1

28
The final row represents the difference between the group’s week 6 difference from control and
the group’s baseline difference from control.
Potential heterogeneity of effect by randomization strata was investigated by analyzing
participants in two subgroups based on whether they were or were not consistent helmet wearers
at baseline. Intervention effects had strong potential be different in magnitude between these
strata because the mechanism of effect was necessarily different between these two groups.
Amongst already consistent wearers, the only possible mechanism of effect is maintenance of
adherence amongst the already adherent, whereas for the inconsistent wearers, the only possible
mechanism of effect is promotion of adherence amongst the not yet adherent. Knowledge about
heterogeneity or consistency of effect is important for future targeting of interventions.
Unadjusted results are shown in Table 2.3.
Table 2.3: Percent of drivers reporting helmet use every trip at 6 weeks, by baseline answer.
Control Fear Appeal (FA)
Social Norming (SN)
Week 6 N 60 60 59 Week 6 % 66.7% 58.3% 76.3%
Subgroup: Baseline
"Consistent Wearers"
Difference from Control 0.0 -8.3 9.6
Control Fear Appeal (FA)
Social Norming (SN)
Week 6 N 50 58 57 Week 6% 36.0% 48.3% 50.9%
Subgroup: Baseline
"Inconsistent Wearers"
Difference from Control 0.0 12.3 14.9
29
The results in Table 2.2 show that the Fear Appeal and Control groups showed little change over
the 6-week period. However, the group receiving Social Norming SMS messages showed a final
11.1% lead over the control group in consistent helmet wearing despite their initial equal levels.
The results in Table 2.3 potentially indicate even more striking differences between treatment
arms. Amongst drivers always wearing their helmets at baseline, all treatment groups had drivers
that dropped down to inconsistent use. Notably, the social norming arm had 9.6% more drivers
stay consistent than the control arm, and the fear appeal group actually had 8.3% fewer,
potentially denoting a detrimental effect of fear messages in this subgroup. Amongst drivers that
began as inconsistent helmet wearers, 36% of the control group became consistent helmet
wearers, but the gains in the fear appeal and social norming arms were even larger, by 12.3% and
14.9% respectively.
Tables 2.2 and 2.3 are presented for easy visualization of group level differences. Hypothesis
testing was performed with logistic regression and p-values were generated via non-parametric
permutation testing to account for the correlations induced by the multi-step randomization
process. Results of hypothesis testing are presented in Tables 2.4 and 2.5. Regression results
unadjusted for any covariates are shown in Table 2.4, which tests the odds ratios associated with
the risk differences presented in Tables 2.2 and 2.3. The first two columns display test results of
whether and how each treatment arm statistically differed from the control arm. The final column
shows the results of tests whether and how effects the two treatment arms statistically differ from
each other. The first row of Table 2.4 presents these tests using all observations. The second
and third rows present these same tests within the two subgroups of baseline “Always Wearers”

30
and baseline “Inconsistent Wearers.” Whether there was a heterogeneous effect of treatment
assignment by this baseline subgrouping is displayed in the last row of Table 2.4, which tests for
effect modification by taking the ratio of the odds ratios between the subgroups and testing
whether this ratio is significant via permutation.
In comparing the two intervention arms to the control arm, one-sided tests of significance were
used, justified by the strong a priori expectation that the two message types would only
encourage, not discourage, helmet wearing. However, because we had no such a priori
expectation that one messaging intervention would work better than the other, a two-sided test
was used whenever comparing the social norming and fear appeal groups.
Table 2.4: Pairwise Treatment Group Comparisons of Odds of Consistent Helmet Wearing (Using Coefficient Results of Unadjusted Logistic Regression)
Fear Appeal
: Control Group
Comparison
Social Norming :
Control Group
Comparison
Social Norming : Fear Appeal
Group Comparison
Odds Ratio 1.03 1.58 1.54 All
Observations P-Value 0.466a 0.043a** 0.119b
Odds Ratio 0.70 1.61 2.30 Subgroup: Baseline "Always Wearers" P-Value 0.813a 0.113a 0.034b**
Odds Ratio 1.66 1.84 1.11 Subgroup: Baseline
"Inconsistent Wearers" P-Value 0.109a 0.071a* 0.796b
Ratio of Odds Ratios 0.42 0.87 2.07 Subgroup
Effect Modification P-Value 0.159b 0.815b 0.209b
All p-values determined by permutation analysis. a: denotes one sided test, b: denotes two sided test * denotes p<.10, ** denotes p<.05
31
Using all observations in an unadjusted analysis, participants in the social norming arm had odds
of consistently wearing their helmet that were 1.58 times the odds in the control group, which
was the strongest measured association. Jointly testing all three possible group comparisons
amongst all participants is this study’s primary, trial registered outcome, and it was pre-planned
to use a Holm-Bonferroni correction to account for this multiple testing. The one-sided p-value
of 0.043 comparing the social norming arm to the control arm was not enough to satisfy the
Holm-Bonferroni cutoff for simultaneously testing three null hypotheses, which requires that the
most significant of three p-values be less than or equal to 0.05/3 = 0.0167 to set a maximum
Type I family-wise error rate of .05.
Within the subgroup of participants that started as consistent helmet wearers, neither intervention
arm differed significantly from the control arm. The social norming group was measured to have
2.30 times the odds of the fear appeal group of consistently wearing their helmets (p=.034).
However this is non-significant under the Holm-Bonferroni correction for simultaneously testing
three group differences in this subset, which again requires p<0.0167. Accounting for testing
several subsets of data would push the already missed boundary for significance even lower. In
the subgroup of participants that were not consistent users at baseline, both intervention arms
out-performed the control group, but their gains, while perhaps clinically meaningful in size,
were not statistically significant at a threshold of p<.05 . Finally, the lowest portion of Table 2.4
investigates whether the same message arms had different effects between the two subgroups:
baseline always wearers and baseline inconsistent wearers. While the measured effects had
seemingly large differences across subgroups, these differences had p-values well above .05.

32
After the unadjusted analysis, the same set of logistic regressions was performed including a set
of demographic factors and baseline driving habits as controls. These controls were as follows:
marital status, driving setting (primarily downtown or primarily suburban portions of the city),
frequency of driving at night, and frequency of driving on the weekend. This list of controls was
somewhat smaller than originally intended for several reasons. Firstly, all participants were male,
and only two reported not being the owner of the motorcycle they rode, precluding the analysis
of gender and ownership as factors. Originally age and whether the driver had children were
intended to be included in the controls, but strong multi-collinearity between age, marital status,
and having children precluded using all three simultaneously. Marital status was deemed to be
the best summary indicator of the three as its effect was most consistent and interpretable across
specifications. Also, large amounts of missingness in self-reported income precluded its
inclusion as a control variable. Table 2.5 reports the results of the adjusted logistic regressions.
Table 2.5: Pairwise Treatment Group Comparisons of Odds of Consistent Helmet Wearing (Using Coefficient Results of Covariate-Adjusted Logistic Regression)
Fear Appeal : Control
Social Norming :
Control
Social Norming:
Fear Appeal
Odds Ratio 1.01 1.57 1.55 All Observations
P-Value 0.491a 0.055a* 0.119b
Odds Ratio 0.62 1.58 2.54 Subgroup: Baseline "Always Wearers" P-Value 0.865a 0.147a 0.03b**
Odds Ratio 1.84 1.90 1.03 Subgroup: Baseline
"Inconsistent Wearers" P-Value 0.086a* 0.075a* 0.933b
Odds Ratio 0.34 0.83 2.46 Subgroup Effect
Modification P-Value 0.073b* 0.76b 0.154b

33
Table 2.5 (Continued) All p-values determined by permutation analysis a: denotes one sided test, b: denotes two sided test * denotes p<.10, ** denotes p<.05 The results in Table 2.5 follow those in Table 2.4 with relatively minor deviations. Given that the
included variables were part of the original propensity score matching, it is unsurprising that
their inclusion fails to alter the analysis in any meaningful way.
VI. Discussion
The results of our study show that social norming messages are potentially effective at increasing
helmet use among motorcycle taxi “boda” drivers in Dar es Salaam, Tanzania. Over the 6-week
period, the group receiving social norming SMS messages showed an increase in helmet use
from 53.1% to 63.8%, and that increase achieved traditional significance (p<.05) when compared
to the control group with p = .043. However accounting for multiple testing means that we
cannot reject the null of no association, as this p value is above the required p< .0167 to maintain
a family-wise Type I error rate of at most .05 when making three group comparisons. In contrast,
the fear appeal and control groups showed little change over the 6-week period, and the changes
in the rate of consistent helmet use were not statistically significant comparing the fear appeal
group to control.
While the main finding shows that the group receiving social norming messages increased
helmet adherence the most, though not statistically significantly, the findings also suggest that
responsiveness to messages may also have been determined by participant baseline response.
Specifically, for those who reported not wearing helmets all the time at baseline, both social

34
norming and fear appeal messages were associated with higher adherence after the 6-week study
period compared to the control group. Though shy of statistical significance due to the power
limitation of restricting the sample, the associated odds ratios imply a near doubling of the odds
of consistent usage, and the close similarity of the odds ratios between the two treatment arms
suggests that initial inconsistent wearers are equally sensitive to both types of messages.
However, amongst those who reported consistent helmet wearing at baseline, those recipients of
social norming messages maintained high levels of adherence, while those receiving fear appeal
messages actually decreased their level of consistent wearing compared to the control. While
neither treatment is associated with a statistical difference from the control in this subgroup, the
combination of a positive association in the social norming arm and a deleterious association in
the fear appeal arm results in a traditionally significant improvement of the social norming arm
over the fear appeal arm (OR=2.30, p=0.034). However, this association does not meet the
Holm-Bonferroni requirement of p=.0167.
These findings have important potential implications for policymakers as well as other
stakeholders in road safety. Firstly, because social norming messaging overall showed a
potentially greater association with consistent helmet use than fear appeal messaging, it could be
strategic for regulators and nongovernmental organizations focusing on road traffic safety to use
social norming messages for any mass message or media campaigns to promote road safety and
behavior change among drivers. However, a larger and more highly powered study would be
required to confirm this differential association. Moreover, given the low cost of implementation
and the overall satisfaction of the program among boda drivers, this type of intervention shows
potential in future road safety messaging campaigns. Finally, intervention designers should note

35
that behavior change may take some time to set in amongst drivers; group level differences were
noticeable at six weeks, but not after three weeks.
VII. Limitations
There are several limitations to this study. First, self-reports introduce the possibility of social
desirability bias among the respondents thanks to the legal requirement that helmets be worn at
all times. A second potential bias in this study is simply recall bias. Our main outcome question
asks for an estimate of helmet use in the past week of boda driving. It is possible that drivers had
difficulty remembering with accuracy the level of helmet wearing during that time. However,
we believed that asking about behavior over the past week was a reasonable amount of time to
ensure accuracy of estimates. Moreover, the recall burden is much lower in answering
consistency than that in answering the number of times or other numeric answers. Thirdly, while
the results can be useful in a Tanzanian urban context, they may not be applicable to other
contexts. Finally, the study was conducted in a convenience sample. The representativeness of
the sample for Dar es Salaam boda drivers is left unknown. Fourth, our study measures effects of
the intervention right after completion of the six-week trial. How long measured effects persist
into the future is unknown. Finally, our study is focused on helmet usage, while the ultimate
goal of such an intervention is better health and safety for drivers on the road. This study was not
structured or powered to detect differences in health outcomes by treatment arm, and further
study would be necessary to determine if such a messaging intervention would improve health
outcomes for drivers.

36
VIII. Conclusion
Though the evidence isn’t fully conclusive, this study suggests that SMS reminders can be an
effective way to improve helmet use among motorcycle drivers. Specifically, social norming
messages appear to be more effective than fear appeal messages when trying to increase helmet
use among boda drivers. Furthermore, for drivers who already wear their helmet consistently,
fear appeal messages may actually have a detrimental effect on helmet use. Future research
should further investigate whether social norming messages are more effective than fear appeals
when trying to change behavior.
Competing Interests The author declares no competing interests. Human subject research ethics This study was reviewed and approved by IRB committees at Dartmouth College, USA and Muhimbili University of Health and Allied Sciences, Tanzania.
BIBLIOGRAPHY
Anderson, M.J., 2001. Permutation tests for univariate or multivariate analysis of variance and regression. Can. J. Fish. Aquat. Sci. 58, 626–639.
Burns, S., 2008. Installing a new habit and breaking an old one. Stephanie Burns Artic. Stephanieburns Comarticlesarticle06habit Asp.
Chalya, P.L., Dass, R.M., Mchembe, M.D., Mbelenge, N., Ngayomela, I.H., Chandika, A.B., Gilyoma, J.M., Mabula, J.B., 2013. Citywide trauma experience in Mwanza, Tanzania: a need for urgent intervention. J. Trauma Manag. Outcomes 7, 9. doi:10.1186/1752-2897-7-9
Chalya, P.L., Mabula, J.B., Dass, R.M., Mbelenge, N., Ngayomela, I.H., Chandika, A.B., Gilyoma, J.M., 2012. Injury characteristics and outcome of road traffic crash victims at Bugando Medical Centre in Northwestern Tanzania. J. Trauma Manag. Outcomes 6, 1. doi:10.1186/1752-2897-6-1
Ebner, N.C., Freund, A.M., Baltes, P.B., 2006. Developmental changes in personal goal orientation from young to late adulthood: from striving for gains to maintenance and prevention of losses. Psychol. Aging 21, 664.
Free, C., Knight, R., Robertson, S., Whittaker, R., Edwards, P., Zhou, W., Rodgers, A., Cairns, J., Kenward, M.G., Roberts, I., 2011. Smoking cessation support delivered via mobile
37
phone text messaging (txt2stop): a single-blind, randomised trial. The Lancet 378, 49–55. doi:10.1016/S0140-6736(11)60701-0
Greevy, R., Lu, B., Silber, J.H., Rosenbaum, P., 2004. Optimal multivariate matching before randomization. Biostatistics 5, 263–275.
Harré, N., Foster, S., O’Neill, M., 2005. Self-enhancement, crash-risk optimism and the impact of safety advertisements on young drivers. Br. J. Psychol. 96, 215–230.
Hayter, A.J., 1986. The maximum familywise error rate of Fisher’s least significant difference test. J. Am. Stat. Assoc. 81, 1000–1004.
Lancaster, H., 2015. Tanzania - Telecoms, Mobile and Broadband - Statistics and Analyses. Lennon, R., Rentfro, R., O’Leary, B., 2010. Social marketing and distracted driving behaviors
among young adults: The effectiveness of fear appeals. Acad. Mark. Stud. J. 14, 95. Liu, B., Ivers, R., Norton, R., Blows, S., Lo, S.K., 2004. Helmets for preventing injury in
motorcycle riders. Cochrane Database Syst. Rev. 4, 1–42. M. Galukande, J.J., n.d. Boda-boda Injuries a Health Problem and a Burden of Disease in
Uganda: a Tertiary Hospital Survey. East Cent. Afr. J. Surg. ISSN 1024-297X Vol 14 Num 2.
Mcharo, B., 2012. Motorcycle crash: injuries pattern and associated factors among patients treated at Muhimbili Orthopaedic Institute (MOI). (Thesis). Muhimbili University of Health and Allied Sciences.
Murray, C.J.L., Vos, T., Lozano, R., Naghavi, M., Flaxman, A.D., et al., 2012. Disability-adjusted life years (DALYs) for 291 diseases and injuries in 21 regions, 1990–2010: a systematic analysis for the Global Burden of Disease Study 2010. The Lancet 380, 2197–2223. doi:10.1016/S0140-6736(12)61689-4
Mwakapasa, E.G., 2011. Attitude towards and practice of helmet use among commercial motorcyclists in Dar es salaam region, Tanzania. Muhimbili University of Health and Allied Sciences.
Nikolajsen, L., Jensen, T.S., 2001. Phantom limb pain. Br. J. Anaesth. 87, 107–116. Nyoni, J.E., Masaoe, E.N., 2011. Factors contributing to high frequency of vulnerable road user
injury in Dar Es Salaam. Okyere, S., n.d. Attitude towards and practice of helmet use among commercial motorcyclists in
Dar es Salaam region, Tanzania [WWW Document]. URL http://www.academia.edu/5249218/ATTITUDE_TOWARDS_AND_PRACTICE_OF_HELMET_USE_AMONG_COMMERCIAL_MOTORCYCLISTS_IN_DAR_ES_SALAAM_REGION_TANZANIA (accessed 12.15.13).
Park, L.G., Howie-Esquivel, J., Chung, M.L., Dracup, K., n.d. A text messaging intervention to promote medication adherence for patients with coronary heart disease: A randomized controlled trial. Patient Educ. Couns. doi:10.1016/j.pec.2013.10.027
Phillipo L Chalya, J.B.M., 2010. Motorcycle injuries as an emerging public health problem in Mwanza City, north-western Tanzania. Tanzan. J. Heal. Res. 12, 214–21.
Rosenbaum, P.R., Rubin, D.B., 1983. The central role of the propensity score in observational studies for causal effects. Biometrika 70, 41–55.
Rosenberg, T., 1364389203. The Destructive Influence of Imaginary Peers [WWW Document]. Opinionator. URL http://opinionator.blogs.nytimes.com/2013/03/27/the-destructive-influence-of-imaginary-peers/ (accessed 4.1.16).

38
Saidi, H., Mutisto, B.K., 2013. Motorcycle injuries at a tertiary referral hospital in Kenya: injury patterns and outcome. Eur. J. Trauma Emerg. Surg. 39, 481–485. doi:10.1007/s00068-013-0280-8
United Republic of Tanzania, 2009. National Road Safety Policy. Ministry of Infrastructure Development, Dar es Salaam.
Vervloet, M., van Dijk, L., Santen-Reestman, J., van Vlijmen, B., van Wingerden, P., Bouvy, M.L., de Bakker, D.H., 2012. SMS reminders improve adherence to oral medication in type 2 diabetes patients who are real time electronically monitored. Int. J. Med. Inf. 81, 594–604. doi:10.1016/j.ijmedinf.2012.05.005
Wundersitz, L.N., Hutchinson, T.P., Woolley, J.E., 2010. Best practice in road safety mass media campaigns: A literature review. Soc. Psychol. 5, 119–186.

39
APPENDIX 2.1: SMS Message Bank Social Norming: English Most boda drivers in Dar wear their helmet
every day they drive on the street. Swahili
Madereva wengi wa bodaboda wa Dar wanavaa helmet kila siku wanapoendesha mitaani.
Source: Amend observational study English Did you know that most boda drivers on [X
road]* wear their helmet every day? Swahili
Je unafahamu kwamba madereva wengi wa bodaboda kwenye barabara (X) huvaa helmet kila siku?
Source: Amend observational study * Majority of observed boda drivers on Pugu road, New Bagamoyou Road, Morogoro Road were wearing helmet English Most of your peers properly wear their
helmet every day – do you? Swahili
Wenzako wengi huvaa kwa usahihi helmet zao kila waendeshapo bodaboda- na wewe je?
Source: Amend observational study English Most boda drivers believe wearing their
helmet is important even for short trips
Swahili
Madereva wengi wa bodaboda wanaamini kuvaa helmeti ni muhimu hata kwa safari fupi
Source: (Mwakapasa, 2011) English Most boda drivers believe that wearing a
helmet is important even during hot weather
Swahili
Madereva wengi wa bodaboda wanaamini kuvaa helmeti ni muhimu hata wakati wa joto
Source: (Mwakapasa, 2011)

40
English Most boda drivers in Dar say that wearing
their helmet regularly is easy and comfortable
Swahili
Madereva wengi wa bodaboda wanasema kuvaa helmeti mara kwa mara ni rahisi na vizuri
Source: (Mwakapasa, 2011) Fear Appeal: Based on: (Chalya et al., 2013; Liu et al., 2004; M. Galukande, n.d.; Mcharo, 2012; Nyoni and Masaoe, 2011; Phillipo L Chalya, 2010; Saidi and Mutisto, 2013) English Helmets decrease the chance of you dying
in an accident.
Swahili
Helmet inapunguza nafasi ya wewe kufa kwenye ajali.
English Road traffic accidents are the number 1
cause of death for boda drivers in Tanzania. Make sure to wear your helmet.
Swahili
Ajali za barabarai ni sababu namba 1 ya vifo kwa madereva wa bodaboda Tanzania. Hakikisha unavaa helmet yako.
Source: Global Burden of Disease 2010 Study English If you do not wear your helmet while
driving, you will increase your chances of injury.
Swahili
Ikiwa hauta vaa helmet yako wakati unaendesha, utaongeza nafasi ya kuumia.
English Boda boda’s are a very risky form of
transportation. Make sure to wear your helmet to prevent injury.
Swahili
Usafiri wa bodaboda ni hatari sana. Hakikisha unavaa helmeti kuzuia hatari.

41
English The number of boda accidents increases
every year. Make sure to wear your helmet. Swahili
Idadi ya ajali za bodaboda zinaongezeka kila mwaka. Hakikisha unavaa helmeti yako.
Source: Amend study English You are more likely to have serious head
injuries if you get in an accident without a helmet.
Swahili
Unauwezekano mkubwa wa kupata majeraha ya kichwa wakati wa ajali kama usipokuwa na helmeti.
Control: English This is a short reminder to not speed while
driving your boda. Swahili
Hii ni kuku-kumbusha kuwa usiendeshe bodaboda yako kwa mwendo kasi.
English This is a short reminder to follow traffic
signs while driving your boda. Swahili
Hii ni kuku-kumbusha kufuata alama za barabarani wakati unaendesha bodaboda yako.
English This is a short reminder to make sure your
passengers are safe on your boda boda. Swahili
Hii ni kuku-kumbusha kuhakikisha kuwa abiria wako wapo salama kwenye bodaboda yako.

42
CHAPTER III
The Effect on Cesarean Section Rates of an SMS Based Educational Intervention for Pregnant Women in Xi’an China
ABSTRACT:
Objective: Given China’s extremely high caesarean section delivery rate (up to 54.9%), the
purpose of this study is to evaluate the impact of different informational text messages (SMS)
informational messages regarding prenatal health and delivery mode on rates of caesarean
section delivery in the study population.
Design: A quasi- randomized controlled trial was conducted to measure the impact of different
types of SMS messages on self-reported mode of delivery. Assignment was based on whether
each woman’s month and day of birth was odd-odd, odd-even, even-odd, or even-even.
Intervention: Participants were assigned into one of four groups, each receiving a different set
of messages, including 1) a comparison group that received only a few “basic” messages, 2) a
group receiving messages primarily regarding care-seeking, 3) a group receiving messages
primarily regarding good home prenatal practices, and 4) a group receiving all text messages.
These messages were delivered throughout pregnancy and were tailored to the woman’s
gestational week. The “Basic” message group was sent no messages regarding mode of delivery.
The “Care Seeking” message group was sent seven relevant messages, generally focusing on
describing proper indications for caesarean, and cautions regarding risks of caesareans. The
“Home Practices” group received fifteen relevant messages, generally focusing on inspiring
confidence in vaginal delivery and discussing non-anesthetic ways to reduce and cope with pain

43
during delivery. The “All Texts” group was sent all texts in both the “Care Seeking” and “Home
Practices” groups.
Main Outcome Measure: The proportion of women in each group that reported delivering their
child via caesarean section.
Results: In the unadjusted analysis, neither the care-seeking or good home prenatal practices
texts alone were associated with lowered odds of undergoing caesarean section. The group
receiving both sets of texts was associated with an odds ratio (OR) of 0.78, p=.085. However,
looking at the subset of women who reported actually receiving program text messages paints a
different picture. Care seeking messages alone were associated with an odds ration of 0.71
(p=.045). The group getting All Texts (Care Seeking & Home Practices together) was associated
with reduced odds of undergoing caesarean section (OR = 0.65, p=0.008). Adjusting for
potentially confounding covariates in the full set of observations shows that the group with all
texts sent together is associated with an a odds ratio of 0.74, p=.058. Focusing on the subset of
women who actually received program text messages, adjusting shows care-seeking messages to
be associated with an odds ratio of 0.64, p=.017, and the message group receiving all texts was
associated with a highly significant OR of 0.59, p=0.004.

44
Background & Introduction
Since 1985, the global healthcare community has estimated that regional caesarean section rates
should not exceed between 10% and 15% (Vogel et al., 2015; World Health Organization, 2015).
However, in the People’s Republic of China (PRC), the rate of caesarean section delivery is
much higher. Based on a survey by the World Health Organization (WHO) on methods of
delivery during the period 2007-8, caesarean sections in Asia as a whole were estimated to be
comprise 27% of all deliveries. But in China, the rate was 46.2%, the highest of any country in
the WHO’s Global Survey (WHOGS) (Lumbiganon et al., 2010). It is estimated that between
1990 and 2014 China has had an average annual rate of increase in caesarean section rates of
about 10% (Betrán et al., 2016).
In certain situations, caesarean sections can be life-saving interventions. Many studies confirm
that they have a strongly protective effect on perinatal mortality when breech presentations are
encountered. (Lumbiganon et al., 2010; Villar et al., 2007). Villar and colleagues state “It is clear
that these babies, regardless of gestational age, should be delivered by planned caesarean” (Villar
et al., 2007).
There can also be other benefits. In a 2006 systematic review conducted by Visco and
colleagues, eleven studies provided moderate strength of evidence showing a lower risk of
hemorrhage and blood transfusion in planned cesareans than in vaginal delivery, and nine articles
(from eight studies) provided weak evidence that rates of stress urinary incontinence for planned
“elective” cesarean section were either lower than or no different from those for vaginal

45
delivery” (Visco et al., 2006). In a 2015 study of 66,226 deliveries over six years in the largest
obstetric center in Shanghai found that compared to vaginal delivery, caesarean delivery was
associated with a reduction in antepartum stillbirth, brachial plexus injuries related to shoulder
dystocia, bone trauma to the clavicle, skull or humerus, intracranial hemorrhage, and neonatal
hypoxemic encephalopathy (Liu et al., 2015).
Moreover, in their review, Visco and colleagues found four studies suggesting no evidence of
difference in maternal mortality associated with planned vaginal versus planned cesarean
delivery” (Visco et al., 2006). In the WHO’s Global Survey of delivery mode, the maternal
mortality risk for antepartum caesarean section without indication could not be estimated
because there were no maternal deaths in that group (Lumbiganon et al., 2010).
However, these protective effects come with serious risks in other outcomes. Using data from the
WHOGS, Souza et al. found that though its association with maternal mortality was either
insignificant or inestimable, both antepartum and intrapartum caesarean sections without medical
indications for necessary caesareans were found to have strong associations with severe maternal
morbidity. Putting death and several sever morbidities into one “Severe Maternal Outcomes”
index, the authors found antepartum caesarean section with no medical indications to have an
adjusted odds ratio (OR) of 5.93 for qualifying for the index, and intrapartum caesarean section
without medical indications had an adjusted OR of 14.29, both with p<.05. (Souza et al., 2010).
A large cohort study in Australia found that mothers delivering via caesarean were more likely to
be readmitted to the hospital within 8 weeks of birth (Thompson et al., 2002).

46
Besides immediate concerns, caesarean sections can be associated with important problems in
the future. A recent study from Australia found that women delivering via caesarean had roughly
twice the odds of persistent pain one year after delivery (Kainu et al., 2010). The association
between caesarean section and reduced future fertility has been demonstrated in a number of
epidemiologic studies (Gilliam, 2006). Given a new conception, a prior cesarean delivery may
cause an increased risk of fetal wastage, and there is data linking previous cesarean delivery to
unexplained stillbirth in the subsequent pregnancy (Gilliam, 2006; Visco et al., 2006). Further,
there is a strong body of evidence on impaired uterine function following cesarean delivery
relating to abnormal placentation. Additionally, cesarean delivery is associated with poor scar
integrity during subsequent pregnancy manifested as uterine scar dehiscence and, in some cases,
uterine rupture (Gilliam, 2006). Given that China has taken several steps in recent years to relax
the constraints of their one child policy, the effect of caesarean delivery on future pregnancies
are now much more relevant in the PRC.
Overall, given the above risks and benefits, the WHO has concluded that:
“Caesarean Sections are effective in saving maternal and infant lives, but only when they are
required for medically indicated reasons. … Caesarean sections can cause significant and
sometimes permanent complications, disability or death particularly in settings that lack the
facilities and/or capacity to properly conduct safe surgery and treat surgical complications.
Caesarean sections should ideally only be undertaken when medically necessary.” (WHO 2015)
Many of the caesarean sections occurring in China are not medically necessary. Lumbiganaon
and colleagues estimated that with 11.7% of all deliveries in China during the study period were

47
caesarean sections without any medical indications (Lumbiganon et al., 2010). Combining the 24
countries in the WHO’s Global Survey on methods of delivery, it was estimated that 63% of all
caesarean sections without medical indications were performed in Chinese health facilities
(Souza et al., 2010).
A more recent national estimate by Liu et al. paints an even more striking picture. In their multi-
centre survey of 39 hospitals in 14 provinces in China, the overall rate of caesarean delivery in
mainland China was 54.90% (Liu et al., 2014). The authors found that an important driver of this
figure was that women with no indications necessitating a caesarean delivery were frequently
requesting caesareans anyway. Caesarean delivery on maternal request (CDMR) accounted for
15.53% of all the deliveries and 28.43% of all caesarean section deliveries their multi-centre
survey (Liu et al., 2014). This national estimate confirms what at least 11 other smaller &
qualitative studies (Feng et al., 2014) and at least one regional estimate (Zhang et al., 2008) have
suggested: women’s own choices are part of the rise in China’s caesarean section rates.
China’s “One-Child Policy” has likely played a role in this preference. As early as 1989 the
indication “precious child” was increasingly found reported amongst conventional clinical
factors justifying caesarean delivery (Feng et al., 2014). This term generally connotes that both
the parents are single children in their immediate families (Zhang et al., 2008). Families often
desire a perfect baby, and are greatly adverse to risks (Zhang et al., 2008). “Precious child,” and
its even more vague successor “social factors” have risen to be the most common justification in
some hospitals (Feng et al., 2014).

48
In addition, women nowadays often view caesarean sections as protecting themselves. In a 2006
survey conducted in two rural counties of Anhui province, more than 80% of women reporting
electing caesarean section gave two main reasons: fear of pain, and because caesareans were
considered safer for the baby and themselves. Less common reasons were pregnancy or labor
complications, possibility of having tubal ligation at the same time, and being able to select a
specific day for delivery. (C.-M. Huang et al., 2013). Qualitative evidence indicates that
convenience, perceived safety, painless birth, and choice of birth date are all factors in women
electing to have a caesarean section (Feng et al., 2014; C.-M. Huang et al., 2013; Liu et al.,
2014). Choosing a specific birth date can be motivational because some dates are considered
more auspicious (Mi and Liu, 2014; Zhang et al., 2008). Also, some women believe their child
will be more cleaver if their head is not forced through the birth canal (Feng et al., 2014; Zhang
et al., 2008). It’s worth noting that impact of women’s preferences for caesarean could me
modified by physician amenability to patient requests. Evidence exists that physicians in rural
China sometimes prescribe and even change prescription behavior in accordance with patient
demand, and that patient behavior during seeking care can influence prescribing by the providers
(Dong, 2003).
There is also evidence that an important portion of the “demand” for caesareans is supplier
induced (C.-M. Huang et al., 2013). Caesarean sections bring in approximately twice the hospital
revenue per birth that vaginal deliveries do (Mi and Liu, 2014; Zhang et al., 2008). The power
imbalance between patients and providers may mask the true decision making (Feng et al.,
2014), and some researchers argued that women’s role in decision making was less than that
described by professionals (C.-M. Huang et al., 2013). For example, in a recent study conducted

49
in two hospitals in Shanghai, of 599 women interviewed in their third trimester, 17.0% reported
preferring caesarean delivery. Yet of 523 women completing the study, 58.1% underwent
caesarean section. Of those, 50.0% had clinically accepted indications for a caesarean; the other
half either had no indications at all (15.1%) and were assumed to be based on maternal request,
or had “doctor-defined” indications (34.9%) such as gestational hypertension or heavy fetus,
which did not conform to the national guidelines for caesarean delivery (Ji et al., 2015). It was
also noted by Huang et al. in their survey in Anhui province that women with private sector
obstetricians show consistently higher caesarean delivery rates than those in the public sector,
which the authors argue could not be explained simply by women’s preferences. They also point
to qualitative data indicating that the “physician factor,” which includes their training,
experience, personal preferences, and financial considerations, is an important influence on the
uptake of caesarean section for delivery. Therefore, educating and empowering women to refute
inappropriate doctor recommendations for caesarean delivery may be as important a pathway for
reducing caesarean deliveries as changing women’s underlying preferences.
While there is a lack of clarity on the extent to which it is supplier induced or originates with the
women themselves, there is agreement that the rate of caesarean delivery in the PRC is
excessive, and numerous experts are beginning to call for strategies to reduce caesarean section
use in China, most specifically when requested by women without any medical indication. To
quote a few:

50
“Therefore, implementation of evidence-based strategies to avoid medically unnecessary
primary caesarean section, and to encourage the safe and appropriate use of vaginal birth after
caesarean section, is needed.” (Vogel et al., 2015)
“Therefore, to reduce the rate of [caesarean sections], we should try to reduce the rate of
CDMR. This means that the perception of women and their families that [caesarean delivery] is
the safest and most convenient way for childbirth needs to be changed.” (Liu et al., 2014)
“Concerted action targeting service providers as well as users needs to be taken in the near
future, in order to effectively control the rapid rise of [caesarean delivery] in China.” (Ji et al.,
2015)
As discussed in Chapter I, Mobile Health (mHealth) generally, and the use of text messaging
specifically, are expanding topics of study that have already shown significant effects in several
intervention areas. However, evidence for or against its efficacy in the field of maternal and child
health is scarce (Noordam et al., 2011; Tamrat and Kachnowski, 2012), and larger scale
evaluations of its possible effects on maternal health behaviors and health outcomes are
warranted (Evans et al., 2012; Jareethum et al., 2008; Lund et al., 2012; Naughton et al., 2013).
To date, systematic literature reviews have found no published studies exploring either the use of
text messaging for maternal health promotion in China nor the use of text messaging to influence
choice of delivery mode anywhere. A detailed review of the literature that does exist related to
mHealth and health behaviors can be found in Chapter I of this thesis.

51
This study comprises a portion of Evaluation for mHealth Interventions (EMI) Newborn Health
Project. The Newborn Health Project has several aims; its primary (trial registered) metric of
success being the newborn’s appropriate weight for gestational age. This paper will investigate
whether the short message service (SMS) advice provided by the Newborn Health Project was
successful in a secondary goal of lowering the rates of cesarean delivery in the intervention arms.
Methods
The Newborn Health project offers expectant mothers in the rural district of Gaoling in Xi’an,
China a package of free, short, informational messages via cell phone regarding pregnancy and
childbirth. These messages are delivered throughout the pregnancy and are tailored to each
mother’s gestational week. It is hypothesized that delivering these messages to pregnant women
can improve maternal and newborn health. The study utilizes factorial quasi-randomization at the
individual level to assign women to receive one of four groups of text messages, then compares
psychological, behavioral and health outcomes between the four groups. Quasi-randomization
assigned treatment based on the expecting mother’s birthday, specifically whether their birth
month and day of birth were even-even, even-odd, odd-even, or odd-odd. This assignment
method was successful at balancing observable covariates, as discussed in detail in the Statistical
Analysis & Results section.
The four study arms include: 1) Good household prenatal practice messages (Home Practices),
including advice on nutrition, exercise, self-awareness of depression, breastfeeding, etc.; 2) Care
seeking messages (Care Seeking), which include information about government-subsidized

52
programs, warning signs of potential problems, and the importance of care seeking during
illness; 3) Both types of messaging (All Texts); and 4) A very limited (25 in total) set of “Basic”
messages about pregnancy to act as a comparison group. Women in the other intervention arms
also received all of these basic messages. From an estimation standpoint, to act as a valid
comparison group for the content of intervention texts, it was decided that the comparison group
should receive at least some regular informational placebo messages to feel like they received a
service and were part of the program. From an ethical standpoint, it also ensured that all
enrollees received the most basic pregnancy information; the informational equivalent of “basic
care.” These basic, placebo messages included primarily un-actionable updates on fetal
development in different gestational stages, as well as a handful of reminders for prenatal visits
and promotion of certified skilled attendance of labor. Thus, group comparisons of treatment
arms elicit the effect of (assignment to) receiving the content in the more comprehensive
intervention messages in addition to the basic ones, and are designed intentionally to estimate
this effect separated out from the effect of being included in an informational messaging study at
all. Totally, 148 messages have been designed in this study, and the number of messages by
topic and study arm is presented in Appendix 3.1.
The four treatment arms received differing sets of messages relevant to labor and delivery that
could potentially impact a woman’s choice in mode of delivery. As a first of its kind, this
intervention is exploratory in investigating what combination of SMS messages are most
efficacious in promoting vaginal delivery. Of the “Basic” (comparison) group’s 25 messages,
none were relevant to mode of delivery. Of the 82 messages sent to the “Care Seeking” group,
seven were relevant, generally focusing on describing proper indications for caesarean, and

53
cautioning that caesareans and anesthesia make birth less painful but come with other risks.
These texts can help women recognize when caesareans are actually indicated and not indicated,
and instill a hesitance to undergo a caesarean. Of their total 91 messages, the “Home Practices”
group was sent fifteen delivery relevant ones, generally focusing on inspiring confidence in
vaginal delivery and discussing non-anesthetic ways to reduce and cope with pain during
delivery. These can potentially allay some of the fear of pain from undergoing vaginal delivery,
which as mentioned is a key driver of CDMR. The “All Texts” group received 22 relevant
messages out of their total 148, composed of all messages sent to the other treatment arms. The
exact messages sent relevant to labor and delivery are presented in Appendix 3.2. It should be
noted that though presented in English here, the messages that women receive were actually in
Mandarin.
This study was approved by the Ethics Committee of the School of Medicine at Xi’an Jiao Tong
University on January 18th, 2013. Upon agreement with the Xi’an Health Bureau in Shanxi
Province, China, Gaoling district was selected as the intervention site, and the local maternal and
child health center (MCHC) was invited to be the study site. All women attending their first visit
to the antenatal care (ANC) at the MCHC during the study period were invited to participate, so
long as they were aged 18-45 years old and had access to a cellular phone owned by themselves
or someone in the same household. All participants so recruited were presented with and signed
an informed consent form.
Between July and August 2013, 20 local public health professionals and 4 student researchers
were trained regarding the consent process, cognitive debriefing, face-to-face interviewing, and

54
phone interviewing. Pilot testing with 140 subjects occurred between August – October 2013,
and was comprehensive of recruitment, treatment assignment, sending (abbreviated) message
sets, and collecting information on all survey instruments. Survey questionnaires were finalized
after incorporating feedback from the testing.
Prior to treatment assignment, a baseline survey was conducted with each enrollee. This survey
collected demographic data, self-reported health data, as well as data relating to each enrollees’
thoughts and perceptions regarding health during pregnancy and childbirth.
Next, a quasi-randomized factorial assignment placed each participant into one of four possible
message package programs. Neither the health workers who enrolled the participants nor the
participants themselves were informed how treatment would be assigned.
The intervention’s text messages were sent from the first clinic visit until delivery, and the
contents are tailored according to the women’s gestational week. A week after each delivery, a
follow-up survey was conducted via phone, measuring knowledge, psychological and behavioral
changes, as well as other pregnancy related questions, including whether the delivery was
vaginal or via caesarean section. Additionally, the survey asked whether the enrollee had
successfully received our messages; if so, how approximately how many; as well as their levels
of satisfaction and perceived usefulness of various aspects of and topics included in the
messages.

55
Statistical Analysis & Results
Prior to analysis, two balance checks were run on all variables collected in the baseline survey.
The first balance check was conducted using all women who were enrolled in the study and
completed a baseline survey. These results are presented in Table 3.1A below. The second
balance test of baseline variables included only those women who completed the study and the
follow-up survey. These results are presented in Table 3.1B below. For continuous and ordinal
variables, one-way ANOVAs were performed to determine if there existed a distribution
imbalance across the four treatment arms. For categorical variables, chi-squared tests were
performed to check for balance across treatment arms. In total, 56 baseline variables were
analyzed in each balance check.
If all null hypotheses of no association truly held, meaning treatment assignment was orthogonal
to all covariates, at an significance threshold of α =.05, we would still expect 5% of independent
tests to result in the Type I error of falsely rejecting the null hypothesis of no association. Thus,
of 56 balance tests, we would expect to erroneously reject the null hypothesis for 2.8. We would
further expect another 2.8 balance tests to erroneously reject the null hypothesis of no association
at .05<p<.10, for a total of 5.6. We found that for the set of women completing the study, only
one baseline variable test rejected balance at p<.05, and a further 4 to reject balance at
.05<p<.10, for a total of 5. Balance in the set of all women completing a baseline survey found
only one of 56 tests to reject balance at p<.05, and only two more to reject balance at p<.10.
Finding no more significant associations than would be expected when treatment assignment is

56
genuinely orthogonal to all covariates, we inferred that our quasi-randomization was effective in
assigning treatment orthogonally to relevant observable covariates.
A pure randomization assignment method would have the same goal of distributing treatment
orthogonally to covariates, and subsequent a subsequent balance check would have the same
number of expected Type I errors. Achieving the same standard, we infer that our quasi-
randomization worked as effectively at balancing observable covariates as a successful pure
randomization is meant to be in expectation. As always, is unknowable whether unobservable
covariates were also well balanced, and unobserved unbalanced confounders may still bias our
results. However, this is always true, and study designs with both random and non-random
assignments proceed after successful balance checks on observable covariates under the un-
testable assumption that unobservable covariates are balanced to the same degree as observable
ones.
TABLE 3.1A: Balance Check, All Baseline Variables, All Enrollees
Basic Care Seeking
Home Practices All Texts
N=1,057 N=1,106 N=1,044 N=1,168
Variable Mean (SD) Or % in Category Test P Value
Age (years) 26.9 (4.0) 26.9 (3.9) 26.9 (3.8) 27.1 (3.9) Anova 0.518 Weight before Pregnancy (lbs)
120.2 (18.2) 119.8 (17.6)
120.5 (18.3)
120.8 (18.0) Anova 0.591
Han / Minority 99.3% 99.2% 99.2% 98.6% Chi-2 0.284 RESIDENCY Province/City 2.4% 2.8% 2.5% 3.8% County 13.6% 15.3% 16.0% 14.0% Township 21.4% 17.7% 17.5% 18.0% Village 62.6% 64.3% 64.1% 64.3%
Chi-2 0.156

57
TABLE 3.1A (Continued) OCCUPATON Farmer 20.6% 19.4% 21.1% 19.5% Business Owner 7.5% 7.5% 6.6% 7.3% Government Worker 3.7% 4.3% 4.7% 4.0% Migrant Worker 6.5% 7.6% 6.7% 6.9% Local Worker 4.1% 5.1% 5.9% 5.4% Home-Maker 37.0% 36.8% 33.1% 36.8% Other 20.6% 19.4% 21.9% 20.2%
Chi-2 0.833
EDUCATION Jr. High or Less 45.6% 43.1% 40.0% 42.0% Sr. High Graduate 27.8% 27.8% 30.9% 28.0% 3yr College 19.6% 21.3% 21.4% 21.3% 4yr College + 7.0% 7.8% 7.7% 8.7%
Chi-2 0.396
Cell Phone Self Owned 91.9% 90.9% 92.0% 92.2% Chi-2 0.681
HUSBAND EDUCATION Jr. High or Less 44.2% 42.5% 42.8% 43.5% Sr. High Graduate 29.7% 29.7% 27.3% 27.7% 3yr College 18.1% 19.3% 20.4% 19.0% 4yr College + 8.1% 8.4% 9.5% 9.9%
Chi-2 0.696
INSURANCE NCMS 78.0% 77.1% 76.3% 77.1% Urban Worker 5.7% 7.2% 7.0% 7.2% Urban Resident 9.7% 8.4% 8.4% 8.6% Other 2.3% 2.3% 2.6% 1.7% None 4.3% 5.0% 5.7% 5.5%
Chi-2 0.767
Currently Married 98.7% 98.5% 98.6% 98.1% Chi-2 0.714 Family Members in Household 4.3 (1.3) 4.2 (1.3) 4.3 (1.3) 4.3 (1.3) Anova 0.770
Annual Household Expenditure (RMB)
33,900 (45,200)
32,500 (37,000)
33,500 (34,800)
34,200 (46,200) Anova 0.903
Annual Household Income (RMB)
57,700 (74,300)
56,000 (73,400)
71,400 (235,800)
56,300 (56,500) Anova 0.138
Economic Condition (Scale of 1-10) 5.8 (2.0) 5.6 (1.8) 5.7 (1.9) 5.7 (1.9) Anova 0.524
PREGNANCY NUMBER 1st 42.5% 43.2% 43.9% 42.4% 2nd 35.6% 35.0% 33.8% 35.9% 3rd + 21.9% 21.8% 22.4% 21.8%
Chi-2 0.974
PREVIOUS LIVE BIRTHS None 64.1% 65.1% 64.8% 63.5% One 34.9% 33.6% 34.5% 35.7% Two + 1.1% 1.3% 0.7% 0.8%
Chi-2 0.730
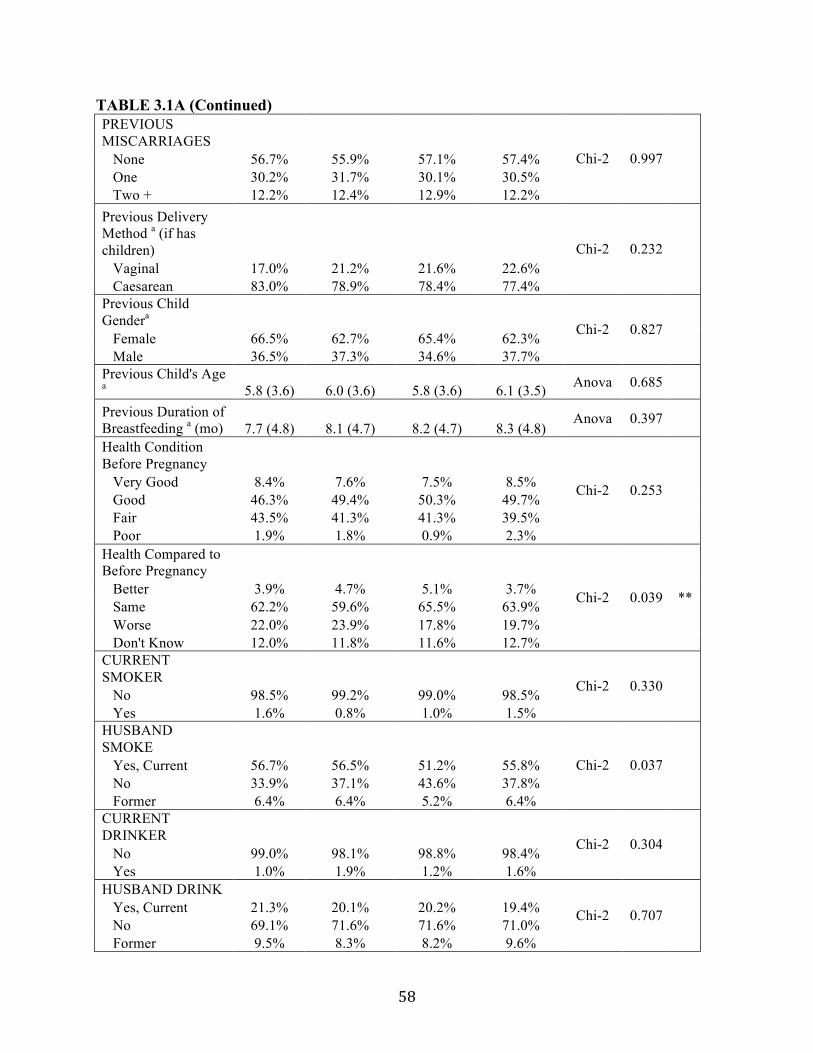
58
TABLE 3.1A (Continued) PREVIOUS MISCARRIAGES None 56.7% 55.9% 57.1% 57.4% One 30.2% 31.7% 30.1% 30.5% Two + 12.2% 12.4% 12.9% 12.2%
Chi-2 0.997
Previous Delivery Method a (if has children) Vaginal 17.0% 21.2% 21.6% 22.6% Caesarean 83.0% 78.9% 78.4% 77.4%
Chi-2 0.232
Previous Child Gendera Female 66.5% 62.7% 65.4% 62.3% Male 36.5% 37.3% 34.6% 37.7%
Chi-2 0.827
Previous Child's Age a 5.8 (3.6) 6.0 (3.6) 5.8 (3.6) 6.1 (3.5) Anova 0.685
Previous Duration of Breastfeeding a (mo) 7.7 (4.8) 8.1 (4.7) 8.2 (4.7) 8.3 (4.8)
Anova 0.397
Health Condition Before Pregnancy Very Good 8.4% 7.6% 7.5% 8.5% Good 46.3% 49.4% 50.3% 49.7% Fair 43.5% 41.3% 41.3% 39.5% Poor 1.9% 1.8% 0.9% 2.3%
Chi-2 0.253
Health Compared to Before Pregnancy Better 3.9% 4.7% 5.1% 3.7% Same 62.2% 59.6% 65.5% 63.9% Worse 22.0% 23.9% 17.8% 19.7% Don't Know 12.0% 11.8% 11.6% 12.7%
Chi-2 0.039 **
CURRENT SMOKER No 98.5% 99.2% 99.0% 98.5% Yes 1.6% 0.8% 1.0% 1.5%
Chi-2 0.330
HUSBAND SMOKE Yes, Current 56.7% 56.5% 51.2% 55.8% No 33.9% 37.1% 43.6% 37.8% Former 6.4% 6.4% 5.2% 6.4%
Chi-2 0.037
CURRENT DRINKER No 99.0% 98.1% 98.8% 98.4% Yes 1.0% 1.9% 1.2% 1.6%
Chi-2 0.304
HUSBAND DRINK Yes, Current 21.3% 20.1% 20.2% 19.4% No 69.1% 71.6% 71.6% 71.0% Former 9.5% 8.3% 8.2% 9.6%
Chi-2 0.707

59
TABLE 3.1A (Continued) EXERCISE Yes, Current 34.3% 32.8% 34.1% 32.2% No 55.6% 55.7% 54.1% 56.6% Former 10.1% 11.6% 11.9% 11.3%
Chi-2 0.736
EXERCISE HUSBAND Yes, Current 38.3% 39.5% 41.3% 39.2% No 54.7% 53.8% 53.1% 53.8% Former 7.0% 6.8% 5.7% 7.1%
Chi-2 0.765
HEALTH INFORMATION SOURCES
Uses Health Institution 11.5% 11.9% 11.4% 13.5% Chi-2 0.436
Uses Internet 44.1% 43.5% 43.3% 45.8% Chi-2 0.621 Uses TV 7.9% 7.7% 8.0% 8.4% Chi-2 0.961 Uses Books 24.5% 24.3% 27.7% 24.1% Chi-2 0.202 Uses Friends 32.9% 34.4% 33.6% 32.9% Chi-2 0.869 Uses Family Members 15.1% 13.4% 15.0% 14.9% Chi-2 0.655
No Sources 4.5% 4.0% 4.3% 4.6% Chi-2 0.896 Uses Other Sources 2.6% 1.8% 1.8% 1.4% Chi-2 0.264 Pregnancy Week at Sign-up 14.7 (7.2) 15.1 (7.3) 14.9 (7.1) 14.9 (7.5) Chi-2 0.763
PREGNANCY PLANNED Yes 63.8% 66.2% 66.6% 65.9% No 36.2% 33.8% 33.4% 34.1%
Chi-2 0.558
SINGLETON Singleton 85.7% 85.8% 86.2% 85.6% Twins & Above 0.6% 1.2% 1.2% 1.0% Not Sure 13.7% 13.1% 12.6% 13.4%
Chi-2 0.827
Health Attitudes b (1-5) 3.89 (1.0) 3.93 (.97) 3.91 (1.0) 3.94 (.94) Anova 0.559
Health Expectations b (1-5) 3.78 (.71) 3.80 (.73) 3.78 (.71) 3.81 (.72)
Anova 0.506
Health Self Efficacy b (1-5) 3.13 (.91) 3.13 (.91) 3.12 (.90) 3.11 (.90)
Anova 0.963

60
TABLE 3.1B: Balance Check, All Baseline Variables, Women With Follow-Up Surveys
Basic Care Seeking
Home Practices All Texts
N = 488 N = 471 N = 465 N = 528
Variable Mean (SD) Or % in Category Test P Value
Age (years) 26.7 (3.7) 27.0 (4.0) 27.0 (3.9) 27.0 (3.7) Anova 0.648 Weight before Pregnancy (lbs)
120.0 (17.7) 119.5 (18.2)
120.1 (18.3)
120.1 (18.1) Anova 0.958
Han / Minority 99.6% 99.8% 99.4% 98.9% Chi-2 0.272 RESIDENCY Province/City 1.9% 2.6% 1.6% 3.3% County 7.0% 8.7% 8.4% 10.0% Township 22.0% 17.6% 15.3% 15.4% Village 69.1% 71.2% 74.7% 71.2%
Chi-2 0.085 *
OCCUPATON Farmer 22.5% 21.2% 24.7% 22.0% Business Owner 5.9% 6.6% 5.8% 6.2% Government Worker 2.8% 2.7% 2.7% 1.9% Migrant Worker 5.7% 6.6% 4.5% 5.2% Local Worker 3.6% 4.0% 3.8% 4.8% Home-Maker 38.8% 39.7% 38.1% 36.5% Other 20.8% 19.2% 20.4% 23.4%
Chi-2 0.972
EDUCATION Jr. High or Less 47.4% 44.5% 42.3% 41.4% Sr. High Graduate 30.2% 30.6% 32.7% 30.9% 3yr College 16.8% 20.0% 19.3% 22.0% 4yr College + 5.6% 5.0% 5.7% 5.7%
Chi-2 0.675
Cell Phone Self Owned 93.5% 92.3% 91.9% 92.4% Chi-2 0.803
HUSBAND EDUCATION Jr. High or Less 43.8% 44.2% 47.7% 443.3% Sr. High Graduate 35.0% 32.9% 27.6% 31.7% 3yr College 14.2% 16.2% 17.1% 17.9% 4yr College + 7.1% 6.7% 7.7% 7.1%
Chi-2 0.513
INSURANCE NCMS 81.8% 82.2% 81.1% 82.1% Urban Worker 3.2% 3.9% 3.7% 3.3% Urban Resident 8.6% 8.8% 7.3% 7.5% Other 2.7% 2.3% 2.3% 1.4% None 3.8% 2.8% 5.7% 5.7%
Chi-2 0.652
Currently Married 98.8% 98.5% 99.1% 99.2% Chi-2 0.658 Family Members in Household 4.4 (1.2) 4.4 (1.2) 4.3 (1.2) 4.4 (1.2) Anova 0.408
Annual Household Expenditure (RMB)
33,600 (55,900)
31,200 (27,500)
31,900 (27,500)
33,700 (39,100) Anova 0.883

61
TABLE 3.1B (Continued): Annual Household Income (RMB)
50,400 (48,200)
58,000 (89,400)
54,900 (48,400)
54,900 (52,100) Anova 0.586
Economic Condition (Scale of 1-10) 5.8 (1.9) 5.7 (1.9) 5.7 (2.0) 5.6 (2.0) Anova 0.375
PREGNANCY NUMBER 1st 42.5% 42.2% 42.1% 42.2% 2nd 36.9% 34.4% 34.2% 34.9% 3rd + 20.6% 23.4% 23.8% 22.9%
Chi-2 0.928
PREVIOUS LIVE BIRTHS None 62.9% 61.2% 63.9% 63.3% One 36.5% 38.0% 35.8% 35.7% Two + 0.6% 0.9% 0.2% 1.0%
Chi-2 0.808
PREVIOUS MISCARRIAGES None 60.8% 55.7% 54.1% 56.4% One 29.0% 33.5% 31.6% 30.9% Two + 10.2% 10.9% 14.4% 12.7%
Chi-2 0.266
Previous Delivery Method a (if has children) Vaginal 13.7% 19.8% 18.0% 19.9% Caesarean 86.3% 80.2% 82.0% 80.1%
Chi-2 0.385
Previous Child Gendera Female 62.9% 64.8% 66.7% 61.2% Male 37.1% 35.2% 33.3% 38.8%
Chi-2 0.733
Previous Child's Age a 5.6 (3.5) 5.8 (3.5) 6.0 (3.5) 6.1 (3.5) Anova 0.608 Previous Duration of Breastfeeding a (mo) 7.8 (4.6) 8.0 (4.8) 8.4 (5.0) 8.2 (4.7)
Anova 0.678
Health Condition Before Pregnancy Very Good 8.3% 7.2% 7.1% 8.8% Good 47.2% 50.2% 52.5% 49.8% Fair 43.0% 40.8% 38.8% 39.2% Poor 1.5% 1.8% 1.6% 2.2%
Chi-2 0.879
Health Compared to Before Pregnancy Better 3.5% 4.9% 5.0% 4.3% Same 61.9% 61.0% 66.4% 64.6% Worse 23.4% 22.3% 19.1% 19.7% Don't Know 11.2% 11.8% 10.6% 11.4%
Chi-2 0.652
CURRENT SMOKER No 97.9% 99.1% 99.6% 98.8% Yes 2.1% 0.9% 0.4% 1.2%
Chi-2 0.110

62
TABLE 3.1B (Continued): HUSBAND SMOKE Yes, Current 57.1% 60.8% 54.0% 57.8% No 36.0% 33.6% 41.1% 36.1% Former 7.0% 5.7% 4.9% 6.2%
Chi-2 0.293
CURRENT DRINKER No 99.6% 97.4% 98.7% 97.9% Yes 0.4% 2.7% 1.3% 2.1%
Chi-2 0.041 **
HUSBAND DRINK Yes, Current 22.0% 21.6% 21.7% 19.5% No 67.0% 71.7% 70.5% 70.4% Former 11.0% 6.6% 7.8% 10.1%
Chi-2 0.229
EXERCISE Yes, Current 34.5% 34.2% 32.8% 32.4% No 55.3% 54.7% 55.8% 55.6% Former 10.2% 11.1% 11.4% 12.1%
Chi-2 0.968
EXERCISE HUSBAND Yes, Current 38.4% 37.9% 38.6% 37.9% No 53.9% 56.4% 57.6% 53.6% Former 7.6% 5.8% 3.8% 8.5%
Chi-2 0.117
HEALTH INFORMATION SOURCES
Uses Health Institution 10.3% 12.6% 10.2% 13.1% Chi-2 0.379 Uses Internet 43.0% 43.1% 43.8% 45.5% Chi-2 0.854 Uses TV 7.9% 7.2% 9.3% 7.7% Chi-2 0.721 Uses Books 26.0% 27.0% 26.6% 25.0% Chi-2 0.911 Uses Friends 33.6% 35.1% 36.2% 33.3% Chi-2 0.784 Uses Family Members 15.0% 12.8% 14.4% 14.1% Chi-2 0.832 No Sources 4.8% 4.9% 4.2% 4.5% Chi-2 0.952 Uses Other Sources 2.2% 1.2% 1.4% 1.7% Chi-2 0.651 Pregnancy Week at Sign-up
14.3 (7.0) 15.2 (7.3) 14.5 (7.0) 14.7 (7.0) Chi-2 0.225
PREGNANCY PLANNED Yes 64.5% 66.4% 68.6% 66.9% No 35.6% 33.6% 31.4% 33.1%
Chi-2 0.610
SINGLETON Singleton 84.8% 84.9% 85.5% 86.0% Twins & Above 0.9% 1.1% 1.4% 1.0% Not Sure 14.4% 14.0% 13.1% 13.0%
Chi-2 0.981
Health Attitudes b (1-5)
3.88 (.98) 3.96 (.91) 4.03 (.89) 3.99 (.90) Anova 0.063 *
Health Expectations b (1-5)
3.74 (.70) 3.82 (.69) 3.80 (.69) 3.84 (.68)
Anova 0.181
Health Self Efficacy b (1-5)
3.09 (.88) 3.07 (.93) 3.11 (.91) 3.14 (.91)
Anova 0.636

63
TABLE 3.1B (Continued) Health Personal Norms b (1-5) 2.32 (1.1) 2.26 (1.1) 2.29 (1.0) 2.26 (1.1)
Anova 0.762
Health Intentions b (1-5) 3.66 (.87) 3.62 (.98) 3.69 (.85) 3.73 (.88)
Anova 0.343
Health Plans b (1-5) 2.52 (.90) 2.55 (.93) 2.56 (.93) 2.60 (.97) Anova 0.650 Health Susceptibility c (1-5, Don't Know=26.2%)
2.59 (1.46)
2.45 (1.38) 2.48 (1.39) 2.45 (1.41)
Anova &
Chi-2
0.510 / .600
Health Severity c (1-5, Don't Know = 40.3%) 2.52 (1.5) 2.50 (1.5) 2.5 (1.4) 2.3 (1.4)
Anova &
Chi-2
0.454 / .815
Health Social Norms c (1-5, Don't Know=18.6%) 3.70 (.86) 3.70 (.86) 3.84 (.70) 3.76 (.79)
Anova &
Chi-2
0.058 / .330 *
PREFERRED GENDER FOR CHILD (FAMILY)
Boy 8.3% 8.0% 8.1% 9.1% Girl 9.0% 8.7% 6.5% 8.1% No Preference 82.7% 83.4% 85.4% 82.8%
Chi-2 0.845
PREFERRED GENDER FOR CHILD (SELF) Boy 8.4% 6.9% 6.8% 8.0% Girl 23.3% 18.0% 20.7% 16.0% No Preference 68.3% 75.1% 72.5% 76.1%
Chi-2 0.081 *
DELIVERY PREFERENCE Vaginal 83.8% 85.8% 85.2% 83.3% Caesarean 5.7% 6.4% 5.8% 6.4% Don't Know 10.4% 7.8% 9.0% 10.3%
Chi-2 0.824
REASON PREFER CAESAREAN DELIVERY Vaginal is painful 24.3% 13.6% 18.8% 14.3% My friends choose it 0.0% 9.1% 12.5% 5.7% Doctors Suggested 54.1% 53.6% 50.0% 48.6% Other 21.6% 13.6% 18.8% 31.4%
Chi-2 0.341
a = Asked only if respondent had previous children; % denote rates amongst this subset of women. b = “Don't know” <7.5% of responses, “don’t know” responses omitted. c= “Don’t Know” a common response, used both Anova & Chi-2 test for balance. d= Asked only if respondent stated she preferred caesarean delivery; % denotes rates amongst this subset of women. * p < .10 ** p < .05

64
In total, 1,952 women of the original 4,375 from baseline completed a post-delivery follow-up
survey which could be linked to her baseline survey. Of this, 488 (25.0%) were in the “Basic”
messages group, 471 (24.1) were in the Care Seeking Messages treatment arm, 465 (23.8%) were
in the Home Practices treatment arm, and 528 (27.0%) were in the group receiving All Texts. A
chi-squared test shows no evidence of differential loss to follow-up by treatment arm, failing to
reject the null of equal attrition at p=.615.
Loss to follow-up was high in our study for two main reasons. First, Gaoling MCHC with which
this study partnered to implement the trail abruptly and without notice uniformly stopped
sending program texts in December of 2015. Their decision was unrelated to efficacy, safety, or
cost of the intervention. Rather, clinic management decided that future patient communications
were preferably sent over WeChat than cellular SMS. WeChat is a very popular social
networking app in China. Released in 2011, it is estimated to now have 1.1 billion accounts and
570 million daily users, predominantly in China, an estimated 55% of which open WeChat more
than 10 times per day (“50+ Amazing WeChat Statistics,” 2014). While the content of the
Newborn Health Projects SMS messages could easily be delivered unaltered over WeChat, the
project’s setup linked message delivery to each women’s cellular number and no information on
their potential WeChat accounts had been collected. Therefore, Gaoling MCHC simply stopped
using the existing message delivery technology, and returned it.
A second reason for high attrition stemmed from difficulty in linking women’s baseline and
follow-up observations. Using personal, identifiable information not accessible by this
investigator, the implementation team linked women’s baseline and follow-up surveys first using

65
the woman’s phone number reported on both the baseline and follow-up survey forms, and if this
failed, the combination of their name and village. In up to 20% of cases, observations have either
failed to link at all or failed to link uniquely. This investigator only has access to follow-up
observations that have been successfully linked to baseline observations, and does not have IRB
permissions to access to the necessary personal, identifiable information to either investigate or
fix this issue.
It should be reiterated that there is no evidence that either issue caused attrition differentially
across treatment arms. While certainly regrettable in terms of statistical power, a lack of
correlation between attrition and treatment implies that there should be no bias induced in our
experimental results by either factor contributing to our high attrition rate. That baseline
covariates remained well and comparably balanced in both the final sample and the starting
sample also indicates that bias was not likely to be introduced via attrition.
Before turning to our main topic, one striking implication of the baseline statistics is worth
calling brief attention to. This Newborn Health Project only collected information on previous
child gender and preferred gender for the current pregnancy as potential control variables in
other analyses. Interestingly, though most stated that they had no preference, a stated preference
for a girl was more than twice as common as a stated preference for a boy. However, in the
gender distribution of women’s previous children, girls outnumber boys almost two to one,
specifically 63.4% to 36.6%. Application of Bayes’ Theorem to these numbers shows an implicit
stopping rule indicating an implicit preference for boys. The probability that women already
have a girl given that they are having additional children P(G | A) = 0.634, by Bayes’ Theorem,

66
is equal to the probability of having additional children given already having a girl P(A | G),
times the probability that any child is a girl P(G) and divided by the probability of having
additional children given one existing child P(A). The probability already having a boy given a
new pregnancy P(B | A) can be analogously described. Assuming that biologically, any
pregnancy is equally likely to result in male or female children (PB ≅ PG ≅ .50), it can be easily
shown that in our study population, the probability of having an additional child after having a
girl is more likely than that of having an additional child after having a boy by a ratio of
0.634/0.366 = 1.73. In light of China’s very recently lifted one child policy, this might shine
important light on which families can be anticipated to have more children in the near future.
Turning to our relationship of interest, the association of treatment assignment and caesarean
section rates, the unadjusted rates of caesarean delivery by treatment assignment are presented
below in Table 3.2.
TABLE 3.2: Birth Method Rates By Treatment Assignment
Caesarean Vaginal
Basic 133 (27.5%)
351 (72.5%)
Care Seeking
116 (24.9%)
350 (75.1%)
Home Practices
122 (26.4%)
340 (73.6%)
All Texts 119 (22.7%)
405 (77.3%)
Total 490 (25.3%)
1446 (74.7%)
Note that though the final sample contained 1,952 women, only 1,936 reported their mode of
delivery. Indeed, some amount of missingness is to be expected in any large-scale survey, and no
variable in the follow-up survey had a full 1,952 responses. By far the most common strategy to

67
handle missing data is to use “listwise deletion,” which means to drop any observation from the
analysis that does not have an observed value for every variable in the analysis. However listwise
deletion, under very weak assumptions, causes estimation errors of the same magnitude as the
omitted variable bias that including (incompletely) observed variables is meant to correct (King
et al., 2001). It’s been shown that a process called “multiple imputation” using expectation
maximization is one that will generally outperform listwise deletion or the other most common
general techniques of handling missing data (King et al., 2001). Multiple imputation was
performed in R using the Amelia package. This process 16 imputed datasets that had “complete”
data on all variables of interest. All regression analyses were run once on each of the 16 imputed
datasets, and the results combined using Rubin’s technique for combining quantities of interest
(King et al., 2001).
A total of four regression models were run to explore the impact of treatment on caesarean
section rates. Models I & II are shown in Table 3.3. Model I is a simple unadjusted logistic
regression that regressed the (log) odds of having a caesarean section on indicators for each
intervention arm, with the Basic arm omitted as the base case. No control variables were
included. The second model was the same functional form, but run on a subset of the data. As
mentioned previously, one of the questions in the post-delivery survey was whether the enrollees
had actually received text messages from the Newborn Health Project during their pregnancy.
Surprisingly only 77.6% of respondents answered “Yes” to this question. The second regression
model was the same unadjusted logistic regression as the first, run only on this 77.6% of
respondents.

68
Table 3.3: Unadjusted Logistic Regression of Caesarean Birth on Treatment Assignment
Model I: All Observations Model II: "Got Texts" Subset
(78%) OR 95% CI P Value OR 95% CI P Value
Care Seeking 0.867 0.650 1.157 0.332 0.711 0.509 0.992 0.045 ** Home
Practices 0.935 0.702 1.245 0.645 0.865 0.627 1.194 0.379 All Texts 0.778 0.584 1.036 0.085 * 0.645 0.467 0.891 0.008 *** Constant 0.384 0.314 0.468 0.000 0.434 0.347 0.542 0.000
* p < .10 ** p < .05 *** p < .01 It is unknown why over 22% of participants did not receive messages from the study. An array of
nonexclusive possibilities include phone numbers being miswritten on the survey form, phone
numbers being misentered into the SMS delivery system by health workers, participant phone
numbers changing after enrollment, participants giving numbers besides their text-enabled
cellular numbers as requested, or recall error. Also, over the full course of pregnancy, women
were sent three reminders that they could opt out of further messaging by replying “stop” to
program messages, though only 10 women in the study utilized this option, and all women using
this option would have received at least one, if not many messages.
A subtle and potentially bias-creating possibility is that sending a very different number of
messages to each group endogenously induced differential recall about receiving program texts.
(See Appendix 3.1 for a breakdown of number of texts by treatment arm and topic). Fortunately,
there is only very weak evidence for this. The rates of affirming text message receipt, by group,
were: Basic – 76.6%, Care Seeking – 74.8%, Home Practices – 77.5%, and All Texts – 81.3%.
A chi-squared test of equal proportions yielded a p-value of only 0.095. Notably, the Basic
group, which was sent by far the fewest number of messages, had a proportion in between that of
the Care Seeking and the Home Practices group. Also, the largest group difference in reported
69
message receipt was 6.4%, whereas each group had 18.7-25.2% non-receipt rate to account for.
Therefore, focusing only on those who confirmed receiving texts would seem to generally
exclude women who legitimately did not receive them while only potentially omitting a handful
that received them but forgot due to differential recall. Analysis of all observations is the usual
intent to treat (ITT) estimate for the experiment. Analysis of this subgroup is an approximation
of the program’s effect when all phone numbers are accurately conveyed by participants and
utilized by health workers.
Models III & IV (displayed in Table 3.4 below) show the results of logistic regression of
caesarean sections on intervention arm as well as baseline covariates. These baseline variables
include general demographic information (age, education, income, residency), pregnancy history
(previous live birth, previous miscarriage, whether pregnancy was planned or unplanned),
baseline self-assessed health, baseline covariates known from the literature to be predictive of
delivery mode (weight, insurance coverage, baseline desired mode of delivery)(K. Huang et al.,
2013; Wispelwey and Sheiner, 2013), all covariates found to be unbalanced from the baseline
balance check, and baseline measures of health psychology factors pulled from health behavior
literature (Health Attitudes, Health Expectations, Health Self-Efficacy, Health Personal Pressure,
Health Intentions, Health Plans, Perceived Health Social Norms, Perceived Susceptibility to Poor
Health, and Perceived Severity of Potential Poor Health). The rational behind the inclusion of
these particular 9 measures is discussed in Chapter 4 this thesis.
Only one variable from follow-up, “Family Support,” was included given its noted associations
with maternal health behaviors and neonatal health outcomes, which are discussed extensively in

70
Chapter 4 of this thesis. However, it is important to note that both unadjusted and covariate
adjusted regressions (not shown) reveal that treatment has no effect on family support levels,
meaning that family support is not a mediator of treatment, and the addition or removal of family
support as a covariate in regressions of cesarean delivery on treatment assignment (also not
shown) leaves the effect of treatment on the odds cesarean delivery unaltered in magnitude or
significance. It is included here only so that adjusted regressions contain all potential major
correlates of maternal health behavior, and so that regressions from Chapters III and IV may be
directly comparable by interested readers.
Table 3.4: Covariate-Adjusted Logistic Regression: Caesarean Birth on Treatment Group
Model III: All Observations Model IV: "Got Texts"
Subset (78%)
OR 95% CI P
Value OR 95% CI P
Value Care Seeking 0.833 0.611 1.135 0.247 0.639 0.443 0.922 0.017 ** Home Practices 0.911 0.670 1.239 0.552 0.788 0.556 1.118 0.182 All Texts 0.742 0.546 1.010 0.058 * 0.589 0.412 0.841 0.004 *** Age (Centered) 1.055 1.019 1.092 0.003 *** 1.061 1.020 1.104 0.004 *** Weight Centered 1.011 1.004 1.017 0.002 *** 1.007 0.999 1.015 0.081 * Planned Preg. 1.009 0.791 1.287 0.943 1.031 0.779 1.364 0.831 Prev. Live Birth 0.815 0.596 1.113 0.198 0.899 0.627 1.290 0.564 Past Miscarriage 1.356 1.072 1.716 0.011 ** 1.303 0.986 1.721 0.063 * Family Support 1.140 0.902 1.439 0.273 1.201 0.920 1.567 0.178 Education: Jr. High - Omitted Sr. High 1.069 0.808 1.415 0.640 1.229 0.886 1.703 0.216 3 Yr. College 0.845 0.576 1.241 0.391 0.943 0.604 1.472 0.796 4 Yr. College + 0.797 0.430 1.477 0.472 0.976 0.477 1.998 0.947 Husband Education Sr. High 0.946 0.713 1.255 0.701 0.919 0.665 1.271 0.609 3 Yr. College 1.123 0.761 1.659 0.558 1.125 0.727 1.743 0.597 4 Yr. College + 1.018 0.585 1.771 0.950 1.084 0.568 2.069 0.807

71
Table 3.4 (Continued): Insurance -NCMS omitted Urban Worker 2.157 1.210 3.848 0.009 *** 1.920 0.989 3.728 0.054 * Urban Resident 0.891 0.570 1.392 0.611 0.943 0.572 1.554 0.818 Other 0.838 0.371 1.889 0.669 0.851 0.327 2.216 0.741 None 0.616 0.324 1.172 0.140 0.486 0.219 1.077 0.075 * Income Category: <=22000 omitted 22,001 RMB 1.025 0.697 1.506 0.901 0.993 0.620 1.589 0.976 40,001 RMB 1.061 0.692 1.627 0.786 1.047 0.643 1.704 0.854 65,001 RMB 1.001 0.630 1.590 0.996 1.073 0.627 1.836 0.796 Health Baseline General: Health Attitude 0.927 0.813 1.058 0.261 0.973 0.836 1.132 0.720 Health Expectations 1.214 1.012 1.455 0.036 ** 1.144 0.924 1.416 0.217 Health Self Efficacy 1.024 0.892 1.175 0.734 1.017 0.868 1.191 0.835 Health Personal Pressure 0.943 0.843 1.054 0.303 0.943 0.829 1.073 0.376 Health Intentions 0.926 0.805 1.064 0.278 0.873 0.747 1.020 0.086 * Health Plans 1.012 0.886 1.155 0.863 1.020 0.877 1.186 0.799 Health Perceived Susceptible-Severity Category
2 0.989 0.658 1.486 0.956 0.986 0.631 1.540 0.949 3 1.330 0.817 2.166 0.251 0.905 0.487 1.680 0.751 4 1.157 0.766 1.747 0.489 1.134 0.690 1.863 0.620 5 1.320 0.869 2.004 0.193 1.104 0.683 1.785 0.685 6 0.950 0.502 1.797 0.874 1.106 0.560 2.185 0.771 7 1.150 0.713 1.856 0.566 1.162 0.693 1.948 0.570 8 1.429 0.717 2.849 0.311 1.266 0.587 2.733 0.548 9 1.367 0.944 1.980 0.098 * 1.266 0.842 1.903 0.256
Residency (Village Omitted) Province / City 2.160 1.113 4.190 0.023 ** 2.183 1.062 4.488 0.034 ** County 1.321 0.892 1.958 0.165 1.407 0.883 2.242 0.150 Township 1.234 0.925 1.645 0.152 1.327 0.944 1.866 0.104 Health before Preg.: Very good Omitted Good 0.905 0.595 1.376 0.639 0.992 0.594 1.656 0.975 Fair 1.126 0.734 1.727 0.586 1.221 0.728 2.048 0.450 Poor 1.392 0.570 3.396 0.468 1.869 0.729 4.795 0.193

72
Table 3.4 (Continued): Social Norm: % Women, none omitted Some 1.263 0.332 4.798 0.732 0.922 0.198 4.295 0.918 About Half 1.512 0.406 5.632 0.538 0.856 0.188 3.892 0.840 Most 1.608 0.446 5.804 0.468 1.105 0.252 4.856 0.894 Almost All 1.624 0.426 6.196 0.477 1.193 0.255 5.570 0.823 Don't know 1.392 0.384 5.052 0.615 0.947 0.214 4.199 0.943 Health Better 1.159 0.676 1.984 0.592 1.064 0.566 2.003 0.847 Health Worse 1.054 0.793 1.399 0.718 0.976 0.706 1.351 0.886 Health Not Sure 0.658 0.447 0.971 0.035 ** 0.532 0.333 0.849 0.008 *** Prefer Boy 0.887 0.577 1.364 0.585 1.003 0.613 1.643 0.990 Prefer Girl 1.055 0.794 1.401 0.713 1.122 0.810 1.554 0.489 Husb. Not smoke 1.055 0.829 1.344 0.662 1.120 0.843 1.487 0.435 Husb. Former Smoke 1.271 0.802 2.016 0.308 1.290 0.752 2.214 0.356 Smoker 1.498 0.565 3.966 0.416 1.867 0.586 5.947 0.291 Drinker 0.641 0.249 1.649 0.356 0.641 0.198 2.072 0.457 Preferred Delivery: Vaginal Omitted C-Section 3.749 2.481 5.664 0.000 *** 4.386 2.709 7.103 0.000 *** Don't Know 2.151 1.514 3.056 0.000 *** 2.137 1.421 3.212 0.000 *** Constant 0.124 0.024 0.630 0.012 0.224 0.035 1.432 0.114
* p < .10 ** p < .05 *** p < .01 In the unadjusted analysis, neither the “Care Seeking” messages group (which received five
relevant messages focused on proper indications for caesarean, risks of anesthesia & caesarean
sections) nor the “Home Practices” group (which received seven messages focusing on inspiring
confidence in vaginal delivery and discussing non-anesthetic ways to reduce and cope with pain
during delivery) were associated with a statistically significant reduction in the odds of
undergoing caesarean section. In combination, the All Texts group was associated with an odds

73
ratio (OR) of 0.78, but a p value of .085. Looking at the subset of the 77.6% of women who
actually received program text messages paints a different picture. In these women, Care Seeking
messages alone were associated with an odds ration of 0.71 with p=.045. The All Texts group
was associated with a highly significant reduction in the odds of undergoing caesarean section
(OR = 0.65, p=0.008).
Adjusting for potentially confounding covariates as well as known and hypothesized predictors
of caesarean delivery adds precision to these estimates but does not change them drastically.
Using all observations, neither separate set of texts had a measureable association with reduced
odds of caesarean sections, but sent together, the All Texts group was associated with an odds
ratio of 0.74, p=.058. Focusing on the subset of women who actually received program text
messages, adjusting for covariates shows Care Seeking messages alone to be associated with an
strong odds ratio of 0.64, p=.017, and the All Texts group was associated with a highly
significant OR of 0.59, p=0.004. Assuming the rate of 27.5% in the Basic group is representative
of Gaoling, this odds ratio of caesarean section in the All Texts group would imply a potential
9.2 percentage point drop to 18.3% if all pregnant women in Gaoling received the messages in
the All Texts arm.
Discussion
The rate of caesarean section in the Basic group of our study (27.5%) is notably lower than two
recent estimates of China’s national average (46.2% & 54.9%). Nonetheless, a rate of 27.5% is
still roughly double the WHO’s recommended rate of 10-15%, and still merits improvement.

74
One possible reason for this lower than expected baseline is that both recent national surveys
focused on large hospitals in large cities, whereas our sample came from an MCHC in a rural
area. Tang and colleagues have noted that women in large cities have 2.4 times the odds of
having caesarean delivery as women in smaller cities (Tang et al., 2006), a finding roughly in
line with the odds ratio found in our study comparing women who self reported living in cities to
those living in villages (OR=2.2). Further, Liu and colleagues found that caesarean section rates
increased with hospital complexity, with tertiary care facilities having the highest rates (Liu et
al., 2014). Also, we cannot test whether receiving the Basic messages lowered what would have
been the baseline rate. However, given that no Basic messages discussed mode of delivery or
related topics, any such effect is presumed to be small.
Evidence is strongly suggestive that receipt of the Newborn Health Project’s full text message
bank (All Texts) may have reduced women’s likelihood of opting for a caesarean delivery. The
unadjusted risk difference of 4.8 percentage points between the control group and the All Texts
group translates to an odds ratio of 0.778, p=0.085. Amongst the subgroup of women who
reported receiving program texts, we see a clearly stronger association, with an OR of 0.645 and
a p-value of 0.0078. This association is statistically significant even with a Bonferroni-
correction accounting for 3 group comparisons in both the full and subgroup data, for a total of 6
tests. Adding covariates to the model to account for potential bias and add precision strengthens
these findings, though only slightly. Using all observations, assignment to All Texts is associated
with an almost significant odds ratio of 0.74, p=.058 of having a caesarean delivery compared to
the control group. Within the subset that acknowledged receiving program texts, the association
is an OR of 0.589, p=0.0035. This p-value remains statistically significant even with a
75
Bonferroni correction for multiple testing accounting for 12 tests; namely, the three group
comparisons across 4 regression models.
The mechanism by which receipt of the full text message bank seems to have reduced demand
for caesarean sections is not entirely clear. The potential causal routes are a) altering women’s
underlying preferences for mode of delivery, b) empowering women to decline doctor suggested
caesareans by increasing their knowledge of delivery and labor self-efficacy, or c) reducing the
number of legitimate indications for caesarean sections. There is weak evidence that the Care
Seeking message bank alone had a larger odds reduction of caesareans than the Home Practices
message bank alone, but each estimate is well within the confidence interval of the other. If the
Care Seeking messages were truly the more effective, this could potentially indicate that
messages about proper caesarean indications and cautions about the risks involved were more
effective than messages about natural ways to reduce delivery pain. However, it could also
indicate that other aspects of the Care-Seeking messages prevented legitimate caesarean
indications by catching them sooner. The information available does not allow us to disentangle
these pathways, nor are they mutually exclusive. Moreover, whether or not one group alone is
more efficacious than the other, receipt of All Texts together showed the strongest reduction in
caesareans, suggesting that the most efficacious strategy is to deliver them together.
Our study has several limitations. Perhaps most importantly, it is limited by the fact that women
are trusted to self-report their delivery method to health workers. If women in intervention
groups felt a pressure to report vaginal delivery even in the case of caesarean delivery due to the
intervention causing them to believe vaginal delivery to be the more socially desirable answer,

76
then our results could be over-stated. If possible, confirming the self-reports by analysis of
medical records could be a useful subsequent analysis. It is also limited by the study population
being concentrated in one district of one province; it is unknown whether the results would
remain the same in other districts and other provinces. Finally, very high loss to follow-up
lowered the planned statistical power of our study. Loss to follow-up does not seem associated
with treatment assignment, and baseline covariates are balanced within both the full sample and
the subset that completed the study, which suggests loss to follow-up is hopefully not biasing our
results. However, we cannot measure whether it is associated with outcomes, and in particular
with mode of delivery, and as such we cannot confidently rule out the possibility that high loss to
follow-up has altered our findings.
As a first of its kind, this intervention and evaluation breaks ground in the fields of SMS for
maternal health in China and SMS for influencing mode of delivery. Though it is unknown how
results would vary in national and international contexts, the effects measured herein indicate
that similar intervention studies are warranted in other settings.
In 2015, China had 16.55 Million new births (National Bureau of Statistics of China, 2016).
With the recent relaxations in China’s one child policy, this number could grow considerably in
the next few years. If even the weakest estimate of the full text message bank (OR=0.778) held
in the general Chinese population, and assuming a national caesarean section rate of 46.2%,
national distribution of the full text message bank would imply a national reduction of 6.1
percentage points in the proportion of women who deliver via caesarean section. If, as Liu et al.
2014 estimates, 15.5% of deliveries in China are caesarean delivery on maternal request, such a

77
reduction would be a sizeable improvement in CDMR rates; though one the left continued need
for improvement. These are strong assumptions, but given the risks that unnecessary caesarean
sections pose, the excessive amount that China currently has, as well as the fact that caesarean
sections cost roughly double what vaginal deliveries cost in China’s big cities (Mi and Liu,
2014), wider distribution the Newborn Health Project’s messages on delivery mode seems a
strategy worth trying.
Conclusion
A quasi-randomized control trial distributing informational text messages to pregnant women in
Gaoling, China found evidence that the full set of text messages may have reduced the number of
caesarean deliveries in that group by 4.8 percentage points over the control group. Focusing on
the set of women who reported actually receiving program texts and adjusting for baseline
covariates greatly strengthened this measured relationship. Given numerous calls for strategies to
reduce the rate of medically unnecessary caesarean sections in China and elsewhere, exploration
of wider distribution of these text messages in China seems warranted.
BIBLIOGRAPHY
50+ Amazing WeChat Statistics [WWW Document], 2014. . DMR. URL
http://expandedramblings.com/index.php/wechat-statistics/ (accessed 3.30.16). Betrán, A.P., Ye, J., Moller, A.-B., Zhang, J., Gülmezoglu, A.M., Torloni, M.R., 2016. The
Increasing Trend in Caesarean Section Rates: Global, Regional and National Estimates: 1990-2014. PloS One 11, e0148343.
Dong, H., 2003. Health Financing Policies: Patient Care-Seeking Behavior in Rural China. Int. J. Technol. Assess. Health Care 19, 526–32.
Evans, W.D., Wallace, J.L., Snider, J., 2012. Pilot evaluation of the text4baby mobile health program. BMC Public Health 12, 1031. doi:10.1186/1471-2458-12-1031
Feng, X.L., Wang, Y., An, L., Ronsmans, C., 2014. Cesarean section in the People’s Republic of China: current perspectives. Int J Womens Heal. 6, 59–74.

78
Gilliam, M., 2006. Cesarean delivery on request: reproductive consequences, in: Seminars in Perinatology. Elsevier, pp. 257–260.
Huang, C.-M., Wu, H.-L., Huang, S.-H., Chien, L.-Y., Guo, J.-L., 2013. Transtheoretical model-based passive smoking prevention programme among pregnant women and mothers of young children. Eur. J. Public Health. doi:10.1093/eurpub/cks177
Huang, K., Tao, F., Faragher, B., Raven, J., Tolhurst, R., Tang, S., Van Den Broek, N., 2013. A mixed-method study of factors associated with differences in caesarean section rates at community level: the case of rural China. Midwifery 29, 911–920.
Jareethum, R., Titapant, V., Tienthai, C., Viboonchart, S., Chuenwattana, P., Chatchainoppakhun, J., 2008. Satisfaction of Healthy Pregnant Women Receiving Short Message Service via Mobile Phone for Prenatal Support: A Randomized Controlled Trial. J Med Assoc Thai 91, 458–63.
Ji, H., Jiang, H., Yang, L., Qian, X., Tang, S., 2015. Factors contributing to the rapid rise of caesarean section: a prospective study of primiparous Chinese women in Shanghai. BMJ Open 5, e008994.
Kainu, J.P., Sarvela, J., Tiippana, E., Halmesmäki, E., Korttila, K.T., 2010. Persistent pain after caesarean section and vaginal birth: a cohort study. Int. J. Obstet. Anesth. 19, 4–9.
King, G., Honaker, J., Joseph, A., Scheve, K., 2001. Analyzing incomplete political science data: An alternative algorithm for multiple imputation, in: American Political Science Association. Cambridge Univ Press, pp. 49–69.
Liu, X., Landon, M.B., Cheng, W., Chen, Y., 2015. Cesarean delivery on maternal request in China: what are the risks and benefits? Am. J. Obstet. Gynecol. 212, 817–e1.
Liu, Y., Li, G., Chen, Y., Wang, X., Ruan, Y., Zou, L., Zhang, W., 2014. A descriptive analysis of the indications for caesarean section in mainland China. BMC Pregnancy Childbirth 14.
Lumbiganon, P., Laopaiboon, M., Gülmezoglu, A.M., Souza, J.P., Taneepanichskul, S., Ruyan, P., Attygalle, D.E., Shrestha, N., Mori, R., Hinh, N.D., others, 2010. Method of delivery and pregnancy outcomes in Asia: the WHO global survey on maternal and perinatal health 2007–08. The Lancet 375, 490–499.
Lund, S., Hemed, M., Nielsen, B.B., Said, A., Said, K., Makungu, M.H., Rasch, V., 2012. Mobile phones as a health communication tool to improve skilled attendance at delivery in Zanzibar: a cluster-randomised controlled trial. BJOG Int. J. Obstet. Gynaecol. 119, 1256–1264. doi:10.1111/j.1471-0528.2012.03413.x
Mi, J., Liu, F., 2014. Rate of caesarean section is alarming in China. Lancet 383, 1463–4. National Bureau of Statistics of China, 2016. China’s Economy Realized a Moderate but Stable
and Sound Growth in 2015 [WWW Document]. URL http://www.stats.gov.cn/english/PressRelease/201601/t20160119_1306072.html (accessed 3.7.16).
Naughton, F., Jamison, J., Sutton, S., 2013. Attitudes towards SMS text message smoking cessation support: a qualitative study of pregnant smokers. Health Educ. Res. doi:10.1093/her/cyt057
Noordam, A.C., Kuepper, B.M., Stekelenburg, J., Milen, A., 2011. Improvement of maternal health services through the use of mobile phones. Trop. Med. Int. Heal. TM IH 16, 622–626. doi:10.1111/j.1365-3156.2011.02747.x
Souza, J.P., Gülmezoglu, A.M., Lumbiganon, P., Laopaiboon, M., Carroli, G., Fawole, B., Ruyan, P., 2010. Caesarean section without medical indications is associated with an

79
increased risk of adverse short-term maternal outcomes: the 2004-2008 WHO Global Survey on Maternal and Perinatal Health. BMC Med. 8, 10.1186/1741–7015–8–71.
Tamrat, T., Kachnowski, S., 2012. Special delivery: an analysis of mHealth in maternal and newborn health programs and their outcomes around the world. Matern. Child Health J. 16, 1092–1101. doi:10.1007/s10995-011-0836-3
Tang, S., Li, X., Wu, Z., 2006. Rising cesarean delivery rate in primiparous women in urban China: evidence from three nationwide household health surveys. Am. J. Obstet. Gynecol. 195, 1527–1532.
Thompson, J.F., Roberts, C.L., Currie, M., Ellwood, D.A., 2002. Prevalence and persistence of health problems after childbirth: associations with parity and method of birth. Birth 29, 83–94.
Villar, J., Carroli, G., Zavaleta, N., Donner, A., Wojdyla, D., Faundes, A., Velazco, A., Bataglia, V., Langer, A., Narváez, A., others, 2007. Maternal and neonatal individual risks and benefits associated with caesarean delivery: multicentre prospective study. Bmj 335, 1025–1029. doi:10.1136/bmj.39363.706956.55
Visco, A.G., Viswanathan, M., Lohr, K.N., Wechter, M.E., Gartlehner, G., Wu, J.M., Palmieri, R., Funk, M.J., Lux, L., Swinson, T., others, 2006. Cesarean delivery on maternal request: maternal and neonatal outcomes. Obstet. Gynecol. 108, 1517–1529.
Vogel, J.P., Betrán, A.P., Vindevoghel, N., Souza, J.P., Torloni, M.R., Zhang, J., Tunçalp, Ö., Mori, R., Morisaki, N., Ortiz-Panozo, E., others, 2015. Use of the Robson classification to assess caesarean section trends in 21 countries: a secondary analysis of two WHO multicountry surveys. Lancet Glob. Heal. 3, e260–e270.
Wispelwey, B.P., Sheiner, E., 2013. Cesarean delivery in obese women: a comprehensive review. J. Matern. Fetal Neonatal Med. 26, 547–551.
World Health Organization, 2015. WHO Statement on Caesarean Section Rates. Zhang, J., Liu, Y., Meikle, S., Zheng, J., Sun, W., Li, Z., 2008. Cesarean delivery on maternal
request in southeast China. Obstet. Gynecol. 111, 1077–1082.

80
APPENDIX 3.1. SMS Messages, by General Topic, Treatment Group, and Timing
Message Categories
Message delivery time and total number of SMS messages Randomized
Group
Sign-up day
First Trimester
Second Trimester
Third Trimester
Final day
Fetal development (19) 2 6 6 3 2
Basic Group (25) Reminders for prenatal
visit and hospital delivery (6)
1 1 4
Fetal development (19) 2 6 6 3 2
Reminders for prenatal visit and hospital delivery (8) 2 2 4
Warnings & Recognition of danger signs (45)
5 23 17
Care-seeking
Group (82)
Reminders for government-subsidized projects (10)
3 2 5
Fetal development (19) 2 6 6 3 2
Reminders for prenatal visit and hospital delivery (6)
1 1 4
Healthy lifestyle (Nutrition, physical activity, etc.) (37)
15 16 6
Mental health during pregnancy (8) 1 4 3
Pain management (9) 4 5 Labor (6) 3 3
Good Household Prenatal Practice
Group (91)
Breastfeeding (6) 6 All Texts: Full SMS Bank (148)
Full bank (148) 2 32 60 52 2

81
APPENDIX 3.2 MESSAGES REGARDING DELIVERY ADVICE BY TREATMENT ARM
COMPARISON GROUP / BASIC
None
CARE SEEKING
Day 158: Cord around the neck is a common, ultrasound, fetal movement monitoring can help
diagnose it. If abnormal, please seek immediate medical attention, and choose the appropriate
delivery method with the guidance of the doctor.
Day 205: Vaginal delivery is the most reliable delivery method unless doctor suggests you to use
c-section. Although anesthesia in C-section would cause no pain during your delivery, you will
still be painful during recovery. Usually, C-section takes more time to recovery. If you feel much
pain after delivery, you could take painkilling medicines according to the doctor’s prescription.
Day 207: Vaginal bleeding in the third trimester may indicate placenta previa, if diagnosed by
ultrasound, you should take more rest, avoid fatigue and vaginal stimulation. If necessary, you
may need caesarean section.
Day 209: Don’t panic about baby malposition. Sometimes malposition can be self-corrected. As
long as you go to regular prenatal care, and choose the right delivery approach according to your
doctor, you can deliver safely.

82
Day 223: The use of anesthesia for "painless childbirth" can reduce pain, but it can also bring
risks. Experts suggest less intervention and a more natural way of labor. Avoid using medicine or
surgical operations unless there are medical reasons for doing so.
Day 263: Doctors will decide whether you should have early admission, fetal monitoring and
your delivery approach by measuring the inside and outside of the pelvis and ultrasonography. If
doctors suggest you to have vaginal delivery, please don't say no just because of fear of pain.
Day 268: If you have passed the expected due data, please do not worry. Only 5% of babies are
born within the due date. The doctor will use ultrasound and fetal heart rate monitor to check the
safety of pregnancy.
HOME PRACTICES
Day 104: Breathing training can help you stay relaxed and calm during childbirth. Rama
breathing exercise is the most commonly used, and it can help reduce the pain during labor. Key
message: Take a deep nasal breath with your nose, and then exhale slowly through your mouth.
Please consult the Maternal and Infant Healthcare Center for details.
Day 121: Prenatal classes on delivery are also a good way to help you understand the labor
process. To be more prepared, you can take a prenatal class in addition to our ‘Baby Letter’.

83
Day 140: Good control of hormone levels will help reduce the pain. During labor, please keep
calm and confident, which could help regulate the secretion of hormones, thereby reducing pain.
Day 163: There are three main ways to delivery a baby: natural childbirth (without anesthesia);
painless childbirth (using local anesthetic); caesarean section. If no high risk factors, it is better
to choose natural childbirth. If you want to use natural birth but are very afraid of the pain, you
can learn more about how to reduce pain during childbirth.
Day 172: For most normal pregnancy, vaginal delivery is the most reliable method, and is more
beneficial for the mother's recovery compared to C-section, it also increases the success of
breastfeeding.
Day 177: Pelvic exercises will make your childbirth easier and help prevent complications such
as perineal tear. Pelvic exercises have the following steps: contraction of the anus and vagina,
then relax. You can practice it whenever you have time.
Day 200: Vaginal delivery is the most reliable delivery method. For most of the normal
pregnancy, natural childbirth is better for recovery, more beneficial for baby and has a higher
rate of successful breastfeeding compared to caesarean section.
Day 202: Still remember Lamaze breathing exercises? Do not forget to keep training your
breathing? Key points are to take a deep breath through nasal, then exhale through your mouth

84
slowly. This can help stay relaxed and calm during childbirth, can reduce the pain from
production.
Day 210: Do you have confidence in the delivery? Do you feel a little worried or panic? Tell
your concerns to your doctor, and learn some information about labor and delivery in advance.
You will feel more comfortable with someone familiar around you.
Day 224: When delivering a baby, in addition to using local anesthetic, there are many other
ways to relieve pain, such as deep breathing, massage, and try different production poses.
Day 237: During labor, lower back massage can reduce pain. But also can massage the head and
face, to relax and unwind.
Day 247: You don't have to lie on the bed before labor. You can walk, stood, swaying body in
the delivery room, leaning against the wall leaning, kneeling, or lying on the bed in her husband's
body. As a mother, you have the intuition to judge what kind of position most comfortable.
Day 259: Contractions may sometimes cause pain that even affect normal language dialogue,
how to cope with contractions? Please take a deep breath. When you take a deep breath, there is
more oxygen to be delivered to your uterus and the fetus, and lead to mild pain relief.
Day 266: Labor pain is not persistent pain, but a wave of pain. After each contraction, please
relax to better cope with the next contraction.

85
Day 270: Moderate exercise can help start the delivery. Walking, climbing stairs and pre-
gymnastics recommended sports. But you should have company during exercise.
ALL TEXTS GROUP
Includes all messages listed above from all groups. Messages sent to this group were sent on the
same days as in the other groups.

86
CHAPTER IV The Association of Familial Support with Birth Weight and Prenatal Behaviors In A Cohort from
Xi’an China ABSTRACT
Objective: Studies of social support in numerous contexts have indicated that it is often
positively associated with better health in numerous contexts, but this pattern is not consistent
across all contexts, nor is the mechanism of association fully understood. Whether there is an
association of family social support during pregnancy and birth outcomes in China has not been
evaluated. This paper aims to measure the association of family support and odds of small for
gestational age amongst newborns, as well as explore a range of pregnancy health behaviors as
potential mediators of an association.
Design: An observational study was conducted in Xi’an China with 1,952 expecting mothers.
Surveys were used to measure the association of levels of self-reported family support with
occurrence of small for gestational age (SGA) and 5 different health behaviors during pregnancy:
timing of initiation of antenatal care, seeking medical attention during illness, supplementing
nutrients, frequency of moderate exercise, and smoking during pregnancy. Logistic regression
was run of SGA on self-reported family support, both with and without an array of control
variables.
Main Outcomes Measure: The proportion of newborns born small for gestational age women
with high and low levels of family support.

87
Results: Unadjusted logistic regression indicated that high levels of family support for a mother
was associated with reduced odds of delivering a child who was small for their gestational age;
odds ratio (OR) =.726, p=.030. Adjusted logistic regression incorporating an array of covariates
found that high levels of family support for a mother was associated with even lower odds of
delivering a child who was small for their gestational age; OR =..681, p=.013. Using Baron and
Kenny’s (1986) criterion for mediation analysis, evidence suggested that the association of
family support and reduced odds of small for gestational age was at least partially mediated by
better nutrition supplementation and more moderate exercise amongst women with high levels of
family support.

88
INTRODUCTION
The literature across many health disciplines has convincingly demonstrated that supportive
relationships have protective effects on a variety of physical and mental health outcomes
(Gallant, 2003). With regards to pregnancy specifically, a substantial number of studies report
that social support exerts a positive impact on a pregnant woman’s psychological well-being, as
well as on the health of her newborn (Fernández and Newby, 2010). The greatest amount of
evidence is on the positive link between social support and birth weight (Dunkel Schetter, 2011;
Feldman et al., 2000; Orr, 2004). Exactly why this association may exist, however, is not fully
clear. Though social support’s of effect on health is primarily hypothesized to be via
neuroendocrine response, inflammatory/immune response, and behavioral, there is very limited
evidence for the full pathway between social support and adverse birth outcomes (Dunkel
Schetter, 2011).
Moreover, there is an open question as to whether a linkage between social support and newborn
health holds at all outside of the West. Whilst a large literature from Western countries has
established a connection between the quality of marital relationships and health, except for work
on domestic violence, the connection between maternal health and family relationship quality
has largely been neglected in non-Western contexts, and has not been accompanied by a
complementary focus on the positive dimensions of family relationships (Allendorf, 2010).
Researchers have called for a focus on the cross-cultural contexts in which social support
provision and receipt can occur (Nurullah, 2012), and regarding pregnancy, as stated by Kratz
89
and colleagues: “research should examine how social support may affect health beliefs among
women who hold non-Western beliefs regarding pregnancy practices (Kratz et al., 2013).”
This paper will contribute to the literature by investigating whether an association between
familial support during pregnancy and newborn health, as proxied by the metric “small for
gestational age” exists in the non-Western context of rural China, using a sample drawn from
Xi’an. If an association is found, this paper will further contribute to the literature by
investigating possible behavioral mediation pathways by which a connection family support and
newborn size for gestational age might be linked. Specifically, self reported measures of
nutritional supplementation, exercise frequency, timing of antenatal care initiation, care-seeking
during illness, and smoking during pregnancy will be available for mediation analysis.
In 2015, China had 16.55 Million new births (National Bureau of Statistics of China, 2016).
With the very recent relaxations in China’s one child policy, this number could grow
considerably in the next few years. Understanding the current influences of newborn health in
China, particularly as influenced by modifiable health behaviors, could potentially benefit
millions of new parents and health practitioners during years that could see a baby boom within
the country.
BACKGROUND
Social Support & Health
Though not yet documented in the literature, there is yet good reason to hypothesize and
investigate whether a connection between social support and newborn health might exist outside
90
of Western countries. Reason to expect an association can be drawn from similar findings in
other health domains. For example, it has been found that social support is an important factor in
immune, endocrine, and cardiovascular functioning; recovery from illness and injury; and health
maintenance (DiMatteo, 2004). There has been strong evidence from systematic reviews that
poor social relations are a risk factor for developing cardiovascular disease as well as poorer
prognosis upon diagnosis (Tay et al., 2013). Amongst the most important reasons to study social
support and health is that the evidence is clear that better social support is associated with
lowered mortality. A 2013 meta-analysis and meta-regression of self-reported social support and
all-cause mortality that included 178 estimates from 50 publications in their analysis found that
mortality among those with low levels of perceived support had an adjusted hazard ratio for all-
cause mortality of 1.11 (95% confidence interval [CI]: 1.05, 1.17) (Shor et al., 2013). Most
relevant to China, a 2015 study from China found that increases in social support increased the
odds of taking medication and measuring blood pressure regularly amongst hypertension patients
(Hu et al., 2015).
The Pathway Between Social Support And Health
There are two main hypotheses on how social support can influence health. The first, known as
the “stress-buffering” hypothesis, posits that social support mitigates the impact of stressful
events by reducing stress and facilitating coping, thereby reducing detrimental psychological and
physiological stress responses (Aaronson, 1989; Harley and Eskenazi, 2006; Kratz et al., 2013;
Orr, 2004). A related but distinct strain of this hypothesis posits a “direct” positive effect on
psychology and physiology that can exist without highly stressful events to buffer (Harley and
Eskenazi, 2006; Orr, 2004). The second main hypothesis is that social support affects health by
91
enabling or enhancing adherence to health behaviors that are beneficial to health (Aaronson,
1989; Cannella, 2006; Fernández and Newby, 2010; Harley and Eskenazi, 2006; Kratz et al.,
2013). Review of the literature suggests evidence for all of these mechanisms (Kratz et al.,
2013; Orr, 2004), and they are not mutually exclusive.
Social Support And Health Behavior
Evidence for the link between social support and health behaviors is myriad. In the realm of
medication adherence, meta-analyses establish significant average r-effect sizes between
adherence and various measures of social support, including practical, emotional, and
unidimensional (DiMatteo, 2004). A 2003 systematic review of social support and chronic illness
self-management found that the studies included provided evidence for a modest positive
relationship between social support and chronic illness self-management, especially for diabetes
(Gallant, 2003). Specifically, of the 13 methodologically sound 13 quantitative articles, six found
significant positive relationships between social support and self-management behaviors, and an
additional six studies found at least partial support for a positive association. Further, the seven
qualitative studies included also provided strong evidence that social support can provide
instrumental and emotional support that is recipients perceive to positively influence self-
management (Gallant, 2003). A study of university students across 16 European countries found
low levels of social support were related to poor health behaviors, such as irregular sleep, lack of
exercise, and not wearing seatbelts (Allgöwer et al., 2001). There is a proliferation of evidence
for social relations specific to physical activity (Tay et al., 2013), including a meta-analysis of 87
studies showing that social influence is associated with exercise adherence and exercise
behaviors (Carron et al., 2010).
92
However, more social support does not always mean better health behaviors, as studies on
tobacco and alcohol use make clear. A review and meta-analysis of alcoholism treatment
programs found that social support had a positive associations, but they were inconsistent and
weak (Beattie, 2001). Despite evidence of an association between social support and limiting
smoking and alcohol consumption among pregnant women (Cannella, 2006), there has been
little evidence in intervention studies that social support interventions are effective in improving
abstinence (Tay et al., 2013). One’s social network can set bad examples as well as good
(Aaronson, 1989), and particularly susceptible are diet (de Jersey, 2013; Gallant, 2003; Tay et
al., 2013) and substance abuse (Kimbro, 2008; Kratz et al., 2013; Tay et al., 2013). “Nagging”
can be unsuccessful and even stress inducing, potentially even causing patients to be less
confident in caring for their own disease (Kimbro, 2008; Kratz et al., 2013; Rosland and Piette,
2010). Interactions may also be complex and inconsistent. For example, while support specific to
pregnancy matters has been found negatively associated with drinking during pregnancy, general
support appears to predict high levels of drinking prior to becoming pregnant (Stephens, 1985).
With these complexities in mind, it has been postulated that social relations may have more
positive associations with health behaviors that are less frequently shared between the focal
individual and their social network (Tay et al., 2013).
Social Support & Behavior During Pregnancy In Other Contexts
A number of studies, predominantly investigated in western cultures, have already shown an
association between social support and pregnancy health behaviors. Perceived and/or received
support, as well as simply being married, have been repeatedly shown to be predictors of reduced

93
consumption of alcohol and drug use (Aaronson, 1989; Fernández and Newby, 2010; Harley and
Eskenazi, 2006; Kimbro, 2008; Martin et al., 2007; Yargawa and Leonardi-Bee, 2015).
Regarding delivery, several studies have shown that male partner attendance at a woman’s
antenatal care (ANC) checkups is positively associated with the presence of a skilled health
worker being present during delivery (Aguiar and Jennings, 2015), and one study from India has
shown that women in better marital relationships are more likely than others to deliver in a
health-care facility (Allendorf, 2010). A small amount of evidence, all from the United States or
Canada, has shown that in those contexts, women with more family support engaged in healthier
eating and had increased usage of prenatal vitamins (Fernández and Newby, 2010; Fowles and
Fowles, 2008; Harley and Eskenazi, 2006; Nash et al., 2013). Some women first seek antenatal
care at family member’s suggestion (Fernández and Newby, 2010), and at least one study shows
that women with more involved partners initiate earlier prenatal care (Martin et al., 2007),
though this does not always seem to be the case (Harley and Eskenazi, 2006). Multiple studies
show that women with more familial and other social support get more prenatal care (Allendorf,
2010; Fernández and Newby, 2010; Kimbro, 2008; Leal et al., 2011), although this can vary with
familial living arrangements (Allendorf, 2010). Moreover, at least two investigations that have
used composite measures of health promotion during pregnancy found positive relations between
social support and positive health practices (Cannella, 2006; Chen et al., 2007).
Though the majority of evidence point towards positive effects of social support on pregnancy
behaviors, not all studies have found consistently positive findings. A 2007 study from Nepal
found no significant differences in skilled birth attendance by women randomized to receive
ANC education with their husbands vs. those randomized to receive it alone (Mullany et al.,

94
2007). Further, male antenatal accompaniment at ANC does not always predict subsequent
utilization (Aguiar and Jennings, 2015).
Current Research Frontiers
Despite this growing body of research on social support, health behaviors, and birth outcomes,
numerous questions remain unanswered. As mentioned, one is whether this linkage holds
outside of the West. Asia is a particularly important location to investigate in this regard. Taylor
et al. found that though “Social support is believed to be a universally valuable resource for
combating stress, yet Asians and Asian Americans report that social support is not helpful to
them, resist seeking it, and are underrepresented among recipients of supportive services (Taylor
et al., 2007).” Distinguishing between explicit and implicit social support, the authors further
found that “Asians and Asian Americans are psychologically and biologically benefited more by
implicit social support than by explicit social support, [but] the reverse is true for European
Americans (Taylor et al., 2007).” This differential reaction to social support may change or
eliminate the physiological or behavioral connections between social support and birth outcomes
in Asian contexts.
Considering that health behaviors have been hypothesized to mediate connections between social
support and health, it is worth noting that that “different sets of predictors, in different
constellations, may determine changes in different health behaviors,” and that “Only a few
studies have examined changes in multiple health behaviors (Park and Gaffey, 2007).” Some
relationships between social support and pregnancy behaviors, such as abstinence from smoking
and drinking, have been well studied. Others, such as diet and exercise, have been less

95
represented, or have conflicting evidence, as is the case with the adequacy of ANC utilization.
Discovering a connection between social support and health immediately poses the non-trivial
question of what mediating factors are connecting the two.
Finally, there has also been a disconnect between observational findings regarding social support
and health outcomes and intervention findings regarding the same. Orr et al.’s 2004 review of
social support and pregnancy outcomes found that the overall evidence from observational
studies showed that social support to be associated with improved outcomes, particularly in the
area of birth weight. However, they also found that interventions to increase social support
during pregnancy often produced “disappointing” results. This casts lingering potential doubt on
a causal relationship between social support and outcomes.
Intended Contribution of the Current Study
Despite a large body of literature on social support and health, whether social support is
associated with better birth outcomes in the People’s Republic of China specifically seems to
have no specific published evidence to support or contradict a connection. A single study from
Taiwan (Lin et al., 2009) was the most relevant citation found, and though promising, that study
substituted perceived social norms as a proxy for social support, and moreover may not represent
social influences from within the PRC.
With this literature gap in mind, this paper will investigate whether family support is associated
with better birth outcomes amongst women in the Xi’an area of China’s Shaanxi province. Given
that social support and birth weight have the most supportive literature in other contexts so far,

96
“small for gestational age” (SGA) was chosen as the fundamental metric for neonatal health at
birth. SGA is defined by the WHO as infants below the 10th percentile of birth weight for their
gestational age (Lee et al., 2013).
Our methodology is intended to add to and improve upon previous research in several ways.
First, SGA is generally considered a more relevant health marker than raw birth weight
continuously measured, as has been more often studied. A recent meta-analysis pooling 20
cohorts from low and middle-income countries found that SGA was associated with a relative
risk of neonatal mortality of 1.83 (95% CI: 1.34-2.50) and 1.90 (1.32-2.73) for post neonatal
mortality (Katz et al., 2013). It is also a more specific metric than the commonly used “Low birth
weight.” Low birth weight can be caused by either of two different factors with different
underlying causes and different risks, namely pre-term birth and intrauterine growth restriction.
By accounting for gestational age, SGA is a commonly accepted proxy for intrauterine growth
restriction specifically, though it does not differentiate causes of that restriction, which can
include chronic undernutrition, placental insufficiency, infections, or other factors (Lee et al.,
2013). It can be useful to differentiate between pre-term birth, SGA and their co-occurrence, as
their associated relative risks of neonatal death are different, and their co-occurrence has a higher
relative risk of neonatal death than either alone (Katz et al., 2013).
Second, as Orr pointed out in their review of social support and pregnancy, many studies
reported correlation coefficients and mean differences, but did not provide data for crude or
adjusted odds ratios, and stated that “Clearly, additional research is needed in this area (Orr,
2004).” This paper will provide both unadjusted and covariate adjusted odds ratios derived from

97
logistic regression, with the aim of accounting for the most likely confounding covariates. Third,
our sample (N=1,952) is larger than any of the four studies of social support and birth weight
discussed in Orr’s review, the largest of which had 247 participants, and in fact has a sample size
larger than all four combined (Orr, 2004). This gives us much greater power to accurately
estimate the association of social support and birth size in our study population than has been the
case in study populations so far. Fourth, our focus on family support specifically may target the
most important source of social support. In their meta-analysis of social support and mortality,
Shor et al. noted that the protective effect of support from family was stronger than that of
support from friends p=.002 (Shor et al., 2013). It may be that different sources of social support
ought to be analyzed separately, though this has not always been done in previous studies.
A final potential contribution of this investigation is that engagement measures for a number of
pregnancy health behaviors potentially relevant to SGA are also collected. Thus, any evidence
of a link between family support and SGA, if found, can be further investigated via a mediation
analysis to discover what, if any, pregnancy behaviors reported may explain the linkage. The
relevant behaviors surveyed are nutrition supplementation, smoking during pregnancy, care-
seeking during illness, timing of antenatal care initiation, and moderate exercise frequency. The
exact metrics used for these behaviors and their potential relations to SGA will be discussed in
subsequent sections.
DATA AND METHODS
Study Population and Data Collection
98
The data for this study comes from Evaluation for mHealth Intervention’s (EMI) Newborn
Health project, which is investigating the effect of a short message service (SMS) intervention on
maternal and newborn health and health behaviors in a cohort of women in Xi’an China. The
Newborn Health project offers expectant mothers in rural China a package of free short messages
via cell phone regarding pregnancy and childbirth. These messages are tailored to each mother’s
gestational week, and it is hypothesized that delivering these short advice messages to pregnant
women can improve maternal and newborn health. EMI’s Newborn Health Project utilizes a
quasi-randomized factorial assignment that places each participant into one of four possible
message package arms based on the expecting mother’s birthday. This paper does not investigate
the effect of these different message treatments on pregnancy health behaviors or pregnancy
outcomes; rather it uses the data generated from the project to investigate whether family support
is connected to SGA, and if so, if the linkage is mediated by pregnancy health behaviors.
However, in most regression specifications, treatment arm is included as a control variable as
treatment arms were designed to be influential on both pregnancy behaviors and outcomes.
Prior to randomization, a baseline survey was conducted with each enrollee. This survey
collected demographic data, self-reported health data, as well as data relating to each enrollees’
thoughts and perceptions regarding health during pregnancy and childbirth.
A week after each delivery, a follow-up survey was conducted by a health worker at the mother’s
home. This survey collected several birth outcomes, including mode of delivery, birth weight,
and gestational week. It also measured retrospective categorizations of pregnancy health
behaviors, as well as other pregnancy related questions, including the self reported amount of

99
how much family support the woman received during pregnancy. The three possible responses
for the amount of social support were “None,” “Some,” and “A lot.”
Four of the pregnancy health behaviors measured in the follow up survey and one measured at
baseline were considered potentially relevant to SGA, and had the potential to mediators to any
significant connection of family support to SGA. They were:
1) Supplementing Any Nutrients: Women were queried during follow up on their
supplementation of calcium, iron, folic acid, and protein powder during pregnancy. Because it
was anticipated that supplementation of each was likely to be correlated with the others, a
composite behavioral measure was created to indicate whether women supplemented at least one
of any of the nutrients calcium, iron, or protein powder. Folic acid supplementation was omitted
from this indicator because 90.7% of respondents reported supplementing folic acid, and if
included the proportion supplementing any nutrient was 95.9%, which was anticipated to leave
too little variation from which to make meaningful inferences. It is beyond the scope of this
investigation to detail the literature surrounding maternal nutrition and birth weight, but we
proceeded with the very strong expectation that nutrition supplementation would be associated
with a reduced rates of SGA.
2) Seeking Care During Illness: Women were then asked during follow up whether they had had
experienced certain symptoms during pregnancy, and conditional upon answering yes, whether
they had sought care for those specific symptoms. Those twelve symptoms were i) Vaginal
bleeding (except during labor), ii) Sudden vision change, iii) Vomiting (except routine morning

100
sickness), iv) Moderate to severe dizziness, v) Mild fever, vi) Moderate to high fever, vii) Mild
abdominal pain, viii) Moderate to severe abdominal pain, ix) Abnormal discharge, x) Mild
swelling/edema, xi) Moderate to severe swelling/edema, and xii) Other serious pain. Women
were coded as “Ill” if they reported experiencing at least one of these symptoms. Women were
further coded as “Sought Care” if were coded as “Ill” and reported seeking medical attention for
at least one of their symptoms. They were coded as “Did Not Seek Care” if either they
experienced symptoms but reported no extra care or if they simply experienced no queried
symptoms. Seeking care during illness is expected have a protective association with SGA, as
conditions potentially causing SGA would potentially be noticed and corrected more quickly.
3) Moderate Exercise Frequency During Pregnancy: Women were asked during follow up how
often they had engaged in “moderate exercise” during pregnancy. The five possible responses
were “Never”, “Less than once a month”, “Once to three times per month”, “One to four times
per week”, and “Four times per week or more.” This variable was coded as a 5-level, ordinal
variable. The relationship between moderate exercise and low birth weight / SGA is an active
area of research. Moderate exercise has generally been viewed as an avenue to potentially
preclude the opposite problem of Large for Gestational Age as well as to guard against
gestational diabetes. Potential concern has been raised as to whether moderate exercise actually
may contribute to SGA for pregnancies at-risk for the condition. However, both a 2011 review
of the literature and a 2015 meta-analysis on the topic conclude that prenatal exercise seems to
protect against “Large at birth,” defined as either LGA or having macrosomia) without any
increase in the odds of “small-at-birth,” defined as either SGA or low birth weight (Hopkins and
Cutfield, 2011; Wiebe et al., 2015). There is also a recent trend in findings suggesting that

101
regular low to moderate exercise reduces the risk of being born at either extreme of the birth
weight range (Siebel et al., 2012), though this potential benefit was not detected in Wiebe et al.’s
2015 meta-analysis. It is worth noting, however, that our original, unimputed sample size
available for analysis of SGA is 1,930, which of itself nearly rivals the 2,183 subjects in the
twelve analyses combined in Weibe et al.’s 2015 meta-analysis of “small at birth.” It is therefore
felt that a test for a potential exercise - SGA association in our analysis can make a solid
contribution to the same topic.
4) Timing of First Antenatal Care (ANC) Checkup: Women were enrolled in EMI’s Newborn
Health Project at their first ANC checkup, and their gestational week at the time of enrollment
was recorded as an integer between 1 and 42. Timing of ANC initiation is a useful proxy for
adequacy of ANC care. The most popular indices measuring the adequacy of prenatal care such
as the Kessner Index, the GINDEX, and the Adequacy of Prenatal Care Utilization (APNCU) all
incorporate the timing of initiation of prenatal care amongst their key factors (VanderWeele et
al., 2009). Studies have suggested that inadequate prenatal care as judged by different indices has
been associated with adverse birth outcomes, though findings have been inconsistent and can
vary by index (CHEN et al., 2007).
5) Smoking During Pregnancy: Smoking during pregnancy is a well acknowledged risk factor
for adverse pregnancy outcomes, including multiple studies showing significant associations
between smoking and the outcomes of SGA, low birth weight, and fetal growth restriction
(Vardavas et al., 2010). Self-reported during follow up, smoking during pregnancy was

102
dichotomously indicated as being a smoker during pregnancy or not; no measures of frequency
or intensity of smoking were recorded.
To categorize infants as SGA, it is necessary to compare each newborn’s weight at birth to some
reference standard for weight distribution at the newborn’s gestational age. Defining the most
appropriate standard for various populations worldwide has often been challenging and debatable
(Mikolajczyk et al., 2011). Recently, Mikolajczyk et al. combined the fetal-weight reference
developed by Hadlock and colleagues and the notion of proportionality proposed by Gardosi and
colleagues to make a formula for a global reference standard adjustable to any local population.
The authors validated their standard using the data from the 24 countries in the WHO Global
Survey on Maternal and Perinatal Health, and found it to be a better predictor of adverse
outcomes for neonates than non-customized standards (Mikolajczyk et al., 2011). This analysis
uses Mikolajczyk et al.’s formula adjusted to the mean and variance of birth weight within China
for births at 40weeks, which was also gathered from Mikolajczyk et al., 2011. We defined SGA
as birthweight below that predicted for the 10th perceintile for gestational week as predicted by
this formula, in accordance with the WHO’s standard definition of SGA (Lee et al., 2013).
Technical details of the operationalization of Mikolajczyk et al.’s formula for this study can be
found in Appendix 4.1.
Statistical Analysis
Before performing any hypothesis testing, relevant missingness in the dataset was address using
multiple imputation. By far the most common strategy to handle missing data in analysis is to
use “listwise deletion,” which means to drop any observation from the analysis that does not

103
have an observed value for every variable in the analysis. However listwise deletion, under very
weak assumptions, causes estimation errors of the same magnitude as the omitted variable bias
that including (incompletely) observed variables is meant to correct (King et al., 2001). It’s been
shown that a process called “multiple imputation” using expectation maximization is one that
will generally outperform listwise deletion or the other most common general techniques of
handling missing data (King et al., 2001). A full description of the technique and proof of its
superiority to other methods of dealing with missing data is beyond the scope of this paper.
However, it will likely interest readers to know that to create usable data for subsequent analysis,
multiple imputation must be performed simultaneously on at least every variable planned for
analysis, with the dependent outcome of interest being no exception. Multiple imputation was
performed in R using the Amelia package. This process created 16 imputed datasets that had
“complete” data on all variables of interest. The pre-imputation number of complete observations
(out of 1,952) of all variables and their range is reported in Appendix 4.2. All regression analyses
were run once on each of the 16 imputed datasets, and the results combined using Rubin’s
technique for combining quantities of interest (King et al., 2001).
Once newborns were categorized as SGA, logistic regressions were run using the 16 imputed
datasets to investigate whether high family support was associated with lowered odds of SGA.
This unadjusted regression was then supplemented with a logistic regression which accounted for
a wide array potentially confounding variables, all of which were collected in the baseline
survey, with the single exception of the variable ‘Ill,’ which was measured retrospectively at
follow-up. These variables fell into six categories, as follows:

104
General Demographic Information: These variables were age, education, husband’s education,
income, residency, and insurance coverage. Age and socioeconomic status have been found to be
predictors of general pregnancy health behavior by Lin et a., 2009, and age and education were
found to be a predictor of family support during pregnancy by Abdollahpour et al. 2015, though
age was not found to be predictive of social support by Harley and Eskenazi, 2006. Income has
been found to be a predictor of ANC uptake by Hohmann-Marriott, 2009 and better eating by
Fowles and Fowles 2008, as well as lower levels of social support by Harley and Eskenazi, 2006.
Medical insurance coverage was hypothesized to impact the number of ANC visits and care-
seeking during illness, and could potentially alter the overall need for family support. Residency
(Village, Township, County, City/Province) was postulated to potentially alter social norms
around both health
Pregnancy Medical History: These variables were previous live birth, previous miscarriage,
whether pregnancy was planned, and weight at start of pregnancy. Higher parity has been shown
to be a predictor of lower social support by Abdollahpour et al. 2015 and Harley and Eskenazi
2006, though differential behavioral effects of previous live births and previous miscarriages has
not, to our knowledge, been investigated. Fernández and Newby 2010 found that previous
pregnancies played a hugely important role in informing women’s behaviors during pregnancy.
A large body of evidence shows that unplanned / unwanted pregnancies are associated with both
lower levels of social support and worse pregnancy behaviors (Abdollahpour et al., 2015;
Fernández and Newby, 2010; Hohmann-Marriott, 2009; Martin et al., 2007; Onat and Aba,
2014). BMI has well studied associations with exercise and nutrition, though to our knowledge
has not been linked in the literature to levels of social support.

105
Household Substance Use: These baseline variables were whether the woman was a
current drinker at baseline and whether the husband was a current smoker, former
smoker, or non-smoker at baseline. Smoking and drinkingmore thanminor amounts of
alcoholduringpregnancyarewellknownriskfactorsforSGA(Patraetal.,2011;Vardavas
et al., 2010). Further, as discussed above, drinking and smoking can have complex
relationshipswithsocialsupport.Itwasunknownwhethertheywouldbeassociatedwith
family support in this population, or whether they would be markers for a propensity
towards worse health behaviors. Whether the woman was a smoker at baseline was
measuredbutnot includedinregressionsasacontrolbecause itwaspredictedtobetoo
highlycollinearwithwhethershesmokedduringpregnancy,whichwasafactorreserved
tobeusedinpotentialsubsequentmediationanalysis.
Self-Assessed Health: Two incorporated baseline variables were a five level self-assessment of
health ranging from very good to very poor, and self-assessed health compared to before
pregnancy, rated as “Better,” “The Same,” “Worse,” and “Don’t know”. From follow-up, a
woman was recorded as “Ill” if she reported one or more of the 12 symptoms queried by the
follow-up survey. Many studies have found that perceived health status is an important predictor
of health promoting lifestyles (Lin et al., 2009), and Tay et al. 2013 postulated that severely poor
health may elicit more social support. Poor health in the mother can also directly impact the
health of her unborn child.

106
Treatment group assignment within the Newborn Health Project: The four different treatment
groups received information and nudges on different health behaviors, and was potentially
expected to be associated with several behaviors as well as health outcomes. Treatment
assignment’s possible relation to social support was not known a priori.
Baseline measures of health psychology & perceptions: These nine variables, pulled from
health behavior literature, were: Health Attitudes, Health Expectations, Health Self-Efficacy,
Health Personal Pressure, Health Intentions, Health Plans, Perceived Health Social Norms,
Perceived Susceptibility to Poor Health, and Perceived Severity of Potential Poor Health. All
were measured by single question, 5-point Likert scales. It is beyond the scope of this paper to
provide a thorough review of relevant health behavior theory. However, the analysis did attempt
to account for the major constructs of the most widely cited theories of health behavior, namely
the Health Belief Model, Social Cognitive Theory, the Theory of Planned Behavior, The Theory
of Reasoned Action, and the Transtheoretical Model. For more in-depth discussion, see (de
Jersey, 2013; Lippke and Ziegelmann, 2008; Noar and Zimmerman, 2005).
If family support was found to be associated with SGA, a mediation analysis via health behavior
was also planned. Details of the mediation analysis plan are described in subsequent sections.
RESULTS
Descriptive statistics for all baseline characteristics of women in the dataset are reported in the
previous chapter of this thesis as Table 3.1 of that chapter. Tables 4.1A and 4.1B below display

107
the pre-imputation descriptive statistics for both the independent variable (Family Support), the
dependent variable (SGA), as well as the four pregnancy behavioral variables described in the
methods section as potential behavioral predictors of SGA. Note that though originally measured
in three categories, (A lot, Some, & None), family support has was dichotomized into High and
Low. This was because only approximately 1% of study participants responded “None,” so the
“None” category was merged with the “Some” category to create the “Low” category.
Respondents answering “A lot” were coded as “High” family support.
TABLE 4.1A: Selected Dichotomous Follow-Up Variables, Pre-Imputation
VARIABLE YES (%) NO (%) TOTAL N Family Support = High 1221 - 63.7% 695 - 36.3% 1916 SGA 220 - 11.4% 1710 - 88.6% 1930 Supplements Any a 1350 - 69.7% 588 - 30.3% 1938 Seeks Care (Given Symptoms) 166 - 36.0% 295 - 64.0% 461 Smoked While Pregnant 32 - 1.7% 1895 - 98.3% 1927 a: Self reports supplementing any of calcium, iron, or protein powder during pregnancy TABLE 4.1B: Exercise Frequency At Follow-Up, Pre-Imputation
Exercise Frequency N % Never 226 14.4 <1x / month 189 9.8 1-3x / month 277 14.4 1-4x / week 374 19.5 >=4x / week 804 41.9 TOTAL 1920 100 The other behavioral variable of interest, week of ANC initiation, was measured at baseline, as
presented in the last chapter. The average week of ANC initiation was 14.6, with a standard
deviation of 7.0 weeks.

108
Results for the unadjusted model of SGA on high family support and the model adjusted for the
full set of potentially confounding covariates are shown in Table 4.2 below. The full set of
exponentiated regression coefficients for the adjusted regression presented in Table 3.
TABLE 4.2: Adjusted and Unadjusted Odds Ratios of SGA with High Family Support Odds Ratio P-Value Unadjusted 0.726 (95% CI 0.544 - 0.969) 0.030 ** Adjusted 0.681 (95% CI 0.503 - 0.922) 0.013 ** * p < .10 ** p < .05 These results show that with or without adjustment for covariates, high family support is
associated reduced odds of SGA. The unadjusted association is an odds ratio (OR) of 0.726
(p=.030), and the adjusted estimate is even stronger, OR=0.681, (p=.013).
These findings raise the question of how family support and SGA might be related. A
“buffering” effect or “direct” effect through physiological response to support may be occurring,
or altered behavior may be mediating the connection, or both. A test of five possible behavioral
mediators of this connection is presented below.
According to Baron and Kenny 1986, four conditions must be met using three regressions to
establish mediation. First, the independent variable must affect the proposed mediator in the
expected direction in regression analysis. Second, the independent variable must be shown to
affect the dependent variable in the expected direction in regression analysis. Then, simultaneous
regression of the dependent variable both the independent variable and the proposed mediator
should show that third: the mediator affects the dependent variable in the expected direction
while controlling for the independent variable, and fourth: that the independent variable’s

109
measured effect on the dependent variable while controlling for the mediator is less than when
not controlling for the mediator in the second regression. Perfect mediation holds if the
independent variable has no measured effect when controlling for the proposed mediator (Baron
and Kenny, 1986).
The regression of SGA on family support laid out above is the one Baron and Kenny describe as
testing and confirming the “second” criterion; that the independent variable (family support) is
affecting the dependent one (odds of SGA). With this confirmed, mediation analysis can then be
completed in two steps. The first step is to include these behaviors in the multivariable
regression of SGA on Family support, and determine if their inclusion attenuates the measured
association between family support and SGA. Table 4.3 below shows the results of this test, and
presents the exponentiated coefficients of the full model with and without the five behaviors side
by side for comparison.
TABLE 4.3: Full Model Results of Logistic Regression of SGA on High Family Support Small for Gestational Age Small for Gestational Age No Behaviors With Behaviors Odds Lower Upper P Odds Lower Upper P
Ratio 95% CI
95% CI Value Ratio 95%
CI 95% CI Value
Family Support 0.681 0.503 0.922 0.013 ** 0.772 0.556 1.072 0.122 Illness 1.247 0.907 1.714 0.174 1.457 1.010 2.103 0.044 ** Sought Care 0.786 0.431 1.436 0.434 Pregnancy Smoking 0.870 0.280 2.701 0.810 Week of 1st ANC 1.001 0.979 1.023 0.956 Supplement Any 0.695 0.505 0.955 0.025 ** Moderate Exercise Freq. 0.875 0.787 0.972 0.013 ***

110
TABLE 4.3 (Continued) Care Seeking 1.015 0.678 1.517 0.944 1.021 0.681 1.530 0.920 Home Practice 0.919 0.608 1.389 0.687 0.920 0.607 1.394 0.694 All Texts 0.754 0.499 1.139 0.180 0.726 0.478 1.102 0.132 Attitude 0.925 0.779 1.098 0.373 Expectations 0.980 0.769 1.249 0.870 Attitude 0.925 0.779 1.098 0.373 0.923 0.774 1.100 0.370 Expectations 0.980 0.769 1.249 0.870 0.976 0.765 1.246 0.848 Self Efficacy 1.004 0.832 1.212 0.969 1.006 0.833 1.214 0.953 Personal Pressure 0.940 0.813 1.088 0.407 0.933 0.805 1.081 0.356 Intentions 0.885 0.738 1.061 0.188 0.884 0.735 1.063 0.189 Plans 1.133 0.951 1.349 0.162 1.126 0.944 1.342 0.186 Susceptible-Severity Category
2 0.518 0.284 0.945 0.032 ** 0.523 0.286 0.957 0.035 ** 3 0.784 0.414 1.483 0.454 0.812 0.427 1.543 0.524 4 0.493 0.268 0.906 0.023 ** 0.514 0.279 0.948 0.033 ** 5 0.751 0.437 1.289 0.299 0.765 0.442 1.322 0.337 6 0.906 0.403 2.034 0.811 0.900 0.399 2.031 0.799 7 1.434 0.827 2.484 0.199 1.483 0.853 2.580 0.163 8 1.063 0.443 2.554 0.891 1.103 0.456 2.665 0.828 9 1.144 0.724 1.807 0.565 1.184 0.746 1.881 0.473
Social Norm: % Women, none omitted Some 0.417 0.091 1.899 0.258 0.437 0.096 1.991 0.285 About Half 0.510 0.114 2.275 0.377 0.518 0.116 2.318 0.389 Most 0.561 0.135 2.333 0.427 0.555 0.133 2.319 0.420 Almost All 0.638 0.143 2.846 0.556 0.641 0.143 2.879 0.561 Don't know 0.664 0.157 2.805 0.577 0.655 0.154 2.786 0.566 Education: Jr. High - Omitted Sr. High 1.205 0.828 1.754 0.331 1.208 0.825 1.769 0.331 3 Yr. College 0.918 0.547 1.541 0.747 0.957 0.566 1.616 0.868 4 Yr. College + 1.226 0.549 2.740 0.619 1.292 0.574 2.908 0.536 Husband Education Sr. High 0.738 0.503 1.084 0.121 0.736 0.499 1.086 0.123 3 Yr. College 1.224 0.751 1.995 0.416 1.139 0.692 1.876 0.608 4 Yr. College + 0.516 0.227 1.172 0.114 0.490 0.214 1.121 0.091 *

111
TABLE 4.3 (Continued) Income <=22000 omitted > 22,000 RMB 1.078 0.662 1.755 0.763 1.084 0.668 1.761 0.744 > 40,001 RMB 1.196 0.700 2.043 0.512 1.166 0.678 2.005 0.579 > 65,001 RMB 1.286 0.762 2.170 0.346 1.288 0.762 2.176 0.345 Age (Centered) 0.990 0.943 1.040 0.695 0.994 0.946 1.045 0.817 Un-Planned Pregnancy 0.752 0.537 1.052 0.096 * 0.734 0.522 1.032 0.075 * Prev. Live Birth 0.841 0.556 1.272 0.412 0.825 0.543 1.253 0.367 Past Miscarriage 0.659 0.474 0.917 0.013 ** 0.631 0.452 0.880 0.007 *** Weight (Centered) 0.985 0.976 0.994 0.002 *** 0.984 0.975 0.994 0.001 *** Province / City 1.188 0.470 3.003 0.716 1.230 0.481 3.146 0.665 County 0.783 0.436 1.405 0.412 0.760 0.422 1.367 0.360 Township 0.967 0.652 1.434 0.868 0.999 0.672 1.486 0.997 Insurance -NCRMS omitted Urban Worker 0.966 0.402 2.325 0.939 0.921 0.378 2.247 0.857 Other 1.366 0.813 2.296 0.239 1.371 0.815 2.308 0.234 None 0.875 0.277 2.761 0.820 0.886 0.281 2.794 0.836 No Answer 0.666 0.281 1.580 0.357 0.686 0.287 1.637 0.396 Health before Preg.: Very good Omitted Good 1.189 0.660 2.140 0.565 1.171 0.648 2.114 0.601 Fair 1.250 0.682 2.291 0.471 1.249 0.677 2.303 0.476 Poor 1.433 0.441 4.655 0.549 1.503 0.458 4.929 0.502 Health Better 0.876 0.405 1.899 0.738 0.855 0.394 1.857 0.692 Health Worse 0.775 0.513 1.171 0.227 0.737 0.485 1.120 0.153 Health Not Sure 1.173 0.742 1.855 0.495 1.218 0.767 1.935 0.404 Drinker (Baseline) 1.420 0.517 3.902 0.496 1.427 0.519 3.918 0.491 Husband Never Smoke 0.921 0.666 1.274 0.621 0.912 0.658 1.265 0.582 Husband Former Smoke 0.684 0.345 1.355 0.276 0.674 0.337 1.348 0.265 Constant 0.926 0.135 6.348 0.938 1.940 0.249 15.112 0.527
* p < .10 ** p < .05 *** p < .01

112
The results of this regression show that when included in multivariable regression, two of the
five proposed health behaviors (namely, supplementing nutrients and moderate exercise) are
significantly associated with SGA in their expected direction. Seeking care during illness, which
would be expected to have a protective effect, is measured to be associated with reduced odds of
SGA, but this association is not significant. Interestingly, smoking during pregnancy shows no
deleterious association with SGA, and is even measured as slightly protective. This result is
likely to do with an extremely small number of women reporting smoking during pregnancy in
our sample. Only 32 women (1.7%) were self reported smokers; but the adjusted model has well
over 32 continuous or categorical indicator regressors, and as such is unlikely to be estimating
the effect of smoking with adequate statistical power. Finally, timing of ANC initiation was
found to have no relation to SGA in this population.
It should be noted that simultaneously testing the association of 5 behaviors with SGA warrants a
correction for testing multiple hypotheses. Using a Holm-Bonferroni correction for 5 tests and a
one tailed test for the literature indicated benefits of supplemental nutrition and moderate
exercise on SGA, the most significant should have p<=2*.05/5; i.e., .02, and conditional on
meeting this standard, the second most significant should have p<=2*.05/4 =.025. These criteria
are met, and therefore these associations remain significant after adjusting for multiple
hypothesis testing.
These results indicate two tested behaviors meet Baron and Kenny’s third mediation criterion:
that the mediator affects the dependent variable in the expected direction while controlling for
the independent variable. Moreover, these regression results also meet the fourth criterion, that

113
the independent variable’s measured effect on the dependent variable while controlling for the
mediator is less than when not controlling for the mediator. Without controlling for behaviors,
high family support is associated with an odds ratio of 0.681, (p=.013). Controlling for behaviors
attenuates this odds ratio to 0.772, and the p-value changes to a non-significant 0.122.
This set of findings prompts the final test of mediation, regressing the two behaviors
significantly predictive of SGA on family support. Having failed to meet Baron and Kenny’s
third criterion for mediation, we exclude the other three behaviors as possible mediators, and it is
not necessary to perform further mediation analysis on them.
Table 4.2 shows the unadjusted odds ratios for each health behavior comparing women with a
high self-reported level of family support compared to the odds for women with low levels of
family support. These odds ratios are the exponentiated coefficients of logistic regression of each
behavior on high family support. The exception is the odds ratio from the Moderate Exercise
Frequency regression, which is the exponentiated coefficient from ordered logistic regression.
Unadjusted results are presented in Table 4.4 below, and the fully adjusted regressions are
presented in Table 4.5.
TABLE 4.4: Unadjusted Logistic Regressions: Prenatal Behaviors On High Family Support BEHAVIOR ODDS RATIO P-VALUE Supplements Any a 1.451 (95% CI 1.188 - 1.771) 0.0003 *** Moderate Exercise Frequency b 3.689 (95% CI 3.097 – 4.394) <0.0001 *** a: Self reports supplementing any of calcium, iron, or protein powder during pregnancy b: 5 category ordered logit

114
TABLE 4.5: Adjusted Logistic Regressions: Prenatal Behaviors On High Family Support Any Supplements Moderate Exercise Frequency Odds P Lower Upper Odds P Low Upper
Ratio Value 95% CI
95% CI Ratio Value 95%
CI 95% CI
Family Support 1.415 0.001 1.147 1.746 *** 3.825 0.000 3.194 4.581 *** Any Illness 2.256 0.000 1.765 2.883 *** 0.915 0.340 0.762 1.098 Care Seeking Group 0.913 0.539 0.683 1.221 0.906 0.420 0.712 1.152 GHPP Group 0.890 0.439 0.663 1.195 0.972 0.822 0.762 1.241 All Texts Group 0.974 0.856 0.732 1.295 0.807 0.071 0.639 1.018 * Baseline Health: Attitude 1.054 0.425 0.926 1.199 0.950 0.336 0.857 1.054 Expectations 1.012 0.896 0.848 1.207 0.970 0.665 0.843 1.115 Self Efficacy 1.088 0.185 0.961 1.232 1.016 0.756 0.921 1.120 Personal Pressure 0.975 0.634 0.878 1.082 0.990 0.816 0.910 1.077 Intentions 0.953 0.453 0.840 1.081 1.062 0.265 0.955 1.181 Plans 0.927 0.214 0.823 1.045 0.954 0.357 0.863 1.055 Susceptible-Severity Category
2 1.060 0.763 0.726 1.547 0.885 0.424 0.657 1.194 3 0.931 0.763 0.585 1.482 1.066 0.743 0.729 1.557 4 1.094 0.646 0.746 1.603 1.141 0.406 0.836 1.557 5 0.814 0.275 0.562 1.178 1.111 0.514 0.809 1.526 6 0.969 0.912 0.550 1.705 0.713 0.153 0.448 1.134
7 0.791 0.289 0.514 1.219 1.178 0.369 0.824 1.682 8 1.476 0.276 0.732 2.974 1.020 0.944 0.596 1.746 9 0.978 0.898 0.695 1.377 1.073 0.625 0.809 1.424
Social Norm: % Women, none omitted Some 1.066 0.916 0.329 3.456 1.216 0.690 0.465 3.182 About Half 1.132 0.840 0.342 3.746 1.042 0.932 0.404 2.690 Most 0.933 0.905 0.299 2.911 0.935 0.887 0.370 2.364 Almost All 1.011 0.985 0.310 3.297 1.081 0.877 0.404 2.892 Don't know 0.880 0.828 0.278 2.787 1.056 0.908 0.417 2.676 Education: Jr. High - Omitted Sr. High 1.238 0.108 0.954 1.606 0.877 0.240 0.705 1.092 3 Yr. College 1.649 0.007 1.146 2.372 *** 0.934 0.646 0.697 1.252 4 Yr. College + 1.298 0.390 0.716 2.356 1.079 0.753 0.672 1.732

115
TABLE 4.5 (Continued) Husband Education
Sr. High 0.853 0.230 0.658 1.106 1.171 0.154 0.942 1.455 3 Yr. College 0.861 0.418 0.599 1.237 0.984 0.915 0.733 1.321 4 Yr. College + 1.365 0.286 0.771 2.417 0.764 0.206 0.504 1.159 Income <=22000 omitted > 22,001 RMB 1.236 0.249 0.862 1.773 0.973 0.838 0.751 1.262 > 40,001 RMB 1.403 0.048 1.002 1.964 0.975 0.882 0.699 1.360 > 65,001 RMB 1.497 0.035 1.029 2.177 ** 0.856 0.336 0.624 1.174 Age (Centered) 0.996 0.811 0.964 1.029 1.010 0.485 0.982 1.038 Un-Planned Pregnancy 0.907 0.416 0.717 1.147 1.077 0.440 0.891 1.303 Prev. Live Birth 0.888 0.404 0.672 1.174 1.137 0.290 0.897 1.441 Past Miscarriage 1.094 0.428 0.875 1.368 0.858 0.098 0.715 1.029 * Weight (Centered) 0.992 0.014 0.986 0.998 ** 1.001 0.618 0.996 1.007 Province / City 1.495 0.304 0.694 3.217 1.144 0.632 0.660 1.983 County 1.104 0.616 0.750 1.624 0.805 0.157 0.596 1.087 Township 1.456 0.010 1.095 1.935 1.147 0.246 0.910 1.445 Insurance -NCMS omitted Urban Worker 0.564 0.071 0.303 1.051 * 1.035 0.894 0.622 1.723 Urban Resident 1.038 0.857 0.690 1.562 1.049 0.773 0.759 1.448 Other 0.844 0.634 0.419 1.698 1.020 0.948 0.570 1.824 None 1.013 0.961 0.604 1.698 0.798 0.276 0.532 1.197
Health before Preg.: Very good Omitted Good 0.828 0.357 0.553 1.238 0.969 0.8474 0.705 1.332 Fair 0.825 0.359 0.548 1.244 0.921 0.629 0.660 1.286 Poor 0.691 0.363 0.311 1.534 1.072 0.842 0.540 2.127 Health Better 0.958 0.871 0.573 1.601 0.808 0.302 0.539 1.211
Health Worse 0.881 0.373 0.666 1.165 0.871 0.236 0.693 1.095 Health Not Sure 1.185 0.350 0.830 1.690 0.970 0.830 0.738 1.277 Drinker (Baseline) 0.777 0.520 0.361 1.673 1.267 0.495 0.643 2.495 Husband Never Smoke 0.998 0.984 0.797 1.248 0.100 0.996 0.829 1.206

116
TABLE 4.5 (Continued) Husband Former Smoke 0.974 0.906 0.623 1.522 1.064 0.742 0.734 1.543 Constant 1.463 0.626 0.316 6.766 Cut 1 0.230 0.016 0.069 0.764 Cut 2 0.467 0.213 0.141 1.546 Cut 3 1.003 0.996 0.303 3.317 Cut 4 2.441 0.144 0.737 8.081
a: Self reports supplementing any of calcium, iron, or protein powder during pregnancy b: 5 category ordered logit Tables 4.4 and 4.5 show that a high level of family support has a strong, positive association with
both nutrition supplementation and moderate exercise frequency. These results are not only
highly statistically significant, but the measured odds ratios are quite large. These findings
indicate that Baron and Kenny’s 1st criterion for mediation is met; the independent variable (high
family support) is associated with the behavioral mediators in the expected direction; namely that
of better nutrition and more exercise.
DISCUSSION
In total, 220 (11.4%) of newborns in our sample fit this criterion for SGA, whereas 1,710
(88.6%) did not. This is near to, but slightly higher than, the 10% that would be expected for
China as a whole under the formula created by Mikolajczyk et al. which was used in this study to
generate our reference standared for China’s national weight for age distribution. The definition
of SGA is meant to encompass the lowest decile of weight for gestational age, and it may be that
newborn weight in Xi’an is slightly lower than China’s national average and variance that was
imput into Mikolajczyk et al.’s formula would predict. High family support was found to be
associated with significantly reduced odds of SGA, OR=0.681, (p=.013). Given that 63.7% of

117
respondents experience high levels of support, assuming this odds ratio of 0.681 is causal would
imply that family support experienced by the sample respondents is responsible for a decline in
SGA of 2.5 percentage points, from an expected 13.9% in the absence of high family support for
any respondent. However, as this analysis is observational, and family support was not
experimentally randomized, we cannot infer with confidence whether this association is in fact
causal.
The regression analyses presented above show that the hypothesized behavioral pathway
between family support and lowered odds of SGA meets the four conditions for establishing
mediation. Specifically, it shows that the measured association between family support and
reduced odds of SGA seems at least partially mediated by family support’s association with
increased nutrition and increased moderate exercise frequency during pregnancy. This lends
support to the school of thought which models the effect of social support on health as being
mediated by changes in health behavior. However, the measured association of high family
support with SGA does not go to zero, implying that nutritional supplementation and exercise
frequency alone may not perfectly mediate the association. The remaining association may be
mediated by other behaviors not considered or by a “buffering” or “direct” effect of social
support on SGA, or a combination of these possibilities. As the remaining association is no
longer statistically significant, we also cannot rule out that there is no association left to mediate
and that the remaining measured association is due to stochastic error. Whatever the full
pathway, higher levels of family support are associated with reduced odds of being born small
for gestational age in our study population.

118
Taken together, the results of this paper suggest that family support may be an overall benefit to
the health behaviors of pregnant women in the context of Xi’an China, and benefit the health of
their children as measured by the odds of being born small for gestational age. However, causal
inference is precluded by the observational nature of the study. Nonetheless, the association is
sufficiently promising to warrant further study in experimental settings. It may be that
interventions aimed at altering pregnancy related behaviors in China could benefit from
including an attempt to muster the support of the pregnant women’s family and experimental
research should determine if this is the case. As mentioned earlier in this paper, there has been
disconnect thus far between the very promising observational findings regarding social support
and health outcomes and the disappointing results of intervention trials attempting to promote
better health outcomes by attempting to promote social support. Some evidence suggests that
such interventions do better when targeting women based on low existing social support than
when targeting based on other criteria, such as medical risk factors for low birth weight (Orr,
2004). Numerous authors on the subject have called for strategies to better involve partners and
families in antenatal care and pregnancy behaviors (Aaronson, 1989; Abdollahpour et al., 2015;
Aguiar and Jennings, 2015; Hohmann-Marriott, 2009; Orr, 2004). How to do so efficiently and
effectively is not currently clear, though targeting women with low social support seems to be a
good start. Creative and rigorously evaluated intervention studies on leveraging family support
might be of great benefit if consistently successful strategies are uncovered and a causal
association between family support and newborn health exists.
119
STRENGTHS & LIMITATIONS
This is the first paper of its kind to investigate the association of familial support, pregnancy
health behaviors, and SGA in China. The measured associations with health behaviors and the
health outcome of SGA are large enough to be clinically significant, and they are robust to the
inclusion of a wide array of control variables. Further, the statistical significance of the
associations nutrition supplementation and more moderate exercise with family support as well
as with reduced odds of SGA are strong enough to easily remain statistically significant even
with a Holm-Bonferroni correction for testing the potential mediation of five behaviors.
However, our inference is limited by the observational nature of the study. Because family
support levels were not exogenously influenced, we cannot say with any confidence that family
support causes either different health behaviors or reduced rates of SGA births, though our data
is consistent with this possibility. Despite the array of control variables included in the adjusted
regressions, there may be omitted ones not measured that are inducing the association. We are
also equally unable to rule out reverse causation; the possibility that better health behaviors
during pregnancy are rewarded by or otherwise inspire increased levels of family support. It may
also be the case that mothers with better birth outcomes look back more fondly on their
pregnancy and more willingly categorize their families as highly supportive in the past months.
A related limiting factor is that we only have a self-reported measure of familial support. Of
itself this is no failing and is actually in line with the most literature on social support; perceived
social support is more commonly investigated than received social support (Gallant, 2003;
Nurullah, 2012). However, inclusion of an objective measure of received social support would

120
allow a complementary investigation with potentially confirmatory or distinct results. Similarly,
“family” is subjectively defined by each respondent and treated as a single unit; this study sheds
no specific light on which family members (for example, spouses or mothers-in-law) are most
influential, or whether this varies across families.
Similarly, all behavioral measures are self-reported rather than objectively measured. Self-
reported behavioral measures can be subject to social acceptability bias when respondents want
to give the “right” answer to surveyors. Rates of “good” behavior are likely to be overestimated
in our study. This bias does not particularly harm the inferences made above if the propensity to
exaggerate “good” behaviors is distributed equally between women with both high and low
levels of family support. However, if there is a connection wherein women with high levels of
family support feel more inclined to give investigator pleasing responses, or wherein women
who exaggerated their “right” answers were also more inclined to exaggerate their level of
perceived family support, the estimated associations above will be upwardly biased and
overstated. However, the fact that the one objectively measured behavior, the number of ANC
checkups attended, has an association with family support of similar magnitude and significance
as the other behaviors suggests that this potential bias is not a decisive issue.
CONCLUSIONS
A high level of family support is associated with reduced odds of being born small for
gestational age in our study population from Xi’an, china. Evidence suggests that this protective
association seems partially, though not fully, mediated through improved nutrient intake and

121
improved moderate exercise frequency that are also associated with a high level of family
support during pregnancy. These findings suggest that research is warranted on how maternal
health professionals can effectively and efficiently induce supportive familial involvement in
pregnancies where women feel a lack of social support.
BIBLIOGRAPHY Aaronson, L.S., 1989. Perceived and received support: effects on health behavior during
pregnancy. Nurs. Res. 38, 4–9. Abdollahpour, S., Ramezani, S., Khosravi, A., 2015. Perceived Social Support among Family in
Pregnant Women. Int. J. Pediatr. 3, 879–888. Aguiar, C., Jennings, L., 2015. Impact of Male Partner Antenatal Accompaniment on Perinatal
Health Outcomes in Developing Countries: A Systematic Literature Review. Matern. Child Health J. 19, 2012–2019. doi:10.1007/s10995-015-1713-2
Allendorf, K., 2010. The Quality of Family Relationships and Use of Maternal Health-care Services in India. Stud. Fam. Plann. 41, 263–276.
Allgöwer, A., Wardle, J., Steptoe, A., 2001. Depressive symptoms, social support, and personal health behaviors in young men and women. Health Psychol. 20, 223.
Baron, R.M., Kenny, D.A., 1986. The moderator–mediator variable distinction in social psychological research: Conceptual, strategic, and statistical considerations. J. Pers. Soc. Psychol. 51, 1173.
Beattie, M.C., 2001. Meta-Analysis of social relationships and posttreatment drinking outcomes: comparison of relationship structure, function and quality. J. Stud. Alcohol 62, 518–527.
Cannella, B.L., 2006. Mediators of the relationship between social support and positive health practices in pregnant women. Nurs. Res. 55, 437–445.
Carron, A.V., Hausenblas, H.A., Mack, D.E., 2010. Social Influence and Exercise: A Meta-Analysis. JSEP 18.
Chen, C.-M., Kuo, S.-F., Chou, Y.-H., Chen, H.-C., 2007. Postpartum Taiwanese women: their postpartum depression, social support and health-promoting lifestyle profiles. J. Clin. Nurs. 16, 1550–1560.
CHEN, X.-K., Wen, S.W., Yang, Q., Walker, M.C., 2007. Adequacy of prenatal care and neonatal mortality in infants born to mothers with and without antenatal high-risk conditions. Aust. N. Z. J. Obstet. Gynaecol. 47, 122–127.
de Jersey, S.J., 2013. Are we missing opportunities? Understanding health behaviours associated with overweight in pregnancy.
DiMatteo, M.R., 2004. Social support and patient adherence to medical treatment: a meta-analysis. Health Psychol. 23, 207.
Dunkel Schetter, C., 2011. Psychological science on pregnancy: stress processes, biopsychosocial models, and emerging research issues. Annu. Rev. Psychol. 62, 531–558.

122
Feldman, P.J., Dunkel-Schetter, C., Sandman, C.A., Wadhwa, P.D., 2000. Maternal social support predicts birth weight and fetal growth in human pregnancy. Psychosom. Med. 62, 715–725.
Fernández, L.E., Newby, A., 2010. Family Support and Pregnancy Behavior among Women in Two Border Mexican Cities. Front. Norte 22, 7–34.
Fowles, E.R., Fowles, S.L., 2008. Healthy eating during pregnancy: determinants and supportive strategies. J. Community Health Nurs. 25, 138–152.
Gallant, M.P., 2003. The influence of social support on chronic illness self-management: a review and directions for research. Health Educ. Behav. 30, 170–195.
Harley, K., Eskenazi, B., 2006. Time in the United States, social support and health behaviors during pregnancy among women of Mexican descent. Soc. Sci. Med. 62, 3048–3061.
Hohmann-Marriott, B., 2009. The couple context of pregnancy and its effects on prenatal care and birth outcomes. Matern. Child Health J. 13, 745–754.
Hopkins, S.A., Cutfield, W.S., 2011. Exercise in pregnancy: weighing up the long-term impact on the next generation. Exerc. Sport Sci. Rev. 39, 120–127.
Hu, H.H., Li, G., Arao, T., 2015. The association of family social support, depression, anxiety and self-efficacy with specific hypertension self-care behaviours in Chinese local community. J. Hum. Hypertens. 29, 198–203.
Katz, J., Lee, A.C., Kozuki, N., Lawn, J.E., Cousens, S., Blencowe, H., Ezzati, M., Bhutta, Z.A., Marchant, T., Willey, B.A., others, 2013. Mortality risk in preterm and small-for-gestational-age infants in low-income and middle-income countries: a pooled country analysis. The Lancet 382, 417–425.
Kimbro, R.T., 2008. Together forever? Romantic relationship characteristics and prenatal health behaviors. J. Marriage Fam. 70, 745–757.
King, G., Honaker, J., Joseph, A., Scheve, K., 2001. Analyzing incomplete political science data: An alternative algorithm for multiple imputation, in: American Political Science Association. Cambridge Univ Press, pp. 49–69.
Kratz, L.M., Wong, Y.J., Vaughan, E.L., 2013. Health behaviors among pregnant women: The influence of social support. Soc. Support Theory Role Gend. Cult. Health 109–122.
Leal, M. do C., Pereira, A.P.E., Lamarca, G. de A., Vettore, M.V., 2011. The relationship between social capital, social support and the adequate use of prenatal care. Cad. Saúde Pública 27, s237–s253.
Lee, A.C., Katz, J., Blencowe, H., Cousens, S., Kozuki, N., Vogel, J.P., Adair, L., Baqui, A.H., Bhutta, Z.A., Caulfield, L.E., others, 2013. National and regional estimates of term and preterm babies born small for gestational age in 138 low-income and middle-income countries in 2010. Lancet Glob. Health 1, e26–e36.
Lin, Y.-H., Tsai, E.-M., Chan, T.-F., Chou, F.-H., Lin, Y.-L., 2009. Health promoting lifestyles and related factors in pregnant women. Chang Gung Med J 32, 650–61.
Lippke, S., Ziegelmann, J.P., 2008. Theory-Based Health Behavior Change: Developing, Testing, and Applying Theories for Evidence-Based Interventions. Appl. Psychol. Int. Rev. 57, 698–716.
Martin, L.T., McNamara, M.J., Milot, A.S., Halle, T., Hair, E.C., 2007. The effects of father involvement during pregnancy on receipt of prenatal care and maternal smoking. Matern. Child Health J. 11, 595–602.

123
Mikolajczyk, R.T., Zhang, J., Betran, A.P., Souza, J.P., Mori, R., Gülmezoglu, A.M., Merialdi, M., 2011. A global reference for fetal-weight and birthweight percentiles. The Lancet 377, 1855–1861.
Mullany, B.C., Becker, S., Hindin, M.J., 2007. The impact of including husbands in antenatal health education services on maternal health practices in urban Nepal: results from a randomized controlled trial. Health Educ. Res. 22, 166–176.
Nash, D.M., Gilliland, J.A., Evers, S.E., Wilk, P., Campbell, M.K., 2013. Determinants of Diet Quality in Pregnancy: Sociodemographic, Pregnancy-specific, and Food Environment Influences. J. Nutr. Educ. Behav. 45, 627–634. doi:10.1016/j.jneb.2013.04.268
National Bureau of Statistics of China, 2016. China’s Economy Realized a Moderate but Stable and Sound Growth in 2015 [WWW Document]. URL http://www.stats.gov.cn/english/PressRelease/201601/t20160119_1306072.html (accessed 3.7.16).
Noar, S.M., Zimmerman, R.S., 2005. Health Behavior Theory and cumulative knowledge regarding health behaviors: are we moving in the right direction? Health Educ. Res. 20, 275–290.
Nurullah, A.S., 2012. Received and provided social support: A review of current evidence and future directions. Am. J. Health Stud. 27, 173–188.
Onat, G., Aba, Y.A., 2014. Health-promoting lifestyles and related factors among pregnant women. Turk. J. Public Health 12, 69.
Orr, S.T., 2004. Social support and pregnancy outcome: a review of the literature. Clin. Obstet. Gynecol. 47, 842–855.
Park, C.L., Gaffey, A.E., 2007. Relationships between psychosocial factors and health behavior change in cancer survivors: an integrative review. Ann. Behav. Med. 34, 115–134.
Patra, J., Bakker, R., Irving, H., Jaddoe, V.W., Malini, S., Rehm, J., 2011. Dose–response relationship between alcohol consumption before and during pregnancy and the risks of low birthweight, preterm birth and small for gestational age (SGA)—a systematic review and meta-analyses. BJOG Int. J. Obstet. Gynaecol. 118, 1411–1421.
Rosland, A.-M., Piette, J.D., 2010. Emerging models for mobilizing family support for chronic disease management: a structured review. Chronic Illn. 6, 7–21.
Shor, E., Roelfs, D.J., Yogev, T., 2013. The strength of family ties: A meta-analysis and meta-regression of self-reported social support and mortality. Soc. Netw. 35, 626–638.
Siebel, A.L., Carey, A.L., Kingwell, B.A., 2012. Can exercise training rescue the adverse cardiometabolic effects of low birth weight and prematurity? Clin. Exp. Pharmacol. Physiol. 39, 944–957.
Stephens, C.J., 1985. Perception of pregnancy and social support as predictors of alcohol consumption during pregnancy. Alcohol. Clin. Exp. Res. 9, 344–348.
Taylor, S.E., Welch, W.T., Kim, H.S., Sherman, D.K., 2007. Cultural differences in the impact of social support on psychological and biological stress responses. Psychol. Sci. 18, 831–837.
Tay, L., Tan, K., Diener, E., Gonzalez, E., 2013. Social relations, health behaviors, and health outcomes: A survey and synthesis. Appl. Psychol. Health Well-Being 5, 28–78.
VanderWeele, T.J., Lantos, J.D., Siddique, J., Lauderdale, D.S., 2009. A comparison of four prenatal care indices in birth outcome models: comparable results for predicting small-for-gestational-age outcome but different results for preterm birth or infant mortality. J. Clin. Epidemiol. 62, 438–445.

124
Vardavas, C.I., Chatzi, L., Patelarou, E., Plana, E., Sarri, K., Kafatos, A., Koutis, A.D., Kogevinas, M., 2010. Smoking and smoking cessation during early pregnancy and its effect on adverse pregnancy outcomes and fetal growth. Eur. J. Pediatr. 169, 741–748.
Wiebe, H.W., Boulé, N.G., Chari, R., Davenport, M.H., 2015. The effect of supervised prenatal exercise on fetal growth: a meta-analysis. Obstet. Gynecol. 125, 1185–1194.
Yargawa, J., Leonardi-Bee, J., 2015. Male involvement and maternal health outcomes: Systematic review and meta-analysis. J. Epidemiol. Community Health 69, 604–612.

125
APPENDIX 4.1: Formulation and Implementation of Mikolajczyk et al.’s SGA Cutoff
To create a globally adaptable reference population, Mikolajcyzk et al. begin with Hadlock et
al.’s (1991) formula, where GA is gestational age in exact weeks:
Eq. 1) Fetal weight (g) = exp(0.578 + 0.332xGA – 0.00354xGA2)
Note that if measured in full week increments rather than exact weeks, as in our study, 0.5 should
be added to birth week. As discussed in Mikolajczyk et al.’s sudy, this original reference was
based on 392 pregnant women within the USA, and it was noted by Hadlock and colleagues that
variation in fetal weight given gestational week was a constant fraction of the mean. This
prompted Gardosi et al. (1995) to expand the Hadlock formula by creating an individualized
reference by adjusting for ethnic group and other maternal demographics, with fixed means and
standard deviations based on these adjustments.
Mikolajcyzk et al. expand Gardosi et al.’s framework by assuming that the mean birth weight at
40 weeks could vary by country, and that percentiles of birth weights by gestational age could be
extrapolated from means and standard deviations of birth weights by assuming a normal
distribution. In their equation, mean birth weight at 40 weeks for the country is divided by the
constant of 3705g, the mean birth weight at 40.5 weeks in Hadlock’s equation. This ratio was
assumed constant across gestational week, and was used as a constant multiplier for on
Hadlock’s formula for mean gestational weight estimates. In Mikolajcyzk et al.’s study, China
had a mean birth weight of 3410g. Thus, Mikolajcyzk et al.’s formula applied to China becomes

126
Eq. 2) Expected Mean Fetal Weight (g) = (3410/3705) x exp(0.578 + 0.332xGA – 0.00354xGA2)
As in Hadlock’s et al.’s findings, standard deviations in birth weight were assumed to be a
constant portion of mean birth weight. This proportion is found by dividing the measured mean
and measured standard deviation of birth weight at 40 weeks within a population. In China,
Mikolajcyzk et al. found the standard deviation to be 411g. Thus at any gestational age in China,
the standard deviation (SD) of birth weight is expected to be:
Eq. 3) SD = (411/3410) x Expected Mean Fetal Weight
Small for gestational age (SGA) is defined to be falling in the bottom 10 percent of birth weights
for birth at that gestational week. Assuming a normal distribution of fetal weight at a given
gestational age, the fetal weight of the 10th percentile is equal to the mean weight minus
1.281551 standard deviations in weight. Operationalized for our study, this defines an SGA
cutoff of:
Eq. 4) Birth Weight < (1 – 1.281551x(411/3410)) x (3410/3705) x exp(0.578 + 0.332xGA –
0.00354xGA2)
Where GA denotes recorded birth week plus 0.5.

127
APPENDIX 4.2 : Range and N of All Regression Variables Variable Possible Responses or Range N Age 18-45 yrs 1,951 Height 140-198 cm 1,946 Weight right before pregnancy 77 - 174 lbs 1,927
Residency Province/City, County, Township, Village 1,902
Occupation
Farmer, Private Business Owner, Government Worker, Migrant Worker, Local Worker, Home-Maker, Other 1,889
Education
Jr. High or less, Sr. High / technical school, 3 Yr. College, 4yr college or more 1,922
Own Phone Self, Family, Others 1,917
Husband Education
Jr. High or less, Sr. High / technical school, 3 Yr. College, 4yr college or more 1,923
Insurance NCMS, Urban Worker, Government Worker, Other, None 1,807
Married Married, Not (Single / Divorced / Widowed) 1,923
Household Members 1-9 people 1,920 Family Income 1,000 - 1,000,000 1,017 Pregnancy # 1, 2, 3+ 1,933 PreviousLive Births 0, 1, 2+ 1,886 Previous Miscarriages 0, 1, 2+ 1,887 Health Condition Before Pregnancy Very Good, Good, Fair, Poor, Very Poor 1,874 Health Compared to Before Better, The Same, Worse, Don't Know 1,857 Smoker Yes, No 1,893 Husband Smoke Yes, No, Former 1,897 Drinker Yes, No 1,890 Husband Drink Yes, No, Former 1,886 Exerciser Yes, No, Former 1,883 Husband Exercise Yes, No, Former 1,869 Pregnancy Week 1 - 42 1,816 Pregnancy Planned Yes, No 1,861 Singleton Yes, No, Don't Know 1,837 Health Attitudes 1,870 Health Expectations Likert Scale: 1-5 1,779 Health Self-Efficacy Likert Scale: 1-5 1,754 Health Personal Norms Likert Scale: 1-5 1,813 Health Intentions Likert Scale: 1-5 1,813 Health Plans Likert Scale: 1-5 1,922 Health Susceptibility Likert Scale: 1-5, Don't Know 1,884 Health Severity Likert Scale: 1-5, Don't Know 1,818 Health Social Norms Likert Scale: 1-5 1,521

128
APPENDIX 4.2 (Continued) Family Gender Preference Boy, Girl, No Preference 1,880 Mother Gender Preference Boy, Girl, No Preference 1,875
Delivery Preference Vaginal, Caesarean Section, No Preference 1,924
Family Support High, Low 1,898 Birth Weight of Newborn 1.6 - 10.0 lbs 1,948 Gestational Age at Delivery 28 - 43 weeks 1,932 Delivery Mode Vaginal, Caesarean 1,936 Smoking during Pregnancy Yes, No 1,927 Ill Yes, No 1,906 Sought Care Yes, No 1,802
Moderate Exercise Frequency Never”, “<1x/m”, “1-3x/m”, “1-4x/wk”, and “>=4x/wk" 1,920
Supplemented Calcium Yes, No 1,941 Supplemented Iron Yes, No 1,936 Supplemented Protein Powder Yes, No 1,923 Supplemented Folic Acid Yes, No 1,943