The Factors Influencing Online Shopping Behaviors The Case ...
123
The Factors Influencing Online Shopping Behaviors: The Case Study of HUAWEI Mobile Product Mr. ZHONG JIACHENG A THESIS SUBMITTED IN PARTIAL FULFILLMENT OF THE REQUIREMENTS FOR THE MASTER’S DEGREEOF FACULTY OF/ INTERNATIONAL COLLAGE // RAJAMANGALA UNIVERSITY OF TECHNOLOGY KRUNGTHEP ACADEMIC YEAR/2020 COPYRIGHT OF RAJAMANGALA UNIVERSITY OF TECHNOLOGY KRUNGTHEP
Transcript of The Factors Influencing Online Shopping Behaviors The Case ...

The Factors Influencing Online Shopping
Behaviors:
The Case Study of HUAWEI Mobile Product
Mr. ZHONG JIACHENG
A THESIS SUBMITTED IN PARTIAL FULFILLMENT
OF THE REQUIREMENTS FOR THE MASTER’S DEGREEOF FACULTY OF/ INTERNATIONAL COLLAGE
// RAJAMANGALA UNIVERSITY OF TECHNOLOGY KRUNGTHEP
ACADEMIC YEAR/2020
COPYRIGHT OF RAJAMANGALA UNIVERSITY OF TECHNOLOGY KRUNGTHEP


Thesis
The Factors Influencing Online Shopping Behaviors:The Case Study of HUAWEI Mobile Product
Author Mr. ZHONG JIACHENG Major MBA Advisor Dr. Hening Widi Oetomo Co-Advisor Dr. Saifon Chairungruang Academic Year 2020
Abstract
In today's society, online shopping has become a way of life, and more and more people are involved in online shopping. Therefore, it is very necessary to study online shopping consumer behavior. By taking HUAWEI mobile phone as an example, this study analyzes several factors that affect consumers' shopping intention/shopping behavior. In this study, marketing mix (7ps) lifestyle and Personal Computer Technology are the focus of analysis. Research data were collected by questionnaire survey from groups who had purchased HUAWEI mobile phones online. Multiple methods were used in this study (T-test, One Way ANOVA, Correlation analysis and Regression analysis).Finally, it comes to the conclusion that: among online shopping and marketing mix 7ps factors, product factors and price factors most directly affect shopping online consumption intention and men are more willing to buy HUAWEI mobile phones online. Through a series of studies in this paper, we can have an impact on the online sales strategies of HUAWEI and other e-commerce companies. Through research, provide some Suggestions to HUAWEI based on the results, improve the online sales of products
Keywords Online shopping //HUAWEI Mobile//Consumer behavior//Marketing Mix 7Ps

1
Acknowledgement
I will use this opportunity to express my gratitude to everyone who greatly
supported me throughout the course of this MBA project, especially my academic advisor
is Dr. Hening Widi Oetomo, Co- Advisor is Dr. Saifon Chairungruang and Our Dean:
Dr.Prattana Srisuk and the other professors; who always helped me to completed my thesis
and gave me encouragement and useful comments. I am thankful for their aspiring
guidance, invaluably constructive criticism and friendly advice during the project work.
Furthermore, I would like to thank all the participants in my survey, who have willingly
shared their precious time during the process of collecting data from questionnaires. Lastly,
I would like to thank my be loved ones, my family and my friends, who have remarkably
supported me throughout the entire learning process, especially my mother who helped me
to fill in my questionnaires. It would have been impossible to complete my thesis without
the help from these people.
Zhong Jiacheng

List of contents
Page
Approval page A
Acknowledgement B
Abstract C
List of contents E
List of tables F
List of figures G
Chapter 1 Introduction
1.1 The Statement of the Research Problem 1
1.2 The Objectives of the Research Study 4
1.3 The Research Propositions (The Conceptual Framework) 5
1.4 The Research Hypothesis 6
1.5 The Benefits of the Research 6
1.6 The Scope of the Research Study 7
1.7 The Technical Terms of The Research 7
1.8 The Limitation of the Research 10
1.9 Further Research 11
Chapter 2 Related Document and Research
2.1 The Theories of the Study 12
2.2 The Empirical Studies 24
2.3 The Research Background 30
Chapter 3 Methodology
3.1 The Research Population 36
3.2 The Research Sampling Methods 36
3.3 The Research Variables 37
3.4 The Data Collection 37
3.5 The Research Instruments 39
3.6 The Questionnaires Design 40
3.7 The Re liabilities and Validity analysis of the Questionnaires 46
3.8 The Research Analysis 57
3.9 The Research Statistics 58
Chapter 4 Data Analysis

4.1 The Descriptive Statistics 59
4.2 The Inferential statistics 73
Chapter 5 Conclusion
5.1 Summary and Conclusion 95
5.2 Results 95
5.3 Discussion 97
5.4 Research Suggestions for HUAWEI Company 103
5.5 Research Suggestions for This Paper 106
Reference 108

List of Tables
Table Page
1.3 The Conceptual Framework 8
3.7.1-1 Reliability Analysis on Marketing Mix7p 47
3.7.1-2 Reliability analysis on computer/network technology questionnaire 48
3.7.1-3 Reliability analysis on Purchase Intention 49
3.7.2.1-1 Reliability analysis on Marketing Mix7p KMO and Bartlett's Test 50
3.7.2.1-2 Reliability analysis on Marketing Mix7p Total Variance Explained 51
3.7.2.1-3 Reliability analysis on Marketing Mix7p Rotated Component Matrix 52
3.7.2.2-1 Validity Analysis of Technology Questionnaire KMO and Bartlett's Test 54
3.7.2.2-2 Validity Analysis of Technology Questionnaire Total Variance Explained 54
3.7.2.2-3 Validity Analysis of Technology Questionnaire Rotated Component Matrix a 55
3.7.2.3-1 Questionnaire Validity Analysis on Purchase Intention KMO and Bartlett's Test 56
3.7.2.3-2 Questionnaire Validity Analysis on Purchase Intention Total Variance Explained 56
3.7.2.3-3: Questionnaire Validity Analysis on Purchase Intention Component Matrix 57
4.1.1-1 The Descriptive Statistics of Gender 59
4.1.1-2 The Descriptive Statistics of Marital Status 59
4.1.1-3 The Descriptive Statistics of Age 60
4.1.1-4 The Descriptive Statistics of Occupation 60
4.1.1-5 The Descriptive Statistics of Income 60
4.1.1-6 The Descriptive Statistics of Education 61

4.1.1-7 The Descriptive Statistics of Hometown 61
4.1.2-1 The Descriptive Statistics of Outgoing Frequency 62
4.1.2-2 The Descriptive Statistics of Access to Information 62
4.1.2-3 The Descriptive Statistics of Online Shopping Frequency 62
4.1.2-4 The Descriptive Statistics of Online Shopping Payment 63
4.1.2-5 The Descriptive Statistics of Social Networking 63
4.1.2-6 The Descriptive Statistics of Main use of Compute 64
4.1.3-1 The Descriptive Statistics of Product Factor 64
4.1.3-2 The Descriptive Statistics of Price Factor 65
4.1.3-3 The Descriptive Statistics of Place Factor 66
4.1.3-4 The Descriptive Statistics of Promotion Factor 66
4.1.3-5 The Descriptive Statistics of People Factor 67
4.1.3-6 The Descriptive Statistics of Process Factor 67
4.1.3-7 The Descriptive Statistics of Physical Evidence Factor 68
4.1.3-8 The Descriptive Statistics of Total Marketing Mix 7p Facto 69
4.1.4-1 The Descriptive Statistics of General Knowledge 69
4.1.4-2 The Descriptive Statistics of Special Knowledge 70
4.1.4-3 The Descriptive Statistics of Online Shopping 71
4.1.4-4 The Descriptive Statistics of Total Technology Knowledge Factor 71
4.1.5 The Descriptive Statistics of Online Shopping Intention 72
4.2.1 Different in Gender Independent Samples Test 73
4.2.2 Difference in Age One-Way ANOVA 74

4.2.1.2-1 Difference in Age Multiple Comparisons 74
4.2.1.3 Difference in Occupation Factor One-Way ANOVA 75
4.2.1.3-1 Difference in Occupation Multiple Comparisons 76
4.2.1.4 Difference in Marital Status Factor One-Way ANOVA 77
4.2.1.4-1 Difference in Marital Status Factor Multiple Comparisons 77
4.2.1.5 Difference in Income One-Way ANOVA 78
4.2.1.5-1 Difference in Income Multiple Comparisons 78
4.2.1.6 Difference in Education Level One-Way ANOVA 79
4.2.1.6-1 Difference in Education Level Multiple Comparisons 80
4.2.1.7 Difference in Hometown One-Way ANOVA 81
4.2.1.7-1 Difference in Hometown Multiple Comparisons 81
4.2.2.1 Difference in Out Going Frequency One-Way ANOVA 82
4.2.2.1-1 Difference in Out Going Frequency Multiple Comparisons 82
4.2.2.2 Difference in Access to Information ANOVA 83
4.2.2.2-1 Difference in Access to Information Multiple Comparisons 83
4.2.2.3 Difference in Online Shopping Frequency One-Way ANOVA 84
4.2.2.3-1 Difference in Online Shopping Frequency Multiple Comparisons 84
4.2.2.4 Difference in Terms of payment One-Way ANOVA 85
4.2.2.4-1 Difference in Terms of payment Multiple Comparisons 86
4.2.2.5 Difference in Social Networking Frequency One-Way ANOVA 87
4.2.2.5-1 Difference in Social Networking Frequency Multiple Comparisons 87
4.2.2.6 Difference in Main Purposes Computers One-Way ANOVA 88

4.2.2.6-1 Difference in Main Purposes Computers Multiple Comparisons 88
4.2.3.1 Correlation analysis for 7Ps 90
4.2.3.2 Correlation analysis for Computer Technical 91
4.2.4.1 Model Summary 91
4.2.4.2 Model Summary One-Way ANOVA 92
4.2.5.1 Coefficients of Marketing Mix 7ps 92
4.2.5.2 Coefficients of Computer Knowledge 94

List of Figures
Figures Page
1.1.1 Capturing Growth in China 2
2.3.1 Chinese Online Shoppers 31

Chapter 1
Introduction
1.1 The Statement of the Research Problem
Through the study of consumers' behavior on Marketing Mix 7P, Lifestyle, Demographic
Factor and Computer Technology, this paper has great inspiration and influence on the online
sales of other products in China and the management of Chinese E-commerce companies. the
reasonable use of the research results can help HUAWAI increase its online sales in China.
In the age of mobile communication, more and more consumers are engaged in online
shopping (even though the majority is still buying their products at brick-and-mortar stores).
Recently, even food retailers started to offer their consumers the possibility of online grocery
shopping. From their perspective, it is interesting to know what factors drive consumers to do
their grocery shopping online in order to provide the necessary consumer-friendly services.
Industry experts see significant potential for growth in the next couple of years.
As the largest electronics company in China, HUAWEI is of great research value.
Moreover, in the current e-commerce trend, it is of great significance to study such a large
company with great potential. I want to explore the price, marketing and model factors of
Chinese online shopping consumers through this research. In my opinion, China's online
shopping market still has great potential for a long time to come, so while helping HUAWEI

2
8000 4000
2004 2005 2006 2007 2008 2009 2010 2011 2012 2013 2014 2015 2016 2017
2018
Online retail market transaction scale (100 million USD)
increase its online sales, it can also inspire other e-commerce companies.
1.1.1 The Development Prospect of E-commerce in China
2018, China’s online retail sales reached 1.4 trillion USD. In addition, the total
consumption on e-commerce platform for physical products is 1.1 trillion USD, which
contributes 45.2% to the growth of total social retail sales of social consumer goods. This
shows that the prospects of China’s online consumption are huge. Moreover, China has the
largest online shopping population and online shopping market in the world. According to
statistics [.], in 2017, the total online shopping population reached 460 million in China, 2.6
times that of the United States. The total retail sales in the online consumer market have
reached 851 billion USD, 2.2 times that of the United States. Hence, China’s consumer
market has been highly digitized, and it leads the world in both user groups and market size.
Online consumption will have a great impact on Chinese residents ‘consumption and even on
the entire Chinese economy.
(Figures 1.1.1 Capturing Growth in China Accenture. Capturing Growth in China: New
Consumers. Available online: https / insights/consumer-goods-services /capturing-

3
growth-in-china(accessed on 26 June 2018)
1.1.2 The Online Shopping Consumer Behavior for Mobile
In today’s world consumer behavior is one of the most fascinating topics.
Consumer is the ultimate user of every product, without any consumer there is no market as
such. Consumers are considered the king therefore it is very essential to study the behavior of
consumers.
Mobile phone which is fundamentally a communication device has undergone
several transformations making its functionalist transcending the traditional voice
communication between two individual’s Mobile technology is a daily communication
device that allows people to communicate worldwide within seconds. Mobile phones have
become an indispensable part of social activities, so it is necessary to study the online
consumption behavior of mobile phones.
1.1.3 Online Sales of HUAWEI Mobile Phones
Take China's online shopping platform and JD.com for example, the sales volume
of HUAWEI on JD.com platform in 2018 reached 42.36 billion yuan, among which the sales
volume of mobile phones accounted for 85%, followed by computer office and digital
supplies.
From April 2016 to April 2019, HUAWEI 's mobile phone sales and sales volume
on JD.com platform increased steadily in the fluctuation. On JD.com platform, in 2017,
HUAWEI 's mobile phone sales reached 25.386 billion yuan, with an annual growth rate of
108.84 percent. In 2018, HUAWEI 's mobile phone sales reached 35.916 billion yuan, with
an annual growth rate of 41.10%. But into 2019, HUAWEI 's monthly sales on the JD.com

4
platform have declined. That is to say, although the sales revenue of HUAWEI increased in
the first quarter of 2019, the sales of its mobile phones on the e-commerce platform did not
reflect the enthusiasm of the overseas people to support HUAWEI.
1.2 The Objectives of the Research Study
1.2.1 To study Consumer online shopping Behavior
1.2.2 To study the impact of demographics factor on online shopping behavior
1.2.3 To study the impact of lifestyle factor on online shopping behavior
1.2.4 To study the impact of Marketing Mix 7P factor on online shopping behavior
1.2.5 To study the impact of Technology Knowledge Factor on online shopping
behavior
5
Marketing Mix 7P
Product;Price;Place;Promotion;People;Process;Physical Evidence
1.3 The Research Propositions (The Conceptual Framework)
Independent Variables Dependent Variables
Technology Knowledge
Normal Compute Tech;Work in
Compute;Play Games;Shopping in
Online;Watch Media
Demographics
Gender;Age;Occupation;Income;Education;Home town
Lifestyle
Outgoing Frequency;Access to information;Online shopping Frequency;Online shopping Payment;Social Networking
Costumers
Behavior
6
1.4 The Research Hypothesis
1.4.1 To test the impact of demographic factors on consumers' online shopping
behavior.
1.4.2 To test the impact of lifestyle factors on consumers’ online shopping behavior.
1.4.3 To test the impact of Marketing Mix 7P factors on consumers’ online shopping
behavior.
1.4.4 To test the impact of Personal Technology Knowledge factors on consumers’ online
shopping behavior.
1.5 The Benefits of the Research
1.5.1 To know Demographic Factors impact of HUAWEI Mobile on Online Shopping.
1.5.2 To know Lifestyle Factors impact of HUAWEI Mobile on Online Shopping.
1.5.3 To know Marketing Mix 7P Factors impact of HUAWEI Mobile on Online
Shopping.
1.5.4 To know Technology Knowledge Factors impact of HUAWEI Mobile on Online
Shopping.
1.5.5 To know Online shopping Intention impact of Other Mobile on Online
Shopping.
1.5.6 While obtaining the research results, the research results are applied to assist
other Chinese e-commerce Mobile enterprises in their management and sales. For example:
Vivo, OPPO and Samsung.

7
1.6 The Scope of the Research Study
This study was conducted from December 2018 to August 2019. The research focuses
on online shopping consumers in mainland China. Especially for consumers who have the
habit of online consumption shopping. Because HUAWEI has many product lines in
mainland China, we choose the most representative mobile phone as the research object. To
pursue the most representative research results.
Cross-sectional surveys are used when researchers intend to analyses relationships
between dependent and independent variables, which are measured at the same time, across
different units in complex models [1] (Easter-Smith et al. 2012.) The survey in this research
is built to gather data on various variables that influence individual’s intention to buy
HUAWEI Mobile in online stores with aim to examine all the occurring relationships
between variables. Cross-sectional research designs are a part of positivist epistemology [1]
(Easter-Smith et al. 2012).
1.7 The Technical Terms of The Research
1.7.1 Sales
The term "sale" in the general business context refers to the exchange of money
or value used to transfer the ownership of goods or property or the right to services. In
general business operations, sales refer to any transaction in which money or value is better
for or entitled to service in exchange for ownership.
1.7.2 Marketing
Marketing is an activity, a series of organizations, and the process of creating,

8
communicating, delivering, and exchanging products of value to consumers, consumer`s
partners, and society at large.
1.7.3 Influence
Influence is the power to have an important influence on someone or something.
If someone is influencing others, they are changing someone or something indirectly but
important.
1.7.4 Online
In a general sense, being online means that an electronic device opens and
connects to another device, such as another computer, a network, or a device such as a printer.
Recently, the term online has meant connecting to the Internet. In this case, a person can be
online when using the Internet, or the computer itself can be said to be online when it has
established an Internet connection.
1.7.5 E-Commerce
Also known as e-commerce or Internet commerce, refers to the use of the Internet
to purchase and sell goods or services and to transfer funds and data to execute these
transactions. E-commerce is usually used to refer to the online sale of physical products, but
it can also describe any type of business transaction promoted through the Internet. Whereas
e-business refers to all aspects of operating an online business, e commerce refers
specifically to the transaction of goods and services. Whereas e-business refers to all aspects
of operating an online business, e commerce refers specifically to the transaction of goods
and services.
1.7.6 Consumer

9
Consumers are defined as people who buy goods and services. The term also
refers to the employment of goods and services. They are people or other economic entities
who use goods or services. Besides, they won't sell the goods they buy. They are the end
users in the distribution chain of goods and services. In fact, sometimes consumers may not
be buyers.
1.7.7 Consumer Behavior
The research of consumer behavior includes numerous fields, i.e. studies the
processes individuals or groups are involved in when they choose, buy and use products,
services, ideas or experiences in order to satisfy their needs and wishes.
The very term consumer behavior can be defined as the behavior that consumers
show while researching, buying, using, evaluating and sorting out products and services that
are to satisfy their needs [2] (Schiffman and Kanuk, 2004). Studying consumer behavior
shows how the individuals make decisions to use their own resources (time, money). It
consists of the research as to how, why, what, when, where and how often consumers buy
products.
1.7.8 Consumer Demographics
Consumer demographics are categories of consumer groups that are relevant to
the purpose of the business, such as marketing and product design. The term also refers to the
study of this category in a business context.
Consumers can be categorized by an almost infinite number of variables. Some of
the most common consumer demographics used for business purposes include age, gender,
geographic location, education level, marital status, family income, occupation and

10
hobbies. Demographics are one of the key elements of consumer segmentation. Targeting a
specific consumer group can more effectively allocate marketing resources and increase
opportunities for cross-selling and up-selling.
1.7.9 Marketing Mix 7P
The marketing mix is also called the 4Ps and the 7Ps. The 4Ps are price, place,
product and promotion. The services marketing mix is also called the 7Ps and includes the
addition of process, people and physical evidence. Marketing Mix 7P this model has gained
significant traction over the years as services and their marketing is increasingly being given
due importance as an independent field of study. This model proposed [3] (Booms and
Bitner, 1981), extends the marketing mix by 3 new “P” that directly relate to the service
provision industry. These are people, physical evidence and process.
1.7.10 Lifestyle
A typical lifestyle reflects a person's attitude, outlook on life, values, or way of
looking at the world. Lifestyle, therefore, is a means of exercising one's sense of self and
creating cultural symbols that resonate with one's identity. Not all aspects of lifestyle are
voluntary.
1.8 The Limitation of the Research
Any rigorous scientific research will have some imperfect limitations, and my research is
no exception. For example, I only focused on HUAWEI's mobile phone products, but did not
study other products more comprehensively. And because I live in Thailand, the research can
only be done online. Another important limitation is my language barrier. The most

11
important is that of have to finish my thesis on time.
1.9 Further Research
The future research should follow the longitudinal approach to predict beliefs and behavior
over time since the model is this study is cross-sectional, which measures the intention only at a
single point in time. Different online shopping websites may have different influences on
consumers. Therefore, in the future research, different types of shopping websites should also
consider different influences on buyers.
In addition, future researchers can focus on the larger cross section of Internet users in order
to get different perspectives such as the business perspective. This will provide equilibrium
perspective on research issues. Future researchers can also conduct the research based on the
comparison study such as comparison indifferent genders (different psychological perception),
races (cross-cultural study), age group (compare the perception of baby boomers and youth
group), as well as online shoppers to non-online shoppers etc.
In order to better understand consumers’ attitude and behavior in a different way, further
research is needed to expand or examine other behavioral model or select other variables that may
influence consumers’ online purchase intention. For example, Structural Equation Model (SEM)
analysis, Multiple Theory Model, Theory of Planned Behavior Model, E-commerce Service
Quality (ESQ), web attributes, consumer attitudes and past related experience that may impact
consumers’ online purchase and repurchase intentions.

12
Chapter 2
Related Documents and Research
2.1 The Theories of the Study
2.1.1 Costumer Behavior
Consumer buying behavior is the sum total of a consumer's attitudes, preferences,
intentions, and decisions regarding the consumer's behavior in the marketplace when purchasing a
product or service. The study of consumer behavior draws upon social science disciplines of
anthropology, psychology, sociology, and economics. [4] (Velumani, D,2014)
According to Wilson, Zethaml, Bitner and Gremler ,2012[5], consumer behavior is a
total decision of consumers towards purchase. Additional, consumer behavior is a prevalent topic
of marketing, which has been studied and discussed in the past decades [6] (Constantinides,
2004). According to [6] (Constantinides ,2004) Czinkota and Kotabe [7](2005) [8](Foxall ,2005),
there are several factors affecting consumer behavior, such as social, cultural, economic and
psychological, which are beyond the control of merchants.
2.1.2 Demographics Factor
2.1.2.1 Gender
Either of the two sexes (male and female), especially when considered with
reference to social and cultural differences rather than biological ones. The term is also used more

13
broadly to denote a range of identities that do not correspond to established ideas of male and
female.
2.1.2.2 Age
Chronological age is defined as the number of years a person has lived. Years,
of course, being Earth revolutions around the sun. This is the one we're all very familiar with.
How old are you? I am so many years, months, and days old. Because of the ease and familiarity
everyone has with chronological age, many tests and programs are based around it. Most 5-year
old are ready for kindergarten. Most 16-year old’s have matured enough to drive. Many 65-year
olds are ready to retire. When looking at chronological age, is 45 different than 20? Yes, but that
number on its own fails to inform us of anything else. All it says is that they were born 25 years,
or Earth-Sun revolutions, apart.
2.1.2.3 Occupation
Occupation is a person's role in society. More specifically, a job is an activity,
often regular and often performed in exchange for payment. Many people have multiple jobs. A
person can begin a job by becoming an employee, volunteering, starting a business, or becoming
a parent. The duration of a job may range from temporary to a lifetime. An activity that requires a
person's mental or physical effort is work. If a person is trained for a certain type of job, they may
have a profession. Typically, a job would be a subset of someone's career. The two may differ in
that one usually retires from their career, versus resignation or termination from a job.
Jobs can be categorized, by the hours per week, into full time or part time. They
can be categorized as temporary, odd jobs, seasonal, self-employment, consulting, or contract
employment. Jobs can be categorized as paid or unpaid. Examples of unpaid jobs include

14
volunteer, homemaker, mentor, student, and sometimes intern. Jobs can be categorized by the
level of experience required: entry level, intern, and co-op. Some jobs require specific training or
an academic degree. Those without paid full-time employment may be categorized as
unemployed or underemployed if they are seeking a full-time paid job. Moonlighting is the
practice of holding an additional job or jobs, often at night, in addition to one's main job, usually
to earn extra income. A person who moonlights may have little time left for sleep or leisure
activities. The Office for National Statistics in the United Kingdom lists 27,966 different job titles,
within a website published 2015.
2.1.2.4 Income
Personal income is the gross earnings received by an individual or a household
including all the sources of compensation such as wages, salaries, investments, and
bonuses.Economics takes a broader view on personal income by defining it as the earnings from
all households in a country. This is very important in determining the level of domestic
consumption. It includes all the salaries, wages, bonuses, social security benefits, food stamps,
dividends, profit-sharing collections, and any other form of income that an individual may receive.
This is not to be confused with net pay.
2.1.2.5 Education
Education is the process of facilitating learning, or the acquisition of
knowledge, skills, values, beliefs, and habits. Educational methods include storytelling,
discussion, teaching, training, and directed research. Education frequently takes place under the
guidance of educators, but learners may also educate themselves. Education can take place in
formal or informal settings and any experience that has a formative effect on the way one thinks,

15
feels, or acts may be considered educational. The methodology of teaching is called pedagogy.
•Bachelor's degree: A bachelor's degree or baccalaureate is an undergraduate academic degree
awarded by colleges and universities upon completion of a course of study lasting three to seven
years (depending on institution and academic discipline). In some institutions and educational
systems, some bachelor's degrees can only be taken as graduate or postgraduate degrees after a
first degree has been completed. In countries with qualifications frameworks, bachelor's degrees
are normally one of the major levels in the framework. In China, Since the undergraduate
education system in China is modeled after its American counterpart, all the degrees are adapted
from those of the United States excepting the release of the degree certificate. Once a student has
fulfilled his/her course requirements, a graduate certificate will be given. In order to get the
degree, a student must finish and pass the dissertation stage; only then will he or she be awarded a
degree credentialed by the Ministry of Education of the People's Republic of China. Four years of
education is the standard length, although some private small colleges not credentialed by the
Ministry of Education do offer three-year programs. Normally, about 90% of graduates are able to
obtain a degree; however, no degree is awarded with excellence or honor. It is also referred to as a
"Xueshi".•Master's degree: A master's degree is an academic degree awarded by universities or
colleges upon completion of a course of study demonstrating mastery or a high-order overview of
a specific field of study or area of professional practice. A master's degree normally requires
previous study at the bachelor's level, either as a separate degree or as part of an integrated course.
Within the area studied, master's graduates are expected to possess advanced knowledge of a
specialized body of theoretical and applied topics; high order skills in analysis, critical evaluation,
or professional application; and the ability to solve complex problems and think rigorously and

16
independently. In China, graduate students are mainly divided into two categories, full-time and
non-full-time. Full-time graduate students are enrolled through the postgraduate and doctoral
entrance examinations held by institutions of higher learning, with a minimum duration of 2 or 3
years; Part-time graduate students before 2017 mainly refers to on-the-job graduate students,
mainly through the October joint examination, the equivalent of Shen Shuo, January recruitment
of in-service graduate students and other ways to recruit students; Starting in 2017 (including
2017), part-time graduate students will be named part-time graduate students, and part-time
graduate students and full-time graduate students will participate in the National Unification
examination at the end of December, with the same designation. The fractional line, upon
graduation, also obtains the double certificate. The institutions that recruit and train master and
doctoral graduate students include institutions of higher learning with master's and doctoral
programs, as well as related scientific research institutions. Doctor’s degree: A doctorate or
doctor's degree or doctoral degree is an academic degree awarded by universities that is, in most
countries, a research degree that qualifies the holder to teach at the university level in the degree's
field, or to work in a specific profession. There are a variety of doctoral degrees, with the most
common being the Doctor of Philosophy (PhD), which is awarded in many different fields,
ranging from the humanities to the scientific disciplines.
2.1.2.6 Hometown
The town where one was born or grew up, or the town of one's present fixed
residence. •City Downtown: Downtown is a term primarily used in North America by
English-speakers to refer to a city's core or central business district (CBD), often in a
geographical or commercial sense. •City Uptown: A residential part of town away from the

17
central commercial district. •Rural area: In general, a rural area or countryside is a geographic
area that is located outside towns and cities. Typical rural areas have a low population density and
small settlements. Agricultural areas are commonly rural, as are other types of areas such as forest.
Different countries have varying definitions of rural for statistical and administrative purposes.
2.1.3 Marketing Mix 7P Factor
2.1.3.1 Product
A product is the item offered for sale. A product can be a service or an
item. It can be physical or in virtual or cyber form. Every product is made at a cost and each
is sold at a price. The price that can be charged depends on the market, the quality, the
marketing and the segment that is targeted. Each product has a useful life after which it needs
replacement, and a life cycle after which it has to be re-invented. In FMCG parlance, a brand
can be revamped, re-launched or extended to make it more relevant to the segment and times,
often keeping the product almost the same. A product needs to be relevant: the users must
have an immediate use for it. A product needs to be functionally able to do what it is
supposed to and do it with a good quality. A product needs to be communicated: Users and
potential users must know why they need to use it, what benefits they can derive from it, and
what it does difference it does to their lives. Advertising and 'brand building' best do this. A
product needs a name: a name that people remember and relate to. A product with a name
becomes a brand. It helps it stand out from the clutter of products and names. A product
should be adaptable: with trends, time and change in segments, the product should lend itself
to adaptation to make it more relevant and maintain its revenue stream.[9] (The Economic
Time,2020)

18
2.1.3.2 Price
A value that will purchase a finite quantity, weight, or other measure of
a good or service. As the consideration given in exchange for transfer of ownership, price
forms the essential basis of commercial transactions. It may be fixed by a contract, left to be
determined by an agreed upon formula at a future date, or discovered or negotiated during
the course of dealings between the parties involved.
In commerce, price is determined by what (1) a buyer is willing to pay,
(2) a seller is willing to accept, and (3) the competition is allowing to be charged. With
product, promotion, and place of marketing mix, it is one of the business variables over
which organizations can exercise some degree of control.[10](MBN.com,2019)
It is a criminal offense to manipulate prices (see price fixing)
in collusion with other suppliers, and to give a misleading indication of price such
as charging for items that are reasonably expected to be included in the advertised, list, or
quoted. Also called sale price and selling price.
At first glance, the price of goods in e-commerce is formed according to
the rules of classical price formation. The pricing strategy is based on three components: cost,
consumer value, and competitors. However, the experience of the world's leaders in
e-commerce indicates the appearance of absolutely unique methods of flexible and personal
pricing.
According to Internet Retailer, price-monitoring technology vendor
Ugam recorded 9715 price changes of electronics, toys and household goods on
Amazon.com during the holiday season from 24 November to 14 December (Rueter, 2014).

19
The Amazon has established a record, surpassing the frequency volatility of the prices of its
competitors - such retail giants as Best Buy Co., Target Corp., Wal-Mart Stores Inc. and
Toys 'R' Us Inc. According to the vice president of marketing, the Amazon is able to change
the price of the product up to 10 times per day, mainly for home appliances and to a lesser
extent for clothing. Approximately the price of 20% of all online products is changing daily,
and the price of the most running products is updated every few minutes, according to the
vice-president of product and business development strategy in the price monitoring
company Decide.com, which recently has been acquired by eBay Inc.
Thus, the price in e-business is highly dynamic and depends on market
conditions and the pricing strategies can have an individual character for each user, and it is
possible due to Big-data technologies. [11] (Pogorelova, E., Yakhneeva, I., Agafonova, A., &
Prokubovskaya, A.,2016)
2.1.3.3 Place
Place is a factor for traditional marketing mix is the product should be
available from where your target consumer finds it easiest to shop. But for Online shopping
the factor of place for online shopping is mainly focused on website construction and use.
consumers are more concerned about whether they can quickly find the goods they want.
The selling development strategy in e-business is influenced by the
specificity of the implemented product group. So, for information products the period of time
and costs to fulfill the orders are small, for the goods in the physical performance the costs
will depend on the shelf life of the product, the chosen method, the volume, the speed of
delivery and the client must be informed about the conditions and the cost of delivery in

20
advance.
The place of sale in e-commerce is a site or a marketplace in the social
network. The latter, being the primary point of the contact with the target audience, also
performs the promotion functions. In today's business the place of sale may be a collective
platform for a group or for many individual sellers, providing goods at fixed prices
(aliexpress.com) or through an auction (ebay.com). An important feature of the place in this
case is the maximum availability of sales channels for both buyers and sellers. [11]
(Pogorelova, E., Yakhneeva, I., Agafonova, A., & Prokubovskaya, A.,2016)
2.1.3.4 Promotion
Business promotion is communicating with the public in an attempt to
influence them toward buying your products and/or services. Generally, we promote our
businesses, our products, and our services by trying to bring them to the forefront of our
target audience's attention in the hope that they will act as we want them to (i.e. see our
product; want to buy our product). You might promote your business, product or service in
person through or in a retail store, via the internet through a website or social
media platform, electronically through email or text messaging (SMS marketing), just to
name a few of the more popular business communication channels, but it's the intention to
influence the consumer that defines promotion and sets it apart from other communication
with consumers and/or clients. [12] (Susan Ward, 2019) But Promotion and Advertising Are
Not the Same. The words promotion and advertising are often used interchangeably, but
they're not the same thing. Advertising is one specific action you could take to promote your
product or service. It's one type of promotion. (See the examples of business promotion

21
below for other types of promotion that small businesses commonly use.) Promotion, as a
general term, includes all the ways available to make a product and/or service known to and
available to purchase by consumers. Someone starting a business, for instance, might ask
themselves how they're going to promote their products or services; advertising would be one
of the ways although of course there are many others. (See the Marketing Plan Section of the
Business Plan for how advertising fits into the promotional mix.) An ad on a bus shelter is
promotion. So is a marketing campaign or offering a discounted price for a set amount of
time. The word promotion is also used specifically to refer to a particular activity that is
intended to promote the business, product or service. A store might advertise that it's having
a big promotion on certain items, for instance, or a businessperson may refer to an ad as a
promotion. Businesses also often create or buy promotional merchandise, products that often
have been branded with a company's logo, to give away at events such as trade shows or as
thank yours to consumers.
2.1.3.5 People
All companies are reliant on the people who run them from front line
Sales staff to the Managing Director. Having the right people is essential because they are as
much a part of your business offering as the products/services you are offering. In an
e-commerce industry, the people factor is usually reflected in after-sales service and pre-sales
service. It’s more of a conversation over the Internet. In addition, an excellent logistics
company and an excellent and friendly Courier are also people factors.
2.1.3.6 Process
Process is another element of the services marketing mix or 7Ps.There is a

22
number of perceptions of the concept of process within the business and marketing literature.
Some see processes as a means to achieve an outcome, for example – to achieve a 30%
market share, a company implements a marketing planning process. Processes include direct
activities and indirect activities. Direct activities add value at the consumer interface as the
consumer experiences the service. Many processes are supported by indirect activities, often
known as back office activities, which support the service before, during and after it has been
consumed. Process factors in online shopping are mainly reflected in the purchase process,
payment process and method and evaluation system. The convenience of the overall service
process and after-sales service process can also be reflected.
2.1.3.7 Physical Evidence
Almost all services include some physical elements even if the bulk of what
the consumer is paying for is intangible. The physical environment is the space by which you are
surrounded when you consume the service. So, for a meal this is the restaurant and for a journey it
is the aircraft that you travel inside. The physical environment is made up from its ambient
conditions; spatial layout and functionality; and signs, symbols, and artefacts [13] (Zeithaml, V. A.,
Bitner, M. J., Gremler, D. D., & Pandit, A.,2000).But for online shopping, this factor comes more
from online sources, such as servers, UI and website security. A fast server without
procrastination is the basis of convenient shopping on the Internet. Good and simple interface
design will make consumers feel happy, thus browsing more goods and buying. Website security
is also important. Protecting consumers' privacy is a legal requirement and protecting consumers'
property security is also a responsibility. If the disclosure of consumer privacy and loss of
financial, will also make the company lose credibility, thus losing consumers.

23
2.1.4 Lifestyle Factor
Lifestyle is the interests, opinions, behaviors, and behavioral orientations of an
individual, group, or culture. [14] (Adorno,1991) the tangible factors are specifically related to
demographic variables such as an individual's demographic profile, whereas intangible
factors concern the psychological aspects of an individual such as personal values,
preferences, and outlooks [15] (Kahle & Close, 2011).A lifestyle typically reflects an
individual's attitudes, way of life, values, or world view. Therefore, a lifestyle is a means of
forging a sense of self and to create cultural symbols that resonate with personal identity. Not all
aspects of a lifestyle are voluntary. Surrounding social and technical systems can constrain the
lifestyle choices available to the individual and the symbols she/he is able to project to others and
the self.[16] (Spaargaren, G., and B. VanVliet ,2000)
2.1.5 Technology Knowledge Factor
General technology knowledge, such as the ability to switch on and off a
computer and the normal use of the computer. Special technology knowledge usually refers
to software designed to abilities to operate the computer to do work. Online shopping
technology knowledge generally refers to the ability to do online shopping alone. Researches
have revealed that online shopping innovativeness is a function of attitude towards the online
environment and individual personal characteristics [17] (Midgley & Dowling, 1978;
Eastlick, 1993; Sylke, Belanger & Comunale, 2004; Lassar et al., 2005).

24
2.2 The Empirical Studies
·Thananuraksakul, S.Study“Factors Affecting Online Shopping Behavioral Study of
Thai Consumer” in 2018 find out this. From this article, we can know that the experience of
online shopping is very important, the more experienced people are, the more likely they are to
continue online shopping. Trust in shopping online is important. When consumers are aware of
this, they are more likely to be online shopping. When they have a positive attitude, they are more
likely to have intentions online shopping. Families, relatives, friends and colleagues influence
shoppers' buying intentions online. [18] (Thananuraksakul, S. ,2007).
·Hongyang Yu Study “Analysis of Influencing Factors of Taobao Consumer Behavior”
in 2017 find out this. Through the analysis of this article, we can see the factors influencing
consumers’ behavior in Taobao. They are store, commodity, safety, time, speculation, interaction
and occasional income factor. Moreover, consumers ’personal factors including gender,
occupation, education, income and online time are also important factors affecting their behavior.
Through the author's research and analysis, they put forward some targeted Suggestions Taobao
sellers must pay great attention to the shop's reputation, be honesty and improve service attitude,
store visibility and affinity. At the same time, Taobao sellers should carry out various promotions
regularly, such as free trial and special discount, in the meantime they should ensure the quality of
products, so that consumers can buy low price and good quality goods. Secondly, Taobao shop
should pay margin, try to offer good after-sale service and open a variety of payment methods for
consumers to choose, increasing consumers' security trust to stores. Moreover, with the increasing
requirements of interaction, sellers should open forum and Spenser-saying platform to understand
consumers' demand, increasing the stores’ turnover rate. Fourthly, Taobao sellers should

25
cooperate with other platforms, increasing conduct propaganda. Finally, Taobao sellers should
ensure account security, preventing illegal embezzlement account number by others. In short, in
the current virtual shopping environment, Taobao sellers should provide good quality, cheap
goods and good service, for the dual purpose of a better service to consumers and better
promotion to Taobao. [19] (Yu, H., & Gao, Q. 2012)
·Kateryna Smoliana Study “Consumer behavior towards buying consumer electronics
online: cross-national analysis “in 2017 find out this. This paper has two research objectives: 1.
What are the factors that influence consumer intention? Buy electronics online? The second part
of the study aims to estimate whether there are differences among counties in this intention.
Research question 2: is there any difference in purchase intention? What factors contribute to
e-presence and in each country? The proposed research model is based on the intention research
literature, especially the theory of planned behavior and the technology acceptance model. This
means that intentions are controlled by attitudes, subjective norms, perceived behavior, attitudes
toward online stores and the cultural environment of trust. To test this effect, five hypotheses
were proposed. The main data was collected through an online questionnaire. It includes five
groups on the impact of the proposal and on the country of residence, gender and age. Based on
quantitative analysis, the following results can be obtained: First, multiple regression analysis
showed that only two of the five hypotheses were accepted. This proves people's attitude towards
buying consumer electronic products online and towards users. SING stores can influence
individuals' willingness to purchase electronic products online. On the basis of quantitative
analysis, the following results can be obtained: First, multiple regression analysis showed that
only two of the five hypotheses were accepted. This proves people's attitude towards buying

26
consumer electronic products online and towards users. SING stores can influence individuals'
willingness to purchase electronic products online. On the basis of quantitative analysis, the
following results can be obtained: First, multiple regression analysis showed that only two of the
five hypotheses were accepted. This proves people's attitude towards buying consumer electronic
products online and towards users. When people have a positive view of the behavior and believe
in the safety and value of the program, they will be more willing to buy consumer electronic
products online. Online stores are more than physical stores, there is no technical difficulty in
recognizing online shopping time and money, as well as experience. [20] (Smoliana, K. 2017)
·Cheng Boon Study “Factors Influencing Consumers’ Online Purchase Intention: A
Study among University Students in Malaysia” in 2016 find out this. From all the information
gathered for this study, e-commerce is one of the most important ways of doing business
worldwide. This study aims to understand the behavior of college student’s intention and
expectation of online purchasing channels in Malaysia. In this paper, five identification factors in
the literature review were used to test it. The results support previous studies. The research shows
that trust, perceived usefulness and subjective norms have positive effects on college students'
online purchase intention. However perceived ease of use and perceived enjoyment emotions
have no significant significance in predicting college students' online shopping intention. In this
study, researchers found that subjective norms are the most powerful predictors of online
shopping intention of college students. In addition, college websites trust the opinions of experts
and media. Therefore, collective voice is necessary to encourage consumers to buy through the
Internet. Consumers are looking for good things before participating in the procurement activities,
all the proof, feedback and comments. E-commerce providers can also partner with Facebook,

27
bloggers and experts. In addition, e-commerce providers can advise experts to link web addresses
to their blogs, or post links to certain professional web sites. Perhaps e-commerce providers could
hire them to spread the word. As a popular marketing tool. The results also show that perceived
utility is the second most important factor influencing consumers' willingness to buy online.
Therefore, e-commerce providers must ensure that their websites are always stable and accessible
from anywhere. Website maintenance needs to be ongoing. [21] (Liat, C.B., Wuan, Y.S., & Nilai,
P. 2014)
·Yan Zhe Study “Research and analysis of Chinese consumer behavior factors that
influence consumer online shopping” in 2016 find out this. This study aims to find out the
factors affecting Chinese consumers and determine the relationship between online shopping and
buying behavior, different demographic data, marketing mix, and lifestyle on consumers' buying
behavior. Through the analysis of questionnaire data, this study found significant differences and
the relationship between consumers' demographic characteristics of network shopping. Such as
monthly income, education, occupation and consumer use. In addition, the study also found a
significant relationship between the marketing mix (4P's) and online shopping behavior of
consumers. Research shows that, the most important factors in the marketing mix are product
quality, product information, online payment, logistics, price, promotion and degree Satisfaction.
Marketing mix (4P 's) (product, price, place, and promotion) factors that affect consumer buying
behavior. For lifestyle factors, this study found that different lifestyles have different impacts
Influence consumers' views and behaviors of online shopping. [22] (Yan Zhe.2016)
·Arjun Mittal Study“E-commerce: It’s Impact on consumer Behavior” in 2016 find out
this. This study mainly studies the influencing factors in the network environment to influence

28
consumers' online shopping behavior. The discussion is divided into three parts: traditional
shopping behavior, online shopping behavior and online consumption behavior. The research
focuses on: online shopping (including the nature of online shopping, e-commerce) websites, and
online security, privacy, trust and trustworthiness) and online consumer behavior (including
background, shopping motivation and decision-making process). Information search is the most
important factor to help consumers find the right products. Therefore, online retailers must
strengthen and improve the information support, such as providing detailed product information
and use to improve the information search efficiency of internal search engines. In the evaluation
stage, consumers pay more attention to the word-of-mouth website of e-commerce and the
payment security purchase stage. In the after-sales stage, the most concerned factor is the
after-sales service. [23] (Mittal, A. 2013)
·YE Study “Online shopping: A comparison of New Zealand and Chinese shoppers “in
2015 find out this The results show that there is a significant relationship between the social
influence of norms and the appearance, purchase and consumption of clothing, shoes and
cosmetics. In addition, the influence of information society is less related to the appearance,
purchase and consumption of clothes. In the past decade, the online shopping environment has
grown rapidly, and it is crucial for those who want to join online businesses or owners of online
stores to know more about consumers. Shopping behavior in network environment. This research
is good for both marketers and online store owners because it will help marketers improve their
business strategies to attract consumers. Pay attention to what consumers buy. In a word, this
study proposes and highlights the significance of national culture and social influence and its
influence on network shopping frequency. This study points out that influence is the influence of

29
national culture on the shopping frequency on the Internet. [24] (Xing, Y. 2016)
·Smt Susheela Menon Study“E-COMMERCE MANAGEMENT” in 2015 find out this.
E-commerce is a new technology related to commerce and computers. Commerce refers to the
exchange, conversion or trading of entities (goods or commodities) to a large extent. With the
flexibility provided by computer networks and the availability of the Internet, e-commerce has
developed on the basis of traditional commerce. E-commerce creates new PR opportunities.
Online activities. It facilitates easier collaboration between groups: companies share information
to improve consumer relationships; Companies work together to design and build new
presales/service; Or multinational companies to share information for major marketing
campaigns.[25] (Smt Susheela Menon,2015)
·R.B. Kim Study “Factors influencing Chinese consumer behavior when buying
innovative food products” in 2014 find out this. This paper finds some important influences on
consumers' go purchase decisions. The results of this study indicate that consumers' perceived
concerns related to gm foods are the primary consideration when choosing gm foods for Chinese
consumers. Companies that want to sell gm foods in China may need to work on marketing,
which can involve significant marketing costs. The results show that the price level of genetically
modified food is an important factor in determining their purchase of genetically modified food,
which indicates the potential sensitivity of Chinese consumers to the price of genetically modified
food. This may require the company to initially price gm foods at a fairly low level in order to
attract potential consumers and could put significant financial pressure on its gm food marketing
business. [26] (Kim, R. B. 2009)

30
2.3 The Research Background
2.3.1 Overview of China’s online retail market
One manifestation of China’s continuous rapid economic growth during the past two
decades is its consumers’ swelling consumption power [27] (Zhao, A.L., Hanmer-Lloyd, S.,
Ward, P. and Goode, M.M.H,2008). As a result of the growing affordability and availability of
Internet access, more and more Chinese consumers are using the internet for information,
entertainment and communication purposes. At the same time, Chinese consumers’ increasing
understanding of online applications, a more transparent and convenient online shopping
environment and expanding investments by companies have turned more and more Chinese
netizens into online shoppers. Evidence of this is reflected in China’s online retail market value
reaching USD 18.8 billion in 2008 with a vigorous growth rate of 128.5 percent in 2008 [28] (Lee,
H-T,2009). Rising against the global economic crisis, China’s online shopping penetration rate
has reached 24.8 percent and the online B2C (business-to-consumer) annual growth rate is
expected to exceed 100 percent over the next two years [28] (Lee, H-T,2009).
One decade after the establishment of the first B2C web site 8848.com in 1999, China’s
B2C e-commerce has entered a stage of rapid development [29] (Weng, V. and Lee, C.H,2009).
In contrast to most Western markets, C2C (consumer to consumer) e-commerce (akin to eBay’s
model) currently dominates China’s online shopping market with 93.2 percent of total online
sales in 2008 [30] (CNNIC,2009).
Exemplifying this is Taobao, the largest e-trailer in China whose web site allows buyers
to shop in C2C bazaars as well as B2C branded stores. However, the online B2C market is
expected to rapidly grow and become the main driver behind the market expansion in the future
31
as the B2C platform matures and more local and foreign firms use this model to enter the market
[31] (Shanghai Business Review ,2010).
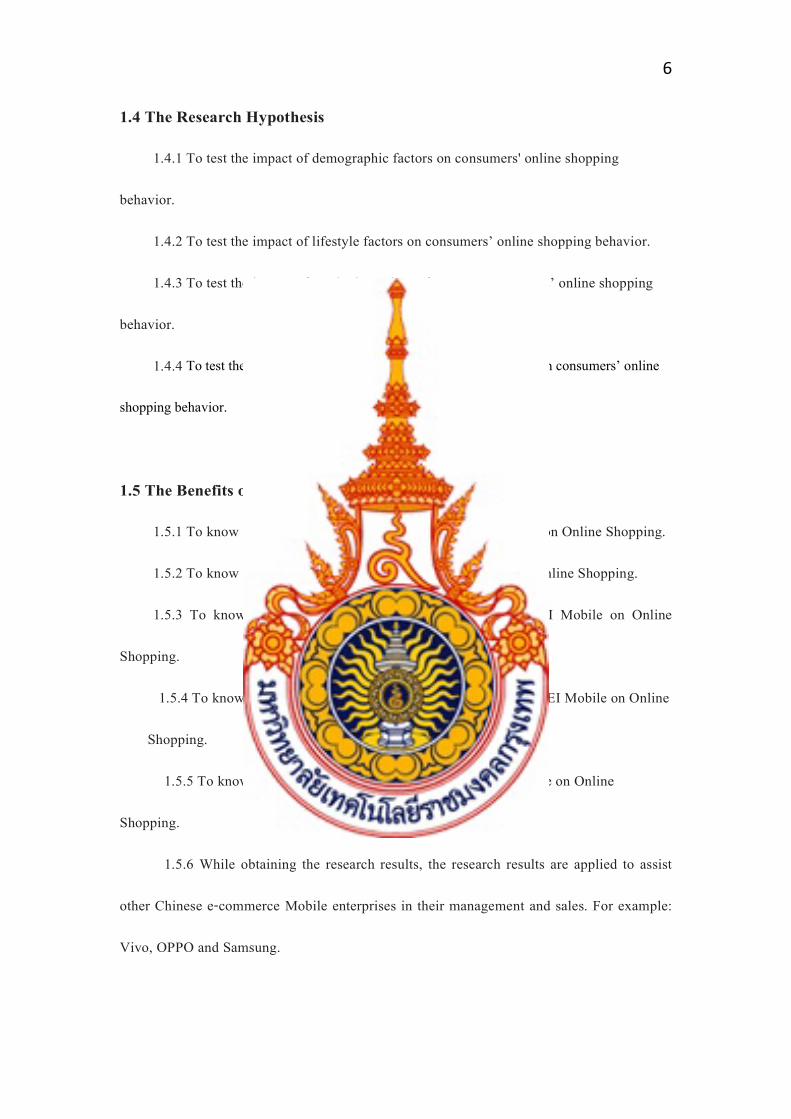
Chinese citizens have greatly increased their online spending over the years. The
average spending online reached RMB1,600 (USD 234.3) in 2008. Like their Western
counterparts, the online shopping lists of Chinese consumers have also expanded a great deal
from the initial simple selection of books, music and video products to include a more extensive
array of product categories including apparel, housewares, digital products and many others.
(Figures 2.3.1 Chinese Online Shoppers’ Average Online Spending Per Year, IResearch Feb
12,2019)
Critics posit that e-commerce will not work in China, arguing that Chinese consumers
are traditionally conservative savers who refuse to buy on credit, distrust online vendors due to
privacy and quality concerns, and need to feel and touch a product before purchasing it [32] (Rein,
S,2008). Such perceptions may be in a state of flux as things have changed dramatically in China
during the past three decades. The implementation of the one-child family policy and the rapid

32
transition to a market economy have remolded the Chinese society culturally, as well as
economically. Younger generations of Chinese hold a set of cultural values strikingly different
from those of their parents and older generations [33] (Gong, W. and Li, Z.G,2008). Young
Chinese are more individualistic, novelty-seeking, admire foreign-made products, and have a
heightened sense of brand and status consciousness [33] (Gong, W. and Li, Z.G,2008). Indeed,
they have become the trend setters in almost every product and service category from street
fashion to mobile phones and online purchases. Therefore, it is not surprising that several market
researches reports have found that young and educated consumer segments with higher income
level are mainly the early adopters of online shopping in China [32] (Rein, S,2008).
Characterized by high technology and low entry barriers, China’s online shopping
market is very dynamic and highly competitive, yet it holds great promise [28] (Lee, H-T,2009).
In recent years, the government has attached great importance to e-commerce as a means of
spurring China’s economy and has released a series of policies to regularize and guide Internet
and e-commerce development, mainly through the 11th Five-Year Plan and the 2006-2020
National Information Development Strategy[30] (CNNIC,2009).
Despite these positive factors, China is not a country where it is easy for foreign firms
to operate online effectively and compete. Online sales and logistics are separated everywhere in
China and cash on delivery is still the main payment method for online shopping [31] (Shanghai
Business Review ,2010). Geographical diversity, cultural barriers, lack of cultural understanding,
the fast-changing business environment and government regulations, and especially the poor
distribution networks and the lack of a safe and efficient online payment mechanism all make this
market less accessible to foreign firms [28] (Lee, H-T,2009). CNNIC’s surveys have consistently

33
shown that Chinese internet users are less involved in e-commerce activities such as online
shopping and payment, compared to their use of the internet as a tool for entertainment,
communication and information. The relatively low adoption of e-commerce activities by Chinese
consumers lags that of their Western counterparts, especially Americans.[27] (Zhao, A.L.,
Hanmer-Lloyd, S., Ward, P. and Goode, M.M.H,2008).
This recap of the Chinese market not only highlights the importance of and an
imminent need for more research on Chinese online shoppers but also implies that Internet
marketing strategies developed in Western countries may not be applicable in the Chinese
context.
2.3.2 About HUAWEI Company
The Founded HUAWEI in 1987. At the time of its establishment, HUAWEI
focused on manufacturing phone switches, but has since expanded to include building
telecommunications networks, providing operational and consulting services and equipment
to enterprises inside and outside of China, and manufacturing communications devices for
the consumer market. [34] (Ahrens, Nathaniel,2013) HUAWEI had over 170,000 employees
as of September 2017, around 76,000 of them engaged in research and development. It has
21 R&D institutes in countries including China, the United States, Canada, the United
Kingdom, Pakistan, Finland, France, Belgium, Germany, Colombia, Sweden, Ireland, India,
Russia, Israel, and Turkey. As of the end of 2018, Huawei sold 200 million smartphones. [35]
(Huawei Hits 200 Million Smartphone Sales in 2018". AnandTech,2018) They reported that
strong consumer demand for premium range smart phones helped the company reach
consumer sales in excess of $52 billion in 2018. [36] (China's Huawei eyes smartphone

34
supremacy this year after record 2018 sales". Reuters, 2018)
HUAWEI has deployed its products and services in more than 170 countries.[37]
(Vance, Ashlee; Einhorn, Bruce,15 September 2011), and as of 2011 it served 45 of the 50
largest telecommuters. HUAWEI overtook Erickson in 2012 as the largest
telecommunications-equipment manufacturer in the world and overtook Apple in 2018 as the
second-largest manufacturer of smart-phones in the world,[38] ("Who's afraid of
Huawei?". The Economist.3 August 2012) behind Samsung Electronics. It ranks 72nd on
the Fortune Global 500.
HUAWEI also produces and sells a variety of devices under its own name, such as
the IDEOS smart-phones, tablet PCs and HUAWEI Smartwatch. In 2010, HUAWEI Devices
shipped 120 million devices around the world.30 million cell phones, of which 3.3 million
units were smart phones, were shipped to markets such as Japan, the United States and
Europe.
2.3.3 Online Shopping
Advancement in the internet technology has facilitated the growth of in-home
shopping [39] (Lumpkin & Hawes, 1985). Online shopping was defined as a process that
consumers go through to purchase products or services over the internet [40] (Shim,
Quereshi, Siegel & Siegel, 2013). Online shopping includes but not limited to the use of
computers, or other mobile devices, such as mobile phones.
Online shopping is a form of electronic commerce which allows consumers to directly
buy goods or services from a seller over the Internet using a web browser. Consumers find a
product of interest by visiting the website of the retailer directly or by searching among

35
alternative vendors using a shopping search engine, which displays the same product's availability
and pricing at different e-retailers. As of 2016, consumers can shop online using a range of
different computers and devices, including desktop computers, laptops, tablet computers and
smart phones.
An online shop evokes the physical analogy of buying products or services at a regular
"bricks-and-mortar" retailer or shopping center; the process is called business-to-consumer (B2C)
online shopping. When an online store is set up to enable businesses to buy from another
businesses, the process is called business-to-business (B2B) online shopping. A typical online
store enables the consumer to browse the firm's range of products and services, view photos or
images of the products, along with information about the product specifications, features and
prices.
Online stores typically enable shoppers to use "search" features to find specific models,
brands or items. Online consumers must have access to the Internet and a valid method of
payment in order to complete a transaction, such as a credit card, an Interact-enabled debit card,
or a service such as PayPal. For physical products (e.g., paperback books or clothes), the e-trailer
ships the products to the consumer; for digital products, such as digital audio files of songs or
software, the e-trailer typically sends the file to the consumer over the Internet. The largest of
these online retailing corporations are Alibaba, Amazon.com, and eBay. [41] (The Alibaba
phenomenon". The Economics, 2013)

36
Chapter 3
Research Methodology
3.1 The Research Population
In this study, the main research population is those who live in mainland China, have online
shopping experience and have bought HUAWEI mobile phones online. There are no restrictions
on gender and age, so as to obtain more comprehensive data.
3.2 The Research Sampling Methods
Data for this study were collected as part of a larger effort to compare the attitudes and
behaviors related to Internet use and online shopping of Chinese consumers Some changes. The
questionnaire was translated and back-translated to ensure semantic consistency between Chinese
and English versions [42] (Singh, 1995) prior to per-testing.
WJX.com, a China-based company specializing in online marketing research, was
commissioned for data collection. The survey was conducted on a private web site administered
by the company. The sampling frame included e-mail addresses collected from major Internet
sites in China. Invitations to participate in the research were sent to 8,000 random addresses. A
total of 417 respondents completed the survey, representing a response rate of 5.2%.
No incentives or follow-up e-mail reminders were used to increase participation. Thus, the
sample was a product of self-selection and all the respondents should be considered as Internet

37
users. Moreover, they have online shopping experience and bought HUAWEI phones online.
Data collection lasted about one month. Respondents were screened to be at least 16 years old.
Therefore, the sampling method is based on non-probability sampling, particularly the eminence
sampling method.
3.3 The Research Variables
The research variables in this study contain of independent variable and dependent variable.
3.3.1 Independent Variable
Independent variable in this study into 4 group, that is demographics factors, lifestyle
factors, marketing mix 7P factors and technology knowledge factors.
3.3.1.1 Demographics include gender factor, age factor, occupation factor, income
factor, education factor and home town factor.
3.3.1.2 Lifestyle contain of outgoing frequency, access to information, online shopping
frequency, online shopping payment way, social networking and main use of computer.
3.3.1.3 7P Marketing Mix contain of product, price, place, promotion, people, process
and physical Evidence.
3.3.1.4 Technology Knowledge contain of normal compute Tech, work in compute,
play games in compute, shopping in Online and watch ,media ;
3.3.2 Dependent Variable
The dependent variable is containing on online shopping behavior include willingness to
buy again, like the shopping experience, recommend to others and keep buying online.

38
3.4 The Data Collection
A self-completion questionnaire was created using a tool called WJX.cn. WJX.cn is the
most popular survey website in mainland China. The main survey method of WJX.cn is to issue
questionnaires on the Internet and distribute them to the respondents through certain
communication methods. The best use of this online survey model is to collect questionnaires
from various provinces in mainland China. China is a big market. If we use the form of offline
questionnaire, we may only be able to collect data of a certain region.
The main way to collect questionnaires is to send questionnaires to every consumer who
buys HUAWEI phones through the online shops selling Huawei phones. Other questionnaires
were sent to friends, many of whom had experience in buying HUAWEI phones online. Without
any reward, it is difficult for consumers to fill in the questionnaire. I have sent a large number of
1,000 questionnaires, and only a small part of them have been collected. But what is exciting is
that there are enough consumers in mainland China and the data collected are enough to support
my research.
The questionnaire was originally edited in English. The purpose is to facilitate my
communication and modification with my supervisor. However, in mainland China,
questionnaires are distributed and collected in both Chinese and English, so that more
respondents who only know Chinese can understand the content of the questions accurately.
English is also used to ensure the rigor and accuracy of the research.
In order to get more responses, the questionnaire started with a paragraph dedicated to
explaining the nature and purpose of the research. The respondents were assured that their
contribution would be important and valuable. Also, the confidentiality and anonymity were

39
guaranteed. According to Easter by-Smith et al. (2015) [43] establishing trust is the key to a
higher level of responses, and trust in self-completion questionnaires is gained with assurance of
importance of the task and security of information. Questionnaire took about 5 minutes to
complete and required little disclosure of personal information, which are also the ways to get
more responses.
Totally 1000 questionnaires were distributed, and 417 qualified questionnaires were
returned. The group of questionnaires survey was done from 1st January, to 4th February 2019.
As can be seen from table 1, Among them Less than 19 years old 23 person.19 but less than
26 years old 117 person.26 but less than 33 years old 174 person.33 but less than 40 years old 64
person.40 and more years old 39 person. There are different age groups taking part in the survey,
but most of them are aged 19 to 33. Among them, the age group from 26 to 33 was the largest,
with 174 people taking part in the survey.
3.5 The Research Instruments
Research instrument refers to different methods through which a researcher collects data
from respondents for a research work. The term data refers to all forms of information that
researchers obtain from the participant of the study. Adedokun (2003) [44] asserts that data refers
“to any fact, observation or facts relating to the subject of the study”. There are different types of
measurement instruments that can be used by researchers for their studies; it depends on the
nature of research that is to be carried out. In this research, I use the form of questionnaire survey.
According to Aina, 2004[46]; Adedokun, 2003[44]; Avwokeni, 2006[47]; Adeniyi [45];
Researchers can collect the following types of data from respondents: Demographic information

40
or data e.g. age, sex, gender, educational background, ethnicity, religion, etc.
The questionnaire is the commonly used instrument for collecting research data from the
participants of a study. “It basically seeks the opinions of individuals in a sample or a population
on issues directly related to the objectives of the research study” [46] (Aina, L.O,2004).
The questionnaire consists of a set of structured and unstructured questions designed by
researchers to obtain data from the respondents. No research is better than its questionnaire and a
faulty questionnaire means faulty research. Hence, a questionnaire designed must be valid,
reliable and must not be bogus so that the data collected can validate the research.
3.6 The Questionnaires Design
中国网购消费者行为研究:以华为手机为研究案例
Questionnaire:问卷调查
·所有参加问卷调查的对象,均在线购买过华为产品。
·All respondents to the questionnaire had purchased HUAWEI products online.
Part-1 Demographic Factor 身份背景
1. Gender 性别
□ Male 男
□ Female 女
2. Marital Status 婚姻状况
□ Single 单身
□ Married 已婚

41
□ Divorce 离异
3. Age 年龄
□ Less than 19 years old 19岁以下
□ 19 but less than 26 19岁到 26岁
□ 26but less than 33 26岁到 33岁
□ 33 but less than 40 33岁到 40岁
□ 40 and more 大于 40岁
4. Occupation 职业
□ House-wife/Unemployed 家庭主妇/自由职业
□ Student 学生
□ Government Officers 政府工作人员
□ Private Business 企业工作人员
□ Other 其他
5. Income(RMB,RMB 1:4.8 Thai Baht) 平均每月工资
□ Less than 1000RMB 小于 1000人民币
□ 1000 but less than 5000RMB 大于 1000但小于 5000
□ 5000 but less than 10000RMB大于 5000但小于 10000
□ 10000 but less than 15000RMB 大于 10000但小于 15000
□ 15000 and more 15000以上
6. Education Level 教育水平
□ Less than Bachelor Degree 低于本科学位
□ Bachelor Degree 本科学位

42
□ Master Degree 研究生学位
□ Doctor Degree 博士学位
7. Home town 家乡
□ Big City 大城市
□ Small City 小城市
□ Rural area 乡下
Part-2 Lifestyle 个人生活方式
1. How often do you go out a week? 你一周内多久外出一次?
□ Less than 3 times 少于三次
□ 3 more but Less than 10 times
□ More than 10 times
2. What are your main sources of information? 你平时主要获取信息的途径是什么?
□ Internet 网上
□ TV 电视
□ Traditional media(Newspaper, Radio, Magazine) 传统媒体(报纸、电台、杂志)
□ We-Media 自媒体
3. How often do you buy products online? 你多久进行一次网上购物?
□ Every Week 每周
□ Every Month 每月
□ Every 3 Month 每三个月
□ Every 6 Month 每六个月
□ Rarely 很少
4. Which kind of payment terms do you prefer? 你喜欢哪种网购支付方式?

43
□ Online Payment(We-chat pay、Ali pay and other) 在线付款
□ COD(Cash on Delivery) 货到付款
□ Credit Card 信用卡支付
□ Debit Card 储蓄卡支付
□ Hire purchase 分期付款
5. Do you use social networking sites? 你会使用社交网络吗?
□ Never Used 从来不用
□ Generally not used 基本不用
□ infrequently used 不经常使用
□ frequently use 经常使用
6. What is the main use of your computer? 一般情况下你使用电脑是为了什么?
□ Work 工作
□ Study 学习
□ Entertainment 娱乐
□ Other 其他
Part-3 Marketing Mix7p (Product; Price; Place; Promotion; People; Process and Physical)
(产品;价格;地点;促销;人;过程和物理成分)
5=Strongly Agree; 4=Agree; 3=Neutral; 2=Disagree and 1=Strength Disagree
5=非常同意;4=同意;3=一般般;2=不同意;1=非常不同意
1. Product Feature 产品因素 1 2 3 4 5
1.1 Brand Name 品牌名字
1.2 Product quality 产品质量
1.3 Product Design 产品设计
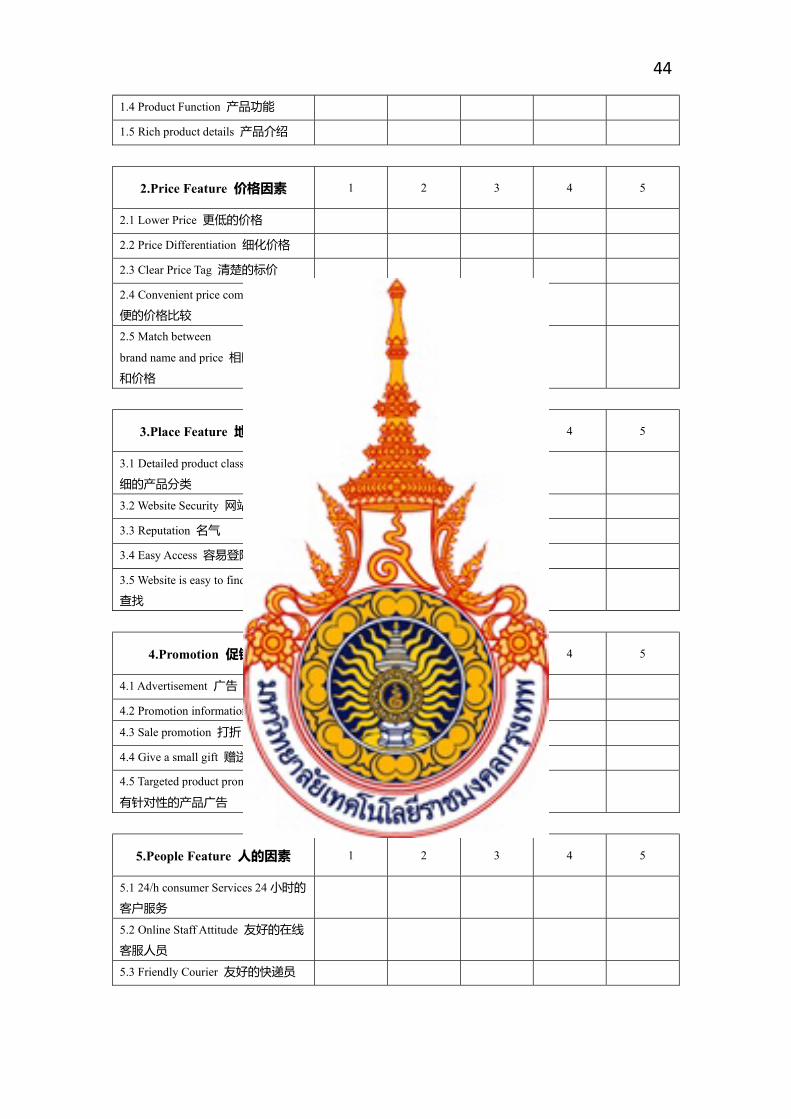
44
1.4 Product Function 产品功能
1.5 Rich product details 产品介绍
2.Price Feature 价格因素 1 2 3 4 5
2.1 Lower Price 更低的价格
2.2 Price Differentiation 细化价格
2.3 Clear Price Tag 清楚的标价
2.4 Convenient price comparison 方
便的价格比较
2.5 Match between
brand name and price 相匹配的品牌
和价格
3.Place Feature 地点因素 1 2 3 4 5
3.1 Detailed product classification 详
细的产品分类
3.2 Website Security 网站的安全
3.3 Reputation 名气
3.4 Easy Access 容易登陆
3.5 Website is easy to find 网页容易
查找
4.Promotion 促销因素 1 2 3 4 5
4.1 Advertisement 广告
4.2 Promotion information 促销信息
4.3 Sale promotion 打折
4.4 Give a small gift 赠送礼品
4.5 Targeted product promotion ads
有针对性的产品广告
5.People Feature 人的因素 1 2 3 4 5
5.1 24/h consumer Services 24小时的
客户服务
5.2 Online Staff Attitude 友好的在线
客服人员
5.3 Friendly Courier 友好的快递员

45
6.Process Feature 过程因素 1 2 3 4 5
6.1 Easy purchase interface 购买过程
便捷
6.2 Flexible payment method 多种付
款方式选择
6.3 Feedback System 有评价系统
6.4 Service process 服务过程良好
6.5 Speed of purchase process 快速购
物过程
7.Physical Evidence 物理因素 1 2 3 4 5
7.1 Smooth web server 流畅的网络
服务器
7.2 Support mobile browsing 支持移
动设备浏览
7.3 Good website UI 友好的 UI界面
7.4 consumer Privacy Protection 客户
隐私保护
7.5 Good web Design 良好的网页设
计
Part-4 Computer / Internet Knowledge Feature
电脑/网络技术因素
5=Very good; 4=Good; 3=Normal; 2=Bad and 1=Very bad
5=非常好;4=好;3=一般般;2=不好;1=非常不好
1.General Knowledge 普通技术 1 2 3 4 5
1.1 Open and Close 开关机
1.2 Running Software 运行软件
1.3 Open Website 打开网站
1.4 Search in Internet 网络搜索
1.5 Download 下载
2.Special Knowledge 特殊技术 1 2 3 4 5
2.1 Edit and Send Email 编辑发送邮
件
2.2 Use the Word/PPT/Excel 使用办

46
公软件
2.3 Play games 玩游戏
2.4 Media(YouTube/Music) 观赏多媒
体
2.5 Social networking sites 使用社交
网站
3.Online Shopping 网购知识 1 2 3 4 5
3.1 Know how to use and buy 知道如
何使用和购买
3.2 Use online payment 能够在线支
付
3.3 Use the Promotion code 使用优惠
代码
3.4 Feedback 填写评价
3.5 Return Product 能够退货
Part-5 Online purchase intention 网购购买意愿
5=Very good; 4=Good; 3=Normal; 2=Bad and 1=Very bad
5=非常好;4=好;3=一般般;2=不好;1=非常不好
5.Online purchase intention线上
购买意愿
1 2 3 4 5
5.1 If you want to buy HUAWEI
phones again, you are more likely to
buy them online. 如果要再次购买华
为手机,在线上购买的可能性较大。
5.2 You like to buy HUAWEI mobile
phones online. 您喜欢在网上购买华
为手机。
5.3 When someone asks you to buy a
HUAWEI phone, they will recommend
you to buy it online.当有人咨询您购
买华为手机时,会推荐网上购买。
5.4 In the future, you will continue to
buy HUAWEI phones online. 以后您
会继续在网上购买华为手机。

47
3.7 The Re liabilities and Validity analysis of the Questionnaires
3.7.1 The Re liabilities of the Questionnaires
To understand the reliability of questionnaire, the reliability test is needed on the
similarity of questionnaire. We generally use the alpha coefficient (Cronbach's Alpha) to measure
the reliability of questionnaire. The larger the alpha coefficient, the higher the reliability of
questionnaire, that is, the higher the credibility and stability of questionnaire. [48] (DeVellis,
R.F.,1991). proposed the following: the α coefficient value between 0.60 and 0.65 should not be
obtained; the α coefficient value between 0.65 and 0.70 is the minimum acceptable value; the α
coefficient value between 0.70 and 0.80 is good. The α coefficient value between 0.80 and 0.90
is very good.
Table 3.7.1-1: Reliability Analysis on Marketing Mix7p
item
Corrected
Item-Total
Correlation
Cronbach's
Alpha if Item
Deleted
Cronbach's
Alpha
Product
Feature
Brand Name 0.594 0.75
0.795
Product quality 0.583 0.754
Product Design 0.546 0.765
Product Function 0.563 0.76
Rich product details 0.59 0.751
Price Feature
Lower Price 0.576 0.752
0.793
Price Differentiation 0.554 0.759
Clear Price Tag 0.56 0.757
Convenient price comparison 0.561 0.757
Match between brand name and price 0.608 0.742
Place Feature
Detailed product classification 0.529 0.743
0.777
Website Security 0.531 0.742
Reputation 0.57 0.729
Easy Access 0.594 0.721
Website is easy to find 0.529 0.743

48
Promotion
Feature
Advertisement 0.488 0.725
0.755
Promotion information 0.544 0.704
Sale promotion 0.561 0.698
Give a small gift 0.535 0.707
Targeted product promotion ads 0.485 0.725
People
Feature
24/h consumer Services 0.548 0.721
0.758 Online Staff Attitude 0.631 0.634
Friendly Courier 0.592 0.673
Process
Feature
Easy purchase interface 0.582 0.761
0.799
Flexible payment method 0.57 0.764
Feedback System 0.589 0.758
Service process 0.59 0.758
Speed of purchase process 0.574 0.763
Physical
Evidence
Smooth web server 0.536 0.761
0.790
Support mobile browsing 0.562 0.753
Good website UI 0.586 0.745
consumer Privacy Protection 0.587 0.745
Good web Design 0.571 0.75
It can be seen from Table 3.7.1-1 above that the reliability of Product Feature, Price
Feature, Place Feature, Promotion Feature, People Feature, Process Feature, and Physical
Evidence are 0.795, 0.793, 0.777, 0.755, 0.758, 0.799, 0.790, respectively. All reliability is above
0.7. Moreover, the correlation between the corrected items and the totals is above 0.4, and the
reliability after deleting the items has different degrees of decline, so the 7P questionnaire has
better reliability.
Table 3.7.1-2: Reliability analysis on computer/network technology questionnaire
item
Corrected
Item-Total
Correlation
Cronbach's Alpha
if Item Deleted Cronbach's Alpha
General
Knowledge
Open and Close 0.595 0.786
0.817 Running Software 0.634 0.773
Open Website 0.662 0.766

49
Search in Internet 0.521 0.805
Download 0.63 0.775
Special
Knowledge
Edit and Send Email 0.565 0.777
0.806
Use the Word/PPT/Excel 0.593 0.769
Play games 0.612 0.763
Media(YouTube/Music) 0.627 0.759
Social networking sites 0.563 0.778
Online Shopping
Know how to use and buy 0.55 0.766
0.795
Use online payment 0.58 0.755
Use the Promotion code 0.589 0.752
Feedback 0.605 0.748
Return Product 0.561 0.761
It can be seen from Table 3.7.1-2 above that the reliability of General Knowledge,
Special Knowledge, and Online Shopping are 0.817, 0.806, and 0.795, respectively, and all
reliability is above 0.7. Moreover, the correlation between the corrected items and the totals is
above 0.5, and the reliability after deleting some items has different degrees of decline. Therefore,
the computer/network technology questionnaire has good reliability.
Table 3.7.1-3: Reliability analysis on Purchase Intention
item
Corrected
Item-Total
Correlation
Cronbach's
Alpha if
Item Deleted
Cronbach's
Alpha
Purchase
Intention
If you want to buy a HUAWEI phone, you are more likely to
buy it online 0.716 0.851
0.878 You like to buy HUAWEI mobile phones online 0.744 0.84
Recommend online to buy HUAWEI phones 0.755 0.836
In the future, you will continue to buy HUAWEI phones online 0.729 0.846
3.7.2 The Validity analysis of the Questionnaires
Validity refers to the degree to which a measurement tool or means can accurately
measure the things that need to be measured. Factor analysis is often used to test the construct
validity of the scale. First, the KMO sample sufficiency measure and the Bartlett sphere test can

50
be used to see if the data can be factored. According to [49] (Kaiser, H,1974), if KMO is above
0.90, it means that the scale is very suitable for factor analysis; if KMO is between 0.8 and 0.9, it
means that it is suitable for factor analysis; if KMO is between 0.7 and 0.8, it means that factor
analysis is passable; if KMO is between 0.6 and 0.7, it means that the factor analysis can be
carried out reluctantly; if KMO is between 0.5 and 0.6, it means that it is not suitable for factor
analysis; if KMO is below 0.5, it is very unsuitable for factor analysis. In addition, when the
statistical significance of Bartlett's Test of Sphericity is less than or equal to the significance level,
factor analysis can be performed.
This research questionnaire is designed based on the questionnaire scale of the relevant
literature, so the questionnaire has a high degree of content validity. This study will focus on the
analysis of structural validity, the method used is factor analysis. That is, exploratory factor
analysis is performed on the obtained data to initially determine its construction structure.
3.7.2.1 Reliability analysis on Marketing Mix7p
Table 3.7.2.1-1: Reliability analysis on Marketing Mix7p KMO and Bartlett's Test
Kaiser-Meyer-Olkin Measure of Sampling Adequacy. .835
Bartlett's Test of Sphericity Approx. Chi-Square 4157.983
df 528
Sig. .000
It can be seen from Table 3.7.2.1-1 that Bartlett's Test of Sphericity of the
correlation matrix of 33 items in the Marketing Mix7p questionnaire is used to obtain
Bartlettχ2=4157.983, p<0.001, indicating that there are common factors in 33 items of
Marketing Mix7p questionnaire. At the same time, the sampling appropriateness measure
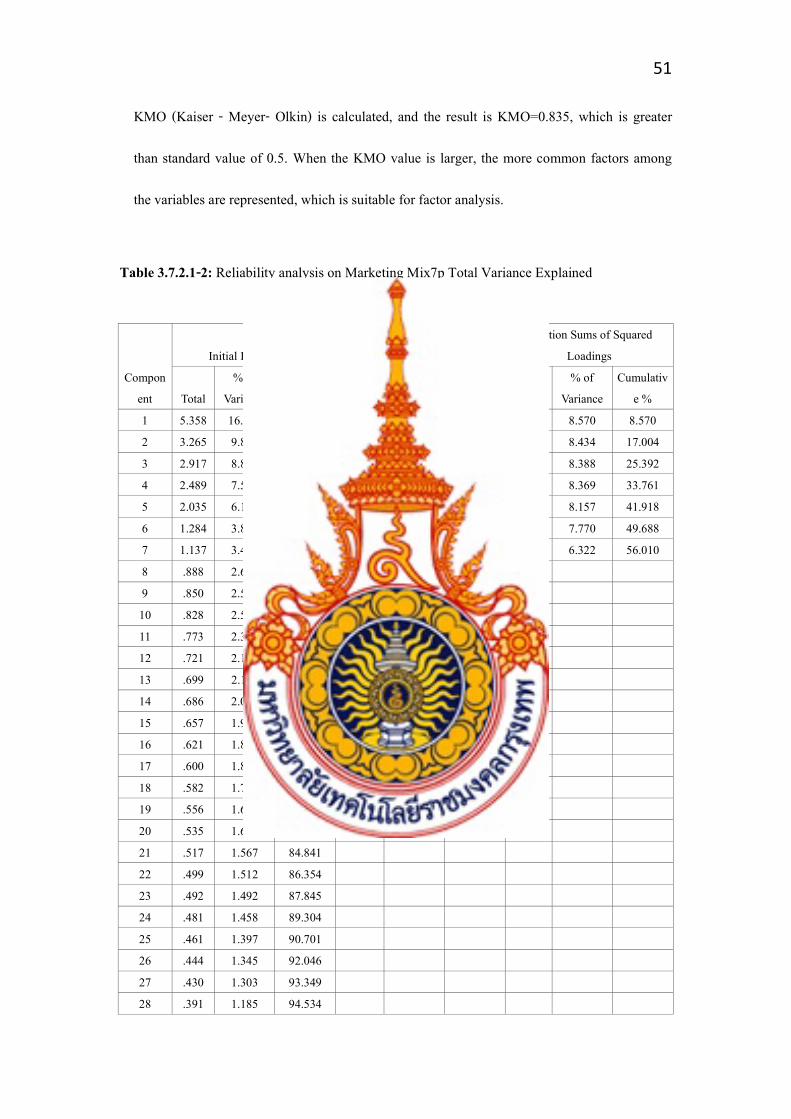
51
KMO (Kaiser - Meyer- Olkin) is calculated, and the result is KMO=0.835, which is greater
than standard value of 0.5. When the KMO value is larger, the more common factors among
the variables are represented, which is suitable for factor analysis.
Table 3.7.2.1-2: Reliability analysis on Marketing Mix7p Total Variance Explained
Compon
ent
Initial Eigenvalues
Extraction Sums of Squared
Loadings
Rotation Sums of Squared
Loadings
Total
% of
Variance
Cumulativ
e % Total
% of
Variance
Cumulativ
e % Total
% of
Variance
Cumulativ
e %
1 5.358 16.236 16.236 5.358 16.236 16.236 2.828 8.570 8.570
2 3.265 9.893 26.128 3.265 9.893 26.128 2.783 8.434 17.004
3 2.917 8.838 34.967 2.917 8.838 34.967 2.768 8.388 25.392
4 2.489 7.542 42.509 2.489 7.542 42.509 2.762 8.369 33.761
5 2.035 6.165 48.674 2.035 6.165 48.674 2.692 8.157 41.918
6 1.284 3.892 52.565 1.284 3.892 52.565 2.564 7.770 49.688
7 1.137 3.445 56.010 1.137 3.445 56.010 2.086 6.322 56.010
8 .888 2.692 58.702
9 .850 2.575 61.277
10 .828 2.510 63.787
11 .773 2.342 66.129
12 .721 2.184 68.313
13 .699 2.118 70.432
14 .686 2.079 72.511
15 .657 1.992 74.502
16 .621 1.883 76.385
17 .600 1.819 78.205
18 .582 1.765 79.969
19 .556 1.684 81.653
20 .535 1.620 83.274
21 .517 1.567 84.841
22 .499 1.512 86.354
23 .492 1.492 87.845
24 .481 1.458 89.304
25 .461 1.397 90.701
26 .444 1.345 92.046
27 .430 1.303 93.349
28 .391 1.185 94.534

52
29 .389 1.178 95.712
30 .380 1.153 96.865
31 .355 1.077 97.942
32 .354 1.071 99.013
33 .326 .987 100.000
It can be seen from Table 3.7.2.1-2 that this paper uses the commonly used
principal component analysis method to intercept factors with the characteristic root greater than
1. After factor extraction of 33 items, 7 factors were finally extracted, and cumulatively explained
variation takes up 56.010% of the total, which can explain most of the variance. Therefore,
further explanation is made that the common factor analysis of this paper is better.
Table 3.7.2.3: Reliability analysis on Marketing Mix7p Rotated Component Matrix
Component
1 2 3 4 5 6 7
Brand Name -.026 .160 .711 .167 -.060 .060 -.044
Product quality -.017 .205 .673 .222 -.045 .016 .034
Product Design -.042 .046 .735 .057 -.008 .033 -.008
Product Function .039 .107 .728 .103 -.028 -.012 .015
Rich product details -.045 .175 .714 .139 .051 -.053 .071
Lower Price .116 .681 .117 .046 -.009 .191 .113
Price Differentiation .051 .716 .103 .054 .000 .090 .054
Clear Price Tag .091 .678 .150 .013 -.006 .151 .064
Convenient price
comparison
.054 .708 .151 .046 -.037 .077 .143
Match between brand name
and price
.132 .694 .180 .031 .077 .220 .059
Detailed product
classification
-.068 -.017 -.036 .083 .656 .230 -.042
Website Security -.037 .036 -.033 .042 .702 .103 -.085
Reputation -.037 .023 -.051 .093 .744 .054 .060
Easy Access .052 .010 .060 .021 .751 .143 .017
Website is easy to find .031 -.039 -.017 .037 .712 .092 .020
Advertisement -.022 .234 -.038 .052 .153 .638 -.077
Promotion information .032 .107 -.058 .009 .106 .699 .106
Sale promotion .190 .103 .100 .045 .137 .717 .057

53
Give a small gift .017 .147 -.038 .021 .180 .651 .243
Targeted product
promotion ads
-.032 .126 .076 .017 .107 .663 .075
24/h consumer Services .022 .105 -.001 .088 -.014 .151 .760
Online Staff Attitude -.066 .138 .033 .166 -.012 .075 .808
Friendly Courier -.013 .131 .023 .072 -.012 .098 .800
Easy purchase interface .715 .214 -.031 .037 -.050 .023 -.024
Flexible payment method .728 .009 -.063 .059 -.028 .050 -.092
Feedback System .745 .101 .029 .080 -.009 -.018 .068
Service process .743 .069 -.020 .066 -.031 .084 -.003
Speed of purchase process .749 .016 .005 -.015 .057 .006 .005
Smooth web server .039 -.041 .116 .721 -.005 .101 -.070
Support mobile browsing .053 .058 .185 .687 .054 .035 .072
Good website UI .063 .048 .153 .714 .093 -.051 .131
consumer Privacy
Protection
.024 -.018 .105 .732 .094 .066 .137
Good web Design .061 .143 .085 .724 .060 -.018 .083
It can be seen from Table 3.7.2.1-3 that the extracted seven factors represent
Product Feature, Price Feature, Place Feature, Promotion Feature, People Feature, Process Feature,
and Physical Evidence. According to the recommendations of Tabachnick and Fidell [50] (2007),
when the factor load is greater than 0.71, the condition of factor load is very ideal. When the
factor load is greater than 0.63, the condition of factor load is ideal; when the factor load value is
greater than 0.55, the condition of load is better at this time; if the factor load is less than 0.32, the
condition of load is not ideal at this time. Among the five factors in this paper, the factor load is
above 0.63, indicating that the factors meet the ideal amount.In summary, the Marketing Mix7p
questionnaire has a good construct validity
3.7.2.2 Validity Analysis of Computer/Network Technology Questionnaire
Table 3.7.2.2-1: Validity Analysis of Technology Questionnaire KMO and Bartlett's Test
Kaiser-Meyer-Olkin Measure of Sampling Adequacy. .830
Bartlett's Test of Sphericity Approx. Chi-Square 1954.056

54
df 105
Sig. .000
It can be seen from Table 3.7.2.2-1that Bartlett's Test of Sphericity of the 15
items of the computer/network technology questionnaire is used to obtainer Bartlettχ2=1954.056,
p<0.001, KMO=0.830, which is suitable for the factor’s analysis.
Table 3.7.2.2-2: Total Variance Explained
Compon
ent
Initial Eigenvalues
Extraction Sums of Squared
Loadings
Rotation Sums of Squared
Loadings
Total
% of
Variance
Cumulativ
e % Total
% of
Variance
Cumulativ
e % Total
% of
Variance
Cumulativ
e %
1 3.948 26.321 26.321 3.948 26.321 26.321 2.909 19.392 19.392
2 2.774 18.494 44.816 2.774 18.494 44.816 2.847 18.981 38.372
3 1.797 11.977 56.793 1.797 11.977 56.793 2.763 18.420 56.793
4 .791 5.274 62.066
5 .711 4.743 66.809
6 .656 4.373 71.182
7 .625 4.169 75.351
8 .560 3.734 79.084
9 .535 3.567 82.651
10 .503 3.355 86.006
11 .500 3.333 89.339
12 .445 2.964 92.303
13 .435 2.898 95.200
14 .385 2.569 97.769
15 .335 2.231 100.000
It can be seen from Table 3.7.2.2-2 that this paper uses the commonly used
principal component analysis method to intercept factors with the characteristics root greater than
1. After factor extraction of 15 items, 3 factors were finally extracted, and cumulatively explained
variation takes up 56.793% of the total, which can explain most of the variances. Therefore, the
common factor analysis of this paper is better.

55
Table 3.7.2.2-3: Rotated Component Matrix a
Component
1 2 3
Open and Close .752 .019 .026
Running Software .775 .005 .073
Open Website .801 .085 .027
Search in Internet .681 .006 .072
Download .781 .022 -.012
Edit and Send Email .056 .701 .171
Use the Word/PPT/Excel .022 .761 .067
Play games .003 .753 .136
Media(YouTube/Music) -.042 .774 .138
Social networking sites .094 .699 .167
Know how to use and buy .068 .135 .698
Use online payment .082 .254 .690
Use the Promotion code .005 .096 .755
Feedback .047 .112 .761
Return Product .000 .104 .734
It can be seen from Table 3.7.2.2-3 that the extracted three factors represent
General Knowledge, Special Knowledge, and Online Shopping, respectively, and the factor load
is above 0.63, indicating that the factors are in good agreement. In summary, the
computer/network technology questionnaire has a good construction validity.
3.7.2.3 Questionnaire Validity Analysis on Purchase Intention
Table 3.7.2.3-1: Questionnaire Validity Analysis on Purchase Intention KMO and Bartlett's Test
Kaiser-Meyer-Olkin Measure of Sampling Adequacy. .820
Bartlett's Test of Sphericity Approx. Chi-Square 852.958
df 6
Sig. .000
It can be seen from Tables 3.7..2.7 that Bartlett's Test of Sphericity of four
project-related matrix of Purchase Intention Questionnaire is used to obtain Bartlett χ 2 =

56
852.958, p < 0.001, KMO = 0.820, indicating that it is suitable for factor analysis.
Table 3.7.2.3-2: Questionnaire Validity Analysis on Purchase Intention Total Variance Explained
Component
Initial Eigenvalues Extraction Sums of Squared Loadings
Total % of Variance Cumulative % Total % of Variance Cumulative %
1 2.927 73.182 73.182 2.927 73.182 73.182
2 .446 11.144 84.326
3 .340 8.500 92.826
4 .287 7.174 100.000
It can be seen from Table 3.7.2.3-2 that this paper uses the commonly used
principal component analysis method to intercept factors with the characteristic root greater than
1. After factor extraction of 4 items, one factor is finally extracted, and cumulatively explained
variation takes up 73.182% of the total, which can explain most of the variances. Therefore, the
common factor analysis of this paper is better.
Table 3.7.2.3-3: Questionnaire Validity Analysis on Purchase Intention Component Matrix
Component
1
If you want to buy a HUAWEI phone, you are more likely to buy it
online
.841
You like to buy HUAWEI mobile phones online .861
Recommend online to buy HUAWEI phones .868
In the future, you will continue to buy HUAWEI phones online .851
It can be seen from Table 3.7.2.3-3 that the extracted factor represents the
Purchase Intention factor, and the factor load is above 0.71, indicating that the factor meets the
ideal amount. In summary, the Purchase Intention Questionnaire has a good construct validity.
3.7.3 Pretest

57
With aim to increase reliability of data and measurements I conducted a pretest before
spreading the link for the questionnaire. 20 friends and Classmate agreed to participate and
provided their answers as well as feedback on the questionnaire, e.g. understanding of questions,
design, comfort while taking it.
The answers to pretest were subjected to factor analysis and the measurements were
corrected if needed. Recommendations about the questionnaire were taken into account and
problems were fixed.
3.8 The Research Analysis
For will do according specified objective of research, so our will use qualitative and
quantitative data analysis were used for the study purpose.
The data entry and analysis. By use Microsoft Excel and Statistical Package for Social
Science (SPSS)
Quantitative data analysis with the application of statistical software consists of the
following stages:
Step 1:Preparing and checking the data. Input of data into computer.
Step 2:Selecting the most appropriate tables and diagrams to use according to my research
objectives.
Step 3:Selecting the most appropriate statistics to describe my data.
Step 4:Selecting the most appropriate statistics to examine relationships and trends in my
data.[51] Saunders, M., Lewis, P. & Thornhill, A. (2012)

58
3.9 The Research Statistics
In this the research statistics use descriptive and inferential statistics methods for analysis
data and evaluate distributions, Difference analysis、ANOVA、Correlation analysis、Regression
analysis.
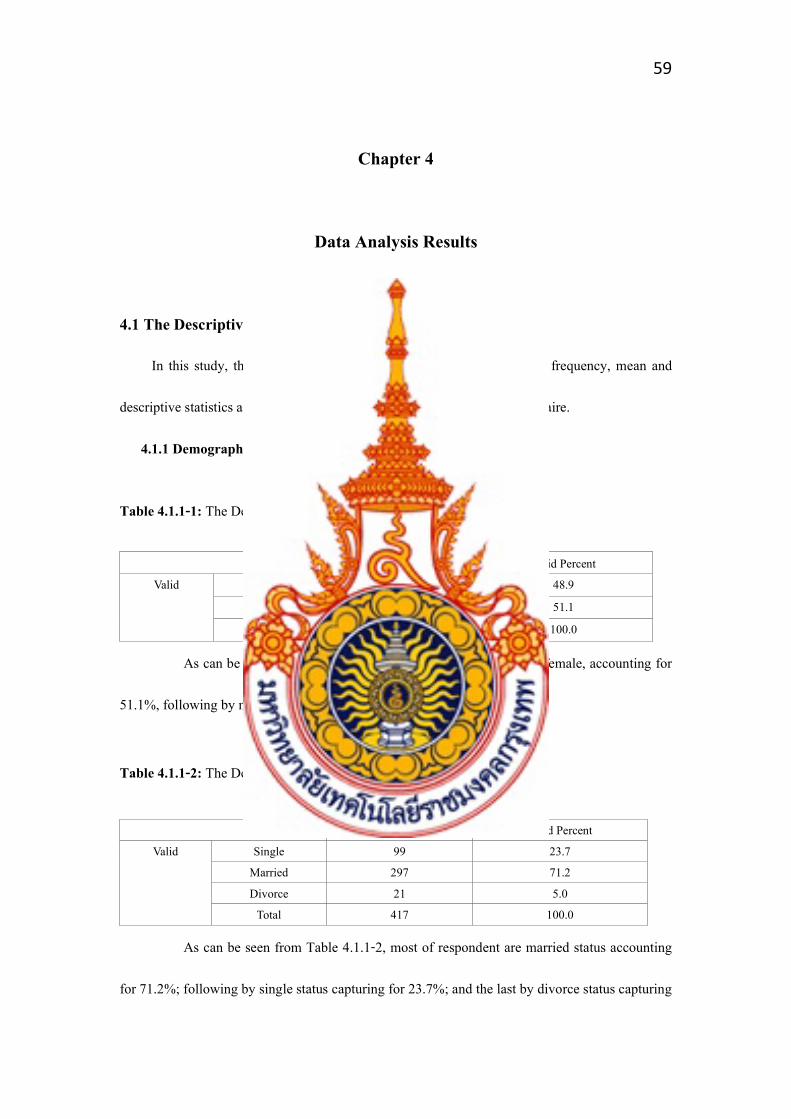
59
Chapter 4
Data Analysis Results
4.1 The Descriptive Statistics
In this study, the demographic statistic based on frequency, percent frequency, mean and
descriptive statistics are applied. The detail of the study from 417 questionnaire.
4.1.1 Demographic Factor
Table 4.1.1-1: The Descriptive Statistics of Gender
Frequency Valid Percent
Valid male 204 48.9
female 213 51.1
Total 417 100.0
As can be seen from Table 4.1.1-1, most of the respondent are female, accounting for
51.1%, following by male, capturing about 48.9%
Table 4.1.1-2: The Descriptive Statistics of Marital Status
Frequency Valid Percent
Valid Single 99 23.7
Married 297 71.2
Divorce 21 5.0
Total 417 100.0
As can be seen from Table 4.1.1-2, most of respondent are married status accounting
for 71.2%; following by single status capturing for 23.7%; and the last by divorce status capturing

60
for 5%.
Table 4.1.1-3: The Descriptive Statistics of Age
Frequency Valid Percent
Valid Less than 19 years old 23 5.5
19 but less than 26 117 28.1
26but less than 33 174 41.7
33 but less than 40 64 15.3
40 and more 39 9.4
Total 417 100.0
As can be seen from Table 4.1.1-3, most of respondent are 26 but less than 33
occupying appreciate for 41.7%; following by 19 but less than 26 occupying appreciate for 28.1%;
and the last one is the group less than 10 years old capturing only 5.5%.
Table 4.1.1-4: The Descriptive Statistics of Occupation
Frequency Valid Percent
Valid House-wife/Unemployed 78 18.7
Student 93 22.3
Government Officers 98 23.5
Private Business 128 30.7
Other 20 4.8
Total 417 100.0
As can be seen from Table 4.1.1-4, most of respondent are private business occupying
appreciate for 30.7%; following by government officers accounting for 23.5%; and the last one by
other occupation capturing only 4.8%.
Table 4.1.1-5: The Descriptive Statistics of Income
Frequency Valid Percent

61
Valid Less than 1000RMB 74 17.7
1000 but less than 5000RMB 202 48.4
5000 but less than 10000RMB 116 27.8
10000 but less than 15000RMB 25 6.0
Total 417 100.0
As can be seen from Table 4.1.1-5, most of respondent are 1000 but less than 5000
RMB occupying appreciate for 48.4%; following by 5000 but less than 10000 RMB occupying
appreciate for 27.8%; last one by 10000 but less than 15000 RMB capturing only for 6%.
Table 4.1.1-6: The Descriptive Statistics of Education
Frequency Valid Percent
Valid Less than Bachelor Degree 124 29.7
Bachelor Degree 195 46.8
Master Degree 81 19.4
Doctor Degree 17 4.1
Total 417 100.0
As can be seen from Table 4.1.1-6, most of respondent are bachelor degree occupying
appreciate for 46.8%; following by less than bachelor degree occupying appreciate for 29.7%; last
one by doctor degree capturing only 4.1%.
Table 4.1.1-7: The Descriptive Statistics of Hometown
Frequency Valid Percent
Valid Big City 63 15.1
Small City 253 60.7
Rural area 101 24.2
Total 417 100.0
As can be seen from Table 4.1.1-7, most of respondent are small city area occupying
appreciate for 60.7%; following by rural area occupying appreciate for 24.2%; last one by big city

62
area capturing only 15.1%.
4.1.2 Lifestyle Factor
Table 4.1.2-1: The Descriptive Statistics of Outgoing Frequency
Frequency Valid Percent
Valid Less than 3 times 141 33.8
3 but Less than 10 times 248 59.5
More than 10 times 28 6.7
Total 417 100.0
As can be seen from Table 4.1.2-1, most of respondent are 3 but less than 10 times
occupying appreciate for 59.5%; following by less than 3 times occupying appreciate for 33.8%;
last one by more than 10 times capturing only for 6.7%.
Table 4.1.2-2: The Descriptive Statistics of Access to Information
Frequency Valid Percent
Valid Internet 140 33.6
TV 155 37.2
Traditional media 109 26.1
We-Media 13 3.1
Total 417 100.0
As can be seen from Table 4.1.2-2, most of respondent are TV occupying appreciate
for 37.2%; following by internet occupying appreciate for 33.6%; last one by we-media capturing
only 3.1%.
Table 4.1.2-3: The Descriptive Statistics of Online Shopping Frequency
Frequency Valid Percent
Valid Every Week 110 26.4
Every Month 194 46.5
Every 3 Month 81 19.4

63
Every 6 Month 16 3.8
Rarely 16 3.8
Total 417 100.0
As can be seen from Table 4.1.2-3, most of respondent are every month occupying
appreciate for 46.5%; following by every week occupying appreciate for 26.4%; last one by every
6 month and rarely capturing same for 3.8%.
Table 4.1.2-4: The Descriptive Statistics of Online Shopping Payment
Frequency Valid Percent
Valid Online Payment 104 24.9
COD 132 31.7
Credit Card 117 28.1
Debit Card 49 11.8
Hire purchase 15 3.6
Total 417 100.0
As can be seen from Table 4.1.2-4,most of respondent are COD occupying
appreciate for 31.7%; following by online payment occupying appreciate for 24.9%; last one by
hire purchase capturing for 3.6%.
Table 4.1.2-5: The Descriptive Statistics of Social Networking
Frequency Valid Percent
Valid Never use 89 21.3
Generally, not used 100 24.0
infrequently used 130 31.2
frequently use 98 23.5
Total 417 100.0
As can be seen from Table 4.1.2-5, most of respondent are infrequently used
occupying appreciate for 31.2%; following by generally not used occupying appreciate for 24%;
last one by never use capturing for 21.3%.

64
Table 4.1.2-6: The Descriptive Statistics of Main use of Compute
Frequency Valid Percent
Valid work 127 30.5
study 107 25.7
entertainment 148 35.5
Other 35 8.4
Total 417 100.0
As can be seen from Table 4.1.2 6, most of respondent are entertainment occupying
appreciate for 35.5%; following by work occupying appreciate 30.5%; last one by other main use
capturing only 8.4%.
4.1.3 Marketing Mix 7P Factor
Table 4.1.3-1: The Descriptive Statistics of Product Factor
Strength
Disagree Disagree Neutral Agree
Strongly
Agree MEAN SD RANKING
Product
Feature1 22(5.3%) 39(9.4%) 108(25.9%) 176(42.2%) 72(17.3%) 3.568 1.047 4
Product
Feature2 6(1.4%) 53(12.7%) 138(33.1%) 150(36%) 70(16.8%) 3.540 0.963 5
Product
Feature3 10(2.4%) 38(9.1%) 130(31.2%) 151(36.2%) 88(21.1%) 3.645 0.990 3
Product
Feature4 10(2.4%) 41(9.8%) 104(24.9%) 179(42.9%) 83(19.9%) 3.681 0.979 2
Product
Feature5 9(2.2%) 39(9.4%) 114(27.3%) 161(38.6%) 94(22.5%) 3.700 0.990 1
Product
Feature 3.627 0.737
From Table 4.1.3-1, Product Feature 5 is the most important feature with the mean of
3.7; following by Product Feature 4 with the mean of 3.681; last one is Product Feature 2 with the
mean of 3.540.All of the respondents ‘opinions on product feature are on the agree level evident

65
by the means ranking from 3.540 to 3.700.
Table 4.1.3-2: The Descriptive Statistics of Price Factor
Strength
Disagree Disagree Neutral Agree
Strongly
Agree MEAN SD
RANKIN
G
Price
Feature 1 14(3.4%) 35(8.4%) 108(25.9%) 179(42.9%) 81(19.4%) 3.667 0.9911 3
Price
Feature 2 8(1.9%) 44(10.6%) 150(36%) 165(39.6%) 50(12%) 3.492 0.9043 5
Price
Feature 3 9(2.2%) 39(9.4%) 112(26.9%) 171(41%) 86(20.6%) 3.686 0.973 1
Price
Feature 4 8(1.9%) 42(10.1%) 126(30.2%) 168(40.3%) 73(17.5%) 3.614 0.952 4
Price
Feature 5 11(2.6%) 36(8.6%) 114(27.3%) 173(41.5%) 83(19.9%) 3.674 0.975 2
Price
Feature 3.626 0.709
From Table 4.1.3-2, Price Feature 3 is the most important feature with the mean of
3.686; following by Price Feature 5 math the mean of 3.674; last one is Product Feature 3 with
the mean of 3.686. All of the respondents ‘opinions on price feature are on the agree level evident
by the means ranking from 3.492 to 3.686.
Table 4.1.3-3: The Descriptive Statistics of Place Factor
Strength
Disagree Disagree Neutral Agree
Strongly
Agree MEAN SD
RANKIN
G
Place
Feature1 13(3.1%) 36(8.6%) 121(29%) 158(37.9%) 89(21.3%) 3.657 1.007 2

66
Place
Feature2 9(2.2%) 44(10.6%) 128(30.7%) 174(41.7%) 62(14.9%) 3.566 0.941 5
Place
Feature3 6(1.4%) 41(9.8%) 130(31.2%) 161(38.6%) 79(18.9%) 3.638 0.946 3
Place
Feature4 6(1.4%) 39(9.4%) 132(31.7%) 169(40.5%) 71(17%) 3.624 0.922 4
Place
Feature5 11(2.6%) 40(9.6%) 113(27.1%) 169(40.5%) 84(20.1%) 3.659 0.990 1
Place
Feature 3.629 0.699
From Table 4.1.3-3, Place Feature 5is the most important feature with the mean of
3.659; following by Place Feature 1 with the mean of 3.657; last one is Place Feature 2 with the
mean of 3.566. All of the respondents ‘opinions on place feature are on the agree level evident by
the means ranking from 3.566 to 3.659.
Table 4.1.3-4: The Descriptive Statistics of Promotion Factor
Strength
Disagree Disagree Neutral Agree
Strongly
Agree MEAN SD RANKING
Promotion1 15(3.6%) 38(9.1%) 115(27.6%) 167(40%) 82(19.7%) 3.631 1.0133 2
Promotion2 9(2.2%) 46(11%) 136(32.6%) 166(39.8%) 60(14.4%) 3.532 0.9429 5
Promotion3 8(1.9%) 32(7.7%) 140(33.6%) 164(39.3%) 73(17.5%) 3.628 0.924 3
Promotion4 10(2.4%) 39(9.4%) 128(30.7%) 162(38.8%) 78(18.7%) 3.621 0.971 4
Promotion5 11(2.6%) 32(7.7%) 119(28.5%) 161(38.6%) 94(22.5%) 3.707 0.986 1
Promotion 3.624 0.688
From Table 4.1.3-4, Promotion Feature 5 is the most important feature with the mean
of 3.707; following by Promotion Feature 1 with the mean of 3.631; last one is Promotion Feature
2 with the mean of 3.532. All of the respondents ‘opinions on promotion feature are on the agree

67
level evident by the means ranking from 3.532 to 3.707.
Table 4.1.3-5: The Descriptive Statistics of People Factor
From Table 4.1.3-5, People Feature 1 is the most important feature math the mean of
3.676; following by People Feature 3 with the mean of 3.573; last one is People Feature 2 with
the mean of 3.506. All of the respondents ‘opinions on people feature are on the agree level
evident by the means ranking from 3.506 to 3.676.
Table 4.1.3-6: The Descriptive Statistics of Process Factor
Strength
Disagree Disagree Neutral Agree
Strongly
Agree MEAN SD
RANKIN
G
Process
Feature1 13(3.1%) 48(11.5%) 103(24.7%) 166(39.8%) 87(20.9%) 3.638 1.034 4
Process
Feature2 9(2.2%) 47(11.3%) 133(31.9%) 165(39.6%) 63(15.1%) 3.542 0.953 5
Strength
Disagree Disagree Neutral Agree
Strongly
Agree MEAN SD
RANKIN
G
People Feature1 6(1.4%) 37(8.9%) 125(30%) 167(40%) 82(19.7%) 3.676 0.9371 1
People Feature2 6(1.4%) 37(8.9%) 156(37.4%) 176(42.2%) 42(10.1%) 3.506 0.8467 3
People Feature3 10(2.4%) 42(10.1%) 138(33.1%) 153(36.7%) 74(17.7%) 3.573 0.973 2
People Feature 3.587 0.755

68
Process
Feature3 5(1.2%) 36(8.6%) 138(33.1%) 151(36.2%) 87(20.9%) 3.669 0.941 2
Process
Feature4 13(3.1%) 34(8.2%) 116(27.8%) 177(42.4%) 77(18.5%) 3.650 0.974 3
Process
Feature5 7(1.7%) 38(9.1%) 107(25.7%) 175(42%) 90(21.6%) 3.727 0.957 1
Process Feature 3.645 0.724
From Table 4.1.3-6, Process Feature 5 is the most important feature with the mean of
3.727; following by Process Feature 3 with the mean of 3.669; last one is Process Feature 2 with
the mean of 3.542. All of the respondents ‘opinions on process feature are on the agree level
evident by the means ranking from 3.650 to 3.727.
Table 4.1.3-7: The Descriptive Statistics of Physical Evidence Factor
Strength
Disagree Disagree Neutral Agree
Strongly
Agree MEAN SD
RANKIN
G
Physical
Evidence1 9(2.2%) 34(8.2%) 111(26.6%) 164(39.3%) 99(23.7%) 3.743 0.980 1
Physical
Evidence2 6(1.4%) 47(11.3%) 125(30%) 178(42.7%) 61(14.6%) 3.578 0.922 5
Physical
Evidence3 6(1.4%) 37(8.9%) 136(32.6%) 144(34.5%) 94(22.5%) 3.679 0.967 3
Physical
Evidence4 9(2.2%) 31(7.4%) 128(30.7%) 172(41.2%) 77(18.5%) 3.664 0.934 4
Physical
Evidence5 12(2.9%) 27(6.5%) 126(30.2%) 169(40.5%) 83(19.9%) 3.681 0.959 2
Physical Evidence 3.669 0.703
From Table 4.1.3-7, Physical Evidence Feature 1 is the most important feature with
the mean of 3.743; following by Physical Evidence Feature 5 with the mean of 3.681; last one is
Physical Evidence Feature 2 with the mean of 3.578. All of the respondents ‘opinions on physical

69
evidence feature are on the agree level evident by the means ranking from 3.566 to 3.659.
Table 4.1.3-8: The Descriptive Statistics of Total Marketing Mix 7p Factor
From Table 4.1.3-8, Physical Evidence Feature is the most important feature with the
mean of 3.669; following by Process Feature with the mean of 3.645; last one is People Feature
with the mean of 3.587 All of the respondents ‘opinions on Marketing Mix 7Ps feature are on the
agree level evident by the means ranking from 3.626 to 3.669.
4.1.4 Computer/Internet Technology Knowledge Factor
Table 4.1.4-1: The Descriptive Statistics of General Knowledge
Strength
Disagree Disagree Neutral Agree
Strongly
Agree MEAN SD RANKING
7P MEAN SD RANKING
PRODUCT 3.627 0.737 4
PRICE 3.626 0.709 5
PLACE 3.629 0.699 3
PROMOTION 3.624 0.688 6
PROPLE 3.587 0.755 7
PROCESS 3.645 0.724 2
PHYSICAL EVIDENCE 3.669 0.773 1

70
General
Knowledge1 15(3.6%) 36(8.6%) 100(24%) 162(38.8%) 104(24.9%) 3.729 1.0428 1
General
Knowledge2 11(2.6%) 51(12.2%) 128(30.7%) 162(38.8%) 65(15.6%) 3.525 0.983 5
General
Knowledge3 6(1.4%) 40(9.6%) 107(25.7%) 175(42%) 89(21.3%) 3.722 0.953 2
General
Knowledge4 6(1.4%) 31(7.4%) 127(30.5%) 174(41.7%) 79(18.9%) 3.693 0.910 4
General
Knowledge5 11(2.6%) 35(8.4%) 119(28.5%) 149(35.7%) 103(24.7%) 3.715 1.013 3
General
Knowledge 3.677 0.746
From Table 4.1.4-1, General Knowledge Feature 1 is the most important feature math
the mean of 3.729; following by General Knowledge 3 with the mean of 3.722; last one is
General Knowledge 2 with the mean of 3.525. All of the respondents ‘opinions on place feature
are on the agree level evident by the means ranking from 3.525 to 3.729.
Table 4.1.4-2: The Descriptive Statistics of Special Knowledge
Strength
Disagree Disagree Neutral Agree
Strongly
Agree MEAN SD RANKING
Special
Knowledge1 13(3.1%) 32(7.7%) 110(26.4%) 170(40.8%) 92(22.1%) 3.710 0.995 1
Special
Knowledge2 7(1.7%) 52(12.5%) 138(33.1%) 152(36.5%) 68(16.3%) 3.532 0.963 5
Special
Knowledge3 19(4.6%) 38(9.1%) 132(31.7%) 146(35%) 82(19.7%) 3.561 1.048 4
Special
Knowledge4 5(1.2%) 41(9.8%) 121(29%) 170(40.8%) 80(19.2%) 3.669 0.936 2
Special
Knowledge5 16(3.8%) 26(6.2%) 118(28.3%) 178(42.7%) 79(18.9%) 3.667 0.979 3
Special
Knowledge 3.628 0.739
From Table 4.1.4-2, Special Knowledge Feature 1 is the most important feature with
the mean of 3.710; following by Special Knowledge 4 math the mean of 3.669; last one is Special

71
Knowledge 2 with the mean of 3.532. All of the respondents ‘opinions on place feature are on the
agree level evident by the means ranking from 3.532 to 3.710.
Table 4.1.4-3: The Descriptive Statistics of Online Shopping
Strength
Disagree Disagree Neutral Agree
Strongly
Agree MEAN SD RANKING
Online
Shopping1 18(4.3%) 35(8.4%) 99(23.7%) 163(39.1%) 102(24.5%) 3.710 1.061 1
Online
Shopping2 9(2.2%) 36(8.6%) 131(31.4%) 178(42.7%) 63(15.1%) 3.600 0.920 5
Online
Shopping3 5(1.2%) 42(10.1%) 134(32.1%) 154(36.9%) 82(19.7%) 3.638 0.949 4
Online
Shopping4 9(2.2%) 29(7%) 129(30.9%) 179(42.9%) 71(17%) 3.657 0.915 3
Online
Shopping5 14(3.4%) 36(8.6%) 108(25.9%) 169(40.5%) 90(21.6%) 3.683 1.012 2
Online Shopping 3.658 0.721
From Table 4.1.4-3, Online shopping Knowledge Feature 1 is the most important
feature with the mean of 3.710; following by Online Shopping Knowledge 5 with the mean of
3.683; last one is Online Shopping Knowledge 2 with the mean of 3.600. All of the respondents
‘opinions on place feature are on the agree level evident by the means ranking from 3.600 to
3.710.
Table 4.1.4-4: The Descriptive Statistics of Total Technology Knowledge Factor
MEAN SD RANKING
GENERAL KNOWLEDGE 3.677 0.739 1

72
From Table 4.1.4-4, General Knowledge Feature Mean is the most important feature
with the mean of 3.677; following by Online Shopping Knowledge with the mean of 3.658; last
one is Special Knowledge with the mean of 3.628 .All of the respondents ‘opinions on place
feature are on the agree level evident by the means ranking from 3.628 to 3.677.
4.1.5 Online Shopping Intention
Table 4.1.5: The Descriptive Statistics of Online Shopping Intention
Strength
Disagree Disagree Neutral Agree
Strongly
Agree MEAN SD
RANKIN
G
Purchase Intention1 1(0.2%) 23(5.5%) 105(25.2%) 183(43.9%) 105(25.2%) 3.882 0.8566 1
Purchase Intention2 5(1.2%) 27(6.5%) 123(29.5%) 187(44.8%) 75(18%) 3.719 0.8746 2
Purchase Intention3 1(0.2%) 36(8.6%) 164(39.3%) 159(38.1%) 57(13.7%) 3.564 0.8415 4
Purchase Intention4 6(1.4%) 31(7.4%) 133(31.9%) 178(42.7%) 69(16.5%) 3.655 0.891 3
Purchase Intention 3.658 0.721
From Table 4.1.5, Purchase Feature 1 is the most important feature with the mean of 3.82;
following by Purchase Intention 2 math the mean of 3.719; last one is Purchase Intention 3 with
the mean of 3.564. All of the respondents ‘opinions on place feature are on the agree level evident
by the means ranking from 3.525 to 3.564.
SPECIAL KNOWLEDGE 3.628 0.915 3
ONLINE SHOPPING 3.658 0.721 2

73
4.2 The Inferential statistics
In the questionnaire analysis, the commonly used difference test is the independent sample
t-test and one-way ANOVA. The t-test statistical method is applicable to the difference test of
two means. The applicable one is that the independent variable is a two-point discrete variable
and the dependent variable is a continuous variable. The one-way ANOVA is applicable to the
difference test of the average between three or more groups. In this survey, gender is a two-point
discrete variable, marital status, age, occupation, monthly income, education, hometown, times of
going out, access to information, times of online shopping, payment methods, common social
networking sites, and the main purpose of computers are more-than-three population variables.
Therefore, independent sample t-test and one-way ANOVA were used to test whether there are
differences in Purchase Intention factors.
4.2.1 The Impact of Demographic Factor on Online Purchase Intention
4.2.1.1 Different in Gender Generates Differences in Online Shopping Behavior
Table 4.2.1.1: Different in Gender Independent Samples Test
Gender N Mean Std. Deviation T-value P-value
Purchase
Intention
male 204 3.813 0.748 2.926 0.004
female 213 3.602 0.721
H0: μ1 = μ 2
Hi: μ1 ≠ μ2
It can be seen from Table 4.2.1.1 that the p-value is about 0.004. That is less
than the critical value of 0.05. Therefore, the H1 is accepted.
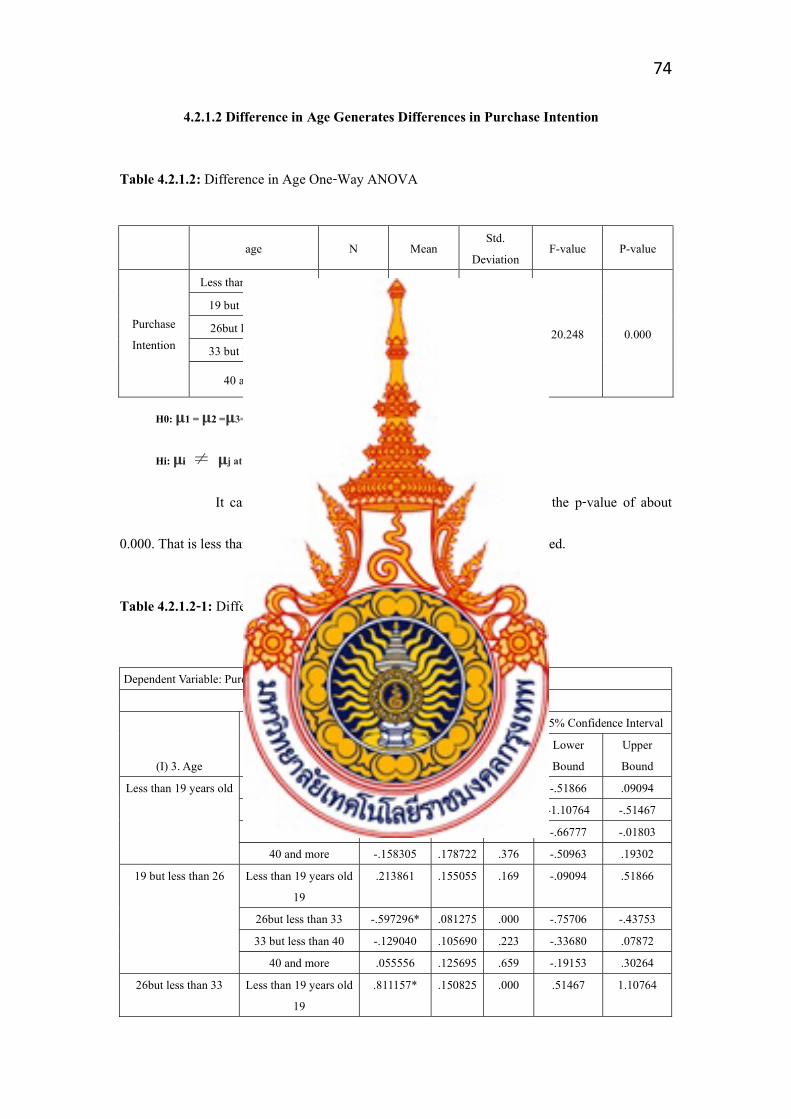
74
4.2.1.2 Difference in Age Generates Differences in Purchase Intention
Table 4.2.1.2: Difference in Age One-Way ANOVA
age N Mean Std.
Deviation F-value P-value
Purchase
Intention
Less than 19 years old 23 3.239 0.770
20.248 0.000
19 but less than 26 117 3.453 0.638
26but less than 33 174 4.050 0.666
33 but less than 40 64 3.582 0.772
40 and more 39 3.397 0.646
H0: μ1 = μ2 =μ3=μ4=μ5
Hi: μi ≠ μj at last one Pair
It can be seen from Table 4.2.1.2 that the evident from the p-value of about
0.000. That is less than the critical value of 0.05. Therefore, the H1 is accepted.
Table 4.2.1.2-1: Difference in Age Multiple Comparisons
Dependent Variable: Purchase Intention
LSD
(I) 3. Age (J) 3. Age
Mean
Difference
(I-J)
Std.
Error Sig.
95% Confidence Interval
Lower
Bound
Upper
Bound
Less than 19 years old 19 but less than 26 -.213861 .155055 .169 -.51866 .09094
26but less than 33 -.811157* .150825 .000 -1.10764 -.51467
33 but less than 40 -.342901* .165267 .039 -.66777 -.01803
40 and more -.158305 .178722 .376 -.50963 .19302
19 but less than 26 Less than 19 years old
19
.213861 .155055 .169 -.09094 .51866
26but less than 33 -.597296* .081275 .000 -.75706 -.43753
33 but less than 40 -.129040 .105690 .223 -.33680 .07872
40 and more .055556 .125695 .659 -.19153 .30264
26but less than 33 Less than 19 years old
19
.811157* .150825 .000 .51467 1.10764

75
19 but less than 26 .597296* .081275 .000 .43753 .75706
33 but less than 40 .468256* .099381 .000 .27290 .66361
40 and more .652851* .120438 .000 .41610 .88960
33 but less than 40 Less than 19 years old
19
.342901* .165267 .039 .01803 .66777
19 but less than 26 .129040 .105690 .223 -.07872 .33680
26but less than 33 -.468256* .099381 .000 -.66361 -.27290
40 and more .184595 .138094 .182 -.08686 .45605
40 and more Less than 19 years old
19
.158305 .178722 .376 -.19302 .50963
19 but less than 26 -.055556 .125695 .659 -.30264 .19153
26but less than 33 -.652851* .120438 .000 -.88960 -.41610
33 but less than 40 -.184595 .138094 .182 -.45605 .08686
*. The mean difference is significant at the 0.05 level.
Table 4.2.1.2 shows the mean and standard deviation of online shopping
behavior of people at different ages. With respect to multiple comparisons analysis, the age group
of less than 19 years old, is different from the group of age group of 26 but less than 33. And the
age group 33 but less than 40, For the 2 groups, it is formed and most to be affect.
4.2.1.3 Difference in Occupation Factor Differences in Purchase Intention
Table 4.2.1.3: Difference in Occupation Factor One-Way ANOVA
Occupation N Mean Std.
Deviation F-value P-value
Purchase
Intention
House-wife/Unemploye
d 78 3.330 0.785
16.587 0.000
Student 93 3.651 0.741
Government Officers 98 4.145 0.645
Private Business 128 3.676 0.622
Other 20 3.450 0.691
H0: μ1 = μ2 =μ3=μ4=μ5
Hi: μi ≠ μj at last one Pair
It can be seen from Table 4.2.1.3 that the evident from the p-value of about

76
0.000. That is less than the critical value of 0.05. Therefore, the H1 is accepted.
Table 4.2.1.3-1: Difference in Occupation Multiple Comparisons
Dependent Variable: Purchase Intention
LSD
(I) 4. Occupation (J) 4. Occupation
Mean
Difference
(I-J)
Std.
Error Sig.
95% Confidence Interval
Lower
Bound
Upper
Bound
House-wife/Unemplo
yed
Student -.320409* .106051 .003 -.52888 -.11194
Government Officers -.815280* .104809 .000 -1.02131 -.60925
Private Business -.345653* .099217 .001 -.54069 -.15062
Other -.119872 .173123 .489 -.46019 .22044
Student House-wife/Unemplo
yed
.320409* .106051 .003 .11194 .52888
Government Officers -.494871* .099992 .000 -.69143 -.29831
Private Business -.025244 .094114 .789 -.21025 .15976
Other .200538 .170250 .240 -.13413 .53520
Government Officers House-wife/Unemplo
yed
.815280* .104809 .000 .60925 1.02131
Student .494871* .099992 .000 .29831 .69143
Private Business .469627* .092713 .000 .28738 .65188
Other .695408* .169479 .000 .36226 1.02856
Private Business House-wife/Unemplo
yed
.345653* .099217 .001 .15062 .54069
Student .025244 .094114 .789 -.15976 .21025
Government Officers -.469627* .092713 .000 -.65188 -.28738
Other .225781 .166079 .175 -.10069 .55225
Other House-wife/Unemplo
yed
.119872 .173123 .489 -.22044 .46019
Student -.200538 .170250 .240 -.53520 .13413
Government Officers -.695408* .169479 .000 -1.02856 -.36226
Private Business -.225781 .166079 .175 -.55225 .10069
*. The mean difference is significant at the 0.05 level.
Table 4.2.1.3-1 shows the mean and standard deviation of Purchase Intention of
people in different occupations; with respect to the House-wife/Unemployed, it is different from
the group of occupation the government officers. For the student, it is different from the group of

77
occupation the government officers. For the government officers, it is different from the group of
occupation other occupation. For the private business, it is the different from the group of
occupation the government officers. For the other occupation, it is differencing the government
officers.
4.2.1.4 Difference in Marital Status Factor Differences in Purchase Intention
Table 4.2.1.4: Difference in Marital Status Factor One-Way ANOVA
Marital Status N Mean Std.
Deviation F-value P-value
Purchase
Intention
Single 99 3.601 0.691
1.357 0.259 Married 297 3.733 0.760
Divorce 21 3.798 0.669
H0: μ1 = μ2 =μ3
Hi: μi ≠ μj at last one Pair
It can be seen from Table 4.2.1.4 that the evident from the p-value of about
0.259. That is more than the critical value of 0.05. Therefore, the H0 is accepted.
Table 4.2.1.4-1: Difference in Marital Status Factor Multiple Comparisons
Dependent Variable: Purchase Intention
LSD
(I) 2. Marital
Status
(J) 2. Marital
Status
Mean
Difference
(I-J) Std. Error Sig.
95% Confidence Interval
Lower Bound Upper Bound
Single Married -.132155 .085883 .125 -.30098 .03667
Divorce -.196609 .177795 .269 -.54610 .15289
Married Single .132155 .085883 .125 -.03667 .30098
Divorce -.064454 .167103 .700 -.39293 .26402
Divorce Single .196609 .177795 .269 -.15289 .54610
Married .064454 .167103 .700 -.26402 .39293

78
Table 4.2.1.4 shows the mean and standard deviation of Purchase Intention of
people in different marital status; after one-way ANOVA, with respect to the single status、
married status and divorce status is no significant difference in purchase intention of people in
different marital status.
4.2.1.5 Difference in Income Generates Differences in Purchase Intention
Table 4.2.1.5: Difference in Income One-Way ANOVA
Average income per
month N Mean
Std.
Deviation F-value P-value
Purchase
Intention
Less than 1000RMB 74 3.412 0.833
16.587 0.000
1000 but less than
5000RMB 202 3.609 0.666
5000 but less than
10000RMB 116 4.114 0.630
10000 but less than
15000RMB 25 3.450 0.750
H0: μ1 = μ2 =μ3=μ4=μ5
Hi: μi ≠ μj at last one Pair
It can be seen from Table 4.2.1.5 that the evident from the p-value of about 0.000.
That is less than the critical value of 0.05. Therefore, the H1 is accepted.
Table 4.2.1.5-1: Difference in Income Multiple Comparisons
Dependent Variable: Purchase Intention
LSD
(I) 5. Average income
per month
(J) 5. Average income
per month
Mean
Difference
(I-J)
Std.
Error Sig.
95% Confidence Interval
Lower
Bound
Upper
Bound
Less than 1000RMB 1000 but less than
5000RMB
-.196749* .094312 .038 -.38214 -.01136

79
5000 but less than
10000RMB
-.702062* .103261 .000 -.90504 -.49908
10000 but less than
15000RMB
-.037838 .160560 .814 -.35345 .27778
1000 but less than
5000RMB
Less than 1000RMB .196749* .094312 .038 .01136 .38214
5000 but less than
10000RMB
-.505313* .080856 .000 -.66425 -.34637
10000 but less than
15000RMB
.158911 .147154 .281 -.13035 .44817
5000 but less than
10000RMB
Less than 1000RMB .702062* .103261 .000 .49908 .90504
1000 but less than
5000RMB
.505313* .080856 .000 .34637 .66425
10000 but less than
15000RMB
.664224* .153044 .000 .36338 .96507
10000 but less than
15000RMB
Less than 1000RMB .037838 .160560 .814 -.27778 .35345
1000 but less than
5000RMB
-.158911 .147154 .281 -.44817 .13035
5000 but less than
10000RMB
-.664224* .153044 .000 -.96507 -.36338
*. The mean difference is significant at the 0.05 level.
Table 4.2.1.5 shows the mean and standard deviation of Purchase Intention of
people with different monthly incomes; after the one-way ANOVA, with respect to the income
group less than 1000RMB, it is different from the group of income between the 5000 but less than
10000RMB. For the income group 1000 but less than 5000RMB, it is different from the group of
income between 5000 but less than 10000RMB. For the income group 5000 but less than
10000RMB, it is different from the group of income between other income group. For the income
group 10000 but less than 15000RMB, it is different from the group of income between the 5000
but less than 10000RMB.
4.2.1.6 Difference in Education Level Generates Differences in Purchase Intention\
Table 4.2.1.6: Difference in Education Level One-Way ANOVA
Education Level N Mean Std. F-value P-value

80
Deviation
Purchase
Intention
Less than Bachelor
Degree 124 3.369 0.749
18.288 0.000 Bachelor Degree 195 3.747 0.709
Master Degree 81 4.093 0.603
Doctor Degree 17 3.824 0.611
H0: μ1 = μ2 =μ3=μ4
Hi: μi ≠ μj at last one Pair
It can be seen from Table 4.2.1.6 that the evident from the p-value of about
0.000. That is less than the critical value of 0.05. Therefore, the H1 is accepted.
Table 4.2.1.6-1: Difference in Education Level Multiple Comparisons
Table 4.2.1.6 shows the mean and standard deviation of Purchase Intention of
Dependent Variable: Purchase Intention
LSD
(I) 6. Education Level (J) 6. Education Level
Mean
Difference
(I-J)
Std.
Error Sig.
95% Confidence Interval
Lower
Bound
Upper
Bound
Less than Bachelor
Degree
Bachelor Degree -.378484* .080220 .000 -.53618 -.22079
Master Degree -.723641* .099779 .000 -.91978 -.52750
Doctor Degree -.454578* .180631 .012 -.80965 -.09951
Bachelor Degree Less than Bachelor
Degree
.378484* .080220 .000 .22079 .53618
Master Degree -.345157* .092323 .000 -.52664 -.16367
Doctor Degree -.076094 .176621 .667 -.42328 .27110
Master Degree Less than Bachelor
Degree
.723641* .099779 .000 .52750 .91978
Bachelor Degree .345157* .092323 .000 .16367 .52664
Doctor Degree .269063 .186322 .149 -.09719 .63532
Doctor Degree Less than Bachelor
Degree
.454578* .180631 .012 .09951 .80965
Bachelor Degree .076094 .176621 .667 -.27110 .42328
Master Degree -.269063 .186322 .149 -.63532 .09719
*. The mean difference is significant at the 0.05 level.
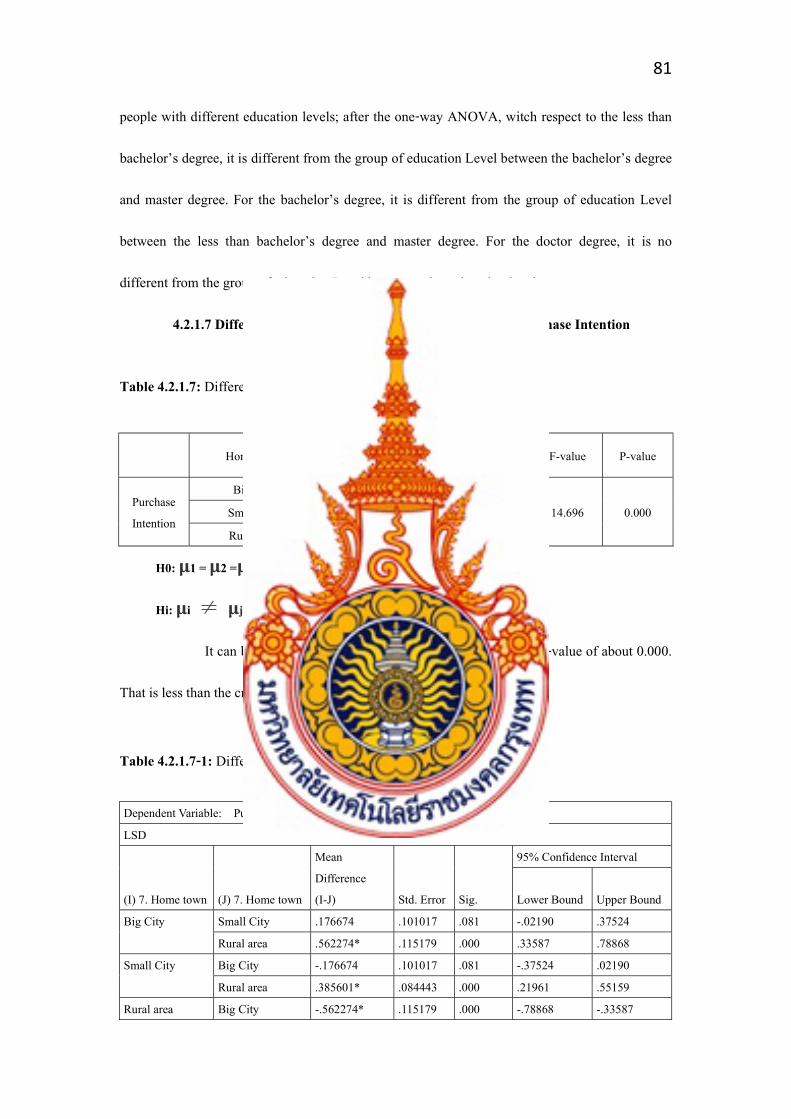
81
people with different education levels; after the one-way ANOVA, witch respect to the less than
bachelor’s degree, it is different from the group of education Level between the bachelor’s degree
and master degree. For the bachelor’s degree, it is different from the group of education Level
between the less than bachelor’s degree and master degree. For the doctor degree, it is no
different from the group of education Level between other education level.
4.2.1.7 Difference in Hometown Generates Differences in Purchase Intention
Table 4.2.1.7: Difference in Hometown One-Way ANOVA
Home town N Mean Std.
Deviation F-value P-value
Purchase
Intention
Big City 63 3.948 0.712
14.696 0.000 Small City 253 3.772 0.692
Rural area 101 3.386 0.781
H0: μ1 = μ2 =μ3
Hi: μi ≠ μj at last one Pair
It can be seen from Table 4.2.1.7 that the evident from the p-value of about 0.000.
That is less than the critical value of 0.05. Therefore, the H1 is accepted.
Table 4.2.1.7-1: Difference in Hometown Multiple Comparisons
Dependent Variable: Purchase Intention
LSD
(I) 7. Home town (J) 7. Home town
Mean
Difference
(I-J) Std. Error Sig.
95% Confidence Interval
Lower Bound Upper Bound
Big City Small City .176674 .101017 .081 -.02190 .37524
Rural area .562274* .115179 .000 .33587 .78868
Small City Big City -.176674 .101017 .081 -.37524 .02190
Rural area .385601* .084443 .000 .21961 .55159
Rural area Big City -.562274* .115179 .000 -.78868 -.33587

82
Small City -.385601* .084443 .000 -.55159 -.21961
*. The mean difference is significant at the 0.05 level.
Table 4.2.1.7 shows the mean and standard deviation of Purchase Intention of
people in different hometowns; after the one-way ANOVA, with respect to the big city, it is
different from the group of the rural area. For the small city, it is different from the group of the
rural area. For the rural area, it is different from the group of the big city and small city.
4.2.2 The Impact of Lifestyles Factor on Online Purchase Intention
4.2.2.1 Difference in Out Going Frequency Generates Differences in Purchase
Intention
Table 4.2.2.1: Difference in Out Going Frequency One-Way ANOVA
How often do you go
out a week N Mean
Std.
Deviation F-value P-value
Purchase
Intention
Less than 3 times 141 3.883 0.749
11.213 0.000 3 but Less than 10 times 248 3.659 0.687
More than 10 times 28 3.214 0.886
H0: μ1 = μ2 =μ3
Hi: μi ≠ μj at last one Pair
It can be seen from Table 4.2.2.1 that the evident from the p-value of about
0.000. That is less than the critical value of 0.05. Therefore, the H1 is accepted.
Table 4.2.2.1-1: Difference in Out Going Frequency Multiple Comparisons
Dependent Variable: Purchase Intention
LSD
(I) How often do you (J) How often do you Mean Std. Sig. 95% Confidence Interval

83
go out a week go out a week Difference
(I-J)
Error Lower
Bound
Upper
Bound
Less than 3 times 3 more but Less than
10 times
.223705* .076271 .004 .07378 .37363
More than 10 times .668693* .149615 .000 .37459 .96279
3 more but Less than
10 times
Less than 3 times -.223705* .076271 .004 -.37363 -.07378
More than 10 times .444988* .144169 .002 .16159 .72838
More than 10 times Less than 3 times -.668693* .149615 .000 -.96279 -.37459
3 more but Less than
10 times
-.444988* .144169 .002 -.72838 -.16159
*. The mean difference is significant at the 0.05 level.
Table 4.2.2.1 shows the mean and standard deviation of Purchase Intention of
people with different times of going out; after one-way ANOVA, with respect to the group less
than 3 times, it is differencing the group more than 10 times. For the group 3 more but less than
10 times, it is no differencing other group. For the group more than 10 times, it is differencing the
group less than 3 times.
4.2.2.2 Difference in Access to Information Differences in Purchase Intention
Table 4.2.2.2: Difference in Access to Information ANOVA
What are your main
sources of
information?
N Mean Std.
Deviation F-value P-value
Purchase
Intention
Internet 140 3.938 0.654
8.408 0.000 TV 155 3.579 0.745
Traditional media 109 3.557 0.729
We-Media 13 3.942 1.037
H0: μ1 = μ2 =μ3=μ4
Hi: μi ≠ μj at last one Pair
It can be seen from Table 4.2.2.2 that the evident from the p-value of about
0.000. That is less than the critical value of 0.05. Therefore, the H1 is accepted.

84
Table 4.2.2.2-1: Difference in Access to Information Multiple Comparisons
Dependent Variable: Purchase Intention
LSD
(I) What are your main
sources of
information?
(J) What are your main
sources of
information?
Mean
Difference
(I-J)
Std.
Error Sig.
95% Confidence Interval
Lower
Bound
Upper
Bound
Internet TV .358468* .084141 .000 .19307 .52387
Traditional media .380161* .092183 .000 .19895 .56137
We-Media -.004808 .209237 .982 -.41611 .40649
TV Internet -.358468* .084141 .000 -.52387 -.19307
Traditional media .021693 .090209 .810 -.15563 .19902
We-Media -.363275 .208375 .082 -.77288 .04633
Traditional media Internet -.380161* .092183 .000 -.56137 -.19895
TV -.021693 .090209 .810 -.19902 .15563
We-Media -.384968 .211750 .070 -.80121 .03127
We-Media Internet .004808 .209237 .982 -.40649 .41611
TV .363275 .208375 .082 -.04633 .77288
Traditional media .384968 .211750 .070 -.03127 .80121
*. The mean difference is significant at the 0.05 level.
Table 4.2.2.2 shows the mean and standard deviation of Purchase Intention for
people with different information access routes; after the one-way ANOVA, witch respect to
internet, it is differencing the TV and traditional media. For the TV, it is differencing the internet.
For the traditional media, it is differencing the internet. For the we-media, it is no differencing
other.
4.2.2.3 Difference in Online Shopping Frequency Generates Differences in Purchase
Intention
Table 4.2.2.3: Difference in Online Shopping Frequency One-Way ANOVA
How often do you buy
products online N Mean
Std.
Deviation F-value P-value
Purchase Every Week 110 3.850 0.716 9.644 0.000

85
Intention Every Month 194 3.780 0.731
Every 3 Month 81 3.568 0.679
Every 6 Month 16 3.406 0.562
Rarely 16 2.797 0.726
H0: μ1 = μ2 =μ3=μ4=μ5
Hi: μi ≠ μj at last one Pair
It can be seen from Table 4.2.2.3 that the evident from the p-value of about 0.000.
That is less than the critical value of 0.05. Therefore, the H1 is accepted.
Table 4.2.2.3-1: Difference in Online Shopping Frequency Multiple Comparisons
Dependent Variable: Purchase Intention LSD
(I) How often do you
buy products online?
(J) How often do you
buy products online?
Mean
Difference
(I-J)
Std.
Error Sig.
95% Confidence Interval
Lower
Bound
Upper
Bound
Every Week Every Month .070361 .084944 .408 -.09662 .23734
Every 3 Month .282099* .104201 .007 .07727 .48693
Every 6 Month .443750* .190424 .020 .06943 .81807
Rarely 1.053125* .190424 .000 .67880 1.42745
Every Month Every Week -.070361 .084944 .408 -.23734 .09662
Every 3 Month .211738* .094149 .025 .02667 .39681
Every 6 Month .373389* .185115 .044 .00950 .73728
Rarely .982764* .185115 .000 .61888 1.34665
Every 3 Month Every Week -.282099* .104201 .007 -.48693 -.07727
Every Month -.211738* .094149 .025 -.39681 -.02667
Every 6 Month .161651 .194704 .407 -.22109 .54439
Rarely .771026* .194704 .000 .38829 1.15376
Every 6 Month Every Week -.443750* .190424 .020 -.81807 -.06943
Every Month -.373389* .185115 .044 -.73728 -.00950
Every 3 Month -.161651 .194704 .407 -.54439 .22109
Rarely .609375* .251621 .016 .11475 1.10400
Rarely Every Week -1.053125* .190424 .000 -1.42745 -.67880
Every Month -.982764* .185115 .000 -1.34665 -.61888
Every 3 Month -.771026* .194704 .000 -1.15376 -.38829
Every 6 Month -.609375* .251621 .016 -1.10400 -.11475
*. The mean difference is significant at the 0.05 level.

86
Table 4.2.2.3 shows the mean and standard deviation of Purchase Intention of
people with different online shopping; after the one-way ANOVA, with respect to every week, it
is differencing the rarely. For every month, it is differencing the rarely. For every 3 months, it is
differencing the rarely. For every 6 months, it is no differencing. For the rarely, it is differencing
every week, every month and every 3 months.
4.2.2.4 Difference in Terms of payment Generates Differences in Purchase Intention
Table 4.2.2.4: Difference in Terms of payment One-Way ANOVA
Which kind of payment
terms do you prefer? N Mean
Std.
Deviation F-value P-value
Purchase
Intention
Online Payment 104 3.873 0.578
3.129 0.015
COD 132 3.570 0.799
Credit Card 117 3.679 0.777
Debit Card 49 3.684 0.649
Hire purchase 15 4.000 0.977
H0: μ1 = μ2 =μ3=μ4=μ5
Hi: μi ≠ μj at last one Pair
It can be seen from Table 4.2.2.4 that the evident from the p-value of about 0.015.
That is less than the critical value of 0.05. Therefore, the H1 is accepted.
Table 4.2.2.4-1: Difference in Terms of payment Multiple Comparisons
Dependent Variable: Purchase Intention LSD
(I) Which kind of
payment terms do you
prefer?
(J) Which kind of
payment terms do you
prefer?
Mean
Difference
(I-J)
Std.
Error Sig.
95% Confidence Interval
Lower
Bound
Upper
Bound
Online Payment COD .302520* .096135 .002 .11354 .49150
Credit Card .193109 .098814 .051 -.00113 .38735

87
Debit Card .188923 .127046 .138 -.06082 .43866
Hire purchase -.127404 .202507 .530 -.52548 .27067
COD Online Payment -.302520* .096135 .002 -.49150 -.11354
Credit Card -.109411 .093100 .241 -.29242 .07360
Debit Card -.113598 .122655 .355 -.35470 .12751
Hire purchase -.429924* .199782 .032 -.82264 -.03721
Credit Card Online Payment -.193109 .098814 .051 -.38735 .00113
COD .109411 .093100 .241 -.07360 .29242
Debit Card -.004186 .124765 .973 -.24944 .24107
Hire purchase -.320513 .201084 .112 -.71579 .07477
Debit Card Online Payment -.188923 .127046 .138 -.43866 .06082
COD .113598 .122655 .355 -.12751 .35470
Credit Card .004186 .124765 .973 -.24107 .24944
Hire purchase -.316327 .216360 .144 -.74163 .10898
Hire purchase Online Payment .127404 .202507 .530 -.27067 .52548
COD .429924* .199782 .032 .03721 .82264
Credit Card .320513 .201084 .112 -.07477 .71579
Debit Card .316327 .216360 .144 -.10898 .74163
*. The mean difference is significant at the 0.05 level.
Table 4.2.2.4 shows the mean and standard deviation of Purchase Intention of
people with different payment methods; after one-way ANOVA, with respect to online payment,
it is differencing the COD. For the COD, it is differencing the online payment. For credit card,
debit card and hire purchase no differencing.
4.2.2.5 Difference in Social Networking Frequency Generates Differences in Purchase
Intention
Table 4.2.2.5: Difference in Social Networking Frequency One-Way ANOVA
Do you use social
networking sites? N Mean
Std.
Deviation F-value P-value
Purchase
Intention
Never use 89 3.402 0.722
8.681 0.000 Generally, not used 100 3.640 0.721
infrequently used 130 3.850 0.724

88
frequently use 98 3.855 0.716
H0: μ1 = μ2 =μ3=μ4
Hi: μi ≠ μj at last one Pair
It can be seen from Table 4.2.2.5 that the evident from the p-value of about 0.000.
That is less than the critical value of 0.05. Therefore, the H1 is accepted.
Table 4.2.2.5-1: Difference in Social Networking Frequency Multiple Comparisons
Dependent Variable: Purchase Intention
LSD
(I) Do you use social
networking sites?
(J) Do you use social
networking sites?
Mean
Difference
(I-J)
Std.
Error Sig.
95% Confidence Interval
Lower
Bound
Upper
Bound
Never use Generally, not used -.238315* .105065 .024 -.44484 -.03179
infrequently used -.448315* .099193 .000 -.64330 -.25333
frequently use -.452906* .105569 .000 -.66043 -.24539
Generally, not used Never use .238315* .105065 .024 .03179 .44484
infrequently used -.210000* .095899 .029 -.39851 -.02149
frequently use -.214592* .102481 .037 -.41604 -.01314
infrequently used Never use .448315* .099193 .000 .25333 .64330
Generally, not used .210000* .095899 .029 .02149 .39851
frequently use -.004592 .096451 .962 -.19419 .18500
frequently use Never use .452906* .105569 .000 .24539 .66043
Generally, not used .214592* .102481 .037 .01314 .41604
infrequently used .004592 .096451 .962 -.18500 .19419
*. The mean difference is significant at the 0.05 level.
Table 4.2.2.5 shows the mean and standard deviation of Purchase Intention of people
with different frequency of using social network; after the one-way ANOVA, with respect to
never use, it is differencing the infrequently used and frequently use. For the generally not used, it
is no differencing. For the infrequently used, it is differencing the never use. For the frequently
use, it is differencing the never use.
4.2.2.6 Difference in Main Purposes Computers Generates Differences in Purchase

89
Intention
Table 4.2.2.6: Difference in Main Purposes Computers One-Way ANOVA
What is the main use of
your computer N Mean
Std.
Deviation F-value P-value
Purchase
Intention
work 127 3.724 0.701
3.005 0.030 study 107 3.544 0.771
entertainment 148 3.819 0.770
Other 35 3.643 0.573
H0: μ1 = μ2 =μ3=μ4
Hi: μi ≠ μj at last one Pair
It can be seen from Table 4.2.2.6 that the evident from the p-value of about 0.000.
That is less than the critical value of 0.05. Therefore, the H1 is accepted.
Table 4.2.2.6-1: Difference in Main Purposes Computers Multiple Comparisons
Dependent Variable: Purchase Intention LSD
(I) What is the main
use of your computer
(J) What is the main
use of your computer
Mean
Difference
(I-J)
Std.
Error Sig.
95% Confidence Interval
Lower
Bound
Upper
Bound
work study .180017 .096500 .063 -.00968 .36971
entertainment -.094847 .088950 .287 -.26970 .08000
Other .081552 .140389 .562 -.19441 .35752
study work -.180017 .096500 .063 -.36971 .00968
entertainment -.274864* .093317 .003 -.45830 -.09143
Other -.098465 .143196 .492 -.37995 .18302
entertainment work .094847 .088950 .287 -.08000 .26970
study .274864* .093317 .003 .09143 .45830
Other .176400 .138221 .203 -.09530 .44810
Other work -.081552 .140389 .562 -.35752 .19441
study .098465 .143196 .492 -.18302 .37995
entertainment -.176400 .138221 .203 -.44810 .09530
*. The mean difference is significant at the 0.05 level.

90
Table 4.2.2.6 shows the mean and standard deviation of Purchase Intention in the
main purpose of different computers. After the one-way ANOVA, with respect to work, it is no
differencing. For the study, it is differencing the entertainment. For the entertainment, it is
differencing the study. For the other, it is no differing.
4.2.3 Correlation analysis
In statistics, the Pearson correlation coefficient is used to measure the linear relationship
between two distance variables. The correlation coefficient has a value between -1 and 1, and the
larger the absolute value, the stronger the correlation between the two. The closer the correlation
coefficient is to 1 or -1, the stronger the correlation, and vice versa. In addition, judging the
correlation needs to consider the correlation coefficient and the significance level
comprehensively. Only when the correlation coefficient is greater than 0 and the significance
level is P<0.05, the variables are related. Therefore, in order to explain whether there is a
correlation between variables, this paper uses SPSS 19 for data analysis.
Table 4.2.3.1: Correlation analysis for 7Ps
Product
Feature
Price
Feature
Place
Feature
Promotion
Feature
People
Feature
Process
Feature
Physical
Evidence
Purchase
Intention
Product
Feature 1
Price
Feature .364** 1
Place
Feature -0.027 0.041 1
Promotion
Feature 0.065 .397** .348** 1
People
Feature 0.095 .288** 0.015 .260** 1
Process -0.009 .226** -0.02 .107* 0.003 1

91
Feature
Physical
Evidence .352** .161** .150** .115* .227** .122* 1
Purchase
Intention .646** .537** .242** .406** .220** .230** .441** 1
Note: **P<0.01, *P<0.05
It can be seen from Table 4.2.3.1 that there is a significant positive correlation between
Purchase Intention and all variables, that is Product Feature, Price Feature, Place Feature,
Promotion Feature, People Feature, Process Feature, and Physical Evidence. The relevant degree
is 0.646, 0.537, 0.242, 0.406, 0.220, 0.230, and 0.441, respectively.
Table 4.2.3.2: Correlation analysis for Computer Technical
General Knowledge Special Knowledge Online Shopping Purchase Intention
General Knowledge 1
Special Knowledge 0.079 1
Online Shopping .108* .362** 1
Purchase Intention .288** .265** .343** 1
Note:**P<0.01, *P<0.05
It can be seen from Table 4.2.3.2 that there is a significant positive correlation between
Purchase Intention and all variables, that is General Knowledge, Special Knowledge, and Online
Shopping. The relevant degree is 0.288, 0.265, and 0.343, respectively.
4.2.4 Regression analysis
Regression analysis is a statistical analysis method that determines the correlation
between two variables or more variables. Regression analysis can be used to solve the following
two problems: First, it can determine the quantitative relationship between the dependent variable
and several independent variables, usually called the mathematical model of the regression
equation, so that we can explain and predict variable value by the independent variable. Secondly,
according to the regression coefficient, we can determine whether the independent variable has a

92
positive or negative influence on the dependent variable, which explanatory variables have a
significant influence on the explained variable, and which explanatory variables have a weak
influence on the explained variable, so as to grasp the main influence and secondary influence
factors of the explained variables. Therefore, this paper chooses multiple regression analysis for
analysis.
Table 4.2.4.1: Model Summary
Model R R Square Adjusted R Square Std. Error of the Estimate
1 .829a .688 .680 .418747
a. Predictors: (Constant), Online Shopping, Promotion Feature, Process Feature, General Knowledge, People
Feature, Physical Evidence, Place Feature, Special Knowledge, Price Feature, Product Feature
Table 4.2.4.2 Model Summary One-Way ANOVA
Model Sum of Squares df Mean Square F Sig.
1 Regression 157.028 10 15.703 89.552 .000a
Residual 71.192 406 .175
Total 228.219 416
a. Predictors: (Constant), Online Shopping, Promotion Feature, Process Feature, General Knowledge, People
Feature, Physical Evidence, Place Feature, Special Knowledge, Price Feature, Product Feature
b. Dependent Variable: Purchase Intention
4.2.5 The of Marketing Mix 7ps and Computer Knowledge on Purchase Intention
Table 4.2.5.1: Coefficients of Marketing Mix 7ps
Model
Unstandardized Coefficients
Standardized
Coefficients
t Sig. B Std. Error Beta
1 (Constant) -2.141 .240 -8.911 .000

93
X1 Product
Feature
.449 .035 .446 12.672 .000
X2 Price
Feature
.197 .036 .188 5.494 .000
X3 Place
Feature
.170 .033 .161 5.174 .000
X4Promotion
Feature
.218 .036 .202 6.094 .000
X5 People
Feature
.016 .030 .017 .544 .587
X6 Process
Feature
.161 .030 .157 5.391 .000
X7 Physical
Evidence
.146 .033 .138 4.403 .000
a. Dependent Variable: Purchase Intention
Model
Unstandardized Coefficients
Standardized
Coefficients
t Sig. B Std. Error Beta
1 (Constant) -2.141 .240 -8.911 .000
Product
Feature
.449 .035 .446 12.672 .000
Price Feature .197 .036 .188 5.494 .000
Place Feature .170 .033 .161 5.174 .000
Promotion
Feature
.218 .036 .202 6.094 .000
Process Feature .161 .030 .157 5.391 .000
Physical
Evidence
.146 .033 .138 4.403 .000
b. Dependent Variable: Purchase Intention
Equation 1:
Y=(a0+a1x1+a2x2+a3x3+a4x4+a5x5+a6x6)
Y=-2.141+.449x1+.197x2+.170x3+.218x4+.161x6+.146x7
(.000) (.000) (.000) (.000) (.000) (.000) (.000)
Adjusted R2=.680
It can be find from Equation 1. Product is the most important feature influences on the
purchase intention evident by the regression coefficient of about .446 following by product,

94
promotion, price, place, process and Physical Evidence, respectively with the coefficient
of .218, .197, .170, .161, and 146.
Table 4.2.5.2: Coefficients of Computer Knowledge
Model
Unstandardized Coefficients
Standardized
Coefficients
t Sig. B Std. Error Beta
1 (Constant) -2.141 .240 -8.911 .000
X1 General
Knowledge
.097 .028 .098 3.408 .001
X2 Special
Knowledge
.046 .033 .046 1.382 .168
X3 Online
Shopping
.108 .032 .105 3.411 .001
Model
Unstandardized Coefficients
Standardized
Coefficients
t Sig. B Std. Error Beta
1 (Constant) -2.141 .240 -8.911 .000
General
Knowledge
.097 .028 .098 3.408 .001
Online
Shopping
.108 .032 .105 3.411 .001
Equation 2:
Y=(a0+a1x1+a2x2+a3x3)
Y=-2.141+.097x1+.108x3
(.000) (.001) (.001)
Adjusted R2=.680
It can be find from the Equation 2. Online shopping is the most important feature
influences on the purchase intention evident by the regression coefficient of about .108 following
by General, respectively with the coefficient of .097.

95
Chapter 5
Conclusion
5.1 Summary and Conclusion
The objective of this study is to analyze the consumer influencing factors in the online sales
of HUAWEI mobile phones. This paper analyzes and studies the consumption intention to buy
HUAWEI mobile phones online from four influencing factors: Demographics, lifestyle, 7Ps and
computer technology.
The research questions are the influence of Demographics difference on purchase intention;
The influence of different lifestyle on purchase intention; The influence of 7ps (marketing Mix)
factors on purchase intention and the influence of computer technology level on purchase
intention.
Primary data was collected via an online questionnaire. All respondents had a premise that
they had bought HUAWEI mobile phones online before. Therefore, use an online store that once
sold HUAWEI phones and Official BBS were used.8,000 questionnaires were published, and 417
valid questionnaires were finally recovered. The data obtained after analysis were representative.
5.2 Results
5.2.1 The impact of Demographic factors an consumers’ online shopping behavior
According to the research, among the personal factors, male is more likely to buy

96
HUAWEI mobile phones online. With respect to age the age between 26 and 33 are more willing
to buy HUAWEI mobile phones online. As focus occupation is can be finding, it finds that
government workers are more willing to buy. In the income division, people with an income of
5,000-10,000 RMB per month are more willing to buy. In the education level, it was found that
the higher the degree, the stronger the purchase intention. For the factors of hometown, the
purchase intention of living in big cities is the strongest, followed by small cities and finally the
countryside.
5.2.2 The impact of lifestyle factors an consumers’ online shopping behavior
It is concluded from the study that among the factors of personal lifestyle, the less the
weekly activities, the stronger the willingness to buy HUAWEI mobile phones online. With
respect to obtaining information between of obtaining information, people who get information
from the Internet have a strong online shopping intention. For the survey of online shopping
frequency, the higher the frequency of online shopping, the stronger the willingness to buy
HUAWEI mobile phones online. In terms of payment methods, consumers who prefer online
payment and installment payment are more willing to purchase. Among the frequency of using
social networking sites, those who use them more frequently are more likely to purchase. For the
major USES of computers, the willingness to buy entertainment is significantly greater than other
USES.
5.2.3 The impact of Marketing Mix 7P factors an consumers’ online shopping behavior
It can be concluded from the research that among the 7ps factors, each factor affects the
purchase intention of HUAWEI mobile phones purchased online. Among them, product factor
and price factor are the most important. According to the research, among the 7ps factors, only

97
the People factor is not significant for the purchase intention. Other factors have significant
positive correlation.
5.2.4 The impact of Personal Technology Knowledge factors an consumers’ online
shopping behavior
It is concluded from the study that in computer technology, three factors are positively
correlated to the purchase intention, among which online shopping technology is the most
important. With respect to Technology Knowledge factors can be concluded from the research
that only the special technology influencing factors have no significant influence on the purchase
intention of HUAWEI mobile phone online shopping.
5.3 Discussion
5.3.1 Demographic factors
On terms of Gender Factor, In this research, it is find out that the Purchase
Intention of male is significantly higher than that of female.
With respect to Age Factor, In this research, the age factor after the one-way
ANOVA analysis, there is a significant difference in Purchase Intention of people in different
ages (F=20.462, p<0.05). For further testing on differences in Purchase Intention of people at
different ages, this paper uses the LSD method for multiple comparisons. The Purchase
Intention of people at the age of 26-33 years old is significantly greater than that of people in
other ages. The Purchase Intention of people at the age of 33-40 years old is significantly
greater than that of 19 years old.

98
As for as Occupation Factor,In this research, Occupation factor after one-way
ANOVA analysis, there is a significant difference in Purchase Intention of people in different
occupations (F=16.587, p<0.05). In order to further test the differences in Purchase Intention
of people in different occupations, this paper uses the LSD method for multiple comparisons.
The Purchase Intention of government workers are significantly larger than that of
housewives/freelancers, students, corporate workers, and others. The Purchase Intention of
students and corporate workers are significantly greater than that of housewives / freelancers.
For Marital Status, In this research, Marital Status factor after one-way ANOVA,
there is no significant difference in Purchase Intention of people in different marital status
(F=1.357, p>0.05). Different marital status does not affect the purchase intention.
With respect to Income Factor, In this research, Average income per month
factor after the one-way ANOVA, there is a significant difference in Purchase Intention of people
with different monthly income (F=16.587, p<0.05). In order to further test the differences in
Purchase Intention of people in different occupations, this paper uses the LSD method for
multiple comparisons. In which the Purchase Intention of people with 5000-10000 yuan is
significantly greater than that of people with other income, and the Purchase Intention of people
with 1000-5000 yuan is significantly greater than that of people with less than 1000.
For Education Level Factor, In this research, Education Level factor after the
one-way ANOVA, there is a significant difference in the Purchase Intention of people with
different education levels (F=18.288, p<0.05). In order to further test the differences in different
educational levels, this paper uses the LSD method for multiple comparisons. The Purchase
Intention of people with the master's degree is significantly larger than that of people with the

99
undergraduate degree or below. The Purchase Intention of people with the doctoral degree is
significantly larger than that of people with the undergraduate degree.
As for as Home town Factor, In this research, Home Town Factor after the one-way
ANOVA, there is a significant difference in Purchase Intention of people in different
hometowns (F=14.696, p<0.05). In order to further test the differences of people in different
hometowns, this paper uses the LSD method to make multiple comparisons. The Purchase
Intention of people in large cities is significantly larger than that of people in rural areas, and
the Purchase Intention of people in small cities is significantly larger than that of people in
rural areas.
5.3.2 Lifestyle factors
On terms of Different times of going out,In this research, after one-way ANOVA,
there is a significant difference in Purchase Intention of people with different time of going
out (F=11.213, p<0.05). In order to further test the difference in the Purchase Intention of
people with different times of going out, this paper uses the LSD method for multiple
comparisons. The Purchase Intention of people with less than 3 times of going out is
significantly different from that of people with other times of going out, and the Purchase
Intention of people with 3-10 times of going out is significantly larger than that of people
with 10 times of going out.
For Access to Information, In this research, after the one-way ANOVA, there is a
significant difference in Purchase Intention of people with different acquired information
(F=8.408, p<0.05). In order to further test and obtain differences in different information, this
paper uses LSD method for multiple comparisons. In which the Purchase Intention of people

100
using online information is significantly larger than that of people using TV and traditional
media.
As for as Online shopping frequency, In this research, after the one-way ANOVA,
there is a significant difference in Purchase Intention of people with different online shopping
(F=9.644, p<0.05). In order to further test the differences in online shopping, this paper uses the
LSD method for multiple comparisons. In which the Purchase Intention of people with weekly
and monthly online shopping is significantly greater than that of people with online shopping
every three months and every six months, and people who barely shopped online; the Purchase
Intention of people with online shopping every three month and every six-month is significantly
greater than that of people who barely shop online.
With respect to Different Payments Way, In this research, after one-way ANOVA,
there is a significant difference in Purchase Intention of people with different payment
methods (F=3.129, p<0.05). In order to further test the differences of Purchase Intention of
people with different payment methods, this paper uses the LSD method for multiple
comparisons. In which the Purchase Intention of people using online payment and
installment payment is significantly greater than that of people using cash on delivery.
For Different Frequencies of using Social Networks, n this research, after the
one-way ANOVA, there is a significance difference in Purchase Intention (F=8.681, p< 0.05)
of people with different frequency of using social networks. In order to further test the
difference in Purchase Intention of people with the different frequency of using social
networks, this paper uses the LSD method for multiple comparisons. In which the Purchase
Intention of people using social network often is significantly larger than that of people who

101
barely or never use social network; the Purchase Intention of people who do not often use
social network is significantly larger than that of people who barely or never use social
network; the Purchase Intention of people who barely use social network is significantly
larger than that of people who never use social network.
As for as Main Purposes of Computers, In this research, after the one-way ANOVA,
there is a significant difference in Purchase Intention of people with the different main use of
computers (F=3.005, p<0.05). In order to further test the differences in Purchase Intention of
people with the different main use of computers, this paper uses the LSD method for multiple
comparisons. z
5.3.3 Marketing Mix 7P factors
It can be seen from study that there is a significant positive correlation between
Purchase Intention and Product Feature, Price Feature, Place Feature, Promotion Feature, People
Feature, Process Feature, and Physical Evidence. The relevant degree is 0.646, 0.537, and 0.242,
0.406, 0.220, 0.230, 0.441, respectively. Among the influencing factors of Marketing Mix (7Ps),
the product factor is the most important, followed by the price factor.
It can be seen from study above that explanation rate of Purchase Intention by Online
Shopping, Promotion Feature, Process Feature, Price Feature and Product Feature is 68%. The
linear relationship between the explained variable and the explanatory variable is significant. A
linear model (F = 89.552, p < 0.001) can be established. From the normalized path coefficient, the
Product Feature has a significant positive effect (β=0.446, p<0.05) on Purchase Intention.; Price
Feature has a significant positive effect on Purchase Intention (β=0.118, p<0.05); Place Feature
has a significant positive effect on Purchase Intention (β= 0.161, p<0.05); Promotion Feature has

102
a significant positive effect on Purchase Intention (β=0.202, p<0.05); People Feature has no
significant effect on Purchase Intention (β=0.017, p>0.05); Process Feature has a significant
positive effect on Purchase Intention (β=0.157, p<0.05); Physical Evidence has a significant
positive effect on Purchase Intention (β=0.138, p<0.05); Among the Marketing Mix(7ps)
influencing factors, only human factors had no significant influence on shopping intention.
Therefore, it is proved that the human factors in 7p do not affect the Online-shopping intention.
5.3.4 Technology Knowledge factors
It can be seen from study that there is a significant positive correlation between
Purchase Intention and General Knowledge, Special Knowledge, and Online Shopping. The
relevant degree is 0.288, 0.265, and 0.343, respectively. It can be seen from the data that among
the influencing factors of Technology Knowledge, online shopping technology is the most
important.
It can be seen from study above that explanation rate of Purchase Intention by Online
Shopping, General Knowledge, Special Knowledge, is 68%. The linear relationship between the
explained variable and the explanatory variable is significant. A linear model (F = 89.552, p <
0.001) can be established. From the normalized path coefficient, Genera l Knowledge has a
significant positive effect on Purchase Intention (β=0.098, p<0.05); Special Knowledge has no
significant effect on Purchase Intention (β=0.046, p>0.05); Online Shopping has a significant
positive effect on Purchase Intention. (β = 0.105, p < 0.05). Special Knowledge has no
significant effect on Purchase Intention. Therefore, special technology does not affect consumers'
purchase intention.

103
5.4 Research Suggestions for HUAWEI Company
5.4.1 Among Demographics factor
·In the study, data and conclusions were analyzed. I suggest that HUAWEI should invest
more in the female mobile phone market, such as special female mobile phone models,
advertisements and spokespersons targeted at female consumers. At the same time maintain the
main consumer groups of male consumers.
·In terms of age group, the age group of 26-33 years old is the main consumer group. The
majority of young people need to make the product line of HUAWEI mobile phone more youthful,
add some trendy factors and keep the price at a price that young people can afford.
·In the occupational group, government employees are obviously more important, so it is
suggested that HUAWEI cooperate with government departments to purchase official mobile
phones. We can also make of apps or specialized phones that are suitable for government
employees.
·In the monthly revenue group, RMB 5,000 to RMB 10,000 is the most important, so
HUAWEI is reminded that it should produce more mid-range models to meet the needs of this
income group while ensuring its profits.
·In education level research, we can conclude that the higher the degree, the stronger
the buying intention. Therefore, for the highly educated people, we can release
advertisements in universities and research institutions, and make some software or mobile
phones suitable for scientific research and teaching.
·In the group of hometown location, people in big cities are more willing to buy
HUAWEI phones online, followed by those in small cities. Therefore, HUAWEI’s sales

104
strategy can be based on large cities. But it should also develop and expand markets in small
cities and rural areas.
5.4.2 Among Lifestyle factor
·Among the influencing factors of personal lifestyle, the frequency of going out every
week is very important. We can conclude that the less the number of going out every week,
the stronger the purchase intention. Therefore, HUAWEI can provide more intimate services
for people who don't go out much, such as door-to-door maintenance.
·In terms of access to information, consumers who like to browse information on the
Internet are more willing to purchase. Therefore, HUAWEI should strengthen the investment
in online advertising, targeted at video website and news website.
·The frequency of online shopping is also an important judgment data. The analysis
shows that the more frequent the online shopping is, the stronger the purchase intention is.
Therefore, in view of this, HUAWEI can strengthen the cooperation with shopping website
and launch advertisements and product placement on their website.
·In the selection of online payment methods, consumers prefer online payment and
installment payment significantly more. Therefore, for these consumer groups, HUAWEI can
support online payment and installment service for all mobile phone products.
·The frequency of using social networking sites also has a great impact on the
purchase intention, especially for consumers who frequently use social networking sites to
buy HUAWEI mobile phones online. According to this feature, HUAWEI can increase its
sharing with social networking companies, including spending on advertising and registering
official social media accounts.

105
·The frequency of using social networking sites also has a great impact on the
purchase intention, especially for consumers who frequently use social networking sites to
buy HUAWEI mobile phones online. According to this feature, HUAWEI can increase its
sharing with social networking companies, including spending on advertising and registering
official social media accounts.
5.4.3 Among Marketing Mix 7Ps factor
Among the Marketing Mix 7ps factors, the factors most concerned by users are
the product and price. In view of this characteristic, HUAWEI should continuously improve
the product quality and product characteristics of mobile phone products. At the same time,
in terms of price, while maintaining profit, we should refine the product line and launch
high-end mobile phones and low-end mobile phones to adapt to different markets.
In Marketing Mix 7ps, it is the People factor that gets the least attention and least
influences consumers' willingness to buy HUAWEI phones online. I think in online shopping,
people or employees are not important compared to traditional business. Therefore,
HUAWEI can reduce the budget and labor cost in this aspect while ensuring normal
operation.
5.4.4 Among Technology Knowledge factor
From the perspective of computer technology, consumers who master online
shopping technology are more willing to buy HUAWEI mobile phones online. It indirectly
indicates that if the online sales volume of HUAWEI mobile phones needs to be improved,
the online shopping knowledge needs to be popularized to the public. And make online
shopping easy, so that people who do not have much computer knowledge also participate in

106
the online shopping.
5.5 Research Suggestions for This Paper
In this study, efforts have been made to improve various parts, including multiple
modifications of variables. However, there are still many shortcomings, especially now
affected by the international economic situation, the us-china trade war has seriously affected
the development and sales of HUAWEI phones. This paper was written earlier and has not
studied these effects further. I hope to study HUAWEI’s online shopping strategy of mobile
phone after the trade war between China and the United States in the future research.
On the other part, due to the limitations of time and ability, more variables were not
added to conduct research. For example, the original plan was to conduct a detailed study on
regional factors and online shopping website factors, but it was not carried out. In future
studies, these two factors can also be added for further research.
5.5.1 The Limitation of the Research
Even though this study was deliberately constructed and developed, there were
some inevitable shortcomings that I confronted during the research process. This might
slightly impact the results of my research.
In this study authors only focused on some shopping websites and HUAWEI
mobile product and part not all product goods, so the conclusion may not be suitable for all
goods and industries. Although online questionnaires could help our research gain more
respondents to ensure the quantity of the data, this method could not guarantee the quality of
the data. This study only uses a quantitative method. The combination of qualitative method

107
and quantitative method would be more valid.
This survey limits us to a pool of Internet users. Hence, the results may not be
generalized to non-Internet users. Although through paper survey it was in- tended to cover
few non-users but since the pool of respondents was either students or working professionals
so all of them had sufficient exposure to in- Internet. Second, the samples of Internet users
for this study were mostly those who are more knowledge about the Internet and are thus
experienced In- Internet users. Thus, the sample of respondents may be skewed toward more
experienced Internet users. This may also restrict the generalize of the findings.
Another limitation was language barrier because I had to read English-written
literates, paraphrase them, and wrote down all my research in English, but I am Chinese,
English is my second language, So there might be some language mistake or
misunderstanding in the process. At the same time, the questionnaire survey was released in
China, so I had to translate it into Chinese, which may also have some language restrictions.

108
Bibliology
[1] Easterby-Smith, M., Thorpe, R., & Jackson, P. R. (2012). Management research. Sage.
[2] Schiffman, L. & Kanuk, L., 2004. Consumer Behavior. 8th ed. New Delhi: Prentice-Hall of India Pvt. Ptd.
[3] Booms, B. (1981). Marketing strategies and organizational structures for service firms. Marketing of
services..
[4] Velumani, D. (2014). A Study on Consumer Buying Behavior towards Nokia Mobile in Erode
District. Journal of Business and Management IOSRJBM, 16(12), 52-54.
[5] Wilson, A., Zeithaml, V., Bitner, M. J., & Gremler, D. (2016). Services marketing: Integrating
customer focus across the firm.
[6] Constantinides, E. (2004). Influencing the online consumer's behavior: the Web experience. Internet
research.
[7] Czinkota, M. R., and Kotabe, M. (2005). Marketing management. Cincinnati: Atomic Dog Publ.’
[8] Foxall, G. (2005). Understanding consumer choice. Springer.
[9] The Economic Time.com. (2020). “Definition of 'Product’”, < https:// economictimes.indiatimes.com
/definition/product>
[10] MBN.com, (2019) <https://marketbusinessnews.com/financial-glossary/price-definition-meaning/>
[11] Pogorelova, E., Yakhneeva, I., Agafonova, A., & Prokubovskaya, A. (2016). Marketing Mix for
E-commerce. International journal of environmental & science education, 11(14), 6744-6759.
[12] Susan Ward, (2019) “What is promotion in business and how does it differ from advertising?
” <https://www.thebalancesmb.com/business-promotion-definition-2947189>
[13] Zeithaml, V. A., Bitner, M. J., Gremler, D. D., & Pandit, A. (2000). Services marketing: Integrating

109
customer focus across the firm.
[14] Adorno, T. (1991). Culture industry reconsidered. Media Studies. A Reader.
[15] Kahle, L. R., & Close, A. G. (Eds.). (2011). Consumer behavior knowledge for effective sports and
event marketing. Routledge..
[16] Spaargaren, G., and B. VanVliet. (2000) "Lifestyle, Consumption and the Environment: The
Ecological Modernisation of Domestic Consumption", Environmental Politics 9(1): 50-75.
[17] Midgley, David F. and Dowling, Grahame R. (1978). Innovativeness: the concept and its
measurement, Journal of Consumer Research, 4 (4), 229-235.
[18] Thananuraksakul, S. (2007). Factors affecting online shopping behaviour: a study of Thai consumers.
University of South Australia.
[19] Yu, H., & Gao, Q. (2012). Analysis of Influencing Factors of Taobao Consumer Behavior.
In WHICEB.
[20] Smoliana, K. (2017). Consumer behavior towards buying consumer electronics online: crossnational
analysis (Master's thesis, Nord universitet).
[21] Liat, C.B., Wuan, Y.S., & Nilai, P. (2014). Factors Influencing Consumers' Online Purchase
Intention: A Study among University Students in Malaysia.
[22] Yan Zhe. (2016). Research and analysis of Chinese consumer behavior factors that influence
consumer online shopping.
[23] Mittal, A. (2013). E-commerce: It’s Impact on consumer Behavior. Global Journal of Management
and Business Studies, 3(2), 131-138.
[24] Xing, Y. (2016). Online shopping: A comparison of New Zealand and Chinese shoppers (Doctoral
dissertation, Auckland University of Technology).

110
[25] Smt Susheela Menon, (2015). E-COMMERCE MANAGEMENT.
[26] Kim, R. B. (2009). Factors influencing Chinese consumer behavior when buying innovative food
products. Agric Econ (Zeme de Lská Ekonomika), 55, 436-445.
[27] Zhao, A. L., Harridge‐March, S., Hanmer‐Lloyd, S., Ward, P., & Goode, M. M. (2008).
Perceived risk and Chinese consumers' internet banking services adoption. International Journal of Bank
Marketing.
[28] Lee, H. T. (2009). Online-shopping market in China. CBC marketing Research & Business
Consulting Ltd.
[29] Weng, V. and Lee, C.H. (2009), Current status and future development potential of China’s online
shopping market.
[30] CNNIC (2009), Statistic report on internet development in China. January, available at:
www.cnnic.cn/ uploadfiles/pdf/2009/3/23/153540.pdf (accessed 13 June 2010).
[31] Shanghai Business Review (2010), ‘’Click to add to cart’’, Shanghai Business Review, March.
[32] Rein, S. (2008), In China, online shopping soars. Forbes.com, 6 June. Rogers.
[33] Gong, W., & Li, Z. G. (2008). Mobile youth in China: a cultural perspective and marketing
implications. International Journal of Electronic Business, 6(3), 261-281.
[34] Ahrens, Nathaniel. (2013). "China's Competitiveness Myth, Reality, and Lessons for the United
States and Japan. Case Study: Huawei" (PDF). Center for Strategic and International
Studies. Archived (PDF) from the original on 13 February 2015. Retrieved 3 October 2014.
[35] Huawei Hits. (2018)200 Million Smartphone Sales in 2018". AnandTech. Archived from the original
on 27 March 2019. Retrieved 27 March 2019.
[36] China's Huawei eyes smartphone supremacy this year after record 2018 sales". Reuters.

111
(2018). Archived. (2019). Retrieved 24 January2019.
[37] Vance, Ashlee; Einhorn, Bruce. (2011). "At Huawei, Matt Bross Tries to Ease U.S. Security
Fears". Bloomberg BusinessWeek. Archived from the original on 24 September 2011. Retrieved 28
September 2011.
[38] "Who's afraid of Huawei?". The Economist. (2012). Archived from the original on 3 August 2012.
Retrieved 15 November 2018. Huawei has just overtaken Sweden's Ericsson to become the world's largest
telecoms-equipment-maker.
[39] Lumpkin, J. R., & Hawes, J. M. (1985). “Retailing without stores: An examination of catalog
shoppers”, Journal of Business Research, 13(2, April), 139-151.
[40] Shim, J.K., Quereshi, A. A. Siegel, J.G. & Siegel, R.M. (2013). The international handbook of
electronic commerce, New York, NY: Routledge Francis & Taylor Group.
[41] The Alibaba phenomenon. (2013). The Economics.
[42] Singh, J. (1995), ‘’Measurement issues in cross-national research’’, Journal of International Business
Studies, Vol. 26 No. 3, pp. 597-619.
[43] Smith, R., Deitz, G., Royne, M. B., Hansen, J. D., Grünhagen, M., & Witte, C. (2013).
‘’Cross-cultural examination of online shopping behavior: A comparison of Norway’’, Germany, and the
United States. Journal of Business Research.
[44] Adedokun,J.A.A. (2003). Basics of research Methodology.’’Sagamu:New Hope Publisher’’.
[45] Adeniyi, A.L.; Oyekanmi, A.O.&Tijani,M.O.(2011).’’Essentials of Business Research
Methods.Lagos:CSS bookshops Limited’’.
[46] Aina,L.O. (2004).Library and Information Science Text For Africa.
[47] Avwokeni,J.A. (2006).’’Research Methods:Process,Evaluation&Critique.’’

112
[48] DeVellis, R.F. (1991). ‘’Scale Development: theory and applications ‘’(Applied Social Research
Methods Series, Vol. 26).
[49] Kaiser, H. (1974).’’An index of factor simplicity’’. Psychometrika p:39: 31–36.
[50] Tabachnick and Fidell (2007), ‘’Using Multivariat Statistics. Social ’’Sciences, Behavioral Sciences
and Education’’.
[51] Saunders, M., Lewis, P. & Thornhill, A. (2012) “Research Methods for Business Students” 6th
edition, Pearson Education Limited