Influence of the Chad-Cameroon pipeline on termite assemblages€¦ · J. Bio. & Env. Sci. 2014 153...
14
J. Bio. & Env. Sci. 2014 153 | Dieudonnén and Josens RESEARCH PAPER OPEN ACCESS Influence of the Chad-Cameroon pipeline on termite assemblages Pierre Dieudonnén 1, 2* , Guy Josens 1 1 Université Libre de Bruxelles, Département de Biologie des Organismes, Av. Roosevelt, 50 - cp 244, 1050 Brussels, Belgium 2 Ecole Normale Supérieure, Université de Yaoundé I, B.P. 47 Yaoundé, Cameroon Article published on June 12, 2014 Key words: Abstract The study of Chad-Cameroon pipeline disturbances on termite assemblages was conducted in 9 sites in the savannah and forest ecosystems, five years following the completion of the works. In each site an experimental design was made up of four transect belts, 100 m long by 2 m wide, two in the disturbed zone and two in the undisturbed zone . Soil samples were taken in the fifth, ninth and fifteenth sections of each of the transect belt to measure the impact of the work on soil texture and chemical properties. Furthermore, termites were inventoried in the whole transect belt. The pipeline construction disrupted significantly the soil textural parameters, bulk density, water properties and soil organic matter. In all 36 transects, 99 termite species were collected. The overall species richness decreased in the disturbed zone but the overall density was not changed. However, the abundance of wood feeding termites significantly increased whereas the species richness and abundance of soil feeding termites decreased. The relatively small difference in termite assemblages between disturbed and undisturbed areas is greatly explained by the fact that ecosystems crossed by the pipeline were already noticeably degraded before the pipeline installation. * Corresponding Author: Pierre Dieudonnén [email protected] Journal of Biodiversity and Environmental Sciences (JBES) ISSN: 2220-6663 (Print) 2222-3045 (Online) Vol. 4, No. 6, p. 153-166, 2014 http://www.innspub.net
Transcript of Influence of the Chad-Cameroon pipeline on termite assemblages€¦ · J. Bio. & Env. Sci. 2014 153...

J. Bio. & Env. Sci. 2014
153 | Dieudonnén and Josens
RESEARCH PAPER OPEN ACCESS
Influence of the Chad-Cameroon pipeline on termite
assemblages
Pierre Dieudonnén1, 2*, Guy Josens1
1 Université Libre de Bruxelles, Département de Biologie des Organismes, Av. Roosevelt, 50 - cp
244, 1050 Brussels, Belgium
2 Ecole Normale Supérieure, Université de Yaoundé I, B.P. 47 Yaoundé, Cameroon
Article published on June 12, 2014
Key words:
Abstract
The study of Chad-Cameroon pipeline disturbances on termite assemblages was conducted in 9 sites in the
savannah and forest ecosystems, five years following the completion of the works. In each site an experimental
design was made up of four transect belts, 100 m long by 2 m wide, two in the disturbed zone and two in the
undisturbed zone . Soil samples were taken in the fifth, ninth and fifteenth sections of each of the transect belt to
measure the impact of the work on soil texture and chemical properties. Furthermore, termites were inventoried
in the whole transect belt. The pipeline construction disrupted significantly the soil textural parameters, bulk
density, water properties and soil organic matter. In all 36 transects, 99 termite species were collected. The
overall species richness decreased in the disturbed zone but the overall density was not changed. However, the
abundance of wood feeding termites significantly increased whereas the species richness and abundance of soil
feeding termites decreased. The relatively small difference in termite assemblages between disturbed and
undisturbed areas is greatly explained by the fact that ecosystems crossed by the pipeline were already noticeably
degraded before the pipeline installation.
*Corresponding Author: Pierre Dieudonnén [email protected]
Journal of Biodiversity and Environmental Sciences (JBES) ISSN: 2220-6663 (Print) 2222-3045 (Online)
Vol. 4, No. 6, p. 153-166, 2014
http://www.innspub.net

J. Bio. & Env. Sci. 2014
154 | Dieudonnén and Josens
Introduction
Disturbances are scattered events that affect a
population, an ecosystem or a landscape; they change
their structure, their physical environment and their
functioning (Pickett et al., 1989). These events may be
inherent to the ecosystem dynamics, but agriculture
and civil engineering have increased dramatically
their frequency and intensity, becoming a threat to
biodiversity (Bengtsson, 2002).
Disturbances may have various direct and indirect
effects on the soil and hence on soil fauna. Civil
engineering clears the vegetation, which exposes it to
direct sunshine and hence alters its climatic
characteristics. The soil may be compacted locally and
its layers mixed elsewhere. Soil fauna is mainly
dependent on soil climate and on its type of
vegetation (Lavelle & Pashanasi, 1989). So increasing
the temperature and decreasing the moisture of top
soil results in animal migration to deeper layers and
on a longer term selects heat-resistant species
(Birang, 2004).
Being a major agent of litter decomposition, termites
are a key-group for the functioning of tropical
ecosystems and thus have been proposed as
indicators (Eggleton et al., 1997). Most studies focus
on changes in the diversity of termites along gradients
of human disturbance (Eggleton et al., 1996; Dibog et
al, 1999, Davies & Maryati, 1999; Jones & Eggleton.,
2000; Jones et al., 2003), some others insist on the
influence of forest fragmentation (DeSouza & Brown,
1994) or on spatial scale and habitat heterogeneity
(Deblauwe et al., 2007). In comparison with
agricultural practices, the impacts of civil engineering
are little documented (Bengtsson & Rundgren, 1988;
Lavelle et al., 1997) and more knowledge is needed
about effects of repeated and large-scale disturbances
on communities and ecosystems (Paine et al., 1998,
Romme et al., 1998).
This study focuses on the impacts of a pipeline
running across Cameroon through savannahs and
forests that have already been more or less disturbed
by other types of human activities such as logging,
slash and burn cultivation or more intensive
agriculture. This study thus assesses the effect of
laying down the pipeline on some soil characteristics,
species richness and relative abundance of termites.
Materials and methods
Study sites
A pipeline, 1070 km long, crosses Cameroon and
carries crude oil from Doba, Chad, to Kribi on the
cameroonian coast (Fig. 1). It was laid down from
1999 to 2003 in a trench about 2 m deep and re-
covered with soil. This "large infrequent disturbance"
(Bengtsson, 2002) has subsequently been maintained
twice a year as an open corridor, 20 m wide, and has
been invaded by ruderal vegetation. Its impact on the
termite communities was assessed in 2008-2009,
about five years after the pipeline opening. Nine sites
from four ecosystems were sampled along the
pipeline in September-October 2008 and in May-July
2009. Their geographic coordinates were taken using
a GPS (Magellan Explorist 100) (table 1 and Fig. 1).
J. Bio. & Env. Sci. 2014
155 | Dieudonnén and Josens
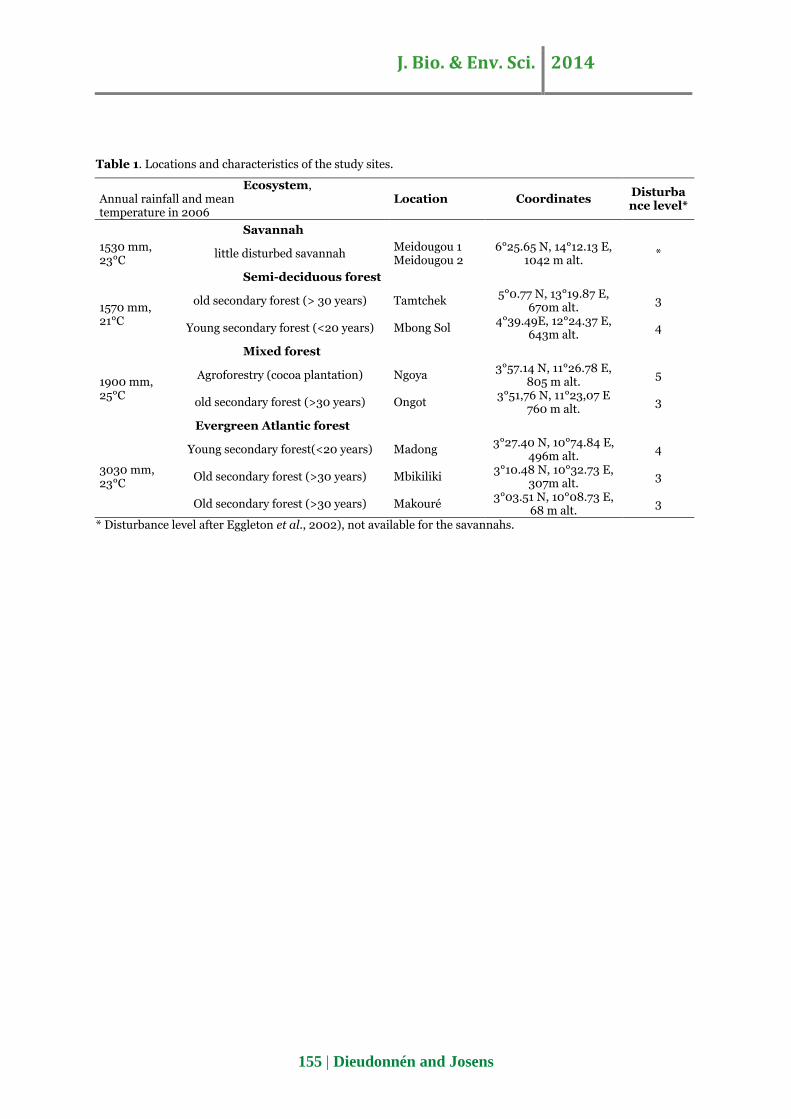
Table 1. Locations and characteristics of the study sites.
Ecosystem, Annual rainfall and mean temperature in 2006
Location Coordinates Disturbance level*
Savannah
1530 mm, 23°C
little disturbed savannah Meidougou 1 Meidougou 2
6°25.65 N, 14°12.13 E, 1042 m alt.
*
Semi-deciduous forest
1570 mm, 21°C
old secondary forest (> 30 years) Tamtchek 5°0.77 N, 13°19.87 E,
670m alt. 3
Young secondary forest (<20 years) Mbong Sol 4°39.49E, 12°24.37 E,
643m alt. 4
Mixed forest
1900 mm, 25°C
Agroforestry (cocoa plantation) Ngoya 3°57.14 N, 11°26.78 E,
805 m alt. 5
old secondary forest (>30 years) Ongot 3°51,76 N, 11°23,07 E
760 m alt. 3
Evergreen Atlantic forest
3030 mm, 23°C
Young secondary forest(<20 years) Madong 3°27.40 N, 10°74.84 E,
496m alt. 4
Old secondary forest (>30 years) Mbikiliki 3°10.48 N, 10°32.73 E,
307m alt. 3
Old secondary forest (>30 years) Makouré 3°03.51 N, 10°08.73 E,
68 m alt. 3
* Disturbance level after Eggleton et al., 2002), not available for the savannahs.
J. Bio. & Env. Sci. 2014
156 | Dieudonnén and Josens
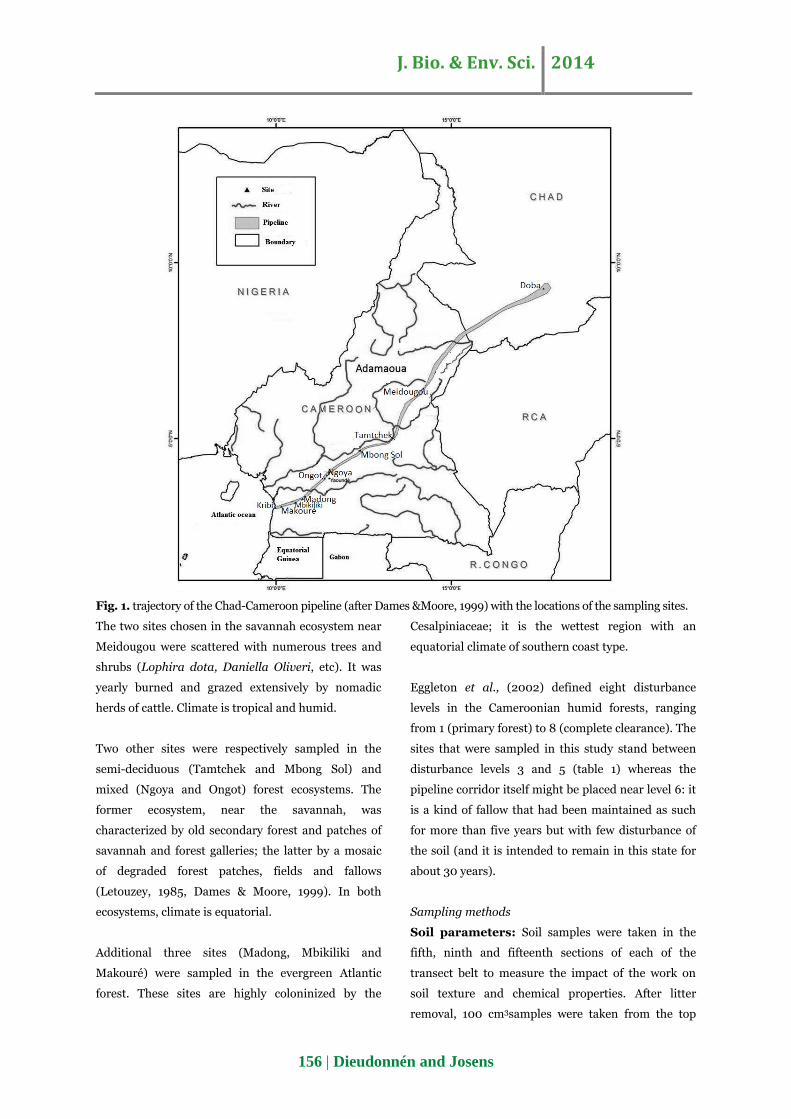
Fig. 1. trajectory of the Chad-Cameroon pipeline (after Dames &Moore, 1999) with the locations of the sampling sites.
The two sites chosen in the savannah ecosystem near
Meidougou were scattered with numerous trees and
shrubs (Lophira dota, Daniella Oliveri, etc). It was
yearly burned and grazed extensively by nomadic
herds of cattle. Climate is tropical and humid.
Two other sites were respectively sampled in the
semi-deciduous (Tamtchek and Mbong Sol) and
mixed (Ngoya and Ongot) forest ecosystems. The
former ecosystem, near the savannah, was
characterized by old secondary forest and patches of
savannah and forest galleries; the latter by a mosaic
of degraded forest patches, fields and fallows
(Letouzey, 1985, Dames & Moore, 1999). In both
ecosystems, climate is equatorial.
Additional three sites (Madong, Mbikiliki and
Makouré) were sampled in the evergreen Atlantic
forest. These sites are highly coloninized by the
Cesalpiniaceae; it is the wettest region with an
equatorial climate of southern coast type.
Eggleton et al., (2002) defined eight disturbance
levels in the Cameroonian humid forests, ranging
from 1 (primary forest) to 8 (complete clearance). The
sites that were sampled in this study stand between
disturbance levels 3 and 5 (table 1) whereas the
pipeline corridor itself might be placed near level 6: it
is a kind of fallow that had been maintained as such
for more than five years but with few disturbance of
the soil (and it is intended to remain in this state for
about 30 years).
Sampling methods
Soil parameters: Soil samples were taken in the
fifth, ninth and fifteenth sections of each of the
transect belt to measure the impact of the work on
soil texture and chemical properties. After litter
removal, 100 cm3samples were taken from the top
J. Bio. & Env. Sci. 2014
157 | Dieudonnén and Josens
soil layer (0-10 cm) with stainless steel rings of
known mass. Textural and chemical analyzes were
carried out in the laboratory of Soil Science,
University of Dschang, Cameroon, while pF analyzes
were performed by the laboratory of IITA
(International Institute of Tropical Agriculture) in
Yaoundé. For each kind of measurement, the three
data were averaged providing only one figure per
transect belt for further statistical analyses.
Water content and bulk density: the fresh 100
cm3 soil samples were weighed, oven dried at 105°C
and weighed again, allowing calculation of the water
content and bulk density.
Texture: organic matter was removed from the soil
samples with hydrogen peroxide and aggregates were
dispersed with sodium metacitrate. Sand particles (50
– 2000 µm) were sorted out by sieving. Silt (2 – 50
µm) and clay (< 2 µm) were sorted by sedimentation
and Robinson pipetting.
pH water: it was measured in water suspended soil
by a pH-meter Schötter with a combined glass and
reference electrode.
Nitrogen and carbon contents: total nitrogen was
measured by the Kjeldahl method and organic carbon
by oxidation with potassium dichromate in strongly
acidic medium.
Water content at pF= 3 & pF= 4.2: the
measurement method is the extraction of the water
under pressure in a Richards membrane press
(Eijkelkamp). Moisture measurements were carried
out at values of pF = 3 (1 bar, saturation point) and
4.2 (16 bars, wilting point) on unstructured (2 mm-
sieved) samples.
Termites
The sampling of termites was founded on
standardised transect belts 100 m long by 2m wide
that are claimed to provide representative samples
(Jones & Eggleton, 2000, Eggleton et al., 2002). Each
transect is made of 20 sections of 5 x 2 m and every
section was searched for 30 minutes by two men
(equivalent to a collection effort of 1 man*hour). In
each section every termite nest, sheeting and runway
was opened up to 2 m in height, tree bases and their
foothills, pieces of dead wood and accumulations of
litter as well as 12 soil samples 12 × 12 × 10 cm were
hand-sorted.
At each of the nine sites four transect belts were
made, parallel to the pipeline, two at 3 m on either
side (disturbed zone) and two at 32 m on either side
of the pipeline (control zone).
Termites were sorted and identified at the IRAD
laboratory (Institut de Recherche Agricole pour le
Développement, Yaoundé, Cameroon) and checked in
the laboratory of systematics and animal Ecology of
the Université Libre de Bruxelles (Belgium), to
species or morphospecies. They were classified into
the four feeding groups according to Donovan et al.,
(2001): group I: wood and litter feeding, lower
termites; group II: wood, litter and grass feeding,
higher termites; group III: termites feeding on very
decayed wood and organic matter-rich soil and group
IV: termites feeding on soil humus.
The presence of a species or morphospecies in a
section is designated as an occurrence and the
number of occurrences per transect is used as a
surrogate for the termite abundance, that can thus
vary theoretically between 0 and 20 for every species.
Data analysis
Changes in soil parameters and termite assemblages
were analysed according to zones (disturbed versus
control), to ecosystems and to sites within the
ecosystems by means of nested ANOVAs followed
with Tukey's tests at a 5% threshold with the software
STATISTICA 9.0. Levene's tests were used to
compare the variances; when significant, Kruskal-
Walis or U Mann-Withney tests were used instead of
ANOVA. The occurrences of termite species per
transect were used in principal component analysis

J. Bio. & Env. Sci. 2014
158 | Dieudonnén and Josens
(PCA) and in a cluster analysis to illustrate the
proximity/distance between ecosystems or zones. The
species richness accumulation curves were produced
with EstimateS (Colwell, 2005). The soil-termite
relationships were analysed with Spearman’s rank
correlations.
Results and discussion
Soil changes
Bulk density: The bulk density (kg/dm³) was
expected to be higher in disturbed zones due to
compaction by earth-movers and trampling, and this
was significantly the case (table 2): it was higher in
every forest site but it was not in the savannah. The
highest value (1.58 kg/dm³) near the pipeline at
Mbikiliki was not critical for soil organisms
(according to Pierce et al, 1983) probably because
quite a few plant material was incorporated into the
soil during levelling. According to Franzluebbers
(2002), a negative correlation should be observed
between the concentration of organic carbon and bulk
density; this was indeed confirmed (ρ = -0.62, p <
0.001).
Water content at sampling
The water content (%) of soil samples, besides the fact
that it can be influenced by recent rainfalls, was
expected to be lower in disturbed zones which were
exposed to direct sun radiation. This was indeed the
case in all sites (table 2).
Texture
Texture was expected to be affected by bringing up
deeper layers generally rich in clay to the soil surface
(Segalen, 1967). Indeed the clay content was very
significantly increased - and that of sand decreased -
in the disturbed zones of all forest sites (table 2).
However, it was not the case in the savannah sites,
where on the other hand the silt content was
increased.
pH water
Sclerenchyma rich litter (tree leaves) entails the
accumulation of humic acids (Doucet, 1994) and since
ruderal vegetation has replaced the forest in the
pipeline corridor, an increase of pH was expected in
the disturbed forest zone and such a tendency was
indeed observed. However, because of very significant
heterosecasticity a U test was used and failed to find a
significant difference between disturbed and control
zones (table 2).
Carbon and nitrogen
Litter mineralization in the pipeline corridor of forest
sites was expected to be faster than in the control
zone for two reasons: it is poorer in sclerenchyma and
exposed to direct sunshine (warmer). Therefore
carbon should be released faster (as CO2) than
nitrogen (sequestered in microorganisms) in the
disturbed zone, that would increase C/N. It can of
course also be argued that the disturbed zones were
covered with deep soil which is poor in organic matter
(Pfeiffer, 2010), but this has probably only little
influence five years after the pipeline completion.
Indeed on the one hand the carbon content was very
significantly lower in the disturbed zones (of all the
sites) and on the other hand the nitrogen content did
not differ significantly (table 2) with large variations
from site to site. As a consequence the C/N did not
differ significantly either.

J. Bio. & Env. Sci. 2014
159 | Dieudonnén and Josens
Table 2. Summary of soil parameters according to the zone (control versus disturbed, all the ecosystems being
pooled): means ± standard deviations with the results of the nested ANOVA and Levene’s tests. N = 18 / zone.
Variable Control zone Disturbed zone Means
ANOVA (1) Variances
Levene’s test (1)
Bulk density (kg/dm3) 1.15 ± 0.15 1.37 ± 0.16 *** ns
Water content at sampling (%)
21.2 ± 4.5 19.0 ± 3.0 ** ns
Clay (%) 24.6 ± 13.7 27.9 ± 13.1 ** ns
Silt (%) 17.7 ± 7.8 18.6 ± 7.5 ns ns
Sand (%) 57.7 ± 16.1 53.5 ± 13.2 *** ns
pH water 5.05 ± 0.59 5.29 ± 0.39 ns(2) **
Carbon (g/kg) 35.5 ± 9.0 29.3 ± 7.5 *** ns
Nitrogen (g/kg) 1.56 ± 0.50 1.44 ± 0.58 ns ns
C/N 23.6 ± 5.1 22.3 ± 8.0 ns(2) **
(1) ns = not significant (p > 0.05), * = p 0.05, **= p 0.01, ***= p 0.001.
(2) heteroscedasticity could not be reduced by data transformation ; comparison was made with a Kruskal test.
Termite assemblages
Total species richness and occurrences: In all
36 transects, 1686 termite occurrences were recorded
and 99 species or morphospecies recognised. An
impact on the termite assemblages was expected in
the disturbed zones and indeed the overall species
richness and diversity were significantly reduced
(table 3), suggesting a reduced range of ecological
niches. However, the total number of occurrences was
not significantly different (table 3), suggesting a
similar amount of resources in the disturbed and
control zones. The species accumulation curve
approaches an asymptote in the disturbed savannah
suggesting that the total species richness was almost
reached there, but this is not the case in the other
sites (Fig. 2).
The limited number of species will be analysed in
comparisons with (a) Eggleton et al., (2002) (133
species) who sampled the termite communities in a
gradient of anthropogenic disturbance in the humid
forests of Congo and southern Cameroon in 17
transect belts from primary forest to complete
clearance (disturbance levels from 1 to 8) and (b) with
Deblauwe et al., (2007) (117 species) who sampled the
termite communities in southeast Cameroon in five
transect belts in disturbance levels running probably
from 1 to 4.

J. Bio. & Env. Sci. 2014
160 | Dieudonnén and Josens
Table 3. Termite species richness, abundance and diversity according to the zone (control versus disturbed, all
ecosystems being pooled): means ± standard deviations with the results of the nested ANOVA and Levene’s tests.
N = 18 / zone.
Variable Control
zone Disturbed
zone Means
ANOVA (1) Variances
Levene’s test (1)
Overall species richness 17.9 ± 5.1 14.7 ± 4.3 ** ns
Species richness group I 0.28 ± 0.57 0.33 ± 0.59 ns ns
Species richness group II 4.61 ± 2.22 4.61 ± 1.85 ns ns
Species richness group III 5.72 ± 2.37 4.78 ± 2.15 p = 0.06 ns
Species richness group IV 7.28 ± 2.88 5.00 ± 2.00 ** ns
Total occurrences 45.4 ± 14.8 48.3 ± 18.6 ns ns
Occurrences group I 0.44 ± 0.98 0.61 ± 1.46 ns ns
Occurrences group II 14.3 ± 8.7 20.9 ± 11.0 *** ns
Occurrences group III 13.0 ± 6.6 14.9 ± 8.2 ns ns
Occurrences group IV 17.7 ± 6.9 11.9 ± 5.3 *** ns
Diversity (Shannon index) 0.99 ± 0.14 0.90 ± 0.17 ** ns
(1) ns: not significant (p > 0.05), *: p 0.05, **: p 0.01, ***: p 0.001.
0
10
20
30
40
50
0 10 20 30 40 50 60 70 80 90 100
Cum
ulat
ive
spec
ies r
ichn
ess
Section
FC
FD
SC
SD
Fig. 2. Species accumulation curves for overall forest
control sites (FC) and disturbed sites (FD) and for
savannah control sites (SC) and disturbed sites (SD)
Group I species richness and occurrences
The lower termites (feeding on wood and litter) are
only represented by three species in 19 occurrences,
most of them from the evergreen Atlantic forest
without any significant difference between control
and disturbed zones (tables 4 and 5). Three and one
species of these termites that inhabit pieces of dead
wood were recorded by Eggleton et al., (2002) and
Deblauwe et al., (2007) respectively.

J. Bio. & Env. Sci. 2014
161 | Dieudonnén and Josens
Table 4. Termite assemblages: species richness according to the ecosystem and to the zone (control versus
disturbed)
Group I Group II Group III Group IV Total
Evergreen forest (N = 12)
Disturbed 2 9 14 19 44
Control 2 7 13 17 39
Both zones 2 9 17 23 51
Mixed forest (N = 8)
Disturbed 0 6 9 9 24
Control 0 8 15 19 42
Both zones 0 9 15 21 45
Semi-deciduous forest (N = 8)
Disturbed 1 7 12 15 35
Control 1 8 12 19 40
Both zones 2 8 16 25 51
Savannah (N = 8)
Disturbed 0 12 9 12 33
Control 0 17 10 14 41
Both zones 0 19 13 15 47
All ecosystems (N = 36)
3 24 31 41 99
Table 5. Termite assemblages: abundance (number of occurrences) according to the ecosystem and to the zone
(control versus disturbed).
Group I Group II Group III Group IV Total
Evergreen forest (N = 12)
Disturbed 10 132 51 70 263
Control 7 65 47 86 205
Total 17 197 98 156 468
Mixed forest (N = 8)
Disturbed 0 39 54 27 120
Control 0 33 70 50 153
Total 0 72 124 77 273
Semi-deciduous forest (N = 8)
Disturbed 1 76 69 54 200
Control 1 56 68 105 230
Total 2 132 137 159 430
Savannah (N = 8)
Disturbed 0 129 94 63 286
Control 0 103 48 78 229
Total 0 232 142 141 515
Grand total 19 633 501 533 1686
Group II species richness and occurrences
The Termitidae feeding on wood, litter (mainly
fungus growers) and grass (in the savannah sites) are
represented by 24 species in 633 occurrences (tables
4 and 5). These termites are particularly abundant at
Mbikiliki (mainly Nasutitermes spp.) feeding on
partly rotten wood and in the savannah (mainly
Macrotermitinae and Trinervitermes spp.) feeding on
sound dead wood, fresh litter and grass.
Their species richness does not differ between control
and disturbed zones but the numbers of occurrences
are very significantly larger in the disturbed zones.
This probably results from the burying of felled
timber when the pipeline trench was levelled: indeed
some residual wood was still found in the soil (more
than five years after its burying). Birang (2004) found
also that wood feeders were faster resilient in
disturbed zones than other termites. Similarly
Eggleton et al., (2002) and Deblauwe et al., (2007)

J. Bio. & Env. Sci. 2014
162 | Dieudonnén and Josens
recorded 25 and 22 species of the group II
respectively.
Group III species richness and occurrences
The Termitidae feeding on very decayed wood and
carbon-rich soil are represented by 502 occurrences
and 31 species. The number of occurrences does not
differ significantly between control and disturbed
zones (tables 4 and 5), however, the species richness
might be impoverished in the disturbed zone, the
difference being marginally significant (p = 0.06).
The species richness recorded in group III is
markedly lower than those found by Deblauwe et al.,
(2007) (43 species) and Eggleton et al., (2002) (48
species). This is linked with the relatively low number
of species in the Anoplotermes group for two reasons:
(a) no primary or near primary forest was sampled in
this work and (b) some species of this group may have
been missed when sorting the samples.
Group IV species richness and occurrences
The Termitidae feeding on soil humus are
represented by 44 species in 533 occurrences. The
species richness and the number of occurrences are
both very significantly lower in the disturbed zones
than in the control ones (tables 4 and 5). Termites of
group IV being true soil feeders, some correlations
with various soil abiotic parameters (clay, C and N
content,...) could be expected but only two significant
correlations were found between their species
richness and (a) bulk density (ρ = - 0.45, p < 0.05)
and (b) organic carbon content (ρ = 0.41, p < 0.05).
The species richness sampled in group IV is lower than
those obtained by Eggleton et al., (2002) (57 species)
and Deblauwe et al., (2007) (51 species). This is linked
with the relatively low numbers of species in both the
Anoplotermes and Apicotermes groups for the same
reasons already put forward for the group III.
Termite assemblages
It is striking that the species richness follows the
same order of the feeding groups (IV > III > II > I) in
all the forests sites of this study, in those sampled by
Deblauwe et al., (2007) and in those sampled by
Eggleton et al. (2002) for disturbance levels lower
than 6. On the other hand the species richness follows
a different order (II > IV > III > I) in this study and in
the savannah of Lamto (Côte d’Ivoire) (Josens,
unpublished data), reflecting more available and
varied resources above ground and less below ground,
the annual bush fires preventing a significant part of
the plant production from being incorporated into the
soil (Lepage et al., 2006a & b).
It might have been expected (because of its changed
climate and vegetation) that the disturbed zone in the
semi-deciduous forest, which is located near the
savannah, would house a termite assemblage
approaching that of the savannah; however, this was
not the case and not any one of the typical savannah
species (e.g. Trinervitermes spp) was sampled there.
A cluster analysis based on the termite species
occurrences splits the 36 transect belts in four
distinguishable clusters: six out of the eight savannah
transect belts form a first cluster (‘SA group’) well
apart from the other transects; the two remaining
savannah transect belts, relatively poor in
Macrotermitinae, cluster with six out of the eight semi
deciduous forest transect belts (‘DF group’). The four
transect belts from Mbikiliki (evergreen Atlantic
forest) form a third cluster (‘MB group’) and finally
the fourth cluster is composed of the remaining 18
transect belts (‘EF-MF group’). Within each cluster
the samples from the disturbed zones tend to
aggregate more or less (starred in Fig. 3). The termite
assemblages appear thus more influenced by the
situational conditions than by the disruption of the
pipeline. The shape of the disturbed zone, a narrow
strip bordered on a long distance with the semi-
natural ecosystems, indeed favours the invasion of the
disturbed zone by the nearby assemblages.

J. Bio. & Env. Sci. 2014
163 | Dieudonnén and Josens
Fig. 3. Classification of transect belts according to the occurrences of all termite species. Each transect name is
made of 6 characters. Two first letters: DF: semi-deciduous forest, EF: evergreen Atlantic Forest, MF: mixed
forest, SA: savannah. Third and fourth letters: M1 and M2: Meidougou 1 and 2, MB: Mbikiliki, MD: Madong, MK:
Makouré, MS: Mbong Sol, NG: Ngoya, OG: Ongot, TK: Tamtchek. Fifth letter: D: disturbed, C: control. Sixth
character: transect number. : Transects of the disturbed zone.
A principal component analysis (PCA) was performed
on the total species richness (based on the
presence/absence of each species in each of the 36
transect belts); when the transect belts are projected
onto the factorial plan F1 x F2, on the one hand the
forest sites separate totally from the savannah sites
along axis 1 and on another hand the forest sites
spread out in a gradient along axis 2 (Fig. 4). On the
same factorial plan, the disturbed transects do not at
all separate from the control transects, the former
group being included as a shrunk version within the
latter group (Fig. 5A). The same, even striker, result is
obtained if only the species of feeding group IV
(which appears as the most sensitive to disruptions)
are used (Fig. 5B).
Fig. 4. Projection of the 36 transects belts on the
factorial plane F1xF2 grouped according to
ecosystems with equiprobable ellipses at 80%.

J. Bio. & Env. Sci. 2014
164 | Dieudonnén and Josens
Fig. 5A. Projection of the 36 transect belts on the
factorial plane F1xF2 of the total species richness,
grouped according to the zones (disturbed vs. control)
with equiprobable ellipses at 80%.
Fig. 5B. Projection of the 36 transects on the
factorial plane F1xF2 of the feeding group IV species
richness, grouped according to the zones (disturbed
vs. control) with equiprobable ellipses at 80%.
Conclusion
The Chad-Cameroon pipeline entailed the complete
clearing of about 3000 ha in 1999-2003, half in
forests and half in savannahs. The disturbed zone, in
2008-2009, looked as a long strip with about 2000
km of boundaries with the crossed semi natural
ecosystems. A little more than five years after the
pipeline completion the termite communities from
the adjacent ecosystems have invaded the disturbed
zone. Since those adjacent ecosystems were already
degraded (by other human activities) the new termite
assemblages showed rather few significant differences
with the nearby termite assemblages despite several
significant changes in the soil properties. The most
dramatic changes in the termite assemblages were (a)
a 18 % reduction of the species richness, (b) a 31 %
reduction of the number of occurrences of the group
IV (humus feeders) and (c) a 17 % increase of
occurrences of group II (wood feeders). It will be
worth to follow the future changes of the termite
assemblages in this unique man-made ecosystem.
Acknowledgements
We thank the Cameroon Oil Transportation
Corporation (COTCO) for supporting the first author
with a grant. We thank Prof. Mvondo Ze (University
of Dschang, laboratory of pedology) for his advice in
the soil analyses and Dr. Luc Dibog (IRAD) for his
assistance in the identification of the termite and the
access to the IRAD termite collection. We thank also
J. Deligne for valuable comments on an earlier
version of the manuscript.
References
Bengtsson J. 2002. Disturbance and resilience in
soil animal communities. European Journal of Soil
Biology 38 (2), 119 – 125.
Bengtsson G and Rundgren S. 1988. The Gusum
case: a brass mill and the distribution of soil
Collembola. Canadian Journal of Zoology 66, 1518-
1526.
Birang M. 2004. Soil Macrofauna community
structure along a gradient of land use intensification
in the humid forest zone of Southern Cameroon.
Tropical Resource Management Papers 197.
Colwell, RK. 2005. EstimateS: statistical estimation
of species richness and shared species from samples.
Version 7.5. Persistent URL
<purl.oclc.org/estimates>.
Dames and Moore. 1999. Chad export project
supplemental collection program Fishery survey of
pipeline route Cameroon portion. 44.

J. Bio. & Env. Sci. 2014
165 | Dieudonnén and Josens
Davies RG and Maryati, M. 1999. Termite
assemblages, forest disturbance and greenhouse gas
fluxes in Sabah, East Malaysia. Philosophical
Transactions of the Royal Society B 354, 1791 – 1802.
Deblauwe I, Dibog L, Missoup, AD, Dupain J,
Van Elsacker L, Dekoninck W, Bonte, D and
Hendrickx F. 2007. Spatial scales affecting termite
diversity in tropical lowland rainforest: a case study
in southeast Cameroon. African Journal Ecology 46,
5–18.
DeSouza O. and Brown VK. 1994. Effect of habitat
fragmentation on Amazonian termite communities.
Journal of Tropical Ecology 10, 197–206.
Dibog L, Eggleton P, Norgrove L, Bignell, DE
and Hauser S. 1999. Impacts of canopy cover on
soil termite assemblages in an agrisilvicultural system
in Southern Cameroon. Bulletin of entomological
Research 89, 125-132.
Donovan SE, Eggleton P and Bignell DE. 2001.
Gut content analysis and a new feeding group
classification of termites (Isoptera). Ecological
Entomology 26, 356–366.
Doucet R. 1994. La Science Agricole. Climat, sols et
productions végétales du Québec Eds Berger 569.
Eggleton P, Bignell DE, Sands WA, Mawdsley
NA, Lawton JH, Wood, TG and Bignell, NC.
1996. The diversity, abundance and biomass of
termites under different levels of disturbance in the
Mbalmayo Forest Reserve, southern Cameroon.
Philosophical Transactions of the Royal Society B
351, 51–68.
Eggleton P, Homathevi R, Jeeva D, Jones DT,
Davies RG and Maryati M.1997. The species
richness and composition of termite (Isoptera) in
primary and regenerating lowland Dipterocarp Forest
in Sabah East Malaysia. Ecotropica 3, 119-128.
Eggleton P, Bignell DE, Hauser S, Dibog L,
Norgrove L and Birang M. 2002. Termite diversity
across an anthropogenic disturbance gradient in the
humid forest zone of West Africa. Agriculture,
Ecosystems and Environment 90, 189-202.
Franzluebbers AJ. 2002. Water infiltration and
soil structure related to organic matter and its
stratification with depth. Soil and Tillage Research
66, 197–205.
Jones TD and Eggleton P. 2000. Sampling termite
assemblages in tropical forest: testing a rapid
biodiversity assessment protocol. J. appl. Ecol. 37,
191-203.
Jones TD, Susilo F X, Bignell DE, Hardiwinoto
S, Gillison AN and Eggleton P. 2003. Termite
assemblage collapses along a land-use intensification
gradient in lowland Central Sumatra, Indonesia.
Journal of apply Ecology 40, 380-391.
Lavelle P and Pashanasi B. 1989. Soil fauna and
land management in Peruvian Amazonia
(Yurimaguas, Loreto). Pedobiologia. 33, 283-291.
Lavelle P, Bignell DE, Lepage M, Wolters V,
Roger P, Ineson P., Heal OW and Dhillion S.
1997. Soil function in a changing world: the role of
invertebrate ecosystem engineers. European Journal
of Soil Biology 33(4), 159–193.
Lepage M, Abbadie L, Josens G and Lavelle P.
2006a. Role of Soil Fauna in Nitrogen Cycling. Lamto
Structure Functionning and Dynamics of a savannah
Ecosystem (Abbadie, L., Gignoux, J., Le Roux, X. and
Lepage, M. Eds) pp. 299-312.
Lepage M, Abbadie L, Josens G, Souleymane K
and Lavelle P. 2006b. Perturbations of Soil Carbon
Dynamics by Soil Fauna. Lamto Structure
Functionning and Dynamics of a savannah Ecosystem
(Abbadie, L., Gignoux, J., Le Roux, X. and Lepage, M.
Eds): 235-250.

J. Bio. & Env. Sci. 2014
166 | Dieudonnén and Josens
Letouzey R. 1985. Notice de la carte
phytogéographique du Cameroun 1 :500000. 102.
Paine RT, Tegner, MJ and Johnson, EA. 1998.
Compounded perturbations yield ecological surprises.
Ecosystems 1, 535–545.
Pfeiffer A. 2010. Effects of soil disturbance on
aggregation and mineral-associated carbon and
nitrogen storage. Senior Integrative Exercise. 41.
Pickett STA, Kolosa J, Armeso JJ and Collins,
SL. 1989. The ecological concept of disturbance and
its expression at various hierarchical levels. Oikos
54,129 – 136.
Romme W, Everham E, Frelich L, Moritz M
and Sparks R. 1998. Are large, infrequent
disturbances qualitatively different from small,
frequent disturbances? Ecosystems. 1, 524–534.