Influence of gibberellins on Nicotiana attenuata’s … · Influence of gibberellins on Nicotiana...
86
Influence of gibberellins on Nicotiana attenuata’s defense against insects Master‘s Thesis to obtain the master’s degree in Biology Faculty of Nature and Technic International Degree Course Industrial and Environmental Biology (M.Sc.) University of Applied Sciences Bremen, Germany composed by Thomas Fabisch Date: 17.11.2013
Transcript of Influence of gibberellins on Nicotiana attenuata’s … · Influence of gibberellins on Nicotiana...

Influence of gibberellins on Nicotiana attenuata’s defense against insects
Master‘s Thesis
to obtain the master’s degree in Biology
Faculty of Nature and Technic
International Degree Course Industrial and Environmental Biology
(M.Sc.)
University of Applied Sciences Bremen, Germany
composed by
Thomas Fabisch
Date: 17.11.2013

2
MPI for Chemical Ecology University of Applied Sciences Bremen Hans-Knöll-Strasse 8 Neustadtswall 30 D-07745, Jena D-28199, Bremen
The present master’s thesis originated as a product of the collaboration between the University
of Applied Sciences Bremen and the Max-Planck-Institute for chemical ecology in Jena. The
project took place at the MPI for chemical ecology in Jena in the time period from March 2013
to October 2013.
First examiner: Prof. Dr. Tilman Achstetter International Study Degree Industrial and Environmental Biology University of Applied Sciences Bremen Neustadtswall 30 D-28199 Bremen
Second examiner: Dr. Stefan Meldau Department of Molecular Ecology Max-Planck-Institute for Chemical Ecology Hans-Knöll-Strasse 8 D-07745 Jena
Supervisor: Dr. Stefan Meldau Department of Molecular Ecology Max-Planck-Institute for Chemical Ecology
Hans-Knöll-Strasse 8 D-07745, Jena

3
Statement of authorship
I hereby declare that this master’s thesis has been written
by myself and without any assistance of third parties.
Furthermore, I confirm that all references and verbatim
extracts have been quoted, and all sources of information
have been specifically acknowledged.
Jena, October 2013

4
Abstract Background: While the role of gibberellins (GAs) as growth hormones is well understood, less is
known about their influence on the plant’s defense against insect herbivores. By mining next
generation sequencing data, we identified 15 genes involved in GA biosynthesis and signaling in
Nicotiana attenuata. A large proportion of these genes are regulated by wounding or induction
of leaves with herbivore-derived elicitors, suggesting an important role of the GA pathway in
N. attenuata’s response to herbivore attack. To investigate the function of GA in the defense
process of plants against insect herbivores, we performed feeding experiments with Manduca
sexta larvae on N. attenuata plants treated with exogenously applied GA. Additionally, we
silenced genes involved in GA degradation (NaGA2ox3) and signaling (NaDELLA1) using virus-
induced gene silencing (VIGS). We analyzed control and simulated herbivory-induced levels of
phytohormones (abscisic acid, jasmonic acid, jasmonyl-isoleucine, salicylic acid), soluble
defense metabolites (nicotine, caffeoylputrescine, dicaffeoylspermidine, chlorogenic acid,
diterpene glycosides, rutin) and volatile organic compounds (VOCs).
Results: The analysis of the sequencing data revealed genes, regulated after wounding and
especially after perception of herbivore-derived elicitors. Compared to wild-type plants, larvae
of M. sexta grew significantly larger on plants treated with exogenous GA when compared to
mock-treated plants. The phytohormone and VOC levels were not different, neither between
GA-treated and wild-type, nor between empty vector and NaDELLA1, NaGA2ox3-silenced
plants, although some trends could be observed. The GA-treated plants showed decreased
levels of nicotine and dicaffeoylspermidine. Some metabolites did not change, indicating that
GAs regulate only specific branches of N. attenuata’s defense. DELLA1-silenced plants
contained less nicotine as well but dicaffeoylspermidine, chlorogenic acid and
cryptochlorogenic acid were increased. GA2ox3-silenced plants were mostly similar to the
empty vector plants except their elevated levels of chlorogenic acid. The VIGS data was partly
contradictory and difficult to interpret. A more fine-tuned regulation might have been the
reason as well.

5
Conclusion: The present results demonstrate that GA levels and signaling regulate
N. attenuata’s defense against M. sexta. Our data show that the GA pathway specifically
regulates only a subset of defense against herbivores. We outline future experiments aimed to
identify a role of GAs on other defense metabolites on N. attenuata, including protease
inhibitors. Using transgenic plants will allow us elucidating the cross-talk between JA and GA
signaling.
Keywords: gibberellin, jasmonic acid, Nicotiana attenuata, Manduca sexta, plant defense,
herbivory, virus-induced gene silencing

6
Contents Abstract ........................................................................................................................................... 4
1 Introduction .......................................................................................................................... 14
1.1 Gibberellins .................................................................................................................... 15
1.1.1 Gibberellin biosynthesis and its regulation ............................................................ 16
1.1.2 Gibberellin signaling................................................................................................ 17
1.2 Aim of this study............................................................................................................. 23
2 Material and methods .......................................................................................................... 27
2.1 Analysis of the microarray.............................................................................................. 27
2.2 Preparation of plant material ......................................................................................... 27
2.3 GA overdose experiment ............................................................................................... 28
2.3.1 M. sexta larval performance experiment ............................................................... 28
2.3.2 Other measurements .............................................................................................. 28
2.4 VIGS experiment ............................................................................................................. 28
2.4.1 Preparation of the VIGS constructs ........................................................................ 28
2.4.2 Transformation of the plasmid into N. attenuata .................................................. 32
2.4.3 VIGS procedure ....................................................................................................... 34
2.5 Measurements (GA overdose and VIGS) ........................................................................ 35
2.5.1 Phytohormones....................................................................................................... 35
2.5.2 Secondary metabolites ........................................................................................... 37
2.5.3 Volatiles ................................................................................................................... 38
2.6 Statistical analysis........................................................................................................... 40

7
3 Results ................................................................................................................................... 41
3.1 Analysis of the microarray.............................................................................................. 41
3.2 GA-treatment influences N. attenuata’s resistance to the specialist herbivore M. sexta
........................................................................................................................................ 43
3.3 Metabolomics GA-overdose........................................................................................... 44
3.3.1 Phytohormones....................................................................................................... 44
3.3.2 Secondary metabolites ........................................................................................... 45
3.3.3 Volatile organic compounds ................................................................................... 47
3.4 Metabolomics VIGS experiment .................................................................................... 48
3.4.1 Phytohormones....................................................................................................... 48
3.4.2 Secondary metabolites ........................................................................................... 49
3.4.3 Volatile organic compounds ................................................................................... 51
4 Discussion.............................................................................................................................. 52
4.1 M. sexta larval mass gain on plants with exogenous GA3 treatment ............................ 52
4.2 Phytohormone levels remained similar in GA sprayed and VIGS plants ....................... 53
4.2.1 ABA levels were not affected by GA spray or silencing but generally increased in
plants treated by spraying .................................................................................................... 53
4.2.2 JA and JA-Ile levels were not affected by GA spray and VIGS ................................ 55
4.3 Specifity in the effect of GA levels and signaling on secondary metabolites ................ 56
4.3.1 Nicotine levels decreased in GA sprayed and DELLA1 silenced plants ................... 56
4.3.2 GA spray partly influenced phenolamide levels ..................................................... 57
4.3.3 DELLA1 silencing decreased the rutin levels after water treatment ...................... 59
4.3.4 GA2ox3 and DELLA1-silencing increased chlorogenic acid levels .......................... 60
4.3.5 HGL-DTG levels decreased after W+OS induction in GA-sprayed plants ............... 60

8
4.4 Only few VOCs responded to GA-treatments and GA-related gene silencing............... 61
4.5 General discussion and future perspectives .................................................................. 62
5 Conclusion ............................................................................................................................. 67
6 Literature ................................................................................................................................. c
7 Appendix .................................................................................................................................. c
7.1 Additional measurements ................................................................................................. c
7.1.1 Differences in plant height......................................................................................... c
7.1.2 Differences in the angle of the rosette leaves ........................................................... c
7.2 Preparation of the VIGS construct ................................................................................... e
7.2.1 Amplification of the partial target gene ................................................................... e
7.2.2 Restriction digestion analysis ..................................................................................... f
7.2.3 Isolation of the target plasmids from E. coli after the transformation .................... h
7.3 Volatile organic compounds .............................................................................................. l

9
Table of Figures
Figure 1: Gibberellin A3 (Source: http://www.plant-hormones.info/gainfo.asp?ID=3) .............................................. 15
Figure 2: Simple scheme of the GA biosynthesis, degradation and signaling pathways and interaction with JA
signaling. ..................................................................................................................................................................... 20
Figure 3: Nicotiana attenuata (Photo: Danny Kessler) ................................................................................................ 21
Figure 4: Manduca sexta caterpillar ............................................................................................................................ 22
Figure 5: Simple scheme of RNAi silencing using PDS (phytoene desaturase) as an example. .................................... 24
Figure 6: binary plant transformation vector pTVLox 6/1. .......................................................................................... 30
Figure 7: binary plant transformation vector pBINTRA ............................................................................................... 33
Figure 8: Young N. attenuata plant approximately 20 days after VIGS with plasmid pTVPD...................................... 34
Figure 9: Simulation of herbivore attack on leaves of N. attenuata plants. ................................................................ 35
Figure 10: Varian ProStar 1200 QQQ MS (Varian, USA) .............................................................................................. 36
Figure 11: Agilent 1100-UV-Varian ELSD (Varian, USA)............................................................................................... 38
Figure 12: Volatile trapping using plastic cups, containing PDMS tubes (encircled red). ............................................ 38
Figure 13: SHIMADZU GC-MS – QP2010 Ultra Thermo desorption unit TD20 ............................................................. 39
Figure 14: Herbivory-induced regulation of genes involved into the GA pathway in Nicotiana attenuata. ................ 42
Figure 15: M. sexta larvae feeding on GA-treated plants of N. attenuata gained more mass over time. ................... 43
Figure 16: GA3 application does not alter the accumulation of herbivory-induced phytohormones. .......................... 44
Figure 17: Nicotine and dicaffeoylspermidine levels changed while others were not affected by GA3 treatment. ..... 46
Figure 18: Volatile organic compounds after 24h. ....................................................................................................... 47
Figure 19: Only JA-ile showed significant differences and only in the untreated control leaves. ................................ 48
Figure 20: DELLA1 and GA2ox3-silenced plants were altered in their secondary metabolite levels. .......................... 50
Figure 21: Possible outcomes of a caterpillar performance with wild-type (WT) and JA-deficient (JA(-)) lines. ........... 64
Figure 22: N. attenuata plants treated with GA were higher and showed elevated rosette leaves. ........................... 66
Figure 23: Spraying N. attenuata plants with 10 µM GA3 (in 0.035 % EtOH) increased their height. ........................... c
Figure 24: Gel electrophoresis after the PCR of N. attenuata cDNA .............................................................................. e
Figure 25: Gel electrophoresis of the extracted PCR products. ...................................................................................... f
Figure 26: Gel electrophoresis after restriction digestion of the extracted target DNA. ............................................... g
Figure 27: Gel electrophoresis of the digested target DNA. .......................................................................................... h
Figure 28: Gel electrophoresis performed after plasmid extraction and restriction digestion. ...................................... i
Figure 29: Gel electrophoresis performed after plasmid extraction and restriction digestion. ...................................... i
Figure 30: Gel electrophoresis performed after plasmid extraction and restriction digestion. ...................................... j
Figure 31: Gel electrophoresis performed after plasmid extraction and restriction digestion. ...................................... j
Figure 32: Gel electrophoresis performed after plasmid extraction and restriction digestion. ..................................... k

10
Figure 33: Gel electrophoresis performed after plasmid extraction and restriction digestion. ..................................... k
Figure 35: Emission of nicotine measured in the VIGS plants. ..................................................................................... m
List of tables
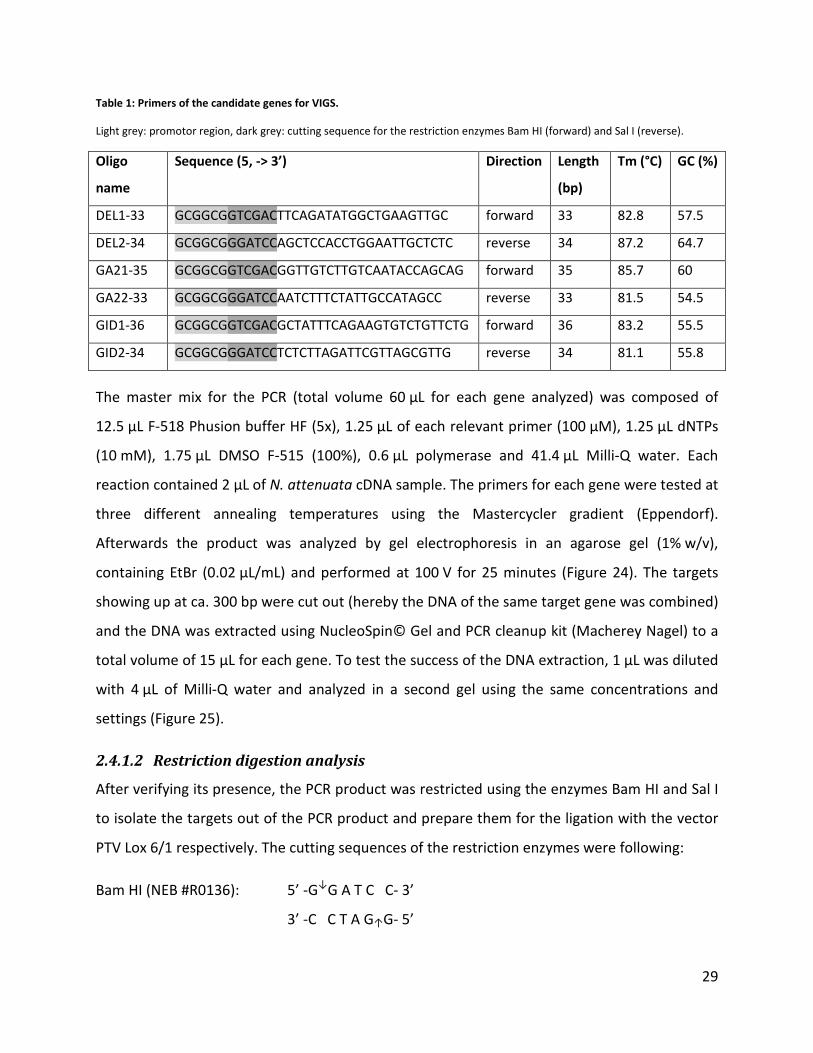
Table 1: Primers of the candidate genes for VIGS. ....................................................................................................... 29
Table 2: Measurements of the leaf-stem angle of N. attenuata plants. ........................................................................ d
Table 3: Volatile organic compounds (VOCs) in counts/cm2. ......................................................................................... l
Abbreviations
# 2ODD 2-oxoglutarate-dependent dioxygenase A: ABA abscisic acid AtGID1 gibberellin insensitive DWARF1 protein in Arabidopsis thaliana B: bp base pairs
BRs brassinosteroids C: CA chlorogenic acid CCA cryptochlorogenic acid cDNA complementary DNA CKs cytokinins COI1 Coronatine-insensitive protein 1 CP caffeoylputrescine CPS ent-copalyl diphosphate synthase CUL1 Cullin1 protein CYP714D1 elongated uppermost internode protein (EUI) D: d8 recombinant DELLA protein DWARF8 in maize
DAMP’s damage-associated molecular patterns DCS dicaffeoylspermidine DELLA protein family designated after N-terminal amino acid sequence D-E-L-
L-A dsRNA double stranded RNA
DTPs diterpene glycosides E: EUI elongated uppermost internode protein ESI electrospray ionization F: FACs fatty acid-amino acid conjugates

11
G: GA gibberellic acid GA2ox gibberellin-2-oxidase
GA3ox gibberellin-3-oxidase GA20ox gibberellin-20-oxidase GAI gibberellin insensitive protein GAMT S-adenosyl-L-methionin-dependent methyltransferase GC-MS Gas Chromatography-Mass spectrometry GID1 gibberellin insensitive DWARF1 receptor GID2 gibberellin insensitive DWARF2 receptor GLVs green leaf volatiles
H: HAE herbivore-associated elicitors
HAMP’s herbivore-associated molecular patterns HGL-DTGs 17-hydroxygeranyllinalool diterpene glycosides HPLC High Performance Liquid Chromatography
J: JA jasmonates JA-Ile jasmonyl-isoleucine conjugate JAZ1 JA ZIM-domain 1 protein K: KAO ent-kaureonic acid oxidase
KO ent-kaurene oxidase KS ent-kaurene synthase
L: LB medium comprised of yeast extract, sodium chloride and tryptone LC-MS Liquid Chromatography-Mass Spectrometry LOX3 Lipoxygenase 3
M: M. sexta Manduca sexta MYB8 transcription factor MYB8 MYC2 basic helix-loop-helix Leu zipper protein N: N. attenuata Nicotiana attenuata O: OD optical density
ODH optimal defense hypothesis ORF open reading frame OS oral secretions P: P450 cytochrome P450 monooxygenase pBINTRA plasmid containing parts of the tobacco rattle virus PCR polymerase-chain-reaction PDMS polydimethylsiloxane PIFs phytochrome interacting factors PIs proteinase inhibitors PTFE polytetrafluorethylene PTGS post-transcriptional gene silencing pTV00 empty vector plasmid pTVGOI plasmid containing gene of interest pTVPD plasmid for silencing phytoene desaturase

12
R: RBX1 RING box protein 1 (E3 ubiquitin ligase) RGA DELLA protein RGA in Arabidosis thaliana RGL DELLA protein RGL in Arabidopsis thaliana Rht DELLA protein in wheat RISC RNA-induced silencing complex RNAi RNA interference S: SA salicylic acid SCF complex Skp1, Cullin1 and F-Box protein complex SCR SCARECROW protein in Arabidopsis thaliana siRNA short interfering RNA Skp1 S-Phase kinase-associated protein 1 SLN1 DELLA protein in barley SLR1 slender rice 1 protein SLY2 SLEEPY2 protein in Arabidopsis thaliana
ssRNA single stranded RNA T: T-DNA transferring DNA Tm melting temperature
TPS terpene synthase TRV tobacco rattle virus
V: VIGS virus-induced gene silencing VOCs volatile organic compounds W: W+OS wounding plus oral secretions of Manduca sexta treatment
W+W wounding plus water treatment WT wild-type plants of Nicotiana attenuata
X: XERICO RING-H2 zinc-finger protein Y: YEP medium comprised of yeast extract, sodium hydroxide and peptone

13
Acknowledgements
First of all I like to thank my supervisor Dr. Stefan Meldau for his great supervision. With this
project I explored a completely special and fascinating branch of biology. Therefore it
demanded a lot of effort, energy and motivation. Thanks for keeping me motivated and
concentrated, thanks for realizing this project. I also thank Prof. Ian Thomas Baldwin for
providing the opportunity to write my master thesis at the department for molecular ecology at
MPI for chemical ecology in Jena. The time I spent here was full of new experiences. I like to
thank Evelyn Clauβen for helping me with the organization of my stay at the MPI. I thank Prof.
Dr. Tilman Achstetter and Dr. Stefan Meldau for their valuable comments and constructive
critics on my thesis. Furthermore I thank Martin Schaefer for his support with the experimental
procedures. He always found some time (and will) to help me with my data analysis or
measurements or simply with his experience. I also appreciate the help of all other members of
our working group: Nour Alhammoud, Ivan David Meza-Canales, Pia Backmann and Christoph
Bruetting. Thanks for your support, experience and critical feedback. Thanks simply for being
lovely colleagues as well. Having nice colleagues is the basis of high motivation. Many thanks go
to the technical assistants Antje Wissgott, Eva Rothe, Celia Diezel and especially to Wibke
Kroeber for their support and help during experimental procedures. At the same time I want to
thank the greenhouse team of the MPI for chemical ecology for taking care of my plants. I do
not even want to imagine how our work should be done without you. You are the heart of this
institution. Your help and support is crucial for making high quality science. Special thanks go to
Thomas Hahn, Klaus Gase and Matthias Schoettner for their support with their molecular
biological and technical experience. It is a very motivating feeling if one can rely on the
experience of others. This is what pushes science forward. Last but not least I want to thank my
family and friends. Although I have to admit that I could not be around all the time since I was
busy with my project, I still was with you in my thoughts. It is you, building the backbone, which
supports me when things become difficult and start to lose their transparency. I know that and I
will keep that in my mind forever. This is why I love you and this is why I will always love you.

14
1 Introduction Although plants are unable to flee biotic stress, they are not as helpless against herbivory as
one would think. Over millions of years they have evolved effective defense systems
maintained by specific metabolites. Plants can recognize herbivores through chemical and
mechanical cues and respond with a broad spectrum of defense systems in order to secure
their survival. Substances, which have repellent, antinutritive or toxic effects on herbivores but
also thorns, spines and tough leaves are direct defenses against insects. But a plant can have
indirect defenses too. Examples of indirect defenses are herbivore-induced plant volatiles and
nectar rewards that attract natural enemies of the attacker (HOWE and JANDER, 2008). Defense
metabolites are not equally distributed among different plant tissues. The optimal defense
hypothesis (ODH) predicts that the limited supply of resources leads to the accumulation of
defense metabolites to the most valuable, fitness relevant parts (MCKEY, 1974). The
accumulation of defensive metabolites in different tissues is often correlated with the
probability of an attack.
As described above, biosynthesis of defense metabolites is costly and often accompanied by
growth inhibition (POVEDA et al., 2003; ZHANG and TURNER, 2008) and lower seed production
(BALDWIN et al., 1990; BALDWIN, 1998). Therefore a plant expresses not all defense systems
constitutively. Plants can activate the production of defenses after perception of herbivory (ERB
et al., 2012). A major signaling cascade activated by perception of herbivory is the jasmonate
(JA) pathway which triggers downstream metabolic pathways leading to the expression of
various chemical defenses like toxins or digestion inhibitors (HOWE and JANDER, 2008). The JA
pathway is activated through perception of herbivory derived cues like damage-associated
molecular patterns (DAMP’s), herbivore-associated molecular patterns (HAMP’s) and wounding
(ERB et al., 2012). While the role of the JA pathway in defense against herbivores is well
described, the function of growth-related hormones, including gibberellic acid (GA), cytokinins
(CKs), auxins and brassinosteroids (BRs) is much less understood. However, recent data
demonstrate that the signaling networks induced by GAs, CKs, auxins and brassinosteroids are
cross-linked to each other and to the JA pathway and therefore possible regulate herbivory

15
resistance ((ERB et al., 2012; MELDAU et al., 2012). Among growth-related hormones, the role of
GAs as regulators of plant growth and defense are well studied. When attacked, the plants
release elevated levels of jasmonates, which interfere with the GA signaling cascade to
prioritize its defense over growth (D. L. YANG et al., 2012). However, whether GA influences
responses to herbivore attack is not known.
1.1 Gibberellins
Gibberellins are diterpene (composed of four isoprene units) plant hormones synthesized from
geranylgeranyl diphosphate, that control several aspects important for growth and
development like seed germination, stem elongation, leaf expansion, root growth as well as
flower and seed development ((RICHARDS ET AL., 2001; CAO ET AL., 2005; S. YAMAGUCHI, 2008;
TANIMOTO, 2012). Gibberellins were first isolated from
the fungus Gibberella fujikuroi (Sawada) Wollenw.
1931 (synonym Fusarium moniliforme Sheldon) by
Teijiro Yabuta in 1935 (YABUTA and SUMIKI 1938). Later,
gibberellins were discovered in several plants species
like maize, bean or peas (RADLEY, 1956; PHINNEY et al.,
1957; MACMILLAN and SUTER, 1958). G. fujikuroi causes
a disease of rice plants called “bakanae” which until
today can lead to great yield loss. Infected plant seeds
appear to be taller, have slender shapes and are slightly more chlorotic (ANDERSON et al. 2004).
In the beginning, the infected plants grow more rapid and taller but after some time they start
to senesce while healthy plants continue to grow. Most of the bakanae plants die before they
reach maturity. Plants reaching the mature stage usually show empty panicles or poorly
developed grains. The rapid elongation of the infected plants is mediated by GAs produced by
the fungus (ANDERSON et al. 2004). Since the first isolation of GAs from G. fujikuroi, a variety of
metabolites with GA-based structures were discovered. Not all of them are biologically active.
Only GA1, GA3 and GA4 (probably also GA5 and GA6) are thought to function as growth
regulating hormones while hundreds of inactive gibberellins identified until today
(http://www.plant-hormones.info/ga1info.htm) act as precursors for bioactive GA’s or present
Figure 1: Gibberellin A3 (Source: http://www.plant-hormones.info/gainfo.asp?ID=3)

16
inactivation products. YAMAGUCHI (2008) suggested that bioactive gibberellins are often
produced where they are needed. Especially actively growing and elongating tissues like shoot
apices, young leaves and flowers contain high levels of GA’s (JONES and PHILLIPS, 1966; KOBAYASHI
et al., 1988; ASHIKARI et al., 2002).
1.1.1 Gibberellin biosynthesis and its regulation
In Arabidopsis thaliana and in wheat seven key-enzymes (two terpene synthases (TPSs), two
cytochrome P450 monooxygenases (P450s) and three 2-oxoglutarate-dependent dioxygenases
(2ODDs) are crucial for the biosynthesis of bioactive GAs. These enzymes include ent-copalyl
diphosphate synthase (CPS), ent-kaurene synthase (KS), ent-kaurene oxidase (KO), ent-
kaureonic acid oxidase (KAO), GA 20-oxidase (GA20ox), GA 3-oxidase (GA3ox) and GA 2-oxidase
(GA2ox). CPS, KS, KO and KAO are involved in the transformation of geranylgeranyl diphosphate
to GA12, which act as a precursor for the formation of other types of GA. GA12 gets then
transformed to the bioactive forms by the enzymes GA 20-oxidase and GA 3-oxidase. GA 2-
oxidase degrades bioactive GAs to inactive forms (YAMAGUCHI, 2008) and in Arabidopsis also
proteins like S-adenosyl-L-methionin-dependent methyltransferases (GAMT1 and GAMT2) are
involved in the degradation process by methylation of the carboxyl group of bioactive GAs
(VARBANOVA et al., 2007). A simple scheme of the gibberellin biosynthetic pathway is shown in
Figure 2. In rice bioactive GA is deactivated by GA2ox and the P450 protein EUI (elongated
uppermost internode), designated as CYP714D1, which epoxidizes the 16,17 –double bond of
non13-hydroxylated GAs. This epoxidation includes inactive GAs like GA12 or GA9 but also the
bioactive form GA4 (YAMAGUCHI, 2008).
Studies have shown that GA biosynthesis is modulated by the action of light and GA itself. (AIT-
ALI et al., 1999) demonstrated on pea seedlings that GA20ox transcript levels were increased in
leaves and apical buds of light grown seedlings while the levels of GA 3β-hydroxylase (synonym
to GA3ox) were higher in etiolated seedlings. After treatment with bioactive GA1, plants
showed drastically decreased levels of both GA20ox and GA3ox transcription levels. (AIT-ALI et
al., 1999) concluded that the transcription of these genes is feedback inhibited by high levels of
bioactive GA1 and with different sensitivity. Similar results were revealed by other studies

17
(CHIANG et al., 1995; PHILLIPS et al., 1995; MARTIN et al., 1996; CARRERA et al., 1999; ROSS et al.,
1999; ASHIKARI et al., 2002; AYELE et al., 2006; GALLEGO-GIRALDO et al., 2008; SUZUKI et al., 2008,
reviewed in HEDDEN AND PHILLIPS, 2000), although they partly show that some genes of these
gene families don’t underlie feedback regulation at all (YAMAGUCHI et al., 1999; MATSUSHITA et al.,
2007).
1.1.2 Gibberellin signaling
1.1.2.1 GA receptors
In contrast to the GA biosynthesis which is well characterized (HEDDEN and PHILLIPS, 2000;
YAMAGUCHI, 2008; HUANG et al., 2012), the GA signaling pathway is much less understood. GA
receptors play an important role in the GA signaling cascade. SASAKI et al. (2003) isolated and
characterized the gibberellin insensitive DWARF2 (GID2) gene from the rice mutant gid2,
encoding the putative F-box protein GA insensitive dwarf 2 (GID2), which, as a part of the SCF
protein complex, is thought to be a positive regulator for GA signaling by degrading the DELLA
protein SLR1 (a repressor of GA signaling, orthologous to GAI and RGA in Arabidopsis, SLN1 in
barley, d8 in maize and Rht in wheat) via the ubiquitin 26S proteasome pathway. When part of
the SCFGID2 complex, GID2 functions as a receptor, selectively recruiting target proteins into the
complex which then get degraded via ubiquitination (SLR1, for example, is a target). The SCF
complex is part of multi subunit RING domain E3 ligases, which is named after three of its four
subunits Skp1, Cullin1 (CUL1) and the F-box protein. The last subunit is the RING-finger-
containing protein RBX1 (WANG and DENG, 2011). In Arabidopsis GID2, which is orthologous to
SLEEPY 2 (SLY2), is the F-box protein.
The gibberellin insensitive DWARF 1 (GID1) gene, which encodes the protein gibberellin
insensitive DWARF1 (GID1), is a soluble receptor for GA signaling. The GID1 gene was first
isolated and characterized from a GA insensitive dwarf mutant gid1 in rice (UEGUCHI-TANAKA et
al., 2005). It encodes a protein which has structural similarities to the hormone-sensitive lipase
(HSL) family, is localized in the nuclei and involved in the perception of bioactive GA, resulting in
the interaction of GID1 with SLR1, followed by the degradation of SLR1 through the SCFGID2
complex. Later, the receptor proteins SLEEPY1 (SLY1) and SNEEZY, executing the same DELLA

18
protein degrading function, were discovered in Arabidopsis (GRIFFITHS et al., 2006; NAKAJIMA et
al., 2006; WILLIGE et al., 2007). SLR1 stabilizes the binding of GA to the GID1 receptor (UEGUCHI-
TANAKA et al., 2007). It was suggested, that the stabilized GA-GID1-SLR1 complex is probably
targeted by the SCFGID2 complex, leading to the degradation of SLR1 (UEGUCHI-TANAKA et al.,
2007; UEGUCHI-TANAKA et al., 2007). Arabidopsis contains three GID1 receptor proteins, AtGID1a,
AtGID1b and AtGID1c. Among them, AtGID1b has different properties than the other GID1s. It
shows higher affinities for binding to GA and also interacts with DELLA proteins in presence and
absence of it (NAKAJIMA et al., 2006). It is likely that AtGID1b plays an elevated role for GA
signaling in Arabidopsis since it is able to interact with the DELLA protein RGA already at
concentrations ten times lower than the GA concentration needed for AtGID1a and AtGID1b
(NAKAJIMA et al., 2006).
1.1.2.2 DELLA proteins
DELLA proteins are involved in the GA signaling pathway and belong to the GRAS superfamily
which is designated after the proteins GAI, RGA and SCR. DELLA proteins are characterized by
their N-terminal DELLA domain (designated after a sequence of the amino acids aspartic acid
(D), glutamic acid (E), leucine (L) and alanine (A) in their N-terminal region), which is essential
for the GA-dependent GID1-DELLA interaction (PYSH et al., 1999; DILL et al., 2001; UEGUCHI-
TANAKA et al., 2007). GAs regulate the attenuation of DELLA proteins via the ubiquitin-
proteasome pathway (SILVERSTONE et al., 2001; FU et al., 2004; SMALLE and VIERSTRA, 2004; HUSSAIN
et al., 2007), although it is not known if the proteasome-mediated proteolysis is the only factor
degrading DELLA proteins (GALLEGO-BARTOLOME et al., 2010). In principle, the target substrate is
tagged by a polyubiquitin chain produced by the enzymes E1 (ubiquitin activating enzyme), E2
(ubiquitin conjugating enzyme) and E3 (ubiquitin ligase). The marked substrate is degraded by
the 26S proteasome enzyme. The polyubiquitin tag can be removed by deubiquitinating
enzymes (DUBs) for reuse in the next ubiquitination cycle (WANG and DENG, 2011). The
ubiquitination function can be carried out either as a single subunit protein or multi-subunit
protein complexes.
19
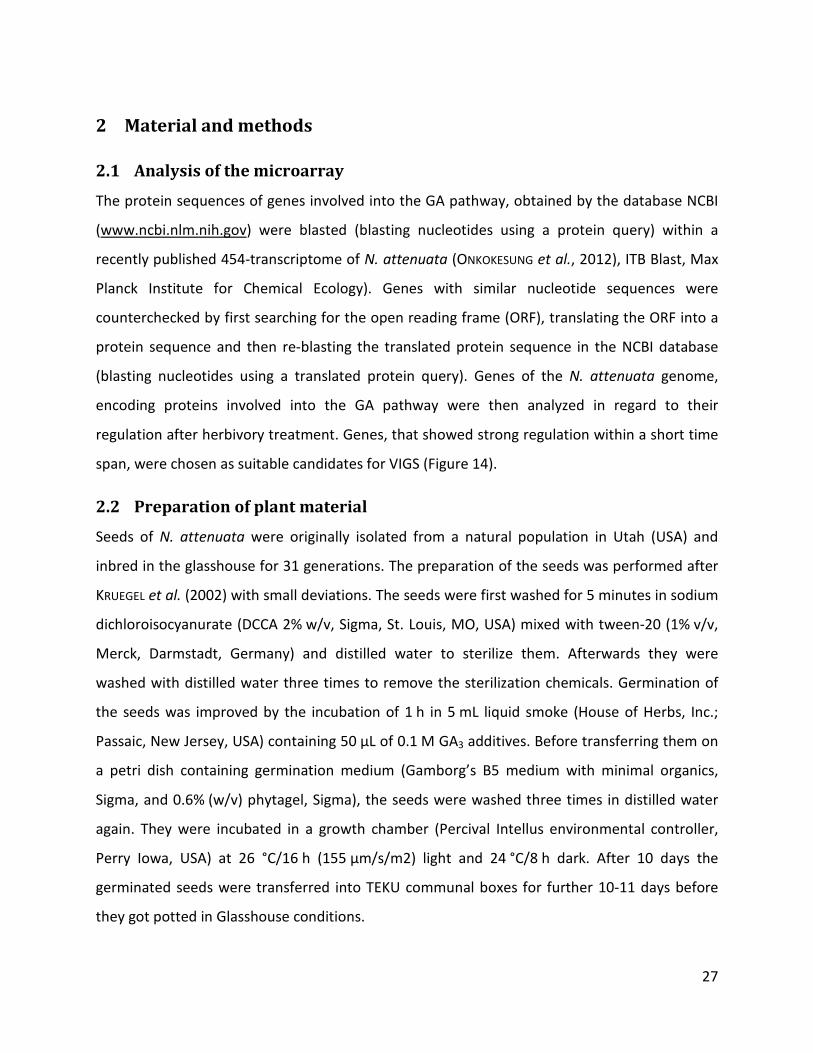
1.1.2.3 DELLAs link JA and GA pathways
In Arabidopsis, DELLAs influence the JA pathway by binding competitively to the JA ZIM
domain1 (JAZ1) protein, which is a key repressor of the JA pathway (Figure 2). While bound to
the DELLAs, JAZ1 can’t bind to MYC2, a key transcriptional activator of the JA pathway (HOU et
al., 2010). Therefore, MYC2 can activate the expression of JA pathway related genes. In the
absence of DELLAs, the JAZ1 protein binds to MYC2 and represses the expression of the genes
involved in the JA pathway (HOU et al., 2010). The degradation of DELLA proteins by GA can be
seen as one crosslink between the JA and the GA pathway. Additionally, DELLAs interact with
growth-promotion transcription factors like phytochrome interacting factors (PIFs) and repress
the transcription of GA responsive genes (ALABADI et al., 2008; DE LUCAS et al., 2008; FENG et al.,
2008; D. L. YANG et al., 2012). On the other hand, JA causes a delay in the degradation of DELLA
proteins, leading to delayed transcription of genes inhibiting the JA pathway. A DELLA-deficient
or non-function mutant shows less sensitivity for growth inhibition triggered by JA. Rice
contains only one gene encoding a DELLA protein (SLR1) while Arabidopsis contains five of
them, the repressor of ga1-3 (RGA), the genes encoding the RGA-like protein 1,2 and 3 (RGL1,
RGL2, RGL3), and the gene encoding the gibberellin acid insensitive mutant protein (GAI). They
are thought to be nuclear localized transcriptional regulators which accumulate under low GA
concentrations and act as repressors of growth and development in plants (SUN and GUBLER,
2004; CAO et al., 2005; FLEET and SUN, 2005; HUSSAIN et al., 2005). The proteins GAI and RGA have
their overlapping function in repressing the GA biosynthesis. Mutants of Arabidopsis lacking the
ability to produce these repressors show GA independent growth regulation. GA-deficient
mutants lacking GAI and RGA do not require GA for normal stem growth (KING et al., 2001).

20
1.1.2.4 Nicotiana attenuata and its defenses against insects
Nicotiana attenuata Torr. ex S. Watson, a species of wild tobacco plants, belongs to the family
Solanaceae (nightshade family) and inhabits the Great Basin Desert of western North America
ranging from British Columbia to Texas (http://plants.usda.gov/java/profile?symbol=NIAT). This
annual pioneer plant occurs in areas underlying periodic disturbances, which can e.g. be caused
by erosion or human activities. It grows up to 1.5 m (GOODSPEED, 1954) and is known to
germinate after bushfires (BARNEY and FRISCHKNECHT, 1974; YOUNG and EVANS, 1978), which are
Figure 2: Simple scheme of the GA biosynthesis, degradation and signaling pathways and interaction with JA signaling.
The round shapes present proteins involved in GA-related processes. GA12, which is a precursor for bioactive GAs, is synthesized from geranylgeranyl diphosphate via several intermediates through the enzymes ent-copalyl diphosphate synthase (CPS), ent-kaurene synthase (KS), ent-kaurene oxidase (KO) and ent-kaureonic acid oxidase (KAO). GA12 is transformed to bioactive GAs by GA 20-oxidases (GA20ox) and GA 3oxidases (GA3ox). Bioactive GAs are degraded to inactive forms by GA 2-oxidases (GA2ox) and (in Arabidopsis) S-adenosyl-L-methionin-dependent methyltransferases (GAMT). Bioactive forms of GAs are perceived by the receptor protein gibberellin insensitive dwarf 1 (GID1), leading to the formation of a complex with the DELLA proteins, which furthermore interact with GID2 (orthologous to Oryza SLY1) of the SCF complex initiating the degradation of the DELLA proteins via the 26S proteasome pathway. Degraded DELLAs can’t bind to the phytochrome interacting factors (PIFs), initiating the transcription of GA response genes. Degraded DELLAs also can’t bind competitively to the JA ZIM domain 1 protein (JAZ1), which therefore is bound by the transcription factor basic helix-loop-helix protein (MYC2). If MYC2 is bound to the JAZ1 protein, the transcription of JA pathway response genes is inhibited (upper-right picture). In the absence of GAs, DELLAs bind to JAZ1, leading to the release of MYC2 which initiates the transcription of JA response genes. Since also the PIF transcription factors are bound by DELLA, the transcription of the GA response genes stops (lower right picture). Transparent enzymes of GA biosynthesis and degradation could not be reliably identified within the genome of N. attenuata.

21
not uncommon in this region. After such fires the success rate of seed germination of
N. attenuata is increased and therefore the abundance of the plant is higher (BALDWIN and
MORSE, 1994; BALDWIN et al., 1994). Bushfires annihilate almost the entire vegetation and form a
layer of nutrient-rich ashes on the top of the soil. Seeds of N. attenuata can outlast for
centuries in the soil until water, nutrients and chemical substances originating from burned
organic matter initiate their germination (BALDWIN and MORSE, 1994; BALDWIN et al., 1994).
During rainfall-rich springs after years with bushfires, the conditions for germination are perfect
and N. attenuata can partly form large monocultures on burned soils. Several thousand seeds
can be produced by one plant (BALDWIN et al., 1998). Most of them start their germination in the
following years but during less favorable circumstances, some just fall in dormancy until the
next fire provide better conditions.
Special seed germination abilities provide
N. attenuata with great ecological benefits but its
germination behavior also leads to highly
unpredictable herbivore pressures. Most of the
defense metabolites produced as defense
responses against herbivores entail large fitness
costs in the absence of herbivores. This is why this
plant probably has evolved a sophisticated
herbivore perception and signaling machinery.
Beside the production of digestion inhibitors and
toxins (BALDWIN and OHNMEISS, 1993; HALITSCHKE and
BALDWIN, 2003), it is able to selectively attract
natural predators of the herbivores through the
release of specific volatiles (KESSLER and BALDWIN,
2001; HALITSCHKE and BALDWIN, 2003; HALITSCHKE et
al., 2008; DAS et al., 2013). Some of these plant
volatiles are known to influence the oviposition behavior of the herbivores as well (ALLMANN et
al., 2013). One of the natural enemies feeding massively on N. attenuata are larvae of the moth
Figure 3: Nicotiana attenuata (Photo: Danny Kessler)

22
Manduca sexta, (Figure 4) also known as tobacco hornworm or goliath worm (Lepidoptera,
Sphingidae), which commonly feeds on tomato, tobacco and other solanaceous plants
(http://entnemdept.ufl.edu/creatures/field/hornworm.htm). To prevent massive damage
caused by M. sexta herbivory, the plant releases proteinase inhibitors (PI), which slow growth
of M sexta (VAN DAM et al., 2001; ZAVALA et al., 2004). At the same time natural enemies like the
big-eyed bug Geochoris pallens (Hemiptera, Lygaeidae), which feed on eggs and younger
(smaller) stages of M. sexta, is attracted to infested plants of N. attenuata (SCHUMAN et al.,
2013). After its arrival it starts feeding on M. sexta, reducing the herbivore load and so
increasing the fitness of the plant (SCHUMAN et al., 2012). In an astonishing way, the plant
inhibits the growth of herbivores while natural enemies are attracted to infested plants, a
combination which provides a highly effective defense system for its survival. But how does
N. attenuata get the information if herbivores are present?
The plant can distinguish herbivore
damage from wounding by perceiving
herbivore-associated elicitors (HAE), such
as the fatty acid-amino acid conjugates
(FACs) in oral secretions (OS) of M. sexta
larvae which are introduced into wounds
during feeding (HALITSCHKE et al., 2001).
The perception of herbivore-associated
molecular patterns (HAMP) allows the
plant to orchestrate specific defense
responses upon attack of specific
herbivores (BONAVENTURE et al., 2011; ERB
et al., 2012). While the most valuable parts of N. attenuata continuously have higher
concentrations of the root produced toxin nicotine, also other important parts are defended by
the induction of this alkaloid. As mentioned above, the main pathway triggering these defense
mechanisms is the JA pathway. In N. attenuata, the defense responses include defense proteins
such as trypsin proteinase inhibitors (TPIs, GREEN and RYAN, 1972; VAN DAM et al., 2001;
Figure 4: Manduca sexta caterpillar
The population used in these experiments was inbreed since approx. 20 years by MPI for chemical ecology.

23
HALITSCHKE and BALDWIN, 2003), the biosynthesis of defense metabolites such as 17-
hydroxygeranyllinalool diterpene glycosides (HGL-DTGs), caffeoylputrescine (CP),
dicaffeoylspermidine (DCS) and nicotine (STEPPUHN et al., 2004; HEILING et al., 2010; KAUR et al.,
2010; HEINRICH et al., 2012), the activation of indirect defense, such as the biosynthesis and
release of volatile organic compounds (VOCs) from the leaves (KESSLER and BALDWIN, 2001;
SCHUMAN et al., 2012).
1.2 Aim of this study
The aim of this study was to analyze the influence of gibberellins on the defense system of
N. attenuata against insect herbivores. GAs influence the JA pathway through the
destabilization of the DELLA proteins, which interact with the JAZ protein (HOU et al., 2010). To
analyze the role of GA in N. attenuata’s defense response we first mined a microarray database
to identify GA-related genes that are regulated by wound or herbivore-derived cues in local and
systemic tissues. Further we selected candidate genes for Virus-induced gene silencing to verify
their role in plant immunity against insects. Virus-induced gene silencing (VIGS) is a virus vector
technology based on RNA interference (RNAi) and presents a technique where transcript levels
of target genes can be reduced to unravel their function (SCHEPERS, 2005). The principles behind
this method are shown in Figure 5. Basically a fragment (ca. 300 bp) of a target gene is inserted
into a viral genome containing T-DNA (transferring DNA) of a binary vector. Afterwards the
plasmid is introduced into Agrobacterium tumefaciens by transformation and the bacteria are
inoculated into the host plant. Inside the plant cell the T-DNA is implemented into the host
genome and transcribed by the host’s DNA-dependent RNA polymerase. Another enzyme, the
RNA-dependent RNA polymerase produces double stranded RNA (dsRNA) from the viral single
stranded RNA (ssRNA) transcript (BECKER and LANGE, 2010). The dsRNA induces the RNAi process.
The process consists of an initiator step and an effector step. During the initiation, the long
dsRNA (both strands complementary to the sequence of the target gene) is cleaved into short
interfering (si) RNAs (usually around 21-24 nucleotides in length) by a double strand-specific
RNase called “Dicer” (BERNSTEIN et al., 2001). During the effector step, the fragments are
incorporated into a protein complex and (after unwinding them) used as guiding sequence for
the recognition of homologous mRNA, which gets subsequently cleaved by a RNA-induced

24
silencing complex (RISC) leading to the degradation of the adequate mRNA (ZAMORE et al.,
2000). At the same time the single stranded siRNAs are amplified and spread as mobile
silencing signals throughout the plant, leading to a systemic silencing effect of the target gene
distant from the inoculation site (BECKER and LANGE, 2010). Naturally this effect occurs as
antiviral defense system of plants, fungi and animals (SCHEPERS, 2005). The effects of gene
Figure 5: Simple scheme of RNAi silencing using PDS (phytoene desaturase) as an example.
Phytoene desaturase (PDS) is an enzyme involved in the chlorophyll and carotenoid biosynthesis pathway. Silencing it results in bleaching of parts of the plant (QIN et al. 2007). In the beginning a cDNA (complementary DNA) containing a partial sequence of the PDS gene is inserted into a viral genome. The viral DNA is inserted into the T-DNA (transport DNA) of a binary vector. The plasmid is transformed into Agrobacterium tumefaciens and the bacteria are inoculated into the leave of the plant. Upon infection the plasmid is inserted into the host genome. During transcription DNA-dependent RNA polymerases produces single stranded RNA (ssRNA) of the T-DNA containing the target. RNA-dependent RNA polymerases uses the ssRNA as template to produce double stranded RNA (dsRNA), which is recognized by “Dicer” enzymes, cleaving the dsRNA into double stranded small interfering (si)RNAs. The RNA-induced silencing complex (RISC) incorporates the siRNA, unwind it and use it as a template for the degradation of the complemental parts of the transcript mRNA. At the same time the siRNAs are amplified and transported into other plant cells leading to silencing effects and in this case to bleaching in plant parts distant from the inoculation site.

25
silencing were first discovered in plants (NAPOLI et al., 1990) and the fungi Neurospora crassa
(COGONI and MACINO, 1997) where they have antiviral-defense purposes. In 1998, FIRE et al.
wanted to explain the unusual high silencing activity of sense control RNA found in a previous
reported antisense experiment in the worm Caenorhabditis elegans performed by (GUO and
KEMPHUES, 1995). They found that a simultaneous injection of sense- and antisense RNA lead to
10-fold higher silencing effects than antisense RNA alone. They concluded that dsRNA triggers
an efficient silencing mechanism in which the levels of target mRNA are reduced by exogenous
dsRNA. In conclusion, virus-induced gene silencing applies the RNAi mechanism to silence
target genes with the help of a virus (LU et al., 2003). The virus carries a partial sequence of the
target gene. When the virus spreads, the endogenous target gene transcripts, homologous to
the insert in the viral vector, are degraded by post-transcriptional gene silencing (PTGS) like
described above (BAULCOMBE, 1999). The present study used the tobacco rattle virus (TRV) to
silence genes involved in the GA pathway in N. attenuata.
To test our hypothesis, that GA can interfere with N. attenuata’s defense responses against
M. sexta herbivory, we measured the phytohormones abscisic acid (ABA), salicylic acid (SA),
jasmonic acid (JA) and its bioactive conjugate jasmonyl isoleucine (JA-ile) and compared three
different kinds of treatments (untreated control plants, plants treated with wounding plus
water and plants treated with wounding and oral secretions of M. sexta) for each transgenic
line. Significant changes in phytohormones and secondary metabolites levels could support the
theory of a linkage between the GA and JA pathway. The JA pathway is the main pathway for
defenses against herbivores in all plants studied so far (DE GEYTER et al., 2012). In N. attenuata,
the activated JA pathway triggers the transcription of genes encoding secondary metabolites
like nicotine (SAEDLER and BALDWIN, 2004), 17-hydroxygeranyllinalool diterpene glycosides (HGL-
DTGs, HEILING et al., 2010) and phenolic compounds like caffeoylputrescine (CP),
dicaffeoylspermidine (DCS), chlorogenic acid (CA, KAUR et al., 2010; HEINRICH et al., 2013) as well
as proteinase inhibitors (PIs) like e.g. trypsin proteinase inhibitor (YANG et al., 2011; HEINRICH et
al., 2012). Their quantitative levels and the transcript levels of genes involved into GA
degradation and signaling provide information about the activity of the JA pathway. With
silencing specific key modulators of the GA pathway it was therefore possible to answer the

26
question if GAs have an influence on the herbivory-induced accumulation of the former
mentioned metabolites. In detail we tried to answer the question if silencing DELLA1 and
GA2ox3, both genes encoding proteins whose reduction in abundance should lead to defense
symptoms similar to GA overdose, show decreased levels of nicotine, HGL-DTGs, CP, and DCS,
compared to wild-type plants. Contrary to DELLA1 and GA2ox3, silencing GID1a should lead to
phenotypes with defense symptoms caused by low GA levels. The former mentioned defense
metabolite levels should be increased.
Additionally some plants were treated by GA overdose. Plants with GA overdose should have
weaker defense responses since the massive presence of bioactive GA lead to the degradation
of DELLA proteins and therefore JAZ1 bind to MYC2 and stops the transcription of JA response
genes. To test this, the levels of phytohormones and secondary metabolites were compared for
plants treated with exogenous GA and plants treated without GA (mock). As a side effect the
plants could grow taller and more rapid since the GA pathway is activated but if there is an
inhibition effect of GA response genes to the GA biosynthesis, the plant treated with GA
overdose should show no increased growth symptoms.
Another interesting question was, if the feeding behavior of M. sexta is influenced by plants
with the exogenous application of bioactive GA. If these plants have lower defense responses,
the M. sexta should be able to feed more intensively, which results in gaining more mass over
time. To test this hypothesis, the mass of the larvae feeding on GA sprayed plants was
compared to the mass of larvae feeding on mock plants. A significant increase of larval mass
towards the larvae feeding on GA sprayed plants was expected.
Furthermore, volatile organic compounds like green leaf volatiles (GLVs) and terpenes are
released as a direct and indirect defense against herbivores. Therefore it was interesting to
measure the volatile levels of GA sprayed and VIGS plants and compare them to the levels of
mock plants. If GA influences the production of volatiles, differences in their levels should be
detectable in VIGS and GA overdose plants compared to the mock plants. If these differences
are responses to oral secretions of M. sexta and not to wounding alone, the levels should be
significantly different from wounding and water and the untreated control plants, respectively.
27
2 Material and methods
2.1 Analysis of the microarray
The protein sequences of genes involved into the GA pathway, obtained by the database NCBI
(www.ncbi.nlm.nih.gov) were blasted (blasting nucleotides using a protein query) within a
recently published 454-transcriptome of N. attenuata (ONKOKESUNG et al., 2012), ITB Blast, Max
Planck Institute for Chemical Ecology). Genes with similar nucleotide sequences were
counterchecked by first searching for the open reading frame (ORF), translating the ORF into a
protein sequence and then re-blasting the translated protein sequence in the NCBI database
(blasting nucleotides using a translated protein query). Genes of the N. attenuata genome,
encoding proteins involved into the GA pathway were then analyzed in regard to their
regulation after herbivory treatment. Genes, that showed strong regulation within a short time
span, were chosen as suitable candidates for VIGS (Figure 14).
2.2 Preparation of plant material
Seeds of N. attenuata were originally isolated from a natural population in Utah (USA) and
inbred in the glasshouse for 31 generations. The preparation of the seeds was performed after
KRUEGEL et al. (2002) with small deviations. The seeds were first washed for 5 minutes in sodium
dichloroisocyanurate (DCCA 2% w/v, Sigma, St. Louis, MO, USA) mixed with tween-20 (1% v/v,
Merck, Darmstadt, Germany) and distilled water to sterilize them. Afterwards they were
washed with distilled water three times to remove the sterilization chemicals. Germination of
the seeds was improved by the incubation of 1 h in 5 mL liquid smoke (House of Herbs, Inc.;
Passaic, New Jersey, USA) containing 50 µL of 0.1 M GA3 additives. Before transferring them on
a petri dish containing germination medium (Gamborg’s B5 medium with minimal organics,
Sigma, and 0.6% (w/v) phytagel, Sigma), the seeds were washed three times in distilled water
again. They were incubated in a growth chamber (Percival Intellus environmental controller,
Perry Iowa, USA) at 26 °C/16 h (155 µm/s/m2) light and 24 °C/8 h dark. After 10 days the
germinated seeds were transferred into TEKU communal boxes for further 10-11 days before
they got potted in Glasshouse conditions.

28
2.3 GA overdose experiment
60 plants potted in the glasshouse were grown until elongation phase. 37 days after seed
germination 30 plants were daily sprayed with 10 µM GA3 in 0.035% ethanol (EtOH). 30 plants
were only treated with 0.035% ethanol as control plants (mock). The plants were sprayed until
further measurements, which were performed during N. attenuata’s early flowering stage
41 days (phytohormones), 42 days (VOCs) and 43 days (secondary metabolites) after seed
germination.
2.3.1 M. sexta larval performance experiment
After 6 days of GA/EtOH treatment (43 days after seed germination) 15 GA-treated and
15 mock plants were exposed to herbivory attack by hatched larvae of M. sexta. Three larvae
were transferred onto one leaf of each plant. The daily GA/EtOH treatment continued during
the exposure of the plants to M. sexta. After approximately 36 h the larvae were transferred
onto a new leaf. The larvae weight was determined after 8 days, 10 days and 12 days of
feeding. The experiment (feeding plus determining larval mass) was performed twice.
2.3.2 Other measurements
During the experiment some visual abnormities of the GA sprayed plants were noted. The GA
sprayed plants seemed to grow taller and showed a smaller angle of rosette leaf positions.
These observations were measured with ruler and goniometer. The results are attached in the
end of this document (Appendix , Figure 23, Table 2).
2.4 VIGS experiment
2.4.1 Preparation of the VIGS constructs
2.4.1.1 Standard PCR
For each of the three candidate genes (GA2ox3, DELLA, GID1) specific primers were designed
and fragments were amplified with a polymerase-chain-reaction (PCR). The primer used
consisted of a partial nucleotide sequence of the gene (ca. 300 bp) and restriction enzyme
recognition sites for cloning (Table 1).
29
Table 1: Primers of the candidate genes for VIGS.
Light grey: promotor region, dark grey: cutting sequence for the restriction enzymes Bam HI (forward) and Sal I (reverse).
Oligo
name
Sequence (5, -> 3’) Direction Length
(bp)
Tm (°C) GC (%)
DEL1-33 GCGGCGGTCGACTTCAGATATGGCTGAAGTTGC forward 33 82.8 57.5
DEL2-34 GCGGCGGGATCCAGCTCCACCTGGAATTGCTCTC reverse 34 87.2 64.7
GA21-35 GCGGCGGTCGACGGTTGTCTTGTCAATACCAGCAG forward 35 85.7 60
GA22-33 GCGGCGGGATCCAATCTTTCTATTGCCATAGCC reverse 33 81.5 54.5
GID1-36 GCGGCGGTCGACGCTATTTCAGAAGTGTCTGTTCTG forward 36 83.2 55.5
GID2-34 GCGGCGGGATCCTCTCTTAGATTCGTTAGCGTTG reverse 34 81.1 55.8
The master mix for the PCR (total volume 60 µL for each gene analyzed) was composed of
12.5 µL F-518 Phusion buffer HF (5x), 1.25 µL of each relevant primer (100 µM), 1.25 µL dNTPs
(10 mM), 1.75 µL DMSO F-515 (100%), 0.6 µL polymerase and 41.4 µL Milli-Q water. Each
reaction contained 2 µL of N. attenuata cDNA sample. The primers for each gene were tested at
three different annealing temperatures using the Mastercycler gradient (Eppendorf).
Afterwards the product was analyzed by gel electrophoresis in an agarose gel (1% w/v),
containing EtBr (0.02 µL/mL) and performed at 100 V for 25 minutes (Figure 24). The targets
showing up at ca. 300 bp were cut out (hereby the DNA of the same target gene was combined)
and the DNA was extracted using NucleoSpin© Gel and PCR cleanup kit (Macherey Nagel) to a
total volume of 15 µL for each gene. To test the success of the DNA extraction, 1 µL was diluted
with 4 µL of Milli-Q water and analyzed in a second gel using the same concentrations and
settings (Figure 25).
2.4.1.2 Restriction digestion analysis
After verifying its presence, the PCR product was restricted using the enzymes Bam HI and Sal I
to isolate the targets out of the PCR product and prepare them for the ligation with the vector
PTV Lox 6/1 respectively. The cutting sequences of the restriction enzymes were following:
Bam HI (NEB #R0136): 5’ -G↓G A T C C- 3’
3’ -C C T A G↑G- 5’

30
Sal I (NEB #R0138): 5’ -G↓T C G A C- 3’
3’ -C A G C T↑G- 5’
The master mix for each sample used for restriction digestion was composed of 5 µL NEB Buffer
B3 (10x), 5 µL of BSA (10x), 23 µL of Milli-Q water, 1,5 µL of each restriction enzyme and 14 µL
of PCR product, summing up to a total volume of 50 µL. The mixture was incubated at 37 °C for
2 h. Afterwards the digested products each divided into two bags of 25 µL were analyzed by gel
electrophoresis (Figure 26). Again the targets around 300 bp were isolated and extracted using
the NucleoSpin© Gel and PCR cleanup kit. The total volume of restricted product was 20 µL for
each target. To verify the success, 1 µL of each product, diluted with 4 µL of Milli-Q water, was
analyzed on a gel (Figure 27). The settings for gel electrophoresis were the same like mentioned
above.
2.4.1.3 Ligase of the target genes with the vector PTV Lox 6/1
In order to construct a plasmid containing the
targets, the restricted DNA was ligated to the
vector PTV Lox 6/1, which also contained a gene
granting resistance against the antibiotic
kanamycin (Figure 6). The master mix contained
2 µL of Fermentas T4 DNA Ligase Buffer (10x),
5 µL each of the vector and the restricted target
DNA, 1 µL of Fermentas T4 DNA Ligase (#K1231)
and 7 µL of Milli-Q water. For the ligation of the
sample containing the GID1 gene a different
master mix, which was composed of 4 µL
Invitrogen T4 Ligase Buffer (10x), 5 µL each of
the vector and the GID1 target DNA, 1 µL of
Invitrogen T4 DNA Ligase and 5 µL of Milli-Q
water, was used. The reason for changing the
master mix was the unsuccessful ligation of GID1 with the vector and the low ligation success
Figure 6: binary plant transformation vector pTVLox 6/1.
TRV coat protein = coat protein of the Tobacco rattle virus, goi = gene of interest, TNOS = terminator novaline synthase gene, LB and RB = left and right border of T-DNA, ori ColE1 and ori pSa = origin of replication E. coli and A. tumefaciens, nptI = gene for neomycin phosphortransferase I, P35S = promotor, BamHI and SalI=restriction enzymes.

31
for DELLA and GA2ox, probably caused by the dysfunction of the DNA ligase. The ligation was
performed overnight at 16 °C for the Fermentas- and 14 °C for the Invitrogen ligase.
2.4.1.4 Transformation of the plasmid into Escherichia coli Top10 F-
Before performing the transformation the plasmid was purified. First 2 µL NaCl and 50 µL of
EtOH (96% v/v) were mixed with 20 µL of plasmid DNA. The mixture was stored at -80 °C for 4 h
to precipitate the plasmid and subsequently centrifuged at 4 °C and 13000 g for 15 minutes to
divide the plasmid from the supernatant. The supernatant was carefully removed with the
pipette and for each sample 100 µL of EtOH (70% v/v) was added as a second wash step. Again
the DNA was centrifuged at 4 °C and 13000 g for 15 minutes before the supernatant was
carefully removed. After centrifuging the sample one more time at 13000 g for 1 minute, the
EtOH was evaporated completely by storing the open tube at room temperature. Subsequently
the plasmid DNA was resuspended in 10 µL of Milli-Q water.
The transformation of the plasmid DNA into E. coli Top10 F- was performed via electroporation
using the MicroPulser Electroporator (BIORAD Laboratories, Germany) with the program Ec1
(1.80 kV, 1 pulse). 5 µL of each plasmid were added into 40 µL of E. coli Top10 F- suspension.
The suspension was then transferred into an electroporation cuvette and subsequently
subjected to electroporation. Immediately after transformation 700 µL LB-medium was added.
The suspension was then incubated on a shaker (Innova 4000, New Brunswick Scientific) for 1 h
at 28 °C, transferred on a petri dish with LB-medium containing 50 mg/L kanamycin and
cultivated overnight at 37 °C.
2.4.1.5 Isolation of the plasmid from transformed E. coli Top10 F-
Pure colonies of the cultivated bacteria were picked with a sterile pipette tip and transferred
into 3 mL liquid LB-medium containing 50 mg/L kanamycin. Afterwards they were incubated
overnight in a shaker at 28 °C. The plasmids were extracted using the NucleoSpin© Plasmid
extraction kit (Macherey Nagel) following the NucleoSpin© Plasmid/Plasmid (No Lid) protocol
using 2 mL of cultivated bacterial cells as template.
To control if the resistance of the transformed E. coli Top10 F- was caused by the insertion of
the plasmid and not by spontaneous mutation, 5 µL of the extracted plasmid DNA was analyzed

32
via restriction digestion and subsequent gel electrophoresis as described above. The presence
of partial DNA of the target genes around 300 bp were verified (Figure 28, Figure 29, Figure 30,
Figure 31, Figure 32, Figure 33).
2.4.1.6 Preparation of the plasmids for sequencing
After the verification of the target sequences in the plasmid DNA the samples were prepared
for sequencing. The target sequences on the plasmids were amplified by a PCR using a master
mix containing labeled nucleotides. In specify the master mix (20 µL) for one sample was
composed of 13,5 µL Milli-Q water, 4 µL BigDye reaction mix (company, kit), 0,5 µL either TRV1
or TRV2 primer and 2 µL of plasmid DNA. The mix was then amplified using the Eppendorf
Mastercycler gradient. Afterwards the PCR product was sequenced.
2.4.2 Transformation of the plasmid into N. attenuata
2.4.2.1 Preparation of electro-competent cells of Agrobacterium tumefaciens
The transformation of the plasmid into the plants of N. attenuata was performed using
Agrobacterium tumefaciens. In order to realize a successful transformation via electroporation
the Agrobacterium cells had to be electro-competent.
To produce electro-competent cells a pure culture of Agrobacterium was picked and grown
overnight at 28 °C in 4 mL of autoclaved YEP medium containing yeast extract (10 g/L), sodium
hydroxide (5 g/L) and tryptone/peptone from casein (10 g/L). The culture was subsequently
transferred into 300 mL of fresh YEP medium and incubated on the shaker (250 rpm) at 28 °C
until the optical density (OD600) reached approximately 0.5. The OD measurement was
performed using a photometer (BioPhotometer, Eppendorf, Germany). After reaching an OD600
of 0.57, the Agrobacteria culture was divided into 6 falcon tubes of 50 mL each. The falcon
tubes were centrifuged at 3214 g and 4 °C for 10 minutes and the supernatant was discarded.
The bacterial pellet was resuspended in 25 mL of ice cold sterile distilled water. The 6 falcon
tubes of 25 mL were combined to 3 tubes containing 50 mL of bacterial suspension before
centrifuging it again using the same settings. The supernatant was discarded and the pellets
resuspended in 25 mL of ice cold sterile distilled water. Two of the falcon tubes were combined
while the third was left uncombined. After centrifuging a third time using the same settings the

33
supernatant was discarded and the bacterial pellet resuspended in 25 mL of ice cold water. The
remaining two tubes were combined and centrifuged like described above. Again the
supernatant was discarded and subsequently 50 mL of ice cold sterile glycerol (10% v/v) was
added before centrifuging a last time at 4 °C for 10 minutes. The supernatant was discarded
and the bacterial pellet resuspended in 2 mL of 10% glycerol. 50 µL of the purified culture was
then aliquot into small cap tubes and frozen immediately on liquid nitrogen before storing
them at -80 °C.
2.4.2.2 Transformation of the target plasmid into Agrobacterium tumefaciens
The transformation of Agrobacterium was
performed similar to the transformation of the
plasmid into E. coli but instead of LB medium,
YEP medium was used instantly after the
electroporation. The transformed bacteria were
transferred to Agar plates with LB medium
containing 50 mg/mL kanamycin and incubated
at 28 °C for 36 h in the dark until colony growth
was sufficient enough to pick single colonies for
further treatment. Single colonies of the
transformed A. tumefaciens were picked from
the agar plates and grown overnight in a pre-
culture of 5 mL YEP medium containing
50 mg/mL kanamycin in the shaker at 28°C.
Additionally pre-cultures of the strains pTV00
(containing an empty vector without the target
DNA), pTVPD (silencing phytoene desaturase)
and pBINTRA were grown. The plasmid transformed into A. tumefaciens contained the target
DNA but also one of the two genetic parts, which produce the tobacco rattle virus. The other
part was produced in the Agrobacterium tumefaciens strain containing the plasmid pBINTRA. In
order to produce the virus these cultures had to be mixed together. This procedure was
Figure 7: binary plant transformation vector pBINTRA
Replicase = RNA-dependent RNA polymerase, T35S = terminator, TNOS = terminator for novaline sythase gene, nptII = kanamycin resistance gene for plants, nptIII = kanamycin resistance gene bacteria, PNOS = promotor novalin synthase gene, RB and LB = right and left border of T-DNA, oriV RK2 = replication origin of plasmid RK2, trfA RK2 = gene for plasmid replication protein (binds to and activates oriV), P35S, T35S = promotor and terminator, 29 kDa protein = movement protein of TRV, 16 kDa protein = suppressor of RNA silencing (to prevent silencing of TRV).

34
performed at a later point directly before VIGS. The pTVPD plasmid was used as a control for
the successful transformation of the VIGS construct into the plant while the pTV00 plasmid was
used as a negative control since the target DNA was not inserted.
After growing them overnight the pre-cultures were transferred into sterile Erlenmeyer-flasks
containing new YEP medium with 50 mg/mL kanamycin. Since the cultures containing the
target, the pTV00 and the pTVPD plasmid had to be mixed with the pBINTRA culture, the
volume of this culture had to be four times larger. The cultures were then grown until the OD600
reached a value between 0.4 and 0.6. The pBINTRA culture was divided into four cultures.
Subsequently, the cultures were aliquot into 50 mL falcon tubes and centrifuged at 2057 g for
5 min. The bacterial pellets were resuspended in a buffer comprised of 12.5 mL 5 mM
magnesium chloride (MgCl2) and 5 mM 2-(N-morpholino)ethansulfonic acid.
2.4.3 VIGS procedure
In the VIGS chamber, a special chamber in the glasshouse reserved for VIGS experiments, the
pTV00, pTVPD and the cultures containing the target plasmids were mixed with the pBINTRA
cultures to inject both parts of the virus. 28 days after seed
germination, approximately 1 mL of the mixed cultures was
inoculated into 3 rosette leafs of each plant using a syringe.
The inoculation was performed with 25 plants for GA2ox3, 25
plants for DELLA1, 25 plants for pTV00 and 5 plants for the
pTVPD construct. After approximately 20 days the plants
silenced in phytoene desaturase (pTVPD) showed bleaching of
the newer leaves and the stem. The bleached parts gave an
insight which leaves are silenced. Figure 8 shows that the
older parts of the plant were not silenced. Therefore only the
younger leaves of the DELLA1 and GA2ox3 silenced plants
were used for further experiments. Although the gel
electrophoresis after the restriction digestion of the GID1 plasmid showed bands around 300 bp
the sequence did not contain the target (counterchecked with the GID1 primer). After several
Figure 8: Young N. attenuata plant silenced in phytoene desaturase approximately 20 days after VIGS.

35
unsuccessful attempts to get a target product it was decided to skip the silencing of the GID1
receptor gene. Subsequently to the VIGS procedure the plants were kept in darkness for 2 days
before exposing them to the light.
2.5 Measurements (GA overdose and VIGS)
2.5.1 Phytohormones
The plants of the GA overdose (41 days after seed germination) and the VIGS experiment
(48 days after seed germination) were analyzed for their levels of Phytohormones 1 h and for
secondary metabolites 48 h after wounding. The youngest and second youngest leaf of each
plant was wounded. For the analysis of the VIGS plants the oldest (S1) and second oldest stem
leaf was used. Wounding was done by using a pattern wheel and the wounded leave was
subsequently supplied with water or 1:5 diluted (with water) oral secretions of M. sexta (Figure
9). The control plants remained untreated.
To analyze the phytohormones after 1 h, each side of the mid nerve of the youngest rosette
leaf of the GA overdose plants and the S1 leaf of the VIGS plants, respectively, was treated with
three rows of wounding. After 1 h the mid vain was cut out and the rest of the lamina was
transferred into 2 mL microfuge tubes and immediately frozen in liquid nitrogen. Prior to this
the leaf outline was drawn onto a paper sheet for calculating its surface. The surface was
measured with the program Photoshop Creativity Suite 5 (Adobe). The second youngest leaf
(for VIGS plants the second oldest stem leaf S2) was treated only with one row of wounding. A
Figure 9: Simulation of herbivore attack on leaves of N. attenuata plants.
The plant leaves were wounded with using pattern wheel. Subsequently, 1:5 diluted oral secretions of M. sexta larvae were applied to the leaves. To analyze the response after wounding alone, water instead of oral secretions was used.

36
second row was performed after 9 h and the third row after 24 h to imitate repeated feeding.
These leaves were harvested after 48 h using the same procedure than the 1 h experiment.
Before harvesting them the leaf volatiles were collected. The plant material was frozen at -80 °C
until further processing.
Later it was grinded to powder using a pestle. During the procedure the material was kept on
liquid nitrogen to prevent degradation of the phytohormones. Approximately 0.1 g of the
ground plant material was aliquot into 96 well Bio-tubes (1.1 mL individual tubes, Arctic White
LLC) containing 2 steel beads. 800 µL of ethyl acetate (containing 100 ng JA and 20 ng JA-Ile, SA
and ABA per sample as phytohormones standards) was added to the samples before they were
extracted at 1150 strokes/min for 5 minutes (Geno Grinder 2000, Spex Sample Prep, US) to
dilute the phytohormones into the
liquid phase. The concentrations of
the standards spiked into the
samples were 10 (ng/mL) for ABA,
SA and JA-ile and 50 (ng/mL) for JA.
The material was centrifuged at
2057 g for 20 min. The supernatant
was carefully transferred into new
1.5 mL tubes and evaporized at
45 °C (TurboVap®96, Biotage,
Sweden). After evaporating the
ethyl acetate, the solid phase was resuspended in 500 µL of MeOH (70 % v/v) using the Geno
Grinder at 1050 strokes per minute for 5 minutes followed by centrifugation at 2057 g for
20 minutes. 450 µL of the supernatant was transferred into glass vials and sealed with a lid. The
measurements of the phytohormones was performed through liquid chromatography mass
spectrometry (LC-MS) using the 1200L Triple-Quadrupol mass spectrometer (Varian, USA). The
samples (V=15 µL) were injected onto a ProntoSIL column (C18, 5 µm, 50 Ã – 2 mm, Bishoff,
Germany) attached to pre-column (C18, 4x2 mm, Phenomenex, USA) with a flow rate of
0.1 mL/min. As mobile phases, two solvents, solvent A (0.05 % formic acid) and solvent B
Figure 10: Varian ProStar 1200 QQQ MS (Varian, USA)
37
(0.05 % formic acid in methanol) were used. Solvent B was injected in a gradient mode. The
time/concentration for the gradient mode (min/%) for solvent B was 0:00/15, 1:30/15, 4:30/98,
12:30/98, 13:30/15 and 15:00/15 with a flow rate (mL/min) of 0:00/0.4, 1:00/0.4, 1:30/0.2,
10:00/0.2, 10:30/0.4, 12:30/0.4 and 15:00/0.4. The detection was performed with negative
electrospray ionization mode (ESI). The ESI generates molecular ions from the phytohormones
in the samples and the internal standards, respectively, by fragmenting the parent ions using
15 V collision energy. These specific ions were then used to create a compound chromatogram.
The compound chromatogram was adjusted and analyzed with the program Varian MS
workstation version 6.6 (Varian Inc., USA). The peak areas were adjusted manually and
subsequently integrated automatically by the program. The phytohormones were quantified by
comparing the peak areas of the sample with the peak areas of the internal standards.
2.5.2 Secondary metabolites
For the analysis of the secondary metabolite levels (GA-overdose 43 days and VIGS 50 days
after seed germination) also 0.1 g of the plant tissue was aliquot into 96 well Bio-tubes
containing 2 steel beads. 800 µL of extraction solvent (0.1 % acetic acid in 40/60 MeOH/H2O)
was added to each sample before shaking it at 1200 strokes/min for 1 minute. Afterwards the
suspension was centrifuged for 20 min at 2057 g and the supernatant carefully transferred into
a new Bio-tube. To ensure the absence of solid particles in the solvent the supernatant was
centrifuged again using the same settings. 450 µL of each extraction solvent was transferred
into a glass vial and sealed with a lid. The analysis was performed through High Performance
Liquid Chromatography (Agilent 1100-UV-Varian ELSD, Varian, USA, Figure 11) using a
chromatographic column (Chromolith FastGradient RP18e, 50 x 2 mm, Merk, Germany)
connected to a precolumn (Gemini NX RP18, 3 um, 2 x 4.6 mm, Phenomenex, USA). The
temperature of the column oven was set to 40 °C. The mobile phase consisted of two solvents,
solvent A (0.1 % formic acid and 0.1 % ammonium hydroxide in water, pH=3.5) and solvent B
(methanol) which were used in a gradient mode (time/concentration min/% for A: 0:00/100;
0.50/100; 6.50/20; 10:00/20; 15:00/100). The flow rate was set to 0.8 mL/min. The signal was
detected using PDA (Photo Diode Array) and ELSD (Evaporative Light Scatter Detector, Varian,

38
USA) detectors. Using these settings and
components, nicotine eluted at a retention
time (RT) of about 0.5 minutes and could be
detected under UV light at 260 nm wavelength.
Caffeoylputrescine, chlorogenic acid and
dicaffeoylspermidine with RT of 2.5, 3.2 and
4.1, respectively, were detected at 320 nm and
rutin (RT 4.9) at 360 nm. The 17-
hydroxygeranyllinalool diterpene glycosides (RT
7.8) were detected via the ELSD detector. The
data was analyzed with Chromeleon software
(version 6.8, Dionex). The peak areas were
integrated and adjusted to the weight of the
aliquot plant material. The concentrations of
nicotine, chlorogenic acid and rutin were determined via external dilution series of standard
mixtures. Caffeoylputrescine, dicaffeoylspermidine and 17-hydroxygeranyllinalool diterpene
glycosides were compared only via their integrated peak areas.
2.5.3 Volatiles
After 8 days of GA/EtOH treatment (45 days of seed germination) the GLVs and terpenes were
collected using polydimethylsiloxane (PDMS)
adsorption with PDMS tubes. The VOCs of
the VIGS plants were taken 49 days (GLVs)
and 50 days (terpenes) after seed
germination. For preparation the PDMS tubes
were cut into 5 mm long pieces, stored
overnight in 4:1 acetonitrile with methanol
(MeOH) and (after removing the supernatant
and transferring of the tubes into a 200 mL
glass column containing a glass frit) heated at
Figure 11: Agilent 1100-UV-Varian ELSD (Varian, USA)
Figure 12: Volatile trapping using plastic cups, containing PDMS tubes (encircled red).

39
210 °C for 3 h under nitrogen flow (2 L/min – PDMS tubes are sensitive to oxygen) before
storing them in polytetrafluorethylene (PTFE)-sealed glass vials containing Argon (Ar) gas until
further use. The collection of the volatiles was performed after the third wounding treatment
during the secondary metabolite analysis. After induction the wounded leafs were enclosed in
plastic cups containing the PDMS tube. After 1 h the tubes for GLV analysis were taken out of
the cup and transferred into PTFE-sealed glass vials. New PDMS tubes were placed into the
cups for the analysis of the terpenes. These tubes were left inside the cup for 24 h. The glass
vials containing the PDMS tubes for GLVs and the terpenes were stored at -20 °C or measured
directly after their collection. The same procedure was applied for the S2 leaves of the VIGS
plants.
The volatile analysis was performed through gas chromatography mass spectrometry using the
Ultra Thermo desorption unit TD20 connected to a quadrupole GC-MS-QP2010Ultra (Shimadzu,
Figure 13). The PDMS tubes were placed in 89 mm glass TD tubes (Supelco). After desorption in
liquid nitrogen with a flow rate of
60 mL/min at 200 °C the substances were
cyro-focused onto a Tenax® adsorbent
trap at -20 °C. After all substances were
focused the trap was heated to 230 °C
within 10 s and analytes were injected
using a 1:20 split ratio onto an Rtx-5MS
column with a diameter of 30 m 0.25 mm
and a film thickness of 0.25 µM (Resteck).
As carrier gas He was used with a
constant linear velocity of 40 cm/s. The
TD-GC interface was held at 230 °C. The oven was set to 40 °C for 5 min followed by 185 °C with
a thermal increase of 5 °C/min and subsequently to 280 °C raising the temperature 30 °C/min
and holding it for 0.83 min. For analysis of the samples the electron impact (EI) spectra were
recorded at 70 eV in scan mode from 33 to 400 m/z at a scan speed of 2000 Da/s. The transfer
line was held at 240°C and the ion source at 220°C. To prevent incorrect measurements caused
Figure 13: SHIMADZU GC-MS – QP2010 Ultra Thermo desorption unit TD20

40
by the breakdown of volatiles before they were measured, the samples were mixed during the
preparation. For each analysis (GLVs/Terpenes GA overdose 1 h, GLVs/Terpenes GA overdose
24 h, GLVs/Terpenes VIGS 1 h and GLVs/Terpenes VIGS 24 h) two empty tubes, one in the
beginning and one at the end of the measurement were included. Data processing was
performed with the program Shimadzu GC-MS solutions software (v2.72) provided by the
manufacturer converting the raw data for into computable documents format (cdf) via its
export function. The results were converted into the final dataset with an MS Excel macro file.
The results were filtered for values smaller than 5000 counts * second, which were considered
as background noise. Afterwards the values were adjusted to the leaf surface to get the final
unit (counts * second) per cm2. This unit was referred to as relative emission.
2.6 Statistical analysis
The present data was analyzed with the program SPSS Statistics 17.0 (IBM, USA) using
descriptive and univariate statistics. The normal distribution of the datasets was determined
with the Kolmogorov Smirnov (KS) test. Before comparing the means with either Student’s T-
test (if data was normal distributed and homoscedastic) or Mann-Whitney U-test (for
heteroscedastic datasets) the data was tested for homogeneity of variance using Levene’s test
and for outliers (caused by extreme values occurring in some plants) using the Grubbs test
(http://graphpad.com/quickcalcs/Grubbs1.cfm).

41
3 Results
3.1 Analysis of the microarray
To understand the influence of certain environmental conditions on organisms like (in this case)
N. attenuata plants, it is sometimes helpful to evaluate the transcriptional regulation of genes,
belonging to various pathways. The microarray data of ONKOKESUNG et al. (2012) contained more
than 100 genes, important as regulators of herbivory-induced defense responses in
N. attenuata. We used a homology-based method to identify all known genes, involved into GA
metabolism and signaling.
We were able to determine in total 21 genes, from which six belonged to GA biosynthesis
(NaGA20ox1/2, NaKS, NaKO, NaKAO, NaGA3ox1), six to GA degradation (NaGA2ox1/2/3/4/5/6)
and nine to GA signaling (NaGID1a/b/c, NaGID2, NaDELLA1, NaDELLA2, NaSPY1, NaSPY2,
NaSPY3). Only few of them showed a quick regulation (within 1 hour) in their transcripts after
herbivory simulation. Transcripts of NaGA2ox3 and NaGID1a were strongly up-regulated while
NaDELLA1 was slightly down-regulated especially after herbivory signals. Also NaGA20ox1 and
NaGA2ox2 showed strong and quick regulations but this regulation was no specific response to
herbivory simulation, since they were regulated after wounding alone. On the other hand, the
transcript levels of the genes NaKAO, NaGA3ox1, NaGA2ox4, NaGID1b and NaGID1c were
regulated specifically in response to herbivory signals but this response was not quick (Figure
14).
To further verify their involvement in N. attenuata’s response to herbivory, we reduced the
transcript levels of NaGa2ox3, NaGID1a and NaDELLA1 using VIGS. We did not use other genes,
since they did not respond quick or specific to herbivory simulation. Although the regulation of
DELLA1 was not quick and strong, we silenced it since it plays a key role in JA-GA signaling.
Furthermore, not all of the genes involved in the GA pathway of Arabidopsis, Oryza and
members of the family Solanaceae, which are studied well, could be found in the N. attenuata
genome. For example the gene encoding CPS was not detected.
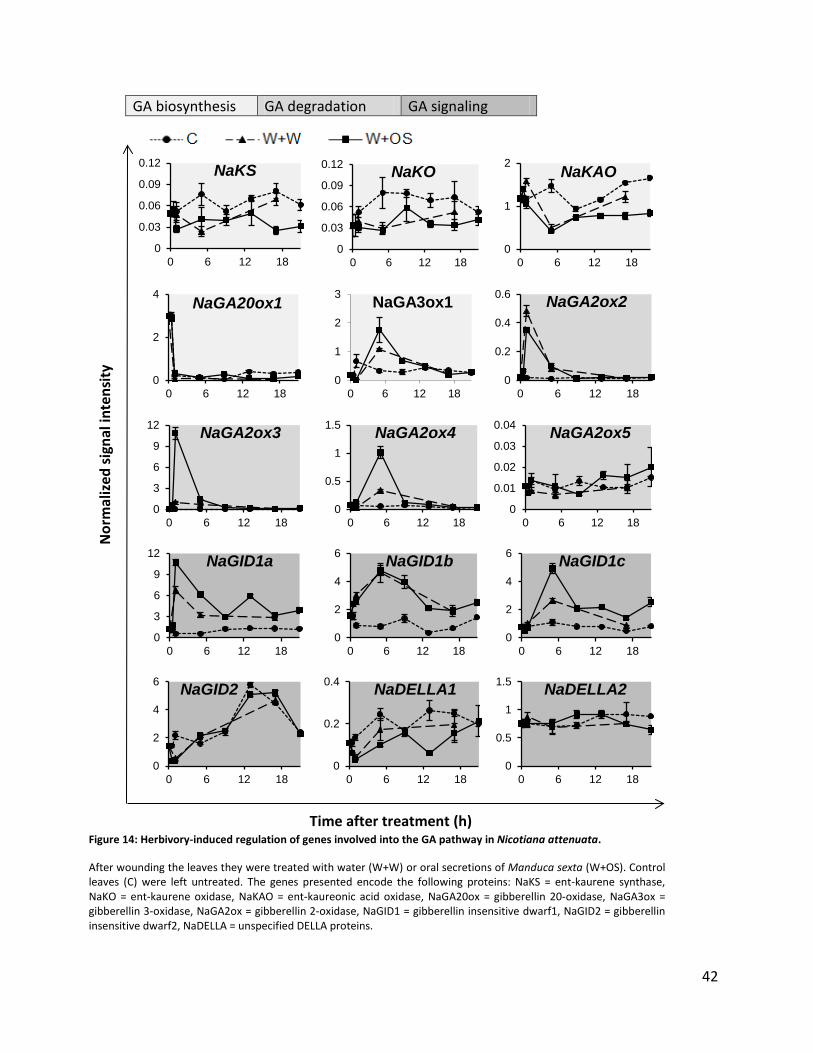
42
GA biosynthesis GA degradation GA signaling
Time after treatment (h)
Nor
mal
ized
sign
al in
tens
ity
0
0.5
1
1.5
0 6 12 18
NaDELLA2
0
0.2
0.4
0 6 12 18
NaDELLA1
0
2
4
6
0 6 12 18
NaGID2
0
2
4
6
0 6 12 18
NaGID1c
0
2
4
6
0 6 12 18
NaGID1b
0
3
6
9
12
0 6 12 18
NaGID1a
0
0.01
0.02
0.03
0.04
0 6 12 18
NaGA2ox5
0
0.5
1
1.5
0 6 12 18
NaGA2ox4
0
3
6
9
12
0 6 12 18
NaGA2ox3
0
0.2
0.4
0.6
0 6 12 18
NaGA2ox2
0
1
2
3
0 6 12 18
NaGA3ox1
0
2
4
0 6 12 18
NaGA20ox1
0
1
2
0 6 12 18
NaKAO
0
0.03
0.06
0.09
0.12
0 6 12 18
NaKO
0
0.03
0.06
0.09
0.12
0 6 12 18
NaKS
Figure 14: Herbivory-induced regulation of genes involved into the GA pathway in Nicotiana attenuata.
After wounding the leaves they were treated with water (W+W) or oral secretions of Manduca sexta (W+OS). Control leaves (C) were left untreated. The genes presented encode the following proteins: NaKS = ent-kaurene synthase, NaKO = ent-kaurene oxidase, NaKAO = ent-kaureonic acid oxidase, NaGA20ox = gibberellin 20-oxidase, NaGA3ox = gibberellin 3-oxidase, NaGA2ox = gibberellin 2-oxidase, NaGID1 = gibberellin insensitive dwarf1, NaGID2 = gibberellin insensitive dwarf2, NaDELLA = unspecified DELLA proteins.

43
3.2 GA-treatment influences N. attenuata’s resistance to the specialist
herbivore M. sexta
To further test the role of the GA pathway we sprayed plants with GA3, a bioactive GA that is
known to trigger the germination of N. attenuata seeds (SCHWACHTJE and BALDWIN, 2004). After
10 days the average mass of the larvae feeding on plants sprayed with 10 µM GA3 was highly
significantly larger than the ones feeding on the control (mock) plants. M. sexta larval mass gain
on the GA-sprayed plants (compared to the control plants) was approximately 17 % after 8
days, 50 % after 10 days and 63 % after 12 days.
The second caterpillar performance experiment showed similar results although the differences
were not that strong like in the former experiment (Figure 15 B). M. sexta larval mass gain on
GA-sprayed plants (compared to control plants) was approximately 5 % after 6 days, -2 % after
8 days, 26 % after 10 days and 37 % after 12 days.
These data demonstrate that altering GA levels influences M. sexta larval mass gain and
suggests that the GA pathway may change the levels of plant metabolites involved in the
defense against herbivores.
Figure 15: M. sexta larvae feeding on GA-treated plants of N. attenuata gained more mass over time.
The average mass of M. sexta feeding on N. attenuata plants treated with whether 10 µM GA3 dissolved in 0.035 % EtOH or only treated with 0.035% EtOH as control plants significantly increased after 10 days on plants sprayed with GA3. The black bars show the standard error, the stars above the level of significance calculated with Student’s t-test. A: first experiment. B: second experiment.
Time M. sexta larvae feeding on N. attenuata
Aver
age
M. s
exta
larv
al
0.0
0.1
0.2
0.3
0.4
0.5
0.6
6 8 10 12
***
*
0.0
0.1
0.2
0.3
0.4
0.5
0.6
8 10 12
control
GA spray
***
*
*** B A

44
3.3 Metabolomics GA-overdose
3.3.1 Phytohormones
Most of the stress responses in plants are regulated via phytohormones. Therefore we analyzed
phytohormones of N. attenuata to get a picture about possible connections between the
phytohormone levels and the levels of the defense metabolites. Although some changes were
observed for JA and its conjugate JA-Ile after wounding plus water (W+W) and wounding plus
oral secretions of M. sexta (W+OS), no significant changes could be seen between the plants
daily sprayed with 10 µM GA3 (dissolved in 0.035% EtOH) and the mock plants only sprayed
with 0.035% EtOH (Figure 16). The levels of SA and ABA remained steady.
Figure 16: GA3 application does not alter the accumulation of herbivory-induced phytohormones.
N. attenuata plants were daily sprayed either with 10 µM GA3 (dissolved in 0.035% EtOH) or with 0.035% EtOH only (mock) for 10 days during their elongation stage. Measurements of the local leaves were taken 1 h after wounding (using a pattern wheel) and subsequent application of water (W+W) or oral secretions of M. sexta (W+OS). The control leaves remained untreated. The measurements were performed during early flowering stage (41 days after seed germination). Black bars show the standard error. SA=salicylic acid, JA=jasmonic acid, JA-Ile=jasmonyl-isoleucine, ABA=abscisic acid, FM = fresh mass (leaf).
Conc
entr
atio
n (n
mol
* g
FM
-1)
ABA controlW+WW+OS
mock 10 µM GA3 mock 10 µM GA3
SA JA-Ile
JA 10
8
6
4
2
0
16
12
8
4
0
0.8 0.6 0.4 0.2 0.0
2.4
2.0
1.6
1.2
0.8
0.4
0.0

45
3.3.2 Secondary metabolites
The elucidation of defense metabolites like toxins or digestion inhibitors can be seen as a direct
defense against herbivores. Changes in the concentration of defense metabolites give insight
into the plant’s answer to herbivore attack. To study the role of GAs in the defense process, it
was indispensable to have a look at the “weapons” of the attacked N. attenuata plants. Some
secondary metabolites were reduced in the plants sprayed with exogenous GA (Figure 17).
The levels of nicotine and DCS were significantly lower for plants treated with 10 µM GA3
compared to the plants treated only with 0.035 % EtOH. The nicotine levels of the mock plants
increased after W+W and W+OS but the GA sprayed plants trended to result in a reduction of
nicotine similar to the level of the untreated control plants (W+W p=0.071). The reduction after
W+OS treatment was significant (p=0.03).
The levels of DCS were in general significantly lower for the GA sprayed plants independent if
they were wounded or not (control, p=0.036, W+W, p=0.013, W+OS, p=0.044). The levels of CP
and CA were higher for all plants treated by W+OS but there were no significant differences
between the plants sprayed with GA and the mock plants except the W+W treatment for CP
(p=0.032). The rutin levels remained unchanged. The HGL-DTG levels were similarly reduced in
response to W+OS-treatment (wild-type plants p=0.037, GA-sprayed plants p=0.047) but no
differences between mock plants and GA-sprayed plants were observed.
Taken these results together the only defense metabolites affected by GA-treatment were
nicotine, DCS and the HGL-DTGs. The other metabolites did not show changes in their
concentrations.

46
0.0
5.0
10.0
15.0
area
* g
FM
-1
HGLDTGs
0.0
1.0
2.0
3.0
4.0
mg
* g
FM-1
Rutin
0.0
5.0
10.0
15.0
20.0
area
* g
FM
-1
Dicaffeoylspermidine
0
200
400
600
800
1000
µg *
g F
M-1
Chlorogenic acid
0
5
10
15
20
area
* g
FM
-1
Caffeoylputrescine
0
200
400
600
800
1000
µg *
g F
M-1
Nicotine
ControlW+WW+OS
* *
*
* p=0.07
mock 10 µM GA3 mock 10 µM GA3
* *
Figure 17: Nicotine and dicaffeoylspermidine levels changed while others were not affected by GA3 treatment.
The secondary metabolite levels were compared between plants of N. attenuata daily sprayed with 10 µM GA3 (dissolved in 0.035 % EtOH) and plants only sprayed with 0.035 % EtOH (mock). The plants were sprayed for 10 days during their elongation phase. Measurements of the local leaves were taken 48 h after wounding (using a pattern wheel) and subsequent application of water (W+W) or oral secretions of M. sexta (W+OS). The control leaves remained untreated. The measurements were performed during early flowering stage (43 days after seed germination). Black bars show the standard error, the stars above the level of significance calculated by Student’s t-test and Mann- Whitney U-test (for heteroscedastic datasets), respectively. FM = fresh mass (leaf).
*

47
3.3.3 Volatile organic compounds
As mentioned in the introduction, VOCs are considered as indirect defense metabolites of
N. attenuata. To get a picture how GAs influence the indirect defense system of N. attenuata
plants, we measured the GLVs emitted after 1 h and the terpenes emitted after 24 h. Although
GLVs were measured for the GA overdose
and the VIGS experiment, the signals after
one hour were too weak to meet the
requirement to have at least three of five
replicates with values larger than
5000 counts * second for calculating the
average value of each treatment (control,
W+W, W+OS). More VOCs could be detected
after 24 h when terpenes were more
abundant than GLVs. The levels of GLVs or
terpenes showed only few differences
between the wild-type plants (GA overdose
experiment) and the plants treated with
external GA3. The entire dataset of the VOC
analysis is shown in the appendix (Table 3).
After 24 h the plants sprayed daily with
10 µM GA3 (dissolved in 0.035% EtOH)
showed a trend towards decreased
concentrations of the sesquiterpene E-α-
bergamotene (only W+OS p=0.052) and
(putative) α-terpineol (p=0.051). The data
are shown in Figure 18. E-alpha-bergamotene was induced strongly after the treatment with
oral secretions of M. sexta. After 24 h, GLVs like e.g. 3-(E)-hexenyl butanoate and 3-(E)-hexenyl
isobutyrate were also induced in response to W+W and W+OS but all these volatiles had no
statistical differences between control and GA sprayed plants.
p=0.056
Figure 18: Volatile organic compounds after 24h.
The VOCs were compared between plants of N. attenuata daily sprayed with 10 µM GA3 (dissolved in 0.035 % EtOH) and plants only sprayed with 0.035 % EtOH (mock). The plants were sprayed for 10 days during their elongation phase. Measurements of the local leaves were taken within 24 h after wounding (using a pattern wheel) and subsequent application of water (W+W) or oral secretions of M. sexta (W+OS). The control leaves remained untreated. The measurements were performed during early flowering stage (42 days after seed germination). The black bars are standard errors, the stars above the level of significance calculated either by Student’s T-test or Mann-Whitney U-test (for heteroscedastic datasets).
Rela
tive
emis
sion
0
2
4
6
PUTATIVE alpha-Terpineol
p=0.051
0
10
20
30
40(E)-alpha-Bergamotene
controlW+WW+OS
mock 10 µM GA3 blank

48
3.4 Metabolomics VIGS experiment
3.4.1 Phytohormones
When comparing the phytohormones levels of the GA overdose with the VIGS experiment, the
concentration of ABA was much higher for the plants sprayed either with 0.035 % EtOH
(control) or 10 µM GA3. These levels were about ten times more concentrated than the ABA
levels of the VIGS plants. Also the JA-Ile levels were slightly higher. Contradicting to that the
levels of JA were increased in the VIGS plants. The concentration of SA remained steady for
each treatment. The only significant changes calculated was between the JA-Ile levels of the
untreated pTV00 (empty vector) plants and the untreated plants silenced in DELLA1 (p=0.017).
as well as the untreated plants silenced in GA2ox3 (p=0.021). These changes were not observed
for the W+W and the W+OS treatment (Figure 19).
ABA controlW+WW+OS
pTV00 DELLA1 GA2ox3
SA
pTV00 DELLA1 GA2ox3
JA-Ile
JA
Conc
entr
atio
n (n
mol
* g
FM
-1)
*
Figure 19: Only JA-ile showed significant differences and only in the untreated control leaves.
The phytohormone levels (local leaf) of N. attenuata plants silenced in DELLA1 or GA2ox3 were compared to the empty vector plants (pTV00). Measurements were taken 1 h after wounding (using a pattern wheel) and subsequent application of water (W+W) or oral secretions of M. sexta (W+OS). The control leaves remained untreated. The measurements were performed during elongation phase (48 days after seed germination). Black bars show the standard error, the stars above the level of significance. FM = fresh mass (leaf).
0.6
0.4
0.2
0.0
0.6
0.4
0.2
0.0
*
24
20
16
12
8
4
0
4 3 2 1 0

49
3.4.2 Secondary metabolites
Compared to the GA overdose experiment the secondary metabolite levels of the VIGS
experiment were generally lower. The most extreme difference was observed for
dicaffeoylspermidine and chlorogenic acid. In some cases the DELLA1 genotype was different
from the empty vector (PTV00) and the GA2ox3.
The nicotine levels of the control and after W+W treatment were significantly lower (p=0.02
and 0.018, respectively) compared to pTV00, although there was no difference after W+OS. The
levels of chlorogenic acid (control p=0.001 and W+OS p=0.016), its isomer cryptochlorogenic
acid (control p=0.032, W+OS p=0.016 and a trend after W+W p=0.076) and
dicaffeoylspermidine (only after W+OS p=0.032).
Compared to pTV00 and GA2ox3, the DELLA1 silenced plants showed no differences in the
levels of rutin but compared to the control plants the rutin levels were already significantly
reduced after W+W (p=0.013) while significant differences for pTV00 and GA2ox3 were only
seen between control plants and plants treated by W+OS (Figure 20). Also contradicting to
pTV00 and GA2ox3 the HGL-DTG levels in DELLA1-silenced plants were not suppressed after
W+OS but no statistical evidence could be brought to cover this observation.
The plant genotype silenced in GA2ox3 gene showed much less responses referring to the levels
of secondary metabolites but still there were some increases in the concentration of
chlorogenic acid (control p=0.039, W+OS p=0.015) and its isomer cryptochlorogenic acid
(control p=0.028). The nicotine, rutin, dicaffeoylspermidine and 17-hydroxygeranyllinalool
diterpene glycosides (HGL-DTGs) levels were statistically similar to the pTV00 plants (Figure 20)
but rutin was significantly reduced in response to W+OS in the GA2ox3 plants (compared to
GA2ox3 control plants).

50
0
20
40
60
80
100
μg *
g F
M-1
Chlorogenic acid
**
*
0.0
1.0
2.0
3.0
4.0
pTV00 DELLA1 GA2ox3
area
* g
FM
-1
HGLDTGs
0.0
0.2
0.4
0.6
0.8
1.0
1.2
pTV00 DELLA1 GA2ox3
area
* g
FM
-1
Dicaffeoylspermidine
**
0
200
400
600
800
1000
µg *
g F
M-1
Rutin * ***
*
0.0
0.5
1.0
1.5
2.0
2.5
area
* g
FM
-1
Cryptochlorogenic acid
**
*
0
50
100
150
200
250
µg *
g F
M-1
Nicotine
controlW+WW+OS
*
p=0.076
*
*
* *
*
Figure 20: DELLA1 and GA2ox3-silenced plants were altered in their secondary metabolite levels.
The secondary metabolite levels (local leaf) of the plants silenced in DELLA1 and GA2ox3 were compared to the levels of the empty vector plants (pTV00). Measurements were taken 48 h after wounding (using a pattern wheel) and subsequent application of water (W+W) or oral secretions of M. sexta (W+OS). The control leaves remained untreated. The measurements were performed during the elongation phase (50 days after seed germination). Black bars show the standard error, the stars above the level of significance calculated either by ANOVA or Mann-Whitney U-test (for heteroscedastic datasets). FM=fresh mass.
p=0.101

51
3.4.3 Volatile organic compounds
Like in the GA-overdose experiment the GLVs released after 1 h were too low in their
concentration. The values were lower than 5000 counts * second, which we set as a baseline.
Furthermore the blank levels were very high. In most cases (except nicotine) they were much
higher than ten percent of the largest value, so that they were not taken into consideration
(SCHUMAN M., personal information). Although there were some reductions of the emitted
nicotine in DELLA1- and partly also in GA2ox3-silenced plants, nicotine was excluded from the
analysis since N. attenuata plants have high levels of nicotine and the slightest injury of leaves
or especially breaking some trichomes could have distorted the results. Therefore we could not
rely on them (the nicotine emission is shown in the appendix, Figure 34). Because of the high
blank levels the data are difficult to interpret. The values were summed up in the appendix
(Table 3).

52
4 Discussion
4.1 M. sexta larval mass gain on plants with exogenous GA3 treatment
In both larval performance experiments the larvae grew significantly larger on plants treated
with 10 µM GA3 compared to the mock plants. From this result it can be concluded that
gibberellins have an effect on larval growth on M. sexta. Also the average larval mass on control
plants of about 300 mg after 12 days was similar to other studies (SON TRUONG et al., 2013; YANG
et al., 2013) although there are also performance experiments showing much higher masses on
mock plants (OH et al., 2012; YANG et al., 2012; HETTENHAUSEN et al., 2013). Maybe the difference
is caused by the disturbance of the larvae by the spray treatment, which was performed daily.
Additionally, although very much diluted, all plants were sprayed with 0.035 % EtOH due to the
insufficient solubility of gibberellic acid in water. Also the untreated mock plants had to be
sprayed with EtOH to ensure the quality as a control plant and make them comparable with the
plants treated with exogenous GA. It seems reasonable that the M. sexta caterpillars feeding on
the plants ingested some of the ethanol. This could probably cause the lower weight compared
to other studies. Our results are still interesting since all caterpillars were exposed to the same
conditions except the treatment with GA.
One question arising from the experiment is how the larvae of M. sexta, which were cultivated
since many years, perform in comparison to natural populations. The colony used for the
performance experiments has their origin in the California State University and was established
at the MPI for chemical ecology in 2002. Since its establishment the colony was occasionally
inbreed with colonies from other institutions (verbal information from KESSLER D., 2013). Recent
investigations came to the result that all major colonies reared in the world derived from the
same mass rearing facilities in Raleigh, North Carolina, established 1960 from field collections in
Clayton, North Carolina (DIAMOND et al., 2010). These colonies were reared and selected in
laboratory environment for decades as well as kept on artificial diet and therefore the
performance and the behavior might be different from natural populations. However, although
there is no information about the behavior of M. sexta reared under laboratory conditions
available yet, DIAMOND et al. (2010) tested the overall performance of M. sexta natural

53
populations versus laboratory colonies when placing them on natural host plants. They
concluded that there are only slight differences between laboratory animals and animals of a
natural population when it comes to performance and fitness although laboratory reared M.
sexta animals showed slightly shorter developmental times and partly higher pupal masses.
This means that the performance of the M. sexta used in the present study is probably not far
apart from natural situations. The problem left is the behavior. The present study focused only
on the question if or if not M. sexta caterpillars grow better on GA sprayed plants. If the larger
mass gain on GA-sprayed plants is based on behavioral differences (e.g. reduced movement)
requires further observation. However, one has to think about that when applying this data to
natural situations. Lots of other factors beside the plant itself can influence the feeding
behavior of M. sexta in the field. While it looks like plants with high doses of GA have ecological
disadvantages compared to other plants (M. sexta ingests more of the plant within the same
time span) there could be other factors like competitive herbivores also attracted by plants
reduced in their defense responses which disturb the feeding behavior and the development of
M. sexta. Therefore, from an ecological point of view, it is conceivable that the results might be
different when compared to experiments, performed under natural environments.
4.2 Phytohormone levels remained similar in GA sprayed and VIGS plants
4.2.1 ABA levels were not affected by GA spray or silencing but generally increased
in plants treated by spraying
Spraying plants of N. attenuata with GA did not alter the phytohormone levels compared to the
mock plants but the spray treatment itself had great effects on the levels of abscisic acid. In
other studies the concentrations of ABA in control plants were approximately between 120 and
400 ng/g FM (HETTENHAUSEN et al., 2012; SON TRUONG et al., 2013). The ABA concentrations
measured in our study were much higher (approximately 1000 to 1200 ng/g FM). ABA is known
to be involved into plant biotic and abiotic stress responses like drought stress response (LEUNG
et al., 2012). Beside this it regulates embryo and seed development, germination and
vegetative development as well as general growth and reproduction (CUTLER et al., 2010). The
best studied function of ABA is its key role in regulating stomata closure (ROYCHOUDHURY et al.,

54
2013). High values of ABA measured during the GA overdose experiment might have been
caused by spraying, leading to stomata closure. Compared to the GA overdose experiments the
ABA levels of the VIGS plants with approximately 60-130 ng/g FM were much lower but the
plants were not sprayed externally. Due to this it is difficult to compare the ABA levels of both
experiments. Additionally the development stages of the plants were different too. While the
plants of the GA overdose experiment were analyzed during early flowering stage, the VIGS
plants were analyzed during the elongation stage. However, there was no significant change
between the ABA levels of the empty vector plants and the plants silenced in DELLA1 and
GA2ox3 gene. The success of the VIGS experiment has still to be proven by analyzing the
transcript levels (silencing efficiency) of DELLA1 and GA2ox3. If gene silencing can be confirmed,
then it can be concluded that GAs probably do not affect the ABA levels of plants. On the other
hand there is increasing evidence about a crosslink of ABA and GA, at least for early
developmental stages of the plant. Already in the 1980ies researchers observed that the non-
germinating Arabidopsis seedlings caused by GA deficiency partially germinated when crossed
with ABA deficient mutants (KOORNNEEF et al., 1982). Also other studies concluded that during
imbibition and seed development of Arabidopsis seeds ABA is involved in the suppression of GA
biosynthesis (SEO et al., 2006). Furthermore, it is known that ABA-deficient mutants germinate,
if the GA biosynthesis is inhibited by paclobutrazol or uniconazol treatments (NAMBARA et al.,
1991; NAMBARA et al., 1998). It is thought that GRAS type proteins act as a linking hub (GOLLDACK
et al., 2013). In fact, recent studies by ARIIZUMI et al. (2013) found that in Arabidopsis DELLA
proteins act as positive regulators of the RING-H2 zinc-finger protein XERICO, an inducer of ABA
biosynthesis, leading to the accumulation of ABA and therefore inhibiting seed germination.
These data demonstrate that GA also influences the ABA biosynthesis like ABA influences the
GA biosynthesis. Taken these facts into account we expected that the ABA levels in DELLA
silenced plants of N. attenuata would respond to the decreased presence of DELLA but the
present results did not confirm this hypothesis. The levels within the DELLA silenced plant did
not differ, as well as the levels of the GA2ox3 mutants did not show differences. The unchanged
levels in the GA2ox3 mutants could be caused by feedback inhibition events as described in the
introduction. In DELLA1-silenced plants another DELLA gene (DELLA2, which showed no

55
response to herbivory induction treatment, though) may have compensated for the defects of
DELLA1 in N. attenuata. At this point more research is necessary. However from the present
results it must be concluded that silencing DELLA1 and GA2ox3 do not influence the ABA levels
in N. attenuata.
4.2.2 JA and JA-Ile levels were not affected by GA spray and VIGS
The levels of JA and JA-Ile seemed to be increased especially 1 h after W+OS treatment
although no statistical test was performed to prove this since it is already known that JA
accumulates after wounding and perception of HAMPs (MCCLOUD and BALDWIN, 1997; HALITSCHKE
et al., 2003; STENZEL et al., 2003; HOWE and JANDER, 2008). The JA and JA-ile levels of the -W+OS-
induced GA overdose plants, which were about 2000-2500 ng/gFM and 150-200 ng/g FM,
respectively, were similar to other studies (PASCHOLD et al., 2008; DEMKURA et al., 2010; YANG et
al., 2013). The levels of the VIGS plants with concentrations of about 800-1000 ng/g FM (W+W)
and 3000-4000 ng/g FM (W+OS) were slightly higher although there are studies showing even
higher (YANG et al., 2011) or lower levels (MELDAU et al., 2011; WUENSCHE et al., 2011) after
induction. The fact that JA and JA-ile concentrations are very low but increase dramatically
within a short time after wounding and even stronger after wounding and treatments with oral
secretions underlines the importance of JA in defense processes. However, the JA levels did not
change in response to treatments with high concentrations of GA. GA is known to affect the JA-
signaling it by degrading DELLA, which leads to the inhibition of the transcription of these genes
since the transcriptional activator MYC2 is bound by JAZ (like explained in the introduction,
Figure 2). But the transcription of JAZ and MYC2 is feedback inhibited. MYC2 and JAZ proteins
are JA response genes (WASTERNACK and HAUSE, 2013). The transcription (and subsequent
translation) of e.g. JAZ leads to the accumulation of new JAZ repressors, which terminate the
transcription process when sufficient concentrations are reached (KOMBRINK, 2012). The GA
mediated degradation of the DELLA proteins in combination with the feedback regulation
questions why the JA levels were normally increased after induction by simulated herbivory. A
possible explanation is that JA is synthesized independently from the presence of GA. If GA
would influence the biosynthesis of jasmonates, the levels of JA (and JA-ile) would have been
lower after induction compared to the control plants (mock and empty vector, respectively).

56
The same counts for the bioactive JA-isoleucine conjugate. JA-ile is crucial for the formation of
the SCFCOI1 complex acting as an E3 ubiquitin ligase, which is involved in the degradation of JAZ
proteins by tagging it with ubiquitin (KOMBRINK, 2012; WASTERNACK and HAUSE, 2013).
Subsequently, JAZ is degraded via the 26-S proteasome pathway. The role of JA-ile is to bind JAZ
to the jasmonate receptor COI1 which is part of the SCFCOI1 complex (KOMBRINK, 2012;
WASTERNACK and HAUSE, 2013). But similar to JA, GA did not influence the levels of the bioactive
JA-ile except that the levels of the untreated control plants silenced in DELLA1 and GA2ox3
were slightly higher. Taken together, these results suggest that GA probably has no direct
influence on the biosynthesis of neither JA nor JA-ile.
4.3 Specifity in the effect of GA levels and signaling on secondary metabolites
4.3.1 Nicotine levels decreased in GA sprayed and DELLA1 silenced plants
The nicotine levels in of the control leaves (about 400 µg/g FM) were similar between the mock
plants and the plants treated with exogenous GA. These values are comparable to other studies
(GILARDONI et al., 2011; WUENSCHE et al., 2011). The levels in induced GA treated leaves remained
close to the control leaves while the mock plants showed higher amounts of nicotine after
induction (approximately 700 µg/g FM). It seemed like the nicotine production in response to
induction was suppressed within the GA-treated plants. A study on plant defense metabolites in
JA-deficient lipoxigenase3 (LOX3)-silenced plants observed the same reduction of nicotine
(HALITSCHKE and BALDWIN, 2003). These results are understandable since it is known that one
protein mainly involved into the regulation of nicotine biosynthesis is NaMYC2 (WOLDEMARIAM et
al., 2013). As described in the introduction MYC2 is a keystone in the JA regulated defense
response of N. attenuata (WOLDEMARIAM et al., 2013), which binds competitively to the JA-ZIM
domain protein if DELLA proteins are not bound to it. If DELLA proteins bind to JAZ, MYC2 is
released from its bond and initiates the transcription of JA response genes (see introduction),
including the genes involved in nicotine biosynthesis. A high amount of GA degrades DELLA
proteins so that JAZ binds to MYC2 inhibiting the transcription of the nicotine biosynthesis. This
is why the lower nicotine levels occurred not unexpected. On the other hand nicotine
production is induced by JA via putrescine methyltransferase genes (WINZ and BALDWIN, 2001;

57
SAEDLER and BALDWIN, 2004) but interestingly no altered levels of either JA or its biologically
active conjugate JA-ile were detected. The influence of GA3 must therefore have been
downstream of JA and JA-Ile synthesis. WINZ and BALDWIN (2001) also concluded that the attack
of M. sexta cause N. attenuata to produce the plant hormone ethylene which directly
suppresses the biosynthesis of nicotine. This could be a reason for the low nicotine by
unchanged JA levels. The cross-talk between GA and ethylene is already known and well-
studied. In their review, SMALLE and VAN DER STRAETEN (1997) generally described the effect of
ethylene as a growth inhibitor although they, on the other hand, mentioned the supportive role
ethylene during seed germination. In Arabidopsis, the ethylene pathway influences the GA
pathway by stabilizing the growth repressors GAI and RGA. Therefore it slows down the GA-
induced degradation of these DELLA proteins (DUGARDEYN et al., 2008). Due to time restrictions
the ethylene levels could not be measured yet but it might be important to do this in future
experiments. At this point it can only be stated that the treatment of N. attenuata plants with
exogenous GA had an effect on nicotine production, possibly via increased ethylene production
or via the degradation of DELLA proteins.
Also in the plants silenced in DELLA1 the nicotine levels were significantly decreased compared
to the empty vector plants (except in response to W+OS-treatment, which showed a trend
though). This result was similar to the result of the GA-sprayed plants. The only difference was
the reduced amount of nicotine in the control leaves, which could mean that the DELLA1-
silenced plants had generally a lower nicotine production even without wounding treatments.
Also the VIGS procedure itself seemed to affect the defense of the plants since the nicotine
levels were lower in all VIGS plants, compared to the GA-overdose experiment.
4.3.2 GA spray partly influenced phenolamide levels
Although increased after W+W and W+OS treatment the DCS levels were significantly
decreased in plants sprayed with exogenous GA independent from the treatment.
Unfortunately, there were no standards to absolutely quantify the amounts of it but for the
comparison between the treatments the measurement was sufficient enough. The CP levels
increased after induction but no difference between GA-sprayed and mock plants was

58
observed. Both phenolamides are known to be JA-responsive metabolites and therefore follow
the JA burst. This is because phenolamide levels in N. attenuata are controlled by the
transcriptional activator MYB8. The activation of MYB8 in N. attenuata requires the activity of
LOX3, which is involved into the biosynthesis of JA (ONKOKESUNG et al., 2012). The JA-
dependency of phenolamides could explain the increased amounts after induction (and the low
amounts without induction, respectively) but since the GA treatment of the plants had no
effect on the JA levels it is likely that there were also no increased phenolamide production
when comparing mock and GA-treated plants. However, this was only observed for CP.
ONKOKESUNG et al. (2012) showed that the levels of DCS are dependent on the developmental
stage of the plant. While the concentrations are higher in young rosette stages, they decreased
with continuing age but since in their study the expression patterns of CP were similar to DCS
the stage of the plant cannot be a reason for the lower DCS levels. Additionally the mock plants
and the plants treated with exogenous GA were in the same stage (early flowering). The
differences in the CP and DCS levels could mean that GA probably has an influence on the
biosynthesis of DCS (because the levels of all treatments were lower) but not on the
biosynthesis of CP. We do not know how exactly the expression of theses metabolites is
influenced by GA. However, the lower DCS levels could be one reason for the higher caterpillar
performance onto GA-treated plants since this effect has already been shown (KAUR et al.,
2010).
In contrast to the plants sprayed with exogenous GA the DCS levels of the DELLA1-silenced
plants were significantly increased in leaves induced by oral secretions of M. sexta. Although
the DCS levels were very low compared to the GA-overdose experiment (the concentrations
were approximately 20 times lower) they were still detectable. It was interesting though, that
no CP could be detected within the VIGS plants. This result is confusing since both
phenolamides are regulated by JA and there was an increase in the JA levels at least after
induction. The increasing DCS levels confirm the response of the phenolamides to increasing JA
levels although this result is contradicting to the result of the GA-overdose experiment. In other
studies CP was also found after the VIGS procedure, so that this cannot be an explanation for
the low levels (ONKOKESUNG et al., 2012; GAQUEREL et al., 2013; SON TRUONG et al., 2013). It can be

59
assumed that CP was produced by the plants but probably the levels were far too low for their
detection via HPLC. Using more plant material or less extraction buffer might help to increase
its detection. CP is also known to degrade quickly at room temperature. A longer storage of
samples at RT might have limited its detection via HPLC-UV.
4.3.3 DELLA1 silencing decreased the rutin levels after water treatment
In general the rutin levels of about 600-900 µg/g FM were comparable to another study with
concentrations of about 700 µg/g FM (WOLDEMARIAM et al., 2013) although the levels can also be
lower in empty vector plants (YANG et al., 2013). Interestingly, in the study of YANG et al. (2013)
the rutin levels were induced after M. sexta herbivory while we found a reduction but different
to our study they measured the levels after 15 days of continuous exposure to M. sexta while in
our study herbivory was only simulated three times and secondary metabolites were measured
after 48 h. However, in our study the only significant change was between the untreated
control leaves and the W+OS leaves of the empty vector plants. The levels after W+W were
slightly lower than the ones from the control leaves but still higher than the levels after W+OS.
Statistical tests proved that there was no significance between them. In the DELLA1 silenced
plants the rutin levels after W+W were already knocked down to the levels after W+OS. The
difference between control and W+W leaves was significant. It seemed like the rutin response
after wounding alone was inhibited probably directly or indirectly by silencing the DELLA1 gene
which could mean that the rutin responses are not strongly connected to herbivory signals as
they are to wounding alone. LOPEZ-GRESA et al. (2011) found that in tomato (Solanum
lycopersicum) rutin (as well as chlorogenic acid) accumulated after bacterial infection with
Pseudomonas syringae pv. tomato. This could lead to the hypothesis that rutin plays a more
important role in the defense against pathogens than in the herbivory-induced defense. This
would also explain the high levels after M. sexta herbivory observed by YANG et al. (2013) since
the continuous feeding of the larvae injured the leaves and rutin probably accumulated as a
defense against pathogens instead rather than a defense against M. sexta. Contrary to this
hypothesis the rutin levels of the VIGS plants were lower than the ones from the GA overdose
experiment. If rutin would play a great role in the bacterial defense, the levels of the VIGS
plants should have been much higher since they were infected with A. tumefaciens. However,

60
form the present results it only can be suggested that rutin was not influenced by the
application of exogenous GA.
4.3.4 GA2ox3 and DELLA1-silencing increased chlorogenic acid levels
Both, the DELLA1 and GA2ox3-silencd plants showed increased levels of chlorogenic acid.
Interestingly, the levels were increased only in the control leaves and after W+OS-treatment.
Wounding in combination with water did not show differences to the empty vector plants. The
polyphenol chlorogenic acid is known to be an antioxidant, which is widely distributed among
fruits and leaves. As such, it prevents biological molecules like proteins, DNA ,RNA lipids and
carbohydrates from damage caused by reactive oxygen species and reactive nitrogen species
(XU et al., 2012). Beside this, chlorogenic acid and its isomers (including cryptochlorogenic acid)
are known to have particular strong antimicrobial effects (ALMEIDA et al., 2006) although this
effect is controversially discussed in the literature (reviewed in LYON, 1989). Furthermore, a
study investigating the effects of the tobacco rattle virus on potatoes found elevated levels of
chlorogenic acid in TRV-infected plant material although it was not clear, if the accumulation
was a result the plants defense or a wound healing response (DALE et al., 2000). This could
explain the higher levels in the DELLA1-and GA2ox3-silenced plants, which could have been in
response to the infection with A. tumefaciens or/and the TRV but if so, we would have expected
similar levels in the empty vector plants and after W+W-treatment too. Interestingly this was
not the case. However, although we cannot say what caused the elevated levels in the DELLA1
and GA2ox3-silenced plants, there was definitely a response in chlorogenic acid and
cryptochlorogenic acid. This response was probably not caused by accumulation of GA itself
since the levels of the GA overdose experiment were similar between wild-type and GA-sprayed
plants but probably by the interaction between GA pathway manipulation, herbivory and VIGS.
4.3.5 HGL-DTG levels decreased after W+OS induction in GA-sprayed plants
A study performed by HEILING et al. (2010) underlined the importance of HGL-DTGs as defense
metabolite against herbivory attack of M. sexta on N. attenuata. In their caterpillar
performance experiment the weight of M. sexta larvae feeding on plants silenced in
geranylgeranyl diphosphate synthase (which lead to the reduction of precursors of HGL-DTGs)

61
was about 10 times larger compared to wild-type plants resulting in increased plant damage.
Diterpene glycosides are known to be induced in response to increased jasmonate levels
(KEINANEN et al., 2001). Therefore we expected that the HGL-DTG levels were increased after the
induction with oral secretions of M. sexta but lower within the plants treated with exogenous
GA. However, while the levels were similar between mock and GA-sprayed plants they were not
increased but instead significantly reduced after W+OS treatment. In N. attenuata four groups
of HGL-DTGs can be found. These groups (precursors, core, malonylated and dimalonylated
HGL-DTGs) are regulated in a different manner. The malonylation is the key biosynthetic step
regulated by herbivory and jasmonate signaling (HEILING et al., 2010). In response to herbivory
the precursors, malonylated and dimalonylated groups are up-regulated while the core groups
partly are negative regulated (HEILING et al., 2010). We performed HPLC analysis to measure
secondary metabolites. This method is not suitable to distinguish if the HGL-DTGs were
precursors, core, malonylated or dimalonylated groups. Probably we measured the core
groups, which are in fact down-regulated in response to herbivore attack since they become
malonylated (HEILING et al., 2010). To test this hypothesis we have to measure the samples
again using mass spectrometry. Then we would be able to distinguish between the different
HGL-DTG groups and could test if malonylated moieties change in GA-sprayed plants.
4.4 Some VOCs responded to GA-treatments and GA-related gene silencing
When it comes to indirect defense responses of plants against herbivores, some volatiles play
very important roles, while others are less effective. Studies showed that volatiles like the
sesquiterpene (E)-α-bergamotene and green leaf volatiles (fatty acid derived C6 aldehydes,
alcohols and esters) are involved in the attraction of Geochoris spp. predators (KESSLER and
BALDWIN, 2001; HALITSCHKE et al., 2008). It is also known that in N. attenuata, the attack by
M. sexta decreases the ratio of (Z)/(E)-isomers of GLVs, resulting from the production of (E)-
isomers from plant-derived (Z)-isomers. If N. attenuata is not attacked, (E)-isomers dominate
the volatile household but within the next hours after herbivory attack the levels of (E)- and (Z)-
isomers are nearly equal (ALLMANN and BALDWIN, 2010). While GLVs are immediately released
from wounded leaves, terpenoids are emitted systemically and with a delay of some hours to
days (DICKE, 2009). This is why they are probably involved in long-distance attraction of

62
carnivores (ALLMANN and BALDWIN, 2010). Therefore we took measurements after one hour and
after 24 hours. However, the green leaf volatiles collected after one hour were too low
concentrated and could be considered as background. Either this resulted from low
concentrations within the plant leaves or the method used to measure the GLVs was not
adjusted sufficiently. The GC-MS method used to analyze VOCs was still in development and the
settings have to be improved. In general there were some considerations about the precision of
the analysis. The VOCs were trapped with PDMS tubes for 1 h. The tubes had to be cut in pieces
by hand using a cutting block. Although we took care that the pieces had approximately the
same length, tiny differences in length could have influence on the total amount of VOCs
trapped. The plastic cups used had two openings allowing a flow of air out of and into the cup.
Especially inside the narrow VIGS chambers the VOCs of all plants are likely to emit into the air,
mixing up with each other and therefore distorting the results. This could be seen on the partly
high standard errors between the replicates of one treatment and the particular high blank
values measured for the VIGS plants. Another possibility is that the lower temperature in the
VIGS chamber (and therefore in the VIGS plants) inhibited the emission or evaporation ability of
GLVs after wounding. After 24 h more VOCs were measured but only few showed significant
differences between the plants compared. Nicotine was one of the VOCs showing partly
reduced levels in the DELLA1 and GA2ox3-silenced plants but this change was not taken into
account since the slightest injury or breaking trichomes can cause additional emission of
nicotine, distorting the results. However, a few changes were found. The terpenoids (putative)
α-terpineol and (E)-α-bergamotene showed strong tendencies towards reduced levels after
W+OS treatment of the GA-sprayed plants. Except these terpenoids the levels of the other
VOCs were either not different or the blanks were too high, so that there was no significant
difference to the control leaves anymore. These results suggest that GA might have an
influence on the production of some terpenes. With higher sensitivity of the method, we will be
able to determine the effect of GAs on GLVs.
4.5 General discussion and future perspectives
The present dataset was particularly comprehensible but although we expected similar
behavior of phytohormones, volatiles and secondary metabolites between the GA-sprayed

63
plants and the VIGS plants silenced in DELLA1 and GA2ox3, some data was partly contradicting
to each other and did not match our expectations. This is why it seems necessary to analyze the
transcript levels to ensure that the gene silencing was successful. Also the proteinase inhibitors
could provide an answer for the heavier larval weight of M. sexta on GA-sprayed plants. We
already have collected the plant material and will analyze the activity in future experiments.
In general the plants silenced in GA2ox3 did not show any changes in their secondary
metabolites except increased levels of chlorogenic acid in the control and W+OS leaves. This
result is not surprising considering many studies which concluded that the GA biosynthesis is
feedback regulated by bioactive GA itself (PHILLIPS et al., 1995; AIT-ALI et al., 1999; ASHIKARI et al.,
2002; AYELE et al., 2006; GALLEGO-GIRALDO et al., 2008). It is also possible that the degradation of
bioactive GAs in N. attenuata is performed by additional enzymes and not only GA2ox3. GAMT-
like enzymes could not be found within the genome of N. attenuata but probably other
enzymes are involved as well. To get a clear picture it is necessary to analyze the transcript
levels of genes involved into the biosynthesis of GAs as well as some GAs which could either be
intermediates or degradation products of bioactive GAs or the level of bioactive GAs itself.
The caterpillar experiment, which was performed two times, showed that GA had a positive
influence on M. sexta’s larval weight, even if the metabolomics analysis could only partly
explain this difference. However, it is not clear yet that the higher larval masses on GA-sprayed
plants are caused by decreased plant defense responses of N. attenuata or if bioactive
gibberellins probably directly affect the growth of M. sexta caterpillars. In future experiments
we will repeat the caterpillar performance using JA-deficient and wild-type plants. Because of
the JA-deficiency, the caterpillars should grow larger on these plants if the difference of the
weight is caused by reduced defense responses of N. attenuata (RAYAPURAM and BALDWIN, 2006).
In a setup using two types of plants (wild-type and JA-deficient) and two treatments (control
and GA sprayed) the results could look like stated in Figure 21. The caterpillars feeding on wild-
type plants treated with exogenous GA could have approximately the same weight like the ones
feeding on JA deficient plants and a significant increase compared to the untreated wild-type
plants. If the weight of the caterpillars feeding on GA treated wild-type, JA-deficient control and

64
GA-treated JA-deficient plants is similar, it can be concluded that gibberellins knockdown the
defense responses (at least the ones important for inhibiting M. sexta growth) to the level of
JA-deficient plants (Figure 21 a). If the caterpillar weight differs only between the untreated
≈
≈
<
≈
<
WT control WT 10 µM GA3 JA(-) control JA(-) 10 µM GA3
a)
b)
c)
d)
<
<
<
<
≈
<
<
≈
Figure 21: Possible outcomes of a caterpillar performance with wild-type (WT) and JA-deficient (JA(-)) lines.
Suggestions could be following: a) Spraying wild-type plants with exogenous GA knocks down the plants defense to the level of JA-deficient plants. This is why M. sexta larvae grow as large on GA treated wild-type plants as on JA-deficient plants while there is no difference between the treatments of the JA-deficient plants. b) All caterpillars feeding on GA sprayed plants grow larger but there is no difference between wild-type and JA-deficient plants. Spraying exogenous GA directly affects the caterpillar growth of M. sexta. c) The caterpillars feeding on GA-treated wild-type plants grow larger compared to the wild-type control but smaller compared to the caterpillars feeding on JA-deficient plants. This could mean spraying wild-type plants with exogenous GA reduces the plants defense but this reduction is less strong than in JA-deficient plants. d) Although the caterpillars feeding on GA-treated plants are larger compared to the controls they grow generally larger on JA-deficient plants but with the same effect of GA-treatment. From this it could be concluded that spraying wild-type plants with exogenous GA reduces their defense but additionally GA directly affects the growth of M. sexta caterpillars.

65
plants and the plants treated with GA but not between the JA-deficient lines and the wild-type
plants, the effect of increased larvae growth is probably caused by gibberellins itself (Figure 21
b). If the caterpillars feeding on JA-deficient plants show similar, the ones feeding on GA
sprayed wild-type plants slightly less and the ones feeding on the untreated wild-type plants
the least weight, then it could also be a hint for a reduction of defense responses although this
reduction would be less intense than in plants with JA-deficiency (Figure 21 c). Finally, if the
caterpillars feeding on JA-deficient GA-treated plants grow largest, the ones feeding JA-
deficient control plants second largest, the ones feeding on the GA-treated wild-type plants
even smaller and the ones feeding on control wild-type plants smallest, then it could be a hint
for an effect of reduced defense responses and additionally a direct effect of the GA-treatment
in combination (Figure 21 d). It also seems reasonable to investigate how caterpillars perform
onto the VIGS plants. We expect that M. sexta larvae will grow larger on plants silenced in
DELLA1 since this phenotype should be similar to GA-overexpression phenotypes.
As mentioned in the introduction, the production of defense metabolites is costly and often
accompanied by growth inhibition (POVEDA et al., 2003; ZHANG and TURNER, 2008). Therefore it
was expected that some secondary metabolites in N. attenuata, like nicotine, CA, CP or DCS,
were induced after simulated M. sexta herbivore attack. The best example is the secondary
metabolite CP, which levels showed a tenfold increase after wounding and application of
M. sexta oral secretions, compared to the untreated leaves. These results underpin the optimal
defense hypotheses stated by MCKEY (1974). Although we did not focus on different plant
tissues of N. attenuata (e.g. leaves compared to flowers or apical shoots), we were able to show
that not all defense metabolites (including VOCs) were constitutively expressed among the
plant. Rather than that, N. attenuata responded to the attack of M. sexta by inducing the
production of defense metabolites. As described above many of N. attenuata’s “weapons” are
regulated by the JA pathway. The analysis of the phytohormones showed a strong burst of JA
and its conjugate JA-Ile already one hour after the treatments. We were also able to show, that
GAs suppressed some of these weapons although others were not affected. During the GA-
overdose experiment we observed the influence of exogenous applied GA on N. attenuata’s
growth behavior. N. attenuata plants treated with exogenous GA were averagely about 10 cm

66
taller, compared to the mock plants (Figure 22, appendix Figure 23). Interestingly also the leaf-
stem angle of the rosette leaves was smaller, meaning that the plants sprayed with GA “lifted”
their rosette leaves away from the ground (appendix Table 2).
Figure 22: N. attenuata plants treated with GA were higher and showed elevated rosette leaves.
N. attenuata plants were daily treated with 10 µM GA3 (dissolved in 0.035 % EtOH, labeled red) during their elongation phase (start: 34 days after seed germination) and compared to mock plants (only sprayed with 0.035 % EtOH, labeled green). The picture and measurements (plant height, leaf-stem-angle) were taken during early flowering stage after 18 days of GA3-treatment (52 days after seed germination).
These measurements show that GA had an influence on N. attenuata’s growth behavior. The
observation, that elevated GA levels increase the height of the plant fits to the observation
described by ANDERSON et al. (2004) but, as far as we know, the differences in the angle of the
rosette leaves were not described before. Probably this effect is specific to N. attenuata.

67
5 Conclusion The caterpillar performance showed that there was an influence of bioactive GA on
N. attenuata’s defense against M. sexta. This was indicated by the larger larval mass of the
caterpillars feeding on GA-treated plants. We also found some changes in the metabolomic
household of N. attenuata. The most important difference we found is the reduced amount of
nicotine in plants with GA-overdose treatments, which is likely to have been the main cause of
the reduced growth of the caterpillars on the nicotine-rich mock plants since this result was
already suggested by another study on Nicotiana sylvestris (VOELCKEL et al., 2001). Although
nicotine is a toxic alkaloid, M. sexta can tolerate it. But although they can tolerate higher doses
of nicotine they grow less intense, from which VOELCKEL et al. (2001) concluded that nicotine
probably decreases the palatability of the leaves. Dicaffeoylspermidine could have been
another reason for the increased larval mass on GA-treated plants but since the DELLA1-
silenced plants showed contradictory results we have to do further analysis to confirm this. All
the other metabolites were not affected by GA. Although some tendencies towards reduced
levels of at least α-terpineol and (E)-α-bergamotene were detected 24 h after the last wounding
treatment we could not find any greater changes of the VOCs.

c
6 Literature AIT-ALI T., FRANCES S., WELLER J. L., REID J. B., KENDRICK R. E., KAMIYA Y. (1999) Regulation of gibberellin 20-
oxidase and gibberellin 3 beta-hydroxylase transcript accumulation during de-etiolation of pea seedlings. Plant Physiology 121: 783-791
ALABADI D., GALLEGO-BARTOLOME J., ORLANDO L., GARCIA-CARCEL L., RUBIO V., MARTINEZ C., FRIGERIO M., IGLESIAS-PEDRAZ J. M., ESPINOSA A., DENG X. W., BLAZQUEZ M. A. (2008) Gibberellins modulate light signaling pathways to prevent Arabidopsis seedling de-etiolation in darkness. Plant Journal 53: 324-335
ALLMANN S., BALDWIN I. T. (2010) Insects Betray Themselves in Nature to Predators by Rapid Isomerization of Green Leaf Volatiles. Science 329: 1075-1078
ALLMANN S., SPATHE A., BISCH-KNADEN S., KALLENBACH M., REINECKE A., SACHSE S., BALDWIN I. T., HANSSON B. S. (2013) Feeding-induced rearrangement of green leaf volatiles reduces moth oviposition. eLife 2: e00421
ALMEIDA A. A. P., FARAH A., SILVA D. A. M., NUNAN E. A., GLORIA M. B. A. (2006) Antibacterial activity of coffee extracts and selected coffee chemical compounds against enterobacteria. Journal of Agricultural and Food Chemistry 54: 8738-8743
ANDERSON, L., WEBSTER, R.K. AND OSTER, J.J. (2004): Balkanae Disease of Rice in California – Update. UC IPM Pest Management Guidelines: Rice UC ANR Publication 3465. Department of Plant Pathology, University of California.
ARIIZUMI T., HAUVERMALE A. L., NELSON S. K., HANADA A., YAMAGUCHI S., STEBER C. M. (2013) Lifting DELLA Repression of Arabidopsis Seed Germination by Nonproteolytic Gibberellin Signaling. Plant Physiology 162: 2125-2139
ASHIKARI M., SASAKI A., UEGUCHI-TANAKA M., ITOH H., NISHIMURA A., DATTA S., ISHIYAMA K., SAITO T., KOBAYASHI M., KHUSH G. S., KITANO H., MATSUOKA M. (2002) Loss-of-function of a rice gibberellin biosynthetic gene, GA20 oxidase (GA20ox-2), led to the rice 'green revolution'. Breeding Science 52: 143-150
AYELE B. T., OZGA J. A., REINECKE D. M. (2006) Regulation of GA biosynthesis genes during germination and young seedling growth of pea (Pisum sativum L.). Journal of Plant Growth Regulation 25: 219-232
BALDWIN I. T. (1998) Jasmonate-induced responses are costly but benefit plants under attack in native populations. Proceedings of the National Academy of Sciences of the United States of America 95: 8113-8118
BALDWIN I. T., GORHAM D., SCHMELZ E. A., LEWANDOWSKI C. A., LYNDS G. Y. (1998) Allocation of nitrogen to an inducible defense and seed production in Nicotiana attenuata. Oecologia 115: 541-552
BALDWIN I. T., MORSE L. (1994) UP IN SMOKE .2. GERMINATION OF NICOTIANA-ATTENUATA IN RESPONSE TO SMOKE-DERIVED CUES AND NUTRIENTS IN BURNED AND UNBURNED SOILS. Journal of Chemical Ecology 20: 2373-2391
BALDWIN I. T., OHNMEISS T. E. (1993) ALKALOIDAL RESPONSES TO DAMAGE IN NICOTIANA NATIVE TO NORTH-AMERICA. Journal of Chemical Ecology 19: 1143-1153
BALDWIN I. T., SIMS C. L., KEAN S. E. (1990) THE REPRODUCTIVE CONSEQUENCES ASSOCIATED WITH INDUCIBLE ALKALOIDAL RESPONSES IN WILD TOBACCO. Ecology 71: 252-262
BALDWIN I. T., STASZAKKOZINSKI L., DAVIDSON R. (1994) UP IN SMOKE .1. SMOKE-DERIVED GERMINATION CUES FOR POSTFIRE ANNUAL, NICOTIANA-ATTENUATA TORR EX WATSON. Journal of Chemical Ecology 20: 2345-2371
BARNEY M. A., FRISCHKNECHT N. C. (1974) VEGETATION CHANGES FOLLOWING FIRE IN PINYON-JUNIPER TYPE OF WEST-CENTRAL UTAH. Journal of Range Management 27: 91-96
d
BAULCOMBE D. (1999) Viruses and gene silencing in plants. Archives of Virology 15: 189-201 BECKER A., LANGE M. (2010) VIGS – genomics goes functional. Trends in Plant Science 15: 1-4 BERNSTEIN E., CAUDY A. A., HAMMOND S. M., HANNON G. J. (2001) Role for a bidentate ribonuclease in the
initiation step of RNA interference. Nature 409: 363-366 BONAVENTURE G., VANDOORN A., BALDWIN I. T. (2011) Herbivore-associated elicitors: FAC signaling and
metabolism. Trends in Plant Science 16: 294-299 CAO D., HUSSAIN A., CHENG H., PENG J. (2005) Loss of function of four DELLA genes leads to light- and
gibberellin-independent seed germination in Arabidopsis. Planta 223: 105-113 CARRERA E., JACKSON S. D., PRAT S. (1999) Feedback control and diurnal regulation of gibberellin 20-
oxidase transcript levels in potato. Plant Physiology 119: 765-773 CHIANG H. H., HWANG I., GOODMAN H. M. (1995) ISOLATION OF THE ARABIDOPSIS GA4 LOCUS. Plant Cell
7: 195-201 COGONI C., MACINO G. (1997) Isolation of quelling-defective (qde) mutants impaired in posttranscriptional
transgene-induced gene silencing in Neurospora crassa. Proceedings of the National Academy of Sciences of the United States of America 94: 10233-10238
CUTLER S. R., RODRIGUEZ P. L., FINKELSTEIN R. R., ABRAMS S. R. (2010) Abscisic Acid: Emergence of a Core Signaling Network. In MERCHANT, S., BRIGGS, W.R., ORT, D., eds, Annual Review of Plant Biology 61: 651-679
DALE M. F. B., ROBINSON D. J., WYNNE GRIFFITHS D., TODD D., BAIN H. (2000) Effects of tuber-borne M-type strain of tobacco rattle virus on yield and quality attributes of potato tubers of the cultivar Wilja. European Journal of Plant Pathology 106: 275-282
DAS A., LEE S. H., HYUN T. K., KIM S. W., KIM J. Y. (2013) Plant volatiles as method of communication. Plant Biotechnology Reports 7: 9-26
DE GEYTER N., GHOLAMI A., GOORMACHTIG S., GOOSSENS A. (2012) Transcriptional machineries in jasmonate-elicited plant secondary metabolism. Trends in Plant Science 17: 349-359
DE LUCAS M., DAVIERE J. M., RODRIGUEZ-FALCON M., PONTIN M., IGLESIAS-PEDRAZ J. M., LORRAIN S., FANKHAUSER C., BLAZQUEZ M. A., TITARENKO E., PRAT S. (2008) A molecular framework for light and gibberellin control of cell elongation. Nature 451: 480-484
DEMKURA P. V., ABDALA G., BALDWIN I. T., BALLARE C. L. (2010) Jasmonate-Dependent and -Independent Pathways Mediate Specific Effects of Solar Ultraviolet B Radiation on Leaf Phenolics and Antiherbivore Defense. Plant Physiology 152: 1084-1095
DIAMOND S. E., HAWKINS S. D., NIJHOUT H. F., KINGSOLVER J. G. (2010) Evolutionary divergence of field and laboratory populations of Manduca sexta in response to host-plant quality. Ecological Entomology 35: 166-174
DICKE M. (2009) Behavioural and community ecology of plants that cry for help. Plant Cell and Environment 32: 654-665
DILL A., JUNG H. S., SUN T. P. (2001) The DELLA motif is essential for gibberellin-induced degradation of RGA. Proceedings of the National Academy of Science of the United States of America 98: 14162-14167
DUGARDEYN J., VANDENBUSSCHE F., VAN DER STRAETEN D. (2008) To grow or not to grow: what can we learn on ethylene-gibberellin cross-talk by in silico gene expression analysis? Journal of Experimental Botany 59: 1-16
ERB M., MELDAU S., HOWE G. A. (2012) Role of phytohormones in insect-specific plant reactions. Trends in Plant Science 17: 250-259
FENG S., MARTINEZ C., GUSMAROLI G., WANG Y., ZHOU J., WANG F., CHEN L., YU L., IGLESIAS-PEDRAZ J. M., KIRCHER S., SCHAFER E., FU X., FAN L. M., DENG X. W. (2008) Coordinated regulation of Arabidopsis thaliana development by light and gibberellins. Nature 451: 475-479
e
FIRE A., XU S. Q., MONTGOMERY M. K., KOSTAS S. A., DRIVER S. E., MELLO C. C. (1998) Potent and specific genetic interference by double-stranded RNA in Caenorhabditis elegans. Nature 391: 806-811
FLEET C. M., SUN T. P. (2005) A DELLAcate balance: the role of gibberellin in plant morphogenesis. Curr Opin Plant Biol 8: 77-85
FU X. D., RICHARDS D. E., FLECK B., XIE D. X., BURTON N., HARBERD N. P. (2004) The Arabidopsis mutant sleepy1(gar2-1) protein promotes plant growth by increasing the affinity of the SCFSLY1 E3 ubiquitin ligase for DELLA protein substrates. Plant Cell 16: 1406-1418
GALLEGO-BARTOLOME J., MINGUET E. G., MARIN J. A., PRAT S., BLAZQUEZ M. A., ALABADI D. (2010) Transcriptional diversification and functional conservation between DELLA proteins in Arabidopsis. Mol Biol Evol 27: 1247-1256
GALLEGO-GIRALDO L., UBEDA-TOMAS S., GISBERT C., GARCIA-MARTINEZ J. L., MORITZ T., LOPEZ-DIAZ I. (2008) Gibberellin homeostasis in tobacco is regulated by gibberellin metabolism genes with different gibberellin sensitivity. Plant and Cell Physiology 49: 679-690
GAQUEREL E., KOTKAR H., ONKOKESUNG N., GALIS I., BALDWIN I. T. (2013) Silencing an N-Acyltransferase-Like Involved in Lignin Biosynthesis in Nicotiana attenuata Dramatically Alters Herbivory-Induced Phenolamide Metabolism. Plos One 8
GILARDONI P. A., HETTENHAUSEN C., BALDWIN I. T., BONAVENTURE G. (2011) Nicotiana attenuata LECTIN RECEPTOR KINASE1 Suppresses the Insect-Mediated Inhibition of Induced Defense Responses during Manduca sexta Herbivory. Plant Cell 23: 3512-3532
GOODSPEED, T., H. (1954). The Genus Nicotiana. Origins, Relationships and Evolution of its Species in the Light of their Distribution, Morphology and Cytokinetics. Chronica Botanica Company. 536 p.
GOLLDACK D., LI C., MOHAN H., PROBST N. (2013) Gibberellins and abscisic acid signal crosstalk: living and developing under unfavorable conditions. Plant Cell Reports 32: 1007-1016
GREEN T. R., RYAN C. A. (1972) WOUND-INDUCED PROTEINASE INHIBITOR IN PLANT LEAVES - POSSIBLE DEFENSE MECHANISM AGAINST INSECTS. Science 175: 776-&
GRIFFITHS J., MURASE K., RIEU I., ZENTELLA R., ZHANG Z. L., POWERS S. J., GONG F., PHILLIPS A. L., HEDDEN P., SUN T. P., THOMAS S. G. (2006) Genetic characterization and functional analysis of the GID1 gibberellin receptors in Arabidopsis. Plant Cell 18: 3399-3414
GUO S., KEMPHUES K. J. (1995) PAR-1, A GENE REQUIRED FOR ESTABLISHING POLARITY IN C-ELEGANS EMBRYOS, ENCODES A PUTATIVE SER/THR KINASE THAT IS ASYMMETRICALLY DISTRIBUTED. Cell 81: 611-620
HALITSCHKE R., BALDWIN I. T. (2003) Antisense LOX expression increases herbivore performance by decreasing defense responses and inhibiting growth-related transcriptional reorganization in Nicotiana attenuata. Plant Journal 36: 794-807
HALITSCHKE R., GASE K., HUI D. Q., SCHMIDT D. D., BALDWIN I. T. (2003) Molecular interactions between the specialist herbivore Manduca sexta (Lepidoptera, Sphingidae) and its natural host Nicotiana attenuata. VI. Microarray analysis reveals that most herbivore-specific transcriptional changes are mediated by fatty acid-amino acid conjugates. Plant Physiology 131: 1894-1902
HALITSCHKE R., SCHITTKO U., POHNERT G., BOLAND W., BALDWIN I. T. (2001) Molecular interactions between the specialist herbivore Manduca sexta (Lepidoptera, Sphingidae) and its natural host Nicotiana attenuata. III. Fatty acid-amino acid conjugates in herbivore oral secretions are necessary and sufficient for herbivore-specific plant responses. Plant Physiology 125: 711-717
HALITSCHKE R., STENBERG J. A., KESSLER D., KESSLER A., BALDWIN I. T. (2008) Shared signals - 'alarm calls' from plants increase apparency to herbivores and their enemies in nature. Ecology Letters 11: 24-34
HEDDEN P., PHILLIPS A. L. (2000) Gibberellin metabolism: new insights revealed by the genes. Trends in Plant Science 5: 523-530
HEILING S., SCHUMAN M. C., SCHOETTNER M., MUKERJEE P., BERGER B., SCHNEIDER B., JASSBI A. R., BALDWIN I. T. (2010) Jasmonate and ppHsystemin Regulate Key Malonylation Steps in the Biosynthesis of 17-

f
Hydroxygeranyllinalool Diterpene Glycosides, an Abundant and Effective Direct Defense against Herbivores in Nicotiana attenuata. Plant Cell 22: 273-292
HEINRICH M., BALDWIN I. T., WU J. Q. (2012) Three MAPK Kinases, MEK1, SIPKK, and NPK2, are not Involved in Activation of SIPK after Wounding and Herbivore Feeding but Important for Accumulation of Trypsin Proteinase Inhibitors. Plant Molecular Biology Reporter 30: 731-740
HEINRICH M., HETTENHAUSEN C., LANGE T., WUNSCHE H., FANG J. J., BALDWIN I. T., WU J. Q. (2013) High levels of jasmonic acid antagonize the biosynthesis of gibberellins and inhibit the growth of Nicotiana attenuata stems. Plant Journal 73: 591-606
HETTENHAUSEN C., BALDWIN I. T., WU J. (2013) Nicotiana attenuata MPK4 suppresses a novel jasmonic acid (JA) signaling-independent defense pathway against the specialist insect Manduca sexta, but is not required for the resistance to the generalist Spodoptera littoralis. New Phytologist 199: 787-799
HETTENHAUSEN C., BALDWIN I. T., WU J. Q. (2012) Silencing MPK4 in Nicotiana attenuata Enhances Photosynthesis and Seed Production But Compromises Abscisic Acid-Induced Stomatal Closure and Guard Cell-Mediated Resistance to Pseudomonas syringae pv tomato DC3000. Plant Physiology 158: 759-776
HOU X. L., LEE L. Y. C., XIA K. F., YEN Y. Y., YU H. (2010) DELLAs Modulate Jasmonate Signaling via Competitive Binding to JAZs. Developmental Cell 19: 884-894
HOWE G. A., JANDER G. (2008) Plant immunity to insect herbivores. In Annual Review of Plant Biology: 59. Annual Reviews, Palo Alto, 41-66
HUANG Y. Y., YANG W. L., PEI Z., GUO X. L., LIU D. C., SUN J. Z., ZHANG A. M. (2012) The genes for gibberellin biosynthesis in wheat. Functional & Integrative Genomics 12: 199-206
HUSSAIN A., CAO D., CHENG H., WEN Z., PENG J. (2005) Identification of the conserved serine/threonine residues important for gibberellin-sensitivity of Arabidopsis RGL2 protein. Plant J 44: 88-99
HUSSAIN A., CAO D., PENG J. (2007) Identification of conserved tyrosine residues important for gibberellin sensitivity of Arabidopsis RGL2 protein. Planta 226: 475-483
JONES R. L., PHILLIPS I. D. (1966) ORGANS OF GIBBERELLIN SYNTHESIS IN LIGHT-GROWN SUNFLOWER PLANTS. Plant Physiology 41: 1381-&
KAUR H., HEINZEL N., SCHOETTNER M., BALDWIN I. T., GALIS I. (2010) R2R3-NaMYB8 Regulates the Accumulation of Phenylpropanoid-Polyamine Conjugates, Which Are Essential for Local and Systemic Defense against Insect Herbivores in Nicotiana attenuata. Plant Physiology 152: 1731-1747
KEINANEN M., OLDHAM N. J., BALDWIN I. T. (2001) Rapid HPLC screening of jasmonate-induced increases in tobacco alkaloids, phenolics, and diterpene glycosides in Nicotiana attenuata. Journal of Agricultural and Food Chemistry 49: 3553-3558
KESSLER A., BALDWIN I. T. (2001) Defensive function of herbivore-induced plant volatile emissions in nature. Science 291: 2141-2144
KING K. E., MORITZ T., HARBERD N. P. (2001) Gibberellins are not required for normal stem growth in Arabidopsis thaliana in the absence of GAI and RGA. Genetics 159: 767-776
KOBAYASHI M., YAMAGUCHI I., MUROFUSHI N., OTA Y., TAKAHASHI N. (1988) FLUCTUATION AND LOCALIZATION OF ENDOGENOUS GIBBERELLINS IN RICE. Agricultural and Biological Chemistry 52: 1189-1194
KOMBRINK E. (2012) Chemical and genetic exploration of jasmonate biosynthesis and signaling paths. Planta 236: 1351-1366
KOORNNEEF M., JORNA M. L., DERSWAN D., KARSSEN C. M. (1982) THE ISOLATION OF ABSCISIC-ACID (ABA) DEFICIENT MUTANTS BY SELECTION OF INDUCED REVERTANTS IN NON-GERMINATING GIBBERELLIN SENSITIVE LINES OF ARABIDOPSIS-THALIANA (L) HEYNH. Theoretical and Applied Genetics 61: 385-393

g
KRUEGEL T., LIM M., GASE K., HALITSCHKE R., BALDWIN I. T. (2002) Agrobacterium-mediated transformation of Nicotiana attenuata, a model ecological expression system. Chemoecology 12: 177-183
LEUNG J., VALON C., MOREAU B., BOEGLIN M., LEFOULON C., JOSHI-SAHA A., CHEREL I. (2012) The ABC of abscisic acid action in plant drought stress responses. Biologie Aujourd hui 206: 301-312
LOPEZ-GRESA M. P., TORRES C., CAMPOS L., LISON P., RODRIGO I., BELLES J. M., CONEJERO V. (2011) Identification of defence metabolites in tomato plants infected by the bacterial pathogen Pseudomonas syringae. Environmental and Experimental Botany 74: 216-228
LU R., MARTIN-HERNANDEZ A. M., PEART J. R., MALCUIT I., BAULCOMBE D. C. (2003) Virus-induced gene silencing in plants. Methods 30: 296-303
LYON G. D. (1989) THE BIOCHEMICAL BASIS OF RESISTANCE OF POTATOES TO SOFT ROT ERWINIA SPP - A REVIEW. Plant Pathology 38: 313-339
MACMILLAN J., SUTER P. J. (1958) THE OCCURRENCE OF GIBBERELLIN-A1 IN HIGHER PLANTS - ISOLATION FROM THE SEED OF RUNNER BEAN (PHASEOLUS-MULTIFLORUS). Naturwissenschaften 45: 46-46
MARTIN D. N., PROEBSTING W. M., PARKS T. D., DOUGHERTY W. G., LANGE T., LEWIS M. J., GASKIN P., HEDDEN P. (1996) Feed-back regulation of gibberellin biosynthesis and gene expression in Pisum sativum L. Planta 200: 159-166
MATSUSHITA A., FURUMOTO T., ISHIDA S., TAKAHASHI Y. (2007) AGF1, an AT-hook protein, is necessary for the negative feedback of AtGA3ox1 encoding GA 3-oxidase. Plant Physiology 143: 1152-1162
MCCLOUD E. S., BALDWIN I. T. (1997) Herbivory and caterpillar regurgitants amplify the wound-induced increases in jasmonic acid but not nicotine in Nicotiana sylvestris. Planta 203: 430-435
MCKEY D. (1974) ADAPTIVE PATTERNS IN ALKALOID PHYSIOLOGY. American Naturalist 108: 305-320 MELDAU S., BALDWIN I. T., WU J. (2011) SGT1 regulates wounding- and herbivory-induced jasmonic acid
accumulation and Nicotiana attenuata's resistance to the specialist lepidopteran herbivore Manduca sexta. New Phytologist 189: 1143-1156
MELDAU S., ERB M., BALDWIN I. T. (2012) Defence on demand: mechanisms behind optimal defence patterns. Annals of Botany 110: 1503-1514
NAKAJIMA M., SHIMADA A., TAKASHI Y., KIM Y. C., PARK S. H., UEGUCHI-TANAKA M., SUZUKI H., KATOH E., IUCHI S., KOBAYASHI M., MAEDA T., MATSUOKA M., YAMAGUCHI I. (2006) Identification and characterization of Arabidopsis gibberellin receptors. Plant Journal 46: 880-889
NAMBARA E., AKAZAWA T., MCCOURT P. (1991) EFFECTS OF THE GIBBERELLIN BIOSYNTHETIC INHIBITOR UNICONAZOL ON MUTANTS OF ARABIDOPSIS. Plant Physiology 97: 736-738
NAMBARA E., KAWAIDE H., KAMIYA Y., NAITO S. (1998) Characterization of an Arabidopsis thaliana mutant that has a defect in ABA accumulation: ABA-dependent and ABA-independent accumulation of free amino acids during dehydration. Plant and Cell Physiology 39: 853-858
NAPOLI C., LEMIEUX C., JORGENSEN R. (1990) INTRODUCTION OF A CHIMERIC CHALCONE SYNTHASE GENE INTO PETUNIA RESULTS IN REVERSIBLE CO-SUPPRESSION OF HOMOLOGOUS GENES IN TRANS. Plant Cell 2: 279-289
OH Y., BALDWIN I. T., GALIS I. (2012) NaJAZh Regulates a Subset of Defense Responses against Herbivores and Spontaneous Leaf Necrosis in Nicotiana attenuata Plants. Plant Physiology 159: 769-788
ONKOKESUNG N., GAQUEREL E., KOTKAR H., KAUR H., BALDWIN I. T., GALIS I. (2012) MYB8 Controls Inducible Phenolamide Levels by Activating Three Novel Hydroxycinnamoyl-Coenzyme A:Polyamine Transferases in Nicotiana attenuata. Plant Physiology 158: 389-407
PASCHOLD A., BONAVENTURE G., KANT M. R., BALDWIN I. T. (2008) Jasmonate perception regulates jasmonate biosynthesis and JA-Ile metabolism: The case of COI1 in Nicotiana attenuata. Plant and Cell Physiology 49: 1165-1175
PHILLIPS A. L., WARD D. A., UKNES S., APPLEFORD N. E. J., LANGE T., HUTTLY A. K., GASKIN P., GRAEBE J. E., HEDDEN P. (1995) ISOLATION AND EXPRESSION OF 3 GIBBERELLIN 20-OXIDASE CDNA CLONES FROM ARABIDOPSIS. Plant Physiology 108: 1049-1057

h
PHINNEY B. O., WEST C. A., RITZEL M., NEELY P. M. (1957) EVIDENCE FOR GIBBERELLIN-LIKE SUBSTANCES FROM FLOWERING PLANTS. Proceedings of the National Academy of Sciences of the United States of America 43: 398-404
POVEDA K., STEFFAN-DEWENTER I., SCHEU S., TSCHARNTKE T. (2003) Effects of below- and above-ground herbivores on plant growth, flower visitation and seed set. Oecologia 135: 601-605
PYSH L. D., WYSOCKA-DILLER J. W., CAMILLERI C., BOUCHEZ D., BENFEY P. N. (1999) The GRAS gene family in Arabidopsis: sequence characterization and basic expression analysis of the SCARECROW-LIKE genes. Plant Journal 18: 111-119
QIN G. J., GU H. Y., MA L. G., PENG Y. B., DENG X. W., CHEN Z. L., QU L. J. (2007) Disruption of phytoene desaturase generesults in albino and dwarf phenotypes in Arabodopsis by imparing chlorophyll, carotenoid and gibberellin biosynthesis. Cell Research 17(5): 471-482
RADLEY M. (1956) OCCURRENCE OF SUBSTANCES SIMILAR TO GIBBERELLIC ACID IN HIGHER PLANTS. Nature 178: 1070-1071
RAYAPURAM C., BALDWIN I. T. (2006) Using nutritional indices to study LOX3-dependent insect resistance. Plant Cell and Environment 29: 1585-1594
RICHARDS D. E., KING K. E., AIT-ALI T., HARBERD N. P. (2001) How gibberellin regulates plant growth and development: A molecular genetic analysis of gibberellin signaling. In Annual Review of Plant Physiology and Plant Molecular Biology 52: 67-88
ROSS J. J., MACKENZIE-HOSE A. K., DAVIES P. J., LESTER D. R., TWITCHIN B., REID J. B. (1999) Further evidence for feedback regulation of gibberellin biosynthesis in pea. Physiologia Plantarum 105: 532-538
ROYCHOUDHURY A., PAUL S., BASU S. (2013) Cross-talk between abscisic acid-dependent and abscisic acid-independent pathways during abiotic stress. Plant Cell Reports 32: 985-1006
SAEDLER R., BALDWIN I. T. (2004) Virus-induced gene silencing of jasmonate-induced direct defences, nicotine and trypsin proteinase-inhibitors in Nicotiana attenuata. Journal of Experimental Botany 55: 151-157
SASAKI A., ITOH H., GOMI K., UEGUCHI-TANAKA M., ISHIYAMA K., KOBAYASHI M., JEONG D. H., AN G., KITANO H., ASHIKARI M., MATSUOKA M. (2003) Accumulation of phosphorylated repressor for gibberellin signaling in an F-box mutant. Science 299: 1896-1898
SCHEPERS, U. (2005): RNA interference in Practice: Principles, Basics and Methods for Gene Silencing in C. elegans, Drosophila and Mammals. Wiley-VCH Verlag GmbH & Co. KGaA, Weinheim. 326p. ISBN: 3-527-31020-7
SCHMITZ, K. and SCHEPERS, U. (2004). Silencio: RNA interference, the tool of the new millennium. Biol Chem (in press)
SCHUMAN, M., KESSLER, D., BALDWIN, I. T. (2013). Ecological observations of native Geocoris pallens and G. punctipes populations in the Great Basin Desert of southwestern Utah. Psyche: A Journal of Entomology; Cambridge Entomological Club, New York, NY: Hindawi, 2013: 465108. doi:10.1155/2013/465108.
SCHUMAN M. C., BARTHEL K., BALDWIN I. T. (2012) Herbivory-induced volatiles function as defenses increasing fitness of the native plant Nicotiana attenuata in nature. eLife 1: e00007
SCHWACHTJE J., BALDWIN I. T. (2004) Smoke exposure alters endogenous gibberellin and abscisic acid pools and gibberellin sensitivity while eliciting germination in the post-fire annual, Nicotiana attenuata. Seed Science Research 14: 51-60
SEO M., HANADA A., KUWAHARA A., ENDO A., OKAMOTO M., YAMAUCHI Y., NORTH H., MARION-POLL A., SUN T. P., KOSHIBA T., KAMIYA Y., YAMAGUCHI S., NAMBARA E. (2006) Regulation of hormone metabolism in Arabidopsis seeds: phytochrome regulation of abscisic acid metabolism and abscisic acid regulation of gibberellin metabolism. Plant Journal 48: 354-366
SILVERSTONE A. L., JUNG H. S., DILL A., KAWAIDE H., KAMIYA Y., SUN T. P. (2001) Repressing a repressor: Gibberellin-induced rapid reduction of the RGA protein in Arabidopsis. Plant Cell 13: 1555-1565

i
SMALLE J., VANDERSTRAETEN D. (1997) Ethylene and vegetative development. Physiologia Plantarum 100: 593-605
SMALLE J., VIERSTRA R. D. (2004) The ubiquitin 26S proteasome proteolytic pathway. Annu Rev Plant Biol 55: 555-590
SON TRUONG D., BALDWIN I. T., GALIS I. (2013) The HERBIVORE ELICITOR-REGULATED1 Gene Enhances Abscisic Acid Levels and Defenses against Herbivores in Nicotiana attenuata Plants. Plant Physiology 162: 2106-2124
STENZEL I., HAUSE B., MAUCHER H., PITZSCHKE A., MIERSCH O., ZIEGLER J., RYAN C. A., WASTERNACK C. (2003) Allene oxide cyclase dependence of the wound response and vascular bundle-specific generation of jasmonates in tomato - amplification in wound signalling. Plant Journal 33: 577-589
STEPPUHN A., GASE K., KROCK B., HALITSCHKE R., BALDWIN I. T. (2004) Nicotine's defensive function in nature. Plos Biology 2: 1074-1080
SUN T. P., GUBLER F. (2004) Molecular mechanism of gibberellin signaling in plants. Annu Rev Plant Biol 55: 197-223
SUZUKI Y., MIZUNO T., URAKAMI E., YAMAGUCHI I., ASAMI T. (2008) Immunomodulation of bioactive gibberellin confers gibberellin-deficient phenotypes in plants. Plant Biotechnol J 6: 355-367
TANIMOTO E. (2012) Tall or short? Slender or thick? A plant strategy for regulating elongation growth of roots by low concentrations of gibberellin. Annals of Botany 110: 373-381
UEGUCHI-TANAKA M., ASHIKARI M., NAKAJIMA M., ITOH H., KATOH E., KOBAYASHI M., CHOW T. Y., HSING Y. I., KITANO H., YAMAGUCHI I., MATSUOKA M. (2005) GIBBERELLIN INSENSITIVE DWARF1 encodes a soluble receptor for gibberellin. Nature 437: 693-698
UEGUCHI-TANAKA M., NAKAJIMA M., KATOH E., OHMIYA H., ASANO K., SAJI S., HONGYU X., ASHIKARI M., KITANO H., YAMAGUCHI I., MATSUOKA M. (2007) Molecular interactions of a soluble gibberellin receptor, GID1, with a rice DELLA protein, SLR1, and gibberellin. Plant Cell 19: 2140-2155
UEGUCHI-TANAKA M., NAKAJIMA M., MOTOYUKI A., MATSUOKA M. (2007) Gibberellin receptor and its role in gibberellin signaling in plants. Annu Rev Plant Biol 58: 183-198
VAN DAM N. M., HORN M., MARES M., BALDWIN I. T. (2001) Ontogeny constrains systemic protease inhibitor response in Nicotiana attenuata. Journal of Chemical Ecology 27: 547-568
VARBANOVA M., YAMAGUCHI S., YANG Y., MCKELVEY K., HANADA A., BOROCHOV R., YU F., JIKUMARU Y., ROSS J., CORTES D., MA C. J., NOEL J. P., MANDER L., SHULAEV V., KAMIYA Y., RODERMEL S., WEISS D., PICHERSKY E. (2007) Methylation of gibberellins by Arabidopsis GAMT1 and GAMT2. Plant Cell 19: 32-45
VOELCKEL C., KRUGEL T., GASE K., HEIDRICH N., VAN DAM N. M., WINZ R., BALDWIN I. T. (2001) Anti-sense expression of putrescine N-methyltransferase confirms defensive role of nicotine in Nicotiana sylvestris against Manduca sexta. Chemoecology 11: 121-126
WANG F., DENG X. W. (2011) Plant ubiquitin-proteasome pathway and its role in gibberellin signaling. Cell Research 21: 1286-1294
WASTERNACK C., HAUSE B. (2013) Jasmonates: biosynthesis, perception, signal transduction and action in plant stress response, growth and development. An update to the 2007 review in Annals of Botany. Annals of Botany 111: 1021-1058
WILLIGE B. C., GHOSH S., NILL C., ZOURELIDOU M., DOHMANN E. M. N., MAIER A., SCHWECHHEIMER C. (2007) The DELLA domain of GA INSENSITIVE mediates the interaction with the GA INSENSITIVE DWARF1A gibberellin receptor of Arabidopsis. Plant Cell 19: 1209-1220
WINZ R. A., BALDWIN I. T. (2001) Molecular interactions between the specialist herbivore Manduca sexta (Lepidoptera, Sphingidae) and its natural host Nicotiana attenuata. IV. Insect-induced ethylene reduces jasmonate-induced nicotine accumulation by regulating putrescine N-methyltransferase transcripts. Plant Physiology 125: 2189-2202

j
WOLDEMARIAM M. G., DINH S. T., OH Y., GAQUEREL E., BALDWIN I. T., GALIS I. (2013) NaMYC2 transcription factor regulates a subset of plant defense responses in Nicotiana attenuata. Bmc Plant Biology 13
WUENSCHE H., BALDWIN I. T., WU J. (2011) S-Nitrosoglutathione reductase (GSNOR) mediates the biosynthesis of jasmonic acid and ethylene induced by feeding of the insect herbivore Manduca sexta and is important for jasmonate-elicited responses in Nicotiana attenuata. Journal of Experimental Botany 62: 4605-4616
XU J. G., HU Q. P., LIU Y. (2012) Antioxidant and DNA-Protective Activities of Chlorogenic Acid Isomers. Journal of Agricultural and Food Chemistry 60: 11625-11630
YABUTA T, SUMIKI Y. 1938. On the crystal of gibberellin, a substance to promote plant growth. Journal of the Agricultural and Chemical Society Japan 14. 1526
YAMAGUCHI S. (2008) Gibberellin metabolism and its regulation. Annu Rev Plant Biol 59: 225-251 YAMAGUCHI S., SUN T.-P., SMITH M. W., BROWN R. G. S., KAMIYA Y. (1999) Phytochrome regulation of
gibberellin 3beta-hydroxylase genes in germinating Arabidopsis seeds. Plant Biology (Rockville) 1999: 153-154
YANG D.-H., BALDWIN I. T., WU J. (2013) Silencing Brassinosteroid Receptor BRI1 Impairs Herbivory-elicited Accumulation of Jasmonic Acid-isoleucine and Diterpene Glycosides, but not Jasmonic Acid and Trypsin Proteinase Inhibitors in Nicotiana attenuata. Journal of Integrative Plant Biology 55: 514-526
YANG D.-H., HETTENHAUSEN C., BALDWIN I. T., WU J. (2011) BAK1 regulates the accumulation of jasmonic acid and the levels of trypsin proteinase inhibitors in Nicotiana attenuata's responses to herbivory. Journal of Experimental Botany 62: 641-652
YANG D.-H., HETTENHAUSEN C., BALDWIN I. T., WU J. (2012) Silencing Nicotiana attenuata Calcium-Dependent Protein Kinases, CDPK4 and CDPK5, Strongly Up-Regulates Wound- and Herbivory-Induced Jasmonic Acid Accumulations. Plant Physiology 159: 1591-1607
YANG D. L., YAO J., MEI C. S., TONG X. H., ZENG L. J., LI Q., XIAO L. T., SUN T. P., LI J. G., DENG X. W., LEE C. M., THOMASHOW M. F., YANG Y. N., HE Z. H., HE S. Y. (2012) Plant hormone jasmonate prioritizes defense over growth by interfering with gibberellin signaling cascade. Proceedings of the National Academy of Sciences of the United States of America 109: E1192-E1200
YOUNG J. A., EVANS R. A. (1978) POPULATION-DYNAMICS AFTER WILDFIRES IN SAGEBRUSH GRASSLANDS. Journal of Range Management 31: 283-289
ZAMORE P. D., TUSCHL T., SHARP P. A., BARTEL D. P. (2000) RNAi: Double-stranded RNA directs the ATP-dependent cleavage of mRNA at 21 to 23 nucleotide intervals. Cell 101: 25-33
ZAVALA J. A., PATANKAR A. G., GASE K., HUI D. Q., BALDWIN I. T. (2004) Manipulation of endogenous trypsin proteinase inhibitor production in Nicotiana attenuata demonstrates their function as antiherbivore defenses. Plant Physiology 134: 1181-1190
ZHANG Y., TURNER J. G. (2008) Wound-Induced Endogenous Jasmonates Stunt Plant Growth by Inhibiting Mitosis. Plos One 3: e3699

c
7 Appendix
7.1 Additional measurements
7.1.1 Differences in plant height
The plants sprayed with GA showed significantly increased heights. Compared to the mock
plants with an average size of 83.4 cm, the GA sprayed plants with an average size of 94.7 cm
were approximately 10 cm taller. Student’s t-test revealed a high significance level of p=1*10-8
(Figure 23).
7.1.2 Differences in the angle of the rosette leaves
The rosette leaves of all sprayed plants seemed to be steeper than unsprayed plants but there
were also significant differences between the plants treated with GA and the mock plants. The
average horizontal angle of the rosette leaves was significant larger and the leaf-stem angle
(minimum and maximum) significant smaller for the plants sprayed with GA (Table 2). The
0
20
40
60
80
100
120
heig
ht (c
m)
***
Figure 23: Spraying N. attenuata plants with 10 µM GA3 (in 0.035 % EtOH) increased their height.
After 18 days of GA-treatment, the overall plant size of the GA-treated N. attenuata plants was higher compared to the control plants only treated with 0.035 % EtOH (mock). The measurements were performed with a folding ruler. The plants were measured from the surface of the soil to the uppermost tip. The black bars show the standard error, the stars above the level of significance calculated with Student’s t-test. The number of replicates was n=29 (15 mock and 14 GA3 sprayed plants).
mock 10 µM GA3

d
Student’s t-test resulted in significant differences between the minimum horizontal leaf angel
of the control and the GA treated plants (p=5.6*10-6), as well as between the maximum
horizontal leaf angle of the mock and the GA treated plants (p=2.9*10-6). There were also
significant differences between the minimal and maximal leaf-stem angles of the mock and the
GA treated plants (p=6.65*10-4 and p=8.19*10-4 respectively).
Table 2: Measurements of the leaf-stem angle of N. attenuata plants.
The leaf-stem angles (measured with a goniometer) of the plants sprayed with 10 µM GA3 (in 0.035 % EtOH) were significantly lower compared the control plants only treated with 0.035 % EtOH (mock). For the t-test after Student the fields of the same color were compared. Before comparing the means, the data was tested for its distribution with Kolmogorov-Smirnov (KS) test. The 2-tailed asymptotic significance is abbreviated with “as Sig” and the distribution with “distr”.
leaf-stem angle (°) mock 10 µM GA3 Plant number min. max. min. max.
1 50 92 19 54 2 48 64 30 63 3 65 80 25 71 4 55 73 43 70 5 47 58 36 74 6 29 76 38 58 7 48 75 38 57 8 34 80 45 55 9 44 79 45 76
10 50 83 38 67 11 48 80 29 70 12 39 88 44 71 13 55 81 35 75 14 60 79 45 61 15 50 81 31 78
average 48.1 77.9 36.1 66.7 standard error 2.4 2.2 2.1 2.1 KS-Test (as. Sig.) 0.69 0.48 0.93 0.63 KS-Test (distr.) normal normal normal normal T-test 5.31E-03 5.52E-03

e
7.2 Preparation of the VIGS construct
7.2.1 Amplification of the partial target gene
After the PCR with partial target sequence specific primers (Table 1) the gel electrophoresis
showed bands around 300 bp for each product (Figure 24). The annealing temperatures
showing the strongest bands were 64.2 °C for DELLA1, 63,1 °C for GA2ox3 and 64,2 °C for
GID1a. The varying temperatures were applied to ensure the presence of a suitable product.
Figure 24: Gel electrophoresis after the PCR of N. attenuata cDNA
The primers used were specific to the partial sequence of the target gene. The strongest bands (around 300 bp) showed up at annealing temperatures of 64.2 °C for DELLA1 (DEL), 63.1 °C for GA2ox3 (GA) and 64.2 °C for GID1a (GID).
The extraction of the PCR product from the gel was successful. The second gel electrophoresis
using 1 µL of the extracted DNA also showed the target genes at 300 bp. The concentration of
the partial target DNA for GA2ox was lower than the ones from DELLA1 and GID1a (Figure 25)
but still adequate enough to continue preparing the construct.

f
Figure 25: Gel electrophoresis of the extracted PCR products.
The products for each partial target gene incubated at varying temperatures and extracted from the gel (Figure 24) were combined (e.g. DEL = DEL1, DEL2 and DEL3).
7.2.2 Restriction digestion analysis
The restriction digestion performed for each target cut the ends of the target DNA insert in
order to prepare them for the ligation with the vector PTV Lox 6/1. To make sure that the
restriction enzymes cut at the correct position a gel electrophoresis was performed. The
product showed still bands around 300 bp, the restriction digestion worked fine (Figure 26).

g
Figure 26: Gel electrophoresis after restriction digestion of the extracted target DNA.
For all target genes products showed up around 300 bp. The products after the extraction were divided into two gel bags. Therefore there are two bands for each target.
After isolating and combining the target products from the gel, another extraction was
performed and the presence of the product verified via gel electrophoresis. Again the product
was detectable at a length of approximately 300 bp (Figure 27).

h
Figure 27: Gel electrophoresis of the digested target DNA.
The gel electrophoresis was performed after extracting the target DNA of the digested product from the former gel electrophoresis (Figure 26). The volume of the analyzed product was 1 µL.
7.2.3 Isolation of the target plasmids from E. coli after the transformation
The ligation of the target DNAs with the vector PTV Lox 6/1 and the subsequent transformation
of the plasmids into E. coli were successful. The gel electrophoresis performed after ligation,
transformation, plasmid extraction and subsequent restriction digestion showed the target
DNA fragments (at ca. 300 bp) and the vector PTV Lox 6/1 (at ca. 7000 bp) for GA2ox3 (Figure
28, Figure 29), DELLA1 (Figure 30, Figure 31) and GID1a (Figure 32, Figure 33) in a bands around
7 kbp. All three ligations and transformations performed well. The sequencing of the plasmids
confirmed the presence of the target genes for GA2ox3 and DELLA1 but not for GID1a. After
several unsuccessful attempts it was decided to only silence the genes GA2ox3 and DELLA1.

i
Figure 28: Gel electrophoresis performed after plasmid extraction and restriction digestion.
The plasmids of the pure colonies received after transformation of the GA2ox3 plasmid were extracted and subsequently digested plasmid with Bam HI and Sal I. The vector could be seen at around 7000 bp and the target DNA at around 300 bp. The presence of the target DNA in the digested plasmid was taken as an evidence for successful ligation and transformation.
Figure 29: Gel electrophoresis performed after plasmid extraction and restriction digestion.
The plasmids of the pure colonies received after transformation of the GA2ox3 plasmid were extracted and subsequently digested plasmid with Bam HI and Sal I. The vector could be seen at around 7000 bp and the target DNA at around 300 bp. The presence of the target DNA in the digested plasmid was taken as an evidence for successful ligation and transformation.

j
Figure 30: Gel electrophoresis performed after plasmid extraction and restriction digestion.
The plasmids of the pure colonies received after transformation of the DELLA1 plasmid were extracted and subsequently digested plasmid with Bam HI and Sal I. The vector could be seen at around 7000 bp and the target DNA at around 300 bp. The presence of the target DNA in the digested plasmid was taken as an evidence for successful ligation and transformation.
Figure 31: Gel electrophoresis performed after plasmid extraction and restriction digestion.
The plasmids of the pure colonies received after transformation of the DELLA1 plasmid were extracted and subsequently digested plasmid with Bam HI and Sal I. The vector could be seen at around 7000 bp and the target DNA at around 300 bp. The presence of the target DNA in the digested plasmid was taken as an evidence for successful ligation and transformation.

k
Figure 32: Gel electrophoresis performed after plasmid extraction and restriction digestion.
The plasmids of the pure colonies received after transformation of the GID1a plasmid were extracted and subsequently digested plasmid with Bam HI and Sal I. The vector could be seen at around 7000 bp and the target DNA at around 300 bp. The presence of the target DNA in the digested plasmid was taken as an evidence for successful ligation and transformation.
Figure 33: Gel electrophoresis performed after plasmid extraction and restriction digestion.
The plasmids of the pure colonies received after transformation of the GID1a plasmid were extracted and subsequently digested plasmid with Bam HI and Sal I. The vector could be seen at around 7000 bp and the target DNA at around 300 bp. The presence of the target DNA in the digested plasmid was taken as an evidence for successful ligation and transformation.

l
7.3 Volatile organic compounds Table 3: Relative emission of volatile organic compounds (VOCs).
The upper part of the table contains the average values adjusted to the leaf surface and the lower part the standard errors. Only few VOCs showed differences between the plants sprayed with GA3 (dissolved in 0.035% EtOH) and the mock plants (only sprayed with 0.035% EtOH) as well as between the VIGS plants. The samples were measured with SHIMADZU GCMS – QP2010 Ultra Thermo desorption unit TD20. The fields marked with “-“ did not have the required number of three replicates with values larger than 5000 counts (which were considered not to be background noise).
mock GA pTV00 DELLA GA2ox3 mock GA pTV00 DELLA GA2ox3 mock GA pTV00 DELLA Ga2ox3(E)-alpha-Bergamotene 360 452 7088 10234 8763 1712 1165 10945 10316 10699 25320 10135 9093 14899 11071 7476 181
3(Z)-Hexenyl butanoate 2144 934 1666 1985 1417 6229 6021 1897 2689 2310 7579 5501 - 2306 2393 1049 -
3(Z)-Hexenyl isobutyrate 1207 917 929 1050 833 2931 3113 1029 1258 1145 2267 2260 - 1458 1294 - 205
5┤-epi-aristolochene - - 27022 39872 31357 222 - 34193 42220 38369 3209 4024 31946 43292 48130 28585 -
alpha-Duprezianene 1484 1557 13916 17339 18177 2205 1558 18190 16986 18299 1578 1375 14193 18681 18702 11810 771
Benzyl acetone 20629 22565 - 6949 - 19885 20062 - - - 26614 21242 - - - - 19298
MW 220 2686 3477 38070 50326 46815 6515 3745 52719 44828 48545 4166 2795 37263 51914 53955 32113 1453
Nicotine 101790 132587 44594 13200 67157 65539 63039 39802 23208 34122 90430 59350 74633 26003 37047 2424 -
PUTATIVE 3(Z)-Hexenyl (E)-2-methylbut-2-enoate 2488 866 2326 - 2456 4147 4405 - - - 4495 3270 2098 3631 3538 2390 -
PUTATIVE 3(Z)-Hexenyl caproate 2102 1433 - 531 - 4537 3859 911 - - 2695 2387 870 - - 589 -
PUTATIVE 3(Z)-Hexenyl isovalerate 5530 1573 - - - 8270 10399 - - - 5155 4502 - - - - 883
PUTATIVE alpha-Terpineol 1562 1157 3037 4017 3468 2377 1437 3771 4843 4378 4042 1412 3172 4297 4210 2910 208
PUTATIVE GLV ester RT:29.143 916 988 9520 12881 12456 1625 1131 13750 11784 12599 1298 878 9876 13455 14094 8616 -
PUTATIVE sesquiterpene RT:26.390 - - 3301 5436 3826 - - 4064 5117 4604 - - 3731 4841 5728 3433 -
Tetradecenal 366 433 6330 9217 4782 345 398 5650 8541 4790 507 315 5834 5653 8325 5457 297
standard errors(E)-alpha-Bergamotene 7 84 781 538 666 713 219 1706 375 717 5416 2467 543 2914 2702 142 7
3(Z)-Hexenyl butanoate 421 108 215 82 111 2160 1356 271 325 233 1047 1200 - 797 351 185 -
3(Z)-Hexenyl isobutyrate 258 172 131 152 152 947 613 108 231 99 300 266 - 175 76 - 20
5┤-epi-aristolochene - - 2973 2866 2424 50 - 2956 7418 2299 729 1744 938 4238 4392 1030 -
alpha-Duprezianene 183 194 854 959 1097 260 97 1316 441 1680 62 172 546 1491 1575 298 31
Benzyl acetone 2167 2009 - 441 - 1433 2960 - - - 2470 2532 - - - - 1955
MW 220 138 564 2655 4088 3777 1020 297 3583 1148 3782 553 369 2173 5268 3342 1481 44
Nicotine 48983 50030 6963 4192 16252 23378 9296 6732 6675 6192 21947 16683 12345 2192 4952 656 -
PUTATIVE 3(Z)-Hexenyl (E)-2-methylbut-2-enoate 558 147 455 - 251 1450 885 - - - 1083 588 311 663 288 280 -
PUTATIVE 3(Z)-Hexenyl caproate 497 398 - 33 - 934 409 266 - - 608 515 255 - - 72 -
PUTATIVE 3(Z)-Hexenyl isovalerate 1525 366 - - - 3256 2968 - - - 677 623 - - - - 121
PUTATIVE alpha-Terpineol 337 172 277 248 361 843 239 316 747 154 964 253 210 501 217 145 13
PUTATIVE GLV ester RT:29.143 155 174 756 859 883 253 91 762 459 784 197 261 535 1105 989 351 -
PUTATIVE sesquiterpene RT:26.390 - - 453 554 362 - - 295 882 359 - - 249 729 385 174 -
Tetradecenal 43 74 1299 1246 1053 23 53 1971 1693 1149 51 61 327 1361 1797 201 40
Volatile Organic Compound blank GA
relative emmision (counts * second) / cm2
control W+W W+OS blank VIGS

m
Relating to the VIGS experiment, the only VOC showing blanks with values smaller than 10 % of
the highest value was nicotine but nicotine was not taken into consideration since the smallest
injury of the leaf or broken trichomes during the collection of the VOCs could have influenced
the nicotine emission. Therefore it is only shown here in the appendix.
0
10
20
30
40
50
60
70
80
90
100
pTV00 DELLA1 GA2ox3 Blank
Nicotine
control
W+W
W+OS**
*
*
Figure 34: Emission of nicotine measured in the VIGS plants.
Nicotine as a VOC was not taken into consideration since the slightest injury of the leaves or trichomes would lead to distorted values.
Rela
tive
emis
sion