INFLAMMATION Copyright © 2018 The Hippo pathway effector ... · Hippo pathway also cross-talks...
12
Hagenbeek et al., Sci. Signal. 11, eaaj1757 (2018) 11 September 2018 SCIENCE SIGNALING | RESEARCH ARTICLE 1 of 11 INFLAMMATION The Hippo pathway effector TAZ induces TEAD-dependent liver inflammation and tumors Thijs J. Hagenbeek 1 , Joshua D. Webster 2 , Noelyn M. Kljavin 3 , Matthew T. Chang 4 , Trang Pham 1 , Ho-June Lee 1 , Christiaan Klijn 4 , Allen G. Cai 1 , Klara Totpal 5 , Buvana Ravishankar 6 , Naiying Yang 5 , Da-Hye Lee 7 , Kevin B. Walsh 3 , Georgia Hatzivassiliou 6 , Cecile C. de la Cruz 5 , Stephen E. Gould 5 , Xiumin Wu 8 , Wyne P. Lee 8 , Shuqun Yang 9 , Zhixiang Zhang 9 , Qingyang Gu 9 , Qunsheng Ji 9 , Erica L. Jackson 1 , Dae-Sik Lim 7 , Anwesha Dey 1 * The Hippo signaling pathway regulates organ size and plays critical roles in maintaining tissue growth, homeosta- sis, and regeneration. Dysregulated in a wide spectrum of cancers, in mammals, this pathway is regulated by two key effectors, YAP and TAZ, that may functionally overlap. We found that TAZ promoted liver inflammation and tumor development. The expression of TAZ, but not YAP, in human liver tumors positively correlated with the expression of proinflammatory cytokines. Hyperactivated TAZ induced substantial myeloid cell infiltration into the liver and the secretion of proinflammatory cytokines through a TEAD-dependent mechanism. Furthermore, tumors with hyperactivated YAP and TAZ had distinct transcriptional signatures, which included the increased expression of inflammatory cytokines in TAZ-driven tumors. Our study elucidated a previously uncharacterized link between TAZ activity and inflammatory responses that influence tumor development in the liver. INTRODUCTION Liver cancer, which includes hepatocellular carcinoma (HCC) and cholangiocarcinoma (CCA), is a major cause of cancer-related deaths and is a substantial unmet medical need (1). Although the number of cases has substantially increased in recent years, the treatment options have hardly changed. Progress in detection and treatment of localized disease has been made, but the 5-year relative survival rate for distant stage liver cancer patients is 3.1%, whereas that of regional stage liver cancer is 10.7% (www.cancer.org). Hence, there is a clear need for new and better treatment options for liver cancer patients. The Hippo signaling pathway has emerged in recent years as a central regulator of organ size (2, 3). The linear kinase cascade that activates this pathway is highly conserved between Drosophila and mammals. Multiple factors act on the kinases mammalian STE20- like protein kinase 1/2 (MST1/2) and the adaptor salvador 1 (SAV1/ WW45). MST kinases phosphorylate Mob1 homolog (MOB1) and large tumor suppressor 1/2 (LATS1/2) kinases. Upon activation, LATS kinases then phosphorylate Yes-associated protein (YAP) and transcriptional coactivator with PDZ-binding motif (TAZ, also known as WWTR1), the key effectors of the Hippo pathway. In their unphosphorylated state, YAP and TAZ are localized to the nu- cleus where they interact with the transcriptional enhanced associ- ate domain (TEAD) family of transcription factors and regulate target gene expression to modulate cell growth, proliferation, and survival. However, phosphorylated YAP and TAZ are excluded from the nucleus and degraded in the cytoplasm, which prevents their activity. Dysregulation of the Hippo pathway has been identi- fied in a wide spectrum of cancers (4), highlighting a key role of the pathway in maintaining cellular homeostasis and tissue growth (5). Literature surrounding the Hippo pathway is largely focused on the pathway’s role in development, regeneration, and cellular ho- meostasis through the balance of cell proliferation and death and its dysregulation in cancer. The pathway has other nongrowth and nondevelopmental processes in Drosophila, where the Hippo path- way is activated by innate immunity Toll receptor signaling (6). The Hippo pathway also cross-talks with other developmental signaling pathways (7–11) and several novel members of the pathway, and ex- tracellular stimuli provide physiological modulation of the pathway. Most studies have focused on YAP as a key effector of the Hippo pathway. Whereas Yorkie (YKI) is the only Hippo pathway effector encoded in flies, mammals have two paralogous effector proteins, YAP and TAZ. On the basis of genetic mouse studies, YAP and TAZ appear to have distinct, nonredundant functions during devel- opment. While YAP knockout mice die during embryonic develop- ment (12), TAZ knockout mice develop polycystic kidney disease (13, 14). Whether this is due to differences in expression patterns during development or functional distinctions is not well under- stood. Although both YAP and TAZ are dysregulated in a variety of cancers, whether there are differences in the tumorigenic properties of YAP and TAZ remains unknown. Therefore, it is important to assess biological differences between YAP and TAZ and to under- stand their differential regulation in development and disease. Given that the liver is exquisitely sensitive to modulation of the Hippo pathway and several studies have reported a role of YAP in liver cancer (15–17), in this study, we investigated whether TAZ has dis- tinct functions in the liver. Here, we characterized the effects of expressing hyperactivated TAZ in the liver. We found that cooperation of hyperactivated TAZ (TAZ-4SA) and oncogenic NRasV12 in the liver increased cytokine 1 Department of Discovery Oncology, Genentech Inc., 1 DNA Way, South San Fran- cisco, CA 94080, USA. 2 Department of Pathology, Genentech Inc., South San Fran- cisco, CA 94080, USA. 3 Department of Molecular Oncology, Genentech Inc., South San Francisco, CA 94080, USA. 4 Department of Bioinformatics and Computational Biology, Genentech Inc., South San Francisco, CA 94080, USA. 5 Department of Translational Oncology, Genentech Inc., South San Francisco, CA 94080, USA. 6 De- partment of Cancer Immunotherapy, Genentech Inc., South San Francisco, CA 94080, USA. 7 Department of Biological Sciences, Korea Advanced Institute of Science and Technology, Daejeon 34141, Korea. 8 Department of Translational Immunology, Genentech Inc., South San Francisco, CA 94080, USA. 9 Oncology Business Unit, Research Service Division, WuXi AppTec, Waigaoqiao Free Trade Zone, Shanghai 200131, China. *Corresponding author. Email: [email protected] Copyright © 2018 The Authors, some rights reserved; exclusive licensee American Association for the Advancement of Science. No claim to original U.S. Government Works on March 29, 2020 http://stke.sciencemag.org/ Downloaded from
Transcript of INFLAMMATION Copyright © 2018 The Hippo pathway effector ... · Hippo pathway also cross-talks...
Hagenbeek et al., Sci. Signal. 11, eaaj1757 (2018) 11 September 2018
S C I E N C E S I G N A L I N G | R E S E A R C H A R T I C L E
1 of 11
I N F L A M M A T I O N
The Hippo pathway effector TAZ induces TEAD-dependent liver inflammation and tumorsThijs J. Hagenbeek1, Joshua D. Webster2, Noelyn M. Kljavin3, Matthew T. Chang4, Trang Pham1, Ho-June Lee1, Christiaan Klijn4, Allen G. Cai1, Klara Totpal5, Buvana Ravishankar6, Naiying Yang5, Da-Hye Lee7, Kevin B. Walsh3, Georgia Hatzivassiliou6, Cecile C. de la Cruz5, Stephen E. Gould5, Xiumin Wu8, Wyne P. Lee8, Shuqun Yang9, Zhixiang Zhang9, Qingyang Gu9, Qunsheng Ji9, Erica L. Jackson1, Dae-Sik Lim7, Anwesha Dey1*
The Hippo signaling pathway regulates organ size and plays critical roles in maintaining tissue growth, homeosta-sis, and regeneration. Dysregulated in a wide spectrum of cancers, in mammals, this pathway is regulated by two key effectors, YAP and TAZ, that may functionally overlap. We found that TAZ promoted liver inflammation and tumor development. The expression of TAZ, but not YAP, in human liver tumors positively correlated with the expression of proinflammatory cytokines. Hyperactivated TAZ induced substantial myeloid cell infiltration into the liver and the secretion of proinflammatory cytokines through a TEAD-dependent mechanism. Furthermore, tumors with hyperactivated YAP and TAZ had distinct transcriptional signatures, which included the increased expression of inflammatory cytokines in TAZ-driven tumors. Our study elucidated a previously uncharacterized link between TAZ activity and inflammatory responses that influence tumor development in the liver.
INTRODUCTIONLiver cancer, which includes hepatocellular carcinoma (HCC) and cholangiocarcinoma (CCA), is a major cause of cancer-related deaths and is a substantial unmet medical need (1). Although the number of cases has substantially increased in recent years, the treatment options have hardly changed. Progress in detection and treatment of localized disease has been made, but the 5-year relative survival rate for distant stage liver cancer patients is 3.1%, whereas that of regional stage liver cancer is 10.7% (www.cancer.org). Hence, there is a clear need for new and better treatment options for liver cancer patients.
The Hippo signaling pathway has emerged in recent years as a central regulator of organ size (2, 3). The linear kinase cascade that activates this pathway is highly conserved between Drosophila and mammals. Multiple factors act on the kinases mammalian STE20-like protein kinase 1/2 (MST1/2) and the adaptor salvador 1 (SAV1/WW45). MST kinases phosphorylate Mob1 homolog (MOB1) and large tumor suppressor 1/2 (LATS1/2) kinases. Upon activation, LATS kinases then phosphorylate Yes-associated protein (YAP) and transcriptional coactivator with PDZ-binding motif (TAZ, also known as WWTR1), the key effectors of the Hippo pathway. In their unphosphorylated state, YAP and TAZ are localized to the nu-cleus where they interact with the transcriptional enhanced associ-ate domain (TEAD) family of transcription factors and regulate
target gene expression to modulate cell growth, proliferation, and survival. However, phosphorylated YAP and TAZ are excluded from the nucleus and degraded in the cytoplasm, which prevents their activity. Dysregulation of the Hippo pathway has been identi-fied in a wide spectrum of cancers (4), highlighting a key role of the pathway in maintaining cellular homeostasis and tissue growth (5).
Literature surrounding the Hippo pathway is largely focused on the pathway’s role in development, regeneration, and cellular ho-meostasis through the balance of cell proliferation and death and its dysregulation in cancer. The pathway has other nongrowth and nondevelopmental processes in Drosophila, where the Hippo path-way is activated by innate immunity Toll receptor signaling (6). The Hippo pathway also cross-talks with other developmental signaling pathways (7–11) and several novel members of the pathway, and ex-tracellular stimuli provide physiological modulation of the pathway.
Most studies have focused on YAP as a key effector of the Hippo pathway. Whereas Yorkie (YKI) is the only Hippo pathway effector encoded in flies, mammals have two paralogous effector proteins, YAP and TAZ. On the basis of genetic mouse studies, YAP and TAZ appear to have distinct, nonredundant functions during devel-opment. While YAP knockout mice die during embryonic develop-ment (12), TAZ knockout mice develop polycystic kidney disease (13, 14). Whether this is due to differences in expression patterns during development or functional distinctions is not well under-stood. Although both YAP and TAZ are dysregulated in a variety of cancers, whether there are differences in the tumorigenic properties of YAP and TAZ remains unknown. Therefore, it is important to assess biological differences between YAP and TAZ and to under-stand their differential regulation in development and disease. Given that the liver is exquisitely sensitive to modulation of the Hippo pathway and several studies have reported a role of YAP in liver cancer (15–17), in this study, we investigated whether TAZ has dis-tinct functions in the liver.
Here, we characterized the effects of expressing hyperactivated TAZ in the liver. We found that cooperation of hyperactivated TAZ (TAZ-4SA) and oncogenic NRasV12 in the liver increased cytokine
1Department of Discovery Oncology, Genentech Inc., 1 DNA Way, South San Fran-cisco, CA 94080, USA. 2Department of Pathology, Genentech Inc., South San Fran-cisco, CA 94080, USA. 3Department of Molecular Oncology, Genentech Inc., South San Francisco, CA 94080, USA. 4Department of Bioinformatics and Computational Biology, Genentech Inc., South San Francisco, CA 94080, USA. 5Department of Translational Oncology, Genentech Inc., South San Francisco, CA 94080, USA. 6De-partment of Cancer Immunotherapy, Genentech Inc., South San Francisco, CA 94080, USA. 7Department of Biological Sciences, Korea Advanced Institute of Science and Technology, Daejeon 34141, Korea. 8Department of Translational Immunology, Genentech Inc., South San Francisco, CA 94080, USA. 9Oncology Business Unit, Research Service Division, WuXi AppTec, Waigaoqiao Free Trade Zone, Shanghai 200131, China.*Corresponding author. Email: [email protected]
Copyright © 2018 The Authors, some rights reserved; exclusive licensee American Association for the Advancement of Science. No claim to original U.S. Government Works
on March 29, 2020
http://stke.sciencemag.org/
Dow
nloaded from

Hagenbeek et al., Sci. Signal. 11, eaaj1757 (2018) 11 September 2018
S C I E N C E S I G N A L I N G | R E S E A R C H A R T I C L E
2 of 11
production, tissue myeloid cell recruitment, and mortality in mice. We further found that these effects required TAZ-TEAD interaction. Our studies highlight that TAZ has a key role in promoting inflam-mation and development of liver tumors. Furthermore, tumors gen-erated by hyperactivated YAP or TAZ had distinct transcriptional signatures, which suggests that YAP and TAZ may have distinct and combinatorial roles in liver tumor development.
RESULTSTAZ expression correlates with CCL2 and CXCL1 mRNA amount in tumorsHCC is associated with increased inflammation at all stages of the disease (18). Given the established role of the Hippo pathway in HCC (19), we assessed the gene expression data across a panel of 57 patient-derived xenograft (PDX) HCC models by RNA sequencing (RNA-seq). We found that Taz expression, but not Yap, was among the most positively correlated with C-C motif chemokine ligand 2 (Ccl2, also Mcp1), C-X-C motif chemokine ligand 1 (Cxcl1, also Kc), and interleukin-6 (Il-6) expression (Fig. 1, A and B). Similar results were obtained when examining The Cancer Genome Atlas (TCGA) RNA expression data for the correlation of cytokines (Mcp1 and Kc) with Taz, but not Yap, across multiple cancer types (Fig. 1C). Further-more, these cytokines correlated better with Taz expression, but not with Yap expression, in a panel of 20 human liver cancer cell lines as well (Fig. 1D). These data suggested that inflammation may be asso-ciated specifically with TAZ expression in multiple cancers, includ-ing HCC and liver cancer.
Expression of active YAP stimulates tumor formation in miceGiven the differences between the correlation of Yap and Taz ex-pression with inflammatory cytokines, we investigated the effect of YAP and TAZ overexpression on liver tumorigenesis driven by hy-drodynamic tail vein (HTV) injection of DNA. HTV injection of DNA constructs with sleeping beauty (SB) transposase allows for the rapid uptake and expression of the construct within the liver (20). In this system, NRasV12 expression alone is not sufficient to drive tumor formation but facilitates hepatocellular transformation in mice (21). Whereas TAZ plays a critical role in fibrosis and liver inflammation (22), YAP is important for macrophage recruitment by tumor-initiating cells (23). However, the differential effects of YAP and TAZ on liver inflammation or tumor growth remain unclear.
Abolishing all the LATS kinase phosphorylation sites in vitro re-sults in hyperactivated YAP (24). When we expressed YAP-5SA, which has all five LATS sites mutated with NRasV12 and SB in the mouse liver by HTV injection of plasmids, we found that activated YAP reduced the survival of mice (Fig. 2A). Similarly, coexpression of NRasV12 and constitutively active YAP-S127A also reduced mouse survival (Fig. 2B). Inhibiting the interaction of YAP with the TEAD transcription factors (YAPS94A mutant) significantly res-cued survival of mice that received activated YAP (Fig. 2, A and B). Histological analysis suggested that expression of activated YAP stim-ulated multifocal expansion of oval cell populations in 75% of the mice (9 of 12; Fig. 2C) and a 33% (4 of 12) incidence of intrahepatic tumor formation (HCC or anaplastic spindle cell tumor/sarcoma; Fig. 2D). In contrast, in mice injected with NRasV12, a hepatocellu-lar adenoma was only identified in 1 of 10 mice around 20 weeks after injection. Activated YAP–associated tumors tended to be ana-plastic, although some tumors had features of HCC and CCA. Flow
cytometry analysis of immune cells from the liver of control (NRasV12), YAP-5SA, or YAP-5SA/S94A (TEAD binding–deficient) mice revealed no significant differences between myeloid cell infil-trations in this model (Fig. 2, E and F). These data suggest that over-expression of activated YAP stimulates TEAD-dependent tumor development and impaired survival in mice.
Hyperactivated TAZ stimulates proinflammatory myeloid cell infiltration of tissuesBecause abolishing all the LATS inhibitory phosphorylation sites in vitro results in hyperactivated TAZ (24), we also mutated all four LATS phosphosites from serine to alanine (TAZ-4SA) to generate constitutively active Taz constructs. When we injected mice with Taz-4SA and NRasV12 plasmids, we found that they all died within 1 week (Fig. 2G). This rapid mortality was observed on two differ-ent genetic backgrounds (FVB and C57BL/6; Fig. 2G). In contrast, we found no effect on mortality when we injected Taz-4SA alone (Fig. 3A).
Death was associated with enlarged livers with morphological features of inflammation in the TAZ-4SA mice (Figs. 2H and 3B and fig. S1). We noted that TAZ abundance was increased in the livers as early as 2 days after injection (Fig. 2I and fig. S2) and that some liver morphology changes occurred when TAZ-4SA was expressed alone (Fig. 3B). Morphologically altered cells were pancytokeratin AE1/AE3–positive and von Willebrand factor (VWF)–negative (Fig. 3C and fig. S3A), suggesting that these cells had an epithelial origin. We also found strong F4/80 (Fig. 3C) and CD68 (fig. S3B) immunolabeling in liver sections of mice that received coinjection of Taz-4SA and NRasV12. Flow cytometry analysis of liver immune infiltrates indicated that overexpression of activated TAZ increased the frequency and number of CD11b+F4/80+Gr1− macrophages in this tissue (Fig. 3, D and E). Increased inflammatory cells were also found in multiple organs, most notably in the spleen and lung (fig. S4).
To evaluate whether the massive myeloid infiltration in mice co-injected with Taz-4SA and NRasV12 caused the increased mortality that we observed, we depleted myeloid cells by either a single dose of 10-gray (Gy) irradiation or injection with clodronate liposomes. Neither method of myeloid cell depletion rescued the lethality seen after coinjection with Taz-4SA and NRasV12 in mice (fig. S5A). After myeloid depletion, we found that there was no change in the liver dys-plasia associated with overexpression of activated TAZ and NRasV12, although inflammatory infiltrates were reduced (fig. S5B). These re-sults indicated that hepatocyte morphology changes in these mice were not dependent on myeloid infiltration.
When we evaluated the serum cytokine profile of mice after HTV injection, we found that circulating proinflammatory cytokines were altered in mice injected with either Taz-4SA alone or both Taz-4SA and NRasV12 (Fig. 3F). Gene expression analyses on FACS (fluorescence- activated cell sorting)–sorted macrophages revealed that expression of genes involved in inflammation and endoplasmic reticulum stress was increased in mice coinjected with Taz-4SA and NRasV12 (Fig. 3G). Transcript expression of Il-6, Stat3 (signal transducer and activator of transcription 3), and ATF4/EIF2A (activating transcription factor 4/ eukaryotic translational initiation factor 2A) all increased in macro-phages from these mice. Together, these data demonstrated that hyper-activated TAZ increased proinflammatory cytokine production and myeloid cell recruitment. This is strikingly similar to what we ob-served in the PDX HCC models and across multiple TCGA indications
on March 29, 2020
http://stke.sciencemag.org/
Dow
nloaded from

Hagenbeek et al., Sci. Signal. 11, eaaj1757 (2018) 11 September 2018
S C I E N C E S I G N A L I N G | R E S E A R C H A R T I C L E
3 of 11
TAZ YAP
−0.2
0.0
0.2
0.4
0.6
Spe
arm
an c
orre
latio
n
0.0 0.5 1.0 1.5
−10
−8
−6
−4
−2
0
2
Liver cell lines only
TAZ mRNA (z-score)
CC
L2/C
CL5
/CX
CL1
Z−s
core
s
P value: 0.01Spearman correlation: 0.54
0.9 1.0 1.1 1.2 1.3
−10
−8
−6
−4
−2
0
2
Liver cell lines only
YAP mRNA (z-score)
CC
L2/C
CL5
/CX
CL1
Z−s
core
s
P value: NSSpearman correlation: 0.03
A ●
●
●●
●
0.0
0.5
1.0
WW
TR1
TGFB2CCL2
SPP1CCL7
CXCL5
CXCL2
CCL21
VEGFAIL6IL11
BMP7CCL8
CXCL1
CXCL8IL18
CCL11
CD40LGCSF3LIF
CSF1
TNFRSF11B
TNFSF11
TGFB1IL1
5CSF2
YAP1IL1
B
ADIPOQ
CX3CL1
BMP2IL1
3
CXCL9PF4PPBP
IL17A
TNFSF10
CXCL11
CXCL12GPI
IL24IL1
A
TNFSF13B
IL12B
CCL20
BMP6
FASLGIL1
7FTHPO
IL23ABMP4
CNTFIL3TNFMIFCCL5
CCL13
CXCL16
IL10
CCL18IL2
2
CXCL13LT
BOSM
CXCL10
IFNGCCL2
4IL2IL4IL7
CCL17
CCL3IL21
IL12A
CCL22
MSTNIL1
6
NODALXCL1
CCL1LTAIL5IL9
IFNA2IL1
RNIL2
7
CCL19
Pea
rson
cor
rela
tion
CCL2
CXCL1
IL-6
Other
WWTR1
YAP
Correlation with TAZ
●
●
●
● ●
−0.5
0.0
0.5
1.0
YAP1BMP4
BMP7
TGFB2CCL7PF4
MSTNIL1
1
CCL11
WW
TR1SPP1
ADIPOQBMP6
IL17F
CXCL12
THPOCCL2
4
CXCL5BMP2
CNTFCCL2
CX3CL1
TGFB1
VEGFAMIFIL2
1LT
BPPBPIL6
CXCL1IL18
NODALLIFIFNGIL5
TNFRSF11B
CCL8
CXCL8
CXCL2IL13
XCL1
CXCL13
IL22
IL1RNIL1
6TNF
CXCL11
CD40LGIL1
ACSF3
TNFSF13B
CCL21
CCL19
CXCL16
IL24
TNFSF11
CCL20IL2
CXCL9IL1
7A
CCL22
CCL3IFNA2
FASLGLTA
CSF2IL1
BIL1
2ACSF1
GPI
CCL18IL1
0IL4IL9OSMCCL1IL2
7
CXCL10
IL15
TNFSF10
CCL13
CCL5IL1
2BIL3IL2
3A
CCL17IL7
Pea
rson
cor
rela
tion
Correlation with YAP
B
●
●●
●
●●
CCL2
IL-6
CXCL1
CCL2
IL-6CXCL1
*
0.0
0.1
0.2
0.3
0.4
0.5
TAZ
YAP
Pea
rson
cor
rela
tion
●●●
●●●
ns
●●
**
● ●ns
*
●
●
●
●
●
ns
●
****
CCL2 CXCL1 IL-6
Norm
alTum
or
TAZ YAP TAZ YAP TAZ YAP
−1.0
−0.5
0.0
0.5
1.0
−1.0
−0.5
0.0
0.5
1.0
Pea
rson
cor
rela
tion
C
D
Fig. 1. TAZ expression correlates with CCL2 and CXCL1 expression in tumors. (A and B) Pearson correlation between Taz (A) or Yap (B) expression and chemokine and cytokine mRNAs in RNA-seq data from PDX HCC models. Data for the colored genes are means ± SD from 57 tumor models. (C) Pearson correlation between Yap or Taz expression and Ccl2, Il-6, and Cxcl1 mRNAs in TCGA RNA-seq data sets. Boxplot data are median and quartile correlation values between Taz and Yap with the indicated genes within 22 TCGA indications. (D) Correlation between Yap and Taz expression with inflammatory cytokines. Boxplot data are median and quartile values [left, P value: not significant (ns)], and scatterplot data are mean values (right) from 20 liver cancer cell lines. *P < 0.05 by unpaired t test (B and C), **P < 0.01, ****P < 0.0001 (C), Wilcoxon rank sum test (D, left), or Spearman rank correlation (D, right).
on March 29, 2020
http://stke.sciencemag.org/
Dow
nloaded from

Hagenbeek et al., Sci. Signal. 11, eaaj1757 (2018) 11 September 2018
S C I E N C E S I G N A L I N G | R E S E A R C H A R T I C L E
4 of 11
(Fig. 1), where increased TAZ expression was correlated with in-creased expression of the inflammatory cytokine CCL2.
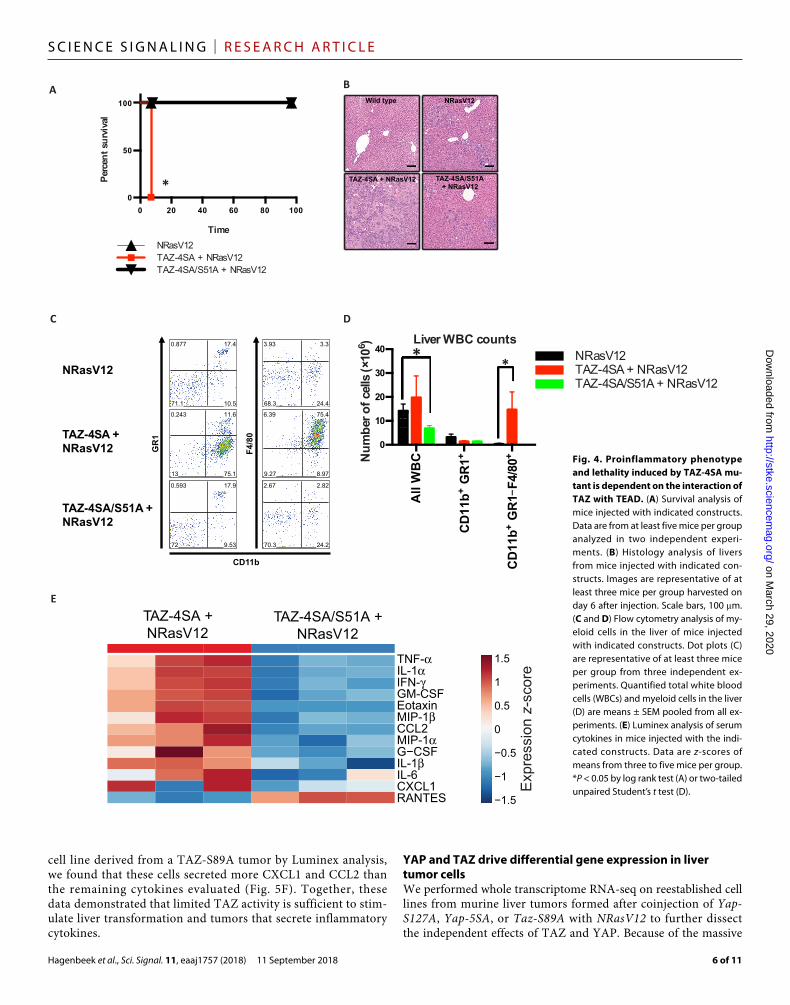
TAZ regulates liver inflammation through TEAD-dependent transcriptionYAP and TAZ function as coactivators through interaction with the TEAD family of transcription factors, and the TAZ S51A mutation abolishes the interaction of TAZ with TEAD (24). When we inhib-ited the TAZ and TEAD interaction by generating a second muta-tion at their interaction site (TAZ-4SA/S51A), we found that this mutation completely rescued the lethality induced by coinjection of
Taz-4SA and NRasV12 (Fig. 4A). Re-duced mortality was accompanied by re-duced inflammatory infiltration of the liver and grossly normal liver morphol-ogy (Fig. 4B). Similarly, the frequency and number of macrophages in the liver determined by flow cytometry analysis depended on the TAZ-TEAD interac-tion (Fig. 4, C and D). Mutation of TAZ S51A also reduced proinflammatory se-rum cytokines when compared to coin-jection of Taz-4SA and NRasV12 (Fig. 4E). Together, these data demonstrated that TAZ promoted inflammation in a TEAD- dependent manner (fig. S6).
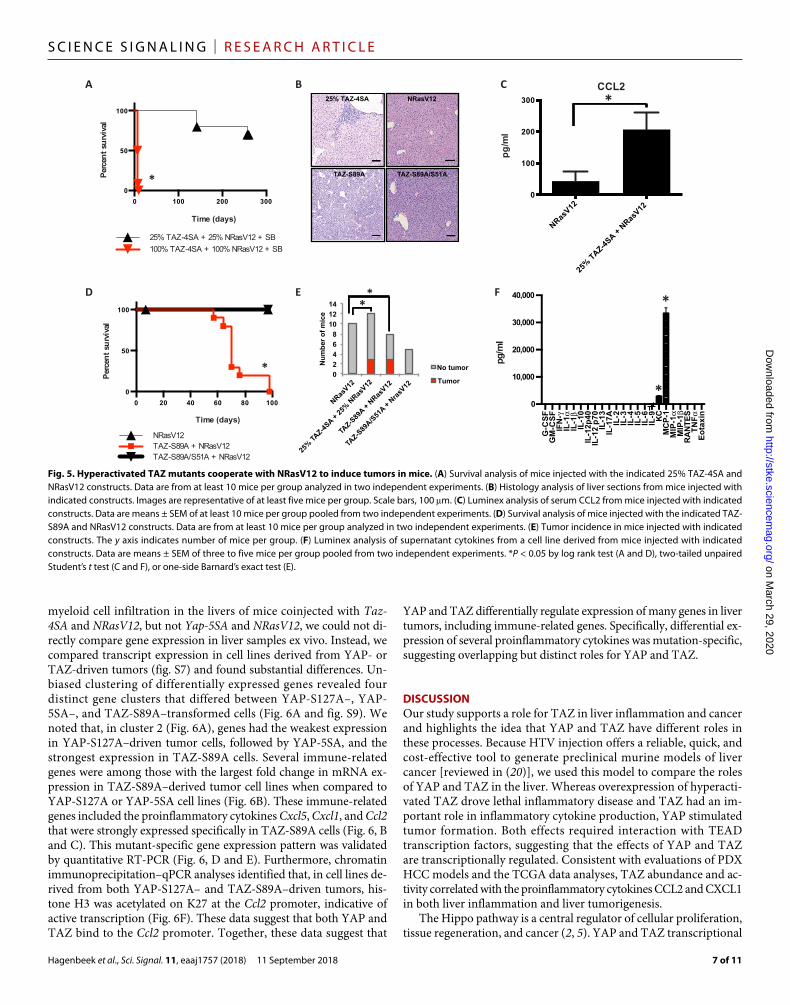
Reducing TAZ expression or activity stimulates TEAD-dependent tumorigenesisTo evaluate the dose-dependent effect of TAZ expression on liver tumorigenesis, we coinjected mice with a lower dose of Taz-4SA and NRasV12 DNA. When mice were injected with 25% of the Taz-4SA and NRasV12 DNA, we found that they survived significantly longer than mice that received a normal dose of Taz-4SA and NRasV12 (Fig. 5A). After injection with this dose of DNA, histo-logical analysis indicated that about 25% of mice developed tumors (Fig. 5, B and E). Tumors in these mice includ-ed one HCC and two anaplastic spindle cell tumors (fig. S8). Histological analy-sis found that these mice still exhibited multifocal inflammation and liver dys-plasia, which was consistent with the increased amount of CCL2 found in the serum when compared to control mice (Fig. 5C). These data indicated that, at lower doses that did not stimulate rapid mortality, activated TAZ promoted liver transformation.
We tested whether reduced TAZ activation would similarly stimulate tumor formation by evaluating a sec-ond TAZ construct with only a single phosphosite mutation. Abolishing the
LATS inhibitory phosphorylation site at serine 89 on TAZ in vi-tro activates TAZ (24, 25). Coexpression of NRasV12 with a con-stitutively active mutation at a single site in TAZ (TAZ-S89A, equivalent to YAP-S127A) reduced survival relative to wild-type mice or mice injected with NRasV12 alone and drove liver tu-morigenesis with nearly 37.5% penetrance (Fig. 5, D and E). Sim-ilar to YAP, inhibiting the interaction of TAZ with the TEAD transcription factors (TAZ S51A mutant) significantly improved survival and reduced tumor incidence with only a single mouse developing a small, discrete hepatocellular adenoma (Fig. 5, D and E). When we profiled the cytokines secreted by a tumor
data
Liver WBC counts
All
WB
C
CD
11b
+ G
R1+
CD
11b
+ G
R1- F
4/80
+
0
5
10
15
20
Nu
mb
er o
f cel
ls (×
106 )
NRasV12YAP-5SA + NRasV12YAP-5SA/S94A + NRasV12
Time (days)
Per
cen
t su
rviv
al
0 50 100 150
0
50
100
Time (days)
Per
cen
t su
rviv
al
0 50 100 150
0
50
100
NRasV12 YAP-S127A + NRasV12YAP-S127A/S94A + NRasV12
NRasV12YAP-S5A + NRasV12YAP-S5A/S94A + NRasV12
YAP-5SA + NRasV12
Wild type
YAP-5127A + NRasV12
NRasV12
0.642 15.2
11.572.6
3.41 3.24
23.170.3
0.515 20.8
9.6469
3 2.86
27.266.9
1R
G
08/4F
CD11b
0.877 17.4
10.571.1
3.93
24.468.3
NRasV12
YAP-5SA/S94A
*
NRasV12
Time (days)
Per
cent
sur
viva
l
0 50 100 1500
50
100
NRasV12TAZ-4SA + NRasV12 - FVB-NTAZ-4SA + NRasV12 - C57BL/6
TAZ-4SA + NRasV12Wild type
Wild type NRasV12 TAZ-4SA + NRasV12
YAP-5SA
0
2
4
6
8
10
12
Wild
type
NRasV12
YAP-S
127A
+ N
RasV12
YAP-5
SA + N
RasV12
Nu
mb
er o
f m
ice
No tumor
Tumor
Fig. 2. Expression of YAP, not TAZ, in mouse livers increases tumorigenesis. (A and B) Survival analysis of FBV-N mice injected with YAP-5SA and YAP-5SA/S94A constructs (A) or YAP-S127A and YAP-S127A/S94A constructs (B). Data are from at least five mice per group analyzed in two independent experiments. (C) Histology analysis of oval cell hyperplasia in liver sections from mice injected with the indicated constructs. Images are representative of five mice per group. Scale bars, 100 m. (D) Tumor incidence in mice injected with indicated constructs. The y axis indi-cates number of mice per group. (E and F) Flow cytometry analysis of myeloid cells from the liver of mice injected with the indicated constructs. Dot plots (E) are representative of at least three mice per group. Quantified total white blood cells (WBCs) and myeloid cells in the liver (F) are means ± SEM pooled from all experiments. (G) Survival analy-sis of FVB-N and C57BL/6 mice injected with TAZ-4SA constructs. Data are from at least three mice per group ana-lyzed in three independent experiments. (H and I) Histology analysis (H) and immunohistochemistry analysis of TAZ abundance (I) in liver sections from mice injected with the indicated constructs. Images are representative of at least three mice per group harvested on day 6 after injection. Scale bars, 100 m. *P < 0.05 by log rank test (A, B, and G) or by one-sided Barnard’s exact test (D).
on March 29, 2020
http://stke.sciencemag.org/
Dow
nloaded from

Hagenbeek et al., Sci. Signal. 11, eaaj1757 (2018) 11 September 2018
S C I E N C E S I G N A L I N G | R E S E A R C H A R T I C L E
5 of 11
Liver WBC counts
All
WB
C
CD
11b
+ G
R1+
CD
11b
+ G
R1- F
4/80
+
0
10
20
30
40
50
Nu
mb
er o
f cel
ls (×
106 ) Wild type
NRasV12TAZ-4SATAZ-4SA + NRasV12
Exp
ress
ion z-s
core
RANTESCXCL1CCL2MIP-1βMIP-1αIL-1αIL-6G-CSFEotaxinGM-CSFIL-1βTNF-αIFN-γ
Wild type NRasV12 TAZ-4SATAZ-4SA +NRasV12
−2
−1
0
1
2
AHRRPL19TGFBBCL2SRXN1HPRTS100A8STAT3SLC7A11XBP1CD80PGDGSRATF4CCL2IL10TNFEIF2AITGAMIL6NFKBIZCXCL1CXCL2CXCL3WARSARG1CHIL3NFIL3MMP9TNFSF9CD300AIL18CD68PRDX1SOCS1CHIL1RN18SNFKB1MRC1IRF4RETNALCD86B2MSTAT1CXCL9NQO1ITGAXPDCD1LGCCL22CSF1RIL15GSTM1CCL8CASP9CCL5CYP2F2
TAZ-4SA + NRasV12NRasV12
Exp
ress
ion z-s
core
−2
−1
0
1
2
Time (days)
Per
cent
sur
viva
l
0 50 100 1500
50
100
Wild type NRasV12TAZ-4SATAZ-4SA + NRasV12
TAZ-4SA
TAZ- 4SA + NRasV12 NRasV12
Wild type
Cytokeratin AE1/AE3 F4/80
Wild type Wild type
TAZ-4SA + NRasV12 T AZ-4SA + NRasV12
TAZ-4SA + NRasV12
TAZ-4SA
NRasV12
Wild type
0.172 3.61
4.6491.6
3.27 1.38
5.190.3
0.172 3.61
4.6491.6
7.31 1.87
6.3584.5
0.303 12.8
61.825.1
7.5 56
1323.5
0.504 11.8
65.422.2
8.83 63.8
6.3621
CD11b
GR
1
F4/
80
Fig. 3. Hyperactivated TAZ-4SA mutant cooperates with NRasV12 to induce lethality in mice. (A) Survival analysis of mice injected with the indicated TAZ and NRasV12 constructs. Data are from at least four mice per group analyzed in three independent experiments. (B and C) Histology analysis (B) and immunohistochemistry analysis of cyto-keratin AE1/AE3 and F4/80 (C) in liver sections from mice injected with indicated constructs. Scale bars, 100 m. Histology images are representative of at least three mice per group harvested on day 6 after injection. (D and E) Flow cytometry analysis of myeloid cells in the liver of mice injected with the indicated constructs. Dot plots (D) are represen-tative of at least three mice per group from three independent experiments. Quantified total white blood cells (WBCs) and myeloid cells in the liver (E) are means ± SEM pooled from all experiments. (F) Luminex analysis of serum cytokines in mice injected with the indicated constructs. Data are z-scores of means from three to five mice per group, repre-sentative of three independent experiments. IFN-, interferon-; TNF-, tumor necrosis factor–; GM-CSF, granulocyte macrophage colony stimulating factor; G-CSF, granulocyte colony stimulating factor; MIP-1, macrophage inflammatory protein–1; RANTES, regulated on activation normal T cell expressed and secreted. (G) Fluidigm reverse transcrip-tion polymerase chain reaction (RT-PCR) analysis of sorted macrophages from the livers of mice injected with indicated constructs. Data are z-scores of means from three to five mice per group. Rows have been hierarchically clustered using Pearson correlation as a distance metric. *P < 0.05 by log rank test (A) or two-tailed unpaired Student’s t test (E).
on March 29, 2020
http://stke.sciencemag.org/
Dow
nloaded from
Hagenbeek et al., Sci. Signal. 11, eaaj1757 (2018) 11 September 2018
S C I E N C E S I G N A L I N G | R E S E A R C H A R T I C L E
6 of 11
cell line derived from a TAZ-S89A tumor by Luminex analysis, we found that these cells secreted more CXCL1 and CCL2 than the remaining cytokines evaluated (Fig. 5F). Together, these data demonstrated that limited TAZ activity is sufficient to stim-ulate liver transformation and tumors that secrete inflammatory cytokines.
YAP and TAZ drive differential gene expression in liver tumor cellsWe performed whole transcriptome RNA-seq on reestablished cell lines from murine liver tumors formed after coinjection of Yap-S127A, Yap-5SA, or Taz-S89A with NRasV12 to further dissect the independent effects of TAZ and YAP. Because of the massive
0 20 40 60 80 100
0
50
100P
erce
nt
surv
ival
Time
NRasV12TAZ-4SA + NRasV12TAZ-4SA/S51A + NRasV12
Exp
ress
ion z-s
core
RANTESCXCL1
CCL2
TAZ-4SA +NRasV12
TAZ-4SA/S51A +NRasV12
1
Wild type NRasV12
TAZ-4SA + NRasV12 TAZ-4SA/S51A + NRasV12
13
CD11b
F4/
80
TAZ-4SA/S51A + NRasV12
TAZ-4SA + NRasV12
NRasV12
GR
1
Liver WBC counts
All
WB
C
CD
11b
+ G
R1+
CD
11b
+ G
R1–
F4/
80+
0
10
20
30
40
Nu
mb
er o
f cel
ls (×
106 )
NRasV12TAZ-4SA + NRasV12TAZ-4SA/S51A + NRasV12
TNF-αIL-1αIFN-γGM-CSF
MIP-1β
MIP-1α
IL-1βIL-6
Fig. 4. Proinflammatory phenotype and lethality induced by TAZ-4SA mu-tant is dependent on the interaction of TAZ with TEAD. (A) Survival analysis of mice injected with indicated constructs. Data are from at least five mice per group analyzed in two independent experi-ments. (B) Histology analysis of livers from mice injected with indicated con-structs. Images are representative of at least three mice per group harvested on day 6 after injection. Scale bars, 100 m. (C and D) Flow cytometry analysis of my-eloid cells in the liver of mice injected with indicated constructs. Dot plots (C) are representative of at least three mice per group from three independent ex-periments. Quantified total white blood cells (WBCs) and myeloid cells in the liver (D) are means ± SEM pooled from all ex-periments. (E) Luminex analysis of serum cytokines in mice injected with the indi-cated constructs. Data are z-scores of means from three to five mice per group. *P < 0.05 by log rank test (A) or two-tailed unpaired Student’s t test (D).
on March 29, 2020
http://stke.sciencemag.org/
Dow
nloaded from
Hagenbeek et al., Sci. Signal. 11, eaaj1757 (2018) 11 September 2018
S C I E N C E S I G N A L I N G | R E S E A R C H A R T I C L E
7 of 11
myeloid cell infiltration in the livers of mice coinjected with Taz-4SA and NRasV12, but not Yap-5SA and NRasV12, we could not di-rectly compare gene expression in liver samples ex vivo. Instead, we compared transcript expression in cell lines derived from YAP- or TAZ-driven tumors (fig. S7) and found substantial differences. Un-biased clustering of differentially expressed genes revealed four distinct gene clusters that differed between YAP-S127A–, YAP-5SA–, and TAZ-S89A–transformed cells (Fig. 6A and fig. S9). We noted that, in cluster 2 (Fig. 6A), genes had the weakest expression in YAP-S127A–driven tumor cells, followed by YAP-5SA, and the strongest expression in TAZ-S89A cells. Several immune-related genes were among those with the largest fold change in mRNA ex-pression in TAZ-S89A–derived tumor cell lines when compared to YAP-S127A or YAP-5SA cell lines (Fig. 6B). These immune-related genes included the proinflammatory cytokines Cxcl5, Cxcl1, and Ccl2 that were strongly expressed specifically in TAZ-S89A cells (Fig. 6, B and C). This mutant-specific gene expression pattern was validated by quantitative RT-PCR (Fig. 6, D and E). Furthermore, chromatin immunoprecipitation–qPCR analyses identified that, in cell lines de-rived from both YAP-S127A– and TAZ-S89A–driven tumors, his-tone H3 was acetylated on K27 at the Ccl2 promoter, indicative of active transcription (Fig. 6F). These data suggest that both YAP and TAZ bind to the Ccl2 promoter. Together, these data suggest that
YAP and TAZ differentially regulate expression of many genes in liver tumors, including immune-related genes. Specifically, differential ex-pression of several proinflammatory cytokines was mutation-specific, suggesting overlapping but distinct roles for YAP and TAZ.
DISCUSSIONOur study supports a role for TAZ in liver inflammation and cancer and highlights the idea that YAP and TAZ have different roles in these processes. Because HTV injection offers a reliable, quick, and cost-effective tool to generate preclinical murine models of liver cancer [reviewed in (20)], we used this model to compare the roles of YAP and TAZ in the liver. Whereas overexpression of hyperacti-vated TAZ drove lethal inflammatory disease and TAZ had an im-portant role in inflammatory cytokine production, YAP stimulated tumor formation. Both effects required interaction with TEAD transcription factors, suggesting that the effects of YAP and TAZ are transcriptionally regulated. Consistent with evaluations of PDX HCC models and the TCGA data analyses, TAZ abundance and ac-tivity correlated with the proinflammatory cytokines CCL2 and CXCL1 in both liver inflammation and liver tumorigenesis.
The Hippo pathway is a central regulator of cellular proliferation, tissue regeneration, and cancer (2, 5). YAP and TAZ transcriptional
G-C
SF
GM
-CS
FIF
N-γ
IL-1
αIL
-1β
IL-1
0IL
-12p
40IL
-12
p70
IL-1
3IL
-17A IL-2
IL-3
IL-4
IL-5
IL-6
IL-9 KC
MC
P-1
MIP
-1α
MIP
-1β
RA
NTE
ST
NF
αE
ota
xin
0
10,000
20,000
30,000
40,000
pg/m
l
25% TAZ-4SA + 25% NRasV12 + SB100% TAZ-4SA + 100% NRasV12 + SB
Time (days)
Per
cen
t su
rviv
al
0 100 200 300
0
50
100
Gra
d
0 20 40 60 80 100
0
50
100
Per
cen
t su
rviv
al
Tim e (days)
NRasV12TAZ-S89A + NRasV12TAZ-S89A/S51A + NRasV12
CCL2
pg
/ml
NRasV12
25%
TAZ-4
SA + N
RasV12
0
100
200
300
TAZ-S89A
NRasV12
TAZ-S89A/S51A
25% TAZ-4SA
0 2 4 6 8
10 12 14
NRasV12
25%
TAZ-4
SA + 25
% N
RasV12
TAZ-S
89A +
NRas
V12
TAZ-S
89A/S
51A +
Nra
sV12
Nu
mb
er o
f m
ice
No tumor
Tumor
Fig. 5. Hyperactivated TAZ mutants cooperate with NRasV12 to induce tumors in mice. (A) Survival analysis of mice injected with the indicated 25% TAZ-4SA and NRasV12 constructs. Data are from at least 10 mice per group analyzed in two independent experiments. (B) Histology analysis of liver sections from mice injected with indicated constructs. Images are representative of at least five mice per group. Scale bars, 100 m. (C) Luminex analysis of serum CCL2 from mice injected with indicated constructs. Data are means ± SEM of at least 10 mice per group pooled from two independent experiments. (D) Survival analysis of mice injected with the indicated TAZ-S89A and NRasV12 constructs. Data are from at least 10 mice per group analyzed in two independent experiments. (E) Tumor incidence in mice injected with indicated constructs. The y axis indicates number of mice per group. (F) Luminex analysis of supernatant cytokines from a cell line derived from mice injected with indicated constructs. Data are means ± SEM of three to five mice per group pooled from two independent experiments. *P < 0.05 by log rank test (A and D), two-tailed unpaired Student’s t test (C and F), or one-side Barnard’s exact test (E).
on March 29, 2020
http://stke.sciencemag.org/
Dow
nloaded from

Hagenbeek et al., Sci. Signal. 11, eaaj1757 (2018) 11 September 2018
S C I E N C E S I G N A L I N G | R E S E A R C H A R T I C L E
8 of 11
coactivators are the key effectors of this pathway, and both proteins are overexpressed in a wide spectrum of cancers. YAP is amplified in hepatocellular cancers, and overexpression of YAP in the liver or loss of upstream tumor suppressor kinases increases liver tumori-genesis (26). Loss of upstream tumor suppressor kinases MST1/2 and SAV1 also increases proinflammatory IL-6 and tumor necrosis factor– cytokine expression in liver-specific conditional knockout mice (26). These data imply that activation of the Hippo pathway restricts the production of inflammatory cytokines that are in-creased in response to liver inflammation and contribute to hepatic carcinogenesis (27). Deletion of upstream tumor suppressors also promotes the nuclear localization of both YAP and TAZ.
YAP may activate the growth of hepatocytes through a two-signal system that requires liver inflammation or injury (28), though the
underlying mechanism remains unknown. What role TAZ may have in any of these contexts and the differential roles of YAP and TAZ in inflammation and tumorigenesis are largely unexplored. Here, we found that TAZ promotes inflammatory cytokine production and tissue macrophage infiltration. Given the links between inflam-mation and cancer development (29), it is tempting to speculate that TAZ induces inflammation that may promote the oncogenic function of YAP in the liver. This may provide therapeutic opportu-nities for intervention by targeting both key Hippo signaling and inflammatory pathways in liver cancer. This study highlights the idea that YAP and TAZ have distinct roles in liver tumor development.
Whereas some of the signaling inputs of the Hippo pathway are known, the physiological regulation of the pathway in response to stimuli and cross-talk with other signaling modules are long-standing
2.03.04.05.06.07.0
Cxcl5
Yap
S12
7A
Yap
5SA
Taz
S89
A
6.57.07.58.08.59.0
Ccl2
3.04.05.06.07.0
Cxcl1mR
NA
(nor
mal
ized
)
P < 10–8
P < 10–5
P < 10–8
–2.00
–1.00
0
1.00
2.00
Cluster 1
Cluster 2
Cluster 3
Cluster 4
Yap
S127
AYap
S127
AYap
S127
AYap
5SA
Yap
5SA
Yap
5SA
Taz
S89A
Taz
S89A
Taz
S89A
Taz
S89A
Taz
S89A
Gene expression(z-scores)
Orm1
Cxcl5
Psca
Ugt2b34
Leprel1
Ndrg1
Them6
Ly6a
Cxcl1
Slfn2
Efna1
Ccl9
Tgm2
Cdkn2b
Khdrbs3
Rrad
Pdk4
Ptprk
Ets2
Tnfsf13
Bst1
Gca
Cotl1
Mia2
Col18a1
Rbp2
St3gal5
1110008P14Rik
Pla2g7
Pdgfc
Pdgfb
1190002N15Rik
Gcat
Card10
Tfrc
Galk2
Abca2
Spaca7
Jund
Ccl2
Log 2
fold
cha
nge
0
2
4
6
8Taz-S89A vs Yap-S127ATaz-S89A vs Yap-S127A/ Yap-5SA
IgG
Myc ta
Histone H
H3K27AYAP-S12
7A
TAZ-S89
A
YAP-5SA
25%
TAZ-4
SA
0
1
2
3
4
5
Rel
ativ
e ex
pres
sion
CXCL5
CXCL1
YAP-S
127A
TAZ-S
89A
YAP-5
SA
25%
TAZ-4
SA0
100
200
3004000
5000
6000
7000
8000
Rel
ativ
e ex
pre
ssio
n
Fig. 6. Differential gene expression profile of YAP- and TAZ-driven liver tumors. (A to C) RNA-seq analysis of gene expression in cell lines derived from YAP-S127A, YAP-5SA, and TAZ-S89A mouse liver tumors. Z-score values (A) are from at least three tumors derived from unique mice per group. Fold change in the top 40 most differ-entially altered genes (B) and normalized expression levels of Cxcl5, Cxcl1, and Ccl2 (C) were determined by DESeq2 analysis. (D and E) qRT-PCR analysis of Cxcl1 (D) and CXCL5 (E) mRNA expression in the indicated cell lines. Data are means ± SEM from three independent experiments. (F) ChIP-qPCR analysis of H3K27ac and total histone H3 in lysates from YAP-S127 and TAZ-S89A tumor-derived cell lines. All YAP and TAZ constructs injected using HTV have a dual Flag and Myc tag. Data are means ± SEM pooled from three independent experiments. *P < 0.05 by two-tailed unpaired Student’s t test (D to F). IgG, immunoglobulin G.
on March 29, 2020
http://stke.sciencemag.org/
Dow
nloaded from

Hagenbeek et al., Sci. Signal. 11, eaaj1757 (2018) 11 September 2018
S C I E N C E S I G N A L I N G | R E S E A R C H A R T I C L E
9 of 11
questions of interest in the field (30, 31). The presence of Gram-positive bacteria is a unique signal that activates the Hippo pathway in flies through the Toll-Myd88-Pelle cascade (6). However, whether this function is conserved in mammals remains unknown. Because flies only encode the gene Yki, we speculate that the functions of the mammalian orthologs may have separable functions. Whereas both YAP and TAZ promoted liver tumors, TAZ played a more promi-nent role in secretion of proinflammatory cytokines and driving inflammation-induced tumors. TAZ is also required for the differen-tiation of T helper 17 cells (32). In prostate cancer, YAP stimulates expression of the chemokine CXCL5, which recruits myeloid- derived suppressor cells to promote tumor growth (33). YAP acti-vation also underlies macrophage recruitment by tumor-initiating cells (23). Although these studies do not compare the role of TAZ in their specific model systems, collectively, all our data suggest that YAP and TAZ are not completely redundant. It is possible that there are overlapping yet distinct roles of YAP and TAZ in a context- and tissue-dependent manner. Although YAP could play a more important role in tumor initiation, YAP and TAZ could promote inflammation and stimulate transcription of distinct target genes depending on their expression in specific cell types. Future studies will address whether this is broadly applicable in other cancers and provide additional targets for therapeutic intervention.
MATERIALS AND METHODSGene expression profiling—PDX and TCGALiver cancer PDX RNA-seq data were obtained from OncoWuXi (https://onco.wuxiapptec.com). RNA-seq alignment was performed using the RNA STAR software (v2.4.0j). For Homo sapiens samples, hg19 genome build with gencode v19 gene annotation was used. Raw read numbers of each gencode gene were counted using feature Counts (v1.4.6). Fragments per Kilobase Million values are calculated with R package edgeR (v3.8.5). For TCGA data, raw RNA-seq data were downloaded from TCGA (n = 7304) and aligned to the human refer-ence genome (GRCh37/hg19) using GSNAP version 2013-10-10, allow-ing a maximum of two mismatches (parameters: “-M 2 -n 10 -B 2 -i 1 -N 1 -w 200000 -E 1 --pairmax-rna=200000”). Gene expression levels used are regularized log-transformed data determined by the DESeq2 package for the R programming language. All correlations calculated for RNA-seq data are Pearson’s correlation. Statistical significance be-tween correlation values was determined by nonpaired two-sided t test. For Fig. 1D, all correlations calculated for RNA-seq data were performed in R using the cor function (with the method being either Pearson or Spearman as annotated in axes). Cell line cytokine, Yap, and Taz RNA expression values were obtained from a previously published study (34).
AnimalsFVB-N (Charles River) or C57BL/6 mice were subjected to HTV in-jection with SB transposase and relevant TAZ mutant encoding plas-mids, as previously described (21). For myeloid depletion studies, mice were injected with clodronate or control liposomes as per the manu-facturer’s instructions (Encapsula NanoSciences). For irradiation stud-ies, mice were given one round of 10-Gy irradiation. The Genentech Institutional Animal Care and Use Committee approved all protocols.
Cytokine profilingSerum was separated from blood that was harvested by orbital bleed or terminal heart bleed using BD microtainer tubes with serum sep-
arator additive (Becton Dickinson). Samples were diluted 1:4 in sample diluent (Bio-Rad) and were used for Bio-Plex Pro Mouse Assay (Bio-Rad) with sample dilutions of 1:4 and 1:20 according to the manufacturer’s instructions. Heatmap visualizations were row- normalized by z-scoring.
Liver processingAll the lobes of the liver were collected in ice-cold sterile phosphate- buffered saline (PBS) after perfusion. Briefly, the lobes were minced with a blade and were incubated in digestion medium [RPMI 1640 medium containing deoxyribonuclease I (DNase I; 0.1 mg/ml; Invitrogen), collagenase P (0.4 mg/ml; Roche), and dispase (0.8 mg/ml; Roche) in a 37°C water bath], and cell fractions were collected every 10 to 15 min over a period of 45 min. The single-cell suspensions were fil-tered and ACK (ammonium-chloride-potassium)–lysed for a period of 5 min at room temperature, followed by neutralization with PBS. The cells were further stained for antibodies for flow cytometry/sorting.
Fluidigm gene expression analysisRNA (100 ng) was subjected to complementary DNA (cDNA) syn-thesis reaction using the Applied Biosystems High Capacity cDNA Reverse Transcription Kit (Thermo Fisher Scientific), as per the manu-facturer’s protocol. Preamplification reaction was then performed with Taqman PreAmp Master Mix (Thermo Fisher Scientific). After am-plification, samples were diluted 1:4 with tris-EDTA, and qPCR was conducted on Fluidigm 96.96 Dynamic Arrays using the BioMark HD system according to the manufacturer’s instruction. Fluidigm data were analyzed with RealTime StatMiner for qPCR in SpotFire program. Heatmap visualizations were row-normalized by z-scoring.
Flow cytometry and antibodiesAfter mechanical homogenization or enzymatic digestion of liver, cells were resuspended in flow cytometry buffer (PBS containing 2% fetal bovine serum and 2 mM EDTA) and incubated for 30 min with the following dyes and antibodies: CD11b (M1/70; BD Pharmingen), GR1 (RB6-8C5; BD Pharmingen), LY6C (HK1.4; BioLegend), CD45 (30-F11; BioLegend), Ly6g (IA8; eBioscience), F4/80 (BM8; BioLegend), CD11C (N418; eBioscience), propidium iodide nucleic acid stain (Molecular Probes), and Viability Dye (53-6.7; BioLegend). The stained cells were acquired on a FACSCalibur, LSRII, or FACSAria (BD Biosciences) and analyzed using FlowJo software (Tree Star Inc.). The F4/80+ cells were sorted using FACSAria (BD Biosciences), and the cells were collected in RNA protect buffer (Qiagen) for downstream RNA purification and Fluidigm analysis.
Western blottingWhole cell lysates were prepared in NP-40 buffer [1% NP-40, 120 mM NaCl, 50 mM tris (pH 7.4), 1 mM EDTA (pH 7.4), 20 mM N-ethylmaleimide, and protease and phosphatase inhibitors (Roche)]. All antibodies used were from Cell Signaling Technology.
Real-time RT-PCRCells were lysed, and RNA was isolated using the RNeasy Plus Mini Kit (Qiagen), according to the manufacturer’s protocol. Upon cDNA pro-duction using the iScript cDNA Synthesis Kit (Bio-Rad), samples were analyzed by real-time PCR using a QuantStudio 7 Flex machine (Applied Biosystems). All probes used were either purchased from Applied Bio-systems [including Ccl2 (Mm00441242_m1), Cxcl1 (Mm04207460_m1), Ccl5 (Mm01302427_m1), and Cxcl10 (Mm00445235_m1)] or
on March 29, 2020
http://stke.sciencemag.org/
Dow
nloaded from

Hagenbeek et al., Sci. Signal. 11, eaaj1757 (2018) 11 September 2018
S C I E N C E S I G N A L I N G | R E S E A R C H A R T I C L E
10 of 11
custom- designed [including Cxcl1, AAA AGG TGT CCC CAA GTA (forward) and AAG CAG AAC TGA ACT ACC ATC G (reverse); and -actin, GGA ATC GTG CGT GAC ATC AAA G (forward) and TGT AGT TTC ATG GAT GCC ACA G (reverse)].
HistologyHistologic evaluations were performed on about 4-m-thick formalin- fixed, paraffin-embedded tissue sections routinely stained with hematoxylin and eosin. Immunohistochemistry was also performed on 4-m-thick formalin-fixed, paraffin-embedded tissue sections using primary antibodies against CD68 (Abcam; rabbit polyclonal, 0.25 g/ml), cytokeratin AE1/AE3 (Dako; mouse monoclonal, 5 g/ml), F4/80 (AbD Serotec; rat monoclonal, clone Cl:A3-1, 10 g/ml), and VWF (Dako; rabbit polyclonal, 3.875 g/ml). CD68 immuno-histochemistry was performed on the Ventana Discovery XT plat-form using CC1 standard antigen retrieval and the Rabbit OmniMap detection system (Ventana) with 3,3′-diaminobenzidine (DAB) chro-mogen and hematoxylin counterstain. TARGET antigen retrieval (Dako) and the ABC- Peroxidase Elite detection Kit (Vector Labora-tories) with DAB chromogen and hematoxylin counterstain were used for both F4/80 and VWF. Proteinase K antigen retrieval was used for AE1/AE3, and immunolabeling was detected with the Dako ARK detection kit with DAB chromogen and hematoxylin counter-stain. Naïve, isotype control antibodies were used in place of primary antibodies as a negative control.
RNA library preparation and sequencingRNA-seq was performed to identify genes that are differentially ex-pressed between the YAP and TAZ mutants and to understand their contribution toward liver cancer. Total RNA was extracted using the Qiagen RNeasy kit as per the manufacturer’s protocol in-cluding the on-column DNase digestion. Quality control of samples was done to determine RNA quantity and quality before their pro-cessing by RNA-seq. The concentration of total RNA samples was determined using NanoDrop 8000 (Thermo Fisher Scientific). The integrity of RNA samples was determined using 2100 Bioanalyzer (Agilent Technologies). About 500 ng of total RNA was used as an input for library preparation using the TruSeq RNA Sample Prepa-ration Kit v2 (Illumina). Size of the libraries was confirmed using 2200 TapeStation and High Sensitivity D1K screen tape (Agilent Technologies), and their concentration was determined by a qPCR- based method using the Library Quantification Kit (KAPA). The librar-ies were multiplexed and then sequenced on Illumina HiSeq2500 (Illumina) to generate 30M of single-end 50–base pair reads.
RNA-seq alignment and feature countingRNA-seq reads were first aligned to ribosomal RNA sequences to remove ribosomal reads. The remaining reads were aligned to the mouse reference genome (GRCm38) using GSNAP (35, 36) version “2013-10-10,” allowing a maximum of two mismatches per 75 base sequence (parameters: ‘-M 2 -n 10 -B 2 -i 1 -N 1 -w 200000 -E 1 --pairmax-rna=200000 --clip-overlap). Transcript annotation was based on the Ensembl genes database (release 77). To quantify gene expression levels, the number of reads mapped to the exons of each RefSeq gene was calculated.
RNA-seq differential gene expressionDifferential gene expression was performed with DESeq2 (37). A prefilter was applied: Only genes with at least a median RPKM
(reads per kilobase per million mapped reads) value of 10 in one condition were analyzed. P values for other genes were simply set to 1 and log fold changes were set to 0 for visualization purposes, but such genes were not included in the multiple testing correction. Q values were obtained by correcting P values for multiple hypotheses using the Benjamini-Hochberg procedure. Genes were considered if they had a Q value of less than 0.05 and were protein-coding. Counts were transformed to log2 counts per million, quantile-normalized, and precision-weighted with the “voom” function of the limma package (38). Genes statistically significantly up-regulated in TAZ-S89A were determined by genes that were statistically significantly up-regulated in TAZ-S89A when compared against YAP-S127A as well as when combining YAP-S127A and YAP-5SA samples. Four clusters were determined by manual inspection. Fuzzy c-means clus-tering was performed using R package e1071 v.1.6.8.
SUPPLEMENTARY MATERIALSwww.sciencesignaling.org/cgi/content/full/11/547/eaaj1757/DC1Fig. S1. HTV injection of TAZ-4SA + NRasV12 constructs increased liver weights in mice.Fig. S2. HTV injection of TAZ constructs increases TAZ abundance in the liver.Fig. S3. TAZ alters expression of CD68 and not VWF in mouse liver tissue.Fig. S4. Mice injected with TAZ-4SA and NRasV12 had inflammatory cell infiltrates in multiple tissues.Fig. S5. Myeloid depletion does not rescue lethality induced by injection with TAZ-4SA + NRasV12.Fig. S6. Phenotypic characterization indicates that TAZ regulates liver inflammation in a TEAD-dependent manner.Fig. S7. Characterization of liver tumor–derived cell lines from mice injected with expression constructs.Fig. S8. Mice injected with 25% TAZ-4SA + NRasV12 constructs developed tumors.Fig. S9. YAP and TAZ drive differential gene expression in liver tumor cells.
REFERENCES AND NOTES 1. P. Fitzmorris, M. Shoreibah, B. S. Anand, A. K. Singal, Management of hepatocellular
carcinoma. J. Cancer Res. Clin. Oncol. 141, 861–876 (2015). 2. R. Johnson, G. Halder, The two faces of Hippo: Targeting the Hippo pathway for
regenerative medicine and cancer treatment. Nat. Rev. Drug Discov. 13, 63–79 (2014). 3. D. Pan, The Hippo signaling pathway in development and cancer. Dev. Cell 19, 491–505 (2010). 4. A. A. Steinhardt, M. F. Gayyed, A. P. Klein, J. Dong, A. Maitra, D. Pan, E. A. Montgomery,
R. A. Anders, Expression of Yes-associated protein in common solid tumors. Hum. Pathol. 39, 1582–1589 (2008).
5. K. F. Harvey, X. Zhang, D. M. Thomas, The Hippo pathway and human cancer. Nat. Rev. Cancer 13, 246–257 (2013).
6. B. Liu, Y. Zheng, F. Yin, J. Yu, N. Silverman, D. Pan, Toll receptor-mediated Hippo signaling controls innate immunity in Drosophila. Cell 164, 406–419 (2016).
7. X. Varelas, B. W. Miller, R. Sopko, S. Song, A. Gregorieff, F. A. Fellouse, R. Sakuma, T. Pawson, W. Hunziker, H. McNeill, J. L. Wrana, L. Attisano, The Hippo pathway regulates Wnt/-catenin signaling. Dev. Cell 18, 579–591 (2010).
8. X. Varelas, P. Samavarchi-Tehrani, M. Narimatsu, A. Weiss, K. Cockburn, B. G. Larsen, J. Rossant, J. L. Wrana, The Crumbs complex couples cell density sensing to Hippo-dependent control of the TGF--SMAD pathway. Dev. Cell 19, 831–844 (2010).
9. L. Azzolin, T. Panciera, S. Soligo, E. Enzo, S. Bicciato, S. Dupont, S. Bresolin, C. Frasson, G. Basso, V. Guzzardo, A. Fassina, M. Cordenonsi, S. Piccolo, YAP/TAZ incorporation in the -catenin destruction complex orchestrates the Wnt response. Cell 158, 157–170 (2014).
10. L. Azzolin, F. Zanconato, S. Bresolin, M. Forcato, G. Basso, S. Bicciato, M. Cordenonsi, S. Piccolo, Role of TAZ as mediator of Wnt signaling. Cell 151, 1443–1456 (2012).
11. D. F. Tschaharganeh, X. Chen, P. Latzko, M. Malz, M. M. Gaida, K. Felix, S. Ladu, S. Singer, F. Pinna, N. Gretz, C. Sticht, M. L. Tomasi, S. Delogu, M. Evert, B. Fan, S. Ribback, L. Jiang, S. Brozzetti, F. Bergmann, F. Dombrowski, P. Schirmacher, D. F. Calvisi, K. Breuhahn, Yes-associated protein up-regulates Jagged-1 and activates the NOTCH pathway in human hepatocellular carcinoma. Gastroenterology 144, 1530–1542.e12 (2013).
12. E. M. Morin-Kensicki, B. N. Boone, M. Howell, J. R. Stonebraker, J. Teed, J. G. Alb, T. R. Magnuson, W. O’Neal, S. L. Milgram, Defects in yolk sac vasculogenesis, chorioallantoic fusion, and embryonic axis elongation in mice with targeted disruption of Yap65. Mol. Cell. Biol. 26, 77–87 (2006).
on March 29, 2020
http://stke.sciencemag.org/
Dow
nloaded from

Hagenbeek et al., Sci. Signal. 11, eaaj1757 (2018) 11 September 2018
S C I E N C E S I G N A L I N G | R E S E A R C H A R T I C L E
11 of 11
13. R. Makita, Y. Uchijima, K. Nishiyama, T. Amano, Q. Chen, T. Takeuchi, A. Mitani, T. Nagase, Y. Yatomi, H. Aburatani, O. Nakagawa, E. V. Small, P. Cobo-Stark, P. Igarashi, M. Murakami, J. Tominaga, T. Sato, T. Asano, Y. Kurihara, H. Kurihara, Multiple renal cysts, urinary concentration defects, and pulmonary emphysematous changes in mice lacking TAZ. Am. J. Physiol. Renal Physiol. 294, F542–F553 (2008).
14. Z. Hossain, S. M. Ali, H. L. Ko, J. Xu, C. P. Ng, K. Guo, Z. Qi, S. Ponniah, W. Hong, W. Hunziker, Glomerulocystic kidney disease in mice with a targeted inactivation of Wwtr1. Proc. Natl. Acad. Sci. U.S.A. 104, 1631–1636 (2007).
15. M. Overholtzer, J. Zhang, G. A. Smolen, B. Muir, W. Li, D. C. Sgroi, C.-X. Deng, J. S. Brugge, D. A. Haber, Transforming properties of YAP, a candidate oncogene on the chromosome 11q22 amplicon. Proc. Natl. Acad. Sci. U.S.A. 103, 12405–12410 (2006).
16. J. Dong, G. Feldmann, J. Huang, S. Wu, N. Zhang, S. A. Comerford, M. F. Gayyed, R. A. Anders, A. Maitra, D. Pan, Elucidation of a universal size-control mechanism in Drosophila and mammals. Cell 130, 1120–1133 (2007).
17. L. Zender, M. S. Spector, W. Xue, P. Flemming, C. Cordon-Cardo, J. Silke, S.-T. Fan, J. M. Luk, M. Wigler, G. J. Hannon, D. Mu, R. Lucito, S. Powers, S. W. Lowe, Identification and validation of oncogenes in liver cancer using an integrative oncogenomic approach. Cell 125, 1253–1267 (2006).
18. H. B. El-Serag, K. L. Rudolph, Hepatocellular carcinoma: Epidemiology and molecular carcinogenesis. Gastroenterology 132, 2557–2576 (2007).
19. D. Yimlamai, B. H. Fowl, F. D. Camargo, Emerging evidence on the role of the Hippo/YAP pathway in liver physiology and cancer. J. Hepatol. 63, 1491–1501 (2015).
20. X. Chen, D. F. Calvisi, Hydrodynamic transfection for generation of novel mouse models for liver cancer research. Am. J. Pathol. 184, 912–923 (2014).
21. C. Ho, C. Wang, S. Mattu, G. Destefanis, S. Ladu, S. Delogu, J. Armbruster, L. Fan, S. A. Lee, L. Jiang, F. Dombrowski, M. Evert, X. Chen, D. F. Calvisi, AKT (v-akt murine thymoma viral oncogene homolog 1) and N-Ras (neuroblastoma ras viral oncogene homolog) coactivation in the mouse liver promotes rapid carcinogenesis by way of mTOR (mammalian target of rapamycin complex 1), FOXM1 (forkhead box M1)/SKP2, and c-Myc pathways. Hepatology 55, 833–845 (2012).
22. X. Wang, Z. Zheng, J. M. Caviglia, K. E. Corey, T. M. Herfel, B. Cai, R. Masia, R. T. Chung, J. H. Lefkowitch, R. F. Schwabe, I. Tabas, Hepatocyte TAZ/WWTR1 promotes inflammation and fibrosis in nonalcoholic steatohepatitis. Cell Metab. 24, 848–862 (2016).
23. X. Guo, Y. Zhao, H. Yan, Y. Yang, S. Shen, X. Dai, X. Ji, F. Ji, X.-G. Gong, L. Li, X. Bai, X.-H. Feng, T. Liang, J. Ji, L. Chen, H. Wang, B. Zhao, Single tumor-initiating cells evade immune clearance by recruiting type II macrophages. Genes Dev. 31, 247–259 (2017).
24. H. Zhang, C.-Y. Liu, Z.-Y. Zha, B. Zhao, J. Yao, S. Zhao, Y. Xiong, Q.-Y. Lei, K.-L. Guan, TEAD transcription factors mediate the function of TAZ in cell growth and epithelial-mesenchymal transition. J. Biol. Chem. 284, 13355–13362 (2009).
25. Q.-Y. Lei, H. Zhang, B. Zhao, Z.-Y. Zha, F. Bai, X.-H. Pei, S. Zhao, Y. Xiong, K.-L. Guan, TAZ promotes cell proliferation and epithelial-mesenchymal transition and is inhibited by the Hippo pathway. Mol. Cell Biol. 28, 2426–2436 (2008).
26. L. Lu, Y. Li, S. M. Kim, W. Bossuyt, P. Liu, Q. Qiu, Y. Wang, G. Halder, M. J. Finegold, J.-S. Lee, R. L. Johnson, Hippo signaling is a potent in vivo growth and tumor suppressor pathway in the mammalian liver. Proc. Natl. Acad. Sci. U.S.A. 107, 1437–1442 (2010).
27. B. Sun, M. Karin, Inflammation and liver tumorigenesis. Front. Med. 7, 242–254 (2013). 28. T. Su, T. Bondar, X. Zhou, C. Zhang, H. He, R. Medzhitov, Two-signal requirement for
growth-promoting function of Yap in hepatocytes. eLife 4, e02948 (2015). 29. Y. Ben-Neriah, M. Karin, Inflammation meets cancer, with NF-B as the matchmaker.
Nat. Immunol. 12, 715–723 (2011). 30. S. Piccolo, S. Dupont, M. Cordenonsi, The biology of YAP/TAZ: Hippo signaling and
beyond. Physiol. Rev. 94, 1287–1312 (2014). 31. F.-X. Yu, B. Zhao, N. Panupinthu, J. L. Jewell, I. Lian, L. H. Wang, J. Zhao, H. Yuan,
K. Tumaneng, H. Li, X.-D. Fu, G. B. Mills, K.-L. Guan, Regulation of the Hippo-YAP pathway by G-protein-coupled receptor signaling. Cell 150, 780–791 (2012).
32. J. Geng, S. Yu, H. Zhao, X. Sun, X. Li, P. Wang, X. Xiong, L. Hong, C. Xie, J. Gao, Y. Shi, J. Peng, R. L. Johnson, N. Xiao, L. Lu, J. Han, D. Zhou, L. Chen, The transcriptional coactivator TAZ regulates reciprocal differentiation of TH17 cells and Treg cells. Nat. Immunol. 18, 800–812 (2017).
33. G. Wang, X. Lu, P. Dey, P. Deng, C. C. Wu, S. Jiang, Z. Fang, K. Zhao, R. Konaparthi, S. Hua, J. Zhang, E. M. Li-Ning-Tapia, A. Kapoor, C.-J. Wu, N. B. Patel, Z. Guo, V. Ramamoorthy, T. N. Tieu, T. Heffernan, D. Zhao, X. Shang, S. Khadka, P. Hou, B. Hu, E.-J. Jin, W. Yao, X. Pan, Z. Ding, Y. Shi, L. Li, Q. Chang, P. Troncoso, C. J. Logothetis, M. J. McArthur, L. Chin, Y. A. Wang, R. A. DePinho, Targeting YAP-dependent MDSC infiltration impairs tumor progression. Cancer Discov. 6, 80–95 (2016).
34. C. Klijn, S. Durinck, E. W. Stawiski, P. M. Haverty, Z. Jiang, H. Liu, J. Degenhardt, O. Mayba, F. Gnad, J. Liu, G. Pau, J. Reeder, Y. Cao, K. Mukhyala, S. K. Selvaraj, M. Yu, G. J. Zynda, M. J. Brauer, T. D. Wu, R. C. Gentleman, G. Manning, R. L. Yauch, R. Bourgon, D. Stokoe, Z. Modrusan, R. M. Neve, F. J. de Sauvage, J. Settleman, S. Seshagiri, Z. Zhang, A comprehensive transcriptional portrait of human cancer cell lines. Nat. Biotechnol. 33, 306–312 (2015).
35. T. D. Wu, S. Nacu, Fast and SNP-tolerant detection of complex variants and splicing in short reads. Bioinformatics 26, 873–881 (2010).
36. T. D. Wu, J. Reeder, M. Lawrence, G. Becker, M. J. Brauer, GMAP and GSNAP for genomic sequence alignment: Enhancements to speed, accuracy, and functionality. Methods Mol. Biol. 1418, 283–334 (2016).
37. M. I. Love, W. Huber, S. Anders, Moderated estimation of fold change and dispersion for RNA-seq data with DESeq2. Genome Biol. 15, 550 (2014).
38. C. W. Law, Y. Chen, W. Shi, G. K. Smyth, voom: Precision weights unlock linear model analysis tools for RNA-seq read counts. Genome Biol. 15, R29 (2014).
Acknowledgments: We thank members of the Dey and Jackson laboratories for advice and discussions, and core laboratories for technical assistance. We thank D. Barnes for help with necropsy, A. Paler Martinex for help with luminex, O. Mayba for statistical analyses, and S. Lau, D. Dunlap, and the Histology core laboratory for help with histologic sections and immunohistochemistry. Funding: This work was supported by Genentech. Author contributions: T.J.H., S.E.G., E.L.J., D.-S.L., and A.D. designed the project. T.J.H., J.D.W., N.M.K., T.P., H.-J.L., A.G.C., K.T., B.R., N.Y., and X.W. performed the experiments. T.J.H., J.D.W., M.T.C., T.P., H.-J.L., C.K., A.G.C., B.R., D.-H.L., K.B.W., G.H., C.C.d.l.C., W.P.L., S.Y., Z.Z., Q.G., Q.J., and D.-S.L. analyzed the data. A.D. and T.J.H. wrote the manuscript. Competing interests: T.J.H., J.D.W., N.M.K., M.T.C., T.P., H.-J.L., C.K., K.T., N.Y., K.B.W., G.H., C.C.d.l.C., S.E.G., X.W., W.P.L., and A.D. are current employees of Genentech and shareholders in Roche. S.Y., Z.Z., Q.G., and Q.J. are current employees of WuXi AppTec, a contractor for Genentech. The other authors declare that they have no competing interests. Data and materials availability: The RNA-seq data have been deposited to Gene Expression Omnibus (GEO). The GEO Series accession number is GSE117974. All other data needed to evaluate the conclusions in the paper are present in the paper or the Supplementary Materials.
Submitted 7 September 2016Resubmitted 12 September 2017Accepted 15 August 2018Published 11 September 201810.1126/scisignal.aaj1757
Citation: T. J. Hagenbeek, J. D. Webster, N. M. Kljavin, M. T. Chang, T. Pham, H.-J. Lee, C. Klijn, A. G. Cai, K. Totpal, B. Ravishankar, N. Yang, D.-H. Lee, K. B. Walsh, G. Hatzivassiliou, C. C. de la Cruz, S. E. Gould, X. Wu, W. P. Lee, S. Yang, Z. Zhang, Q. Gu, Q. Ji, E. L. Jackson, D.-S. Lim, A. Dey, The Hippo pathway effector TAZ induces TEAD-dependent liver inflammation and tumors. Sci. Signal. 11, eaaj1757 (2018).
on March 29, 2020
http://stke.sciencemag.org/
Dow
nloaded from

The Hippo pathway effector TAZ induces TEAD-dependent liver inflammation and tumors
Jackson, Dae-Sik Lim and Anwesha Deyde la Cruz, Stephen E. Gould, Xiumin Wu, Wyne P. Lee, Shuqun Yang, Zhixiang Zhang, Qingyang Gu, Qunsheng Ji, Erica L.Allen G. Cai, Klara Totpal, Buvana Ravishankar, Naiying Yang, Da-Hye Lee, Kevin B. Walsh, Georgia Hatzivassiliou, Cecile C. Thijs J. Hagenbeek, Joshua D. Webster, Noelyn M. Kljavin, Matthew T. Chang, Trang Pham, Ho-June Lee, Christiaan Klijn,
DOI: 10.1126/scisignal.aaj1757 (547), eaaj1757.11Sci. Signal.
nonredundant functions.signatures in tumor cells driven by activated YAP or TAZ, suggesting that these Hippo pathway effectors haveTEAD-mediated systemic inflammation and tissue infiltration by myeloid cells. RNA-seq analysis identified distinct gene
factortranscript abundance. Expression of hyperactivated TAZ, but not YAP, in the livers of mice augmented transcription . found that only TAZ expression correlated strongly with inflammatory cytokineet aland TCGA data sets, Hagenbeek
kinases that inhibit the activity of these transcriptional coactivators promotes inflammation. In patient-derived xenografts Key effectors of the Hippo pathway, YAP and TAZ, are overexpressed in various cancers. Loss of upstream
TAZ drives inflammation
ARTICLE TOOLS http://stke.sciencemag.org/content/11/547/eaaj1757
MATERIALSSUPPLEMENTARY http://stke.sciencemag.org/content/suppl/2018/09/07/11.547.eaaj1757.DC1
CONTENTRELATED
http://stm.sciencemag.org/content/scitransmed/8/352/352ra108.fullhttp://stke.sciencemag.org/content/sigtrans/9/413/ra12.fullhttp://stke.sciencemag.org/content/sigtrans/10/508/eaan4667.full
REFERENCES
http://stke.sciencemag.org/content/11/547/eaaj1757#BIBLThis article cites 38 articles, 8 of which you can access for free
PERMISSIONS http://www.sciencemag.org/help/reprints-and-permissions
Terms of ServiceUse of this article is subject to the
is a registered trademark of AAAS.Science SignalingYork Avenue NW, Washington, DC 20005. The title (ISSN 1937-9145) is published by the American Association for the Advancement of Science, 1200 NewScience Signaling
Science. No claim to original U.S. Government WorksCopyright © 2018 The Authors, some rights reserved; exclusive licensee American Association for the Advancement of
on March 29, 2020
http://stke.sciencemag.org/
Dow
nloaded from