Infectious disease model
7
Infectious disease model • HIV-1 infection 1. Watanabe S, Ohta S, Yajima M, et al. Humanized NOD/SCID/IL2Rgamma(null) mice transplanted with hematopoietic stem cells under nonmyeloablative conditions show prolonged life spans and allow detailed analysis of human immunodeficiency virus type 1 pathogenesis. J Virol. 2007;81:13259-13264. 2. Watanabe S, Terashima K, Ohta S, et al. Hematopoietic stem cell-engrafted NOD/SCID/IL2Rgamma null mice develop human lymphoid systems and induce long-lasting HIV-1 infection with specific humoral immune responses. Blood. 2007;109:212-218. Figure 1. Surface expression of HIV-1 coreceptors on CD4 + cells in various organs of mice 4 months after transplantation. A representative FACS profile of human CXCR4 and CCR5 on CD4 + cells shows the existence of CXCR4 + CD4 + and CCR5 + CD4 + cells in blood (A), spleen (B), and BM (D), but no CCR5 + CD4 + cells in the thymus (C). BM results show that many CD4 + cells are neither CD3 + T cells nor CD14 + monocytes. A gate was set on the human CD45 + population. Table 1. Comparison of viral RNA copies in plasma and HIV-DNA copies in the spleen, BM, and thymus from hNOG mice receiving low- and high-dose viral inoculations Seven mice inoculated with a low infection dose of HIV-1 JRCSF (200 TCID 50 ) or HIV-1 JRCSF (180 TCID 50 ), and 7 mice receiving a high dose of HIV-1 JRCSF (65,000 TCID 50 ) or HIV-1 JRCSF (20,000 TCID 50 ) were listed. ND indicates not done. A CD8 5.7% blood B 18.8% spleen 12.6% C thymus 3.7% D BM CD4 4.1% 66.1% CD14 5.9% 0.1% 5.0% 0.7% CD3 5.8% 8.9% 13.7% 1.0% 1.9% 10.5% 2.5% 9.7% 1.1% 4.5% 8.2% 8.2% 78.0% 6.9% 39.9% 45.0% 0.4% 91.1% 25.7% 28.7% 0.7% 22.3% 5.2% 3.7% CXCR4 CCR5 CD19 CXCR4 CCR5 CD14
Transcript of Infectious disease model

Infectious disease model• HIV-1 infection
1. Watanabe S, Ohta S, Yajima M, et al. Humanized NOD/SCID/IL2Rgamma(null) mice transplanted withhematopoietic stem cells under nonmyeloablative conditions show prolonged life spans and allow detailedanalysis of human immunodeficiency virus type 1 pathogenesis. J Virol. 2007;81:13259-13264.
2. Watanabe S, Terashima K, Ohta S, et al. Hematopoietic stem cell-engrafted NOD/SCID/IL2Rgamma null micedevelop human lymphoid systems and induce long-lasting HIV-1 infection with specific humoral immuneresponses. Blood. 2007;109:212-218.
Figure 1. Surface expression of HIV-1 coreceptors on CD4+ cells in various organs of mice 4 months aftertransplantation. A representative FACS profile of human CXCR4 and CCR5 on CD4+ cells shows the existence of CXCR4+CD4+ and CCR5+CD4+
cells in blood (A), spleen (B), and BM (D), but no CCR5+CD4+ cells in the thymus (C). BM results show that many CD4+ cells areneither CD3+ T cells nor CD14+ monocytes. A gate was set on the human CD45+ population.
Table 1. Comparison of viral RNA copies in plasma and HIV-DNA copies in the spleen, BM, and thymusfrom hNOG mice receiving low- and high-dose viral inoculations
Seven mice inoculated with a low infection dose of HIV-1JRCSF (200 TCID50) or HIV-1JRCSF (180 TCID50), and 7 mice receivinga high dose of HIV-1JRCSF (65,000 TCID50) or HIV-1JRCSF (20,000 TCID50) were listed. ND indicates not done.
A
CD8
5.7%
blood B
18.8%
spleen
12.6%
C thymus
3.7%
D BM
CD4
4.1%
66.1%
CD14
5.9%
0.1%
5.0%
0.7%
CD35.8%
8.9%
13.7%
1.0%
1.9%
10.5%
2.5%
9.7%
1.1%
4.5%
8.2%
8.2%
78.0%
6.9%
39.9%
45.0%
0.4%
91.1%
25.7%
28.7%
0.7%
22.3%
5.2%
3.7%
CXCR
4 CC
R5
CD19
CX
CR4
CCR5
CD14

Figure 3. Detection of anti–HIV-1 antibodies from the plasma of HIV-1–infected mice. An ELISA assay was conducted by using plasma from 14 mice inoculated with either HIV-1JRCSF or HIV-1MNp, andfrom 2 uninfected control mice. Representatives (n = 8) of the 14 HIV-1–inoculated mice, and the 2 uninfected mice, areshown in the panels. Measurements of specific human antibodies for HIV-1IIIB gp120 (A), HIV-1MN gp120 (B), and HIV-1IIIB p24 antigens (C) were shown. Results are expressed as the means from triplicate assays in 3 different experiments.
Figure 2. The numbers of RNA viral copies in plasma, CD4+/CD8+ T-cell ratios in the spleen, and p24 detection in theimmunohistochemistry of HIV/SHIV-infected mice. (A) Viral copy numbers of 8 mice inoculated with a high infectious dose of HIV-1JRCSF (65,000 TCID50) and killed on days 33 and 43 afterinoculation. (B) Viral copy numbers of 8 mice inoculated with a high infectious dose of SHIV-C2/1 (50,000 TCID50) and killed on days 18 and 42after inoculation. Note that all the mice showed high levels of viremia that lasted more than 40 days after inoculation. (C) CD4/CD8 cell ratios in thespleens of 16 infected mice and 9 uninfected control mice. Control mice were not inoculated with HIV/SHIV and were killed on days 105 to 166after stem cell transplantation. There was no significant rapid loss of CD4+ cells in HIV-1JRCSF–infected mice, while a decline of the CD4/CD8 ratiowas detected in SHIV-C2/1–infected mice on day 42 after infection compared with uninfected control mice (*P < .05). The short bars indicate themeans of each group. (D) P24+ cells are clearly observed in the spleen, LNs, and lungs. Arrow indicates p24 positive for macrophage-like cells.Original magnification, x100.
B HIV-1MN gp120
0.2
0.4
0.6
0.8
0 1/20 1/60 1/180
serum dilution
A
O.D
. 405
nm
0.5
1.0
1.5
2.0
2.5
3.0
1/20 1/60 1/1800
HIV-1IIIB gp120 C HIV-1IIIB p24
1/20 1/60 1/1800
0.4
0.8
1.2
1.61.0
uninfected control #1 uninfected control #2#136-2 HIV-1JRCSF-infected #136-3 HIV-1JRCSF-infected
#112-4 HIV-1MNp-infected #113-4 HIV-1MNp-infected#141-1 HIV-1JRCSF-infected #161-3 HIV-1JRCSF-infected
#157-3 HIV-1MNp-infected #157-4 HIV-1MNp-infected
100
101
102
103
104
105
106
day43day33
Copy
num
bers
/ m
l
day18 day42
HIV-1JRCSFA B SHIV-C2/1
C
D
spleen
LN
lung
HIV-1JRCSF SHIV-C2/1
CD4/
CD8
ratio
0
0.5
1.0
1.5
2.0
2.5
3.0
control day18 day42day43day33
*

Figure 4. Human cell generation in hematopoietic stemcell-engrafted hNOG mice with or without myeloablation. Life spans of NOG mice transplanted with human stem cells afterreceiving 300 cGy irradiation (n = 25) or not receiving irradiation (n= 25). (B) Representative flow cytometric profiles of the mice from 2to 6 months after transplantation without irradiation. The ratio ofhuman to murine CD45+ cells and that of human CD3+ cells to CD19+
cells are shown. Note that the mice generated human CD45+
leukocytes that eventually developed human CD19+ B cells first andthen CD3+ T cells. (C and D) Percentages of human CD45+ cells (C)and CD3+ T cells in human CD45+ cells (D) in peripheral blood from65 mice that received 300 cGy irradiation and 222 nonirradiated mice40 to 413 days after transplantation. (E) Summary of engraftmentlevels in nonirradiated mice transplanted with 2 x 10⁴ to 5 x 10⁴ cells(n = 11), 5 x 10⁴ to 7 x 10⁴ cells (n = 53), or 7 x 10⁴ to 12 x 104 (n =30) human stem cells. Percentages of human CD45+ leukocytes inperipheral blood during 4 to 5 months after transplantation wereshown. The horizontal black bars indicate the averages of the groups.(F to I) Flow cytometric analysis and immunohistochemical analysisof the expression of myelomonocytic markers in nonirradiated mice 4months after transplantation. Human CD14+ monocytes/macrophageswere recognized in peripheral blood and BM (F). A gate was set onthe human CD45+ population. Human CD68+ macrophages andCD205+ DCs were also detected in spleen (G) and uterus (H and I).Visualization was performed with 5-bromo-4-chloro-3-indolylphosphate (BCIP). The original magnifications were x100 (Gand H) and x200 (I).
Figure 5. Long-lasting viremia and CD4+ T-cell depletion inR5- and X4-tropic HIV-1-infected hNOG mice.(A) Viral copy numbers in plasma from 29 mice intravenouslyinoculated with R5-tropic HIV-1JRCSF (65,000 TCID50; n = 11), X4-tropic HIV-1MNp (20,000 TCID50; n = 10), and X4-tropic HIV-1NL4-3(60,000 TCID50; n = 8). RNA viral copy numbers were measured usinga real-time PCR quantification assay as previously described (22). (B)The percentages of CD4– CD8+ (top left), CD4+ CD8+ (top right), andCD4+ CD8– (bottom right) cells in blood, spleen, and thymus from auninfected control mouse and a V-1NL4-3-infected mouse (32 dayspostinfection). These two mice were constructed with HSCs from thesame cord blood donor, and sacrificed 181 and 169 days aftertransplantation, respectively. A gate was set on the human CD45+
population. (C) Comparison of the apparent size of mesenteric LN fromuninfected mice or mice infected with HIV-1JRCSF (109 dayspostinfection), HIV-1MNp (109 days postinfection), or HIV-1NL4-3 (112days postinfection). A uninfected control mouse was sacrificed 249 daysafter transplantation, and three HIV-1-infected mice were sacrificed246, 246, and 249 days after transplantation. (D) Comparison ofCD4/CD8 T-cell ratios and absolute CD4+ T-cell numbers in peripheralblood from uninfected control mice (n = 7), R5-tropic HIV-1JRCSF-infected mice (n = 7), X4-tropic HIV-1MNp-infected mice (n = 5), andX4-tropic HIV-1NL4-3-infected mice (n = 6). Results are expressed asmeans ± standard deviations (error bars).

Infectious disease model• ATL infection
Dewan MZ, Terashima K, Taruishi M, et al. Rapid tumor formation of human T-cell leukemia virus type 1-infected cell lines in novel NOD-SCID/gammac(null) mice: suppression by an inhibitor against NF-kappaB. JVirol. 2003;77:5286-5294.
We established a novel experimental model for human T-cell leukemia virus type 1 (HTLV-1)-induced tumor usingNOD-SCID/gammac(null) (NOG) mice. This model is very useful for investigating the mechanism of tumorigenesis andmalignant cell growth of adult T-cell leukemia (ATL)/lymphoma, which still remains unclear. Nine HTLV-1-infectedcell lines were inoculated subcutaneously in the postauricular region of NOG mice. As early as 2 to 3 weeks afterinoculation, seven cell lines produced a visible tumor while two transformed cell lines failed to do so. Five of seven linesproduced a progressively growing large tumor with leukemic infiltration of the cells in various organs that eventuallykilled the animals. Leukemic cell lines formed soft tumors, whereas some transformed cell lines developed intohemorrhagic hard tumors in NOG mice. One of the leukemic cell lines, ED-40515(-), was unable to produce visibletumors in NOD-SCID mice with a common gamma-chain after 2 weeks. In vivo NF-kappaB DNA binding activity ofthe ED-40515(-) cell line was higher and the NF-kappaB components were changed compared to cells in vitro. Bay 11-7082, a specific and effective NF-kappaB inhibitor, prevented tumor growth at the sites of the primary region andleukemic infiltration in various organs of NOG mice. This in vivo model of ATL could provide a novel system for use inclarifying the mechanism of growth of HTLV-1-infected cells as well as for the development of new drugs against ATL.

Infectious disease model• EBV infection model
Yajima M, Imadome K, Nakagawa A, et al. A new humanized mouse model of Epstein-Barr virus infectionthat reproduces persistent infection, lymphoproliferative disorder, and cell-mediated and humoral immuneresponses. J Infect Dis. 2008;198:673-682.
The functional human immune system, including T, B, and natural killer lymphocytes, is reconstituted inNOD/Shi-scid/IL-2Rγnull (NOG) mice that receive hematopoietic stem cell transplants. Here, we show thatthese humanized mice can recapitulate key aspects of Epstein-Barr virus (EBV) infection in humans.Inoculation with ∼1 × 10³ TD50 (50% transforming dose) of EBV caused B cell lymphoproliferative disorder,with histopathological findings and latent EBV gene expression remarkably similar to that inimmunocompromised patients. Inoculation with a low dose of virus (≤1 × 101 TD50), in contrast, resulted inapparently asymptomatic persistent infection. Levels of activated CD8+ T cells increased dramatically in theperipheral blood of infected mice, and enzyme-linked immunospot assay and flow cytometry demonstrated anEBV-specific T cell response. Immunoglobulin M antibody specific to the EBV-encoded protein BFRF3 wasdetected in serum from infected mice. The NOG mouse is the most comprehensive small-animal model ofEBV infection described to date and should facilitate studies of the pathogenesis, prevention, and treatment ofEBV infection.
Figure1. Peripheral blood Epstein Barr virus (EBV) DNA load and body weight in humanized NOG (hNOG)mice infected with EBV. A, Infection at a high dose of virus. Six mice were inoculated intravenously with 1 × 10³ TD50 ofEBV. Peripheral blood EBV DNA load (upper panels) and body weight (lower panels) were then determined weekly. Each symbolin the graphs represents an individual mouse. Interruption of records indicates the death or killing of a mouse. B, Infection at lowerdoses. Peripheral blood EBV DNA load (upper panel) and body weight (lower panel) of 2 mice inoculated with low doses of EBV(black circle, 1 × 10⁻¹ TD50; white circle, 1 × 101 TD50) are shown..
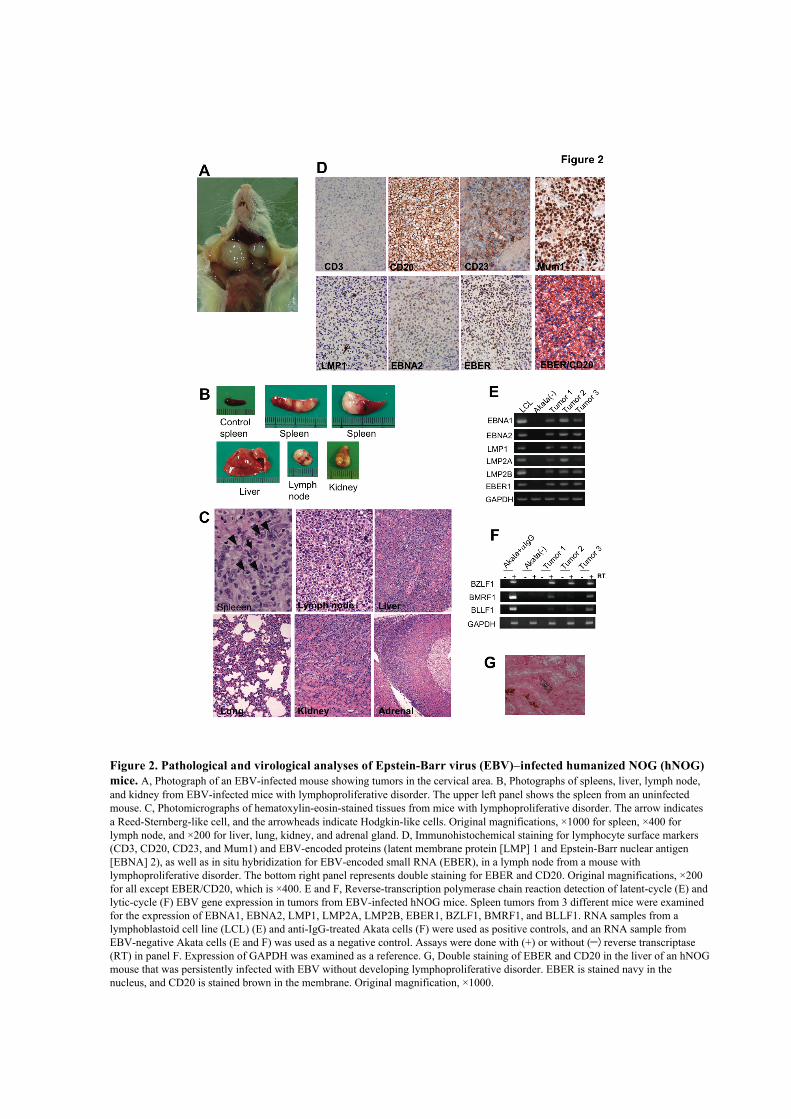
Figure 2. Pathological and virological analyses of Epstein-Barr virus (EBV)–infected humanized NOG (hNOG)mice. A, Photograph of an EBV-infected mouse showing tumors in the cervical area. B, Photographs of spleens, liver, lymph node,and kidney from EBV-infected mice with lymphoproliferative disorder. The upper left panel shows the spleen from an uninfectedmouse. C, Photomicrographs of hematoxylin-eosin-stained tissues from mice with lymphoproliferative disorder. The arrow indicatesa Reed-Sternberg-like cell, and the arrowheads indicate Hodgkin-like cells. Original magnifications, ×1000 for spleen, ×400 forlymph node, and ×200 for liver, lung, kidney, and adrenal gland. D, Immunohistochemical staining for lymphocyte surface markers(CD3, CD20, CD23, and Mum1) and EBV-encoded proteins (latent membrane protein [LMP] 1 and Epstein-Barr nuclear antigen[EBNA] 2), as well as in situ hybridization for EBV-encoded small RNA (EBER), in a lymph node from a mouse withlymphoproliferative disorder. The bottom right panel represents double staining for EBER and CD20. Original magnifications, ×200for all except EBER/CD20, which is ×400. E and F, Reverse-transcription polymerase chain reaction detection of latent-cycle (E) andlytic-cycle (F) EBV gene expression in tumors from EBV-infected hNOG mice. Spleen tumors from 3 different mice were examinedfor the expression of EBNA1, EBNA2, LMP1, LMP2A, LMP2B, EBER1, BZLF1, BMRF1, and BLLF1. RNA samples from alymphoblastoid cell line (LCL) (E) and anti-IgG-treated Akata cells (F) were used as positive controls, and an RNA sample fromEBV-negative Akata cells (E and F) was used as a negative control. Assays were done with (+) or without (-) reverse transcriptase(RT) in panel F. Expression of GAPDH was examined as a reference. G, Double staining of EBER and CD20 in the liver of an hNOGmouse that was persistently infected with EBV without developing lymphoproliferative disorder. EBER is stained navy in thenucleus, and CD20 is stained brown in the membrane. Original magnification, ×1000.

Figure 3. Surface marker expression by peripheral blood T cells in Epstein-Barr virus (EBV)–infectedhumanized NOG (hNOG) mice. A, Changes in the percentages of CD3+ T cells and CD19+ B cells among human CD45+
leukocytes (upper panels) and in the percentages of CD8+ cells and CD4+ cells among CD3+ cells (lower panels) after infectionwith EBV. Results obtained from 3 EBV-infected mice and an uninfected mice are shown. White symbols indicate thepercentage of CD19+ cells (upper panels) or CD4+ cells (lower panels); black symbols indicate the percentage of CD3+ cells(upper panels) or CD8+ cells (lower panels). A vertical arrow in the graph area shows the time point at which EBV DNA wasfirst detected in peripheral blood. B, Changes in the no. of CD8+ T cells in the peripheral blood of EBV-infected hNOG mice.White symbols indicate uninfected mice, and black symbols indicate infected mice. Note that cell no. is plotted in a logarithmicscale. C, Viral dose-dependent T cell responses in hNOG mice inoculated with serially diluted EBV. Ten-fold serial dilutions ofan EBV sample starting from 1 × 10³ TD50 per inoculate were injected intravenously into NOG mice that had undergonetransplantation with the same lot of human hematopoietic stem cells (HSCs). Changes in the percentages of CD3+ T cells amonghuman CD45+ leukocytes (upper panel) and in the percentages of CD8+ cells among CD3+ cells (lower panel) after inoculationwith EBV are shown. The viral dose for each mouse is shown in the key. D, Comparison of surface marker expression betweenEBV-infected mice and control mice. Two mice that underwent transplantation with the same lot of human HSCs were eitherinoculated with EBV or left uninfected; 10 weeks after inoculation, mononuclear cells obtained from peripheral blood or spleenwere gated for the expression of human CD3 and then examined for the expression of CD8 and CD4 (top panels), CD45RO andCD45RA (second from top), HLA-DR and CD4 (second from bottom), and HLA-DR and CD8 (bottom).