Industry/University Cooperative Highlights of Membership ...08/MembershipProcessOutcome... · •...
57
Page 1 IUCRC June 2008 Industry/University Cooperative Research Centers Highlights of Membership and Process/Outcome Data FY 2006-2007 IUCRC Evaluator’s Meeting June 12, 2008 Denis Gray, Andrea Lloyd, Denis Gray, Andrea Lloyd, & Lindsey McGowen & Lindsey McGowen North Carolina State University North Carolina State University PDF created with pdfFactory Pro trial version www.pdffactory.com
Transcript of Industry/University Cooperative Highlights of Membership ...08/MembershipProcessOutcome... · •...
Page 1 IUCRC June 2008
Industry/University Cooperative
Research CentersHighlights of Membership and Process/Outcome Data
FY 2006-2007
IUCRC Evaluator’s MeetingJune 12, 2008
Denis Gray, Andrea Lloyd, Denis Gray, Andrea Lloyd, & Lindsey McGowen& Lindsey McGowen
North Carolina State UniversityNorth Carolina State University
PDF created with pdfFactory Pro trial version www.pdffactory.com
Page 2 IUCRC June 2008
Industry/University Cooperative
Research Centers
MEMBERSHIP REPORT DATA
PDF created with pdfFactory Pro trial version www.pdffactory.com
Page 3 IUCRC June 2008
Industry/University Cooperative
Research Centers
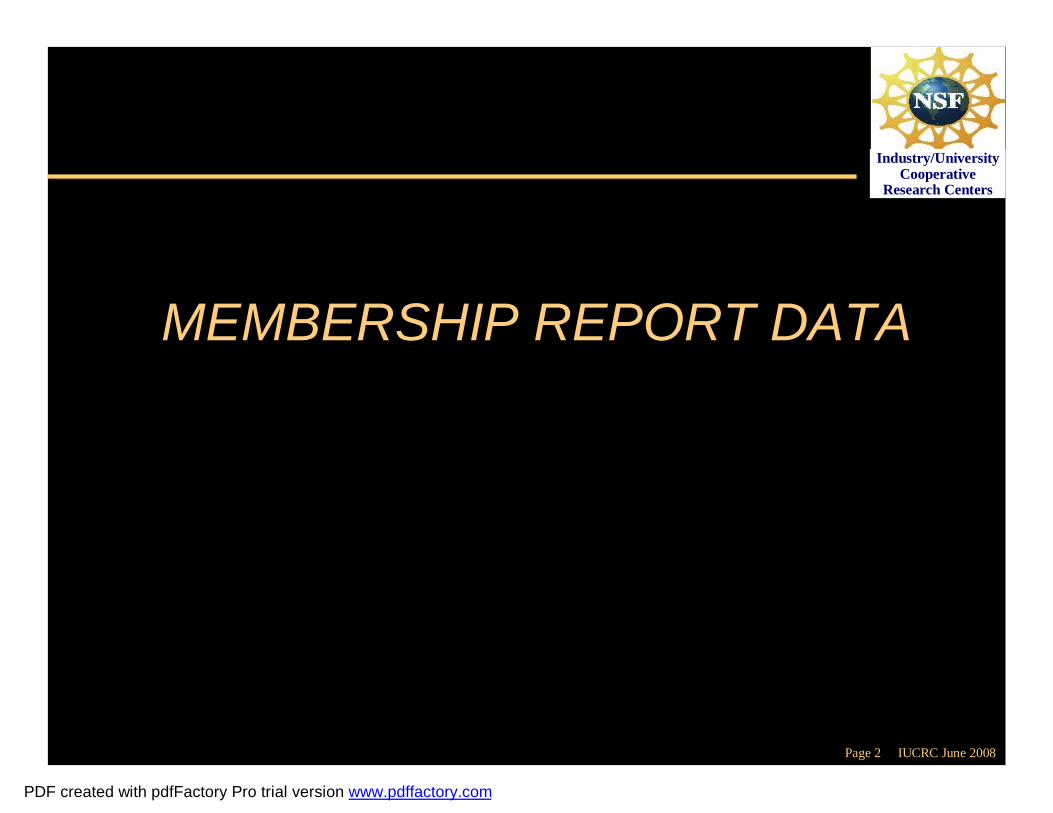
Take Home Message
•• Tracking Tracking ““membershipmembership”” is important is important because it may be the most important because it may be the most important measure of success for centers and measure of success for centers and the IUCRC programthe IUCRC program
•• ButBut……––We need to be very careful in interpreting We need to be very careful in interpreting
changes in membership overtimechanges in membership overtime
PDF created with pdfFactory Pro trial version www.pdffactory.com
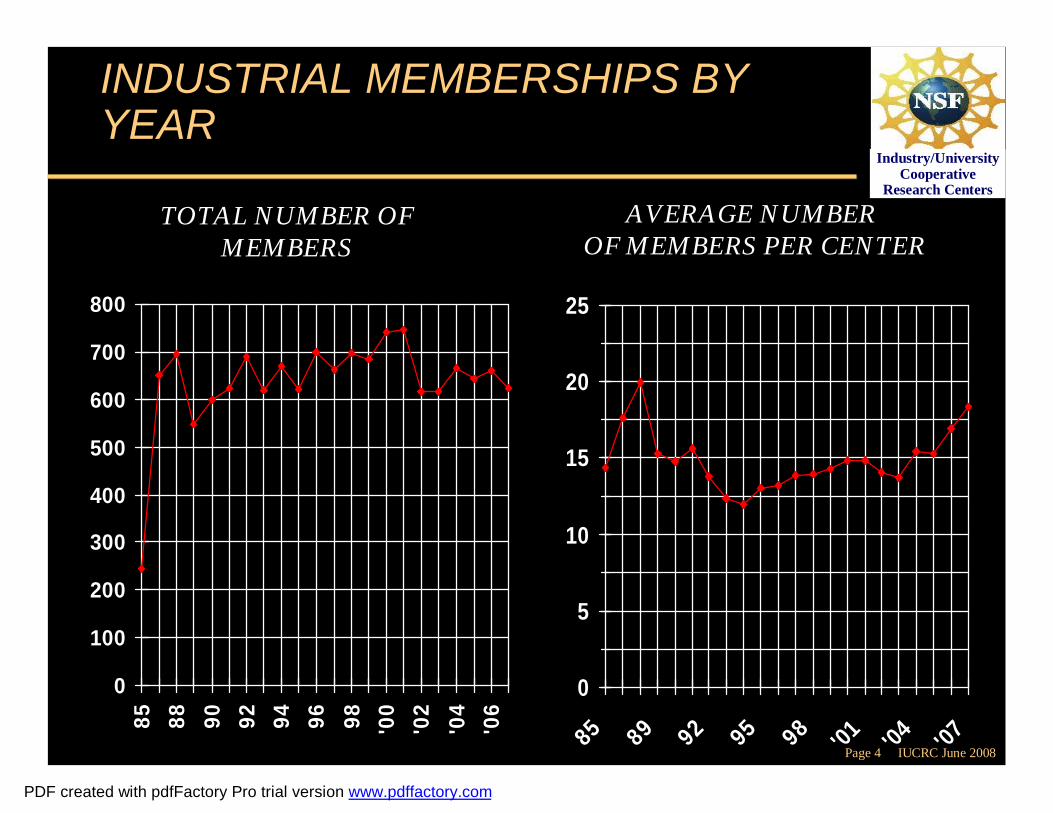
Page 4 IUCRC June 2008
Industry/University Cooperative
Research Centers
INDUSTRIAL MEMBERSHIPS BY YEAR
TOTAL NUMBER OF MEMBERS
AVERAGE NUMBEROF MEMBERS PER CENTER
0
100
200
300
400
500
600
700
800
85 88 90 92 94 96 98 '00
'02
'04
'06
0
5
10
15
20
25
85 89 92 95 98 '01 '04 '07
PDF created with pdfFactory Pro trial version www.pdffactory.com
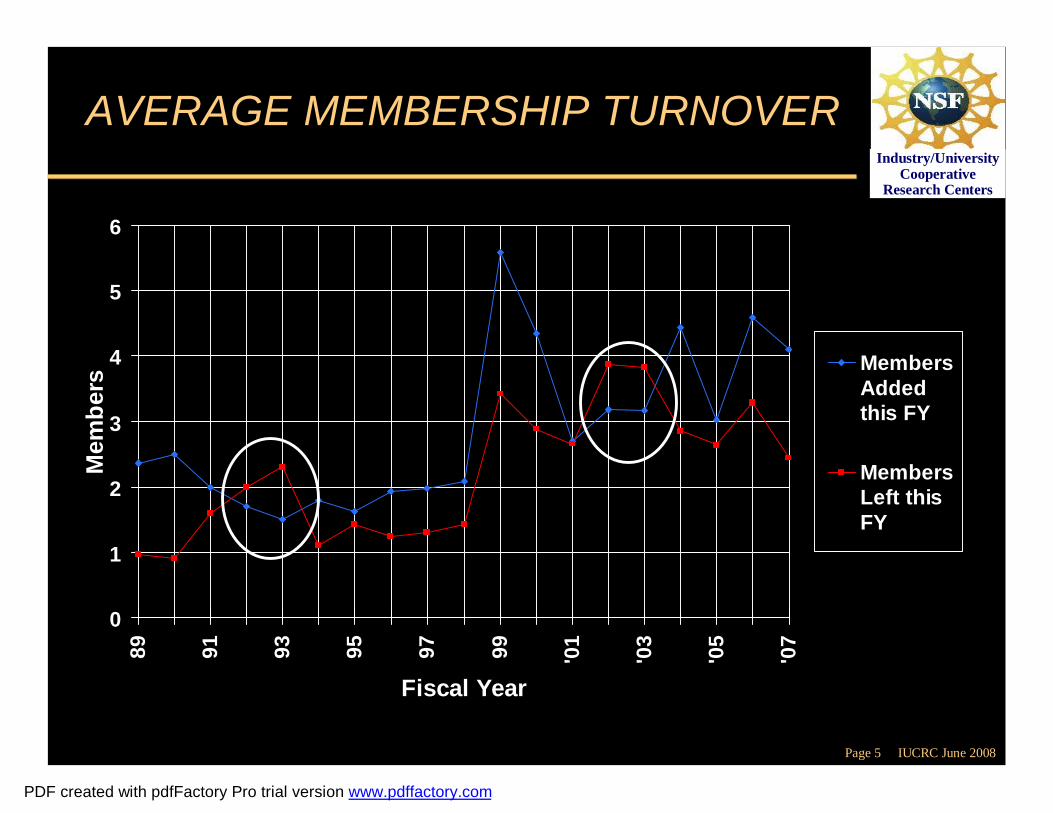
Page 5 IUCRC June 2008
Industry/University Cooperative
Research Centers
AVERAGE MEMBERSHIP TURNOVER
0
1
2
3
4
5
6
89 91 93 95 97 99 '01
'03
'05
'07
Fiscal Year
Mem
bers
MembersAddedthis FY
MembersLeft thisFY
PDF created with pdfFactory Pro trial version www.pdffactory.com
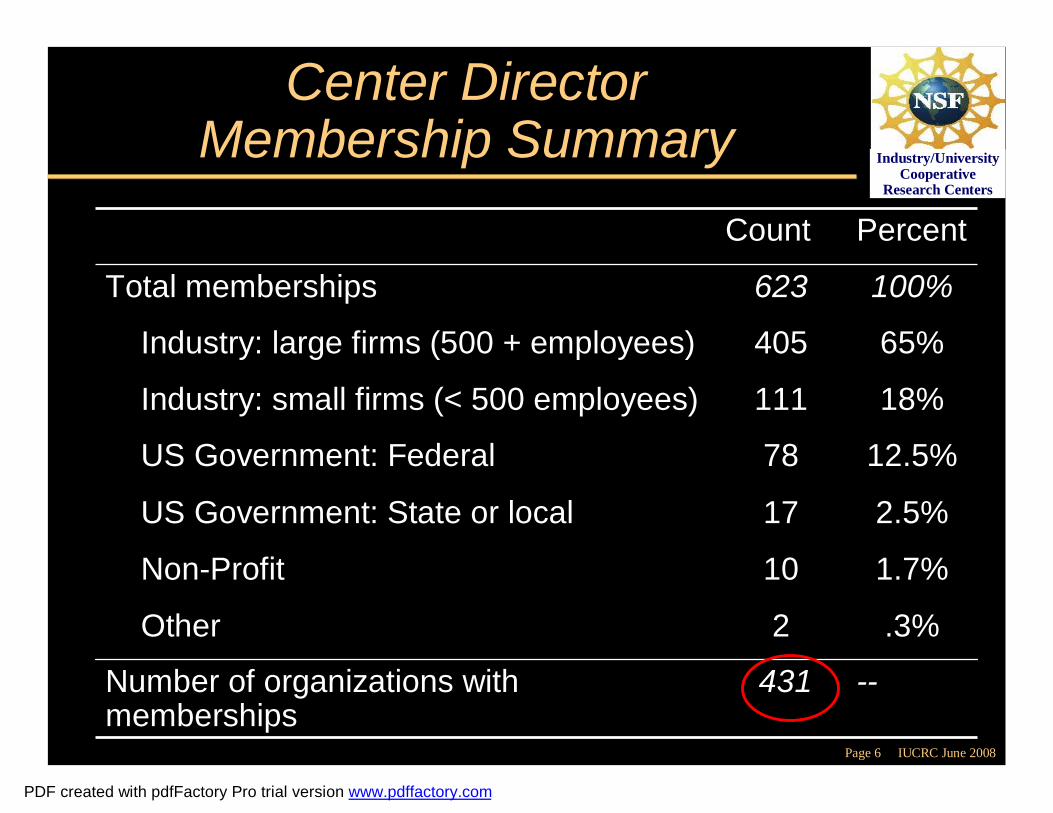
Page 6 IUCRC June 2008
Industry/University Cooperative
Research Centers
Center Director Membership Summary
2.5%2.5%1717US Government: State or localUS Government: State or local
12.5%12.5%7878US Government: Federal US Government: Federal
1.7%1.7%1010NonNon--ProfitProfit
.3%.3%22Other Other
----431431Number of organizations with Number of organizations with membershipsmemberships
111111
405405
623623
CountCount
18%18%Industry: small firms (< 500 employees)Industry: small firms (< 500 employees)
65%65%Industry: large firms (500 + employees)Industry: large firms (500 + employees)
100%100%Total membershipsTotal memberships
PercentPercent
PDF created with pdfFactory Pro trial version www.pdffactory.com
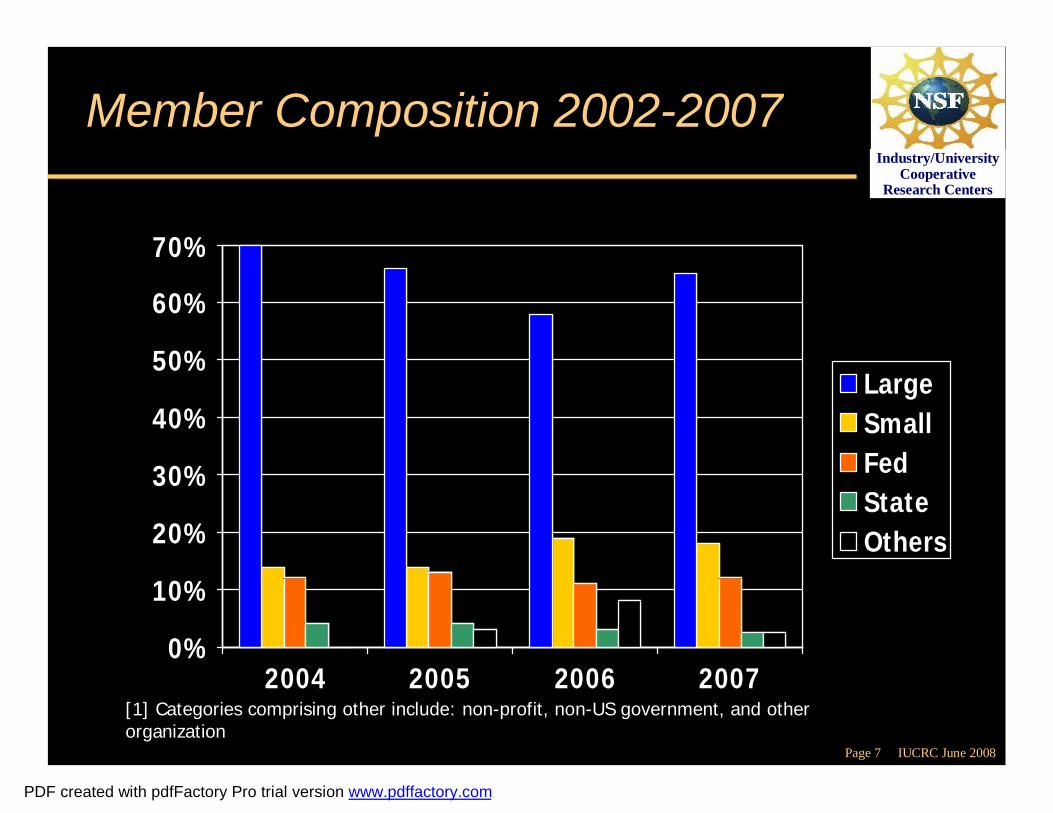
Page 7 IUCRC June 2008
Industry/University Cooperative
Research Centers
Member Composition 2002-2007
0%
10%
20%
30%
40%
50%
60%
70%
2004 2005 2006 2007
LargeSmallFedStateOthers
[1] Categories comprising other include: non-profit, non-US government, and other organization
PDF created with pdfFactory Pro trial version www.pdffactory.com
Page 8 IUCRC June 2008
Industry/University Cooperative
Research Centers
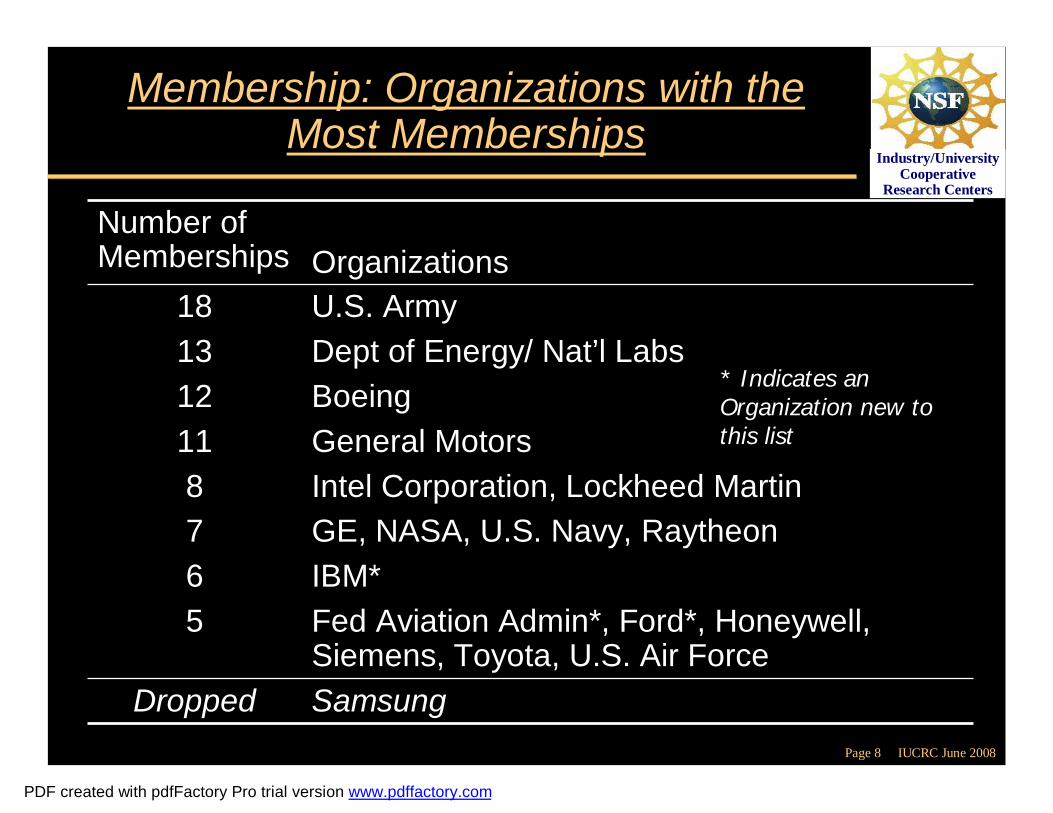
Membership: Organizations with the Most Memberships
U.S. ArmyU.S. Army1818
Fed Aviation Admin*, Ford*, Honeywell, Fed Aviation Admin*, Ford*, Honeywell, Siemens, Toyota, U.S. Air Force Siemens, Toyota, U.S. Air Force
55
Samsung Samsung DroppedDropped
IBM*IBM*66GE, NASA, U.S. Navy, RaytheonGE, NASA, U.S. Navy, Raytheon77Intel Corporation, Lockheed Martin Intel Corporation, Lockheed Martin 88General MotorsGeneral Motors1111BoeingBoeing1212Dept of Energy/ NatDept of Energy/ Nat’’l Labsl Labs1313
OrganizationsOrganizationsNumber of Number of MembershipsMemberships
* Indicates an Organization new to this list
PDF created with pdfFactory Pro trial version www.pdffactory.com
Page 9 IUCRC June 2008
Industry/University Cooperative
Research Centers
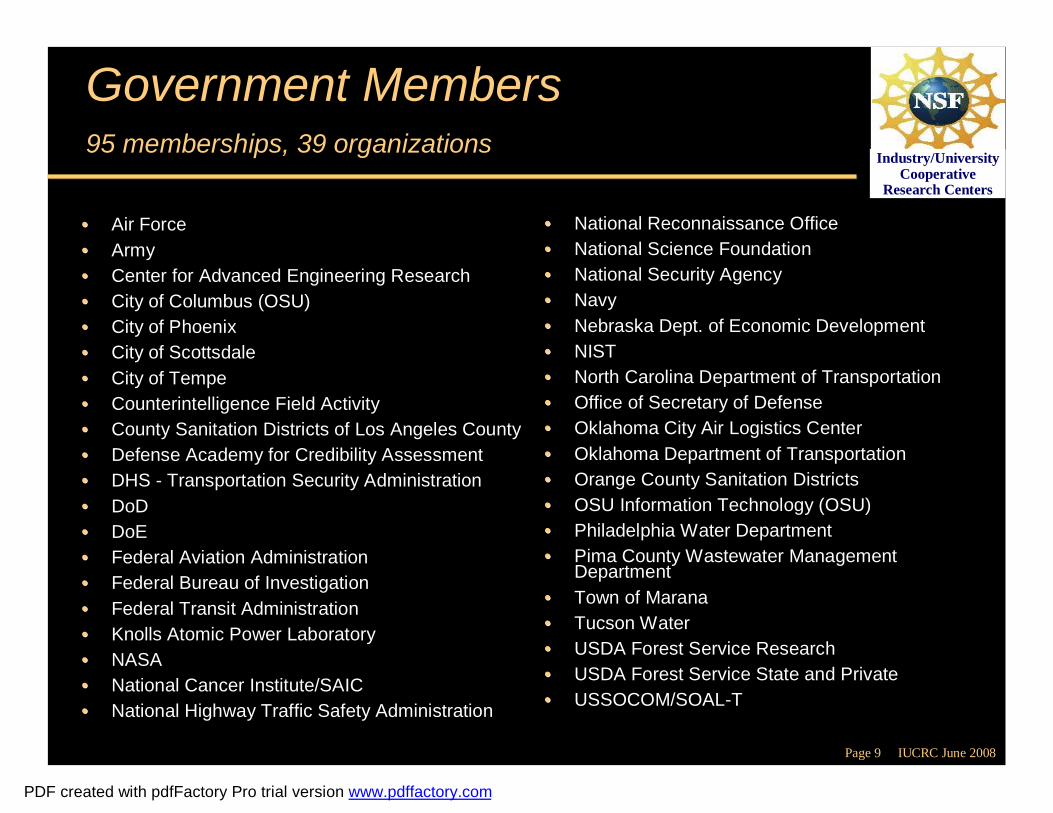
Government Members95 memberships, 39 organizations
•• Air ForceAir Force•• ArmyArmy•• Center for Advanced Engineering ResearchCenter for Advanced Engineering Research•• City of Columbus (OSU)City of Columbus (OSU)•• City of PhoenixCity of Phoenix•• City of ScottsdaleCity of Scottsdale•• City of TempeCity of Tempe•• Counterintelligence Field ActivityCounterintelligence Field Activity•• County Sanitation Districts of Los Angeles CountyCounty Sanitation Districts of Los Angeles County•• Defense Academy for Credibility AssessmentDefense Academy for Credibility Assessment•• DHS DHS -- Transportation Security AdministrationTransportation Security Administration•• DoDDoD•• DoEDoE•• Federal Aviation Administration Federal Aviation Administration •• Federal Bureau of InvestigationFederal Bureau of Investigation•• Federal Transit AdministrationFederal Transit Administration•• Knolls Atomic Power LaboratoryKnolls Atomic Power Laboratory•• NASANASA•• National Cancer Institute/SAICNational Cancer Institute/SAIC•• National Highway Traffic Safety AdministrationNational Highway Traffic Safety Administration
•• National Reconnaissance OfficeNational Reconnaissance Office•• National Science FoundationNational Science Foundation•• National Security AgencyNational Security Agency•• NavyNavy•• Nebraska Dept. of Economic DevelopmentNebraska Dept. of Economic Development•• NISTNIST•• North Carolina Department of TransportationNorth Carolina Department of Transportation•• Office of Secretary of DefenseOffice of Secretary of Defense•• Oklahoma City Air Logistics CenterOklahoma City Air Logistics Center•• Oklahoma Department of TransportationOklahoma Department of Transportation•• Orange County Sanitation DistrictsOrange County Sanitation Districts•• OSU Information Technology (OSU)OSU Information Technology (OSU)•• Philadelphia Water DepartmentPhiladelphia Water Department•• Pima County Wastewater Management Pima County Wastewater Management
DepartmentDepartment•• Town of MaranaTown of Marana•• Tucson WaterTucson Water•• USDA Forest Service ResearchUSDA Forest Service Research•• USDA Forest Service State and PrivateUSDA Forest Service State and Private•• USSOCOM/SOALUSSOCOM/SOAL--TT
PDF created with pdfFactory Pro trial version www.pdffactory.com
Page 10 IUCRC June 2008
Industry/University Cooperative
Research Centers
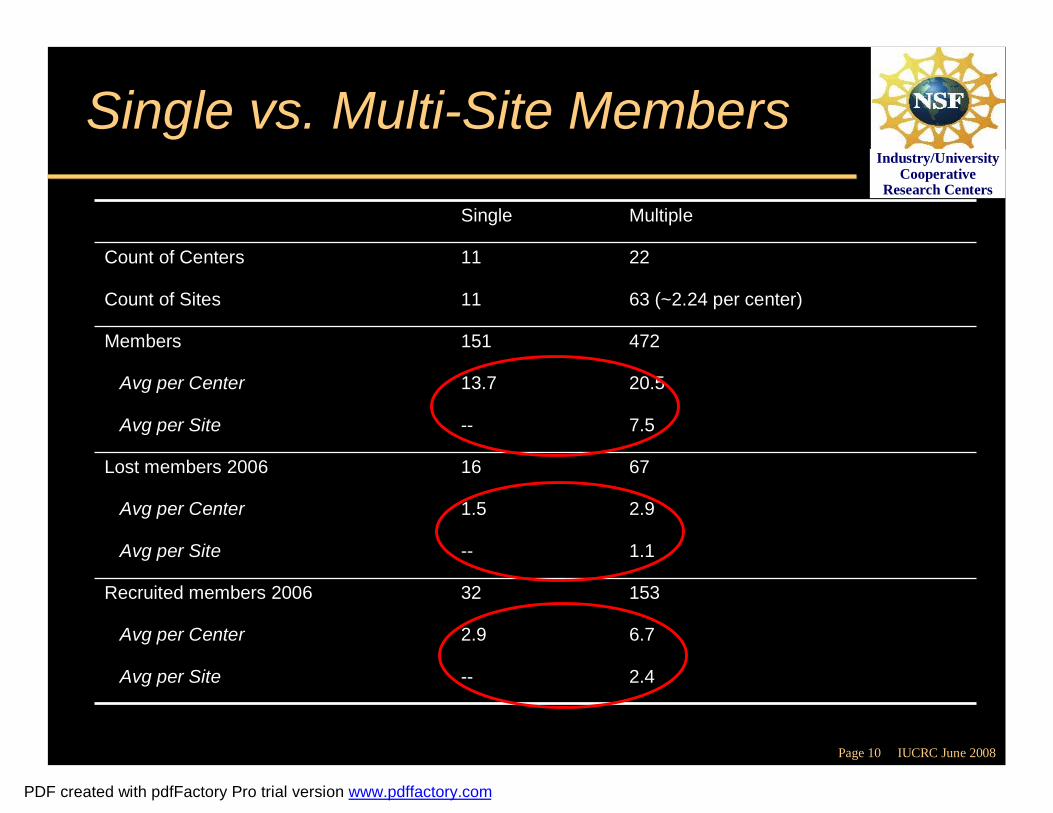
Single vs. Multi-Site Members
2.42.4----Avg per SiteAvg per Site
6.76.72.92.9Avg per CenterAvg per Center
1531533232Recruited members 2006Recruited members 2006
1.11.1----Avg per SiteAvg per Site
2.92.91.51.5Avg per CenterAvg per Center
67671616Lost members 2006Lost members 2006
7.57.5----Avg per SiteAvg per Site
20.520.513.713.7Avg per CenterAvg per Center
472 472 151 151 MembersMembers
63 (~2.24 per center)63 (~2.24 per center)1111Count of Sites Count of Sites
22221111Count of CentersCount of Centers
Multiple Multiple SingleSingle
PDF created with pdfFactory Pro trial version www.pdffactory.com
Page 11 IUCRC June 2008
Industry/University Cooperative
Research Centers
Conclusion and a caution …
•• Membership looks pretty healthy butMembership looks pretty healthy but……•• All our interpretations of membership All our interpretations of membership
changes over time are suspect changes over time are suspect ––Because they are affected by factors Because they are affected by factors
operating at multiple levels of analysisoperating at multiple levels of analysis
PDF created with pdfFactory Pro trial version www.pdffactory.com
Page 12 IUCRC June 2008
Industry/University Cooperative
Research Centers
IUCRC Evolution
NSFNSF--IUCRC Program Composition IUCRC Program Composition 2002 2002 –– 2006 2006
Prepared by Drew Rivers, NCSUPrepared by Drew Rivers, NCSU
PDF created with pdfFactory Pro trial version www.pdffactory.com
Page 13 IUCRC June 2008
Industry/University Cooperative
Research Centers
Overview
•• Current Structural Report provides annual Current Structural Report provides annual counts of program centers and memberscounts of program centers and members
•• However, changes from yearHowever, changes from year--toto--year are year are more complicated than previously more complicated than previously consideredconsidered
•• This document summarizes the evolution of This document summarizes the evolution of the IUCRC program at the Centerthe IUCRC program at the Center--, Site, Site--, , and Memberand Member--level from 2002 level from 2002 -- 20062006
PDF created with pdfFactory Pro trial version www.pdffactory.com
Page 14 IUCRC June 2008
Industry/University Cooperative
Research Centers
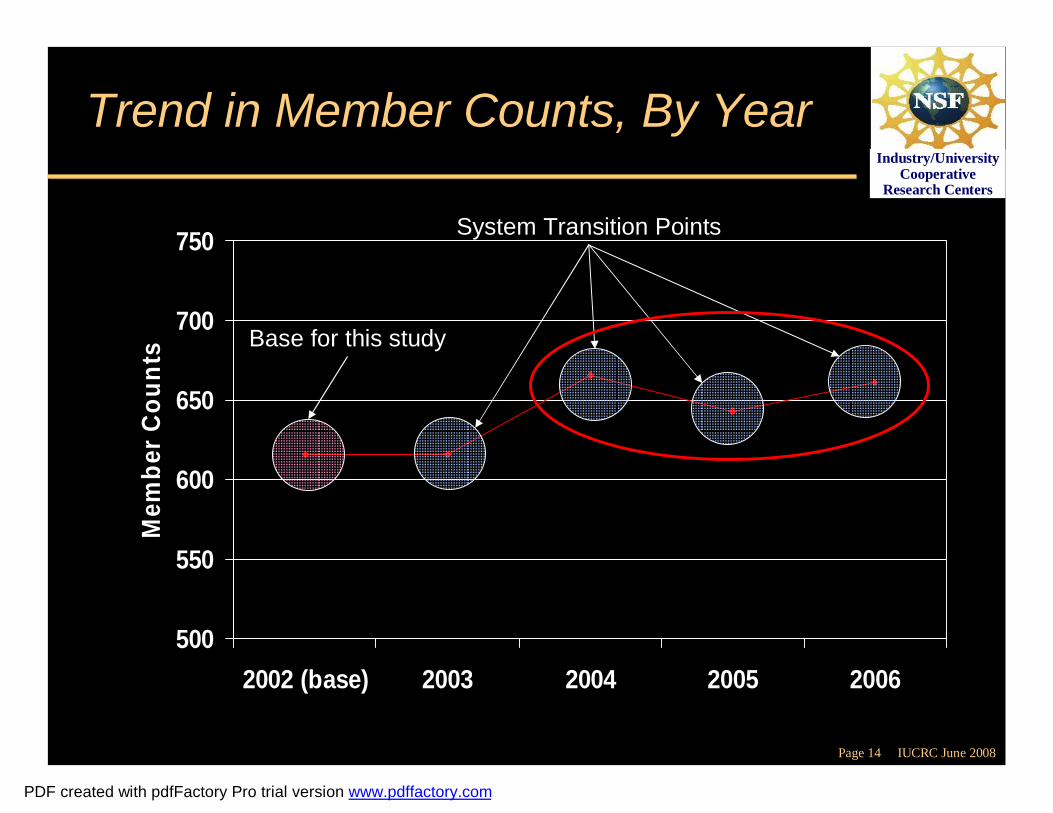
Trend in Member Counts, By Year
500
550
600
650
700
750
2002 (base) 2003 2004 2005 2006
Mem
ber C
ount
s
System Transition Points
Base for this study
PDF created with pdfFactory Pro trial version www.pdffactory.com
Page 15 IUCRC June 2008
Industry/University Cooperative
Research Centers
Interpreting Membership Changes Over Time
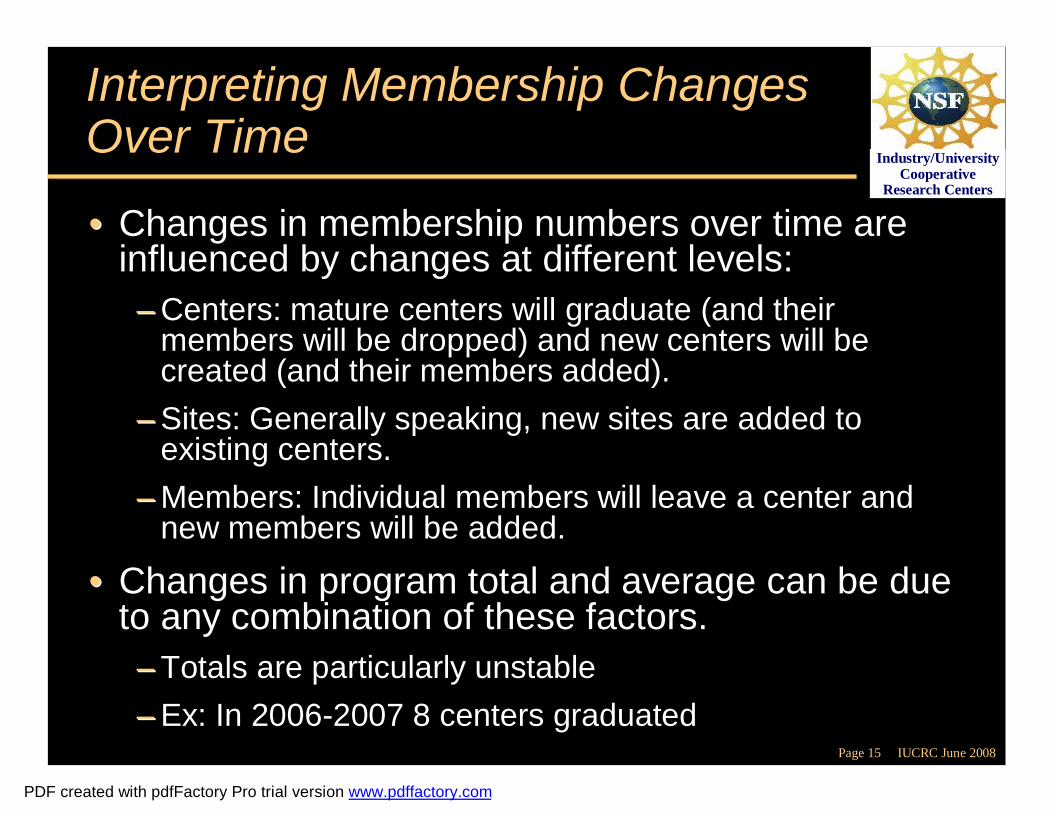
•• Changes in membership numbers over time are Changes in membership numbers over time are influenced by changes at different levels:influenced by changes at different levels:
–– Centers: mature centers will graduate (and their Centers: mature centers will graduate (and their members will be dropped) and new centers will be members will be dropped) and new centers will be created (and their members added).created (and their members added).
–– Sites: Generally speaking, new sites are added to Sites: Generally speaking, new sites are added to existing centers. existing centers.
–– Members: Individual members will leave a center and Members: Individual members will leave a center and new members will be added.new members will be added.
•• Changes in program total and average can be due Changes in program total and average can be due to any combination of these factors.to any combination of these factors.
–– Totals are particularly unstableTotals are particularly unstable–– Ex: In 2006Ex: In 2006--2007 8 centers graduated2007 8 centers graduated
PDF created with pdfFactory Pro trial version www.pdffactory.com
Page 16 IUCRC June 2008
Industry/University Cooperative
Research Centers
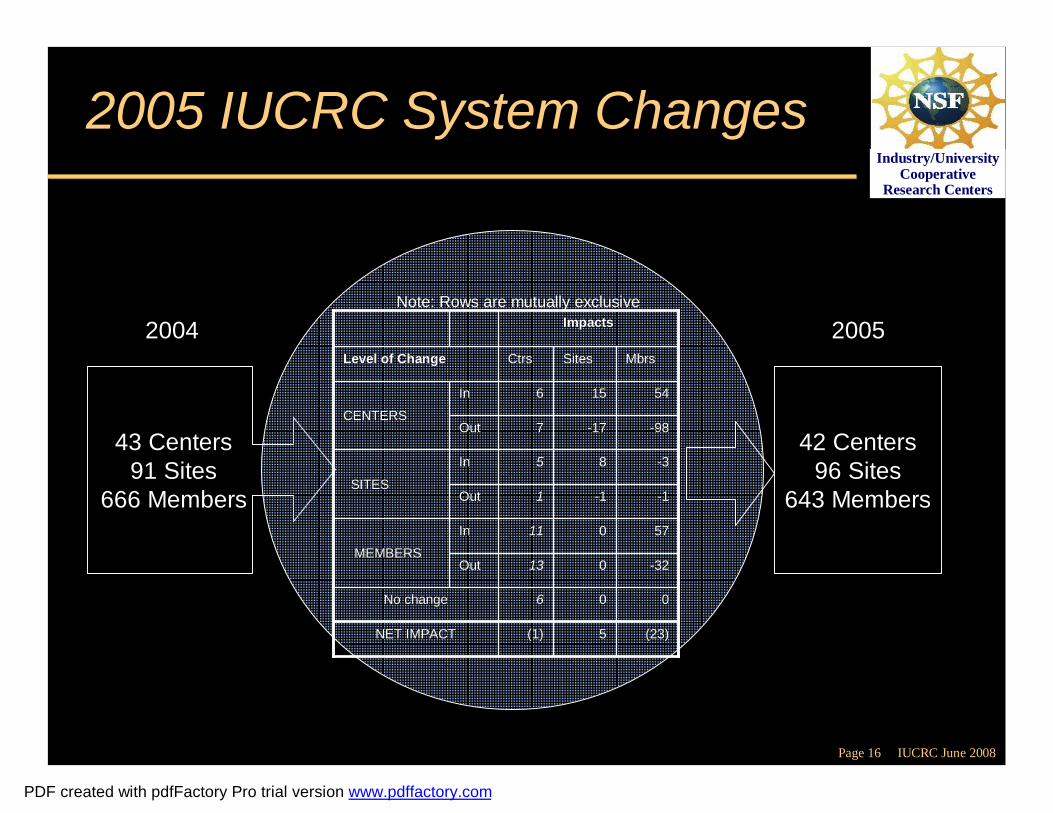
2005 IUCRC System Changes
2004
43 Centers91 Sites
666 Members
000066No changeNo change
MEMBERSMEMBERS
SITESSITES
CENTERSCENTERS
(23)(23)55(1)(1)NET IMPACTNET IMPACT
--3232001313OutOut
5757001111InIn
--11--1111OutOut
--338855InIn
--9898--171777OutOut
5454151566InIn
MbrsMbrsSitesSitesCtrsCtrsLevel of ChangeLevel of Change
ImpactsImpacts
42 Centers96 Sites
643 Members
2005 Note: Rows are mutually exclusive
PDF created with pdfFactory Pro trial version www.pdffactory.com

Page 17 IUCRC June 2008
Industry/University Cooperative
Research Centers
2006 IUCRC System Changes
2005
42 Centers96 Sites
643 Members
000044No changeNo change
MEMBERSMEMBERS
SITESSITES
CENTERSCENTERS
181811(3)(3)NET IMPACTNET IMPACT
--4646001010OutOut
5656001616InIn
22--1111OutOut
10109955InIn
--3333--121266OutOut
29295533InIn
MbrsMbrsSitesSitesCtrsCtrsLevel of ChangeLevel of Change
ImpactsImpacts
39 Centers97 Sites
661 Members
2006
Note: Rows are mutually exclusive
PDF created with pdfFactory Pro trial version www.pdffactory.com
Page 18 IUCRC June 2008
Industry/University Cooperative
Research Centers
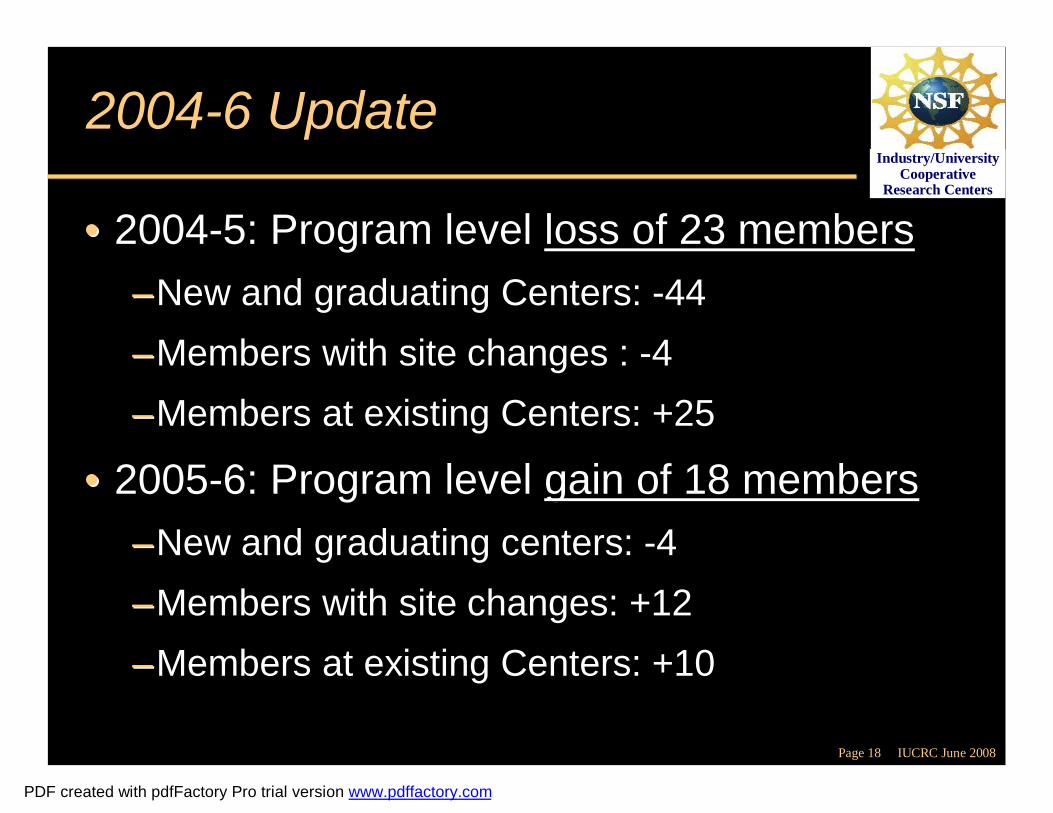
2004-6 Update
•• 20042004--5: Program level 5: Program level loss of 23 membersloss of 23 members––New and graduating Centers: New and graduating Centers: --4444––Members with site changes : Members with site changes : --4 4 ––Members at existing Centers: +25Members at existing Centers: +25
•• 20052005--6: Program level 6: Program level gain of 18 membersgain of 18 members––New and graduating centers: New and graduating centers: --44––Members with site changes: +12Members with site changes: +12––Members at existing Centers: +10Members at existing Centers: +10
PDF created with pdfFactory Pro trial version www.pdffactory.com
Page 19 IUCRC June 2008
Industry/University Cooperative
Research Centers
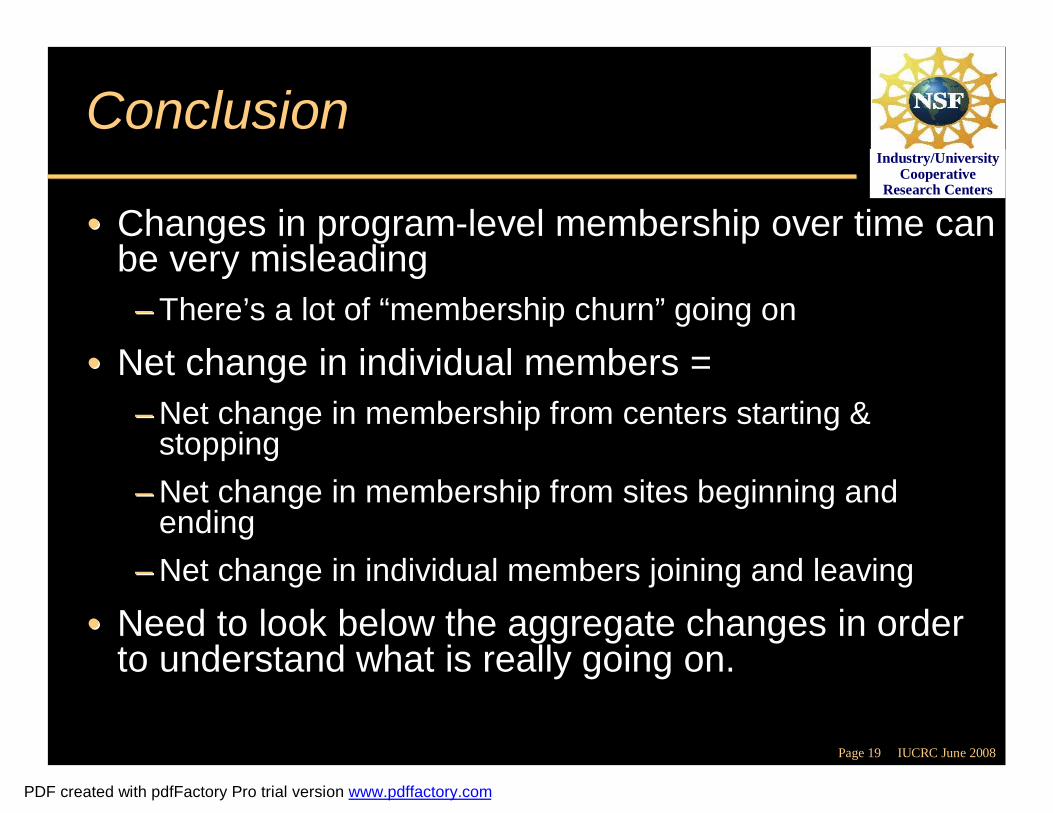
Conclusion
•• Changes in programChanges in program--level membership over time can level membership over time can be very misleadingbe very misleading
–– ThereThere’’s a lot of s a lot of ““membership churnmembership churn”” going ongoing on
•• Net change in individual members =Net change in individual members =–– Net change in membership from centers starting & Net change in membership from centers starting &
stoppingstopping–– Net change in membership from sites beginning and Net change in membership from sites beginning and
endingending–– Net change in individual members joining and leavingNet change in individual members joining and leaving
•• Need to look below the aggregate changes in order Need to look below the aggregate changes in order to understand what is really going on.to understand what is really going on.
PDF created with pdfFactory Pro trial version www.pdffactory.com
Page 20 IUCRC June 2008
Industry/University Cooperative
Research Centers
PROCESS – OUTCOME DATA
PDF created with pdfFactory Pro trial version www.pdffactory.com
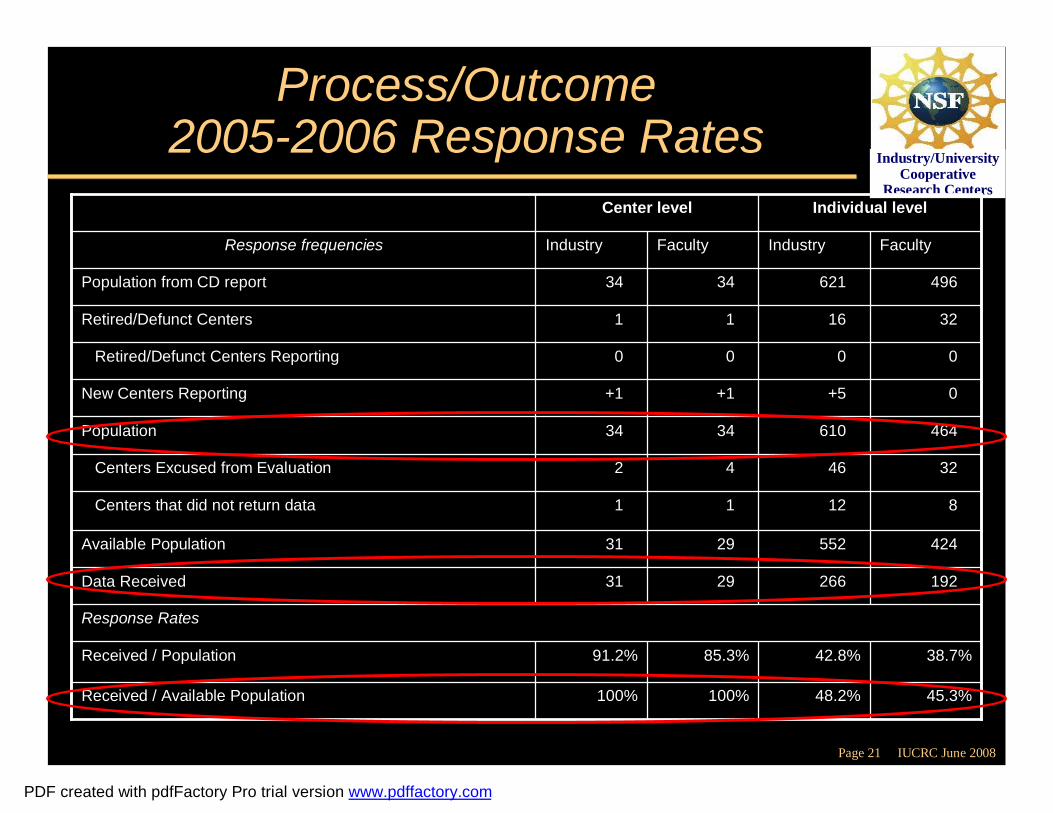
Page 21 IUCRC June 2008
Industry/University Cooperative
Research Centers
Process/Outcome2005-2006 Response Rates
00+5+5+1+1+1+1New Centers ReportingNew Centers Reporting
00000000Retired/Defunct Centers ReportingRetired/Defunct Centers Reporting
45.3%45.3%48.2%48.2%100%100%100%100%Received / Available PopulationReceived / Available Population
38.7%38.7%42.8%42.8%85.3%85.3%91.2%91.2%Received / PopulationReceived / Population
Response RatesResponse Rates
19219226626629293131Data Received Data Received
42442455255229293131Available PopulationAvailable Population
8812121111Centers that did not return dataCenters that did not return data
323246464422Centers Excused from EvaluationCenters Excused from Evaluation
46446461061034343434PopulationPopulation
323216161111Retired/Defunct CentersRetired/Defunct Centers
49649662162134343434Population from CD reportPopulation from CD report
FacultyFacultyIndustryIndustryFacultyFacultyIndustryIndustryResponse frequenciesResponse frequencies
Individual levelIndividual levelCenter levelCenter level
PDF created with pdfFactory Pro trial version www.pdffactory.com
Page 22 IUCRC June 2008
Industry/University Cooperative
Research Centers
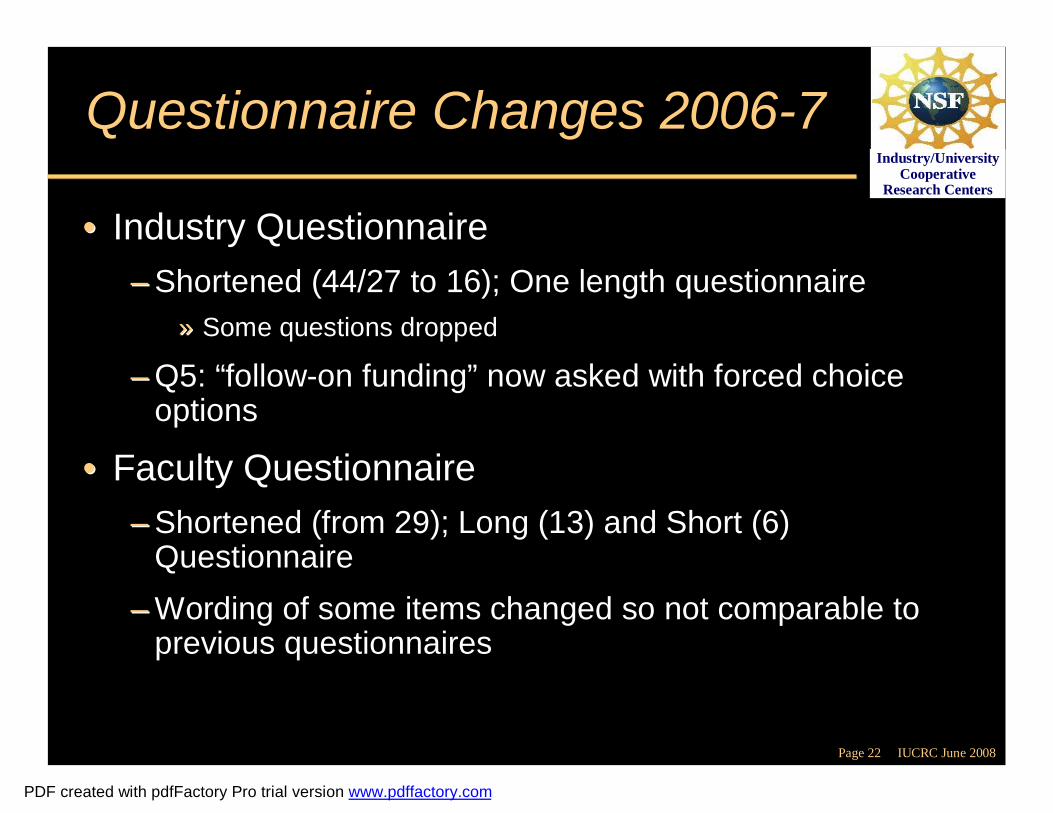
Questionnaire Changes 2006-7
•• Industry Questionnaire Industry Questionnaire –– Shortened (44/27 to 16); One length questionnaireShortened (44/27 to 16); One length questionnaire
»» Some questions droppedSome questions dropped
–– Q5: Q5: ““followfollow--on fundingon funding”” now asked with forced choice now asked with forced choice optionsoptions
•• Faculty QuestionnaireFaculty Questionnaire–– Shortened (from 29); Long (13) and Short (6) Shortened (from 29); Long (13) and Short (6)
QuestionnaireQuestionnaire–– Wording of some items changed so not comparable to Wording of some items changed so not comparable to
previous questionnairesprevious questionnaires
PDF created with pdfFactory Pro trial version www.pdffactory.com
Page 23 IUCRC June 2008
Industry/University Cooperative
Research Centers
Industry Questionnaire
Select ResultsSelect Results
PDF created with pdfFactory Pro trial version www.pdffactory.com
Page 24 IUCRC June 2008
Industry/University Cooperative
Research Centers
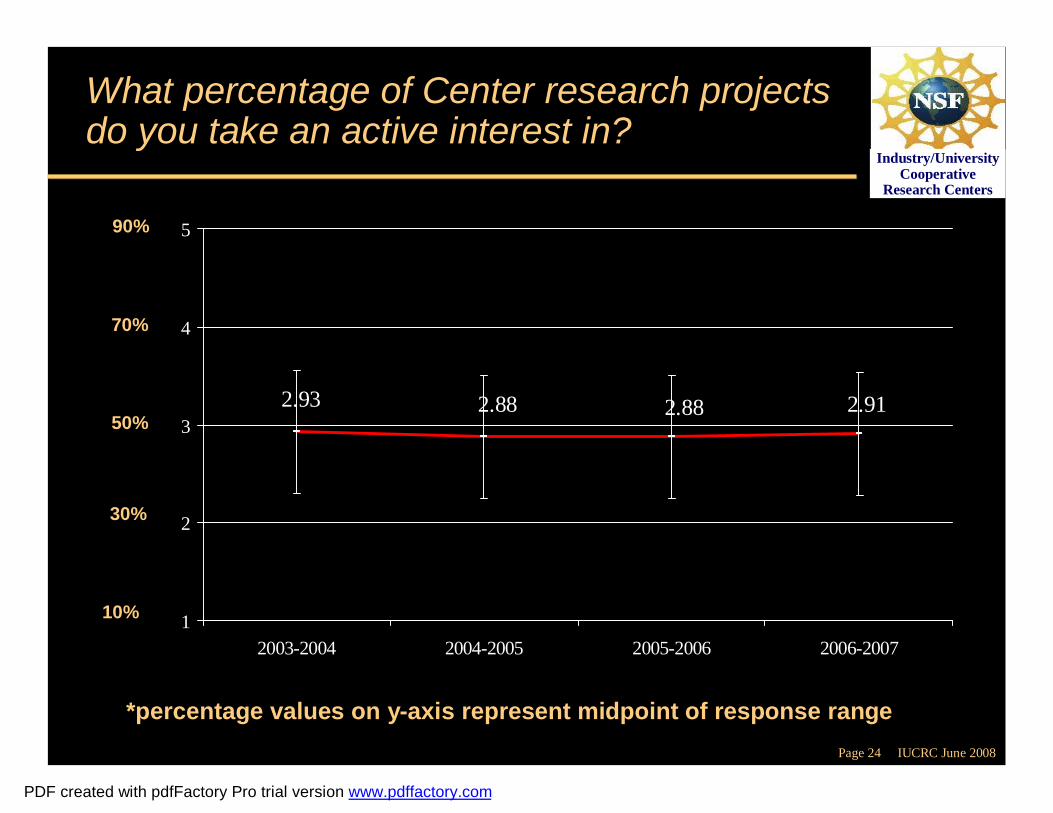
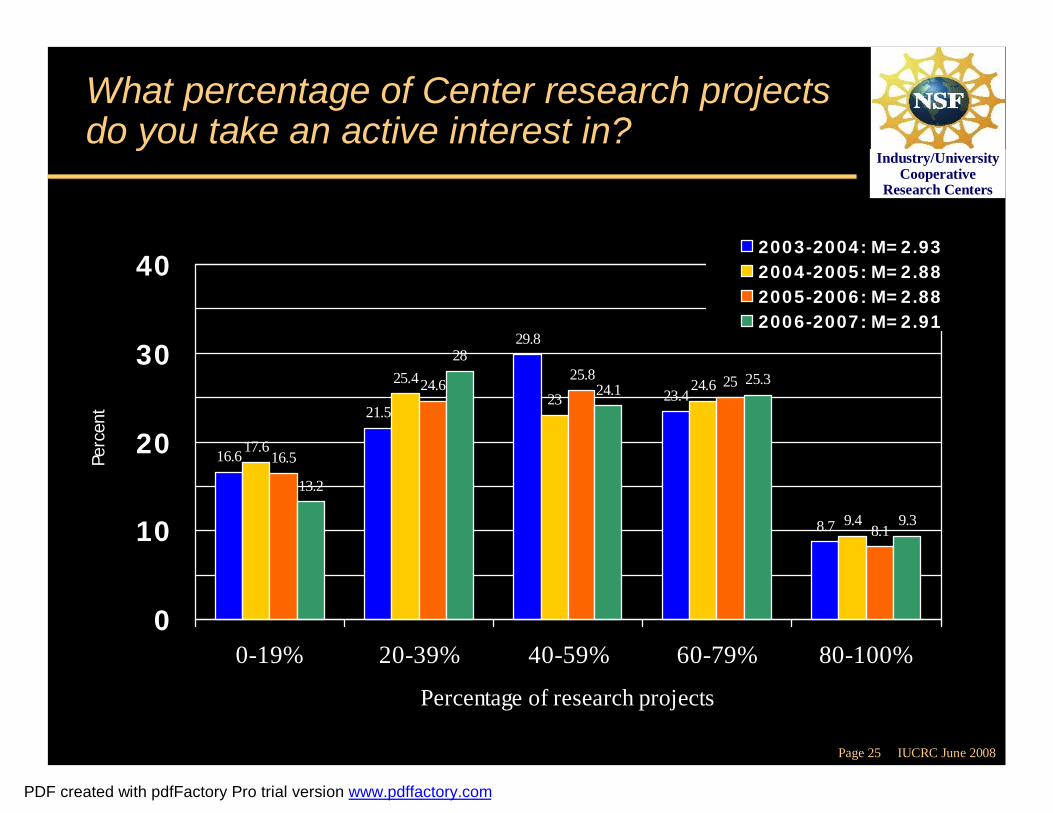
What percentage of Center research projects do you take an active interest in?
2.88 2.912.882.93
1
2
3
4
5
2003-2004 2004-2005 2005-2006 2006-2007
10%
70%
50%
90%
30%
*percentage values on y-axis represent midpoint of response range
PDF created with pdfFactory Pro trial version www.pdffactory.com
Page 25 IUCRC June 2008
Industry/University Cooperative
Research Centers
What percentage of Center research projects do you take an active interest in?
16.6
21.5
29.8
23.4
8.7
17.6
25.423
24.6
9.4
16.5
24.625.8 25
8.1
13.2
28
24.125.3
9.3
0
10
20
30
40
0-19% 20-39% 40-59% 60-79% 80-100%
Percentage of research projects
Perc
ent
2003-2004: M=2.932004-2005: M=2.882005-2006: M=2.882006-2007: M=2.91
PDF created with pdfFactory Pro trial version www.pdffactory.com
Page 26 IUCRC June 2008
Industry/University Cooperative
Research Centers
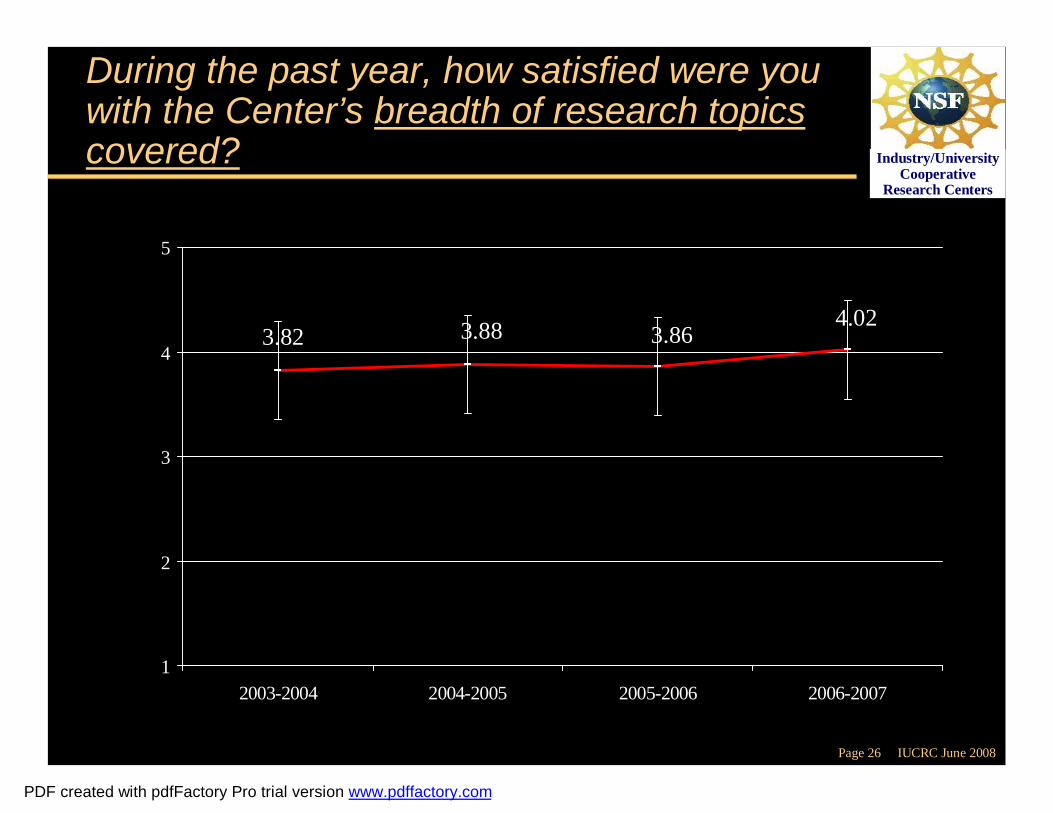
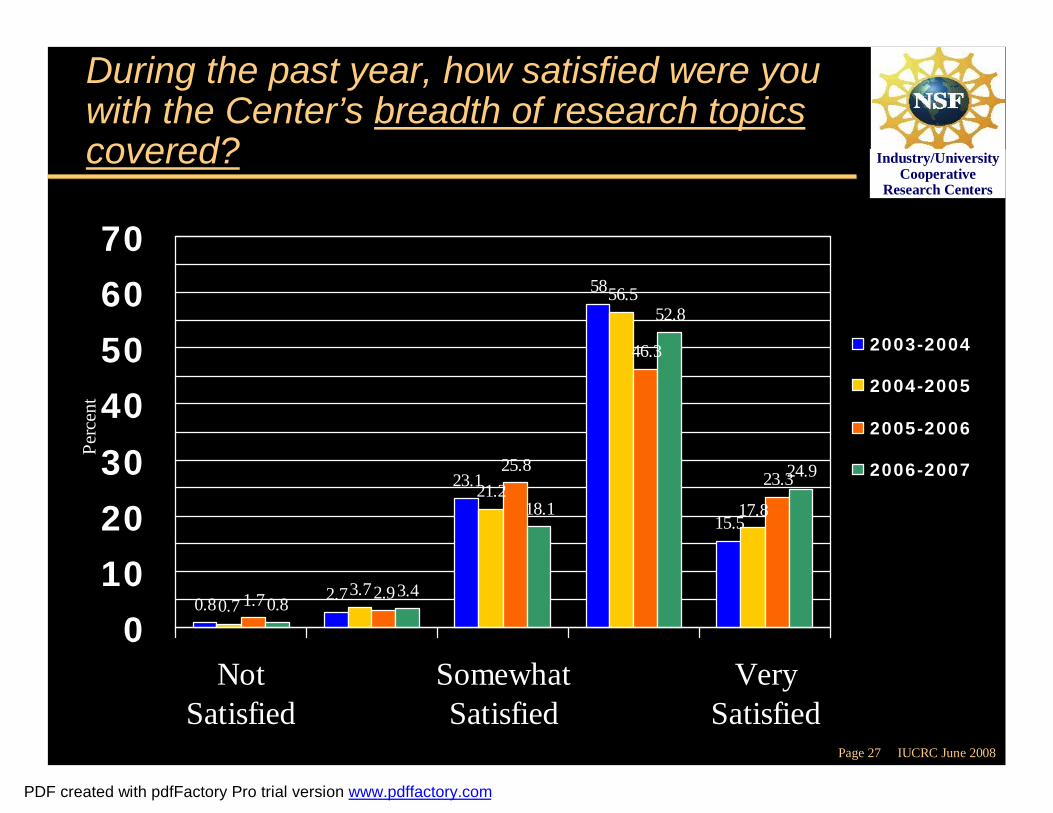
During the past year, how satisfied were you with the Center’s breadth of research topics covered?
3.864.023.883.82
1
2
3
4
5
2003-2004 2004-2005 2005-2006 2006-2007
PDF created with pdfFactory Pro trial version www.pdffactory.com
Page 27 IUCRC June 2008
Industry/University Cooperative
Research Centers
During the past year, how satisfied were you with the Center’s breadth of research topics covered?
0.8 2.7
23.1
58
15.5
0.73.7
21.2
56.5
17.8
1.7 2.9
25.8
46.3
23.3
0.83.4
18.1
52.8
24.9
0102030
40506070
NotSatisfied
SomewhatSatisfied
VerySatisfied
Perc
ent
2003-2004
2004-2005
2005-2006
2006-2007
PDF created with pdfFactory Pro trial version www.pdffactory.com
Page 28 IUCRC June 2008
Industry/University Cooperative
Research Centers
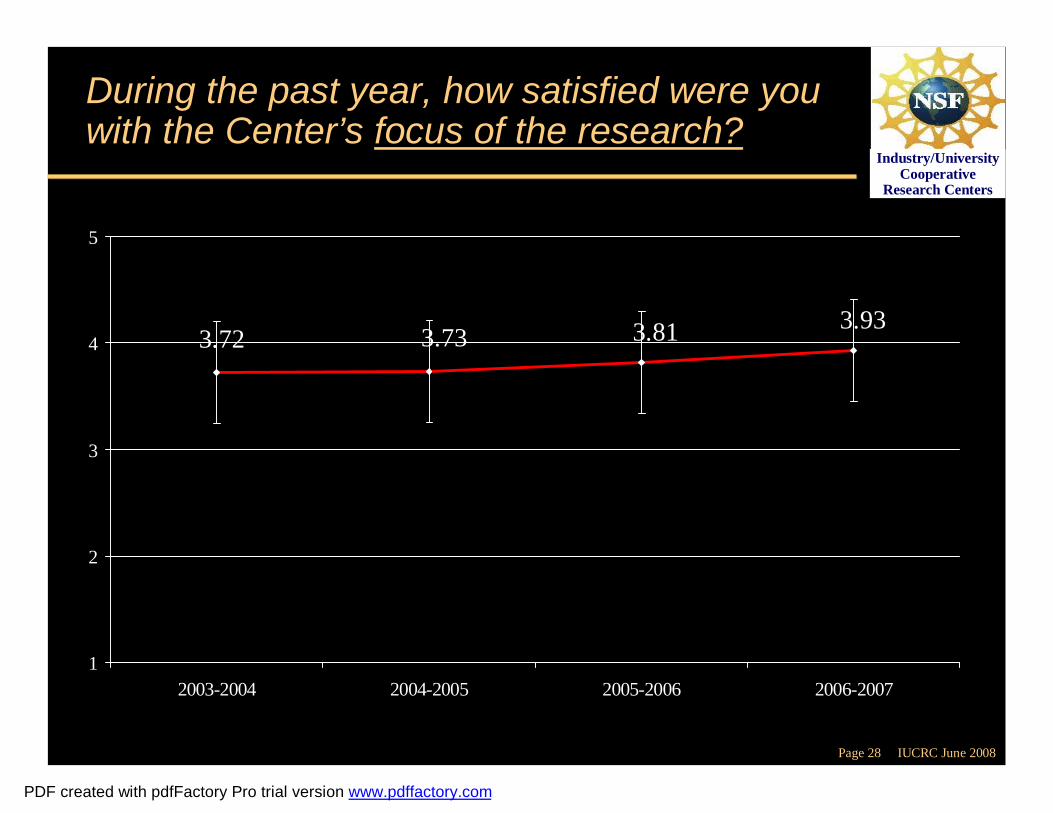
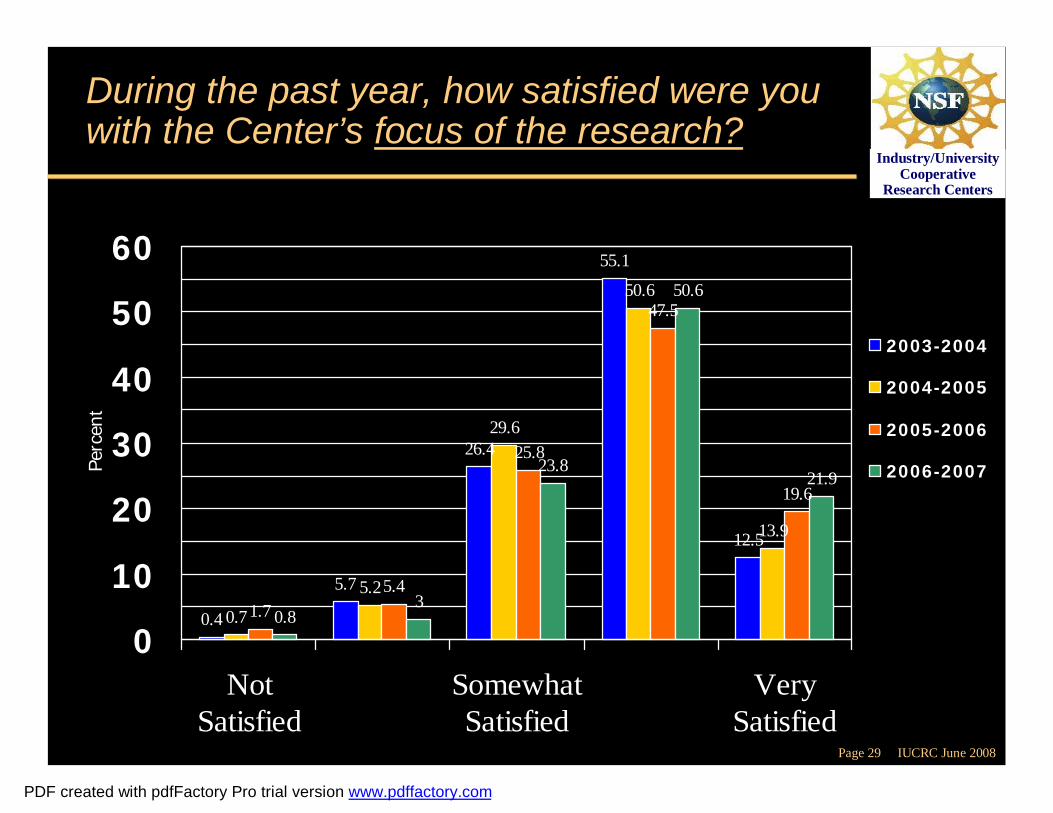
During the past year, how satisfied were you with the Center’s focus of the research?
3.81 3.933.733.72
1
2
3
4
5
2003-2004 2004-2005 2005-2006 2006-2007
PDF created with pdfFactory Pro trial version www.pdffactory.com
Page 29 IUCRC June 2008
Industry/University Cooperative
Research Centers
During the past year, how satisfied were you with the Center’s focus of the research?
0.4
5.7
26.4
55.1
12.5
0.7
5.2
29.6
50.6
13.9
1.75.4
25.8
47.5
19.6
0.83
23.8
50.6
21.9
0
10
20
30
40
50
60
NotSatisfied
SomewhatSatisfied
VerySatisfied
Perc
ent
2003-2004
2004-2005
2005-2006
2006-2007
PDF created with pdfFactory Pro trial version www.pdffactory.com
Page 30 IUCRC June 2008
Industry/University Cooperative
Research Centers
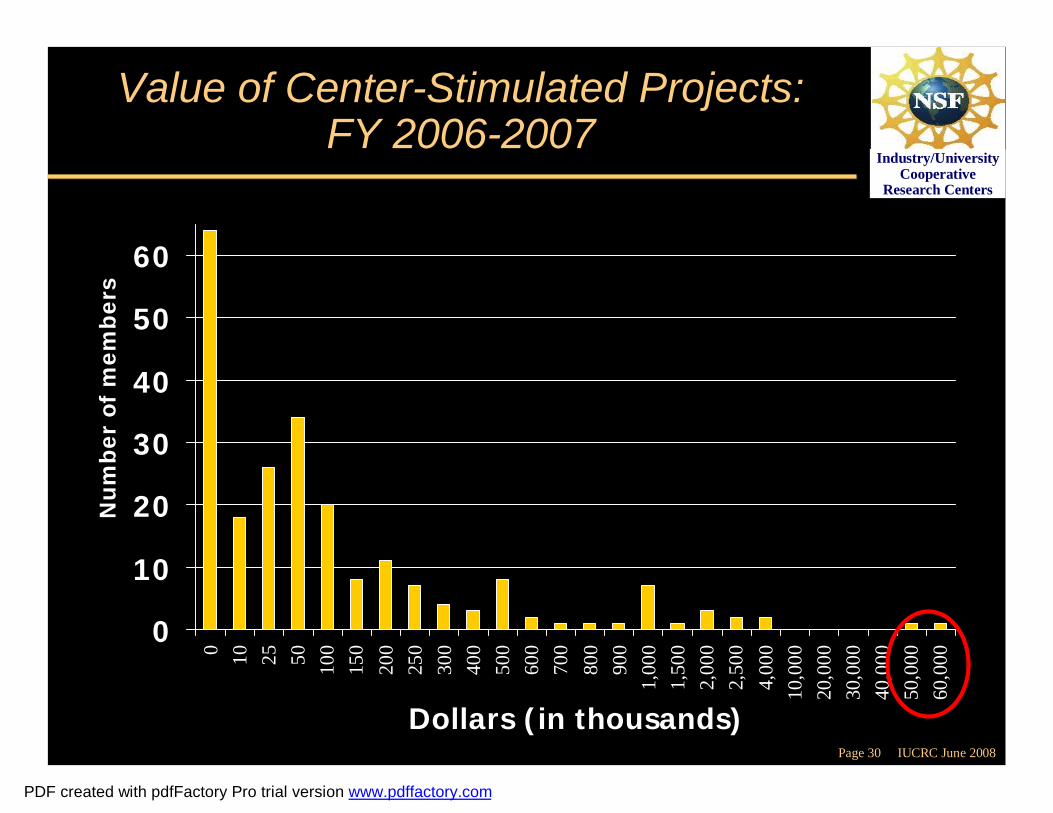
Value of Center-Stimulated Projects: FY 2006-2007
0
10
20
30
40
50
60
0 10 25 50 100
150
200
250
300
400
500
600
700
800
900
1,00
01,
500
2,00
02,
500
4,00
010
,000
20,0
0030
,000
40,0
0050
,000
60,0
00
Dollars (in thousands)
Nu
mb
er o
f m
emb
ers
PDF created with pdfFactory Pro trial version www.pdffactory.com
Page 31 IUCRC June 2008
Industry/University Cooperative
Research Centers
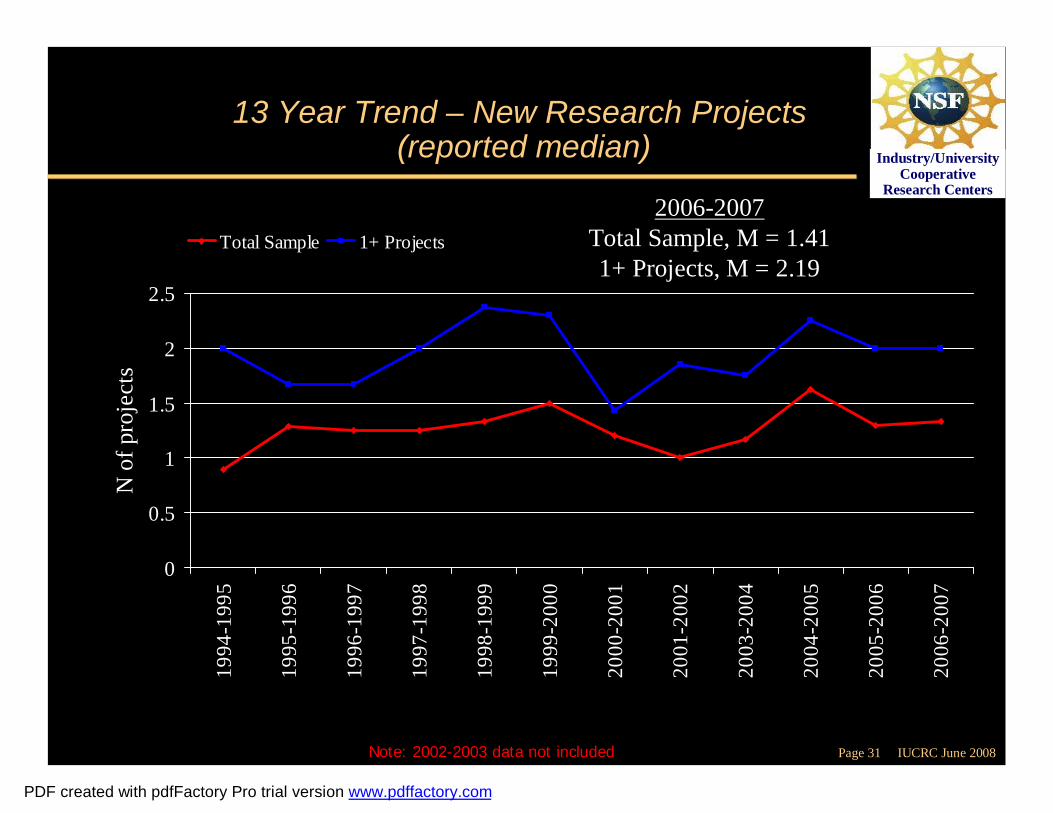
13 Year Trend – New Research Projects (reported median)
0
0.5
1
1.5
2
2.5
1994
-199
5
1995
-199
6
1996
-199
7
1997
-199
8
1998
-199
9
1999
-200
0
2000
-200
1
2001
-200
2
2003
-200
4
2004
-200
5
2005
-200
6
2006
-200
7
N o
f pro
ject
s
Total Sample 1+ Projects
Note: 2002-2003 data not included
2006-2007Total Sample, M = 1.411+ Projects, M = 2.19
PDF created with pdfFactory Pro trial version www.pdffactory.com
Page 32 IUCRC June 2008
Industry/University Cooperative
Research Centers
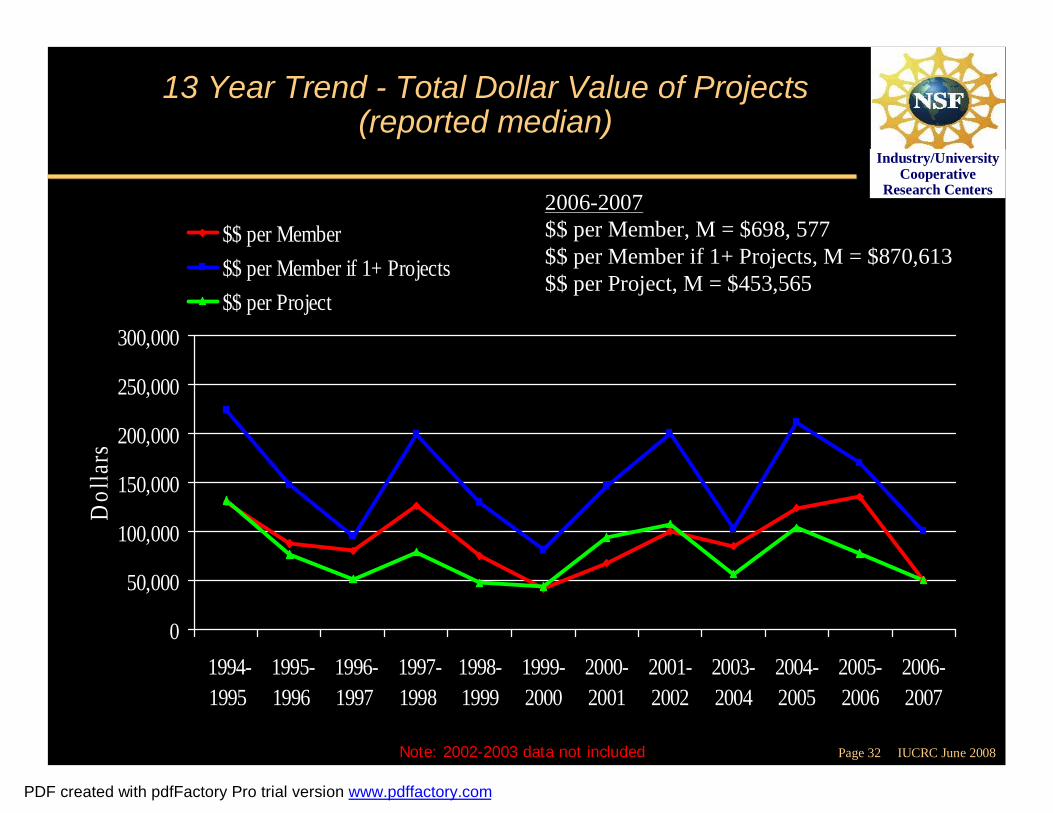
13 Year Trend - Total Dollar Value of Projects(reported median)
0
50,000
100,000
150,000
200,000
250,000
300,000
1994-1995
1995-1996
1996-1997
1997-1998
1998-1999
1999-2000
2000-2001
2001-2002
2003-2004
2004-2005
2005-2006
2006-2007
Dol
lars
$$ per Member $$ per Member if 1+ Projects$$ per Project
Note: 2002-2003 data not included
2006-2007$$ per Member, M = $698, 577$$ per Member if 1+ Projects, M = $870,613$$ per Project, M = $453,565
PDF created with pdfFactory Pro trial version www.pdffactory.com
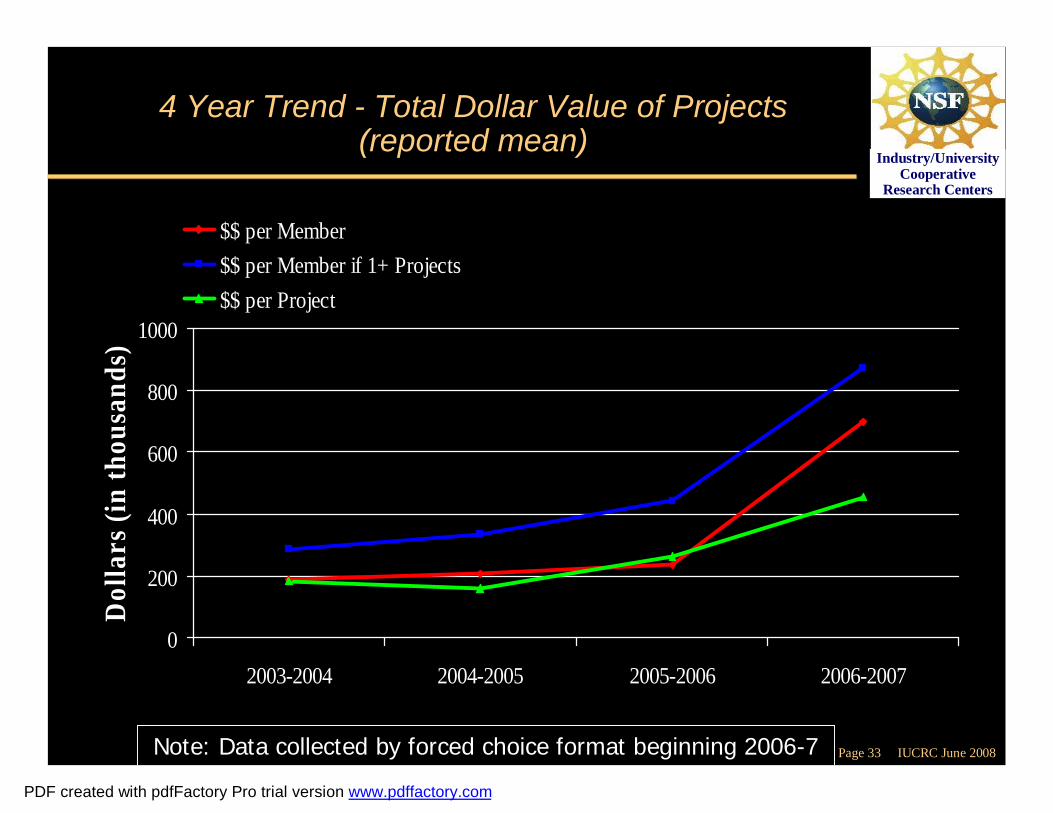
Page 33 IUCRC June 2008
Industry/University Cooperative
Research Centers
4 Year Trend - Total Dollar Value of Projects(reported mean)
0
200
400
600
800
1000
2003-2004 2004-2005 2005-2006 2006-2007
Dol
lars
(in
thou
sand
s)
$$ per Member $$ per Member if 1+ Projects$$ per Project
Note: Data collected by forced choice format beginning 2006-7
PDF created with pdfFactory Pro trial version www.pdffactory.com
Page 34 IUCRC June 2008
Industry/University Cooperative
Research Centers
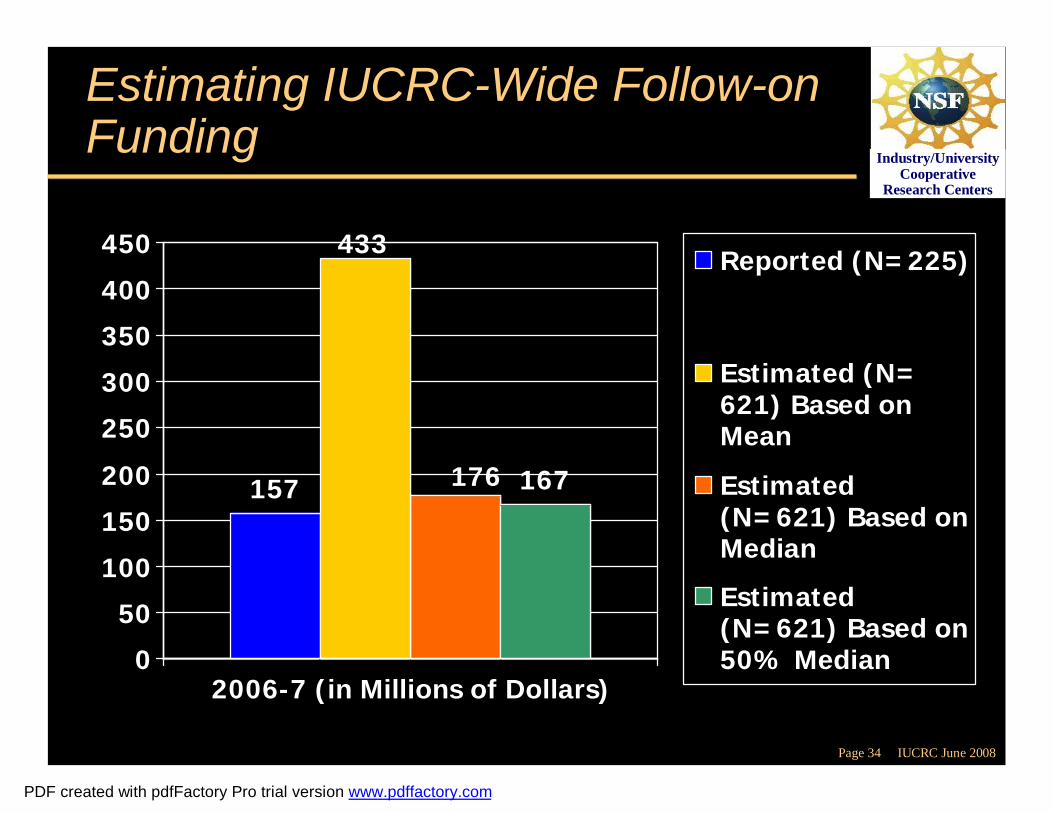
Estimating IUCRC-Wide Follow-on Funding
157
433
176 167
0
50
100
150
200
250
300
350
400
450
2006-7 (in Millions of Dollars)
Reported (N=225)
Estimated (N=621) Based onMean
Estimated (N=621) Based onMedian
Estimated (N=621) Based on50% Median
192
PDF created with pdfFactory Pro trial version www.pdffactory.com
Page 35 IUCRC June 2008
Industry/University Cooperative
Research Centers
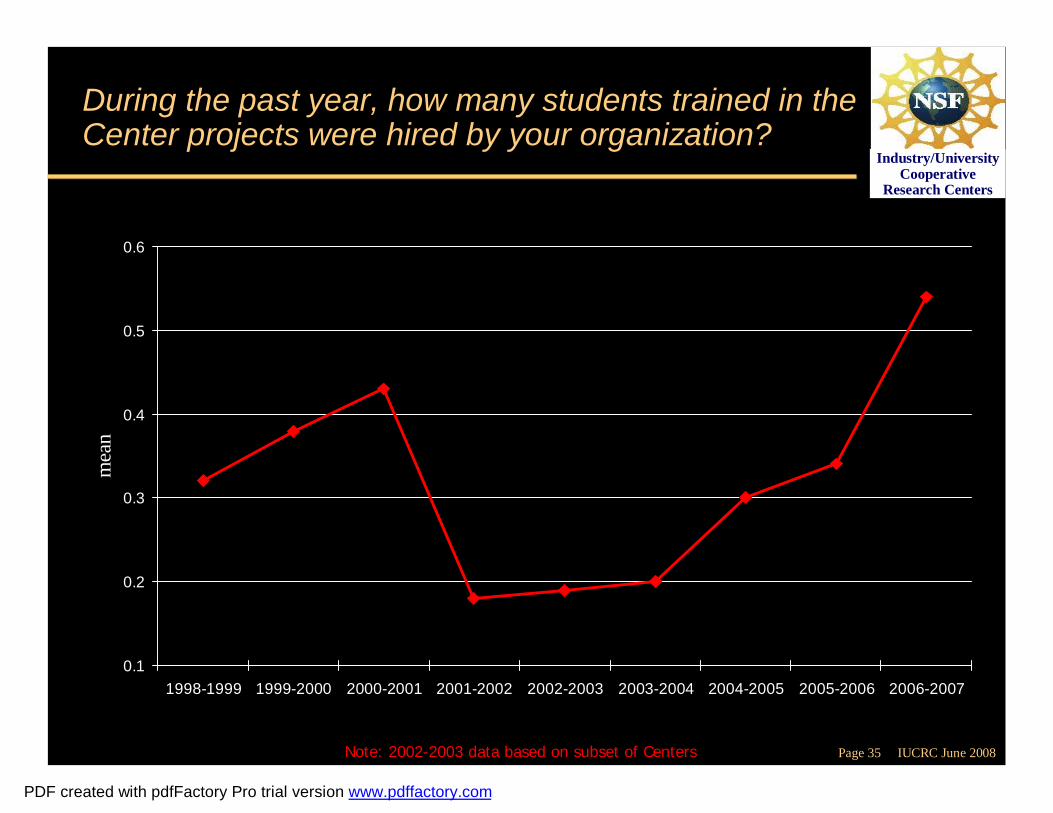
During the past year, how many students trained in the Center projects were hired by your organization?
0.1
0.2
0.3
0.4
0.5
0.6
1998-1999 1999-2000 2000-2001 2001-2002 2002-2003 2003-2004 2004-2005 2005-2006 2006-2007
mea
n
Note: 2002-2003 data based on subset of Centers
PDF created with pdfFactory Pro trial version www.pdffactory.com
Page 36 IUCRC June 2008
Industry/University Cooperative
Research Centers
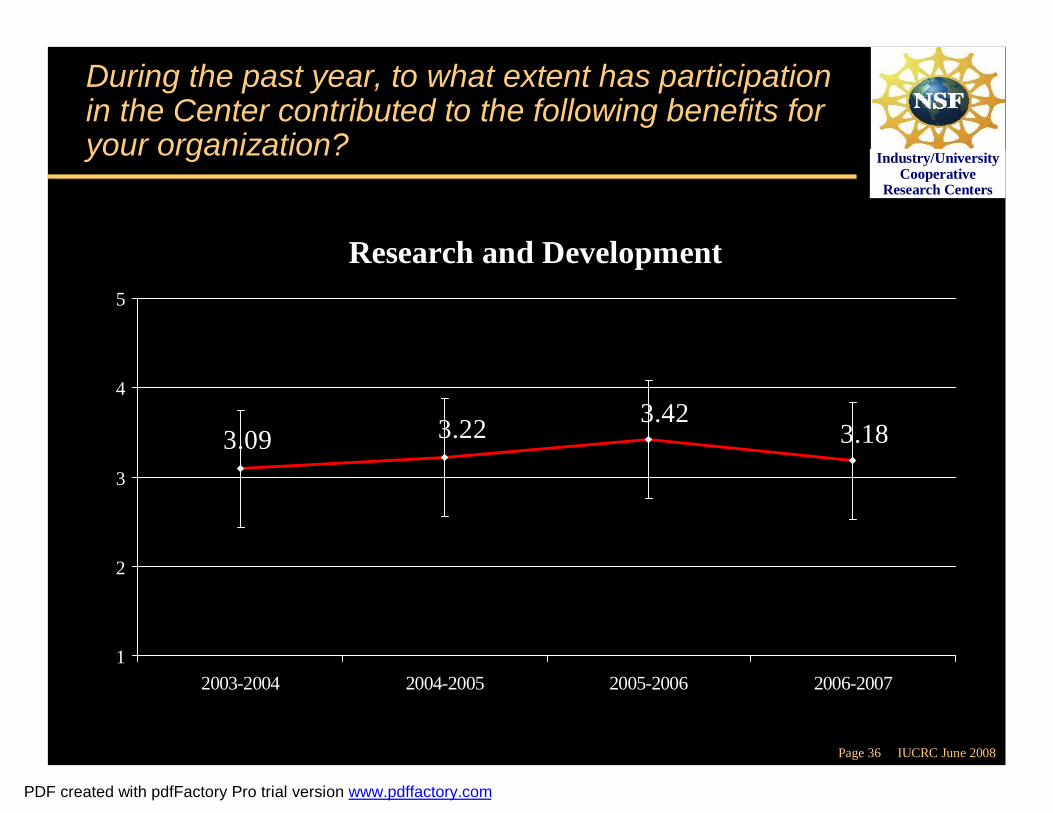
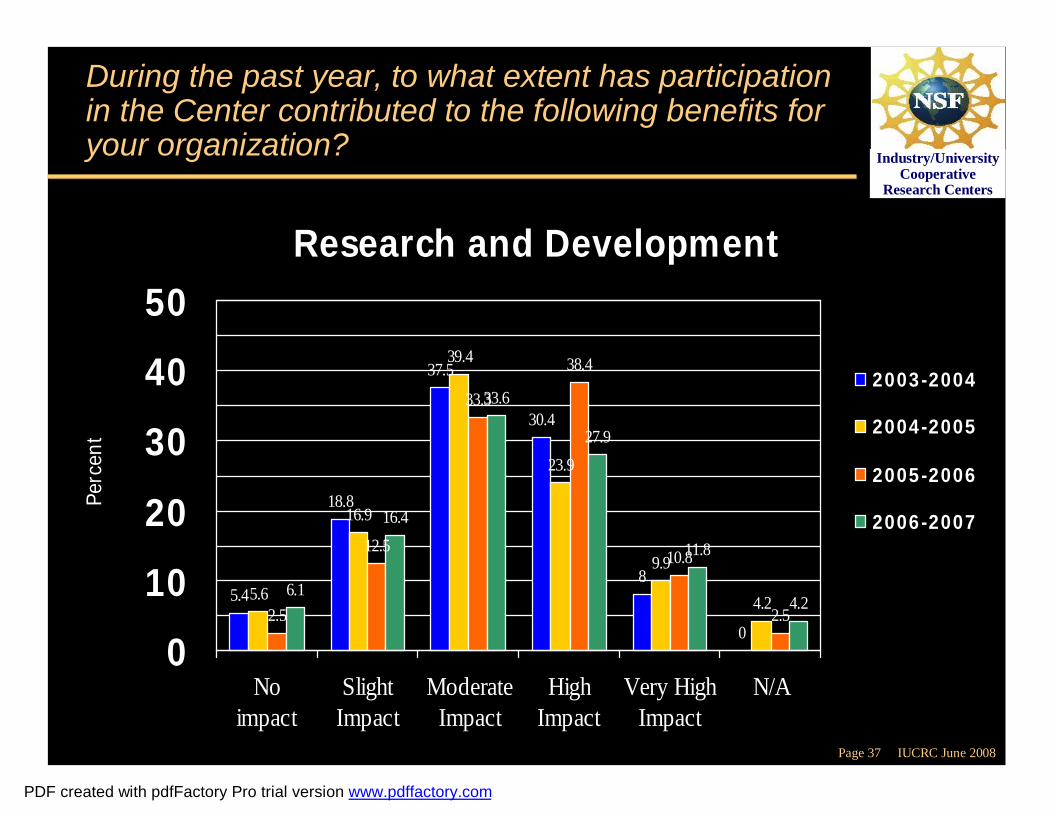
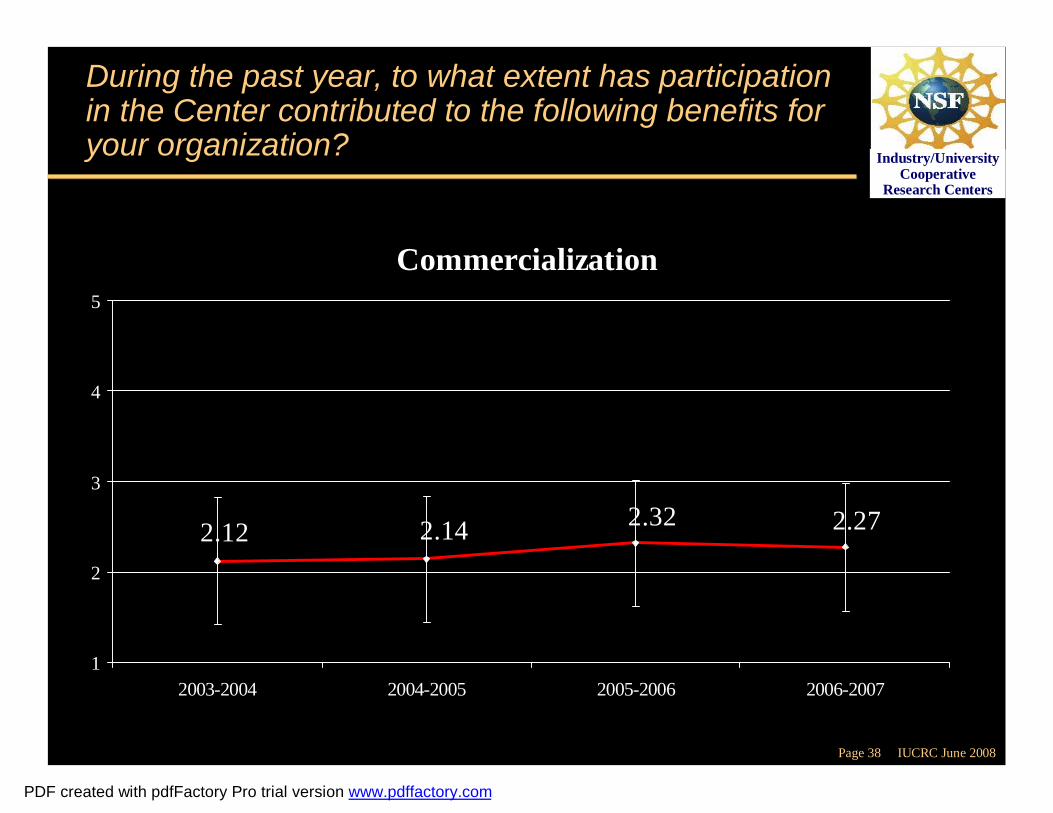
During the past year, to what extent has participation in the Center contributed to the following benefits for your organization?
Research and Development
3.423.183.223.09
1
2
3
4
5
2003-2004 2004-2005 2005-2006 2006-2007
PDF created with pdfFactory Pro trial version www.pdffactory.com
Page 37 IUCRC June 2008
Industry/University Cooperative
Research Centers
During the past year, to what extent has participation in the Center contributed to the following benefits for your organization?
Research and Development
5.4
18.8
37.5
30.4
8
0
5.6
16.9
39.4
23.9
9.9
4.22.5
12.5
33.3
38.4
10.8
2.56.1
16.4
33.6
27.9
11.8
4.2
0
10
20
30
40
50
Noimpact
SlightImpact
ModerateImpact
HighImpact
Very HighImpact
N/A
Perc
ent
2003-2004
2004-2005
2005-2006
2006-2007
PDF created with pdfFactory Pro trial version www.pdffactory.com
Page 38 IUCRC June 2008
Industry/University Cooperative
Research Centers
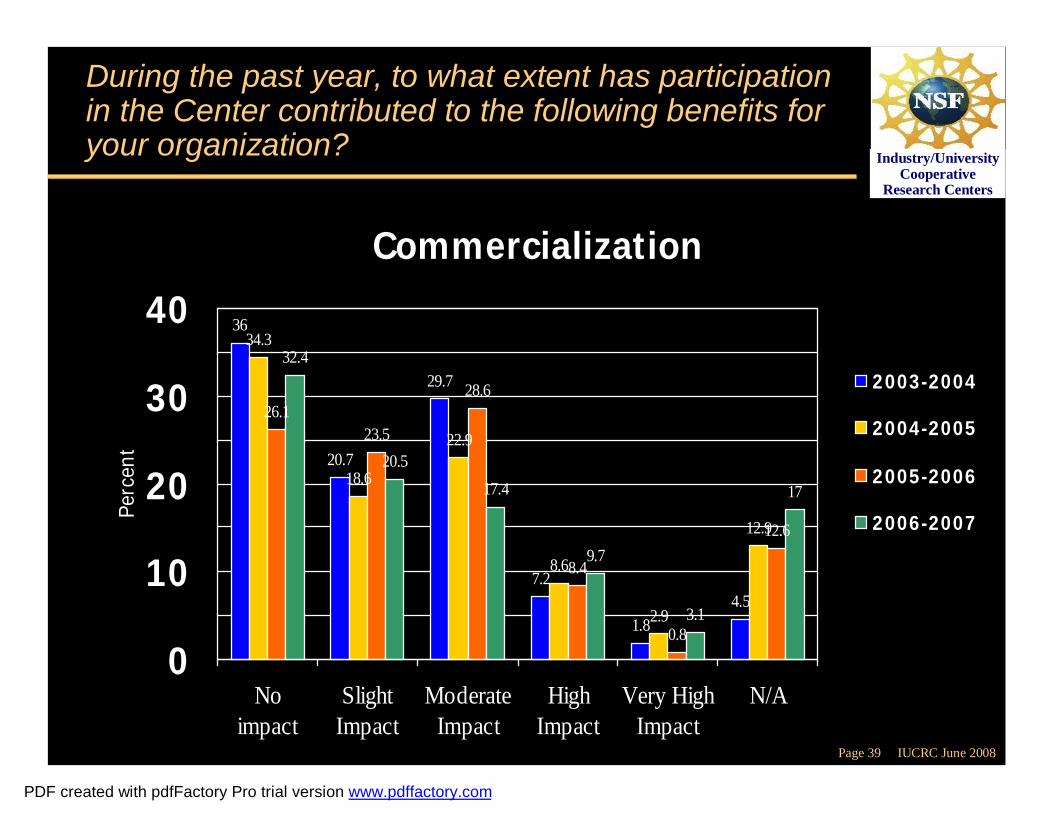
During the past year, to what extent has participation in the Center contributed to the following benefits for your organization?
Commercialization
2.32 2.272.142.12
1
2
3
4
5
2003-2004 2004-2005 2005-2006 2006-2007
PDF created with pdfFactory Pro trial version www.pdffactory.com
Page 39 IUCRC June 2008
Industry/University Cooperative
Research Centers
During the past year, to what extent has participation in the Center contributed to the following benefits for your organization?
Commercialization
36
20.7
29.7
7.2
1.84.5
34.3
18.6
22.9
8.6
2.9
12.9
26.123.5
28.6
8.4
0.8
12.6
32.4
20.517.4
9.7
3.1
17
0
10
20
30
40
Noimpact
SlightImpact
ModerateImpact
HighImpact
Very HighImpact
N/A
Perc
ent
2003-2004
2004-2005
2005-2006
2006-2007
PDF created with pdfFactory Pro trial version www.pdffactory.com
Page 40 IUCRC June 2008
Industry/University Cooperative
Research Centers
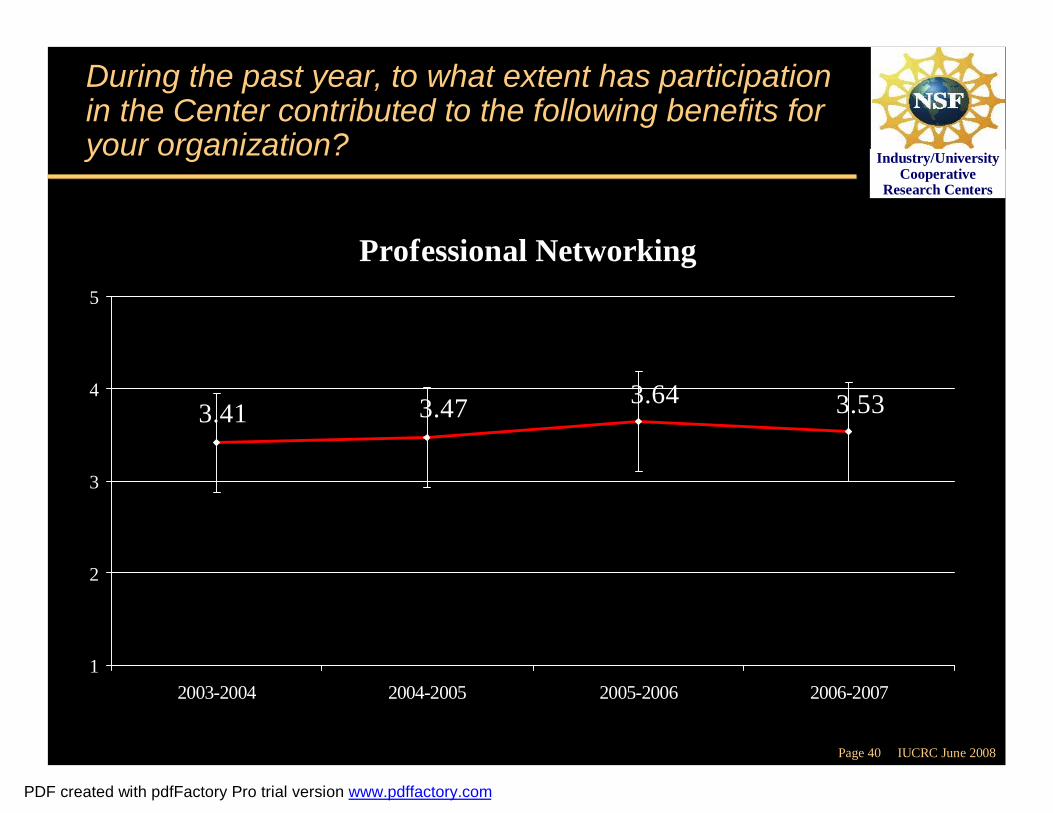
During the past year, to what extent has participation in the Center contributed to the following benefits for your organization?
Professional Networking
3.64 3.533.473.41
1
2
3
4
5
2003-2004 2004-2005 2005-2006 2006-2007
PDF created with pdfFactory Pro trial version www.pdffactory.com
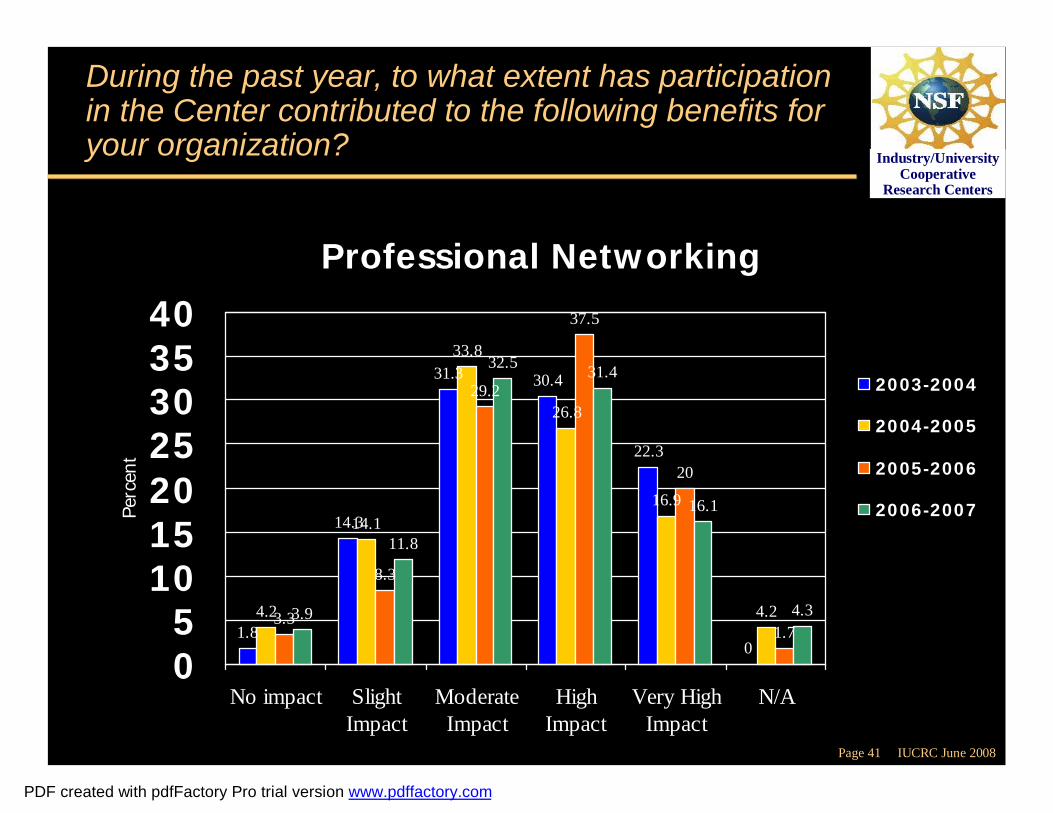
Page 41 IUCRC June 2008
Industry/University Cooperative
Research Centers
During the past year, to what extent has participation in the Center contributed to the following benefits for your organization?
Professional Networking
1.8
14.3
31.3 30.4
22.3
0
4.2
14.1
33.8
26.8
16.9
4.23.3
8.3
29.2
37.5
20
1.73.9
11.8
32.5 31.4
16.1
4.3
05
10152025303540
No impact SlightImpact
ModerateImpact
HighImpact
Very HighImpact
N/A
Perc
ent
2003-2004
2004-2005
2005-2006
2006-2007
PDF created with pdfFactory Pro trial version www.pdffactory.com
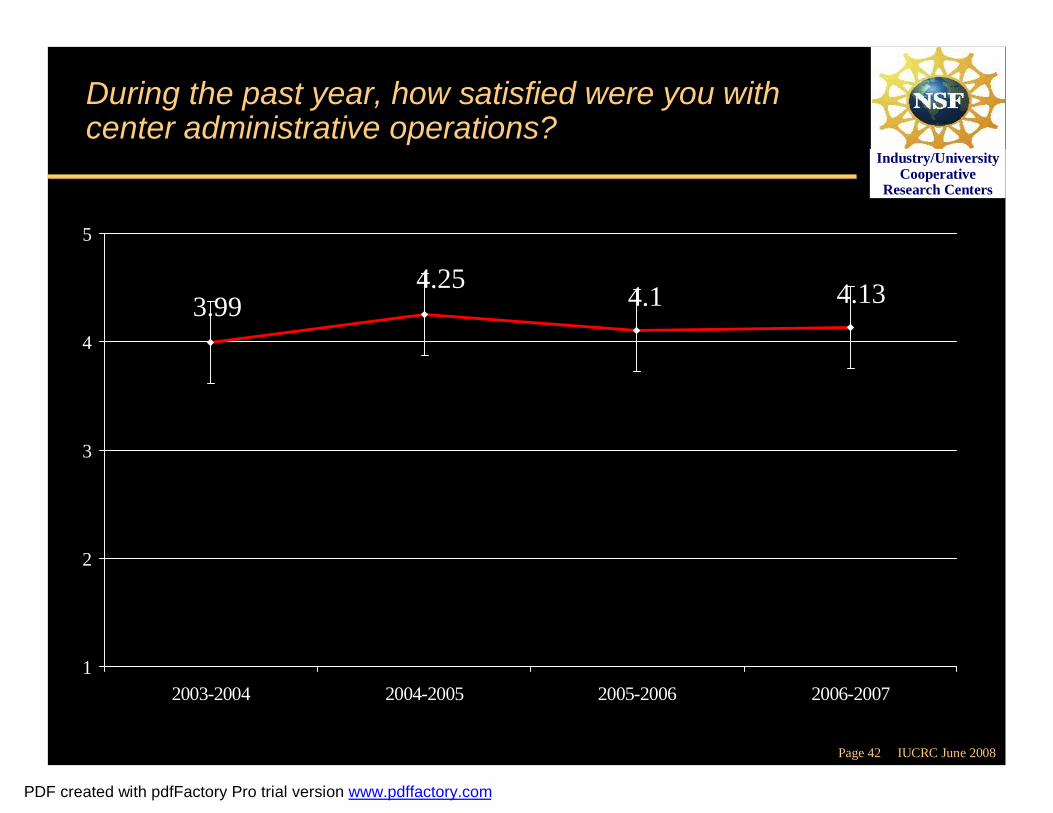
Page 42 IUCRC June 2008
Industry/University Cooperative
Research Centers
During the past year, how satisfied were you with center administrative operations?
4.1 4.134.253.99
1
2
3
4
5
2003-2004 2004-2005 2005-2006 2006-2007
PDF created with pdfFactory Pro trial version www.pdffactory.com
Page 43 IUCRC June 2008
Industry/University Cooperative
Research Centers
During the past year, how satisfied were you with center administrative operations?
0.94.5
12.7
51.8
30
0 0
13
52.2
34.8
0.8 0
14.3
54.6
30.3
02
14.8
52.7
30.5
0
10
20
30
40
50
60
NotSatisfied
SlightlySatisfied
Satisfied QuiteSatisfied
VerySatisfied
Perc
ent
2003-2004
2004-2005
2005-2006
2006-2007
PDF created with pdfFactory Pro trial version www.pdffactory.com
Page 44 IUCRC June 2008
Industry/University Cooperative
Research Centers
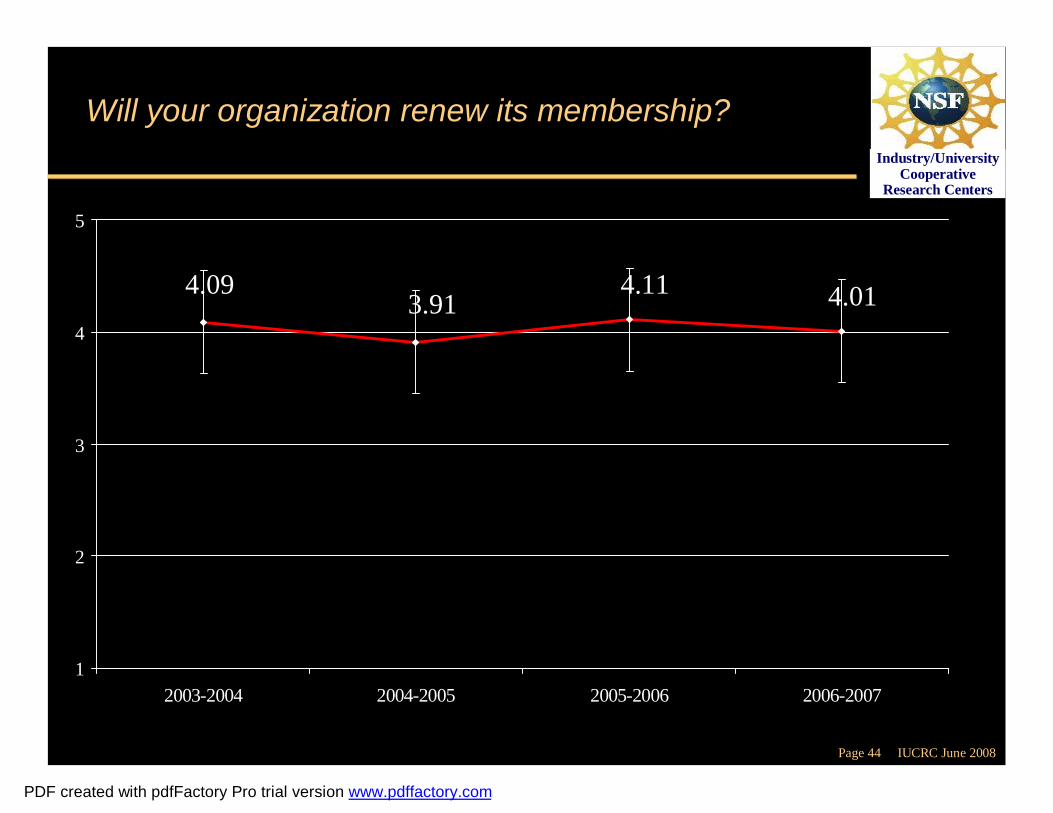
Will your organization renew its membership?
4.11 4.013.914.09
1
2
3
4
5
2003-2004 2004-2005 2005-2006 2006-2007
PDF created with pdfFactory Pro trial version www.pdffactory.com

Page 45 IUCRC June 2008
Industry/University Cooperative
Research Centers
Will your organization renew its membership?
0.83.4
14.4
52.9
28.5
2.3 3.8
16.8
50
27.1
0.4 0.9
14.5
52.8
31.5
1.9 2.3
14.6
50.8
30.4
0
10
20
30
40
50
60
DefinitelyNot
ProbablyNot
Uncertain ProbablyYes
DefinitelyYes
Perc
ent
2003-2004
2004-2005
2005-2006
2006-2007
PDF created with pdfFactory Pro trial version www.pdffactory.com
Page 46 IUCRC June 2008
Industry/University Cooperative
Research Centers
Faculty Questionnaire
Select ResultsSelect Results
PDF created with pdfFactory Pro trial version www.pdffactory.com
Page 47 IUCRC June 2008
Industry/University Cooperative
Research Centers
Faculty Long and Short Forms
1231236969Sample sizeSample size
19191010# of centers using form# of centers using form
0077# of unique questions# of unique questions
6666# of questions in common# of questions in common
661313# of items# of items
Short FormShort FormLong FormLong Form
PDF created with pdfFactory Pro trial version www.pdffactory.com
Page 48 IUCRC June 2008
Industry/University Cooperative
Research Centers
Compared to the research projects that you typically conduct outside the Center, would you describe your Center-funded research as:
3.563.3
3.53.433.54
1
2
3
4
5
2002-2003 2003-2004 2004-2005 2005-2006 2006-2007
Muc
h m
ore
basi
c----
--M
uch
mor
e ap
plie
d
PDF created with pdfFactory Pro trial version www.pdffactory.com
Page 49 IUCRC June 2008
Industry/University Cooperative
Research Centers
3.763.764.13
3.843.68
1
2
3
4
5
2002-2003 2003-2004 2004-2005 2005-2006 2006-2007
During the past year, how satisfied were you with the quality of center-supported research program?
PDF created with pdfFactory Pro trial version www.pdffactory.com
Page 50 IUCRC June 2008
Industry/University Cooperative
Research Centers
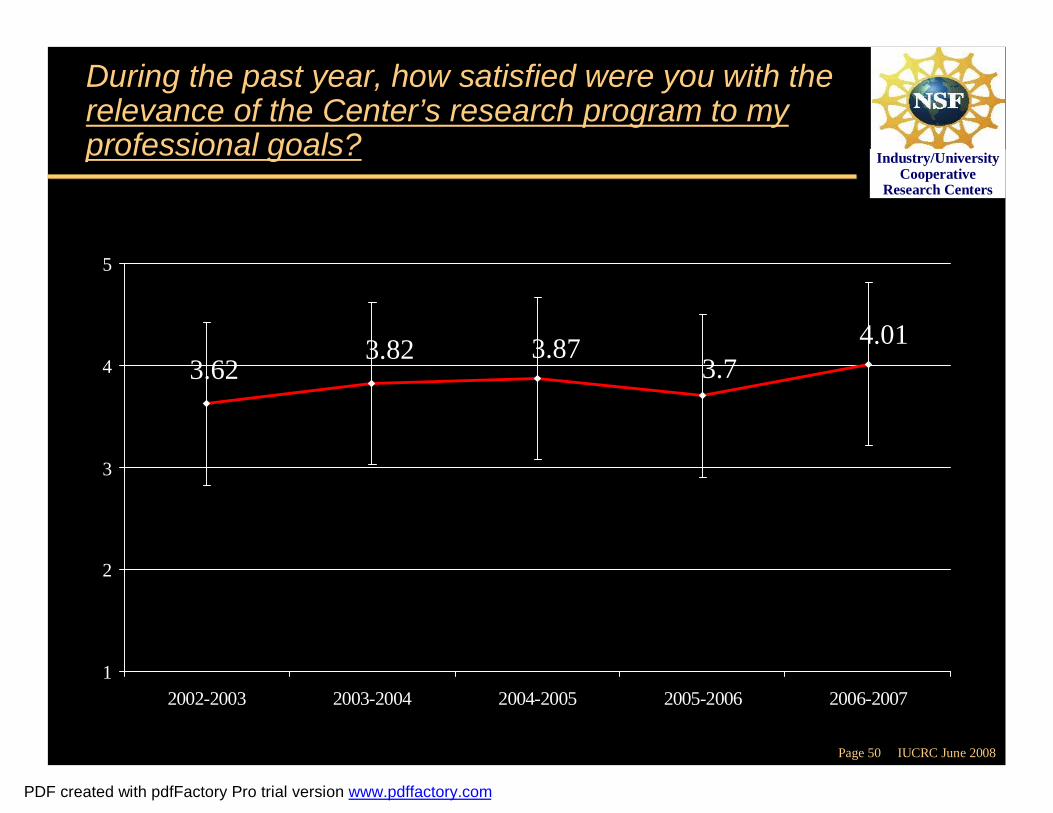
3.73.87 4.013.82
3.62
1
2
3
4
5
2002-2003 2003-2004 2004-2005 2005-2006 2006-2007
During the past year, how satisfied were you with the relevance of the Center’s research program to my professional goals?
PDF created with pdfFactory Pro trial version www.pdffactory.com
Page 51 IUCRC June 2008
Industry/University Cooperative
Research Centers
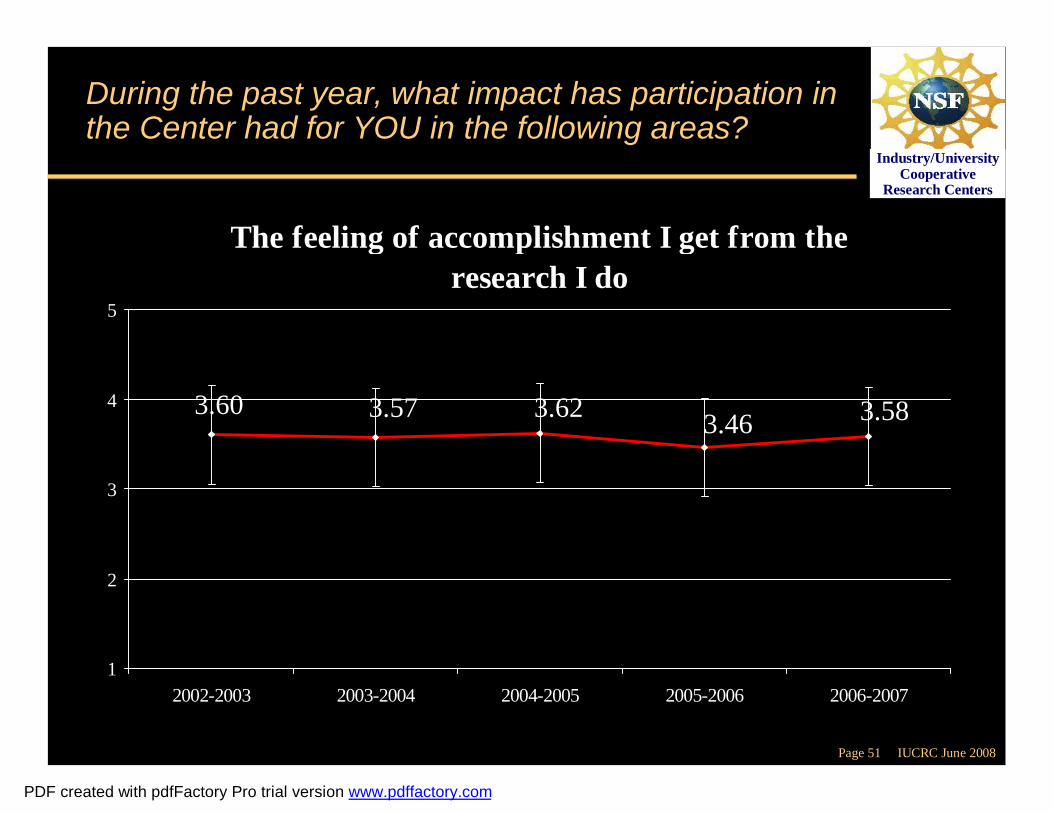
During the past year, what impact has participation in the Center had for YOU in the following areas?
The feeling of accomplishment I get from the research I do
3.463.62 3.583.573.60
1
2
3
4
5
2002-2003 2003-2004 2004-2005 2005-2006 2006-2007
PDF created with pdfFactory Pro trial version www.pdffactory.com
Page 52 IUCRC June 2008
Industry/University Cooperative
Research Centers
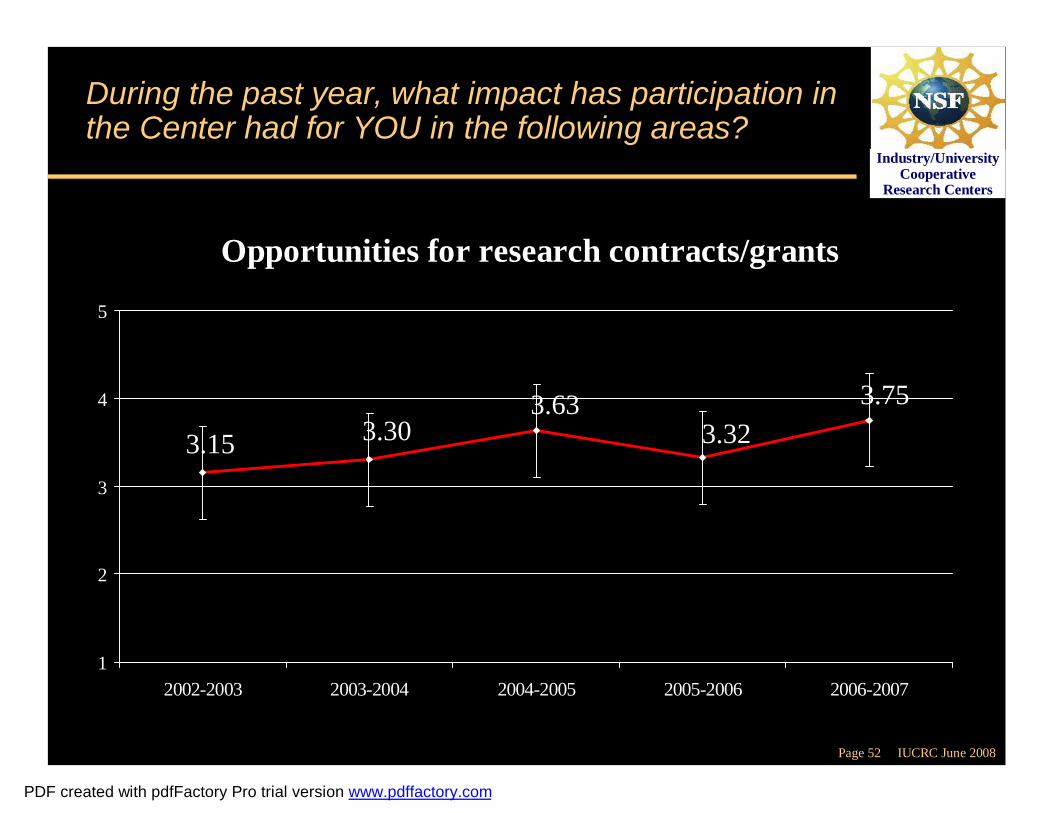
During the past year, what impact has participation in the Center had for YOU in the following areas?
Opportunities for research contracts/grants
3.323.63 3.75
3.303.15
1
2
3
4
5
2002-2003 2003-2004 2004-2005 2005-2006 2006-2007
PDF created with pdfFactory Pro trial version www.pdffactory.com
Page 53 IUCRC June 2008
Industry/University Cooperative
Research Centers
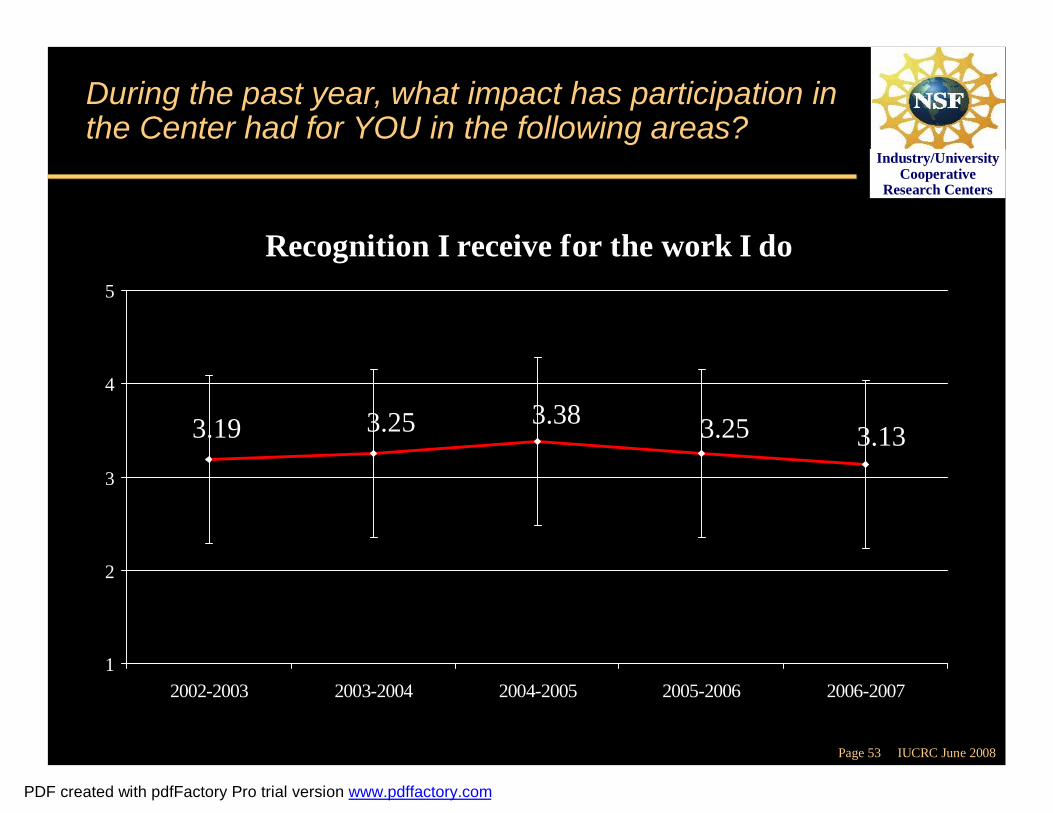
During the past year, what impact has participation in the Center had for YOU in the following areas?
Recognition I receive for the work I do
3.253.383.133.253.19
1
2
3
4
5
2002-2003 2003-2004 2004-2005 2005-2006 2006-2007
PDF created with pdfFactory Pro trial version www.pdffactory.com
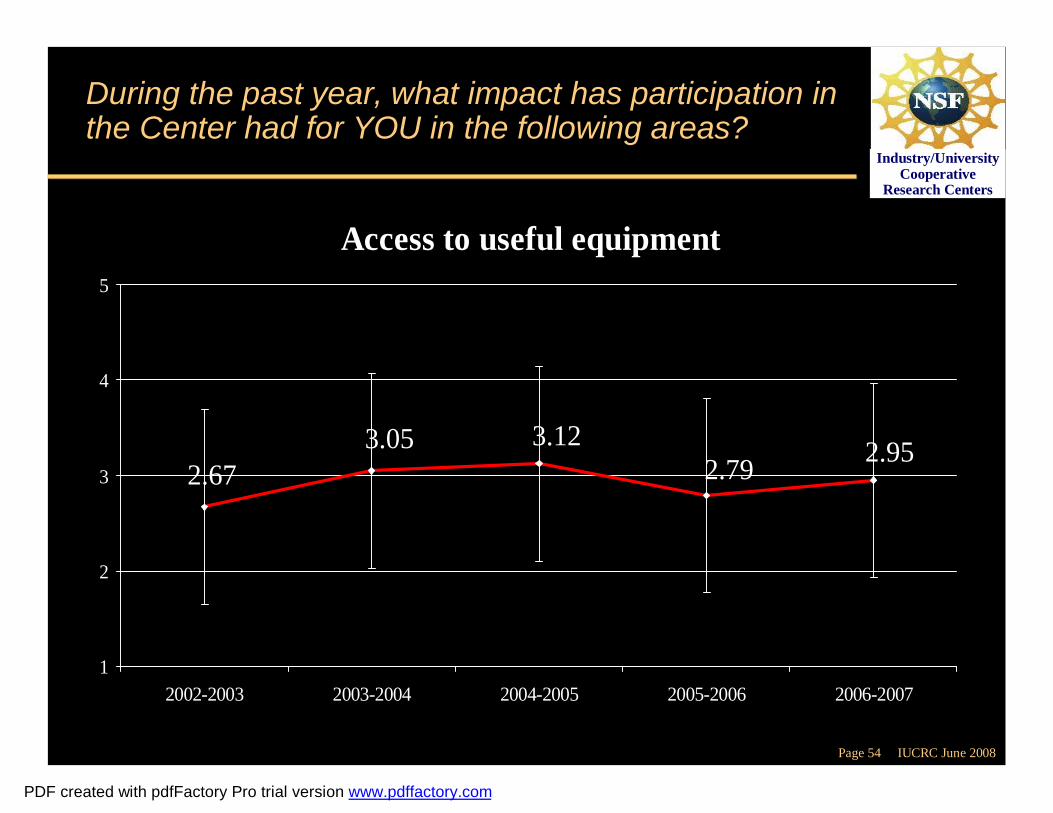
Page 54 IUCRC June 2008
Industry/University Cooperative
Research Centers
During the past year, what impact has participation in the Center had for YOU in the following areas?
Access to useful equipment
2.793.12 2.953.05
2.67
1
2
3
4
5
2002-2003 2003-2004 2004-2005 2005-2006 2006-2007
PDF created with pdfFactory Pro trial version www.pdffactory.com
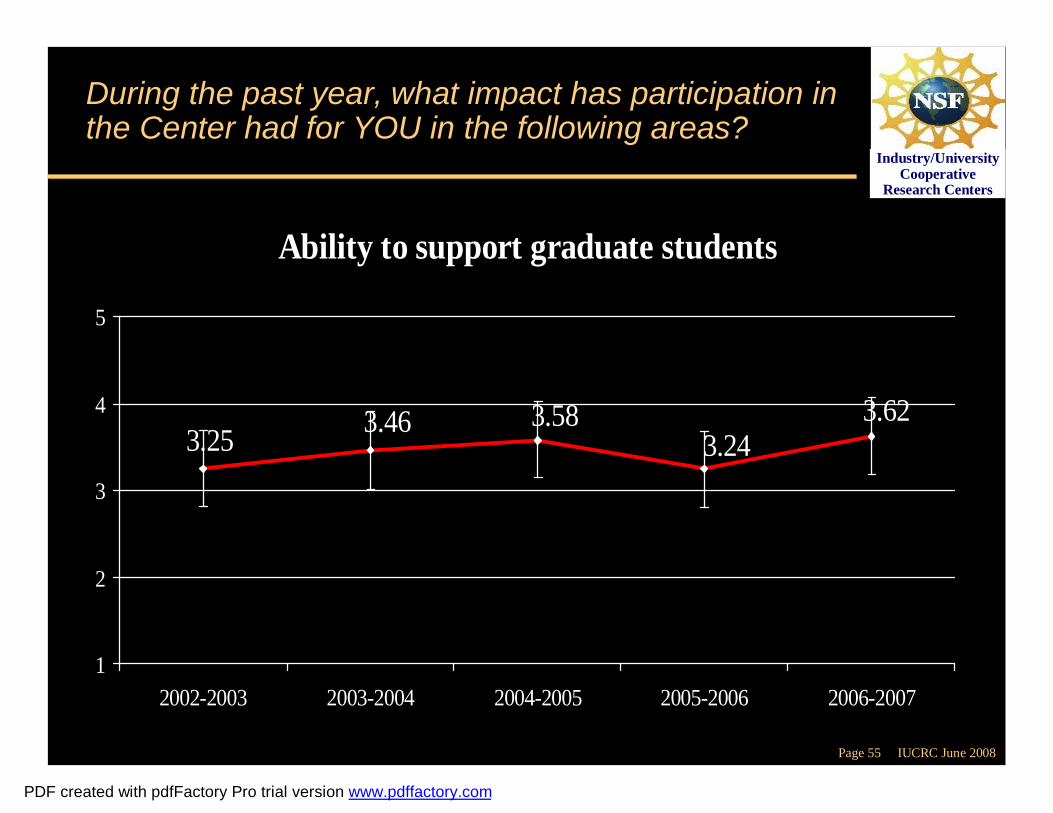
Page 55 IUCRC June 2008
Industry/University Cooperative
Research Centers
During the past year, what impact has participation in the Center had for YOU in the following areas?
Ability to support graduate students
3.243.58 3.623.463.25
1
2
3
4
5
2002-2003 2003-2004 2004-2005 2005-2006 2006-2007
PDF created with pdfFactory Pro trial version www.pdffactory.com
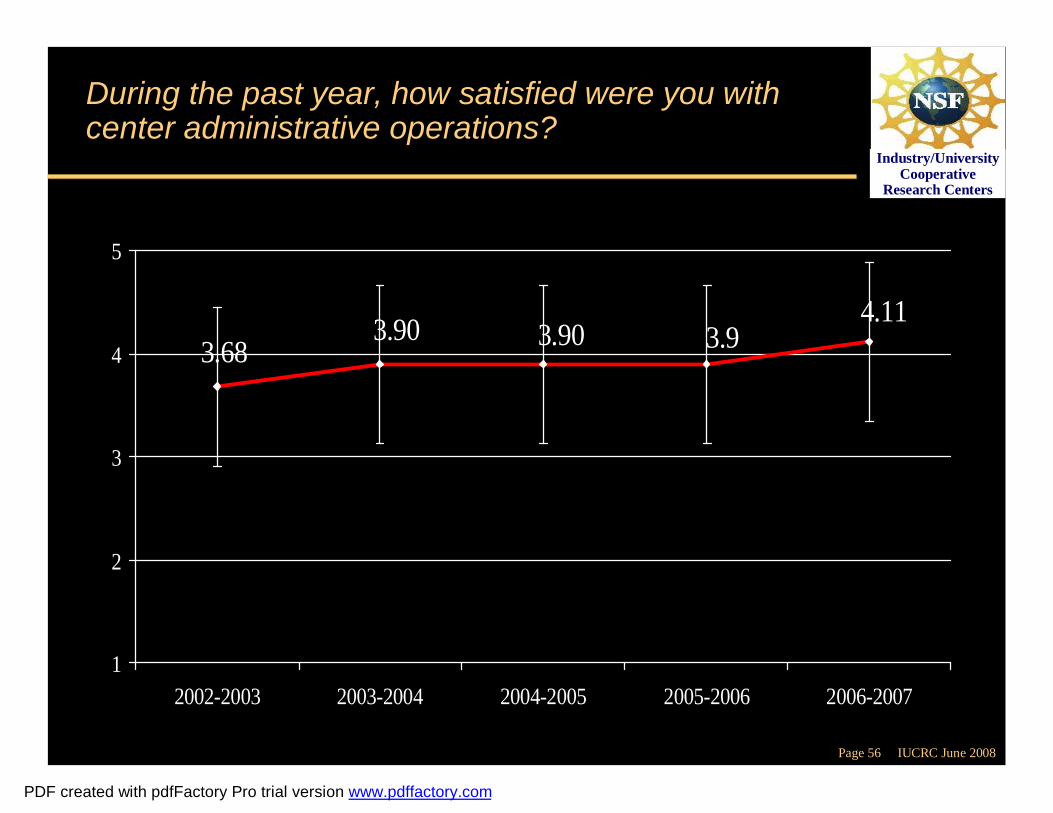
Page 56 IUCRC June 2008
Industry/University Cooperative
Research Centers
During the past year, how satisfied were you with center administrative operations?
3.93.904.113.90
3.68
1
2
3
4
5
2002-2003 2003-2004 2004-2005 2005-2006 2006-2007
PDF created with pdfFactory Pro trial version www.pdffactory.com
Page 57 IUCRC June 2008
Industry/University Cooperative
Research Centers
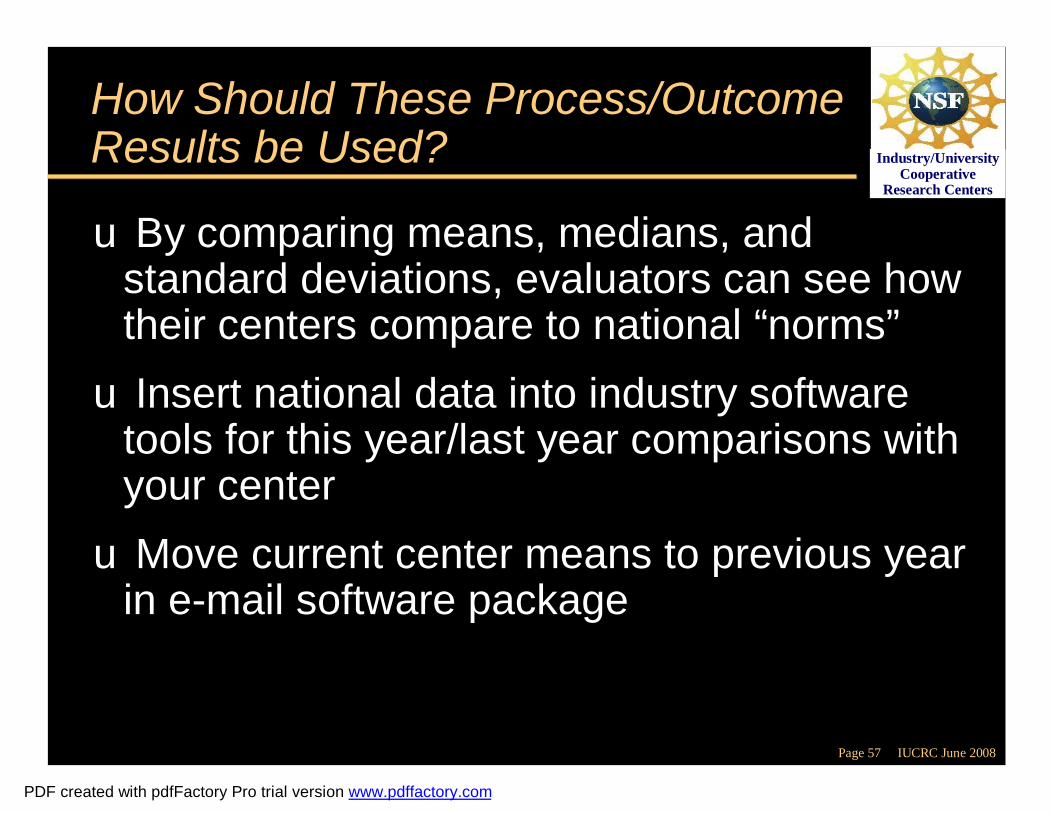
How Should These Process/Outcome Results be Used?
uuBy comparing means, medians, and By comparing means, medians, and standard deviations, evaluators can see how standard deviations, evaluators can see how their centers compare to national their centers compare to national ““normsnorms””uuInsert national data into industry software Insert national data into industry software
tools for this year/last year comparisons with tools for this year/last year comparisons with your centeryour centeruuMove current center means to previous year Move current center means to previous year
in ein e--mail software packagemail software package
PDF created with pdfFactory Pro trial version www.pdffactory.com