VST Tillers Tractors ltd (NSE Code VSTTILLERS) - Katalyst Wealth Alpha Recommendation

08-Aug-17
Key Highlights of the Report:
52wk Range H/L
Mkt Capital (Rs Cr)
Av. Volume (,000)
Financials/Valu
ation
FY15 FY16 FY17 FY18E FY19ENet Sales 4,37,526 3,47,165 3,59,873 3,80,052 3,85,906
EBITDA 10,147 21,057 31,781 33,563 34,080
EBIT 5,618 16,117 25,558 26,205 26,168
PAT 5,273 10,928 19,106 20,111 19,930
1QFY18 4QFY17 3QFY17 EPS (Rs) 11 23 39 41 41
Promoters 57.3 57.3 58.3 EPS growth (%) -25% 107% 75% 5% -1%
Public 42.7 42.7 41.7 ROE (%) 8% 12% 19% 18% 16%
Total 100.0 100.0 100.0 ROCE (%) 6% 14% 21% 20% 18%
BV 140 181 205 231 255
P/B (X) 1.3 1.1 1.9 1.7 1.5
1Mn 3Mn 1Yr P/E (x) 17.0 8.7 9.8 9.5 9.6
Absolute 9.4 51.1 41.1
Rel.to Nifty 5.3 34.3 15.4 RECENT DEVELOPMENT:
CMP 430
IndianOil and LanzaTech sign a Statement of Intent to Construct World's
First Refinery Off Gas-to-Bioethanol Production Facility in India.The work
at 40 MTPA facility will begin later this year for installation at IndianOil's
Panipat Refinery at an estimated cost of Rs.350 Cr.
IOC is facing violent protest at its newly proposed LPG terminal at
Puthuvypeen in Kochi which may delay its commissioning. The NGT, vide
its order of April 13, 2017, has reconfirmed its August 2016 order
permitting IOC to continue with the work.
Oil companies to bear merchant discount rate fees on debit card payments
for fuel. The fee is 1% on credit card transactions and 0.25-1% on debit
card transactions.
We expect core GRM to remain under pressure due to uncertainities in the
crude oil prices.
Target Price 445
Previous Target Price 445
RoE to maintain over 16% in FY19E
2,09,435
600
Upside 3%
450/265
INDUSTRY - OIL MARKETING
BSE Code - 530965
NSE Code - IOCNIFTY - 10066
Weak operational performance has lowered GRM to 4.32 USD/BBL vs
9.98 USD/BBL in the same period in FY17.
Rupee appreciation against dollar and decline in crude oil prices remained
major concern in 1QFY18.
Management expects 60km Jharsuguda-Ranchi pipeline to be
commissioned in FY18 which will increase volume from Paradip refinery.
Currently, the stock is trading at 1.5x FY19E P/BV. We maintain
‘NEUTRAL' rating in this stock with the target price of Rs.445.
ADITYA [email protected]
Narnolia Securities LtdPlease refer to the Disclaimers at the end of this Report
IOC keen to buy 26% stake in GSPC's Mundra LNG terminal. With a view
to expand its gas business, IOC invests Rs. 4500 Cr in Mundra project.
Company Data
Stock Performance %
Shareholding patterns %
7%8%
11%
8%
12%
19%18%
16%
0%
5%
10%
15%
20%
25%ROE
65
75
85
95
105
115
125
135
145
155
165
Jul-1
6
Aug-
16
Sep-
16
Oct
-16
Nov
-16
Dec
-16
Jan-
17
Feb-
17
Mar
-17
Apr-
17
May
-17
Jun-
17
Jul-1
7
IOC NIFTY

F
i
1QFY17 2QFY17 3QFY17 4QFY17 1QFY18 YoY % QoQ% FY16 FY17 YoY %
R
e
16 16 16 17 18 10% 4% 56 65 16%
M
a
20 19 20 21 23 10% 8% 80 80 0%
P
i
21 21 20 20 21 0% -2% 80 82 3%
N
e
86,081 80,370 93,102 1,00,338 1,05,434 22% 8% 3,47,165 3,59,873 4%
O
t
470 854 808 2,060 1,228 161% 155% 2,305 4,209 83%
C
O
63,701 66,330 73,872 79,673 87,825 38% 8% 2,89,365 2,83,576 -2%
E
m
1,772 1,872 1,813 4,202 2,414 36% 132% 7,019 9,658 38%
O
t
6,925 6,397 9,483 12,054 7,196 4% 27% 29,723 34,858 17%
E
B
13,684 5,772 7,934 4,409 8,000 -42% -44% 21,057 31,781 51%
D
e
1,435 1,505 1,554 1,729 1,721 20% 11% 4,940 6,223 26%
I
n
680 615 997 1,154 718 6% 16% 3,101 3,445 11%
P
B
12,039 4,507 6,191 3,585 6,788 -44% -42% 15,321 26,321 72%
T
a
3,770 1,385 2,196 (136) 2,239 -41% -106% 5,758 7,215 25%
P
A
8,269 3,122 3,995 3,721 4,549 -45% -7% 10,928 19,106 75%
Higher Inventory loss resulted into subdued bottom line :
EBITDA margin has delined by 160bps to 7.6% in 1QFY18 mainly due to higher inevntory
loss and lower GRM of 4.32 USD/barrel.
Profit after tax has declined by 45% to Rs. 4549 Cr in 1QFY18 as compared to Rs. 8269 Cr
in the same quarter in FY17 on account of lower refining margins and higher depreciation.
GRM for the quarter is 4.2 USD/barrel vs 9.98 USD/barrel on account of crude price
fluctuations and lower yields.
Compay has reported marketing volume of 20.73 MMT in the Q1FY18, a muted growth of
2% YoY. This muted growth is led by lower demand of Diesel.
Pipeline throughput has increased to 21.35 MMT in Q1FY18, growth of 7% QoQ. This
growth is on account of commissioning of Haldia Baruna pipeline which has been
commissioned in March 17.
Quarterly Performance
Revenue has increased by 22.5% to Rs. 105434 Cr in 1QFY18 as compared to Rs. 86081
Cr in the same quarter in FY17. Revenue has improved on account of increased refinery
throughput by 9% YoY.
Narnolia Securities LtdPlease refer to the Disclaimers at the end of this Report
10
,28
7
66
6
5,3
55
4,7
44
13
,68
4
5,7
72
7,9
34
4,4
09
8,0
00
10%
1%
6% 6%
16%
7%9%
4%
8%
0%
2%
4%
6%
8%
10%
12%
14%
16%
18%
-
2,000
4,000
6,000
8,000
10,000
12,000
14,000
16,000
EBITDA(Rs. Cr.) EBITDA Margin
6,5
91
(45
0)
3,0
96
2,0
06
8,2
69
3,1
22
3,9
95
3,7
21
4,5
49
6%
-1%
4%
3%
10%
4% 4%4%
4%
-2%
0%
2%
4%
6%
8%
10%
12%
(1,000)
-
1,000
2,000
3,000
4,000
5,000
6,000
7,000
8,000
9,000
PAT(Rs. Cr.) PAT Margin
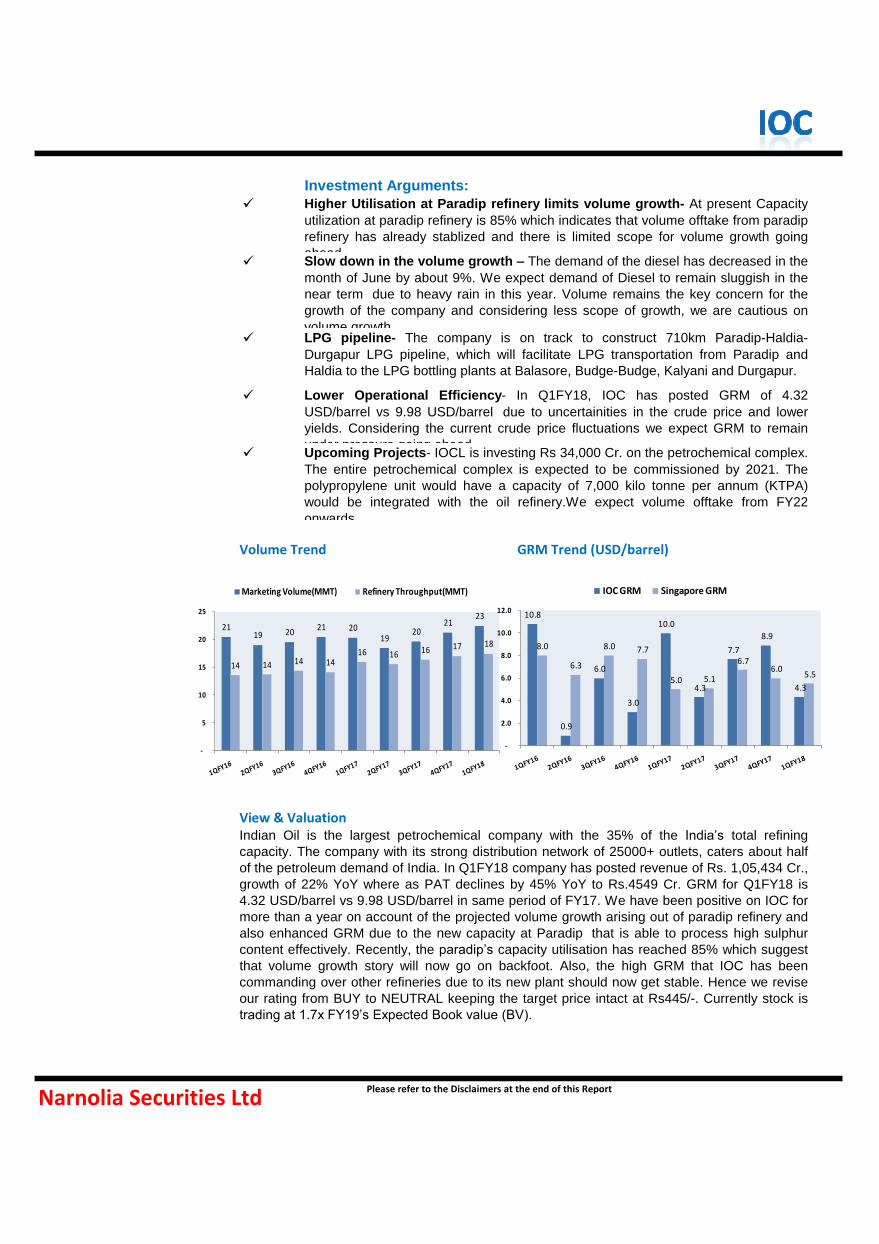
Volume Trend GRM Trend (USD/barrel)
View & Valuation
Slow down in the volume growth – The demand of the diesel has decreased in the
month of June by about 9%. We expect demand of Diesel to remain sluggish in the
near term due to heavy rain in this year. Volume remains the key concern for the
growth of the company and considering less scope of growth, we are cautious on
volume growth.
Narnolia Securities LtdPlease refer to the Disclaimers at the end of this Report
Investment Arguments:
Higher Utilisation at Paradip refinery limits volume growth- At present Capacity
utilization at paradip refinery is 85% which indicates that volume offtake from paradip
refinery has already stablized and there is limited scope for volume growth going
ahead.
LPG pipeline- The company is on track to construct 710km Paradip-Haldia-
Durgapur LPG pipeline, which will facilitate LPG transportation from Paradip and
Haldia to the LPG bottling plants at Balasore, Budge-Budge, Kalyani and Durgapur.
Lower Operational Efficiency- In Q1FY18, IOC has posted GRM of 4.32
USD/barrel vs 9.98 USD/barrel due to uncertainities in the crude price and lower
yields. Considering the current crude price fluctuations we expect GRM to remain
under pressure going ahead.
Indian Oil is the largest petrochemical company with the 35% of the India’s total refining
capacity. The company with its strong distribution network of 25000+ outlets, caters about half
of the petroleum demand of India. In Q1FY18 company has posted revenue of Rs. 1,05,434 Cr.,
growth of 22% YoY where as PAT declines by 45% YoY to Rs.4549 Cr. GRM for Q1FY18 is
4.32 USD/barrel vs 9.98 USD/barrel in same period of FY17. We have been positive on IOC for
more than a year on account of the projected volume growth arising out of paradip refinery and
also enhanced GRM due to the new capacity at Paradip that is able to process high sulphur
content effectively. Recently, the paradip’s capacity utilisation has reached 85% which suggest
that volume growth story will now go on backfoot. Also, the high GRM that IOC has been
commanding over other refineries due to its new plant should now get stable. Hence we revise
our rating from BUY to NEUTRAL keeping the target price intact at Rs445/-. Currently stock is
trading at 1.7x FY19’s Expected Book value (BV).
Upcoming Projects- IOCL is investing Rs 34,000 Cr. on the petrochemical complex.
The entire petrochemical complex is expected to be commissioned by 2021. The
polypropylene unit would have a capacity of 7,000 kilo tonne per annum (KTPA)
would be integrated with the oil refinery.We expect volume offtake from FY22
onwards.
21 19 20
21 20 19
20 21
23
14 14 14 14 16 16 16 17 18
-
5
10
15
20
25
Marketing Volume(MMT) Refinery Throughput(MMT)
10.8
0.9
6.0
3.0
10.0
4.3
7.7
8.9
4.3
8.0
6.3
8.0 7.7
5.0 5.1
6.7 6.0
5.5
-
2.0
4.0
6.0
8.0
10.0
12.0
IOC GRM Singapore GRM
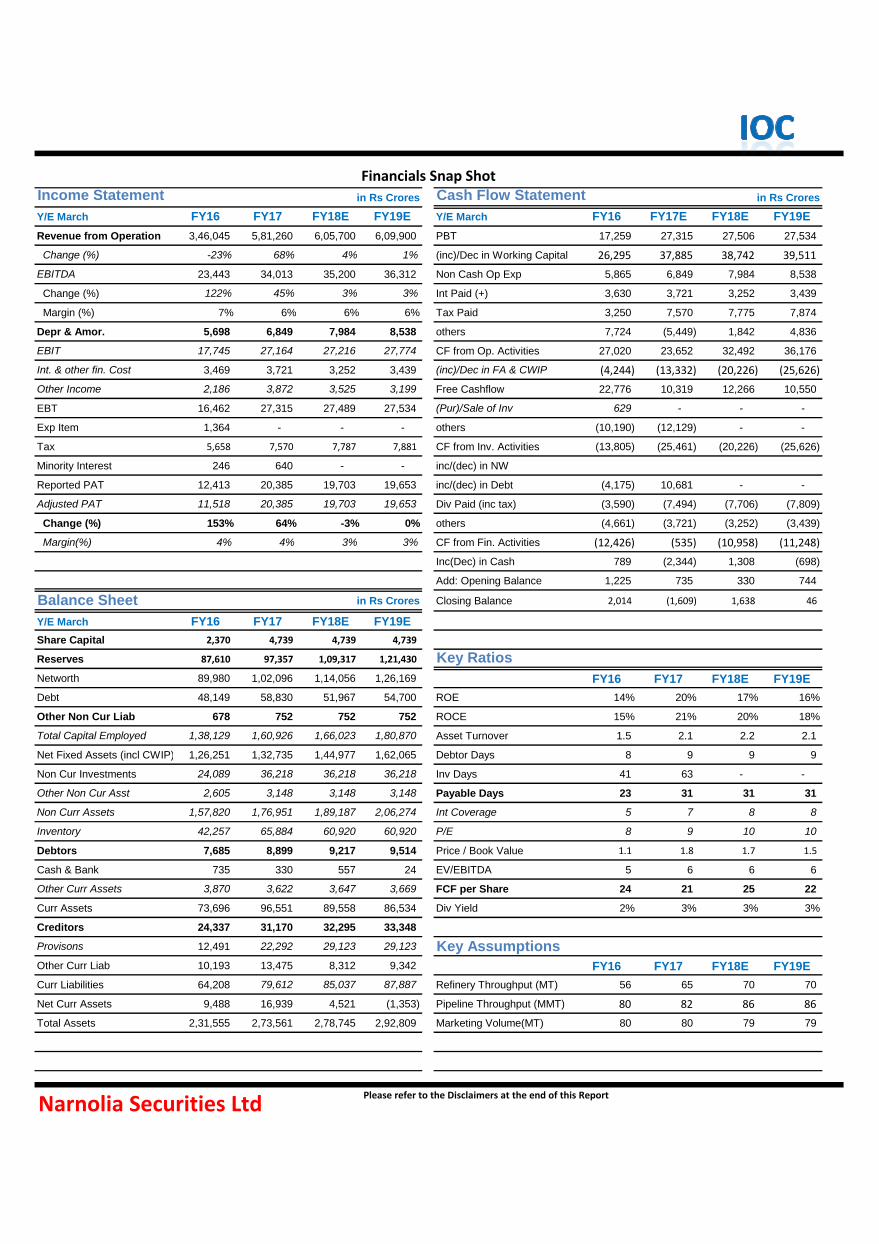
Income Statement in Rs Crores Cash Flow Statement in Rs Crores
Y/E March FY16 FY17 FY18E FY19E Y/E March FY16 FY17E FY18E FY19E
Revenue from Operation 3,46,045 5,81,260 6,05,700 6,09,900 PBT 17,259 27,315 27,506 27,534
Change (%) -23% 68% 4% 1% (inc)/Dec in Working Capital 26,295 37,885 38,742 39,511
EBITDA 23,443 34,013 35,200 36,312 Non Cash Op Exp 5,865 6,849 7,984 8,538
Change (%) 122% 45% 3% 3% Int Paid (+) 3,630 3,721 3,252 3,439
Margin (%) 7% 6% 6% 6% Tax Paid 3,250 7,570 7,775 7,874
Depr & Amor. 5,698 6,849 7,984 8,538 others 7,724 (5,449) 1,842 4,836
EBIT 17,745 27,164 27,216 27,774 CF from Op. Activities 27,020 23,652 32,492 36,176
Int. & other fin. Cost 3,469 3,721 3,252 3,439 (inc)/Dec in FA & CWIP (4,244) (13,332) (20,226) (25,626)
Other Income 2,186 3,872 3,525 3,199 Free Cashflow 22,776 10,319 12,266 10,550
EBT 16,462 27,315 27,489 27,534 (Pur)/Sale of Inv 629 - - -
Exp Item 1,364 - - - others (10,190) (12,129) - -
Tax 5,658 7,570 7,787 7,881 CF from Inv. Activities (13,805) (25,461) (20,226) (25,626)
Minority Interest 246 640 - - inc/(dec) in NW
Reported PAT 12,413 20,385 19,703 19,653 inc/(dec) in Debt (4,175) 10,681 - -
Adjusted PAT 11,518 20,385 19,703 19,653 Div Paid (inc tax) (3,590) (7,494) (7,706) (7,809)
Change (%) 153% 64% -3% 0% others (4,661) (3,721) (3,252) (3,439)
Margin(%) 4% 4% 3% 3% CF from Fin. Activities (12,426) (535) (10,958) (11,248)
Inc(Dec) in Cash 789 (2,344) 1,308 (698)
Add: Opening Balance 1,225 735 330 744
Balance Sheet in Rs Crores Closing Balance 2,014 (1,609) 1,638 46
Y/E March FY16 FY17 FY18E FY19E
Share Capital 2,370 4,739 4,739 4,739
Reserves 87,610 97,357 1,09,317 1,21,430 Key Ratios
Networth 89,980 1,02,096 1,14,056 1,26,169 FY16 FY17 FY18E FY19E
Debt 48,149 58,830 51,967 54,700 ROE 14% 20% 17% 16%
Other Non Cur Liab 678 752 752 752 ROCE 15% 21% 20% 18%
Total Capital Employed 1,38,129 1,60,926 1,66,023 1,80,870 Asset Turnover 1.5 2.1 2.2 2.1
Net Fixed Assets (incl CWIP) 1,26,251 1,32,735 1,44,977 1,62,065 Debtor Days 8 9 9 9
Non Cur Investments 24,089 36,218 36,218 36,218 Inv Days 41 63 - -
Other Non Cur Asst 2,605 3,148 3,148 3,148 Payable Days 23 31 31 31
Non Curr Assets 1,57,820 1,76,951 1,89,187 2,06,274 Int Coverage 5 7 8 8
Inventory 42,257 65,884 60,920 60,920 P/E 8 9 10 10
Debtors 7,685 8,899 9,217 9,514 Price / Book Value 1.1 1.8 1.7 1.5
Cash & Bank 735 330 557 24 EV/EBITDA 5 6 6 6
Other Curr Assets 3,870 3,622 3,647 3,669 FCF per Share 24 21 25 22
Curr Assets 73,696 96,551 89,558 86,534 Div Yield 2% 3% 3% 3%
Creditors 24,337 31,170 32,295 33,348
Provisons 12,491 22,292 29,123 29,123 Key Assumptions
Other Curr Liab 10,193 13,475 8,312 9,342 FY16 FY17 FY18E FY19E
Curr Liabilities 64,208 79,612 85,037 87,887 Refinery Throughput (MT) 56 65 70 70
Net Curr Assets 9,488 16,939 4,521 (1,353) Pipeline Throughput (MMT) 80 82 86 86
Total Assets 2,31,555 2,73,561 2,78,745 2,92,809 Marketing Volume(MT) 80 80 79 79
Financials Snap Shot
Narnolia Securities LtdPlease refer to the Disclaimers at the end of this Report

Narnolia Securities Ltd201 | 2nd Floor | Marble Arch Build ing | 236B-AJC Bose
Road | Kolkata-700 020 , Ph : 033-40501500
email: [email protected],
website : www.narnolia.com
Risk Disclosure & Disclaimer: This report/message is for the personal information of
the authorized recipient and does not construe to be any investment, legal or taxation
advice to you. Narnolia Securities Ltd. (Hereinafter referred as NSL) is not soliciting any
action based upon it. This report/message is not for public distribution and has been
furnished to you solely for your information and should not be reproduced or
redistributed to any other person in any from. The report/message is based upon publicly
available information, findings of our research wing “East wind” & information that we
consider reliable, but we do not represent that it is accurate or complete and we do not
provide any express or implied warranty of any kind, and also these are subject to change
without notice. The recipients of this report should rely on their own investigations,
should use their own judgment for taking any investment decisions keeping in mind that
past performance is not necessarily a guide to future performance & that the the value of
any investment or income are subject to market and other risks. Further it will be safe to
assume that NSL and /or its Group or associate Companies, their Directors, affiliates
and/or employees may have interests/ positions, financial or otherwise, individually or
otherwise in the recommended/mentioned securities/mutual funds/ model funds and
other investment products which may be added or disposed including & other mentioned
in this report/message.