Industry 6 - Natural Resources - New · PDF filerane) (14%, n=34). w c Table E7 ... Table E8:...
132
2008 Employer Survey Summary Report New Brunswick Career Development Action Group Detailed Findings by Industry Industry 6 - Natural Resources 6-1
-
Upload
trannguyet -
Category
Documents
-
view
214 -
download
0
Transcript of Industry 6 - Natural Resources - New · PDF filerane) (14%, n=34). w c Table E7 ... Table E8:...

2008 Employer Survey Summary Report New Brunswick Career Development Action Group Detailed Findings by Industry
Industry 6 - Natural Resources
6-1

2008 Employer Survey Summary Report Industry 6 – Natural Resources Detailed Findings by Industry
Table of Contents
1.0 Current Employees.......................................................................................... 6-3 1.1 Provincial Overview....................................................................................................6-4 1.2 Urban/Rural Subdivision.............................................................................................6-7 1.3 Economic Regions ...................................................................................................6-12
2.0 Hiring and Recruitment Practices .................................................................6-23 2.1 Provincial Overview..................................................................................................6-24 2.2 Urban/Rural Subdivision...........................................................................................6-31 2.3 Economic Regions ...................................................................................................6-43
3.0 Business Outlook and Confidence ...............................................................6-67 3.1 Provincial Overview .................................................................................................6-68 3.2 Urban/Rural Subdivision...........................................................................................6-71 3.3 Economic Regions ...................................................................................................6-76
4.0 Training and Employment Development ......................................................6-87 4.1 Provincial Overview..................................................................................................6-884.2 Urban/Rural Subdivision...........................................................................................6-904.3 Economic Regions ...................................................................................................6-93
5.0 Family Friendly Policies and Procedures.....................................................6-99 5.1 Provincial Overview................................................................................................6-100 5.2 Urban/Rural Subdivision.........................................................................................6-103 5.3 Economic Regions .................................................................................................6-108
6.0 Literacy..........................................................................................................6-119 6.1 Provincial Overview................................................................................................6-120 6.2 Urban/Rural Subdivision.........................................................................................6-123 6.3 Economic Regions .................................................................................................6-127
6-2

2008 Employer Survey Summary Report Industry 6 – Natural Resources Detailed Findings by Industry
1.0 Current Employees
6-3

2008 Employer Survey Summary Report Section 1.0 Industry 6 – Natural Resources Current Employees
1.1 Provincial Overview
6-4

2008 Employer Survey Summary Report Section 1.1 Industry 6 - Natural Resources Current Employees - Provincial Overview
1.1 Provincial Overview (N=318) Most commonly, businesses operating in the natural resources industry employ general farm workers (20%, n=62), farmers and farm managers (15%, n=48) and heavy equipment operators (except crane) (13%, n=41). Table E1: Top Six Occupations of Surveyed Businesses* - Natural Resources - Provincial
Overview
NOC Code Occupation Name n % (N=318) 8431 General farm workers 62 19.5 8251 Farmers and farm managers 48 15.2 7421 Heavy equipment operators (except crane) 41 13.0 7411 Truck drivers 29 9.1 1241 Secretaries (except legal and medical) 23 7.4 8262 Fishing vessel skippers and fishermen/women 23 7.2
*Multiple responses allowed. On average, natural resources businesses employ ten paid employees. Furthermore, these surveyed businesses employ a total of 4,544 employees1. Most businesses are small, employing one to 19 employees (83%, n=263). Figure E1: Business Size - Natural Resources - Provincial Overview (N=318)
Large2%
Medium15% Small
83%
Over one-half of employees among surveyed businesse (59%) are pe ent. Of permanent e employed on a full-time basis T
s rmanmployees, almost all (97%) are .
able E2: Profile of Employees – Natural Resources vincial Ov
ification
- Pro e wrvie
Employee Class n % Permanent 2,689 59.2 Casual/Contract 157 3.5 Seasonal 1,698 37.4
aEmployee Tot l 4,544 100.0 Business Total 301 - Status of Permanent Positions n % Full-time 2,603 96.9 Part-time 84 3.1 Employee Total 2,687 100.0 Business Total 2142 -
1 Businesses with missing data were excluded from this analysis. 2 Businesses with missing data were excluded from this analysis.
6-5

2008 Employer Survey Summary Report Section 1.1 Industry 6 - Natural Resources Current Employees - Provincial Overview
J lf of employees from surveyed businesses ) have a hig ool diploma as their ighest level of education, while 18% have less than a high school education. ust over one-ha (56% h sch
h Table E3: Highest Education Level of Employees – Natural Resources - Provincial Overview
n % University d e 432 9.5 egreJourneypers certification 339 7.5 on College certificate or diploma 379 8.3 High school 2,556 56.3 Less than high school 838 18.4 Employee Total 4,544 100.0 Business Total 301 -
Just over one-half of businesses in the natural resources industry (56%, n=180) report their employees to be, on average, between the ages of 25 and 44 years. More than one-third (38%, n=121) report an average age of 45 years or older. Figure E2: Average Age of Workforce - Natural Resources - Provincial Overview (N=318)
25-44 years56%
Don't Know3% Less than 25 years
3%
45 years or older38%
6-6

2008 Employer Survey Summary Report Section 1.0 Industry 6 – Natural Resources Current Employees
1.2 Urban/Rural Subdivision
1.2.1 Urban Subdivision 1.2.2 Rural Subdivision
6-7

2008 Employer Survey Summary Report Section 1.2.1 Industry 6 - Natural Resources Current Employees - Urban Subdivision
1.2.1 ban
ost commonly, urban businesses operating in the natural resources industry employ general farm
Ur Subdivision (N=97) Mworkers (16%, n=15), farmers and farm managers (12%, n=12) and heavy equipment operators (except crane) (11%, n=11).
able E4T : Top Five Occupations of Surveyed Businesses* - Natural Resources – Urban Subdivision
NOC Code Occupation Name n % (N=97)
8431 General farm workers 15 15.5 8251 Farmers and farm managers 12 12.4
11.3 8.2
2223 Forestry technologists and technicians 7 7.2
7421 Heavy equipment operators (except crane) 11 1221 Administrative officers 8
* O ural resources businesses in urban areas ploy ten paid ployees. Furthermore, th yed businesses employ a total of 1,333 employ Most busin are small, employing o es (83%, n=80). Figure E3
Multiple responses allowed.
n average, nat em emese surve ees3. essesne to 19 employe
: Business Size – Natural Resources – Urban Subdivision (N=97)
Medium16% Small
Large2%
83%
A , almost one-half of employees asonal (47%) or permanent (46%). Of p (93%) are employed on a full-time basis. T
mong surveyed businessesployees, most
are seermanent em
able E5: Profile of Employees – Natural Resource an Subdi
n n %
s – Urb vision
Employee ClassificatioPermanent 607 45.5 Casual/Contract 98 7.4 Seasonal 628 47.1 Employee Total 1,333 100.0 Business T 91 - otal Status of Permanent Positions n % Full-time 561 92.7 Part-time 44 7.3 Employee Total 605 100.0 Business Total 634 -
3 Businesses with missing data were excluded from this analysis. 4 Businesses with missing data were excluded from this analysis.
6-8
2008 Employer Survey Summary Report Section 1.2.1 Industry 6 - Natural Resources Current Employees - Urban Subdivision
Just over one-half of employees from surveyed businesses (56%) have a high school diploma as their highest level of education, while 20% have less than a high school education. Table E6: Highest Education Level of Employees – Natural Resources – Urban Subdivision
n % University degree 159 11.9 Journeyperson certification 74 5.6 College certificate or diploma 97 7.3 High school 740 55.5 Less than high school 263 19.7 Employee Total 1,333 100.0 Business Total 91 -
Over one-half of urban businesses in the natural resources industry (58%, n=56) report their employees
be, on average, between the ages of 25 and 44 years. More than one-third (37%, n=36) report an verage age of 45 years or older.
igure E4
toa F : Average Age of Workforce – Natural Resources – Urban Subdivision (N=97)
25-44 years58%
Don't Know2% Less than 25 years
3%
45 years or older37%
6-9

2008 Employer Survey Summary Report Section 1.2.2 Industry 6 - Natural Resources Current Employees - Rural Subdivision
1.2.2 Rural Subdivision (N=246) Most comm y, rural businesses operating in the natural resources industry em
orkers (22% n=53), farmers and farm managers (17%, n=41) and heavy equipmenonl ploy general farm
, t operators (except rane) (14%, n=34).
wc Table E7: Top Five Occupations of Surveyed Businesses* - Natural Resources – Rural
Subdivision
NOC Cod Occupation Name n e % (N=246) 8431 General farm workers 53 21.5 8251 Farmers and farm managers 4 16.7
Heavy equipment operators (except crane) 13.8 Truck drivers 26 10.6 Secretaries (except legal and medical) 8.5
1 7421 34 7411 1241 21
*Multiple responses allowed. On average, natural resources businesses in rural areas empl pl rthermore, these s total of 3,578 employees5. Most businesses are small, employing one to 19 employees (83%, n=203). F
oy ten paid em oyees. Fuurveyed businesses employ a
igure E5: Business Size – Natural Resources – Rural Subdivision ( )
N=246
Medium15%
Large2%
Small83%
esses, two-thirds of employees (66% permanent, while one-third (33%) are Among surveyed busin ) are
seasonal. Of permanent employees, almost all (98%) are employed on a full-time basis. Table E8: Profile of Employees – Natural Resources – Rural Subdivision
Employee C sification n % lasPermanent 2,358 65.9 Casual/Contract 55 1.5 Seasonal 1,165 32.6 Employee Total 3,578 100.0 Business Total 233 - Status of Permanent Positions n % Full-time 2,317 98.3 Part-time 41 1.7 Employee Total 2,358 100.0 Business Total 168 -
5 Businesses with missing data were excluded from this analysis.
6-10

2008 Employer Survey Summary Report Section 1.2.2 Industry 6 - Natural Resources Current Employees - Rural Subdivision
Over one-half of employees from surveyed businesses (57%) have a high school diploma as their highest level of education, while 18% have less than a high school diploma. Table E9: Highest Education Level of Employees – Natural Resources – Rural Subdivision
n % University degree 298 8.3 Journeyperson certification 300 8.4 College certificate or diploma 317 8.9 High school 2,026 56.6 Less than high school 637 17.8 Employee Total 3,578 100.0 Business Total 233 -
Just over one-half of rural businesses in the natural resources industry (56%, n=137) repo their
mployees to be, on average, between the ages of 25 and 44 years. Thirty-nine percent (n=95) report an verage age of 45 years or older.
igure E6
rt ea F : Average Age of Workforce – Natural Resources – Rural Subdivision (N=246)
25-44 years56%
Don't Know3% Less than 25 years
2%
45 years or older39%
6-11

2008 Employer Survey Summary Report Section 1.0 Industry 6 – Natural Resources Current Employees
1.3 Economic Regions
1.3.1 Central Region 1.3.2 Northeast Region 1.3.3 Northwest Region 1.3.4 Southeast Region 1.3.5 Southwest Region
6-12

2008 Employer Survey Summary Report Section 1.3.1 Industry 6 - Natural Resources Current Employees - Central Region
1.3.1 Central Region (N=44) PLEASE NOTE THAT THE MARGIN OF ERROR FOR THIS ECONOMIC RE
HEREFOR INDINGS SHOULD BE INTERPRETED WITH CAUTION. GION IS ABOVE 10%,
E, F
st commonly, Central New Brunswick businesses perating in the natural resources industry employ rmers and farm managers (22%, n=10), heavy equipment operators (except crane) (18%, n=8) and eneral farm workers (17%, n=7).
able E10
T Mofa
o
g T : Top Five Occupations of Surveyed Businesses* - Natural Resources - Central
Region
NOC Code Occupation Name n % (N=44)
8251 Farmers and farm managers 10 22.3 7421 Heavy equipment operators (except crane) 8 17.8 8431 General farm workers 7 16.5 1221 Administrative officers 6 14.6 7411 Truck drivers 6 14.0
*Multiple responses allowed.
n average, natural resources businesses in Central New Brunswick employ eight paid employees. OFurthermore, these surveyed businesses employ a total of 339 employees6. Most businesses are small, employing one to 19 employees (88%, n=39). Figure E7: Business Size – Natural Resources - Central Region (N=44)
Medium12%
Small88%
6 Businesses with missing data were excluded from this analysis.
6-13

2008 Employer Survey Summary Report Section 1.3.1 Industry 6 - Natural Resources Current Employees - Central Region
Among surveyed businesses, just over three-quarters of employees (78%) are employed on a permanent basis. Of permanent employees, most (90%) are employed full-time. Table E11: Profile of Employees – Natural Resources - Central Region
las
Employee C sification n % Permanent 265 78.2 Casual/Contract 22 6.5 Seasonal 52 15.3 Employee Total 339 100.0 Business Total 43 - Status of Permanent Positions n % Full-time 238 89.8 Part-time 27 10.2 Employee Total 265 100.0 Business Total 39 -
Just over one-half of employees from surveyed businesses (55%) have a high school diploma as their highest level of education, while 16% have a journeyperson certification and 15% have a university education.
able E12T : Highest Education Level of Employees – Natural Resources - Central Region
n %
University degree 50 14.7 Journe person certification 53 y 15.6
23 6.8 Employee Total 339 100.0
College certificate or diploma 25 7.4 High school 187 55.2 Less than high school
Business To 43 - tal Just over one-half of Central area businesses in the natural resources industry (54%, n=24) report their em be d 44 years. More than one , n=17) report an averag Figu
ployees to , on average, bet 25 ane age of 45 years or older.
ween the ages of -third (38%
re E8: A ce – Natural Resources - Central ion (N=4
verage Age of Workfor Reg 4)
25-44 years54%
Don't Know
38%
2% Less than 25 years7%
45 years or older
6-14

2008 Employer Survey Summary Report Section 1.3.2 Industry 6 - Natural Resources Current Employees - Northeast Region
1.3.2 Northeast Region (N=115) M t New Brunswick businesses opera in the natura urces industry employ fi ppers and fishermen/women (19%, n=22). T
ost commonly, Northeas ting l resoshing vessel ski
able E13: Top Six Occupations of Surveyed Busi s* - Natur sources - Northeast
Occupation Name n % (N=115)
nesse al ReRegion
NOC Code 8262 Fishing vessel skippers and fishermen/women 19.2 22 7421 8431
Heavy equipment operators (except crane) 12.6 General farm workers 9.4
w, water transport 8.9 Farmers and farm managers 10 8.6
8261 Fishing masters and officers 17 4.5
14 1 1
10 7433 Deck cre8251
*Multiple responses allowed. On average, natural resources businesses in Northeast New Brunswick employ 11 paid employees.
, th all, mploying one to 19 employees (86%, n=98).
F
Furthermore ese surveyed businesses employ a total of 1,686 employees7. Most businesses are sme
igure E9: Business Size – Natural Resources – Nort t Region (N )
heas =115
Large3%
Medium12%
Small86%
Among surveyed businesses, almost all employees are employed on a permanent (50%) or seasonal (49%) basis. Of permanent employees, almost all (98%) are employed full-time. Table E14: Profile of Employees – Natural Resources - Northeast Region
Employee Classification n % Permanent 846 50.2 Casual/Contract 23 1.4 Seasonal 817 48.5 Employee Total 1,686 100.0 Business Total 108 - Status of Permanent Positions n % Full-time 826 97.6 Part-time 20 2.4 Employee Total 846 100.0 Business Total 52 -
Businesses with missing data were excluded from this analysis. 7
6-15

2008 Employer Survey Summary Report Section 1.3.2 Industry 6 - Natural Resources Current Employees - Northeast Region
Approximately one-half of employees from surveyed businesses (49%) have a high school diploma as eir highest level of education, while 30% have less than a high school diploma.
able E15
th T : Highest Education Level of Employees – Natural Resources - Northeast Region
n %
University degree 121 7.2 Journeyperson certification 80 4.7 College certificate or diploma 157 9.3 High school 817 48.5 Less than high school 512 30.4 Employee Total 1,686 100.0 Business Total 108 -
Over one-half of Northeast area businesses in the natural resources industry (58%, n=66) report their
es of 25 and 44 years. Just over one-third (36%, n=41) employees to be, on average, between the agreport an average age of 45 years or older. Figure E10: Average Age of Workforce – Natural Resources - Northeast Region (N=115)
25-44 years58%
Don't Know4% Less than 25 years
3%
45 years or older
36%
6-16

2008 Employer Survey Summary Report Section 1.3.3 Industry 6 - Natural Resources Current Employees - Northwest Region
1 est Region (N=81) .3.3 Northw Most commonly, Northwest New Brunswick businesses operating in the natural resources industry employ general farm workers (38%, n=30) and farmers and farm managers (26%, n=21). Table E16: Top Five Occupations of Surveyed Businesses* - Natural Resources - Northwe
Region st
Occupation Name n % (N=81)
NOC Code 8431 General farm workers 3 37.6 0 8251 Farmers and1241 Secretaries (
farm managers 2 25.6 except legal and medical) 1 13.0
drivers 12.7 quipment operators (except crane) 11.6
1 0
7411 Truck 7421 Heavy e
10 9
*Multiple responses allowed.
n average, natural resources businesses in Northwest New Brunswick employ seven paid employees.
igure E11
OFurthermore, these surveyed businesses employ a total of 521 employees8. The majority of businesses are small, employing one to 19 employees (79%, n=64). F : Business Size – Natural Resources – Northwest Region (N=81)
Large1%
Medium20%
Small79%
Among surveyed businesses, almost all employees are employed on a seasonal (51%) or permanent (44%) basis. Of permanent employees, most (92%) are employed full-time.
able E17T : Profile of Employees – Natural Resources - Northwest Region
Employee Classification n %
Permanent 229 44.0 Casual/Contract 27 5.2 Seasonal 265 50.9 Employee Total 521 100.0 Business Total 75 - Status of Permanent Positions n % Full-time 211 92.1 Part-time 17 7.4 Employee Total 229 100.0 Business Total 62 -
Businesses with missing data were excluded from this analysis. 8
6-17

2008 Employer Survey Summary Report Section 1.3.3 Industry 6 - Natural Resources Current Employees - Northwest Region
Just over one-half of employees from surveyed businesses (55%) have a high school diploma as their ighest level of education, while 25% have less than a high school diploma.
able E18
h T : Highest Education Level of Employees – Natural Resources - Northwest Region
n %
University degree 45 8.6 Journeyperson certification 25 4.8 College certificate or diploma 36 6.9 High school 285 54.7 Less than high school 130 25.0 Employee Total 521 100.0 Business Total 75 -
Just over on alf of Northwest area businesses in the natural resources industry (56%, n=45) report their e-hmployees to be, on average, between the ages of 25 and 44 years. Forty percent (n=33) report an v r older.
Figure E12
ea erage age of 45 years o
: A l Resources - Northwe gion ( )
verage Age of Workforce – Natura st Re N=81
25-44 years56%
40%
Don't Know
2% Less than 25 years1%
45 years or older
6-18

2008 Employer Survey Summary Report Section 1.3.4 Industry 6 - Natural Resources Current Employees - Southeast Region
1 ion (N=44) PLEASE NOTE THAT THE MARGIN OF ERROR FOR THIS ECONOMIC REGION IS ABOVE 10%, T GS SHOULD BE INTERPRETED WI UTION.
, Southeast New Brunswick businesses op ng in the n tural resources industry
.3.4 Southeast Reg
HEREFORE, FINDIN TH CA
Most commonly erati aemploy retail salespersons and sales clerks (18%, n=8). Table E19: Top Four Occupations of Surveyed Businesses* - Natural Resources - Southeast
Region
NOC Code Occupation Name n % (N=44) 6421 Retail salespersons and sales clerks 8 17.5 7265 Welders and related machine operators 7 15.6 8431 General farm workers 7 14.9 0621 Retail trade managers 6 13.0
*Multiple responses allowed. On average, natural resources businesses in Southeast New Brunswick employ 14 paid employees. Furthermore, these surveyed businesses employ a total of 1,078 employees9. The majority of businesses are small, employing one to 19 employees (79%, n=34). Figure E13: Business Size – Natural Resources – Southeast Region (N=44)
Large3%
Medium18%
Small79%
Ab
mong surveyed businesses, most employees are employed on a permanent (47%) or seasonal (47%) asis. Of permanent employees, most (96%) are employed full-time.
able E20 T : Profile of Employees – Natural Resources - Southeast Region
Employee Classification n %
Permanent 504 46.8 Casual/Contract 74 6.9 Seasonal 501 46.5 Employee Total 1,078 100.0 Business Total 41 - Status of Permanent Positions n % Full-time 485 96.2 Part-time Employee Total
19 3.8 504 100.0
Business Total 33 -
9 Businesses with missing data were excluded from this analysis.
6-19

2008 Employer Survey Summary Report Section 1.3.4 Industry 6 - Natural Resources Current Employees - Southeast Region
Almost two-thirds of employees from surveyed businesses (63%) have a high school diploma as their highest level of education. Table E21: Highest Education Level of Employees – Natural Resources - Southeast Region
n % U ree 132 .2 niversity deg 12Jour son c 52 8 Coll tificat 86 0 High l 680 .1 Less h sc 129 .0 Emp al 78 .0
neyper ertification 4.ege cer e or diploma 8. schoo 63 than hig hool 12loyee Tot 1,0 100
Business Total 41 - Just over one-half of Southeast area businesses in the natural resources industry (55%, n=24) report their employees to be, on average, between the ages of 25 and 44 years. Less than one-half (44%, n=19) report an average age of 45 years or older. Figure E14: Average Age of Workforce – Natural Resources - Southeast Region (N=44)
45 years or older44%
25-44 years55%
Don't Know
2%
6-20

2008 Employer Survey Summary Report Section 1.3.5 Industry 6 - Natural Resources Current Employees - Southwest Region
1.3.5 Southwest Region (N=35)
LEASE NOTE THAT THE MARGIN OF ERROR FOR THIS ECONOMIC REGION IS ABOVE 10%, THEREFORE, FINDINGS SHOULD BE INTERPRETED WITH CAUTION. Most commonly, Southwest New Brunswick businesses operating in the natural resources industry employ general farm workers (20%, n=7) and general office clerks (17%, n=6). Table E22
P
: Top Five Occupations of Surveyed Businesses* - Natural Resources - Southwest Region
NOC Code Occupation Name n % (N=35)
8431 General farm workers 7 20.2 1411 General office clerks 6 17.0 7421 Heavy equipment operators (except crane) 5 15.3 8251 Farmers and farm managers 5 14.5 6663 Janitors, caretakers and building superintendents 4 10.5
*Multiple responses allowed.
n average, natural resources businesses in Southwest New Brunswick employ 11 paid employees. urthermore, these surveyed businesses employ a total of 920 employees10. Most businesses are small, mploying one to 19 employees (77%, n=27).
igure E15
OFe F : Business Size – Natural Resources – Southwest Region (N=35)
Large6%
Medium17%
Small77%
Among surveyed businesses, most employees (92%) are employed on a permanent basis. Of permanent employees, all except one are employed full-time. Table E23: Profile of Employees – Natural Re - Southwest Region
Employee Classification n %
sources
Permanent 846 92.0 Casual/Contract 11 1.2 Seasonal 63 6.8 Employee Total 920 100.0 Business Total 33 - Status of Permanent Positions n % Full-time 843 99.9 Part-time 1 0.1 Employee Total 844 100.0 Business Total 2811 -
10 Businesses with missing data were excluded from this analysis. 11 Businesses with missing data were excluded from this analysis.
6-21

2008 Employer Survey Summary Report Section 1.3.5 Industry 6 - Natural Resources Current Employees - Southwest Region
Ah
lmost two-thirds of employees from surveyed businesses (64%) have a high school diploma as their ighest level of education.
Table E24: t st Region
n %
Highes Education Level of Employees – Natural Resources - Southwe
University degree 84 9.1 Journeyperson certification 129 14.0 College certificate or diploma 76 8.3 High school 587 63.8 Less than high school 45 4.9 Employee Total 920 100.0 Business Total 33 -
The majority of Southwest area businesses in the natural resources industry (60%, n=21) report their
mployees to be, on average, between the ages of 25 and 44 years. Just over one-third (36%, n=12) port an average age of 45 years or older.
igure E16
ere F : Average Age of Workforce – Natural Resources - Southwest Region (N=35)
25-44 years54%
Don't Know2% Less than 25 years
7%
45 years or older38%
6-22

2008 Employer Survey Summary Report Industry 6 – Natural Resources Detailed Findings by Industry
2.0 Hiring and Recruitment Practices
6-23

2008 Employer Survey Summary Report Section 2.0 Industry 6 – Natural Resources Hiring and Recruitment Practices
2.1 Provincial Overview
6-24

2008 Employer Survey Summary Report Section 2.1 Industry 6 - Natural Resources Hiring and Recruitment - Provincial Overview
2.1 Provincial Overview (N=318) Approxi tresourccompen Figure E17
ma ely 15% of businesses in the natural resources industry (n=47) have a formal human es plan, that is, a written plan including key elements such as recruitment, retention, sation and benefits, training, and safety.
: Businesses with a Formal Human Resources Plan - Natural Resources - Provincial Overview (N=318)
Don't Know1% Yes
15%
No84%
stry (43%, n=138) hired at least one new employee over the ore,
ed
G workers (26%, n=36) was the top occupation hir ver the p 2 months. T
ess than one-half of businesses in this induLpast 12 months. Of those who hired (n=138), an average of six new employees were hired. Furthermhese survey businesses hired a total of 1,003 employees. t
eneral farm ed o ast 1
able E25: Top Five Occupations Hired in the Past 12 Mont - Natural Resources - Provincial Overview
Occupation Name n % (N=138)
hs*
NOC Code 8431 General farm workers 36 25.8 7421 Heavy equipment operators (except crane) 12 8.4 7411 Truck drivers 8 5.7 6421 Retail salespersons and sales clerks 7 5.3 8254 Nursery and greenhouse workers 6 4.5
* Multiple respon allowed. ses
Of those who hired new employees over the past 12 months (n=138), 70% ( fully satisfied with th T reported on average th y were not satisfied w .
n=96) wereeir new hires.
hose not satisfied with at least one employee (n=42) at theith 30% of the new employees hired
6-25

2008 Employer Survey Summary Report Section 2.1 Industry 6 - Natural Resources Hiring and Recruitment - Provincial Overview
The primary reasons identified for dissatisfaction were new employees lacking work ethic/motivation 3%, n=14) and being unreliable (20%, n=8). (3
Table E26: Primary Reason for Dissatisfaction with New Employees - Natural Resources
– Provincial Overview
n % (N=42) Lacking work ethic/motivation 14 32.7 Unreliable 8 20.4
qualified for position 3 7.5 ed 3 6.8 h p
Not a good fit within the company 2 4.1 y adapting to position 1
3
Lacking adequate training/skills 4 9.5 Not suited/InexperiencPoor attitude 2 4.8 Unhappy wit erformance 2 4.1
Difficult 2.0Other 8.2
Of the 1,003 employees hired by surveyed businesses the past 12 ths, a large proportion ( h school diploma or less than a high school a as their
new 79%) have a hig
over mondiplom highest level of education.
Table E27: Highest Education Level of New Employees – Natural Resources - Provincial Overview
n % University 65 6.5 Public Commun 132 13.2 Private Training Institution 13 1.3 High School 582 58.0 Less than High School 212 21.1 New Employee Total 1,003 100.0
ity College
Business Total 138 - Businesses that hired at least one employee from the various educational categories were asked to rate the overall job readiness of the employees from each category. As shown below, the majority of businesses rated the job readiness of new employees as excellent or good, regardless of employees’ education level:
University graduates (n=29) – 11 employers rated job readiness as excellent, 14 rated it as
=18) rated it as good, 6% (n=2) rated it as fair, and one employer was
rivexcelle d.
High School graduates (n=96) – 19% of employers (n=18) rated iness as excellent, 51) rated it as good, 20% (n=19) rated it as fair, 5% (n= it as poor, and 3% re unsure.
good, four rated it as fair, and one rated it as poor. Public Community College graduates (n=31) – 32% of employers (n=10) rated job readiness
as excellent, 59% (nunsure.
P ate Training Institution graduates (n=5) – Three employers rated job readiness as nt and three rated it as goo
job read5 d 54% (n= ) rate
(n=3) we
6-26

2008 Employer Survey Summary Report Section 2.1 Industry 6 - Natural Resources Hiring and Recruitment - Provincial Overview
A in the natural resources industry that hired over th st 12 months, 12% of th inals.
mong surveyed businesses e pae new employees hired were aborig
Table E28: Classifications of New Employees - Natural Res rces – Pr cial Overview ou ovin
n % Immigrants 14 1.4 Co-op students hired for work placement 14 1.4
h disabil
New Employee 1,002 15.0
Persons wit ities 6 0.6 Aboriginals 116 11.6
Total Business Total 13712 -
Busin were general, the methods they use to fill st g vacanc at occur. By far ost p referrals (65 ).
esses asked to identify, in affin ies th, the m opular method used is word of mouth/employee %, n=208
Table E29: Methods Used to Fill Staffing Vacancies* - Natural Resour - Provincial Overview
n % (N=318)
ces
Use word of mouth/employee referrals 208 65.4 Place ad in newspaper 59 18.7 Place ad/use Service Canada Student Employment Centre 59 18.6
Place ad in student employment centres at colleges/universities 10 3.1
ociation journals 4 1.3 oth
Don’t know 17 5.2
Use unsolicited resumes 36 11.2 Place ad on or check internet/websites 14 4.4 Post internally in your company/organization 13 4.0 Don’t hire/never have vacancies/self-employed 10 3.2
Place ad on bulletin boards in local community 9 2.7 Use an employment agency/headhunter 9 2.7 Radio 7 2.2 Place ad in trade/professional/assRecruit from er companies 3 1.1 Other 15 4.8
*Multiple responses allowed. Over st 12 resources industry =120) hav at least one v posit ) re rted an a e of five vacan Furthe e a tota 742 vacant positions.
vailable among these surveyed businesses, 230 or 31% of positions were ughout the past 12 months.
the pa months, 38% of businesses in the naturalion available. Those with at least one
(n e hadacant vacancy (n=120
usinesses, there werpo verag
cies. rmore, among these surveyed b l of
Of the 742 vacant positacant more than once thro
ions av Furthermore, among these surveyed businesses, almost two-thirds (63%) of the positions available were seasonal. Table E30: Classification of Vacancies - Natural Resources – Provincial Overview
n % Permanent 206 27.8 Casual/Contra t 67 9.0
63.3c
Seasonal 469 V l 741 1 0 acancy Tota 00.B 11913usi Total ness -
xcluded from this analysis. 12 Businesses with mi
13 Businesses with mi xcluded from this analysis. ssing data were essing data were e
6-27

2008 Employer Survey Summary Report Section 2.1 Industry 6 - Natural Resources Hiring and Recruitment - Provincial Overview
Busin were experienced any difficulty in filling vac cies. Near e-quarter rienced difficulty, 41% (n=131) have not, and 35% (n=111) have not hired or
ttempted to hire.
esses asked if they have an ly on(24%, n=75) have expea Figure E18: Businesses Experiencing Difficulty Filling Vacancies - Natural Resources -
Provincial Overview (N=318)
Yes24%
Don't know1%
No41%
hire
The most common reason for experiencing difficulty in filling vacancies was potential hires lacking experience (31%, n=23). Table E31
Have not hired/Attempted to
35%
: Main Reason for Experiencing Difficulty in Filling Vacancies* - Natural Resources - Provincial Overview
n % (N=75) Lacking experience 23 31.0 Workforce shortage 18 24.3 Difficult working conditions 17 22.3 Lacking educational/training qualifications 16 21.2 Salary expectations too high 13 17.8 Lacking specific technical skills 13 17.8 Lacking soft skills (such as communication/teamwork) 6 8.0 People not interested in employment 4 5.7 Lacking proper license/permit 3 3.8 Position did not provide enough hours 2 2.3 Location 2 2.3 Other 6 8.3
*Multiple responses allowed.
mong businesses experiencing difficulty in filling vacancies (n=75), general farm workers (26%, n=19) as the most difficult occupation to fill over the past 12 months.
able E32
Aw T : Top Four Occupations That Were Difficult to Fill Over the Past 12 Months* - Natural
Resources - Provincial Overview
NOC Code Occupation Name n % (N=75)
8431 General farm workers 19 25.8 7411 Truck drivers 6 8.0 7421 Heavy equipment operators (except crane) 6 8.0 8262 Fishing vessel skippers and fishermen/women 5 6.1
*Multiple responses allowed.
6-28

2008 Employer Survey Summary Report Section 2.1 Industry 6 - Natural Resources Hiring and Recruitment - Provincial Overview
The large majority of businesses in the natural resources industry (90%, n=285) did not have any mployees retire over the past 12 months. Of the surveyed businesses that did experience retirement =33), a total of 69 employees retired, averaging two employees per business.
f businesses that experienced employee retirement over the past 12 months (n=33), general farm orkers (17%, n=6) and heavy equipment operators (except crane) (15%, n=5) were the top occupations om which employees retired.
able E33
e(n Owfr T : Top Five Occupations From Which Employees Retired Over the Past 12 Months* -
Natural Resources - Provincial Overview
NOC Code Occupation Name n % (N=33)
8431 General farm workers 6 16.9 7421 Heavy equipment operators (except crane) 5 15.3 9619 Other labourers in processing, manufacturing and utilities 3 7.6 7312 Heavy-duty equipment mechanics 2 5.9 7411 Truck drivers 2 5.1
*Multiple responses allowed.
lmost two-thirds of businesses in this industry (62%, n=199) do not expect any employees to retire in the ext five years. Of the surveyed businesses that expect employee retirement over this period (n=120), an verage of three employees are expected to retire, with retirement totaling 446 employees.
ost commonly, employees are expected to retire from the general farm workers occupation (15%, =18).
able E34
Ana Mn T : Top Five Occupations From Which Employees Are Expected to Retire Over the
Next Five Years* - Natural Resources - Provincial Overview
NOC Code Occupation Name n % (N=120)
8431 General farm workers 18 15.3 8251 Farmers and farm managers 13 10.8 7421 Heavy equipment operators (except crane) 10 8.5 7411 Truck drivers 7 6.1 0621 Retail trade managers 6 4.7
*Multiple responses allowed. Nineteen percent of b (n=60) expect their wner/manager/CEO to ret
Figure E19
usinesses in the natural resources industry ire within the next five years. o
: Businesses Expec ire in Next Five Years - Natural
Resources - Provinting Owner/Manager/CEO to Retcial Overview (N=318)
No76%
Yes19%
Don't Know5%
6-29

2008 Employer Survey Summary Report Section 2.1 Industry 6 - Natural Resources Hiring and Recruitment - Provincial Overview
Of those that expect their owner/manager/CEO to retire within the next five years (n=60), almost one-half 8%, n=29) have a formal or informal succession plan in place.
igure E20
(4 F : Businesses with a Succession Plan - Natural Resources - Provincial Overview
(N=60)
No42%
Yes48%
Don't Know11%
6-30

2008 Employer Survey Summary Report Section 2.0 Industry 6 – Natural Resources Hiring and Recruitment Practices
2.2 Urban/Rural Subdivision
2.2.1 Urban Subdivision 2.2.2 Rural Subdivision
6-31

2008 Employer Survey Summary Report Section 2.2.1 Industry 6 - Natural Resources Hiring and Recruitment – Urban Subdivision 2.2.1 Urban Subdivision (N=97)
n percent of urban businesses in the natural resources industry (n=10) have a formal human resources plan, that is, a written pl key elements such as recr ent, compensation and b F
Te
an including uitm retention, enefits, training, and safety.
igure E21: Businesses with a Formal Human Resources Nat esources – Urban an - Pl u Rral Subdivision (N=97)
Don't Know2%
No88%
Yes10%
n average of six new employees were hired. yees.
Less than one-half of urban businesses in this industry (42%, n=41) hired at least one new employee over the past 12 months. Of those who hired (n=41), a
urthermore, these surveyed businesses hired a total of 395 emploF General farm workers (22%, n=9) was the top occupation hired over the past 12 months. Table E35: Top Three Occupations Hired in the Past 12 Months* - Natural Resou
Subdivision rces - Urban
Occupation Name % (N=41)
NOC Code n 8431 General farm workers 22.0 9 6421 Retail salespersons and sales clerks 12.2
Chainsaw and skidder operators 7.3 5
8421 3 *Multiple responses allowed.
f those who hired new employees over the past 12 months (n=41), 71% (n=29) were fully satisfied with eir new hires.
hose not satisfied with at least one employee (n=12) reported on average, that they were not satisfied ith 28% of the new employees hired.
he primary reasons identified for dissatisfaction were new employees lacking work ethic/motivation =3), being unreliable (n=3), lacking adequate training/skills (n=2), not suited/qualified for position (n=2)
nd other responses (n=2).
Oth Tw T(na
6-32

2008 Employer Survey Summary Report Section 2.2.1 Industry 6 - Natural Resources Hiring and Recruitment – Urban Subdivision Of the 395 new employees hired by surveyed businesses over the past 12 months, many (77%) have a high school diploma or less than a high school diploma as their highest level of education. Table E36: Highest Education Level of New Employees - Natural Resources – Urban
n %
Subdivision
University 26 6.6 Public Community College 65 16.5 Private Training Institution 1 0.3 High School 223 56.5 Less than High School 80 20.3 New Employee Total 395 100.0 Business Total 41 -
Businesses that hired at least one employee from the various educational categories were asked to rate the overall job readiness of the employees from each category. The majority of businesses rated the job readiness of new employees as excellent or good, regardless of
ity graduates (n=10) – Five employers rated job readiness as excellent, four rated it as
and . Private Training Institution graduates (n=1) – This emplo r rated ess as good.
ool graduates (n=27) – Seven employers rated job read cellent, 17 rated it ree rated it as fair.
A past 12 months, nearly quarter of the new e boriginals. T
employees’ education level:
Universgood, and one rated it as fair.
Public Community College graduates (n=9) – Two employers rated job readiness as excellent seven rated it as good
ye job readinine ex High Sch ss as
as good, and th
mong surveyed businesses that hired over the one-mployees hired (23%) were a
able E37: Classifications of New Employees - Natural Res rces – Ur Subdivision
n %
ou ban
Immigrants 5 1.3 Co-op students hired for work placement 3 0.8 Persons with disabilities 2 0.5 Aboriginals 90 22.9
eeNew Employ Total 393 25.5 Business Total 40 - 14
14 Businesses with missing data were excluded from this analysis.
6-33
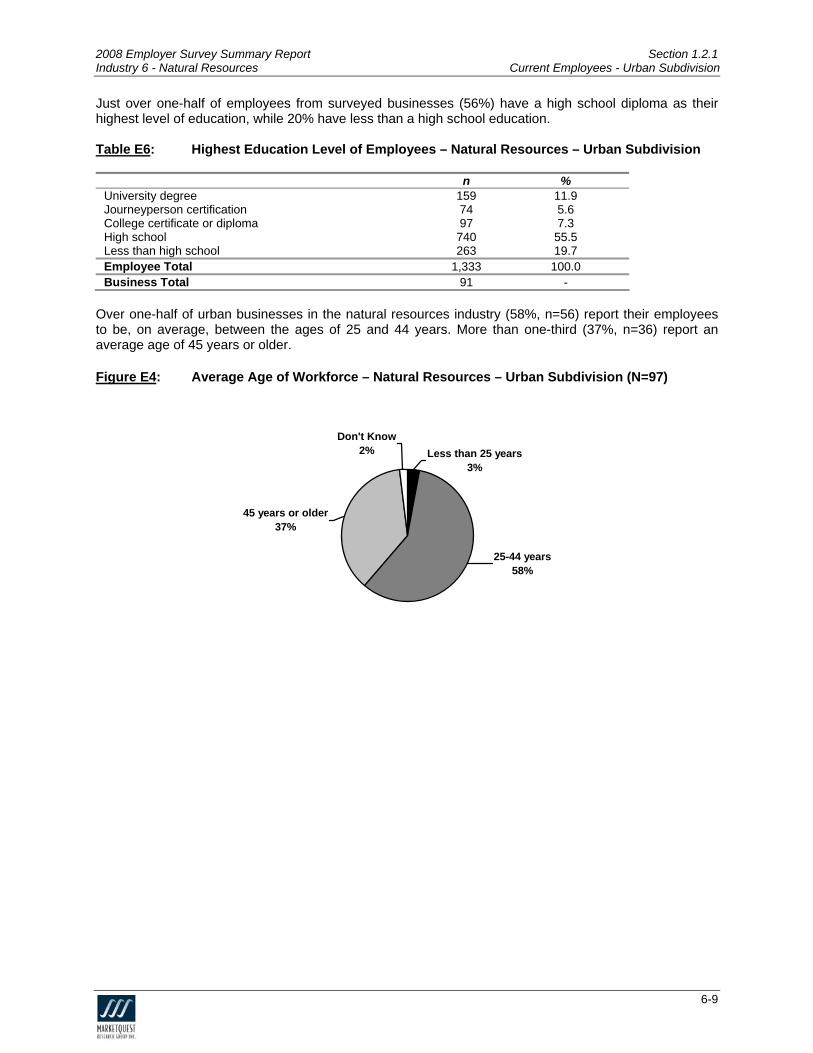
2008 Employer Survey Summary Report Section 2.2.1 Industry 6 - Natural Resources Hiring and Recruitment – Urban Subdivision Businesses were asked to identify, in general, the methods they use to fill staffing vacancies that occur. By far, the most popular method used is word of mouth/employee referrals (66%, n=64). Table E38: Methods Used to Fill Staffing Vacancies* - Natural Resources - Urban Subdivision
(N=97)
n %Use word of mouth/employee referrals 64 66.0 Place ad/use Service Canada Student Employment Centre 20 20.6 Place ad in newspaper 15 15.5 Use unsolicited resumes 9 9.3 Place ad on or check internet/websites 5 5.2 Use an employment agency/headhunter 4 4.1 Post internally in your company/organization 3 3.1 Don’t hire/never have vacancies/self-employed 3 3.1
othPlace ad in stud 2.1 Radio 1 1.0 S mphlets 1 .0 Other 4 .1 Don’ 5
Recruit from er companies 3 3.1 ent employment centres at colleges/universities 2
igns/flyers/pa 14
t know 5.2 *Multip nses a
ver the past 12 months, 32% of urban businesses in the natural resources industry (n=31) have had at
s, there were a total of 296 vacant positions.
acha
urthermore, among these surveyed businesses, alm st two-thirds (63%) of the positions available were easonal.
le respo llowed. Oleast one vacant position available. Those with at least one vacancy (n=31) reported an average of four vacancies. Furthermore, among these surveyed businesse Of the 296 v ant positions available among these surveyed businesses, 92 positions or 31% were vacant more t n once throughout the past 12 months.
F os Table E39: Classification of Vacancies - Natural Resources – Urban Subdivision
n % Permanent 71 24.0 Casual/Contract 39 13.2 Seasonal 186 62.8 Vacancy Total 296 100.0 Business Total 31 -
6-34
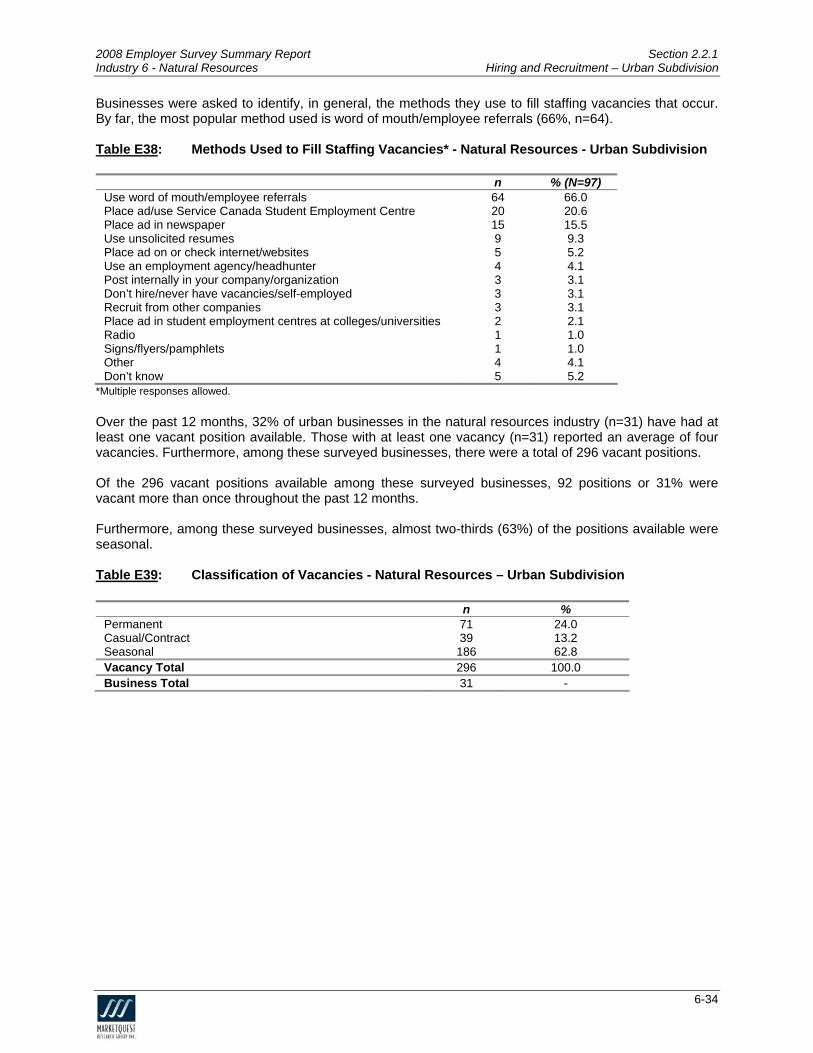
2008 Employer Survey Summary Report Section 2.2.1 Industry 6 - Natural Resources Hiring and Recruitment – Urban Subdivision Businesses were asked if they have experienced any difficulty in filling vacancies. Nineteen percent
hire. Figure E22
(n=18) have experienced difficulty, 44% (n=43) have not, and 37% (n=36) have not hired or attempted to
: Businesses Experiencing Difficulty Filling Vacancies - Natural Resources – Urban Subdivision (N=97)
Yes19%
No44%
The most common reason for experiencing difficulty in filling vacancie
Have not hired/Attempted to
hire37%
s was potential hires lacking xperience (n=7).
able E40
e T : Main Reason for Experiencing Difficulty in Filling Vacancies* - Natural Resources -
n % (N=18)
Urban Subdivision
L ence 7 .9 acking experi 38Diffic ng c 5 .8 Lacki cation 5 .8 Salar ctatio 5 7.8 Lacki c te 5 7.8 Workforce shortag 1
rmit 1 5.6 Other 1 5.6
ult worki onditions 27ng edu al/training qualifications 27y expe ns too high 2ng specifi chnical skills 2
e 5.6 Lacking proper license/pe
*Multiple responses allowed.
mong businesseA s experiencing difficulty in filling vacancies (n=18), general farm workers (n=5) was the
able E41
most difficult occupation to fill over the past 12 months. T : Top Three Occupations That Were Difficult to Fill Over the Past 12 Months* -
Natural Resources - Urban Subdivision
NOC Code Occupation Name n % (N=18)
8431 General farm workers 5 27.8 7411 Retail salespersons and sales clerks 2 11.1 7611 Construction trades helpers and labourers 2 11.1
*Multiple responses allowed.
6-35

2008 Employer Survey Summary Report Section 2.2.1 Industry 6 - Natural Resources Hiring and Recruitment – Urban Subdivision The large m rity of businesses in the natural resources industry (90%, n=87) did not haveajo any employees retir nths. Of the surveyed businesses that did experience retirement
=10), a total of 14 employees retired, averaging one employee per business. O ced employee retirement over the 2 mon n=10), general farm w 2) was the top occupation from which employees retired A sses in this industry (62%, n=60) do no pect any s to retire in the n businesses that expect employee retirement over this period (n=37), an a expected to retire, with retirement totaling 117 e oyees. M are expected to retire from the general farm worker n (14%, n=5).
able E42
e over the past 12 mo(n
f businesses that experien past 1 ths (orkers (n= .
lmost two-thirds of busine t ex employeeext five years. Of the surveyed
everage of three employees ar mpl
ost commonly, employees s occupatio
T : Top Three Occupations From Which Employees Are Expected to Retire Over the
NOC Code Occupation Name n % (N=37)
Next Five Years* - Natural Resources - Urban Subdivision
8431 General farm workers 5 13.5 8251 rm managers 4 10.8 7414 Delivery and courier service drivers 3 8.1
Farmers and fa
*Multiple responses allowed. S an businesses in the natural ources i ry (n=15) expect their owner/manager/CEO to retire within the next five years. F
ixteen percent of urb res ndust
igure E23: Businesses Expecting Owner/Manager/CEO to Retire in Next Five Years - Natural s – Urban Subdivision (N=97) Resource
No78%
YesDon't Know
Of businea formal or
16%6%
sses that expect their owner/manager/CEO to retire within the next five years (n=15), five have informal succession plan in place.
6-36

2008 Employer Survey Summary Report Section 2.2.2 Industry 6 - Natural Resources Hiring and Recruitment – Rural Subdivision 2.2.2 Rural Subdivision (N=246) Seventeen percent of rural businesses in the natural resou ormal human r plan including key elements such as recruitment, retention, c d safety. F
rces industry (n=42) have a fesources plan, that is, a written
fits, training, anompensation and bene
igure E24: Businesses with a Formal Human Reso s Plan - Resources – Rural ision (N=246)
urce NaturalSubdiv
Don't Know1% Yes
17%
No83%
L n=108) red at lea e new employee over th =108), an average w employees were hired. F total of 657 emplo s. G s the top occupation hired over the past 1 nths.
ess than one-half of rural businesses in this industry (44%, hi st one past 12 months. Of those who hired (n of five neurthermore, these surveyed businesses hired a yee
eneral farm workers (28%, n=30) wa 2 mo
Table E43: Top Five Occupations Hired in the Past 12 Months* - Natural Resources - Rural Subdivision
NOC Code Occupation Name n % (N=108)
8431 General farm workers 30 27.8 7421 Heavy equipment operators (except crane) 11 10.2
Fishing vessel skippers and fishermen/women 4 3.7
7411 Truck drivers 8 7.4 8432 Nursery and greenhouse workers 6 5.6 8262
*Multiple responses allowed.
f those wO ho hired new employees over the past 12 months (n=108), 69% (n=75) were fully satisfied with es.
hose not satisfied with at least one employee (n=33) reported on average, that they were not satisfied with 30% of the new employees hired.
their new hir T
6-37
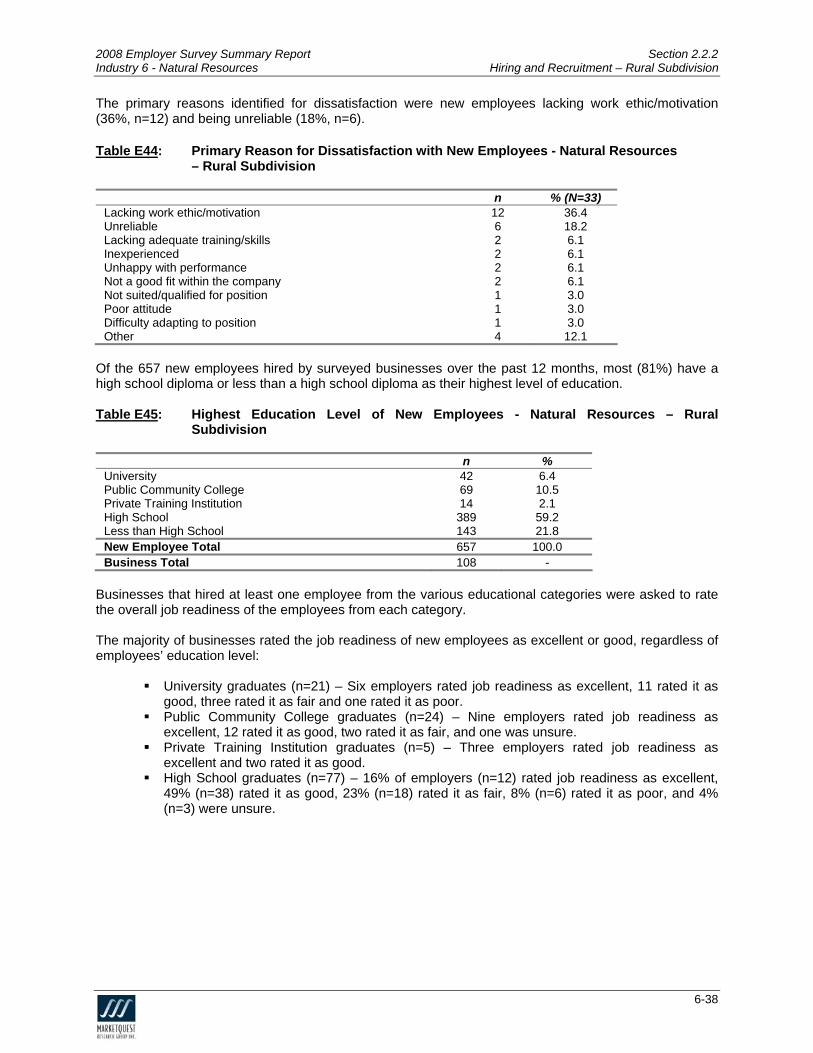
2008 Employer Survey Summary Report Section 2.2.2 Industry 6 - Natural Resources Hiring and Recruitment – Rural Subdivision The primary reasons identified for dissatisfaction were new employees lacking work ethic/motivation
n Table E44
(36%, n=12) a d being unreliable (18%, n=6).
: Primary Reason for Dissatisfaction ith New Employees - Natural Resources
n % (N=33)
w– Rural Subdivision
Lacking work hic/motivation 12 36.4 etUnreliable 6 18.2 Lacking adequate traini 2 6.1
xperienced 2 ance
he company ion
ng/skills Ine 6.1 Unhappy with perform
t2 6.1
Not a good fit within 2 6.1 Not suited/qualified for posit 1 3.0 Poor attitude 1 3.0 Difficulty adapting to position 1 3.0 Other 4 12.1
O esses over the past 12 mo , most (81%) have a h gh school diploma as their high t level of e ation. Table E45
f the 657 new employees hired by surveyed busin nthsigh school diploma or less than a hi es duc
: Highest Education Level of New Employee Natur esources – Rural Subdivision
s - al R
n % University 42 6.4 Public Community College 69 10.5 Private Training Institution 14 2.1
Less than High 143 21.8 New Employee Total 657 100.0
High School 389 59.2 School
B 108 - usiness Total Busin that h rious educational cat ories were d to rate the overall job rea employees from each category.
es rated the job readiness of new employees as excellent or good, regardless of mployees’ education level:
University graduates (n=21) – Six employers rated job readiness as excellent, 11 rated it as good, three rated it as fair and one rated it as poor.
esses ired at least one employee from the va eg askediness of the
The majority of businesse
Public Community College graduates (n=24) – Nine employers rated job readiness as excellent, 12 rated it as good, two rated it as fair, and one was unsure.
Private Training Institution graduates (n=5) – Three employers rated job readiness as excellent and two rated it as good.
High School graduates (n=77) – 16% of employers (n=12) rated job readiness as excellent, 49% (n=38) rated it as good, 23% (n=18) rated it as fair, 8% (n=6) rated it as poor, and 4% (n=3) were unsure.
6-38

2008 Employer Survey Summary Report Section 2.2.2 Industry 6 - Natural Resources Hiring and Recruitment – Rural Subdivision Among surveyed businesses that hired new employees over the past 12 months, a total of 7% were hired from each of the groups shown below. Table E46: Classifications of New Employees - Natural Resources – Rural Subdivision
n % Immigrants 10 1.5 Co-op students hired for work placement 12 1.8 Persons with disabilities 4 0.6
New EmployeeAboriginals 17 2.6
Total 657 6.5 Business Total 108 -
Busin were general, the methods they use to fill st g vacanc at occur. By far ost p ployee referrals (65 n=160). Table
esses asked to identify, in affin ies th, the m opular method used is word of mouth/em %,
E47: M d to Fill Staffing Vacancies* - Natural Resour - Rural Subdivision ethods Use ces
n % (N=246) Use word of mouth/employee referrals 160 65.0 Place ad in newspaper 50 20.3
ed
Post internally in 11 4.5 Place ad on or check internet/websites 10 4.1 Place ad on bulletin boards in local community 10 4.1 Place ad in student employment centres at colleges/universities 9 3.7 Don’t hire/never have vacancies/self-employed 8 3.3 Radio 7 2.8 Place ad in trade/professional/association journals 5 2.0 Use an employment agency/headhunter 5 2.0 Other 11 4.5 Don’t know 13 5.3
Place ad/use S rvice Canada Student Employment Centre 43 17.5 Use unsolicite resumes 30 12.2
your company/organization
*Multiple responses allowed. Over the past 12 months, 41% of rural businesses in the natural resources industry (n=100) have had at least one vacant position available. Those with at least one vacancy (n=100) reported an av e of five acancies. Furthermore, among these surveyed businesses, there were a total of 481 vacant positions.
f the 481 vacant positions available, 149 positions or 31% were vacant more than once throughout the ast 12 months.
eragv Op Furthermore, among these surveyed businesses, almost two-thirds (64%) of the positions available were seasonal. Table E48: Classification of Vacancies - Natural Resources – Rural Subdivision
n % Permanent 148 30.8 Casual/Contract 27 5.6 Seasonal 305 63.5 Vacancy Total 480 100.0 Business Total 9915 -
Businesses with missing data were excluded from this analysis. 15
6-39

2008 Employer Survey Summary Report Section 2.2.2 Industry 6 - Natural Resources Hiring and Recruitment – Rural Subdivision Businesses were asked if they have experienced any difficulty in filling vacancies. Approximately one-
uarter (26%, n=64) have experienced difficulty, 39% (n=97) have not, and 34% (n=83) have not hired or ttempted to hire.
igure E25
qa F : Businesses Experiencing Difficulty Filling Vacancies - Natural Resources – Rural
Subdivision (N=246)
Yes26%
Don't know1%
No39%
Have not hired/Attempted to
hire34%
The most common reasons for experiencing difficulty in filling vacancies were a workforce shortage (31%,
=20) and potential hires lacking experience (28%, n=18).
able E49
n T : Main Reason for Experiencing Difficulty in Filling Vacancies* - Natural Resources -
Rural Subdivision
n % (N=64)
Workforce shortage 20 31.3 Lacking experience 18 28.1 Difficult working conditions 13 20.3 Lacking educational/training qualifications 12 18.8 Salary expectations too high 9 14.1 Lacking specific technical skills 9 14.1 Lacking soft skills (such as communication/teamwork) 7 10.9 People not interested in employment 5 7.8 Position did not provide enough hours 2 3.1 Lacking proper license/permit 2 3.1 Location 2 3.1 Other 6 9.4
*Multiple responses allowed.
mong businesses experiencing difficulty in filling vacancies (n=64), general farm workers (25%, n=16) as the most difficult occupation to fill over the past 12 months.
able E50
Aw T : Top Four Occupations That Were Difficult to Fill Over the Past 12 Months* - Natural
Resources - Rural Subdivision
NOC Code Occupation Name n % (N=64)
8431 General farm workers 16 25.0 7421 Heavy equipment operators (except crane) 7 10.9 7411 Truck drivers 7 10.9 8262 Fishing vessel skippers and fishermen/women 4 6.3
*Multiple responses allowed.
6-40

2008 Employer Survey Summary Report Section 2.2.2 Industry 6 - Natural Resources Hiring and Recruitment – Rural Subdivision The large majority of business , n=220) did not have any employees retire over the past 1 t hat did experience retirement
=26), a total of 63 employees retired, averaging two employees per business. Of businesses that experienced empl months (n=26), heavy equipment operators (except crane) (n=6) was t oyees retired. Table E51
es in the natural resources industry (89%2 mon hs. Of those surveyed businesses t
(n
oyee retirement over the past 12he top occupation from which empl
: Top Four Occupati er the Past 12 Months* - Natural Resources
NOC Code Occupation Name n % (N=26)
ons From Which Employees Retired Ov – Rural Subdivision
7421 Heavy equipment operators (except crane) 6 23.1 8431 General farm workers 4 15.4 9619 Other labourers in processing, manufacturing and utilities 3 11.5 7411 Truck drivers 2 7.7
*Multiple responses allowed.
lmost two-thirds of businesses in this industry (63%, n=154) do not expect any employees to retire in the ext five years. Of those surveyed businesses that do expect employee retirement over this period =92), an average of three employees are expected to retire, with retirement totaling 370 employees.
ost commonly, employees are expected to retire from the general farm workers occupation (16%, =15).
able E52
An(n Mn T : Top Four Occupations From Which Employees Are Expected to Retire Over the
Next Five Years* - Natural Resources - Rural Subdivision
NOC Code Occupation Name n % (N=92)
8431 General farm workers 15 16.3 7421 Heavy equipment operators (except crane) 12 13.0
agers 10 10.9 6 6.5
8251 Farmers and farm man7411 Truck drivers
*Multiple responses allowed. Almost one-quarter of rural businesses in the natural resources industry (21%, n=51) expect their owner/manager/CEO to retire within the next five years. Figure E26: Businesses Expecting Owner/Manager/CEO to Retire in Next Five Years - Natural
Resources – Rural Subdivision (N=246)
No75%
YesDon't Know
21%5%
6-41

2008 Employer Survey Summary Report Section 2.2.2 Industry 6 - Natural Resources Hiring and Recruitment – Rural Subdivision Of businesses that expect their owner/manager/CEO to retire within the next five years (n=51), just over one-half (53%, n=27) have a formal or informal succession plan in place. Figure E27: Businesses with a Succession Plan - Natural Resources – Rural Subdivision (N=51)
No
Yes53%
37%
Don't Know
10%
6-42
2008 Employer Survey Summary Report Section 2.0 Industry 6 – Natural Resources Hiring and Recruitment Practices
2.3 Economic Regions
2.3.4 Southeast Region
2.3.1 Central Region
2.3.2 Northeast Region 2.3.3 Northwest Region
2.3.5 Southwest Region
6-43

2008 Employer Survey Summary Report Section 2.3.1 Industry 6 - Natural Resources Hiring and Recruitment – Central Region 2.3.1 Central Region (N=44)
LEASE NOTE THAT THE MARGIN OF ERROR FOR THIS ECONOMIC REGIONP IS ABOVE 10%,
u l resources industry (n=6) have a formal human
THEREFORE, FINDINGS SHOULD BE INTERPRETED WITH CAUTION.
ourteen percent of Central area businesses in the nat raFresources plan, that is, a written plan including key elements such as recruitment, retention, compensation and benefits, training, and safety.
igure E28F : Businesses with a Formal Human Resources Plan - Natural Resources – Central Region (N=44)
Don't Know3% 14%
Yes
No84%
Less one-h industry (43%, n=1 hired at l one new employee over th n=19), an average o ve new em es were hired. ermor nesses hired a total of 88 employees.
n=4) and truck drivers (n=3) were the top occupations hired over the past 12 onths .
over the past 12 months were fully satisfied with eir new hires. Those not satisfied with at least one employee (n=5) reported on average, that they were
The primary reasons identified for dissatisfaction were new employees being unreliable (n=3), lack of work ethic/motivation (n=1) and not suited/qualified for position (n=1). Of the 88 new employees hired by surveyed businesses over the past 12 months, most (92%) have high school or less than high school as their highest level of education. Table E53
than alf of Central area businesses in this onths. Of those who hired (
9) east e past 12 m f fi ploye
Furth e, these surveyed busi
General farm workers (16m
Fourteen of the 19 businesses that hired new employeesthnot satisfied with 38% of the new employees hired.
: Highest Education Level of New Employees - Natural Resources – Central Region
n % University 5 5.7 Public Community College 2 2.3 Private Training Institution - - High School 57 64.8 Less than High School 24 27.3 New Employee Total 88 100.0 Business Total 19 -
16 Multiple responses allowed.
6-44

2008 Employer Survey Summary Report Section 2.3.1 Industry 6 - Natural Resources Hiring and Recruitment – Central Region Businesses that hired at least one employee from the various educational categories were asked to rate the overall job readiness of the employees from each category.
he majority of businesses rated the job readiness of new employees as excellent or good, regardless of mployees’ education level:
University graduates (n=4) – One employer rated job readiness as excellent, two rated it as good, and one rated it as fair.
Public Community College graduates (n=1) – This employer rated job readiness as good. High School graduates (n=17) – Four employers rated job readiness as excellent, nine rated it
as good, three rated it as fair and one rated it as poor.
mong surveyed businesses that hired over the past 12 months, 17% of the new employees hired were boriginals.
able E54
Te
Aa T : Classifications of New Employees - Natural Resources – Central Region
n %
Immigrants 5 5.7 Co-op students hired for work placement 1 1.1
- - 15 17.0
Persons with disabilities Aboriginals New Employee Total 88 23.8 Business Total 19 -
usinesses were asked to identify, in general, thB e methods they use to fill staffing vacancies that occur.
Table E55
By far, the most popular method used is word of mouth/employee referrals (64%, n=28).
: Fill Staffing Vacancies* - Natural Resources - Central Region
Methods Used to
n % (N=44) Use word of mouth/employee referrals 28 63.7 Place ad/use Service Canada Student Employment Centre 7 15.9 Place ad in newspaper 6 13.4
3 7.0 1 2.5
tud
Place ad on bull in local community 1 1.9 Post internally in your company/organization 1 1.9 Other 3 .0 Don’ 2
Use an employment agency/headhunter 3 7.6 Use unsolicited resumes Recruit from other companies Place ad in s ent employment centres at colleges/universities 1 2.5 Radio 1 2.5
etin boards
7t know 4.5
*Multip nses a
le respo llowed.
6-45

2008 Employer Survey Summary Report Section 2.3.1 Industry 6 - Natural Resources Hiring and Recruitment – Central Region Over the pas 2 months, 33% of Central area businesses in the natural resources industry (n=15)t 1 have had at least one le. Those with at least one vacancy (n=15) reported an average of ve vacancies. Furthermore, among these surveyed businesses, there were a total of 73 vacant
positions. O ilable among these surveyed businesses, 27 pos or 37% were vacant m throughout the past 12 months. F eyed businesses, over one-half (59%) of the s available were
vacant position availabfi
f the 73 vacant positions ava itionsore than once
urthermore, among these surv positionseasonal.
able E56T : Classification of Vacancies - Natural Resources – Central Region
n % Permanent 23 31.5 Casual/Contract 7 9.6
nal 43 8.9 0.0
Seaso 5Vacancy Total 73 10Business Total 15 -
B if they have experienced any difficult filling vac s. Eighteen percent (n=8) h ulty, 45% (n=20) have not, and 37% (n=16) have n d to hire.
usinesses were asked y in ancieave experienced diffic ot hired or attempte
Figure E29: Businesses Experiencing Difficulty Filling Vacancies - Natural Resources – Central Region (N=44)
Yes18%
No45%
ses that have experig difficulty were potential
Have not
hire37%
Of busines enced difficulty in filling vacancies (n=8), the main reasons for xperiencin hires lacking educational training/qualifications (n=3), lacking
mong businesses experiencing difficulty in filling vacancies (n=8), general farm workers (n=2) was the oc
arge majority of businesses in the natural resources industry (85%, n=38) did not have any e etire over the past 12 months. Of the surveyed sinesses that did experience retirement ( eraging one employee per business O es that experienced employee retirement over e past 12 nths (n=6), general farm w top occupation from which employees retired19.
hired/Attempted to
eexperience (n=3), not being interested in employment (n=2) and other reasons (n=3)17. Amost difficult cupation to fill over the past 12 months18. The l
mployees r bun=6), a total of 8 employees retired, av .
f business th moorkers (n=2) was the
Multiple responses allowed.
18 Multiple responses allowed. 19 Multiple responses allowed.
17
6-46

2008 Employer Survey Summary Report Section 2.3.1 Industry 6 - Natural Resources Hiring and Recruitment – Central Region Over one-half of businesses in this industry (59%, n=26) do not expect any employees to retire in the next ve years. Of the surveyed businesses that expect employee retirement over this period (n=18), an verage of three employees are expected to retire, with retirement totaling 52 employees.
ost commonly, employees are expected to retire from the general farm workers and heavy equipment perators (except crane) occupations (n=3 each).
able E57
fia Mo T : Top Five Occupations From Which Employees Are Expected to Retire Over the
Next Five Years* - Natural Resources - Central Region
% (N=18)
NOC Code Occupation Name n 8431 General farm workers 3 18.7 7421 Heavy equipment operators (except crane) 3 14.1 7411 Truck drivers 2 10.9 0621 Retail trade managers 10.9
ervice drivers 12.5 2 27414 Delivery and courier s
* A minority of Central area businesses in the natural resourc industry (13%, n=6) expect their owner/manager/CEO to retire within the next five years. F
Multiple responses allowed.
es
igure E30: Businesses Expecting Owner/Manager/CEO to tire in N Five Years - Natural ion (N=44)
Re ext Resources – Central Reg
No83%
Yes13%
Don't Know5%
six five years have formal or informal succession plan in place.
None of the businesses that expect their owner/manager/CEO to retire within the next a
6-47

2008 Employer Survey Summary Report Section 2.3.2 Industry 6 - Natural Resources Hiring and Recruitment – Northeast Region 2.3.2 Northeast Region (N=115)
Thirteen percen es in the natural resources industry (n=14) have a formal human resources plan, that is, a written plan including key elements such as recruitment, retention, compensation and benefits, training, and safety. Figure E31
t of Northeast area business
: Businesses with a Formal Human Resources Plan - Natural Resources – Northeast Region (N=115)
Don't Know2%
No86%
Yes13%
Less than one-half of Northeast area businesses in this industry 0%, n at least one new e ast 12 months. Of those who hired (n=46), an erage of five new employees were h nesses hired a total of 267 employees. G %, n=7) and heavy equipment operator xcept cr (13%, n=6) were the to e past 12 months. T
(4 =46) hiredmployee over the p avired. Furthermore, these surveyed busi
eneral farm workers (14 s (e ane) p occupations hired over th
able E58: Top Six Occupations Hired in the Past 12 Mont Natura sources – Northeast Region
cupation Name n % (N=46)
hs* - l Re
NOC Code Oc 8431 General farm workers 7 14.1 7421 Heavy equipment operators (except crane) 6 12.9
3 6.1 7612 Other trades helpers and labourers 3 5.5
8262 Fishing vessel skippers and fishermen/women 3 7.4 7433 Deck crew, water transport 3 6.1 8432 Nursery and greenhouse workers
*Multiple responses allowed.
uarters of businesses that hired new employeJwust over three-q es over the past 12 months (78%, n=36) e with their new hi fied with at least one em oyee (n on
ave the ployees hired. The p reas employees lacking w ethic/motivation (n=4).
able E59
re fully satisfied ra at
res. Those not satis pl =10) reportedge, th y were not satisfied with 20% of the new em
rimary on identified for dissatisfaction was new ork T : Primary Reason for Dissatisfaction with New Employees - Natural Resources
10)
– Northeast Region
n % (N=Lacking work ethic/motivation 4 42.9 Lacking adequate training/skills 1 11.4 Inexperienced 1 11.4 Unhappy with performance 1 8.6 Not a good fit within the company 1 8.6 Other 2 17.2
6-48

2008 Employer Survey Summary Report Section 2.3.2 Industry 6 - Natural Resources Hiring and Recruitment – Northeast Region Of the 267 new employees hired by surveyed businesses over the past 12 months, 62% have a high school diploma as their highest level of education. Table E60: Highest Education Level of New Employees - Natural Resources – Northeast
Region
n % University 20 7.5 Public Community College 38 14.2 Private Training Institution 10 3.7 High School 165 61.8 Less than High School 34 12.7 New Employee Total 267 100.0 Business Total 46 -
Businesses that hired at least one employee from the various educational categories were asked to rate
e overall job readiness of the employees from each category.
as g r. Public Community College graduates (n=12) – Seven employers rated job readiness as
excellent and six rated it as good.
19% of employers (n=6) rated job readiness as excellent, 48% (n=15) rated it as good, 25% (n=8) rated it as fair, 5% (n=2) rated it as poor, and one employer was unsure.
Among surveyed businesses that hired new employees over the past 12 months, a total of 6% were hired from each of the groups shown below. Table E61
th The majority of businesses rated the job readiness of new employees as excellent or good, regardless of mployees’ education level: e
University graduates (n=8) – Three employers rated job readiness as excellent, three rated it
ood, one rated it as fair, and one rated it as poo
Private Training Institution graduates (n=3) – Two employers rated job readiness as excellent and one rated it as good.
High School graduates (n=32) –
: Classifications of New Employees - Natural Resources – Northeast Region
n % Immigrants 5 1.9 Co-op students hired for work placement 7 2.6 Persons with disabilities 2 0.8 Aboriginals 1 0.4 New Employee Total 265 5.7 Business Total 4520 -
20 Businesses with missing data were excluded from this analysis.
6-49
2008 Employer Survey Summary Report Section 2.3.2 Industry 6 - Natural Resources Hiring and Recruitment – Northeast Region Businesses were asked to identify, in general, the methods they use to fill staffing vacancies that occur.
y far, the most popular method used is word of mouth/employee referrals (74%, n=85).
able E62
B T : Methods Used to Fill Staffing Vacancies* - Natural Resources - Northeast Region
n % (N=115)
Use word of mouth/employee referrals 85 73.9 Place ad/use Service Canada Student Employment Centre 17 14.7 Use unsolicited resumes 16 13.8 Place ad in newspaper 15 13.3 Radio 3 3.0 Place ad on or check internet/websites 3 2.5 Don’t hire/never have vacancies/self-employed 3 2.2 Post internally in your company/organization 3 2.2 Other 9 6.6 Don’t know 5 4.7
*Multiple responses allowed.
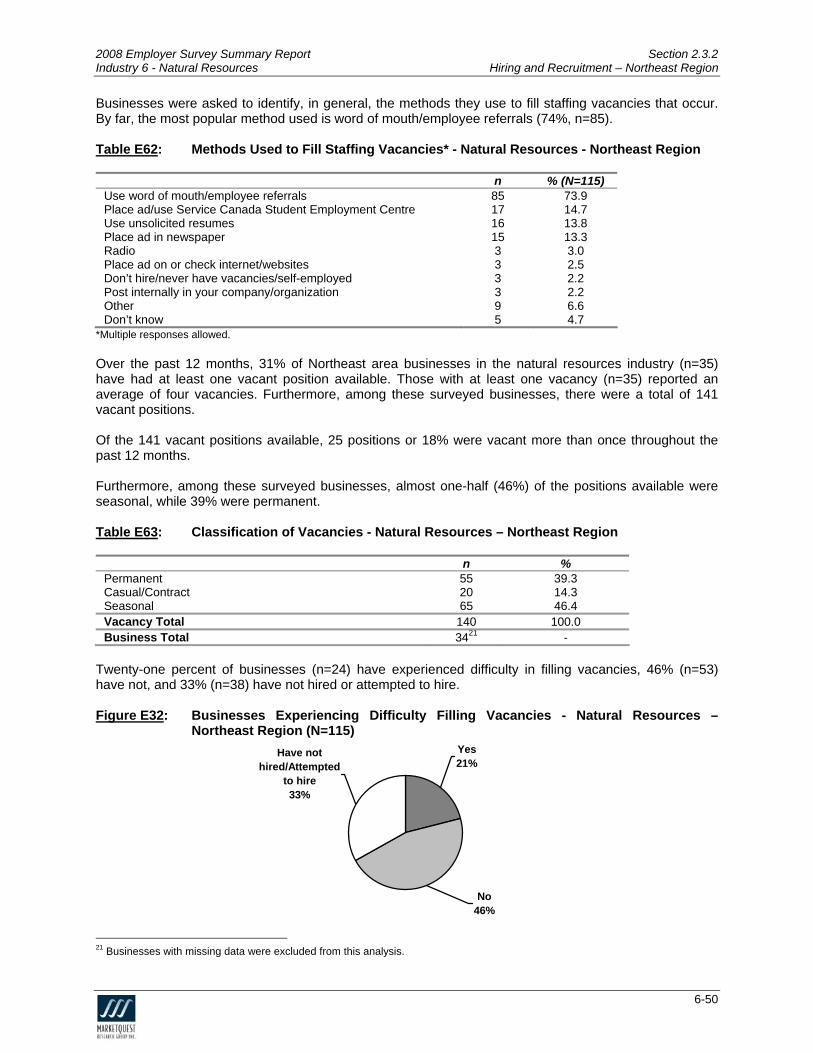
ver the past 12 months, 31% of Northeast area businesses in the natural resources industry (n=35) have had at least one vacant position available. Those with at least one vacancy (n=35) reported an verage of four vacancies. Furthermore, among these surveyed businesses, there were a total of 141
sitions.
f the 141 vacant positions available, 25 positions or 18% were vacant more than once throughout the ast 12 months.
Furthermore, among these surveyed businesses, almost one-half (46%) of the positions available were easonal, while 39% were permanent.
able E63
O
avacant po Op
s T : Classification of Vacancies - Natural Resources – Northeast Region
n %
Permanent 55 39.3 Casual/Contract 20 14.3 Seasonal 65 46.4 Vacancy Total 140 100.0 Business Total 3421 -
Twenty-one percent of businesses (n=24) have experienced difficulty in filling vacancies, 46% (n=53) have not, and 33% (n=38) have not hired or attempted to hire. Figure E32: Businesses Experiencing Difficulty Filling Vacancies - Natural Resources –
Northeast Region (N=115) Yes21%
No46%
Have not hired/Attempted
to hire33%
21 Businesses with missing data were excluded from this analysis.
6-50
2008 Employer Survey Summary Report Section 2.3.2 Industry 6 - Natural Resources Hiring and Recruitment – Northeast Region Of businesses that have experienced difficulty in filling vacancies (n=24), the main reason for
dif Table E64
experiencing ficulty was potential hires lacking experience (n=11).
: Main Reason for Experiencing Difficulty in Filling Vacancies* - Natural Resources – Northeast Region
n % (N=24) Lacking experience 11 47.1 Lacking educational/training qualifications 8 34.1 Lacking specific technical skills 7 27.0 Workforce shortage 6 24.7 Difficult working conditions 5 22.3 Salary expectations too high 3 14.1 Lacking soft skills (such as communication/teamwork) 2 7.1 Lacking proper license/permit 2 7.1 Location 2 7.1 People not interested in employment 1 3.5 Position did not provide enough hours 1 3.5 Other 1 4.7
*Multiple responses allowed.
mong businesses experiencing difficulty in filling vacancies (n=24), general farm workeA rs (n=5) was the most difficult occupation to fill over the past 12 months. Table E65: Top Three Occupations That Were Difficult to Fill Over the Past 12 Months* -
Natural Resources – Northeast Region
NOC Code Occupation Name n % (N=24) 8262 Fishing vessel skippers and fishermen/women 5 18.8 8431 General farm workers
ent operators (except cran4 15.3
7421 Heavy equipm e) 3 14.1 *Multiple responses allowed. The large majority of businesses in the natural resources industry (89%, n=102) did not have any employees retire over the past 12 months. Of those surveyed businesses that did experience retirement (n=12), a total of 25 employees retired, averaging two employees per business. Of businesses that experienced employee retirement over the past 12 months (n=12), heavy equipment operators (except crane) and other labourers in processing, manufacturing and utilities (n=2 each) were
e top occupations from which employees retired22.
Almost two-third dustry (63%, n=72) do not expect any employees to retire in the ext five years. Of those surveyed businesses that do expect employee retirement over this period
(n=43), an average of three employees are expected to retire, with retirement totaling 172 employees. M are expected to retire from the heav ent ators (except crane) o farmers and farm managers occupa (9%, n=
th
s of businesses in this inn
ost commonly, employees y equipm operccupation (10%, n=4) and the tion 4)23.
22 Multiple responses allowed. 23 Multiple responses allowed.
6-51

2008 Employer Survey Summary Report Section 2.3.2 Industry 6 - Natural Resources Hiring and Recruitment – Northeast Region Approximatel ne-quarter of Northeast area businesses in the natural resources industry (24%, n=27)
er/managy o
expect their own er/CEO to retire within the next five years.
Figure E33
: Businesses Expecting Owner/Manager/CEO to Retire in Next Five Years - Natural Resources – Northeast Region (N=115)
No70%
Yes4%
Don't Know7%
Of the 2formal or in
2
7 businesses that expect their owner/manager/CEO to retire within the next five years, 14 have a formal succession plan in place.
6-52

2008 Employer Survey Summary Report Section 2.3.3 Industry 6 - Natural Resources Hiring and Recruitment – Northwest Region 2.3.3 Northwest Region (N=81) A ses in the natural resources in try (8% ve a formal human r plan including key elements such a cruitment, retention, c F
minority of Northwest area businesis, a written
dus , n ha=7) esources plan, that s reompensation and benefits, training, and safety.
igure E34: Businesses with a Formal Human Resources Plan - Natural Resources – Northwest Region (N=81)
No92%
Yes8%
e past 12 months. Of those who hired (n=35), an average of four new employees were ired. Furthermore, these surveyed businesses hired a total of 150 employees.
m workers (49%, n=17) was the top occupation hired over the past 12 months.
Less than one-half of Northwest area businesses in this industry (43%, n=35) hired at least one new employee over thh General far Table E66: Top Three Occupations Hired in the Past 12 Months* - Natural Resources –
Northwest Region
Occupation Name % (N=35) NOC Code n 8431 General farm workers 49.2 17 8421 Chainsaw and skidder operators 9.0
Truck drivers 7.4 3
7411 3 *Multiple responses allowed.
f the businesses that hired new employees over the past 12 months (n=35), 74% (n=26) were fully atisfied with their new hires. Those not satisfied with at least one employee (n=9) reported on average, at they were not satisfied with 32% of the new employees hired.
he primary reasons identified for dissatisfaction were new employees being unreliable (n=3) and lacking ork ethic/motivation (n=2).
able E67
Osth Tw T : Primary Reason for Dissatisfaction with New Employees - Natural Resources
– Northwest Region
n % (N=9)
Unreliable 3 32.2 Lacking work ethic/motivation 2 19.4 Lacking adequate training/skills 1 9.7 Inexperienced 1 9.7 Unhappy with performance 1 9.7 Poor attitude 1 9.7 Other 1 9.7
6-53

2008 Employer Survey Summary Report Section 2.3.3 Industry 6 - Natural Resources Hiring and Recruitment – Northwest Region Of the 150 ne employees hired by surveyed businesses over the past 12 months, many (79%) have
ss than high school as their w
high school or le highest level of education. Table E68: Highest Education Level of New Employees - Natural Resources – Northwest
Region
n % University 11 7.3 Public Communit 20 13.3
raining Institution 1 073 4846 30.7 150 100.0
y College Private THigh Sc
.7 .7 hool
Less than High School al New Employee Tot
Business Total 35 - B loyee from the various educational cate s were asked to rate th he employees from each category. The majority of businesses rated the job readiness of new employees as excell r good, regardless of
vel:
blic Community College graduates (n=7) – Three employers rated job readiness as
r.
usinesses that hired at least one emp goriee overall job readiness of t
ent oemployees’ education le
University graduates (n=5) – One employer rated job readiness as excellent, three rated it as good, and one rated it as fair.
Puexcellent and four rated it as good.
Private Training Institution graduates (n=1) – This employer rated job readiness as excellent. High School graduates (n=21) – Six employers rated job readiness as excellent, 11 rated it as
good, two rated it as fair and two rated it as poo Among surveyed businesses that hired over the past 12 months, 6% of the new employees hired were aboriginals. Table E69: Classifications of New Employees - Natural Resources – Northwest Region
n % Immigrants - - Co-op students hired for work placement 2 1.3 Persons with disabilities 1 0.7
150 8.0 Aboriginals 9 6.0 New Employee Total Business Total 35 -
6-54
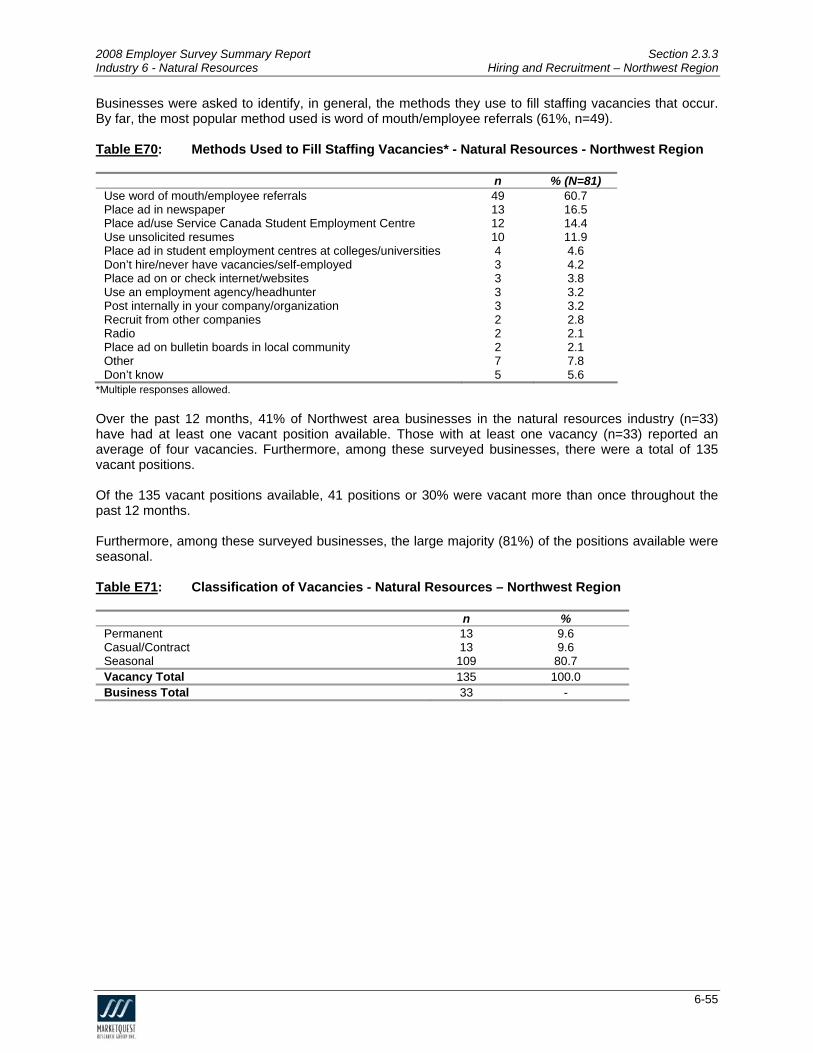
2008 Employer Survey Summary Report Section 2.3.3 Industry 6 - Natural Resources Hiring and Recruitment – Northwest Region Businesses were asked to identify, in general, the methods they use to fill staffing vacancies that occur.
popular method used is word of mouth/emBy far, the most ployee referrals (61%, n=49). Table E70: Methods Used to Fill Staffing Vacancies* - Natural Resources - Northwest Region
n % (N=81) Use word of mouth/employee referrals 49 60.7 Place ad in newspaper 13 16.5 Place ad/use Service Canada Student Employment Centre 12 14.4 Use unsolicited resumes 10 11.9 Place ad in student employment centres at colleges/universities 4 4.6 Don’t hire/never have vacancies/self-employed 3 4.2 Place ad on or check internet/websites 3 3.8 Use an employment agency/headhunter 3 3.2 Post internally in your company/organization 3 3.2
2 2.1 Other 7 7.8 Don’t know 5 5.6
Recruit from other companies 2 2.8 Radio 2 2.1 Place ad on bulletin boards in local community
*Multiple responses allowed.
ver the past 12 months, 41% of Northwest area businesses in the natural resources industry (n=33) ave had at least one vacant position available. Those with at least one vacancy (n=33) reported an verage of four vacancies. Furthermore, among these surveyed businesses, there were a total of 135 acant positions.
f the 135 vacant positions available, 41 positions or 30% were vacant more than once throughout the ast 12 months.
urthermore, among these surveyed businesses, the large majority (81%) of the positions available were easonal.
able E71
Ohav Op Fs T : Classification of Vacancies - Natural Resources – Northwest Region
n %
Permanent 13 9.6 Casual/Contract 13 9.6 Seasonal 109 80.7 Vacancy Total 135 100.0 Business Total 33 -
6-55

2008 Employer Survey Summary Report Section 2.3.3 Industry 6 - Natural Resources Hiring and Recruitment – Northwest Region Businesses were asked if they have experienced any difficulty in filling vacancies. Twenty percent (n=16) have experienced difficulty, 45% (n=37) have not, and 33% (n=26) have not hired or attempted to hire. Figure E35: Businesses Experiencing Difficulty Filling Vacancies - Natural Resources –
Northwest Region (N=81) Yes20%
Don't know2%Have not
hired/Attempted to hir
No45%
e33%
able E72
Of businesses that have experienced difficulty in filling vacancies (n=16), the main reasons for experiencing difficulty were a workforce shortage (n=5) and difficult working conditions (n=5). T : Main Reason for Experiencing Difficulty in Filling Vacancies* - Natural Resources –
n % (N=16)
Northwest Region
Workforce s age 5 31.6 hortDifficult working 5 29.8 Lacking experience 4 22.8
ng specific technical skills munication/teamwork)
ations
ours
conditions
Lacki 3 17.5 Lacking soft skills (such as com
ucational/training qualific3 15.8
Lacking ed 1 5.3 Salary expectations too high 1 5.3 Position did not provide enough h 1 5.3 Other 1 5.3
*Multiple responses allowed.
mong businesses experiencing difficulty in filling vacancies (n=16), general farm workers (n=7), truck rivers (n=3) and farmers and farm managers (n=2) were the most difficult occupations to fill over the past 2 months24.
nce retirement (n=4), a total of 4 tir
f businesses that experienced employee retirement over the past 12 months (n=4), general farm rs (n=3) was the top occupation from which employees retired25.
T n this industry (66%, n=53) do no ect any yees to retire in the next five years. Of those surveyed businesses that do expect employee retirem ver this period (n=27), an a e employee is expected to retire, with retirement totaling 39 e yees. M yees are expected to retire from the g al farm w (n=10) and farmers and fa =5) occupations26.
Ad1 Almost all businesses in the natural resources industry (95%, n=76) did not have any employees retire
ver the past 12 months. Of those surveyed businesses that did experieoemployees re ed, averaging one employee per business. Oworke
wo-thirds of businesses i t exp emploent o
verage of on mplo
ost commonly, emplo ener orkers rm managers (n
24 Multiple responses allowed. 25 Multiple responses allowed. 26 Multiple responses allowed.
6-56

2008 Employer Survey Summary Report Section 2.3.3 Industry 6 - Natural Resources Hiring and Recruitment – Northwest Region Nineteen percent of Northwest area businesses in the natural resources industry (n=16) expect their owner/manager/CEO to retire within the next five years. Figure E36: Businesses Expecting Owner/Manager/CEO to Retire in Next Five Years - Natural
Resources – Northwest Region (N=81)
No76%
19%5%
6 b have a rmal succession plan in place.
YesDon't Know
ine of the 1 usinesses that expect their owner/manager/CEO to retire within the next five yearsN
formal or info
6-57

2008 Employer Survey Summary Report Section 2.3.4 Industry 6 - Natural Resources Hiring and Recruitment – Southeast Region 2 PLEASE NOTE THAT THE MARGIN OF ERROR FOR THIS ECONOMIC REGION IS ABOVE 10%, T E, FINDINGS SHOULD BE INTERPRETED WITH CAUTION.
hirteen percent of Southeast area businesses in the natural resources industry (n=6) have a formal
.3.4 Southeast Region (N=44)
HEREFOR Thuman resources plan, that is, a written plan including key elements such as recruitment, retention, compensation and benefits, training, and safety. Figure E37: Businesses with a Formal Human Resources Plan - Natural Resources – Southeast
Region (N=44)
No87%
Yes13%
pproximately one-half of Southeast area businesses in this industry (52%, n=23) hired at least one new mployee over the past 12 months. Of those who hired (n=23), an average of nine new employees were ired. Furthermore, these surveyed businesses hired a total of 383 employees.
eneral farm workers (n=5) and retail salespersons and sales clerks (n=4) were the top occupations ired over the past 12 months27.
f the businesses that hired new employees over the past 12 months (n=23), 52% (n=12) were fully atisfied with their new hires. Those not satisfied with at least one employee (n=11) reported on average, at they were not satisfied with 30% of the new employees they hired.
he primary reasons identified for dissatisfaction were new employees lacking work ethic/motivation and eing unreliable (n=3 each).
Aeh Gh Osth Tb Table E73: Primary Reason for Dissatisfaction with New Employees - Natural Resources
– Southeast Region
n % (N=11) Lacking work ethic/motivation 3 29.9 Unreliable 3 25.1 Not suited/qualified for position 2 17.5 Lacking adequate training/skills 1 10.0 Poor attitude 1 10.0 Inexperienced 1 7.5
27 Multiple responses allowed.
6-58

2008 Employer Survey Summary Report Section 2.3.4 Industry 6 - Natural Resources Hiring and Recruitment – Southeast Region Of the 383 new employees hired by surveyed businesses over the past 12 months, many (79%) have
le Table E74
high school or ss than high school as their highest level of education.
: Highest Education Level of New Employees - Natural Resources – Southeast Region
n % University 19 5.0 Public Community College 63 16.4 Private Training Institution 1 0.3 High School 205 53.5 Less than High School 96 25.1 New Employee Total 383 100.0 Business Total 23 -
du
University graduates (n=6) – Two employers rated job readiness nt and four rated it
ty College graduates (n=6) – Five employers rated job readiness as good and
Institution graduates (n=1) – This employer rated jo iness as good. ) – 13 employers rated job readiness as good and two rated it as
sses that hired over the past 12 months, 24% of the new employees hired were
Businesses that hired at least one employee from the various educational categories were asked to rate the overall job readiness of the employees from each category. The majority of businesses rated the job readiness of new employees as excellent or good, regardless of employees’ e cation level:
as excelleas good.
ommuni Public Cone rated it as fair.
Private Training b read High School graduates (n=15
fair.
Among surveyed busineaboriginals. Table E75: Classifications of New Employees - Natural Resources – Southeast Region
n % Immigrants 1 0.3 Co-op students hired for work placement 2 0.5 P sabilities 2 0.5 Abori 90 23.5 New ee T 383 24.8
ersons with diginals Employ otal
Bus otal 23 - iness T
6-59

2008 Employer Survey Summary Report Section 2.3.4 Industry 6 - Natural Resources Hiring and Recruitment – Southeast Region Businesses were asked to identify, in general, the methods they use to fill staffing vacancies that occur.
popular method used is word of mouth/empBy far, the most loyee referrals (62%, n=27).
Ta
ble E76: Methods Used to Fill Staffing Vacancies* - Natural Resour - Southeast Region
n % =44)
ces
(NUse f mout 27 1.7 word o h/employee referrals 6Plac e Serv 10 3.4 Plac newsp 7 6.2 Don’ ever hUse ited rePlac stude ges/universities 3
rnet/websites 2 4.5 Place ad on bulletin boards in local community 2 3.9
e ad/us ice Canada Student Employment Centre 2e ad in aper 1t hire/n ave vacancies/self-employed 4
sumes 4 9.7
unsolic 8.4 e ad in nt employment centres at colle 5.9
Place ad on or check inte
Use an employment agency/headhunter 1 2.6 Post internally in your company/organization 1 2.6 Signs/flyers/pamphlets 1 2.6 Place ad in trade/professional/association journals 1 2.0 Radio 1 2.0 Other 1 2.0 Don’t know 3 7.1
*Multiple responses allowed. Over the past 12 months, 44% of Southeast area businesses in the natural resources industry (n=19) ha e vacant pos se with at least one vacancy (n= n avera seven d businesse here were al of 314 vacan tions. Of the 314 vacan 6% were vacant mor han once t ghout the
ve had at least on ition available. Tho 19) reported age of vacancies. Furthermore, among these surveye
s, t a tot
t posi
t positions available, 113 positions or 3 e t hroupast 12 months. Furthermore, among these surveyed businesses, approximately three-quarters (76%) of the positions available were seasonal. Table E77: Classification of Vacancies - Natural Resources – Southeast Region
n % Permanent 55 17.5 Casual/Contract 22 7.0 Seasonal 237 75.5 Vacancy Total 314 100.0 Business Total 19 -
6-60

2008 Employer Survey Summary Report Section 2.3.4 Industry 6 - Natural Resources Hiring and Recruitment – Southeast Region Businesses were asked if they have experienced any difficulty in filling vacancies. One-third (33%, n=14)
Figure E38
have experienced difficulty, 28% (n=12) have not, and 39% (n=17) have not hired or attempted to hire.
: Businesses Experiencing Difficulty Filling Vacancies - Natural Resources – Southeast Region (N=44)
Yes33%
No28%
Have not hired/Attempted
to hire39%
Of businesses that have experienced difficulty in filling vacancies (n=14), the main reasons for experiencing difficulty were salary expectations being too high (n=5) and a workforce shortage (n=5). Table E78: Main Reason for Experiencing Difficulty in Filling Vacancies* - Natural Resources –
n % (N=14)
Southeast Region
Salary expectations too high 5 37.1 Workforce shortage 5 31.4 Lacking experience 4 Difficult working conditions 3
27.4 21.5
Lacking educational/training qualifications 3 19.6 Lacking specific technical skills 3 19.6 Other 2 11.8
*Multiple responses allowed. Among businesses experiencing difficulty in filling vacancies (n=14), general farm workers (n=3) was the
ost difficult occupation to fill over the past 12 months. m Table E79: Top Three Occupations That Were Difficult to Fill Over the Past 12 Months* -
Natural Resources – Southeast Region
e Occupation Name % (N=14)
NOC Cod n 8431 General farm workers 19.6 3 6421 Retail sa
Heavy equilespersons and sales clerks 15.6
pment operators (except crane) 11.8 2
7421 2* T businesses in the natural resource ustry ( 7) did not have any
Multiple responses allowed.
he large majority of s ind 84 , n=3%employees retire over the past 12 months. Of those surveyed businesses that did experience retirement (n=7), a total of 18 employees retired, averaging three employee per business.
6-61

2008 Employer Survey Summary Report Section 2.3.4 Industry 6 - Natural Resources Hiring and Recruitment – Southeast Region The top c Table E80
oc upations from which employees retired are presented in the table below.
: s* -
NOC Code Occupation Name n % (N=7)
Top Eight Occupations From Which Employees Retired Over the Past 12 MonthNatural Resources – Southeast Region
7312 Heavy-duty equipment mechanics 1 16.6 6421 Retail salespersons and sales clerks 1 16.6 7611 Construction trades helpers and labourers 1 16.6
9431 Sawmill machine operators 1 12.6 Other labourers in processing, manufacturing and utilities 1 12.6
ing 12.6
9617 Labourers in food, beverage and tobacco processing 1 16.6 7421 Heavy equipment operators (except crane) 1 12.6
9619 9618 Labourers in fish process 1
* O esses in this industry (57%, n=25) do n xpect any em oyees to retire in the next five years. Of those surveyed businesses that do expect employee retirem ver this period (n=19), an
employees are expected to retire, with retire mployees.
Multiple responses allowed.
ver one-half of busin ot e plent o
a
verage of seven ment totaling 124 e
Most commonly, employees are expected to retire from the retail trade managers occupation (n=3).
able E81T : Top Five Occupations From Which Employees Are Expected to Retire Over the
NOC Code Occupation Name % (N=19)
Next Five Years* - Natural Resources - Southeast Region
n 0621 Retail trade managers 3 14.9 7411 Construction trades helpers and labourers 2 11.9
2 11.9 2 9.0
ept crane) 2 9.0
1221 Administrative officers 8431 General farm workers 7421 Heavy equipment operators (exc
* E es in the natural resources in ry (n=8) expect their o e years. Figure E39
Multiple responses allowed.
ighteen percent of Southeast area businesse next fiv
dustwner/manager/CEO to retire within th
: Businesses Expecting Owner/Manager/CEO to Retire in N Five Years - Natural Resources – Southeast Region (N=44)
ext
No78%
Yes18%5%
Don't Know
ses that expect their owner/manager/CEO to retire within the next five years
l o
Three of the eight busineshave a forma r informal succession plan in place.
6-62

2008 Employer Survey Summary Report Section 2.3.5 Industry 6 - Natural Resources Hiring and Recruitment – Southwest Region 2 uthwest Region (N=35)
N OF ERROR FOR THIS ECONOMIC REGION IS ABOVE 10%,
al cea
Figure E40
.3.5 So
PLEASE NOTE THAT THE MARGITHEREFORE, FINDINGS SHOULD BE INTERPRETED WITH CAUTION. Forty percent of Southwest area businesses in the natural resources industry (n=14) have a formhuman resour s plan, that is, a written plan including key elements such as recruitment, retention, compensation nd benefits, training, and safety.
: Businesses with a Formal Hum n Resources Plan - Natural Resources – aSouthwest Region (N=35)
No60%
Yes40
nder one-half of Southwest area businesses in this industry (45%, n=16) hired at least one new
al of 115 employees.
isfied with 33% of the new employees they hired.
han high school as their highest level of education.
%
Uemployee over the past 12 months. Of those who hired (n=16), an average of seven new employees were hired. Furthermore, these surveyed businesses hired a tot General farm workers (n=4) and mine labourers (n=3) were the top occupations hired over the past 12 months28. Of the businesses that hired new employees over the past 12 months (n=16), 56% (n=9) were fully satisfied with their new hires. Those not satisfied with at least one employee (n=7) reported on average, that they were not sat The primary reasons identified for dissatisfaction were new employees lacking work ethic/motivation (n=3), lacking adequate training/skills (n=1), not a good fit within the company (n=1), difficulty adapting to position (n=1) and other reasons (n=1). Of the 115 new employees hired by surveyed businesses over the past 12 months, the large majority (83%) have high school or less t Table E82: Highest Education Level of New Employees - Natural Resources – Southwest
Region
n % Univ 10 8.7 ersity Publ munity 9 7.8 Priva ning In 0.9
83 72.2 Less than High School 12 10.4 New Employee Total 115 100.0
ic Com College te Trai stitution 1
High School
Business Total 16 - 28 Multiple responses allowed.
6-63

2008 Employer Survey Summary Report Section 2.3.5 Industry 6 - Natural Resources Hiring and Recruitment – Southwest Region Businesses that hired at least one employee from the various educational categories were asked to rate the overall job readiness of the employees from each category.
employees’ edu
University graduates (n=6) – Four employers rated job readiness as excellent, two rated it as good, and one rated it as fair.
Public Community College graduates (n=5) – One employer rated job readiness as excellent, three rated it as good, one rated it as fair, and one was unsure.
Private Training Institution graduates (n=1) – This employer rated job readiness as good. High School graduates (n=11) – Two employers rated job readiness as excellent, three rated
it as good, four rated it as fair, one rated it as poor and two were unsure. Among surveyed businesses that hired new employees over the past 12 months, a total of 5% were hired from each of the groups shown below.
The majority of businesses rated the job readiness of new employees as excellent or good, regardless of
cation level:
Table E83: Classifications of New Employees - Natural Resources – Southwest Reg
ion
n % Immigrants 3 2.6 Co-op students hired for work placement 2 1.7 Persons with disabilities 1 0.9 Aboriginals - - New Employee Total 115 5.2 Business Total 16 -
Businesses were asked to identify, in general, the methods they use to fill staffing vacancies that occur. The most popular methods used include word of mouth/employee referrals (55%, n=19) and placing ads in the newspaper (51%, n=18). Table E84: Methods Used to Fill Staffing Vacancies* - Natural Resources - Southwest Region
n % (N=35) Use word of mouth/employee referrals 19 54.8 Place ad in newspaper 18 50.8 Place ad/use Service Canada Student Employment Centre 13 37.9 Place ad on or check internet/websites 6 17.7 Post internally in your company/organization 6 16.1 Use unsolicited resumes 3 9.7 Place ad on bulletin boards in local community 3 7.3 Place ad in trade/professional/association journals 2 4.8 Use an employment agency/headhunter 1 2.4 Place ad in student employment centres at colleges/universities 1 2.4 Other 2 5.6 Don’t know 2 4.8
*Multiple responses allowed. Over the past 12 months, 50% of Southwest area businesses in the natural resources industry (n=18) have had at least one vacant position available. Those with at least one vacancy (n=18) reported an average of four vacancies. Furthermore, among these surveyed businesses, there were a total of 78 vacant positions. Of the 78 vacant positions available, 24 positions or 31% were vacant more than once throughout the past 12 months.
6-64

2008 Employer Survey Summary Report Section 2.3.5 Industry 6 - Natural Resources Hiring and Recruitment – Southwest Region Furthermore, among these surveyed businesses, approximately three-quarters (76%) of the positions vailable were permanent.
able E85
a T : Classification of Vacancies - Natural Resources – Southwest Region
n %
Permanent 59 75.6 Casual/Contract 4 5.1 Seasonal 15 19.2 Vacancy Total 78 100.0 Business Total 18 -
Businesses were asked if they have experienced any difficulty in filling vacancies. One-third (33%, n=12) ave experienced difficulty, 27% (n=10) have not, and 38% (n=13) have not hired or attempted to hire.
Figure E41
h
: Businesses Experiencing Difficulty Filling Vacancies - Natural Resources – Southwest Region (N=35)
Yes35%
No27%
Have not hired/Attempted to
hire38%
f businesses that have experienced difficulty in filling vacancies (n=12), the main reason for xperiencing difficulty was salary expectations being too high (n=4).
able E86
Oe T : Main Reason for Experiencing Difficulty in Filling Vacancies* - Natural Resources –
Southwest Region
n % (N=12)
Salary expectations too high 4 30.2 Difficult working conditions 3 27.9 Workforce shortage 3 20.9 Lacking soft skills (such as communication/teamwork) 2 14.0 People not interested in employment 2 14.0 Lacking experience 1 7.0 Lacking educational/training qualifications 1 7.0 Other 2 14.0
*Multiple responses allowed.
mong businesses experiencing difficulty in filling vacancies (n=12), general farm workers (n=4) was the ost difficult occupation to fill over the past 12 months29.
he large majority of businesses in the natural resources industry (90%, n=32) did not have any mployees retire over the past 12 months. Of those surveyed businesses that did experience retirement =3), a total of 14 employees retired, averaging four employees per business.
Am Te(n
Multiple responses allowed. 29
6-65

2008 Employer Survey Summary Report Section 2.3.5 Industry 6 - Natural Resources Hiring and Recruitment – Southwest Region Of businesses that experienced employee retirement over the past 12 months (n=3), general farm
orkers (n=1) and heavy equipment operators (except crane) (n=1) were the top occupations from which mployees retired30.
early two-thirds of businesses in this industry (65%, n=23) do not expect any employees to retire in the ext five years. Of those surveyed businesses that do expect employee retirement over this period =12), an average of five employees are expected to retire, with retirement totaling 59 employees.
ost commonly, employees are expected to retire from the farm and farm managers and general office lerks occupations (n=3 each).
able E87
we Nn(n Mc T : Top Three Occupations From Which Employees Are Expected to Retire Over the
Next Five Years* - Natural Resources - Southwest Region
NOC Code Occupation Name n % (N=12)
8431 Farmers and farm managers 3 27.3 1411 General office clerks 3 20.5 7241 Electricians (except industrial and power system) 2 13.7
*Multiple responses allowed.
minority of Southwest area businesses in the natural resources industry (12%, n=4) expect their wner/manager/CEO to retire within five years.
igure E42
Ao F : Businesses Expecting Owner/Manager/CEO to Retire in Next Five Years - Natural
Resources – Southwest Region (N=35)
No86%
Yes12%
Don't Know2%
hree of the four businesses that expect their owner/manager/CEO to retire within the next five years ave a formal or informal succession plan in place.
Th
30 Multiple responses allowed.
6-66

2008 Employer Survey Summary Report Industry 6 – Natural Resources Detailed Findings by Industry
3.0 Business Outlook and Confidence
6-67

2008 Employer Survey Summary Report Section 3.0 Industry 6 – Natural Resources Business Outlook and Confidence
Provincial Overview
3.1
6-68

2008 Employer Survey Summary Report Section 3.1 Industry 6 - Natural Resources Business Outlook and Confidence – Provincial Overview
3.1 Provincial Overview (N=318)
usinesses operating in this industry were somewhat optimistic about the future, providing a mean rating f 6.8 on a scale of 1 to 10, where 1 was “not at all optimistic” and 10 was “very optimistic”. The large ajority of businesses provided a neutral (28%, n=88), somewhat optimistic (26%, n=83) or very ptimistic (27%, n=86) outlook toward the future.
igure E43
Bomo
F : Level of Optimism About the Future - Natural Resources – Provincial Overview (N=318)
8% 7%
28% 26% 27%
5%
0%5%
10%15%20%25%30%
Not at AllOptimistic (1, 2)
Not VeryOptimistic (3, 4)
Neutral (5,6) SomewhatOptimistic (7,8)
Very Optimistic(9, 10)
Don't Know
Businesses that provided an optimistic rating (7 or higher out of 10, n=169) explained their positive outlook by their business do
usinesses with a neutral rating (5 or my is unstable while businesses tha or lower out of 10, n=46) also
indicated that the economy is unstab
able E88
ing well (39%, n=66).
6 out of 10, n=89) mainly indicated that the econoB(47%, n=42), t provided a pessimistic rating (4
le (40%, n=18). T : Reasons for Rating Provided* - Natural Resources – Provincial Overview
Optimistic n % (N=169)
Business is doing well 66 39.4 Growing industry/company 32 19.1 Well established company 23 13.7 Economy is unstable 10 6.0 Future is uncertain 5 2.8 Other 43 24.5 Don’t know/no answer 12 7.4 Neutral n % (N=89) Economy is unstable 42 47.3 Future is uncertain 14 15.6 Increase in operating costs 8 9.0 Business is not doing well 7 7.7 Business is doing well 6 6.4 Change in exchange rates 5 5.4 Workforce shortage 3 3.8 Other 11 13.1 Don’t know/no answer 6 6.4 Pessimistic n % (N=46) Economy is unstable 18 40.1 Business is not doing well 9 20.4 Future is uncertain 5 10.5 Change in exchange rates 4 8.6 Increase in operating costs 3 7.4 Workforce shortage 3 5.6 Increase in competition 2 4.3 Other 8 17.3
*Multiple responses allowed.
6-69

2008 Employer Survey Summary Report Section 3.1 Industry 6 - Natural Resources Business Outlook and Confidence – Provincial Overview
Almost three-quarters of businesses opexperie significant changes to their external
rating in the natural resources industry (71%, n=225) have nced operating environment over the past two years. e
Figure E44: Experienced Significant Change to External Operating Environment Over the Past
Two Years - Natural Resources – Provincial Overview (N=318)
Don't Know1%
Yes
B hat experienced changes (n=225) identified the biggest changes a ase in fuel prices ( exchange rates (35%, n=79) and an inc n the cost of supplies/overhead ( T
No28%
71%
usinesses t s an incre64%, n=145), a change in 26%, n=58).
rease i
able E89: Changes Experienced* - Natural Resources – Pro ver
n % (N )
vincial O view
=225Increase in fuel prices 145 64.4 Change in exchange r
uates 7
pplies/overhead 5 2 2 11
es 1 71 45 24 20.4
9 35.1 Increase in cost of s 8 5.9 Government legislation 6 .6 Decline in particular industri 7 .5 Downturn in economy 1 .9 Workforce shortage .0 Other 6
* .
Multiple responses allowed
6-70

2008 Employer Survey Summary Report Section 3.0 Industry 6 – Natural Resources Business Outlook and Confidence
rban/Rural Subd sion
3.2.1 Urban Subdivision 3.2.2 Rural Subdivision
3.2 U ivi
6-71
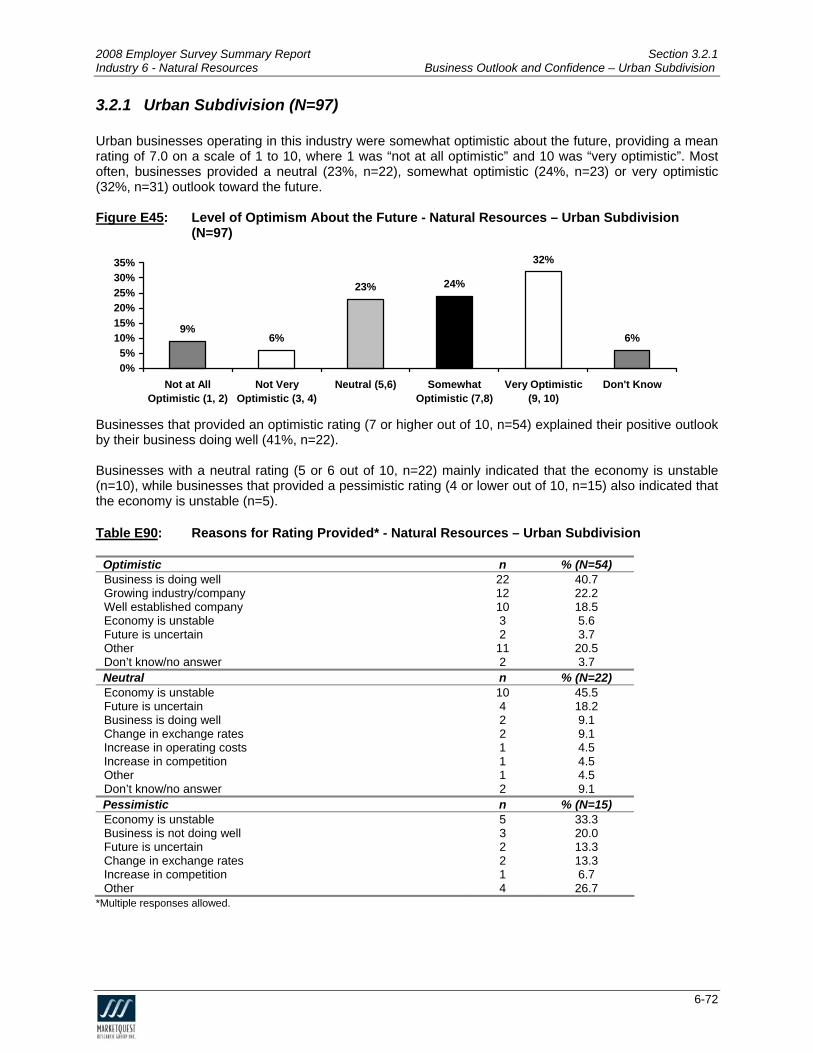
2008 Employer Survey Summary Report Section 3.2.1 Industry 6 - Natural Resources Business Outlook and Confidence – Urban Subdivision 3.2.1 Urban Subdivision (N=97) Urban businesses operating in this industry were somewhat optimistic about the future, providing a mean rating of 7.0 on a scale of 1 to 10, where 1 was “no at all optimistic” and 10 was “very optimistic”. Most
s imistic u
t often, busines es provided a neutral (23%, n=22), somewhat optimistic (24%, n=23) or very opt(32%, n=31) o tlook toward the future.
Figure E45: Level of Optimism About the Future - Natural Resources – Urban Subdivision
(N=97)
9%6%
23% 24%
32%
25%30%35%
6%10%
20%
Not Verytimistic (3, 4)
Neutral (5,6) SomewhatOptimistic (7,8)
ry Optimist(9, 10)
n't Know
B stic rating (7 or higher out of 10, n=54) explained their positive outlook b ing well (41%, n=22). B tral rating (5 or 6 out of 10, n=22) mainly indicated that the economy is unstable ( ses that provided a pessimistic rating (4 or lower out of 1 lso indicated that th ble (n=5). T
15%
0%5%
Not at AllOptimistic (1, 2) Op
Ve ic Do
usinesses that provided an optimiy their business do
usinesses with a neun=10), while busines
ta0, n ) a=15
e economy is uns
able E90: Reasons for Rating Provided* - Natural Resource – Urban Subdivision
% 4)
s
Optimistic n (N=5Business is doing well 22 40.7 Growing industry/compWell established compa
any ny
Economy is unstable 3 5.6 Future is uncertain 2 3.7 Other 11 20.5 Don’t know/no answer 2 3.7 Neutral n % (N=22)
12 22.2 10 18.5
Economy is unstable 10 45.5 Future is uncertain 4 18.2 Business is doing well 2 9.1 Change in exchange rates 2 9.1 Increase in operating costs 1 4.5 Increase in competition 1 4.5 Other 1 4.5 Don’t know/no answer 2 9.1 Pessimistic n % (N=15) Economy is unstable 5 33.3 Business is not doing well 3 20.0 Future is uncertain 2 13.3 Change in exchange rates 2 13.3 Increase in competition 1 6.7 Other 4 26.7
*Multiple responses allowed.
6-72

2008 Employer Survey Summary Report Section 3.2.1 Industry 6 - Natural Resources Business Outlook and Confidence – Urban Subdivision A irds of urban businesses operating in the natural resources i 3%, n=61) have e nt changes to their external operating environment over the past two years.
F
lmost two th ndustry (6xperienced significa
igure E46: Experienced Significant Change to External Ope ing Enviro nt Over the Past Years - Natural Resources – Urban Subdivision (N=97)
rat nmeTwo
Don't Know2%
No35%
Yes63%
Businesses that experienced changes (n=61) identified the biggest changes as an increase in fuel prices (64%, n=39), an increase in the cost of supplies/overhead (33%, n=20) and a change in exchange rates (30%, n=18). Table E91: Changes Experienced* - Natural Resources – Urban Subdivision
n % (N=61) Increase in fuel prices 39 63.9 Increase in cost of supplies/overhead 20 32.8 Change in exchange rates 18 29.5
3 4.9 mpetitio
Other 12 19.6
Decline in particular industries 6 9.8 Government legislation 5 8.2 Downturn in economy Increase in co n 2 3.3 Minimum wage increases 2 3.3
*Multiple responses allowed.
6-73

2008 Employer Survey Summary Report Section 3.2.2 Industry 6 - Natural Resources Business Outlook and Confidence – Rural Subdivision 3.2.2 Rural Subdivision (N=246)
ural businesses operating in this industry were somewhat optimistic about the future, providing a mean ting of 6.7 on a scale of 1 to 10, where 1 was “not at all optimistic” and 10 was “very optimistic”. Most
ften, businesses provided a neutral (31%, n=75), somewhat optimistic (27%, n=67) or very optimistic 4%, n=60) outlook toward the future.
igure E47
Rrao(2
F : Level of Optimism About the Future - Natural Resources – Rural Subdivision (N=246)
7% 7%
31%27%
24%
4%
0%5%
10%15%20%25%30%35%
Not at AllOptimistic (1, 2)
Not VeryOptimistic (3, 4)
Neutral (5,6) SomewhatOptimistic (7,8)
Very Optimistic(9, 10)
Don't Know
Businesses that provided an optimistic rating (7 o er out of 10, n=127) explained their positive outlook by their business doing well (39%, n=49).
Businesses with a neutral rating (5 or 6 out of 10, n=75) mainly indicated that the economy is unstable (48%, n=36), while businesses lower out of 10, n=34) also indicated that the economy is un
Table E92
r high
that provided a pessimistic rating (4 or stable (44%, n=15).
: Reasons for Rating P bdivision
Optimistic n % (N=127)
rovided* - Natural Resources – Rural Su
Business is doing well 49 38.6 Growing industry/company 22 17.3 Well established company 14 11.0 Economy is unstable 8 6.3 Increase in operating costs 3 2.4 Future is uncertain 3 2.4 Other 31 24.5 Don’t know/no answer 12 9.4 Neutral n % (N=75) Economy is unstable 36 48.0 Future is uncertain 11 14.7 Business is not doing well 8 10.7 Increase in operating costs 8 10.7 Workforce shortage 4 5.3 Business is doing well 4 5.3 Change in exchange rates 3 4.0 Other 11 14.7 Don’t know/no answer 4 5.3
6-74

2008 Employer Survey Summary Report Section 3.2.2 Industry 6 - Natural Resources Business Outlook and Confidence – Rural Subdivision
Pessimistic n % (N=34) Economy is unstable 15 44.1 Business is not doing well 7 20.6 Increase in operating costs 4 11.8 Workforce shortage 3 8.8 Future is uncertain 3 8.8 Change in exchange rates 2 5.9 Increase in competition 1 2.9 Other 4 11.8
*Multiple responses allowed. Three-quarters of rural businesses operating in the natural resources industry (75%, n=184) have experienced significant changes to their external operating environment over the past two years.
Figure E48: Experienced Significant Change to External Operating Environment Over the Past
Two Years - Natural Resources – Rural Subdivision (N=246)
Don't Know1%
No24%
Yes75%
Businesses that experienced changes (n=184) identified the biggest changes as an increase in fuel prices (65%, n=119) and a change in exchange rates (38%, n=69). Table E93: Changes Experienced* - Natural Resources – Rural Subdivision
n % (N=184) Increase in fuel prices 119 64.7 Change in exchange rates 6 3Increase in cost of supplies/overhead 42 22.8 Government legislation 24 13.0 Decline in particular industries 12 6.5 Downturn in economy 9 4.9 Workforce shortage 4 2.2 Other 34 18.4
9 7.5
*Multiple responses allowed.
6-75

2008 Employer Survey Summary Report Section 3.0 Industry 6 – Natural Resources Business Outlook and Confidence
3.3 Economic Regions
3.3.1 Central Region 3.3.2 Northeast Region 3.3.3 Northwest Region 3.3.4 Southeast Region 3.3.5 Southwest Region
6-76

2008 Employer Survey Summary Report Section 3.3.1 Industry 6 - Natural Resources Business Outlook and Confidence – Central Region 3.3.1 Central Region (N=44) PLEASE NOTE THAT THE MARGIN OF ERROR FOR THIS ECONOMIC REGION IS ABOVE 10%, THEREFORE, FINDINGS SHOULD BE INTERPRETED WITH CAUTION. Central region businesses operating in this industry were somewhat optimistic about the future, providing a mean rating of 6.6 on a scale of 1 to 10, where 1 was “not at all optimistic” and 10 was “very optimistic”. Most often, businesses provided a neutral (22%, n=10) or very optimistic (33%, n=15) outlook toward the future.
Figure E49: Level of Optimism About the Future - Natural Resources – Central Region (N=44)
9%15%
22%16%
33%
5%
0%5%
10%15%20%25%30%35%
Not at AllOptimistic (1, 2)
Not VeryOptimistic (3, 4)
Neutral (5,6) SomewhatOptimistic (7,8)
Very Optimistic(9, 10)
Don't Know
Businesses that provided an optimistic rating (7 or higher out of 10, n=22) explained their positive outlook by the fact that the industry/company is growing (n=6) and their business doing well (n=5). Businesses with a neutral rating (5 or 6 out of 10, n=10) mainly indicated that the economy is unstable (n=5), while businesses that provided a pessimistic rating (4 or lower out of 10, n=10) also indicated that the economy is unstable (n=5). Table E94: Reasons for Rating Provided* - Natural Resources – Central Region
Optimistic n % (N=22) Growing industry/company 6 29.8 Business is doing well 5 23.4 Well established company 3 15.5 Economy is unstable 3 14.3 Offering an essential service 1 3.9 Other 5 23.4 Neutral n % (N=10) Economy is unstable 5 48.6 Future is uncertain 3 28.6 Change in exchange rates 1 11.4 Increase in operating costs 1 11.4 Workforce shortage 1 8.6 Business is not doing well 1 8.6 Other 1 11.4 Pessimistic n % (N=10) Economy is unstable 5 43.3 Business is not doing well 3 29.7 Future is uncertain 1 10.8 Workforce shortage 1 8.1 Other 2 16.2
*Multiple responses allowed.
6-77

2008 Employer Survey Summary Report Section 3.3.1 Industry 6 - Natural Resources Business Outlook and Confidence – Central Region Over one-half of Central area businesses operating in the natural resources industry (58%, n=26) have experienced significant changes to their external operating environment over the past two years.
Figure E50: Experienced Significant Change to External Operating Environment Over the Past
Two Years - Natural Resources – Central Region (N=44)
No42%
Yes58%
Businesses that experienced changes (n=26) identified the biggest changes as an increase in fuel prices (n=20) and a change in exchange rates (n=10). Table E95: Changes Experienced* - Natural Resources – Central Region
n % (N=26) Increase in fuel prices 20 78.0 Change in exchange rates 10 38.5 Increase in cost of supplies/overhead 6 24.1 Decline in particular industries 3 9.9 Increase in competition 2 8.8 Increase in insurance rates 2 7.7 Minimum wage increases 1 4.4 Government legislation 1 3.3 Downturn in economy 1 3.3 Other 2 8.8
*Multiple responses allowed.
6-78

2008 Employer Survey Summary Report Section 3.3.2 Industry 6 - Natural Resources Business Outlook and Confidence – Northeast Region 3.3.2 Northeast Region (N=115) Northeast region businesses operating in this industry were somewhat optimistic about the future, providing a mean rating of 6.6 on a scale of 1 to 10, where 1 was “not at all optimistic” and 10 was “very optimistic”. Most often, businesses provided a neutral (36%, n=42) outlook toward the future.
Figure E51: Level of Optimism About the Future - Natural Resources – Northeast Region
(N=115)
8%4%
36%
22% 24%
6%
0%5%
10%15%20%25%30%35%40%
Not at AllOptimistic (1, 2)
Not VeryOptimistic (3, 4)
Neutral (5,6) SomewhatOptimistic (7,8)
Very Optimistic(9, 10)
Don't Know
Businesses that provided an optimistic rating (7 or higher out of 10, n=53) explained their positive outlook by their business doing well (44%, n=23). Businesses with a neutral rating (5 or 6 out of 10, n=42) mainly indicated that the economy is unstable (52%, n=22), while businesses that provided a pessimistic rating (4 or lower out of 10, n=14) also indicated that the economy is unstable (n=6). Table E96: Reasons for Rating Provided* - Natural Resources – Northeast Region
Optimistic n % (N=53) Business is doing well 23 44.4 Growing industry/company 7 13.4 Well established company 6 11.8 Future is uncertain 2 3.7 Economy is unstable 2 3.2 Other 14 25.1 Don’t know/no answer 4 7.0 Neutral n % (N=42) Economy is unstable 22 52.4 Future is uncertain 5 12.9 Increase in operating costs 5 12.3 Business is doing well 3 7.5 Business is not doing well 3 6.1 Change in exchange rates 2 4.1 Workforce shortage 2 4.1 Increase in competition 1 2.7 Other 6 14.3 Don’t know/no answer 2 4.1 Pessimistic n % (N=14) Economy is unstable 6 42.9 Business is not doing well 3 20.4 Change in exchange rates 2 16.3 Future is uncertain 2 12.3 Increase in competition 1 8.1 Workforce shortage 1 6.2 Other 1 8.1
*Multiple responses allowed.
6-79

2008 Employer Survey Summary Report Section 3.3.2 Industry 6 - Natural Resources Business Outlook and Confidence – Northeast Region Approximately three-quarters of Northeast area businesses operating in the natural resources industry (76%, n=88) have experienced significant changes to their external operating environment over the past two years.
Figure E52: Experienced Significant Change to External Operating Environment Over the Past
Two Years - Natural Resources – Northeast Region (N=115)
Don't know2%
No22%
Yes76%
Businesses that experienced changes (n=88) identified the biggest change as an increase in fuel prices (67%, n=58). Table E97: Changes Experienced* - Natural Resources – Northeast Region
n % (N=88) Increase in fuel prices 58 66.5 Change in exchange rates 25 28.1 Increase in cost of supplies/overhead 22 25.5 Decline in particular industries 11 12.5 Government legislation 7 7.4 Workforce shortage 3 3.2 Downturn in economy 3 2.9 Minimum wage increases 2 2.3 Other 17 19.4
*Multiple responses allowed.
6-80

2008 Employer Survey Summary Report Section 3.3.3 Industry 6 - Natural Resources Business Outlook and Confidence – Northwest Region 3.3.3 Northwest Region (N=81) Northwest region businesses operating in this industry were somewhat optimistic about the future, providing a mean rating of 6.4 on a scale of 1 to 10, where 1 was “not at all optimistic” and 10 was “very optimistic”. Most often, businesses provided a neutral (29%, n=23) or somewhat optimistic (33%, n=26) outlook toward the future.
Figure E53: Level of Optimism About the Future - Natural Resources – Northwest Region
(N=81)
8% 9%
29%33%
16%
5%
0%5%
10%15%20%25%30%35%
Not at AllOptimistic (1, 2)
Not VeryOptimistic (3, 4)
Neutral (5,6) SomewhatOptimistic (7,8)
Very Optimistic(9, 10)
Don't Know
Businesses that provided an optimistic rating (7 or higher out of 10, n=39) explained their positive outlook by their business doing well (51%, n=20). Businesses with a neutral rating (5 or 6 out of 10, n=24) mainly indicated that the economy is unstable (n=12), while businesses that provided a pessimistic rating (4 or lower out of 10, n=14) also indicated that the economy is unstable (n=6). Table E98: Reasons for Rating Provided* - Natural Resources – Northwest Region
Optimistic n % (N=39) Business is doing well 20 51.1 Well established company 4 10.8 Economy is unstable 3 7.2 Growing industry/company 3 6.5 Change in exchange rates 1 2.9 Increase in operating costs 1 2.2 Increase in competition 1 2.2 Other 8 18.7 Don’t know/no answer 5 13.7 Neutral n % (N=24) Economy is unstable 12 50.0 Future is uncertain 3 10.7 Business is not doing well 3 10.7 Change in exchange rates 2 8.3 Increase in operating costs 2 7.2 Other 1 3.6 Don’t know/no answer 3 13.0 Pessimistic n % (N=14) Economy is unstable 6 44.9 Business is not doing well 3 24.5 Increase in operating costs 3 18.4 Change in exchange rates 2 12.3 Future is uncertain 1 6.1 Other 2 12.2
*Multiple responses allowed.
6-81

2008 Employer Survey Summary Report Section 3.3.3 Industry 6 - Natural Resources Business Outlook and Confidence – Northwest Region The large majority of Northwest area businesses operating in the natural resources industry (80%, n=65) have experienced significant changes to their external operating environment over the past two years.
Figure E54: Experienced Significant Change to External Operating Environment Over the Past
Two Years - Natural Resources – Northwest Region (N=81)
Don't know1%
No19%
Yes80%
Businesses that experienced changes (n=65) identified the biggest changes as an increase in fuel prices (54%, n=35) and a change in exchange rates (45%, n=29). Table E99: Changes Experienced* - Natural Resources – Northwest Region
n % (N=65) Increase in fuel prices 35 54.0 Change in exchange rates 29 45.2 Increase in cost of supplies/overhead 19 30.2 Government legislation 9 13.6 Downturn in economy 6 9.2 Decline in particular industries 2 2.6 Workforce shortage 1 1.3 Other 9 14.5
*Multiple responses allowed.
6-82

2008 Employer Survey Summary Report Section 3.3.4 Industry 6 - Natural Resources Business Outlook and Confidence – Southeast Region 3.3.4 Southeast Region (N=44) PLEASE NOTE THAT THE MARGIN OF ERROR FOR THIS ECONOMIC REGION IS ABOVE 10%, THEREFORE, FINDINGS SHOULD BE INTERPRETED WITH CAUTION. Southeast region businesses operating in this industry were generally optimistic about the future, providing a mean rating of 7.3 on a scale of 1 to 10, where 1 was “not at all optimistic” and 10 was “very optimistic”. Most often, businesses provided a somewhat optimistic (36%, n=15) or very optimistic (32%, n=14) outlook toward the future.
Figure E55: Level of Optimism About the Future - Natural Resources – Southeast Region
(N=44)
7%4%
15%
36%32%
7%
0%5%
10%15%20%25%30%35%40%
Not at AllOptimistic (1, 2)
Not VeryOptimistic (3, 4)
Neutral (5,6) SomewhatOptimistic (7,8)
Very Optimistic(9, 10)
Don't Know
Businesses that provided an optimistic rating (7 or higher out of 10, n=30) explained their positive outlook by their business doing well (34%, n=10) and the fact that the industry/company is growing (28%, n=8). Businesses with a neutral rating (5 or 6 out of 10, n=7) mainly indicated that the future is uncertain (n=3), while businesses that provided a pessimistic rating (4 or lower out of 10, n=5) indicated that the economy is unstable (n=2). Table E100: Reasons for Rating Provided* - Natural Resources – Southeast Region
Optimistic n % (N=30) Business is doing well 10 34.2 Growing industry/company 8 27.6 Well established company 6 21.8 Economy is unstable 3 8.6 Other 10 32.6 Don’t know/no answer 1 2.9 Neutral n % (N=7) Future is uncertain 3 47.7 Economy is unstable 2 26.2 Business is doing well 2 26.2 Workforce shortage 1 13.1 Pessimistic n % (N=5) Economy is unstable 2 37.6 Increase in competition 1 18.8 Increase in operating costs 1 18.8 Other 1 24.8
*Multiple responses allowed.
6-83

2008 Employer Survey Summary Report Section 3.3.4 Industry 6 - Natural Resources Business Outlook and Confidence – Southeast Region Almost two-thirds of Southeast area businesses operating in the natural resources industry (62%, n=27) have experienced significant changes to their external operating environment over the past two years.
Figure E56: Experienced Significant Change to External Operating Environment Over the Past
Two Years - Natural Resources – Southeast Region (N=44)
Don't know3%
No35%
Yes62%
Businesses that experienced changes (n=27) identified the biggest change as an increase in fuel prices (n=20). Table E101: Changes Experienced* - Natural Resources – Southeast Region
n % (N=27) Increase in fuel prices 20 73.9 Change in exchange rates 8 31.2 Increase in cost of supplies/overhead 7 27.1 Government legislation 4 14.6 Downturn in economy 2 6.3 Decline in particular industries 1 3.1 Increase in competition 1 3.1 Workforce shortage 1 3.1 Other 3 10.4
*Multiple responses allowed.
6-84

2008 Employer Survey Summary Report Section 3.3.5 Industry 6 - Natural Resources Business Outlook and Confidence – Southwest Region 3.3.5 Southwest Region (N=35) PLEASE NOTE THAT THE MARGIN OF ERROR FOR THIS ECONOMIC REGION IS ABOVE 10%, THEREFORE, FINDINGS SHOULD BE INTERPRETED WITH CAUTION. Southwest region businesses operating in this industry were generally optimistic about the future, providing a mean rating of 7.7 on a scale of 1 to 10, where 1 was “not at all optimistic” and 10 was “very optimistic”. Most often, businesses provided a very optimistic (48%, n=17) outlook toward the future.
Figure E57: Level of Optimism About the Future - Natural Resources – Southwest Region
(N=35)
6% 3%
19%24%
48%
0%10%20%30%40%50%60%
Not at All Optimistic(1, 2)
Not Very Optimistic(3, 4)
Neutral (5,6) SomewhatOptimistic (7,8)
Very Optimistic (9,10)
Businesses that provided an optimistic rating (7 or higher out of 10, n=25) explained their positive outlook by the fact that the industry/company is growing (n=8) and their business doing well (n=8). Businesses with a neutral rating (5 or 6 out of 10, n=7) indicated that the economy is unstable (n=2), while businesses that provided a pessimistic rating (4 or lower out of 10, n=3) indicated the future is uncertain or a workforce shortage (n=1 each). Table E102: Reasons for Rating Provided* - Natural Resources – Southwest Region
Optimistic n % (N=25) Growing industry/company 8 31.4 Business is doing well 8 30.4 Well established company 3 11.2 Increase in competition 1 3.4 Other 4 16.9 Don’t know/no answer 3 10.1 Neutral n % (N=7) Economy is unstable 2 25.0 Business is doing well 1 12.5 Business is not doing well 1 12.5 Other 3 37.5 Don’t know/no answer 1 12.5 Pessimistic n % (N=3) Future is uncertain 1 36.3 Workforce shortage 1 27.4 Other 2 72.6
*Multiple responses allowed.
6-85
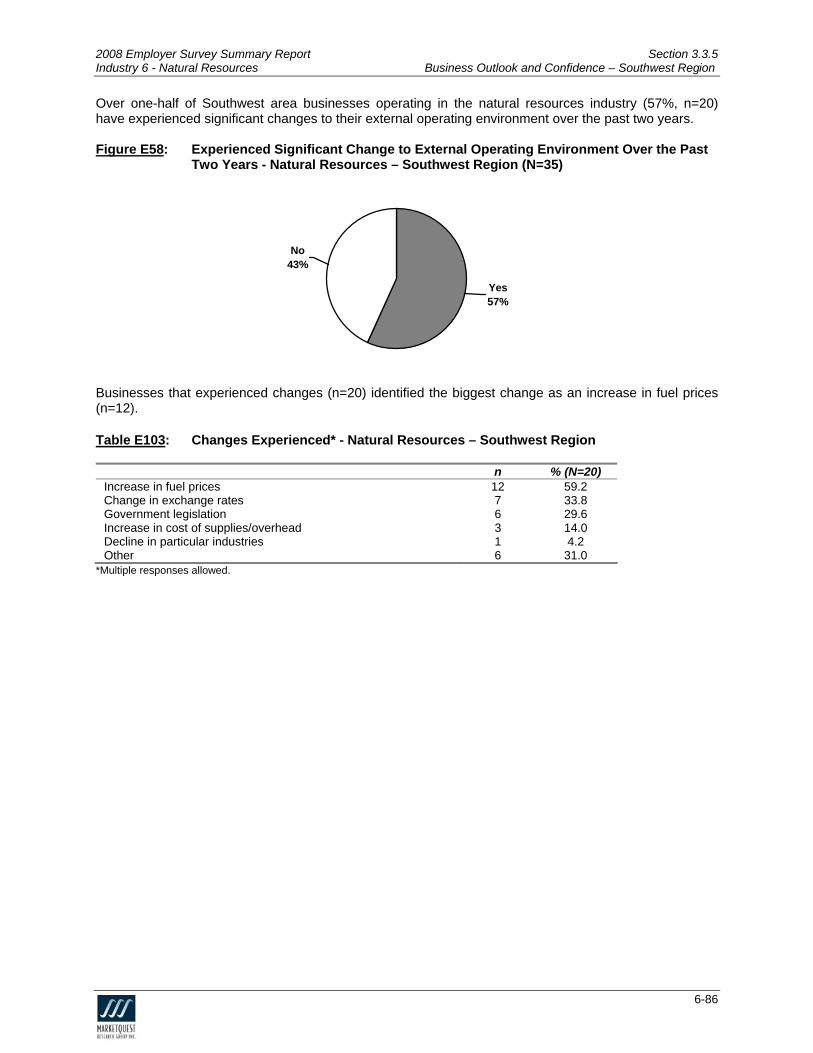
2008 Employer Survey Summary Report Section 3.3.5 Industry 6 - Natural Resources Business Outlook and Confidence – Southwest Region Over one-half of Southwest area businesses operating in the natural resources industry (57%, n=20) have experienced significant changes to their external operating environment over the past two years.
Figure E58: Experienced Significant Change to External Operating Environment Over the Past
Two Years - Natural Resources – Southwest Region (N=35)
No43%
Yes57%
Businesses that experienced changes (n=20) identified the biggest change as an increase in fuel prices (n=12). Table E103: Changes Experienced* - Natural Resources – Southwest Region
n % (N=20) Increase in fuel prices 12 59.2 Change in exchange rates 7 33.8 Government legislation 6 29.6 Increase in cost of supplies/overhead 3 14.0 Decline in particular industries 1 4.2 Other 6 31.0
*Multiple responses allowed.
6-86

2008 Employer Survey Summary Report Industry 6 – Natural Resources Detailed Findings by Industry
4.0 Training and Employment Development
6-87

2008 Employer Survey Summary Report Section 4.0 Industry 6 – Natural Resources Training and Employment Development
4.1 Provincial Overview
6-88

2008 Employer Survey Summary Report Section 4.1 Industry 6 - Natural Resources Training and Employment Development – Provincial Overview 4.1 Provincial Overview (N=318) Among businesses in the natural resources industry, approximately one-half (51%, n=163) have offered some form of informal or formal training to their employees over the past two years. Of those businesses that made training available to their employees (n=163), 46% (n=75) did not offer formal training, while the remaining 54% (n=88) made formal training available. Figure E59: Percentage of Businesses that Offered Informal or Formal Training Over the Past
Two Years - Natural Resources - Provincial Overview (N=318)
No49%
Yes51%
Of businesses that offered formal training to their employees (n=88), the most common sources of formal, structured training were internal staff (43%, n=38) and a non-profit organization/professional association (31%, n=27).
Overall, formal training sessions account for approximately 3% of these businesses’ overall operating budgets. Table E104: Sources of Formal, Structured Training* - Natural Resources - Provincial Overview
n % (N=88) Internal staff 38 42.7 A non-profit organization/professional association 27 30.9 A private training institution 22 24.8 NBCC or CCNB 18 20.9 Another public educational institution 13 15.1 Private consultant 10 11.2 Conferences, trade shows, seminars 3 3.2 Courses offered by government 2 2.2 Other 10 10.2 Don’t know 3 2.9
*Multiple responses allowed.
6-89

2008 Employer Survey Summary Report Section 4.0 Industry 6 – Natural Resources Training and Employment Development
4.2 Urban/Rural Subdivision
4.2.1 Urban Subdivision 4.2.2 Rural Subdivision
6-90

2008 Employer Survey Summary Report Section 4.2.1 Industry 6 - Natural Resources Training and Employment Development – Urban Subdivision
4.2.1 Urban Subdivision (N=97) Among businesses in the natural resources industry, almost one-half (47%, n=46) have offered some form of informal or formal training to their employees over the past two years. Of those businesses that made training available to their employees (n=46), 43% (n=20) did not offer formal training, while the remaining 57% (n=26) made formal training available. Figure E60: Percentage of Businesses that Offered Informal or Formal Training Over the Past
Two Years - Natural Resources – Urban Subdivision (N=97)
No53%
Yes47%
Of businesses that offered formal training to their employees (n=26), the most common source of formal, structured training was internal staff (n=13), followed distantly by a non-profit organization/professional association (n=6).
Overall, formal training sessions account for approximately 3% of these businesses’ overall operating budgets. Table E105: Sources of Formal, Structured Training* - Natural Resources - Urban Subdivision
n % (N=26) Internal staff 13 50.0 A non-profit organization/professional association 6 23.1 A private training institution 5 19.2 NBCC or CCNB 5 19.2 Another public educational institution 2 7.7 Private consultant 5 19.2 Conferences, trade shows, seminars 1 3.8 Courses offered by government 1 3.8 Other 2 7.7
*Multiple responses allowed.
6-91

2008 Employer Survey Summary Report Section 4.2.2 Industry 6 - Natural Resources Training and Employment Development – Rural Subdivision
4.2.2 Rural Subdivision (N=246) Among businesses in the natural resources industry, just over one-half (53%, n=131) have offered some form of informal or formal training to their employees over the past two years. Of those businesses that made training available to their employees (n=131), 47% (n=62) did not offer formal training, while the remaining 53% (n=69) made formal training available. Figure E61: Percentage of Businesses that Offered Informal or Formal Training Over the Past
Two Years - Natural Resources – Rural Subdivision (N=246)
No47%
Yes53%
Of businesses that offered formal training to their employees (n=69), the most common sources of formal, structured training were internal staff (39%, n=27) and a non-profit organization/professional association (35%, n=24).
Overall, formal training sessions account for approximately 3% of these businesses’ overall operating budgets. Table E106: Sources of Formal, Structured Training* - Natural Resources - Rural Subdivision
n % (N=69) Internal staff 27 39.1 A non-profit organization/professional association 24 34.8 A private training institution 19 27.5 NBCC or CCNB 15 21.7 Another public educational institution 13 18.8 Private consultant 5 7.2 Other 11 15.9 Don’t know 3 4.3
*Multiple responses allowed.
6-92

2008 Employer Survey Summary Report Section 4.0 Industry 6 – Natural Resources Training and Employment Development
4.3 Economic Regions
4.3.1 Central Region 4.3.2 Northeast Region 4.3.3 Northwest Region 4.3.4 Southeast Region 4.3.5 Southwest Region
6-93

2008 Employer Survey Summary Report Section 4.3.1 Industry 6 - Natural Resources Training and Employment Development – Central Region 4.3.1 Central Region (N=44) PLEASE NOTE THAT THE MARGIN OF ERROR FOR THIS ECONOMIC REGION IS ABOVE 10%, THEREFORE, FINDINGS SHOULD BE INTERPRETED WITH CAUTION. Businesses in the natural resources industry in Central New Brunswick are evenly split in their offering of informal or formal training to their employees over the past two years (52% offered, n=23; 48% did not offer, n=21). Of those businesses that made training available to their employees (n=23), 43% (n=10) did not offer formal training, while the remaining 57% (n=13) made formal training available. Figure E62: Percentage of Businesses that Offered Informal or Formal Training Over the Past
Two Years - Natural Resources – Central Region (N=44)
No48%
Yes52%
Of businesses that offered formal training to their employees (n=13), the most common sources of formal, structured training were internal staff (n=5) and a non-profit organization/professional association (n=4).
Overall, formal training sessions account for approximately 2% of these businesses’ overall operating budgets. Table E107: Sources of Formal, Structured Training* - Natural Resources - Central Region
n % (N=13) Internal staff 5 41.2 A non-profit organization/professional association 4 30.4 Another public educational institution 3 21.8 Private consultant 2 15.2 A private training institution 2 13.1 NBCC or CCNB 1 8.7 Conferences, trade shows, seminars 1 8.7
*Multiple responses allowed.
6-94

2008 Employer Survey Summary Report Section 4.3.2 Industry 6 - Natural Resources Training and Employment Development – Northeast Region 4.3.2 Northeast Region (N=115) Businesses in the natural resources industry in Northeast New Brunswick are evenly split in their offering of informal or formal training to their employees over the past two years (50% offered, n=58; 50% did not offer, n=57). Of those businesses that made training available to their employees (n=58), 50% (n=29) did not offer formal training, while the remaining 50% (n=29) made formal training available. Figure E63: Percentage of Businesses that Offered Informal or Formal Training Over the Past
Two Years - Natural Resources – Northeast Region (N=115)
No50%
Yes50%
Of businesses that offered formal training to their employees (n=29), the most common sources of formal, structured training were a private training institution (n=11), NBCC or CCNB (n=10) and internal staff (n=10).
Overall, formal training sessions account for approximately 3% of these businesses’ overall operating budgets. Table E108: Sources of Formal, Structured Training* - Natural Resources - Northeast Region
n % (N=29) A private training institution 11 38.8 NBCC or CCNB 10 35.9 Internal staff 10 33.0 A non-profit organization/professional association 7 22.3 Another public educational institution 3 11.7 Other 6 18.4 Don’t know 2 5.8
*Multiple responses allowed.
6-95

2008 Employer Survey Summary Report Section 4.3.3 Industry 6 - Natural Resources Training and Employment Development – Northwest Region 4.3.3 Northwest Region (N=81) Among businesses in the natural resources industry in Northwest New Brunswick, more than one-third (38%, n=31) have offered some form of informal or formal training to their employees over the past two years. Of those businesses that made training available to their employees (n=31), 58% (n=18) did not offer formal training, while the remaining 42% (n=13) made formal training available. Figure E64: Percentage of Businesses that Offered Informal or Formal Training Over the Past
Two Years - Natural Resources – Northwest Region (N=81)
No62%
Yes38%
Of businesses that offered formal training to their employees (n=13), the most common source of formal, structured training was a non-profit organization/professional association (n=4).
Overall, formal training sessions account for approximately 1% of these businesses’ overall operating budgets. Table E109: Sources of Formal, Structured Training* - Natural Resources - Northwest Region
n % (N=13) A non-profit organization/professional association 4 32.6 A private training institution 3 26.1 NBCC or CCNB 3 19.6 Internal staff 2 13.1 Other 5 34.7
*Multiple responses allowed.
6-96

2008 Employer Survey Summary Report Section 4.3.4 Industry 6 - Natural Resources Training and Employment Development – Southeast Region 4.3.4 Southeast Region (N=44) PLEASE NOTE THAT THE MARGIN OF ERROR FOR THIS ECONOMIC REGION IS ABOVE 10%, THEREFORE, FINDINGS SHOULD BE INTERPRETED WITH CAUTION. Among businesses in the natural resources industry in Southeast New Brunswick, over one-half (57%, n=25) have offered some form of informal or formal training to their employees over the past two years. Of those businesses that made training available to their employees (n=25), 44% (n=11) did not offer formal training, while the remaining 56% (n=14) made formal training available. Figure E65: Percentage of Businesses that Offered Informal or Formal Training Over the Past
Two Years - Natural Resources – Southeast Region (N=44)
No43% Yes
57%
Of businesses that offered formal training to their employees (n=14), the most common sources of formal, structured training were internal staff (n=6) and a non-profit organization/professional association (n=5).
Overall, formal training sessions account for approximately 3% of these businesses’ overall operating budgets. Table E110: Sources of Formal, Structured Training* - Natural Resources - Southeast Region
n % (N=14) Internal staff 6 43.0 A non-profit organization/professional association 5 31.4 Private consultant 2 15.6 A private training institution 2 13.7 Conferences, trade shows, seminars 2 11.8 Other 2 13.7 Don’t know 1 5.9
*Multiple responses allowed.
6-97

2008 Employer Survey Summary Report Section 4.3.5 Industry 6 - Natural Resources Training and Employment Development – Southwest Region 4.3.5 Southwest Region (N=35) PLEASE NOTE THAT THE MARGIN OF ERROR FOR THIS ECONOMIC REGION IS ABOVE 10%, THEREFORE, FINDINGS SHOULD BE INTERPRETED WITH CAUTION. Among businesses in the natural resources industry in Southwest New Brunswick, just over three-quarters (77%, n=27) have offered some form of informal or formal training to their employees over the past two years. Of those businesses that made training available to their employees (n=27), 33% (n=9) did not offer formal training, while the remaining 67% (n=18) made formal training available. Figure E66: Percentage of Businesses that Offered Informal or Formal Training Over the Past
Two Years - Natural Resources – Southwest Region (N=35)
No23%
Yes77%
Of businesses that offered formal training to their employees (n=18), the most common source of formal, structured training was internal staff (n=15).
Overall, formal training sessions account for approximately 4% of these businesses’ overall operating budgets. Table E111: Sources of Formal, Structured Training* - Natural Resources - Southwest Region
n % (N=18) Internal staff 15 80.0 A non-profit organization/professional association 8 43.1 Another public educational institution 6 33.8 NBCC or CCNB 4 23.1 Private consultant 4 20.0 A private training institution 3 18.5 Other 2 10.7
*Multiple responses allowed.
6-98

2008 Employer Survey Summary Report Industry 6 – Natural Resources Detailed Findings by Industry
5.0 Family Friendly Policies and Procedures
6-99

2008 Employer Survey Summary Report Section 5.0 Industry 6 – Natural Resources Family Friendly Policies and Procedures
5.1 Provincial Overview
6-100

2008 Employer Survey Summary Report Section 5.1 Industry 6 - Natural Resources Family Friendly – Provincial Overview 5.1 Provincial Overview (N=318)
Among businesses in the natural resources industry, the most common form of family-oriented benefits offered is flexible work arrangements (58%, n=186). Figure E67: Types of Family-Friendly Benefits Offered by Businesses - Natural Resources –
Provincial Overview (N=318)
10%
58%
25% 24%
97% 89%
41%
73% 76%
0%
20%
40%
60%
80%
100%
Childcare/ eldercareinitiatives and
support
Employee/ familyassistanceprograms
Flexible workarrnagements
Reduction of worktime
Paid leave benefits
Yes No Don't Know
Almost one-half of businesses in this industry (48%, n=151) employ women in key decision-making positions such as positions at the management and senior management level. Within these businesses (n=151), women account for an average of 45% of all key decision-making positions. Figure E68: Percentage of Businesses that Employ Women in Key Decision-Making Positions -
Natural Resources - Provincial Overview (N=318)
No52%
Yes48%
6-101

2008 Employer Survey Summary Report Section 5.1 Industry 6 - Natural Resources Family Friendly – Provincial Overview To ensure that jobs of equal value earn equal pay, a minority of businesses in this industry (12%, n=39) have developed and implemented a written, formal gender-neutral process for job evaluation based on skill level, effort, responsibility and working conditions.
Figure E69: Percentage of Businesses/Organization that have a Written, Formal Gender-Neutral
Process of Job Evaluation - Natural Resources – Provincial Overview (N=318)
Don't Know1%
No87%
Yes12%
6-102

2008 Employer Survey Summary Report Section 5.0 Industry 6 – Natural Resources Family Friendly Policies and Procedures
5.2 Urban/Rural Subdivision
5.2.1 Urban Subdivision 5.2.2 Rural Subdivision
6-103

2008 Employer Survey Summary Report Section 5.2.1 Industry 6 - Natural Resources Family Friendly – Urban Subdivision 5.2.1 Urban Subdivision (N=97)
Among urban businesses in the natural resources industry, the most common form of family-oriented benefits offered is flexible work arrangements (66%, n=64). Figure E70: Types of Family-Friendly Benefits Offered by Businesses - Natural Resources –
Urban Subdivision (N=97)
11%
66%
23% 27%
97% 88%
34%
76% 73%
0%
20%
40%
60%
80%
100%
Childcare/ eldercareinitiatives and
support
Employee/ familyassistanceprograms
Flexible workarrnagements
Reduction of worktime
Paid leave benefits
Yes No Don't Know
Approximately one-half of urban businesses in this industry (51%, n=49) employ women in key decision-making positions such as positions at the management and senior management level. Within these businesses (n=49), women account for an average of 47% of all key decision-making positions. Figure E71: Percentage of Businesses that Employ Women in Key Decision-Making Positions -
Natural Resources – Urban Subdivision (N=97)
No49%
Yes51%
6-104

2008 Employer Survey Summary Report Section 5.2.1 Industry 6 - Natural Resources Family Friendly – Urban Subdivision To ensure that jobs of equal value earn equal pay, a minority of urban businesses in this industry (10%, n=10) have developed and implemented a written, formal gender-neutral process for job evaluation based on skill level, effort, responsibility and working conditions.
Figure E72: Percentage of Businesses/Organization that have a Written, Formal Gender-Neutral
Process of Job Evaluation - Natural Resources – Urban Subdivision (N=97)
Don't Know1%
No89%
Yes10%
6-105

2008 Employer Survey Summary Report Section 5.2.2 Industry 6 - Natural Resources Family Friendly – Rural Subdivision 5.2.2 Rural Subdivision (N=246)
Among rural businesses in the natural resources industry, the most common form of family-oriented benefits offered is flexible work arrangements (55%, n=134). Figure E73: Types of Family-Friendly Benefits Offered by Businesses - Natural Resources –
Rural Subdivision (N=246)
9%
55%
27% 22%
97% 89%
44%
72% 77%
0%
20%
40%
60%
80%
100%
Childcare/ eldercareinitiatives and
support
Employee/ familyassistanceprograms
Flexible workarrnagements
Reduction of worktime
Paid leave benefits
Yes No Don't Know
Just under one-half of rural businesses in this industry (46%, n=113) employ women in key decision-making positions such as positions at the management and senior management level. Within these businesses (n=113), women account for an average of 44% of all key decision-making positions. Figure E74: Percentage of Businesses that Employ Women in Key Decision-Making Positions -
Natural Resources – Rural Subdivision (N=246)
No54%
Yes46%
6-106

2008 Employer Survey Summary Report Section 5.2.2 Industry 6 - Natural Resources Family Friendly – Rural Subdivision To ensure that jobs of equal value earn equal pay, a minority of rural businesses in this industry (13%, n=33) have developed and implemented a written, formal gender-neutral process for job evaluation based on skill level, effort, responsibility and working conditions.
Figure E75: Percentage of Businesses/Organization that have a Written, Formal Gender-Neutral
Process of Job Evaluation - Natural Resources – Rural Subdivision (N=246)
Don't Know1%
No86%
Yes13%
6-107

2008 Employer Survey Summary Report Section 5.0 Industry 6 – Natural Resources Family Friendly Policies and Procedures
5.3 Economic Regions
5.3.1 Central Region 5.3.2 Northeast Region 5.3.3 Northwest Region 5.3.4 Southeast Region 5.3.5 Southwest Region
6-108

2008 Employer Survey Summary Report Section 5.3.1 Industry 6 - Natural Resources Family Friendly – Central Region 5.3.1 Central Region (N=44)
PLEASE NOTE THAT THE MARGIN OF ERROR FOR THIS ECONOMIC REGION IS ABOVE 10%, THEREFORE, FINDINGS SHOULD BE INTERPRETED WITH CAUTION. Among Central area businesses in the natural resources industry, the most common form of family-oriented benefits offered is flexible work arrangements (72%, n=32). Figure E76: Types of Family-Friendly Benefits Offered by Businesses - Natural Resources –
Central Region (N=44)
21%
72%
25% 29%
98%79%
28%
75% 71%
0%
20%
40%
60%
80%
100%
Childcare/ eldercareinitiatives and
support
Employee/ familyassistanceprograms
Flexible workarrnagements
Reduction of worktime
Paid leave benefits
Yes No
Over two-thirds of businesses in this industry (69%, n=30) employ women in key decision-making positions such as positions at the management and senior management level. Within these businesses (n=30), women account for an average of 49% of all key decision-making positions. Figure E77: Percentage of Businesses that Employ Women in Key Decision-Making Positions -
Natural Resources – Central Region (N=44)
No31%
Yes69%
6-109

2008 Employer Survey Summary Report Section 5.3.1 Industry 6 - Natural Resources Family Friendly – Central Region To ensure that jobs of equal value earn equal pay, a minority of Central area businesses in this industry (9%, n=4) have developed and implemented a written, formal gender-neutral process for job evaluation based on skill level, effort, responsibility and working conditions.
Figure E78: Percentage of Businesses/Organization that have a Written, Formal Gender-Neutral
Process of Job Evaluation - Natural Resources – Central Region (N=44)
No91%
Yes9%
6-110

2008 Employer Survey Summary Report Section 5.3.2 Industry 6 - Natural Resources Family Friendly – Northeast Region 5.3.2 Northeast Region (N=115)
Among Northeast area businesses in the natural resources industry, the most common form of family-oriented benefits offered is flexible work arrangements (45%, n=52). Figure E79: Types of Family-Friendly Benefits Offered by Businesses - Natural Resources –
Northeast Region (N=115)
5%
45%20% 18%
99% 92%
53%78% 82%
0%
20%
40%
60%
80%
100%
Childcare/ eldercareinitiatives and
support
Employee/ familyassistanceprograms
Flexible workarrnagements
Reduction of worktime
Paid leave benefits
Yes No Don't know
Just over one-third of businesses in this industry (35%, n=41) employ women in key decision-making positions such as positions at the management and senior management level. Within these businesses (n=41), women account for an average of 44% of all key decision-making positions. Figure E80: Percentage of Businesses that Employ Women in Key Decision-Making Positions -
Natural Resources – Northeast Region (N=115)
No65%
Yes35%
6-111

2008 Employer Survey Summary Report Section 5.3.2 Industry 6 - Natural Resources Family Friendly – Northeast Region To ensure that jobs of equal value earn equal pay, a minority of Northeast area businesses in this industry (13%, n=14) have developed and implemented a written, formal gender-neutral process for job evaluation based on skill level, effort, responsibility and working conditions. Figure E81: Percentage of Businesses/Organization that have a Written, Formal Gender-Neutral
Process of Job Evaluation - Natural Resources – Northeast Region (N=115)
Don't know1%
No87%
Yes13%
6-112

2008 Employer Survey Summary Report Section 5.3.3 Industry 6 - Natural Resources Family Friendly – Northwest Region 5.3.3 Northwest Region (N=81)
Among Northwest area businesses in the natural resources industry, the most common form of family-oriented benefits offered is flexible work arrangements (67%, n=54). Figure E82: Types of Family-Friendly Benefits Offered by Businesses - Natural Resources –
Northwest Region (N=81)
67%
30% 24%
99% 95%
33%
70% 76%
0%
20%
40%
60%
80%
100%
Childcare/ eldercareinitiatives and
support
Employee/ familyassistanceprograms
Flexible workarrnagements
Reduction of worktime
Paid leave benefits
Yes No Don't know
Over one-third of businesses in this industry (39%, n=31) employ women in key decision-making positions such as positions at the management and senior management level. Within these businesses (n=31), women account for an average of 42% of all key decision-making positions. Figure E83: Percentage of Businesses that Employ Women in Key Decision-Making Positions -
Natural Resources – Northwest Region (N=81)
No61%
Yes39%
6-113

2008 Employer Survey Summary Report Section 5.3.3 Industry 6 - Natural Resources Family Friendly – Northwest Region To ensure that jobs of equal value earn equal pay, a minority of Northwest area businesses in this industry (7%, n=5) have developed and implemented a written, formal gender-neutral process for job evaluation based on skill level, effort, responsibility and working conditions. Figure E84: Percentage of Businesses/Organization that have a Written, Formal Gender-Neutral
Process of Job Evaluation - Natural Resources – Northwest Region (N=81)
Don't know1%
No92%
Yes7%
6-114

2008 Employer Survey Summary Report Section 5.3.4 Industry 6 - Natural Resources Family Friendly – Southeast Region 5.3.4 Southeast Region (N=44)
PLEASE NOTE THAT THE MARGIN OF ERROR FOR THIS ECONOMIC REGION IS ABOVE 10%, THEREFORE, FINDINGS SHOULD BE INTERPRETED WITH CAUTION. Among Southeast area businesses in the natural resources industry, the most common form of family-oriented benefits offered is flexible work arrangements (61%, n=27). Figure E85: Types of Family-Friendly Benefits Offered by Businesses - Natural Resources –
Southeast Region (N=44)
7%
61%
29%18%
95% 93%
39%
68% 81%
5%0%
20%
40%
60%
80%
100%
Childcare/ eldercareinitiatives and
support
Employee/ familyassistanceprograms
Flexible workarrnagements
Reduction of worktime
Paid leave benefits
Yes No Don't know
Just over one-half of businesses in this industry (53%, n=23) employ women in key decision-making positions such as positions at the management and senior management level. Within these businesses (n=23), women account for an average of 50% of all key decision-making positions. Figure E86: Percentage of Businesses that Employ Women in Key Decision-Making Positions -
Natural Resources – Southeast Region (N=44)
No47%
Yes53%
6-115

2008 Employer Survey Summary Report Section 5.3.4 Industry 6 - Natural Resources Family Friendly – Southeast Region To ensure that jobs of equal value earn equal pay, a minority of Southeast area businesses in this industry (13%, n=6) have developed and implemented a written, formal gender-neutral process for job evaluation based on skill level, effort, responsibility and working conditions. Figure E87: Percentage of Businesses/Organization that have a Written, Formal Gender-Neutral
Process of Job Evaluation - Natural Resources – Southeast Region (N=44)
No87%
Yes13%
6-116

2008 Employer Survey Summary Report Section 5.3.5 Industry 6 - Natural Resources Family Friendly – Southwest Region 5.3.5 Southwest Region (N=35)
PLEASE NOTE THAT THE MARGIN OF ERROR FOR THIS ECONOMIC REGION IS ABOVE 10%, THEREFORE, FINDINGS SHOULD BE INTERPRETED WITH CAUTION. Among Southwest area businesses in the natural resources industry, the most common form of family-oriented benefits offered is flexible work arrangements (61%, n=22). Figure E88: Types of Family-Friendly Benefits Offered by Businesses - Natural Resources –
Southwest Region (N=35)
26%
61%
29%45%
86%72%
39%
71%55%
11%0%
20%
40%
60%
80%
100%
Childcare/ eldercareinitiatives and
support
Employee/ familyassistanceprograms
Flexible workarrnagements
Reduction of worktime
Paid leave benefits
Yes No Don't know
Nearly three-quarters of businesses in this industry (74%, n=26) employ women in key decision-making positions such as positions at the management and senior management level. Within these businesses (n=26), women account for an average of 42% of all key decision-making positions. Figure E89: Percentage of Businesses that Employ Women in Key Decision-Making Positions -
Natural Resources – Southwest Region (N=35)
No26%
Yes74%
6-117

2008 Employer Survey Summary Report Section 5.3.5 Industry 6 - Natural Resources Family Friendly – Southwest Region To ensure that jobs of equal value earn equal pay, just over one-quarter of Southwest area businesses in this industry (28%, n=10) have developed and implemented a written, formal gender-neutral process for job evaluation based on skill level, effort, responsibility and working conditions. Figure E90: Percentage of Businesses/Organization that have a Written, Formal Gender-Neutral
Process of Job Evaluation - Natural Resources – Southwest Region (N=35)
Don't know2%
No69%
Yes28%
6-118

2008 Employer Survey Summary Report Industry 6 – Natural Resources Detailed Findings by Industry
6.0 Literacy
6-119

2008 Employer Survey Summary Report Section 6.0 Industry 6 – Natural Resources Literacy
6.1 Provincial Overview
6-120

2008 Employer Survey Summary Report Section 6.1 Industry 6 - Natural Resources Literacy – Provincial Overview
6.1 Provincial Overview (N=318)
Overall, a minority of businesses in the natural resources industry (16%, n=50) report having at least one employee who has difficulty reading and subsequently applying what was read to his/her job. Among these businesses (n=50), it is estimated that an average of 15% of employees experience this problem. Figure E91: Percentage of Businesses With Employees Who Have Difficulty Reading,
Understanding or Applying What They Have Read to Their Jobs - Natural Resources - Provincial Overview (N=318)
Don’t Know3%
No82%
Yes16%
Furthermore, a minority of businesses (11%, n=35) report having at least one employee who has difficulty working with numbers in his/her job, including difficulty in measuring, calculating, or observing or recording results. Among these businesses (n=35), it is estimated that an average of 14% of employees experience this problem. Figure E92: Percentage of Businesses With Employees Who Have Difficulty Working With
Numbers in Their Jobs - Natural Resources – Provincial Overview (N=318)
Don’t Know3%
No86%
Yes11%
6-121

2008 Employer Survey Summary Report Section 6.1 Industry 6 - Natural Resources Literacy – Provincial Overview Businesses in this industry with at least one employee who experiences a reading or numeracy difficulty (n=56) were asked if they have any initiatives or programs in place to support these employees. The large majority of these businesses (86%, n=48) do not have any initiatives or programs in place. Figure E93: Percentage of Businesses With Initiatives/Programs to Support Employees With
Reading/Numeracy Difficulties - Natural Resources - Provincial Overview (N=56)
Don't Know2%
No86%
Yes12%
Businesses that have such initiatives or programs in place (n=7) were asked to describe them. The most popular initiatives/programs include internal training opportunities (n=5) and paying for educational upgrades/courses (n=2)31.
31 Multiple responses allowed.
6-122

2008 Employer Survey Summary Report Section 6.0 Industry 6 – Natural Resources Literacy
6.2 Urban/Rural Subdivision
6.2.1 Urban Subdivision 6.2.2 Rural Subdivision
6-123

2008 Employer Survey Summary Report Section 6.2.1 Industry 6 - Natural Resources Literacy – Urban Subdivision 6.2.1 Urban Subdivision (N=97)
Overall, a minority of urban businesses in the natural resources industry (11%, n=11) report having at least one employee who has difficulty reading and subsequently applying what was read to his/her job. Among these businesses (n=11), it estimated that an average of 16% of employees experience this problem. Figure E94: Percentage of Businesses With Employees Who Have Difficulty Reading,
Understanding or Applying What They Have Read to Their Jobs - Natural Resources – Urban Subdivision (N=97)
Don’t Know3%
No86%
Yes11%
Furthermore, a minority of urban businesses (8%, n=8) report having at least one employee who has difficulty working with numbers in his/her job, including difficulty in measuring, calculating, or observing or recording results. Among these businesses (n=8), it is estimated that an average of 11% of employees experience this problem. Figure E95: Percentage of Businesses With Employees Who Have Difficulty Working With
Numbers in Their Jobs - Natural Resources – Urban Subdivision (N=97)
Don’t Know2%
No90%
Yes8%
Urban businesses in this industry with at least one employee who experiences a reading or numeracy difficulty (n=13) were asked if they have any initiatives or programs in place to support these employees. Twelve of these 13 businesses do not have any initiatives or programs in place. The business that does have an initiative or program in place offers internal training opportunities32.
32 Multiple responses allowed.
6-124

2008 Employer Survey Summary Report Section 6.2.2 Industry 6 - Natural Resources Literacy – Rural Subdivision
6.2.2 Rural Subdivision (N=246)
Overall, 18% of rural businesses in the natural resources industry (n=44) report having at least one employee who has difficulty reading and subsequently applying what was read to his/her job. Among these businesses (n=44), it estimated that an average of 15% of employees experience this problem. Figure E96: Percentage of Businesses With Employees Who Have Difficulty Reading,
Understanding or Applying What They Have Read to Their Jobs - Natural Resources – Rural Subdivision (N=246)
Don’t Know2%
No80%
Yes18%
Furthermore, a minority of rural businesses (12%, n=30) report having at least one employee who has difficulty working with numbers in his/her job, including difficulty in measuring, calculating, or observing or recording results. Among these businesses (n=30), it is estimated that an average of 15% of employees experience this problem. Figure E97: Percentage of Businesses With Employees Who Have Difficulty Working With
Numbers in Their Jobs - Natural Resources – Rural Subdivision (N=246)
Don’t Know3%
No85%
Yes12%
6-125

2008 Employer Survey Summary Report Section 6.2.2 Industry 6 - Natural Resources Literacy – Rural Subdivision
Rural businesses in this industry with at least one employee who experiences a reading or numeracy difficulty (n=49) were asked if they have any initiatives or programs in place to support these employees. The large majority of these businesses (82%, n=40) do not have any initiatives or programs in place. Figure E98: Percentage of Businesses With Initiatives/Programs to Support Employees With
Reading/Numeracy Difficulties - Natural Resources – Rural Subdivision (N=49)
Don't Know2%
No82%
Yes16%
Businesses that have such initiatives or programs in place (n=8) were asked to describe them. The most popular initiatives/programs include internal training opportunities (n=5) and paying for educational upgrades/courses (n=2)33.
33 Multiple responses allowed.
6-126
2008 Employer Survey Summary Report Section 6.0 Industry 6 – Natural Resources Literacy
6.3 Economic Regions
6.3.1 Central Region 6.3.2 Northeast Region 6.3.3 Northwest Region 6.3.4 Southeast Region 6.3.5 Southwest Region
6-127

2008 Employer Survey Summary Report Section 6.3.1 Industry 6 - Natural Resources Literacy – Central Region 6.3.1 Central Region (N=44)
PLEASE NOTE THAT THE MARGIN OF ERROR FOR THIS ECONOMIC REGION IS ABOVE 10%, THEREFORE, FINDINGS SHOULD BE INTERPRETED WITH CAUTION. Overall, a minority of Central area businesses in the natural resources industry (11%, n=5) report having at least one employee who has difficulty reading and subsequently applying what was read to his/her job. Among these businesses (n=5), it is estimated that an average of 12% of employees experience this problem. Figure E99: Percentage of Businesses With Employees Who Have Difficulty Reading,
Understanding or Applying What They Have Read to Their Jobs - Natural Resources – Central Region (N=44)
No89%
Yes11%
Furthermore, a minority of Central area businesses (10%, n=5) report having at least one employee who has difficulty working with numbers in his/her job, including difficulty in measuring, calculating, or observing or recording results. Among these businesses (n=5), it is estimated that an average of 19% of employees experience this problem. Figure E100: Percentage of Businesses With Employees Who Have Difficulty Working With
Numbers in Their Jobs - Natural Resources – Central Region (N=44)
No90%
Yes10%
Businesses in this industry with at least one employee who experiences a reading or numeracy difficulty (n=8) were asked if they have any initiatives or programs in place to support these employees. Six of these eight businesses do not have any initiatives or programs in place. The two businesses that have initiatives/programs in place offer internal training opportunities34.
34 Multiple responses allowed.
6-128

2008 Employer Survey Summary Report Section 6.3.2 Industry 6 - Natural Resources Literacy – Northeast Region
6-129
6.3.2 Northeast Region (N=115)
Overall, 19% of Northeast area businesses in the natural resources industry (n=22) report having at least one employee who has difficulty reading and subsequently applying what was read to his/her job. Among these businesses (n=22), it is estimated that an average of 17% of employees experience this problem. UFigure E101U: Percentage of Businesses With Employees Who Have Difficulty Reading,
Understanding or Applying What They Have Read to Their Jobs - Natural Resources – Northeast Region (N=115)
Don't know5%
No76%
Yes19%
Furthermore, a minority of Northeast area businesses (10%, n=12) report having at least one employee who has difficulty working with numbers in his/her job, including difficulty in measuring, calculating, or observing or recording results. Among these businesses (n=12), it is estimated that an average of 11% of employees experience this problem. UFigure E102U: Percentage of Businesses With Employees Who Have Difficulty Working With
Numbers in Their Jobs - Natural Resources – Northeast Region (N=115)
Don't know5%
No84%
Yes10%
Businesses in this industry with at least one employee who experiences a reading or numeracy difficulty (n=23) were asked if they have any initiatives or programs in place to support these employees. The majority of these businesses (n=20) do not have any initiatives or programs in place. Businesses that have such initiatives or programs in place (n=3) were asked to describe them. Two of these businesses offered internal training opportunities, while the other business offered something elseTP
35PT.
TP
35PT Multiple responses allowed.

2008 Employer Survey Summary Report Section 6.3.3 Industry 6 - Natural Resources Literacy – Northwest Region
6-130
6.3.3 Northwest Region (N=81)
Overall, a minority of Northwest area businesses in the natural resources industry (12%, n=10) report having at least one employee who has difficulty reading and subsequently applying what was read to his/her job. Among these businesses (n=10), it is estimated that an average of 14% of employees experience this problem. UFigure E103U: Percentage of Businesses With Employees Who Have Difficulty Reading,
Understanding or Applying What They Have Read to Their Jobs - Natural Resources – Northwest Region (N=81)
Don't know2%
No86%
Yes12%
Furthermore, a minority of Northwest area businesses (8%, n=7) report having at least one employee who has difficulty working with numbers in his/her job, including difficulty in measuring, calculating, or observing or recording results. Among these businesses (n=7), it is estimated that an average of 15% of employees experience this problem. UFigure E104U: Percentage of Businesses With Employees Who Have Difficulty Working With
Numbers in Their Jobs - Natural Resources – Northwest Region (N=81)
Don't know4%
No88%
Yes8%
Businesses in this industry with at least one employee who experiences a reading or numeracy difficulty (n=12) were asked if they have any initiatives or programs in place to support these employees. Nine of these 12 businesses do not have any initiatives or programs in place. The two businesses that have initiatives/programs in place offer internal training opportunities and paying for educational upgrades/coursesTP
36PT.
TP
36PT Multiple responses allowed.

2008 Employer Survey Summary Report Section 6.3.4 Industry 6 - Natural Resources Literacy – Southeast Region
6-131
6.3.4 Southeast Region (N=44)
PLEASE NOTE THAT THE MARGIN OF ERROR FOR THIS ECONOMIC REGION IS ABOVE 10%, THEREFORE, FINDINGS SHOULD BE INTERPRETED WITH CAUTION. Overall, 19% of Southeast area businesses in the natural resources industry (n=8) report having at least one employee who has difficulty reading and subsequently applying what was read to his/her job. Among these businesses (n=8), it is estimated that an average of 11% of employees experience this problem. UFigure E105U: Percentage of Businesses With Employees Who Have Difficulty Reading,
Understanding or Applying What They Have Read to Their Jobs - Natural Resources – Southeast Region (N=44)
Don't know3%
No79%
Yes19%
Furthermore, 17% of Southeast area businesses (n=7) report having at least one employee who has difficulty working with numbers in his/her job, including difficulty in measuring, calculating, or observing or recording results. Among these businesses (n=7), it is estimated that an average of 9% of employees experience this problem. UFigure E106U: Percentage of Businesses With Employees Who Have Difficulty Working With
Numbers in Their Jobs - Natural Resources – Southeast Region (N=44)
No83%
Yes17%
Businesses in this industry with at least one employee who experiences a reading or numeracy difficulty (n=8) were asked if they have any initiatives or programs in place to support these employees. Six of these eight businesses do not have any initiatives or programs in place. The two businesses that have initiatives/programs in place offer internal training opportunities and paying for educational upgrades/coursesTP
37PT.
TP
37PT Multiple responses allowed.

2008 Employer Survey Summary Report Section 6.3.5 Industry 6 - Natural Resources Literacy – Southwest Region
6-132
6.3.5 Southwest Region (N=35)
PLEASE NOTE THAT THE MARGIN OF ERROR FOR THIS ECONOMIC REGION IS ABOVE 10%, THEREFORE, FINDINGS SHOULD BE INTERPRETED WITH CAUTION. Overall, a minority of Southwest area businesses in the natural resources industry (15%, n=5) report having at least one employee who has difficulty reading and subsequently applying what was read to his/her job. Among these businesses (n=5), it is estimated that an average of 17% of employees experience this problem. UFigure E107U: Percentage of Businesses With Employees Who Have Difficulty Reading,
Understanding or Applying What They Have Read to Their Jobs - Natural Resources – Southwest Region (N=35)
No85%
Yes15%
Furthermore, a minority of Southwest area businesses (12%, n=4) report having at least one employee who has difficulty working with numbers in his/her job, including difficulty in measuring, calculating, or observing or recording results. Among these businesses (n=4), it is estimated that an average of 22% of employees experience this problem. UFigure E108U: Percentage of Businesses With Employees Who Have Difficulty Working With
Numbers in Their Jobs - Natural Resources – Southwest Region (N=35)
No88%
Yes12%
Businesses in this industry with at least one employee who experiences a reading or numeracy difficulty (n=6) were asked if they have any initiatives or programs in place to support these employees. None of these six businesses have any initiatives or programs in place.