INDONESIA RICE SUPPLY AND DEMAND DYNAMIC MODEL · rural and urban consumption, diversification...
19
AFBE Journal Academic Papers 418 INDONESIA RICE SUPPLY AND DEMAND DYNAMIC MODEL Nunung Kusnadi [email protected] Netti Tinaprilla [email protected] Department of Agribusiness, Faculty of Economics and Management, Bogor Agricultural University, INDONESIA ABSTRACT Demand for rice in Indonesia is high and it is difficult to decrease. Meanwhile there is a big problem in supply side. We also face problem in rice import, land conversion, price fluctuation and leveling of productivity. Unbalanced condition between demand and supply can threat sustainability of food security. Therefore, to maintain balanced in rice supply and demand is important. Related to the aforementioned, the aim of this study is focused on dynamic model development of rice supply and demand. The result of this study reveal that conversion make land farming can‟t increase rapidly and land extensification program is bounded by available land. Domestic rice production can‟t cover rice demand so that BULOG has to conduct market operation with higher rate and cannot avoid rice import. To achieve rice self sufficiency in supply side, production technology is very important to increase productivity. In demand side, we need to decrease rice consumption through consumption diversification campaign. INTRODUCTION Indonesia is one of agricultural countries in the world that has significant role to endow with rich agricultural potentials. Furthermore, agricultural sector plays a big role in forming Gross National Income and also plays a role in supplying food and industrial raw materials. Refers to the Indonesian Government Policy, this sector can make an equal development through the endeavor of poverty reduction and the improvement of people‘s income. The role of food supplier is to achieve food self- sufficiency especially rice. Thus, any activities to increase rice production will be important for sustainable food security. Therefore, there is a need to revitalize agriculture and rice policy in a wider sense throughout Indonesia. One alternative to achieve the national production target is innovating technology and improving productivity in rice production system. Furthermore, demand for rice is increasing with population growth. With 237 million people, in 2010 demand for rice is 32 million tons and rice per capita consumption is 139 kg/year. Rice production is influenced by farming land. Farming land has been converted to another uses like industry and real estate needs. This fact can influence sustainability of rice supply. We also face problem in rice import, land conversion, price fluctuation and leveling of productivity. Unbalanced condition between demand and supply can threat sustainability of food security in Indonesia and it can be a serious problem in whole sectors like economy, social politic, and safety. Therefore, to maintain balanced in rice supply and demand is important. Related to the aforementioned, the aim of this study is focused on dynamic model development of rice supply and demand in order to achieve sustainability of rice self sufficiency.
Transcript of INDONESIA RICE SUPPLY AND DEMAND DYNAMIC MODEL · rural and urban consumption, diversification...

AFBE Journal Academic Papers
418
INDONESIA RICE SUPPLY AND DEMAND DYNAMIC MODEL
Nunung Kusnadi
Netti Tinaprilla
Department of Agribusiness, Faculty of Economics and Management, Bogor
Agricultural University, INDONESIA
ABSTRACT
Demand for rice in Indonesia is high and it is difficult to decrease. Meanwhile
there is a big problem in supply side. We also face problem in rice import, land
conversion, price fluctuation and leveling of productivity. Unbalanced condition
between demand and supply can threat sustainability of food security. Therefore, to
maintain balanced in rice supply and demand is important. Related to the
aforementioned, the aim of this study is focused on dynamic model development of
rice supply and demand. The result of this study reveal that conversion make land
farming can‟t increase rapidly and land extensification program is bounded by
available land. Domestic rice production can‟t cover rice demand so that BULOG has
to conduct market operation with higher rate and cannot avoid rice import.
To achieve rice self sufficiency in supply side, production technology is very
important to increase productivity. In demand side, we need to decrease rice
consumption through consumption diversification campaign.
INTRODUCTION
Indonesia is one of agricultural countries in the world that has significant role
to endow with rich agricultural potentials. Furthermore, agricultural sector plays a big
role in forming Gross National Income and also plays a role in supplying food and
industrial raw materials. Refers to the Indonesian Government Policy, this sector can
make an equal development through the endeavor of poverty reduction and the
improvement of people‘s income. The role of food supplier is to achieve food self-
sufficiency especially rice. Thus, any activities to increase rice production will be
important for sustainable food security. Therefore, there is a need to revitalize
agriculture and rice policy in a wider sense throughout Indonesia. One alternative to
achieve the national production target is innovating technology and improving
productivity in rice production system. Furthermore, demand for rice is increasing
with population growth. With 237 million people, in 2010 demand for rice is 32
million tons and rice per capita consumption is 139 kg/year.
Rice production is influenced by farming land. Farming land has been
converted to another uses like industry and real estate needs. This fact can influence
sustainability of rice supply. We also face problem in rice import, land conversion,
price fluctuation and leveling of productivity. Unbalanced condition between demand
and supply can threat sustainability of food security in Indonesia and it can be a
serious problem in whole sectors like economy, social politic, and safety. Therefore,
to maintain balanced in rice supply and demand is important. Related to the
aforementioned, the aim of this study is focused on dynamic model development of
rice supply and demand in order to achieve sustainability of rice self sufficiency.
AFBE Journal Academic Papers
419
RESEARCH METHODOLOGY
Conceptual Framework
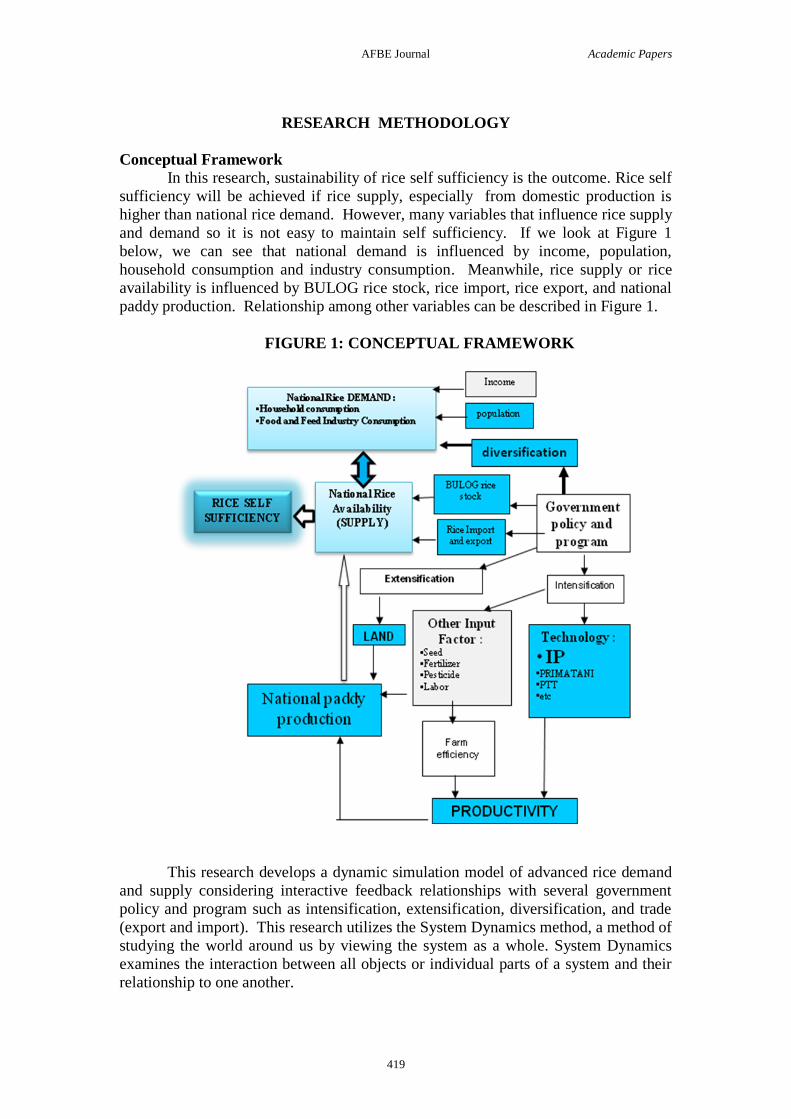
In this research, sustainability of rice self sufficiency is the outcome. Rice self
sufficiency will be achieved if rice supply, especially from domestic production is
higher than national rice demand. However, many variables that influence rice supply
and demand so it is not easy to maintain self sufficiency. If we look at Figure 1
below, we can see that national demand is influenced by income, population,
household consumption and industry consumption. Meanwhile, rice supply or rice
availability is influenced by BULOG rice stock, rice import, rice export, and national
paddy production. Relationship among other variables can be described in Figure 1.
FIGURE 1: CONCEPTUAL FRAMEWORK
This research develops a dynamic simulation model of advanced rice demand
and supply considering interactive feedback relationships with several government
policy and program such as intensification, extensification, diversification, and trade
(export and import). This research utilizes the System Dynamics method, a method of
studying the world around us by viewing the system as a whole. System Dynamics
examines the interaction between all objects or individual parts of a system and their
relationship to one another.

AFBE Journal Academic Papers
420
System Dynamics has two typical methodological characteristics. First, it
focuses on a system‘s dynamic behavior, that is, the behavior changes within the
system according to the progression of time. Second, System Dynamic analysis the
fundamental reasons for dynamic change through a feedback structure. These
characteristics precisely relate to the objectives of this research, which is the
identification of the effect of dynamic changes of extensification or new farming land,
rural and urban consumption, diversification program, price, BULOG rice stock,
market operation, and trade (export and import) on rice supply and demand by
investigating interactive feedback relationship with rice supply and demand. Thus,
this is the reason for using System Dynamics as the methodology for pursuing the
objectives of this research.
Traditionally, there are two Systems Dynamics modeling approaches. One is
known as the top-down modeling approaches, and the other is known as the bottom-
up modeling approach. In the top-down approach that emphasizes ‗feedback loop
thinking‘, a causal loop diagram is made, followed by a detailed System Dynamics
diagram. In the bottom-up approach that emphasizes ‗operational thinking‘, a System
Dynamics diagram is established first by linking individual stock and flow variables,
and then a causal loop diagram is completed by gradually expanding the System
Dynamics diagram. This research employs the top-down modeling approach.
Specifically, System Dynamics analysis of this research is implemented through a
three stage simulation modeling process of establishing a causal loop diagram,
designing a System Dynamics diagram, and formulating an equation.
System Dynamics
For developing the model, mechanism of the research is described as follows;
identifying key variables and its behavior in the system, developing inter-relationship
among key variables in the form of mathematical formulations, programming the
model by using dynamic system based application software, and then simulating,
validating the model to improve performance of the model. The model was tested in
national coverage with base period 2005. Data was collected from some agency or
institution and some literature and textbook that related to this research. For data
processing, this research uses I-Think 9.03 version as system dynamic software.
In order to fully address research questions and objectives, more sophisticated
models must be constructed and more comprehensive simulations must be carried out.
Thus, this research will develop a dynamic simulation model of rice demand and
supply considering interactive feedback relationships with several government policy
and program such as intensification, extensification or new farming land, rural and
urban consumption, diversification program, price, BULOG rice stock and trade
(export and import) on rice supply and demand. This research uses the System
Dynamics method. In the 1960s, Massachusetts Institute of Technology Professor Jay
W. Forrester (1961) created Systems Dynamics, a method of studying the world
around us by viewing the system as a whole. Systems Dynamics examines the
interaction of all objects or individual parts of a system and their relationship to one
another. Basic system structures are assessed to better understand the cause and effect
that may be produced. Many of these systems can be built as computerized models
and are able to perform reliable calculations at a much greater speed than the human-
mind based model.
Even though the application scope and focus of System Dynamics have
changed continuously, the typical methodological characteristics of System Dynamics
have still remained strong during the last 40 years. The first characteristic is that

AFBE Journal Academic Papers
421
System Dynamics focuses on the dynamic behavior of systems, that is, the behavioral
changes of systems according to the progression of time. This implies that System
Dynamics emphasizes practical perspectives such as the change, evolution,
development, and decline of systems. The second feature of System Dynamics is that
it analyzes the fundamental reasons of dynamic change through feedback structure.
Feedback structure means that a closed loop is established by linking causal
relationships among variables (Richardson 1991). Emphasizing feedback loop
indicates that the dynamic change of a system is analyzed through endogenous
variables rather than exogenous variables. Explaining the change of a system by
exogenous variables makes it difficult to alter the behavior of a system strategically.
However, the utilization of endogenous variables makes it possible to change the
behavior of a system within a model. Another strong point of the feedback structure is
to analyze the change of a system in terms of the overall structure of the system rather
than the change of parameter related to a specific variable. These characteristics
precisely correspond to the objective of this research, which is the identification of
dynamic changes rice demand and supply by investigating interactive feedback
relationships with several government policy and program such as intensification,
extensification, rice self sufficiency, food security, and trade. This provides the
reason for using System Dynamics as the methodology to pursue the objectives of this
research.
System Dynamics Modeling Process
The simulation modeling process by the System Dynamics method can be
largely classified into three stages; establishing a causal loop diagram, designing a
System Dynamics diagram, and formulating an equation.
Stage 1: Establishing a causal loop diagram
A causal loop diagram is the map identifying the feedback structure of a
system and organizes the cause and effect that may be produced in a system by
indicating the feedback structure on a two-dimensional diagram. A causal loop
diagram is established by a set of causal propositions or hypotheses on the shape of
relationships among selected construct variables.
Stage 2: Designing a System Dynamics diagram A System Dynamics diagram is the map quantitatively actualizing the
feedback relationships derived from a causal loop diagram through the consideration
of two concepts on system behavior such as system state and system activity. System
state is indicated as the values of all variables constructing a system at time ‗t‘. Such
values are the changing values obtained as a result of activities occurred between time
‗t-1‘ and ‗t‘. Also, information on such system state leads to the change of future
activity by feedback.
Stage 3: Formulating equations
In this stage, equations corresponding to system state and system activity
indicated in the System Dynamics diagram are formulated by computer simulation
language. Such formulation of equations is completed through supplementation by
several test runs of the simulation model.

AFBE Journal Academic Papers
422
INDONESIAN RICE CONDITION
The Importance of Rice Indonesia archipelago stretches 5,110 kilometers from west to east and 1,888
kilometer from north to south along the equator and consists more than 17,000
islands. Total population is more than 210 million people and around 60% lives in
Java island which has only 7% of the total land area. Therefore in country like
Indonesia, logistics function has decisive role in determining the successful
achievement of national food policy, particularly in ensuring adequate food supply at
affordable price. Efforts to attain food price stabilization through distribution of staple
food throughout the country is of importance to the national economic development.
Rice is still considered the most important grains in Indonesia since this crop
is the staple food for majority of the people. In addition millions of people engaged in
rice production, rice processing and other post-harvest activities related to rice.
Considering the importance of rice, Government of Indonesia has launched many
programs to boast rice production in order to meet the demand, and trying not too
much dependent on imported rice.
Success story of Indonesia rice production seems to become a history of
government capability to formulate a comprehensive food policy with particular
reference to rice, coupled with social engineering program that was able to gear-up
people to boast rice production. In addition, important supporting elements ranging
from provision of agricultural inputs for rice production such as increasing fertilizer
supply, provision of good quality seed, credit with low interest rate etc. played a key
role in providing basic support to increase productivity, improving rice quality and
minimizing losses. All contributed greatly to Indonesia‘s self-sufficiency in rice.
However, later in the development, many changes have been occurring in Indonesia
food policy which directly translated into new implementation strategy. Remarkable
impact on the availability of food as well as on domestic market has been noted. The
demand for rice keeps moving on the upward trend, in line with increasing population
and income of the people. On the other hand production seemed to move more
sluggishly and is unable to keep-up with the fast increasing demand. As a result in the
1990‘s Indonesia has become major rice importing countries with import around 2
MMT (Million Metric Tons) annually. Ironically, in 1998 Indonesia had changed its
status from rice self-sufficient country to become the largest importing country, after
they recorded import nearly 6 MMT.
Rice in The Context of Food Security Rice has been considered not only as a trade commodity but also political
commodity. During Soekarno era, the first president of Indonesia used rice as a
vehicle to gain international support for Indonesia global political policy. As
realization thousands tons of rice was shipped to other countries as a gesture of
solidarity and to get positive response to strengthen Indonesia international policy.
The New Order regime led by Suharto has looked rice from different angle but
still placed rice as one of the most important political instrument. Therefore in the
early seventies programs to increase rice production were launched as an integral part
of comprehensive food policy with ultimate objective to strengthen food security and
alleviate poverty. Rice had to be made available at all time, in every place at

AFBE Journal Academic Papers
423
affordable price. Rice policy at this period covered various aspect from inputs of
production by providing seed, fertilizer, pesticide and financial support through
special credit line set up in government banks with low interest.
Bulog used to be a para-statal organization with its main function to stabilize
price of basic food commodities in line with government food policy. In executing
this tasks Bulog implements buffer stock strategy, which buys rice at floor price level
during harvest season to absorb supply to prevent declining price. This farm gate price
is set-up well above the production cost, aiming at ensuring farmers profit thus
providing a better income for rice farmers. In the leaning months market intervention
was conducted to smooth-out price fluctuation, as an effort to maintain affordability
of lower-income groups to ensure their household food security.
Domestic procurement carried-out by Bulog basically to guarantee market for
rice farmers to sell their product and to purchase rice for Bulog operation in supplying
rice for public service obligation and for national stock reserve. Bulog was supported
with special credit line set-up in Central Bank (Bank Indonesia), therefore Bulog
could purchase rice without any difficulty. Farmers were very happy since they
received significant subsidy through cheap fertilizer, pesticide and financial support
during planting season and guaranteed market for their product.
By implementing rice policy and supported with large investment for
improving irrigation and massive subsidy provided by government, rice production
increased significantly at the rate of more than 4.5% in 1969-1990. These all-out
efforts to boast rice production was culminated in 1984 when Indonesia was
pronounced to be self-sufficient country in rice and President Suharto received an
award from FAO for the country achievement. In 1984 Indonesia rice production was
million metric tons (MMT), and BULOG had an ending stock more than 3.0 MMT,
the largest ending stock in the history of this organization . It was the time when food
security in this country including households food security was considered very
strong, and the primary source of the food supply particularly rice came from
domestic production. Many privileges were given to Bulog, among others monopoly
right to import basic food commodities such as rice, sugar, wheat, soybean, corn etc.
More than three decades the price stabilization strategy was considered
effective and contributing significantly to socio-economic stability which provides
strong foundation for economic development. Empirical data showed that favorable
conditions had stimulated remarkable increase in the contribution of agricultural
sector to GDP, which grew more than 5.7% per year during 1978-1986. All sub-sector
of food crops, cash crops, livestock and fisheries all enjoyed such conducive
environment and progressing rapidly. Government had placed agricultural sector as
back-bone of economic development and vehicle to encounter poverty and
malnutrition, particularly in rural areas. During this period Bulog had the monopoly
right to import rice and other basic food commodities such as sugar, wheat, corn and
soybean. Later in the development one by one these commodities was released to
private importers and Bulog had no longer monopoly right for importing those
commodities including rice. The argument raised by scholars primarily lingered on
the accountability, transparency and efficiency of Bulog operation. They suggested
that direction on Indonesia food policy should move towards more open and fair in
international trade of rice and other commodities.
Economic crisis hampered Indonesia and other countries had severe impact on
every facet of Indonesia economy. Industrial sector and agricultural sector were hit
and many of them had closed down their plants. Further down, numbers of poor
people rose significantly and there numbers of malnutrition prevalence increased

AFBE Journal Academic Papers
424
rapidly. Such conditions forced government to change its strategy particularly on food
policy, and it translated, among others by rationalizing the price stabilization strategy.
Rather than providing general price subsidy through what so-called market operation
at which government intervene the market by distributing low price of rice, a targeted
subsidy program through special market intervention and later changed to rice for the
poor (Raskin) was introduced. This program was specifically design for strengthening
food security of the low-income group and the poor family. A set of criteria was used
to determine target beneficiaries and the one eligible to receive this subsidized rice
can get the ration 20 kg per family per month, with the price of Rp.1,000.-. The
program has been launched since 1998 and annually government provides around 2.2
MMT rice distributed to the poor with total subsidy approximately Rp.4.6 trillions .
As indicated earlier basically implementation of Indonesia food policy covers the
following:
1. Implementing domestic price support by guaranteeing market for rice in terms
of floor price to support farmer to improve their income and to stimulate rice
production. This price is reviewed adjusted annually to accommodate inflation
rate which affect cost of production and also the changing of rice price in
international market. On consumers side a ceiling price is set-out to maintain
price stability at affordable level, particularly for the low-income groups.
During leaning months rice price tend to increase due to short of supply, and
to prevent excessive increase in price government through Bulog would
intervene the market my releasing its stock at price level lower than the
prevailing market price.
2. Control rice import. Considering free flow of rice after deregulation of rice
trade, with zero percent tariff had increased downward pressure to domestic
rice market, government has decided to manage rice import by imposing
import tariff at around 30% (Rp.430,-/kilogram or around US$45/ton) in 2000.
The tariff should be reviewed and evaluated routinely to verify its impact on
domestic rice market as well on farmers‘ income.
3. Provision of subsidized rice for the poor. Targeted rice subsidy through Rice
for the Poor (Raskin) program aims at providing support to the fulfillment of
minimum rice requirement for poor family. Ration of rice at the amount of 20
kg/month/family is intended to avoid malnutrition among poor family, as a
part of the social safety net program which was initiated after the crisis in
1997.
4. Diversification of consumption. Recognizing dependent too much on rice as
source of energy for majority of the people may have a negative impact on rice
production and national food security as a whole. To meet constant increasing
demand on rice due to increasing income and population growth, Indonesia
has to import million tons of rice annually. Therefore diversification on
consumption has to be started in a more serious manner and supported with
program to increase production of other source of carbohydrate crops.
Indonesia, in fact is rich in other sources of carbohydrate such as sago, cassava
and other tuber crops. To implement this policy various programs to boast
production of other food crops have been launched since 2000.

AFBE Journal Academic Papers
425
Rice in The Context of Trade Liberalization
As indicated earlier, the Government of Indonesia has deregulated trade of
food crops, and liberalized trade of those commodities including rice. Monopoly right
which used to be enjoyed by Bulog has been abolished, with expectation that such
moves can reduce domestic barrier to entry and exposes domestic producers to
international competition. Furthermore, government expects that the policy would
promote trade, increase market access and economic efficiency and at the end
improve consumers‘ welfare. It should be pointed-out, however, liberalizing rice trade
in relatively short period of time seemed to have more negative than positive one.
Statistical data showed that at zero percent import tariff (which In fact far
beyond the WTO or AFTA arrangement which allow tariff up to 120% for rice until
2003) the quantity of rice import had doubled from at the average of 1.5 MMT per
year in 1995 – 1997 to more than 3.0 MMT in 1998-2001. Rice import remained high
even until recent years averaging around 2.0 MMT. Those statistical data indicated
that import dependency grew from 4.3% to 9% in 1995 – 1998, which was certainly
not a good sign , recognizing too much dependent on import may endanger domestic
rice producers. In addition, Government argues that such a situation was considered
dangerous to national food security, knowing that rice in the international market is
relatively limited and frequently called thin market.
On the other hand Indonesia rice production declined significantly as
compared to sharp increased during 1980‘s. In 2002 for instance, rice output was 51.4
MMT, approximately 4.5% below the production in 1996. Rice production was low as
compared to previous decade, particularly after El-Nino and La Nina phenomena hit
Indonesia at the same time when economic crisis hampered this country. In addition
some argued that uncontrolled rice import with relatively low tariff coupled with low
price of rice in the world market had brought about domestic rice price relatively
depressed. Such a low price became disincentives to rice farmers, and it might have
long term effect on rice production in Indonesia which can endanger national food
security. Liberalization was frequently accused to be responsible for low productivity
and the decline in rice production. Data on rice production and rice harvested areas as
depicted in Table 1 below.
Recognizing the negative impact of liberalization of rice market government
was under great pressure to make a concrete step to protect domestic rice farmers
from the flood of rice import. Government started imposing import tariff in 2000 at
the level of approximately 30% of the world rice price. The primary objective of this
tariff policy was to protect farmers from further decline in price due to deregulation of
domestic rice market, and low price of rice in the world market.
TABLE 1: RICE HARVESTED AREA AND RICE PRODUCTION IN 1990-
2010
Year Harvested Area
(Ha)
Productivity
(Qu/Ha)
Production
(Ton)
1990 10 502 000 43,00 45 179 000
1991 10 282 000 43,50 45 689 000
1992 11 103 000 43,40 48 240 000
1993 10 993 920 43,78 48 129 321
1994 10 717 734 43,48 46 598 380

AFBE Journal Academic Papers
426
1995 11 420 680 43,52 49 697 444
1996 11 550 045 44,20 51 048 899
1997 11 126 396 44,34 49 339 086
1998 11 730 325 41,97 49 236 692
1999 11 963 204 42,52 50 866 387
2000 11 793 475 44,01 51 898 852
2001 11 499 997 43,88 50 460 782
2002 11 521 166 44,69 51 489 694
2003 11 488 034 45,38 52 137 604
2004 11 922 974 45,36 54 088 468
2005 11 839 060 45,74 54 151 097
2006 11 786 430 46,20 54 454 937
2007 12 147 637 47,05 57 157 435
2008 12 327 425 48,94 60 325 925
2009 12 883 576 49,99 64 398 890
2010 13 118 120 50,30 65 980 670
Source : Indonesia Statistical Central Agency (2010)
However, the effectiveness of import tariff was questionable since it seemed to
have minimal effect on the free flow of rice into domestic market. It appears inability
to enforce the implementation of tariff policy and weak coordination and in-efficient
institutional arrangement had caused rice smuggling or under invoicing which had
contributed to the excessive flow of imported rice to domestic market, even during the
harvest season. Price disparity between international rice price and domestic retail
price in Indonesia had speed-up the flow of rice into Indonesia. The direct impact was
that rice price in domestic market fell below the official supported price and Bulog
was accused for not being able to anticipate such conditions.
Opening domestic rice market freely also caused price fluctuation in
international market directly transmitted to domestic price, which may cause price
instability. When the world market reached its high level inability to shield off
domestic market is certainly has negative impact on household food security of low-
income family due to their low purchasing power. Empirical data showed that the
world rice price was much more volatile than domestic prices over the past two
decades. Such situations would pose poor-family to high degree of risk of price
instability and furthermore might increase prevalence of malnutrition in this country.
Another argument on the impact of liberalization was the fact that Indonesian
farmers were mostly subsistence farmers who only have very small land with average
ownership less than 0.5 ha per family. Uneven competition between farmers in
developed countries and Indonesian farmers and farmers in most of developing
countries was even more by looking at the access to information, infra-structure,
technology and human resource. Thus they are really not in the same level of playing
field and certainly incomparable and farmers in developed countries even received
much more subsidy from their government than their colleague in developing nations.
Therefore liberalization appears to give more benefit to farmers in developed country
rather than in developing countries. Free trade liberalization is often accused of

AFBE Journal Academic Papers
427
bringing-about remarkable increase in food crops importation, reduced incentive and
producers income and triggered urbanization of landless labors and poor farmers to
the neighboring cities (Nainggolan, 2000).
Liberalization of agricultural commodities trade particularly rice has to take
into consideration various important determinant factors; among others the ‗status‘ of
rice in the nation from socio-economics and political perspective. A combination of
trade policy and price stabilization policy which usually translated into
implementation of buffer-stock strategy, ensuring adequate supply of rice, provision
of subsidized rice for the poor to ensure household food security are among the most
commonly policy instruments implemented in most rice eating countries like
Indonesia. It is considered too risky leaving rice price fluctuates erratically due to
shortage of supply as effects of pests, or natural calamities or other reasons that cause
surge in price in international market. Since it may destabilize price in domestic
market and disrupt political and stability in the country due to its high degree of social
cost and political consequences.
Recognizing the political and socio-economics implication of rice economy,
government has to be more careful in formulating such a policy, whether it be
producer- or consumers bias. From producer‘s side keeping the floor rice as high as
possible is the most reasonable way in order to maintain farmers income and level of
welfare. It would not be matter if the guaranteed price has been well above the world
price, providing there is a great effort to discourage rice import and adherence to rules
and procedures of import. On the other side, consumers‘ demands affordable price
with reasonable quality of rice, and government still has to provide rice ration through
targeted subsidy program or public distribution system of subsidized rice for the poor.
Indonesia still has the comparative and competitive advantage to grow rice,
and rice is still the most labor-intensive agricultural activities that can be considered
the best vehicle for rural development. Number of peoples engaged in rice production
and post-production activities including processing, storage, transport and distribution
is enormous. Absorption of unskilled labor in rural areas and its potency to reduce
urbanization are great, providing there is supporting policy that can provide
environment conducive enough for maintaining rice production. Therefore it is
obvious that government of Indonesia has been placing increase of rice production to
keep up with the growing demand as one of the highest priority in agricultural
development.
Self-sufficiency in rice and other food crops is no longer placed as national
goal in agricultural development, although once in a while it is used as political
jargon. It should be pointed-out, however, recognizing the great importance of rice in
Indonesia economy and political stability in the country principle of self-reliance has
become more frequently used as motivation to increase production. It means domestic
production is still be used as a major source for meeting rice consumption for the
people, which reaches more than 130 kg/capita/year (in 2010 is 139 kg/capita/year).
Should there be a shortfall in domestic production due to various reasons, rice import
can be carried-out both by government and private importers.
Rice in the Context of Government Policy
Implementation of rice policy is adjusted in line with government food policy.
Institutional change has been aired since the late nineties, particularly proposal to
restructure Bulog. After intensive and long winded discussion President has come to
decision to agree on the proposed Bulog reorganization. As a realization since January

AFBE Journal Academic Papers
428
2003 this strong and powerful institution has officially changed its status from a para-
statal agency to become State Owned Enterprise (SOE). Since then Bulog has dual
functions namely to conduct public service obligations to carry-out business as
commercial organization. Under its new purview Bulog still retains its public service
function to distribute rice for the poor under Raskin program, and to maintain national
stock reserve to encounter food shortage during natural disaster, social unrest or
others. In addition Bulog is allowed to enter into trading activities of various strategic
commodities as a pure profit making institution, as far as government gives the
mandate to do so.
As a business entity Bulog has to compete fairly with other company either as
rice importer or other food crops business activities, in order to generate income
which has to be contributed to state budget. In 2003 apparently most of Bulog
activities is still dominated by the implementation of public service responsibility. It
should be noted, however, with the changed status, Bulog is no longer responsible for
price stabilization of basic food commodities or in improving farmers‘ welfare. This
new tasks has to be disseminated to the people, academia, observers etc. since most of
them still have wrong perception on Bulogs‘ responsibility particularly in food price
stabilization. Although it is true that ability of Bulog to maintain farm-gate price at the
guaranteed buying price (used to be floor price) will contribute significantly to the
farmers‘ income and encouraging farmers to improve rice productivity which in turn
increasing rice production.
Government in 2004 has changed the level of guaranteed price from Rp.
1,500.- /kg for paddy (un-husked rice meeting government standard quality) to Rp.
1,700,-/kg effective January 2004. With this new reference in buying price the price
for milled rice has also increased to Rp. 2,750.-/kg. As a comparison the price of
medium quality of Thai rice in the world market is US$180 or equivalent to
approximately Rp.1.600.-/kg and with Rp.430,-/kg import tariff the Thai rice can be
sold in the retail price in Jakarta at Rp. 2,150.- or Rp2,200.-. Therefore, low price in
the world market may add complication in the procurement policy implemented by
Bulog. This organization is frequently accused to have preference towards imported
rice for its operation in distributing rice to the poor and armed forces, as compared to
domestic rice since rice import can generate a better profit.
In fact rice import is only complementary to domestic procurement; meaning
import is conducted whenever domestic procurement is not enough for fulfilling
Bulog public service obligation. Annually Bulog procures rice from domestic
production ranged between 1.75 to 2.0 MMT in milled rice term or approximately 6-
7% of the total rice production. Another significant progress recently announced by
the government is the control of import of rice. Recognizing the free flow of rice
import to domestic market has number of negative effects, government decides that
since January 2004, rice can only be imported one month before and two months after
peak harvest which runs from February to May each year. The decision were made by
Minister of Trade and Industry and Minister of Agriculture who specifically described
the period of peak harvest of rice, in response to public demand to abolished import of
rice during harvest season.
In addition there has been an intensive discussion to propose an increase in
import tariff to Rp.510.-/kg (approximately US $55/ton). The underline policy
objective of this proposal is to protect domestic rice farmers from competing with
cheap imported rice, which cause disincentive to farmer to increase rice production.
The proposal so far has not been decided by Minister of Finance, thus the import tariff
is still pegged at Rp.430.-/kg or approximately US $45/tons.

AFBE Journal Academic Papers
429
RESULT AND DISCUSSION
Causal Loop Diagram
The explanation on the causal loop diagram in this research starts from the
impact of land conversion and extensification program on wet land area and dry land
area. Land farming is divided into wet land and dry land. This variables is influence
by new farming land and land conversion. New farming land program or
extensification program will increase land farming area. On the other hand, land
conversion will decrease land farming area.
FIGURE 2: LAND FARMING SECTOR
wet land area
wet land extensif ication
wet land extensif ication
f ractionwet land gap
wet land conv ersion rate
wet land conv ersion f raction
wet land goal
wet land extensif ication delay
Paddy production is attained by the sum of wet land paddy production and dry
land paddy production. Production is influence by IP technology, productivity, and
land area. So that increasing in these determinants will increase paddy production.
Total paddy production is net paddy production after seed, feed, and scattered paddy
substraction. National rice supply is sum of domestic rice production, market
operation from BULOG rice stock, and rice import. Rice export will cut down
national rice supply. BULOG is government agency that conduct rice policy. BULOG
is regulator agency that has to maintain rice stock. BULOG has to buy farmer rice
with floor price in peak harvest season and conduct market operation with ceiling
price in lack season.

AFBE Journal Academic Papers
430
FIGURE 3: NATIONAL RICE SUPPLY SECTOR
?
market operation
import f raction 2
BULOG stock goal
BULOG rice
stock
?
TOTAL PADDY PRODUCTION
RICE PRODUCTION
NATIONAL RICE SUPPLY
rice export
y ield f raction paddy rice
?
rice import
export f raction
Figure 3. National Rice Supply Sector
In demand side, household is divided into urban and rural household.
Household rice demand is sum of urban rice demand and rural rice demand. Rice
demand is influenced by population and rice per capita consumption. In this research,
household rice demand will be decreased by consumption diversification program or
campaign in order to achieve rice self sufficiency in demand side. Price has an
important role in rice demand. High price will reduce demand and vice versa.
National rice demand coming from household and industry rice demand. Finally, rice
self sufficiency is balance of supply and demand so that rice demand and supply
balance is ratio between demand and supply.
FIGURE 4: NATIONAL RICE DEMAND
?
RICE PRODUCTION
?
household rice demand
NATIONAL RICE DEMAND
?
industry rice demand
f or raw material
rice industry f raction

AFBE Journal Academic Papers
431
Equations
As the consequence of causal loop diagrams, the result of this research are
these equations as below :
BULOG_rice__stock(t) = BULOG_rice__stock(t - dt) + (rice_procurement -
market_operation) * dt
INIT BULOG_rice__stock = 1500000
INFLOWS:
rice_procurement = IF(Price<minimum_price)THEN rice_procurement_rate
ELSE+BULOG_stock_gap
OUTFLOWS:
market_operation = BULOG_rice__stock*market_operation_fraction
dry_land_area(t) = dry_land_area(t - dt) + (dry_land_extensification -
dry_land_conversion_rate) * dt
INIT dry_land_area = 1165000
INFLOWS:
dry_land_extensification =
dry_land_gap*dry_land_extensification_fraction/dry_land_extensification_delay
OUTFLOWS:
dry_land_conversion_rate = dry_land_area*dry_land_conversion_fraction
Price(t) = Price(t - dt) + (Change_in_Price) * dt
INIT Price = 2800000
INFLOWS:
Change_in_Price = (Indicated_Price - Price)/Price_Adjustment_Time
rural_population(t) = rural_population(t - dt) + (rural_population_growth_rate) * dt
INIT rural_population = 93859252
INFLOWS:
rural_population_growth_rate = rural_population*rural_growth_rate_fraction
rural_rice_per_capita_consumption_2(t) = rural_rice_per_capita_consumption_2(t -
dt) + (- rural_rice_consumption__change_rate) * dt
INIT rural_rice_per_capita_consumption_2 = 0.142
OUTFLOWS:
rural_rice_consumption__change_rate =
rural_rice_per_capita_consumption_2*rural_per_capita_consumption__gap
urban_population(t) = urban_population(t - dt) + (urban_population_growth_rate) *
dt
INIT urban_population = 123210200
INFLOWS:
urban_population_growth_rate = urban_population*urban_growth_rate_fraction
urban_rice__per_capita_consumption_3(t) =
urban_rice__per_capita_consumption_3(t - dt) + (-
urban_rice_consumption__change_rate_2) * dt
INIT urban_rice__per_capita_consumption_3 = 0.1238
OUTFLOWS:
urban_rice_consumption__change_rate_2 =
urban_rice__per_capita_consumption_3*urban_per_capita_consumption__gap_2
wet_land_area(t) = wet_land_area(t - dt) + (wet_land_extensification -
wet_land_conversion_rate) * dt
INIT wet_land_area = 8400030

AFBE Journal Academic Papers
432
INFLOWS:
wet_land_extensification =
wet_land_gap*wet_land_extensification_fraction/wet_land_extensification_delay
OUTFLOWS:
wet_land_conversion_rate = wet_land_area*wet_land_conversion_fraction
BULOG_stock_gap = BULOG_stock_goal-BULOG_rice__stock
BULOG_stock_goal = 3000000
dry_land_conversion_fraction = 0.0032
dry_land_cultivation_intensity_IP = 0.89
dry_land_extensification_delay = 2
dry_land_extensification_fraction = 0.01
dry_land_gap = dry_land_goal-dry_land_area
dry_land_goal = 15000000
dry_land_paddy_production =
dry_land_area*dry_land_paddy_productivity*dry_land_cultivation_intensity_IP
dry_land_paddy_productivity = 2.430
Effect_of_Demand_Supply_Balance_on_Price =
RICE_DEMAND_SUPPLY_BALANCE^Sensitivity_of_Price_to_Demand_Supply_Bal
ance
export_fraction = 0.016
feed = PADDY_PRODUCTION*feed_fraction
feed_fraction = 0.044
household_rice_demand = (rural_rice_demand+urban_rice_demand)
import_fraction = 0.00629
Indicated_Price = Price*Effect_of_Demand_Supply_Balance_on_Price
industry_rice_demand_for_raw_material =
RICE_PRODUCTION*rice_industry_fraction/100
market_operation_fraction = 0.1
minimum_price = 2500000
NATIONAL_RICE_DEMAND =
household_rice_demand+industry_rice_demand_for_raw_material
NATIONAL_RICE_SUPPLY = RICE_PRODUCTION+market_operation-
rice_export+rice_import
PADDY_PRODUCTION =
wet_land_paddy_production+dry_land_paddy_production
Price_Adjustment_Time = 0.5
RICE_DEMAND_SUPPLY_BALANCE =
NATIONAL_RICE_DEMAND/NATIONAL_RICE_SUPPLY
rice_export = RICE_PRODUCTION*export_fraction
rice_import = IF(BULOG_rice__stock<BULOG_stock_goal)THEN
import_fraction*RICE_PRODUCTION ELSE 0
rice_industry_fraction = 0.0056
rice_procurement_delay = 0.45
rice_procurement_fraction = 0.2
rice_procurement_rate =
TOTAL_PADDY_PRODUCTION*rice_procurement_fraction/rice_procurement_dela
y
RICE_PRODUCTION =
TOTAL_PADDY_PRODUCTION*yield_fraction_paddy_rice
rural_growth_rate_fraction = 0.0135

AFBE Journal Academic Papers
433
rural_per_capita_consumption__gap = rural_rice_per_capita_consumption_2-
rural_rice_consumption_diversification_program
rural_rice_consumption_diversification_program = 0.142-STEP(0.003,5)-
STEP(0.003,10)-STEP(0.003,15)
rural_rice_demand = rural_population*rural_rice_per_capita_consumption_2
scattered_paddy = PADDY_PRODUCTION*scattered_paddy_fraction
scattered_paddy_fraction = 0.11
seed = PADDY_PRODUCTION*seed_fraction
seed_fraction = 0.009
Sensitivity_of_Price_to_Demand_Supply_Balance = 0.45
TOTAL_PADDY_PRODUCTION = PADDY_PRODUCTION-feed-seed-
scattered_paddy*yield_fraction_paddy_rice
urban_growth_rate_fraction = 0.0135
urban_per_capita_consumption__gap_2 = urban_rice__per_capita_consumption_3-
urban_rice_consumption_diversification_program_2
urban_rice_consumption_diversification_program_2 = 0.1238-STEP(0.004,5)-
STEP(0.004,10)-STEP(0.004,15)
urban_rice_demand = urban_rice__per_capita_consumption_3*urban_population
wet_land_conversion_fraction = 0.0026
wet_land_cultivation_intensity_IP = 1.4419
wet_land_extensification_delay = 3
wet_land_extensification_fraction = 31427/192739
wet_land_gap = wet_land_goal-wet_land_area
wet_land_goal = 15000000
wet_land_paddy_production =
wet_land_area*wet_land_paddy_productivity*wet_land_cultivation_intensity_IP
wet_land_paddy_productivity = 4.415
yield_fraction_paddy_rice = 0.62
DISCUSSION
The results of this study reveal that land farming will slightly increase until
2019. This condition is influenced by high land conversion, meanwhile
extensification program of new farming land is difficult to implement. Although
farming land is dominated by wet land, but dry land has potential prospect as rice
farming land.
FIGURE 5: WET LAND AND DRY LAND AREA
03:45 AM 2011?5?11?
Untitled
Page 1
1.00 4.50 8.00 11.50 15.00
Years
1:
1:
1:
2:
2:
2:
1000000
7395000
13790000
1: dry land area 2: wet land area
1 1 1 1
2
2
2
2

AFBE Journal Academic Papers
434
In supply side, wet land production is higher than dry land production. Beside
wet land area, this value is also caused by high wet land productivity and IP
technology. If IP technology can be increased, it will increase domestic paddy
production. National rice supply is comes from domestic rice production, rice import,
and market operation from BULOG rice stock. If there is rice export, it will cut down
national rice supply. For further description, it can be shown from Table 2.
TABLE 2: PADDY PRODUCTION , RICE PRODUCTION AND NATIONAL
RICE SUPPLY ESTIMATION UNTIL 2019
YEAR
DRY LAND
PRODUCTION
WET LAND
PRODUCTION
PADDY
PRODUCTION
TOTAL
PADDY
PRODUCTION
RICE
PRODUCTION
NATIONAL
RICE
SUPPLY
2,005 2,519,545.50 53,474,494.38 55,994,039.88 49,207,562.25 30,508,688.59 30,362,449.23
2,006 2,660,653.08 55,573,691.94 58,234,345.02 51,176,342.41 31,729,332.29 31,660,060.46
2,007 2,800,607.13 57,555,866.03 60,356,473.16 53,041,268.61 32,885,586.54 33,196,999.66
2,008 2,939,417.08 59,427,540.33 62,366,957.41 54,808,082.17 33,981,010.94 36,493,961.70
2,009 3,077,092.28 61,194,874.83 64,271,967.12 56,482,204.70 35,018,966.92 39,594,744.05
2,010 3,213,642.02 62,863,686.15 66,077,328.17 58,068,756.00 36,002,628.72 42,512,035.56
2,011 3,349,075.49 64,439,466.64 67,788,542.13 59,572,570.82 36,934,993.91 45,257,644.37
2,012 3,483,401.81 65,927,402.47 69,410,804.28 60,998,214.80 37,818,893.17 47,842,563.69
2,013 3,616,630.03 67,332,390.68 70,949,020.72 62,349,999.41 38,656,999.63 50,277,032.43
2,014 3,748,769.15 68,659,055.35 72,407,824.50 63,631,996.17 39,451,837.62 52,570,590.86
2,015 3,879,828.04 69,911,762.75 73,791,590.79 64,848,049.99 40,205,790.99 54,732,131.92
2,016 4,009,815.56 71,094,635.77 75,104,451.33 66,001,791.82 40,921,110.93 56,769,948.48
2,017 4,138,740.45 72,211,567.44 76,350,307.89 67,096,650.57 41,599,923.35 58,691,776.85
2,018 4,266,611.40 73,266,233.78 77,532,845.18 68,135,864.35 42,244,235.90 60,504,836.94
2,019 4,393,437.03 74,262,105.89 78,655,542.92 69,122,491.12 42,855,944.49 62,215,869.28
Rural rice per capita consumption is higher than urban. However, because of
lower population, rural rice demand is lower than urban. If demand increase very fast

AFBE Journal Academic Papers
435
and supply is leveling of, in the future it will disturb demand supply balance and rice
self sufficiency can‘t be achieved. Hence, we need to decrease rice per capita
consumption. One way to do that is consumption diversification campaign. If we look
at figure below, rice demand become slightly increase as the effect of consumption
diversification campaign. With this program, Indonesia can maintain rice self
sufficiency.
FIGURE 6: URBAN AND RURAL RICE DEMAND
04:28 AM 2011?5?11?
Untitled
Page 2
1.00 3.25 5.50 7.75 10.00
Years
1:
1:
1:
2:
2:
2:
24580000
40400000
56220000
1: NATIONAL RICE SUPPLY 2: NATIONAL RICE DEMAND
1
1
1
1
22
22
CONCLUSION AND POLICY IMPLICATION
Conversion make land farming can‘t increase rapidly and land extensification
program is bounded by available land. Domestic rice production can‘t cover rice
demand so that BULOG has to conduct market operation with higher rate and cannot
avoid rice import. To achieve rice self sufficiency in supply side, new farming land
program can increase domestic rice production, and new technology like IP is very
important to increase productivity. In demand side, we need to decrease rice
consumption through consumption diversification campaign.
REFERENCES
Coyle,R.G. 1977.Management Systems Dynamics. London;New York Wiley.
Dawe, David. 1997. Should Asia Move to Free Trade of Rice?. In Silitonga et al
(Eds). 30 Years the Roles of BULOG in Food Security, Badan Urusan
Logistik, Jakarta.
Ellis, Frank. 1993. Private Trade and Public Role in Stale Food Marketing: The Case
of Rice in Indonesia. Food Policy, Vol. 18 pp. 428-438.

AFBE Journal Academic Papers
436
Forrester, J.W. 1961. Industrial Dynamics. Cambridge, M.A. MIT Press
Nainggolan, Kaman. 2000. Constraints and Consequences of Trade Liberalization on
Agriculture in Indonesia. Workshop on the Effects of Trade Liberalization on
Indonesia Agriculture, Bogor, June, 2000.
Nicholson, W. 2005. Microeconomics Theory, Basic Principles and Extensions,. 9th
ediition. International Students Edition. Thomson South Western. Canada.
Nurmalina, Rita. 2008. Indonesia Rice Dynamic Model, The Effect and Policy
Strategy. Dissertation. Bogor Agricultural University. Indonesia.
Pearson, Scott, ErickMonke and Robert J. Baulch, 1997. The Cost of Rice Price
Stabilization Under Self-sufficiency. In Silitonga et al (eds). (30 Years the
Role of BULOG in Food Security, Bulog, Jakarta.
Sterman, J.D. 2000. Business Dynamics: Systems Thinking and Modeling for a
Complex World, Boston; Irwin McGraw Hill.
Sudaryanto, Tahlim and Adreng Purwoto, 1994. Trends and Determinants of Food
Crops Price Protection. Indonesian Food Journal, Vol. V. No 10, 1994: pp.
71-83.
Tabor, Steven, M. Husen Sawit and H.S. Dillon, 2002. Indonesia Rice Policyand the
Choice of Trade Regime for Rice in Indonesia. Paper presented at the Seminar
on Rice Policy and Trade Regime at LPEM-UI, Jakarta, March, 2002.
Timmer, Peter.1997. Does Bulog Stabilize Rice Price in Indonesia? Should it Try?. In
Silitonga et al (eds). 30 Years the Role of BULOG in Food Security. Bulog,
Jakarta.
Timmer, Peter. The Meaning of Food Self-sufficiency. Indonesia Food Journal, 1994