Individual Differences in the Neurophysiology of Creativity
223
e University of Maine DigitalCommons@UMaine Electronic eses and Dissertations Fogler Library 8-2002 Individual Differences in the Neurophysiology of Creativity Jonna Kwiatkowski Follow this and additional works at: hp://digitalcommons.library.umaine.edu/etd Part of the Psychology Commons is Open-Access Dissertation is brought to you for free and open access by DigitalCommons@UMaine. It has been accepted for inclusion in Electronic eses and Dissertations by an authorized administrator of DigitalCommons@UMaine. Recommended Citation Kwiatkowski, Jonna, "Individual Differences in the Neurophysiology of Creativity" (2002). Electronic eses and Dissertations. 59. hp://digitalcommons.library.umaine.edu/etd/59
Transcript of Individual Differences in the Neurophysiology of Creativity

The University of MaineDigitalCommons@UMaine
Electronic Theses and Dissertations Fogler Library
8-2002
Individual Differences in the Neurophysiology ofCreativityJonna Kwiatkowski
Follow this and additional works at: http://digitalcommons.library.umaine.edu/etd
Part of the Psychology Commons
This Open-Access Dissertation is brought to you for free and open access by DigitalCommons@UMaine. It has been accepted for inclusion inElectronic Theses and Dissertations by an authorized administrator of DigitalCommons@UMaine.
Recommended CitationKwiatkowski, Jonna, "Individual Differences in the Neurophysiology of Creativity" (2002). Electronic Theses and Dissertations. 59.http://digitalcommons.library.umaine.edu/etd/59
INDIVIDUAL DIFFERENCES IN THE NEUROPHYSIOLOGY OF CREATIVITY
BY
Jonna Kwiatkowski
B.A. Saint Mary's College, 1994
A THESIS
Submitted in Partial Fulfillment of the
Requirements for the Degree of
Doctor of Philosophy
(in Psychology)
The Graduate School
The University of Maine
August, 2002
Advisory Committee:
Colin Martindale, Professor of Psychology, Advisor
Jonathan Borkum, Adjunct Professor of Psychology
Michele Alexander, Assistant Profeqsor of Psychology
Marie Hayes, Associate Professor of Psychology
Alan M. Rosenwasser, Professor of Psychology
Copyright 2002 Jonna Kwiatkowslu
All Rights Reserved

INDIVIDUAL DIFFERENCES IN THE NEUROPHYSIOLOGY OF CREATIVITY
By Jonna Kwiatkowski
Thesis Advisor: Dr. Colin Martindale
An Abstract of the Thesis Presented in Partial Fulfillment of the Requirements for the
Degree of Doctor of Philosophy (in Psychology) August, 2002
Theories dating back to the 1800's have suggested neurophysiological
specialization as a key factor in creative production. A common theme in these theories
is that greater flexibility in neurophysiological response to stimuli allows more creative
individuals to customize their response to the task at hand (Martindale, 1999). In
particular, more creative individuals are able to enter a more relaxed, free associative
cognitive state when it is necessary for them to produce a creative solution (e.g., Kris,
1952; Mednick, 1962; Mendelsohn, 1976).
There is empirical support for individual differences in neurophysiological state
between more and less creative participants performing creative tasks (e.g., Martindale,
1999). This research showed that more creative participants had more variable patterns
of activation in response to creative tasks, as well as greater activation in the right
hemisphere during creative tasks. This previous research was used as a model for this
investigation, as well as a guide in finding new methods to investigate neurophysiological
differences between more and less creative individuals.
Three experiments were conducted: (a) an investigation of differences in spectral
density and cross-spectral density for six frequency bands (delta, theta, low alpha, high
alpha, low beta, and high beta) during the imagination and writing of a creative story; (b)
an investigation of NlOO and P300 responses to stimuli presented using the classic
oddball paradigm; (c) an investigation of NLFOO responses to congruous and incongruous
sentence endings. The first experiment expanded upon previous work by increasing the
number of recording sites and by investigating a wider range of frequency bands than
previous research. The second and third experiment introduced new methods to
creativity research, with a focus on the initial response to novel or unexpected stimuli.
Results across all three experiments were that more creative participants showed
greater variability in recorded response, and that more creative participants showed
generally greater activation in the right hemisphere. This is consistent with many
theories of creativity, as well as the hypotheses of this investigation.
ACKNOWLEDGMENTS
If I ever act as advisor on a graduate student thesis, I think that I will make her
write acknowledgements as part of her thesis proposal. Realistically, the people that I
need to thank played an even bigger role than my EEG machine in getting this thing
finished. I think it would have been an even better tribute to their place in my life if I had
been able to acknowledge them at the beginning of this process as people who I know I
can always count on, and who know they can always count on me.
It seems only fitting to start with Colin Martindale, without whom my life course
would be very different. Thank you for opening up a world where neither science nor art
need be ignored. I will always be grateful to you for your ideas and guidance.
It seems just as fitting to start with Oshin Vartanian, my compatriot through the
thick and the thin of graduate school. Thank you for your collaboration and friendship. I
know I wouldn't be writing this right now if it weren't for you.
To Colin and Oshin, I look forward to many more years of collaboration. I will
always remain Your Partner In Crime.
Thanks to Lisle Kingery, who so graciously took on the completion of my data
collection. I will never forget your kindness, although I'm still unsure how I could
possibly repay it.
For their guidance and smiles through short deadlines, thank you to my amazing
committee members: Alan Rosenwasser, Marie Hayes, Michele Alexander, and Jonathan
Borkum. Jonathan, I must give additional thanks to you for your statistics help, which
saved me time and again, giving me the confidence and energy to keep going.
I would also like to thank Joel Gold, my unofficial but crucial sixth committee
member, who supported me in so many ways through graduate school. From your
legendary statistics course, to your assistance with all kinds of problems, to your kind
words and understanding, you have been a strong and positive influence on my graduate
school experience. I cannot thank you enough.
Thanks to all of the University of Maine undergraduates who helped with my
research, providing both the needed hands and challenging ideas to keep the research
moving: Rachelle Smith, Jordan Pike, Amy Faller, Matt Qualey, Casey Brown, and Jim
Lolar.
I also must acknowledge Keithley Instruments, who donated the Analog to Digital
Conversion equipment that I used to collect my data. In particular, Tim Kniss was
crucial to this project's success. His kind patience through all of my AID questions was
at times amazing, and always appreciated.
Time and circumstance have added a wonderhl group to my list of thanks: all of
my fi-iends and colleagues at the PACE Center. Thank you all for supporting and
encouraging me through this long(er than promised) process. In particular, thanks to Bob
Sternberg, Elena Grigorenko, and Linda Jarvin for your time, advice, and moral support;
and thanks to all of the gifted team members for putting up with my sometimes less than
timely feedback.
Continued love and thanks to my family, who have supported me through many a
crazy scheme (including this one). Thanks to Mary Kwiatkowski, my mother, Frank
Kwiatkowslu, my father, Andrew Kwiatkowski, Leslie Rose, Bob Rose, and Allie Rose.
In many big, small, and small-but-big ways, these last people, have been crucial
in this and so many other of my endeavors:; Tina Newman for her calm understanding;
Jean Pretz for putting up with the messiest dining room table ever; Matthew Jukes for his
careful support; Silvina Horovitz for helping me in her hour of stress; The Chicago Outlet
(Laura Berger, John Fitzpatrick, and Alexander Childers); Julie Williamson for tactful
kicks in the tail; Adam Naples for keeping it real; Virginia Cylke for her smiles and
patience; and last but certainly not least, The Tea Ladies (April O'Grady, Beth Kubik,
Rachel Grover, and Michelle Maudlin) who understand better than anyone else.
TABLE OF CONTENTS
... ACKNOWLEDGMENTS ............................................................................................... ill
LIST OF TABLES ........................................................................................................... xi
LIST OF FIGURES ....................................................................................................... wi
Introduction ....................................................................................................................... 1
Section one: Overview of the Theoretical Relationshps Between Creativity and
Neurophysiology ............................................................................................................. 1
Degeneration Theories ................................................................................................ 1
The Creativity Research Boom ................................................................................... 4
Kris .......................................................................................................................... 5
Mednick .................................................................................................................. 6
Mendelsohn ............................................................................................................. 8
. . Current Creativity Research ........................................................................................ 9
................................................................................................................... Eysenck 9
Martindale ............................................................................................................. 10
................. Section Two: Overview of Neurophysiological Measurement Techniques 10
History of Neurophysiological Measurement ........................................................... 10
Overview of Frequency-based Waveforms ............................................................. 12
Identification and Analysis of Frequency-based Waveforms ................................... 12
Coherence in Frequency-based Waveforms ............................................................. 14
Overview of Event-related Potential Waveforms ................................................... 15
vii
Identification of Event-related Potential Waveforms ........................................ 16
Section Three: Neurophysiological Measures of Creativity ........................................ 19
.................................. Objective of Neurophysiological Measurement of Creativity 19
History of Neurophysiological Measurement of Creativity ...................................... 20
......... Hemispheric Differences in Neurophysiological Investigations of Creativity 24
............. Frequency Differences in Neurophysiological Investigations of Creativity 26
Frequency and Coherence Differences in Neurophysiological Investigations of
. . Creat~v~ty .................................................................................................................. 28
Event-related Potential Differences in Neurophysiological Investigations of
. . Creativ~ty .................................................................................................................. 30
Purpose ............................................................................................................................. 33
Common Method ............................................................................................................ 34
. . Participants ................................................................................................................... 34
Paper and Pencil Measures ........................................................................................... 34
Alternate Uses Test ................................................................................................... 35
Remote Associates Test ............................................................................................ 36
Creative Personality Scale ........................................................................................ 37
. . Word Assoc~ation Test ............................................................................................. 37
. . Story Original~ty Scores ............................................................................................ 39
... Vlll
............................................................................................ Intellectual Functioning 40
...................................................................................................................... Apparatus 41
Common Results ............................................................................................................. 43
.................................................................................................................... Participants 43
Paper and Pencil Measures ........................................................................................... 44
Creativity Tests ......................................................................................................... 44
Intellectual Functioning ............................................................................................ 44
Composite Creativity Score .......................................................................................... 45
Experiment One .............................................................................................................. 47
.................................................................................................................... Hypotheses 47
Unique Methods .......................................................................................................... 48
....................................................................................................................... Stimuli 48
............................................................................................................ Data Cleaning 49
............................................................................................................ Data Analysis 49
Spectral Analysis .................................................................................................. 49
Cross-spectral Analysis ......................................................................................... 50
Results ........................................................................................................................... 51
...................................................................................................... Spectral Analysis 51
Cross-spectral Analysis ............................................................................................ 69
..................................................................................................................... Discussion 75

Experiment Two .............................................................................................................. 77
Hypotheses .................................................................................................................... 77
Unique Methods ............................................................................................................ 78
....................................................................................................................... Stimuli 78
Data Collection ......................................................................................................... 79
Data Cleaning .......................................................................................................... 80
............................................................................................................ Data Analysis 80
Results ......................................................................................................................... 82
N100 ......................................................................................................................... 82
..................................................................................................................... Discussion 86
Experiment Three ........................................................................................................... 88
.................................................................................................................... Hypotheses 88
Unique Methods ............................................................................................................ 88
....................................................................................................................... Stimuli 88
Data Collection ......................................................................................................... 89
Data Cleaning ........................................................................................................... 89
Data Analysis ............................................................................................................ 90
........................................................................................................................... Results 91
Discussion ..................................................................................................................... 96
General Discussion .......................................................................................................... 98
X
REFERENCES ................................................................................................................ 99
Appendix A . Full Correlation Matrix ....................................................................... 108
........................................................ Appendix B . Experiment One Spectral Results 111
Appendix C . Experiment One Cross-spectral Results ........................................ 133
Appendix D . Experiment Two .................................................................................... 144
Appendix E . Experiment Three ................................................................................. 166
Appendix F . Paper and Pencil Test Instructions ..................................................... 177
........................... Appendix G . Experimenter Scripts for Neurophysiological Test 193
BIOGRAPHY OF THE AUTHOR ............................................................................. 204
LIST OF TABLES
Table 1. Correlations between Creativity Measures and Intellectual Functioning
Measure ................................................................................................................. 45
Table 2. Spectral Imagine Story and Write Story Multivariate Repeated
Measures Analysis ................................................................................................ 54
Table 3. Imagine Story and Write Story Mean Spectral Densities for Activity x
Frequency x Hemisphere x Originality Group ...................................................... 58
Table 4. Imagine Story and Write Story Mean Spectral Densities for Activity x
Frequency.. ............................................................................................................ 6 1
Table 5. Imagine Story and Write Story Mean Spectral Densities for Activity x
Electrode Location ................................................................................................ 62
Table 6. Imagine Story and Write Story Mean Spectral Densities for Activity x
Frequency x Hemisphere x Electrode Location .................................................... 63
Table 7. Imagine Story, Write Story, and Math Problem Mean Spectral Densities
for Activity x Hemisphere x Originality Group .................................................... 66
Table 8. Spectral Imagine Story, Write Story, and Solve Math Problems
Multivariate Repeated Measures Analysis ............................................................ 67
Table 9. Cross-spectral Imagine Story and Write Story Univariate Repeated
Measures Analysis .............................................................................................. 70
Table 10. Imagine Story and Write Story Mean Cross-spectral Densities for
. . Activity x Frequency.. ........................................................................................... 7 1
xii
Table 1 1. Imagine Story and Write Story Mean Cross-spectral Densities for
Activity x Pair ....................................................................................................... 73
Table 12. Cross-spectral Imagine Story, Write Story, and Math Problem
Univariate Repeated Measures Analysis .............................................................. 74
............................................ Table 13. Nl 00 Multivariate Repeated Measures Analysis.. 83
Table 14. P300 Multivariate Repeated Measures Analysis .............................................. 85
Table 15. N400 Multivariate Repeated Measures Analysis .............................................. 95
Table B. 1. Spectral Analysis Multivariate Repeated Measures Analysis by
Adjective Checklist ............................................................................................. 11 1
Table B.2. Spectral Analysis Multivariate Repeated Measures Analysis by
...................................................................................... Remote Associates Test 1 13
Table B.3. Spectral Analysis Multivariate Repeated Measures Analysis by Word
. . .................................................................................................. Association Test 1 15
Table B.4. Spectral Analysis Multivariate Repeated Measures Analysis by
............................................................................................. Alternate Uses Test 1 17
Table B.5. Spectral Analysis Multivariate Repeated Measures Analysis by
. . ......................................................................... Shipley Institute of Living Scale 1 19
........... Table B.6. Spectral Analysis Multivariate Repeated Measures Analysis by Sex 121
Table B.7. Spectral Analysis Multivariate Repeated Measures Analysis by
................................................................................ Composite Creativity Score 123
Table B.8. Spectral Analysis Multivariate Repeated Measures Analysis by
Composite Creativity Score - Male Data Only .................................................. 125
xiii
Table B.9. Spectral Analyses Multivariate Repeated Measures Analysis by
Originality Rating - Male Data Only .................................................................. 127
Table B. 10. Spectral Analysis Multivariate Repeated Measures Analysis by
Composite Creativity Score - Female Data Only ............................................... 129
Table B. 1 1. Spectral Analysis Multivariate Repeated Measures Analysis by
Originality Rating - Female Data Only .............................................................. 13 1
Table C. 1. Cross-spectral Univariate Repeated Measures Analysis by Adjective
Checklist ............................................................................................................. 133
Table C.2. Cross-spectral Univariate Repeated Measures Analysis by Remote
Associates Test .................................................................................................... 134
Table C.3. Cross-spectral Univariate Repeated Measures Analysis by Word
Association Test .................................................................................................. 135
Table C.4. Cross-spectral Univariate Repeated Measures Analysis by Alternate
Uses Test ............................................................................................................. 136
Table C.5. Cross-spectral Univariate Repeated Measures Analysis by Shipley
Institute of Living Scale ...................................................................................... 137
Table C.6. Cross-spectral Univariate Repeated Measures Analysis by Sex ................... 138
Table C.7. Cross-spectral Univariate Repeated Measures Analysis Composite
Creativity Score .................................................................................................. 139
Table C.8. Cross-spectral Univariate Repeated Measures Analysis by Creativity
Composite Score - Male Date Only ................................................................... 140
Table C.9. Cross-spectral Univariate Repeated Measures Analysis by Originality
Rating - Male Data Only .................................................................................... 141
xiv
Table C. 10. Cross-spectral Univariate Repeated Measures Analysis by Creativity
................................................................ Composite Score - Female Date Only 142
Table C. 1 1. Cross-spectral Univariate Repeated Measures Analysis by
.............................................................. Originality Rating - Female Data Only 143
Table D.1. NlOO and P300 Multivariate Repeated Measures Analysis by
............................................................................................. Adjective Checklist 144
Table D.2. NlOO and P300 Multivariate Repeated Measures Analysis by Remote
Associates Test .................................................................................................... 146
Table D.3. NlOO and P300 Multivariate Repeated Measures Analysis by Word
Association Test .................................................................................................. 148
Table D.4. NlOO and P300 Multivariate Repeated Measures Analysis by
............................................................................................. Alternate Uses Test 150
Table D.5. NlOO and P300 Multivariate Repeated Measures Analysis by
. . ........................................................................ Shipley Institute of Living Scale. 152
Table D.6. Nl 00 and P300 Multivariate Repeated Measures Analysis by Sex .............. 154
Table D.7. NlOO and P300 Multivariate Repeated Measures Analysis by
............................................................................................... Originality Rating 156
Table D.8. NlOO and P300 Multivariate Repeated Measures Analysis by
Originality Rating - Male Data Only .................................................................. 158
Table D.9. NlOO and P300 Multivariate Repeated Measures Analysis by
.................................................. Composite Creativity Score - Male Data Only 160
Table D. 10. N100 and P300 Multivariate Repeated Measures Analysis by
.............................................................. Originality Rating - Female Data Only 162
Table D. 1 1. NlOO and P300 Multivariate Repeated Measures Analysis by
............................................... Composite Creativity Score - Female Data Only 164
Table E. 1. N400 Multivariate Repeated Measures Analysis by Adjective
............................................................................................................ Checklist .I66
Table E.2. N400 Multivariate Repeated Measures Analysis by Remote
.................................................................................................... Associates Test 167
Table E.3. N400 Multivariate Repeated Measures Analysis by Word
. . .................................................................................................. Association Test 168
Table E.4. N400 Multivariate Repeated Measures Analysis by Alternate
............................................................................................................ Uses Test .I69
Table E.5. N400 Multivariate Repeated Measures Analysis by Shipley Institute
.................................................................................................. of Living Scale.. 170
Table E.6. N400 Multivariate Repeated Measures Analysis by Sex .............................. 171
..... Table E.7. N400 Multivariate Repeated Measures Analysis by Originality Rating.. 172
Table E.8. N400 Multivariate Repeated Measures Analysis by Composite
..................................................................... Creativity Score - Male Data Only 173
Table E.9. N400 Multivariate Repeated Measures Analysis by Originality
.................................................................................... Rating - Male Data Only 174
Table E. 10. N400 Multivariate Repeated Measures Analysis by Composite
................................................................. Creativity Score - Female Data Only 175
Table E . l l . N400 Multivariate Repeated Measures Analysis by Originality
................................................................................. Rating - Female Data Only 176
xvi
LIST OF FIGURES
Figure 1. Spectral density for Activity x Hemisphere x Originality Group
differences. . . . . . . . . . . . . . . . . . . . . . . . . . . . . . . . . . . . . . . . . . . . . . . . . . . . . . . . . . . . . . . . . . . . . . . . . . . . . . . . . . . . . . . . . . . . . . . . . . . . . . . . . . . . 53
Figure 2. Imagine Story and Write Story Spectral Density for Activity x
Hemisphere x Frequency Band x Originality Group differences. ........................ 57
Figure 3. Write Story and Imagine Story Spectral Density for Activity x
Frequency Band differences. ................................................................................ 60
Figure 4. Imagine Story and Write Story Spectral density for Activity x Electrode
Location differences .............................................................................................. 61
Figure 5. Imagine Story and Write Story Spectral density for Activity x
Frequency x Hemisphere x Electrode Location differences. ................................ 65
Figure 6. Imagine Story and Write Story Cross-spectral density for Activity x
Frequency differences. ....................... ................................................................... 72
Figure 7. Time course for NlOO and P300 ERP experiments. ........................................ 80
Figure 8. P300 Hemisphere x Creativity group differences. ........................................ 84
Figure 9. Time course for N400 ERP experiments. .......................................................... 89
Figure 10. N400 response for Electrode Location x Creativity group differences. . .... . . . .92
Figure 11. N400 response for Electrode Location x Hemisphere x Creativity
group differences. ................................................................................................. 94

Introduction
In lapidary, a careful study of all the facets of a stone will lead to the moment
when tapped in just the right place, the casing falls away to reveal a perfect gem.
Creativity, like the lapidarian's stone, is multifaceted with the promise of a beautiful
internal structure. Theoreticians of creativity know, however, that this promise is far
fiom realized. This dissertation is meant to elucidate further the underlying mechanisms
of creativity through the use of neurophysiological techniques. The introduction is
organized (a) to introduce the reader to theories of creativity that include ideas about the
underlying neurophysiological mechanisms, (b) to review neurophysiological techniques
likely to enhance investigations of creativity, and (c) to review research that has
combined theories of creativity with neurophysiological measurement techniques. The
introduction is followed by an explanation of a series of new neurophysiological
experiments that have been used to explore creativity.
Section one: Overview of the Theoretical Relationships Between Creativity and
Neurophysiologv
Degeneration Theories
The earliest modem theories postulating a biological basis for creativity date back
to the Romantic theories of the late Nineteenth century. In particular, in accord with the
intellectual climate of the time, those theories postulated an unseemly association
between creative inspiration and insanity: "It was conceived that geniuses evolved fiom
the same maladaptive gene pool as the lowliest elements of society-+riminals and
lunatics" (Prentky, 1989, p. 245). Although philosophers such as Aristotle had stressed
the relationship between creativity and psychopathology since antiquity (Prentky, 1989),

the modern resurgence of the idea is attributable to Morel's introduction of the
degeneration hypothesis in 1857. Degeneration can be best defined as the antithesis of
development, where the "Development of the organism is seen as involving elaboration
and integration while degeneration is seen as leading to disintegration and simplification
which in turn lead to loss of adaptive ability" (Martindale, 197 1, p. 178). Morel argued
that degeneration (a) entailed anatomical as well as mental abnormalities, (b) was brought
about by environmental factors, and (c) was transmitted cumulatively in a Lamarckian
manner across generations. These classifications became part of the fiarnework for all
degeneration theorists.
Subsequent elaborations by Moureau de Tours (1 859), Lombroso (1 864), Nordau
(1 895), and Talbot (1 898) argued that insanity and genius were brought about as the
result of a degenerate genetic disposition. Moreau de Tours suggested that the common
link between insanity and genius was an overexcitation of the brain. Lombroso built on
this idea, proposing that an abnormal oversensitivity due to degeneration was responsible
for genius. In the first systematic investigation of degeneration and genius, Lombroso
(1 864,1898) concluded that "Between the physiology of the man of genius, therefore,
and the pathology of the insane, there are many points of coincidence; there is even actual
continuity" (p. 359). Nordau (1895) hypothesized that degeneration is a consequence of
the weakening of the higher brain functions, thereby allowing a relative dominance of the
lower brain functions to emerge. He distinguished between two types of degeneration,
referring to 'Mysticism' as the inability of higher cognitive levels to exert control, and
'Ego-mania' as an abnormal reduction of sensory thresholds. Talbot (1 898) compared
degeneration to what we would today call a disidubition syndrome, where excessive cell
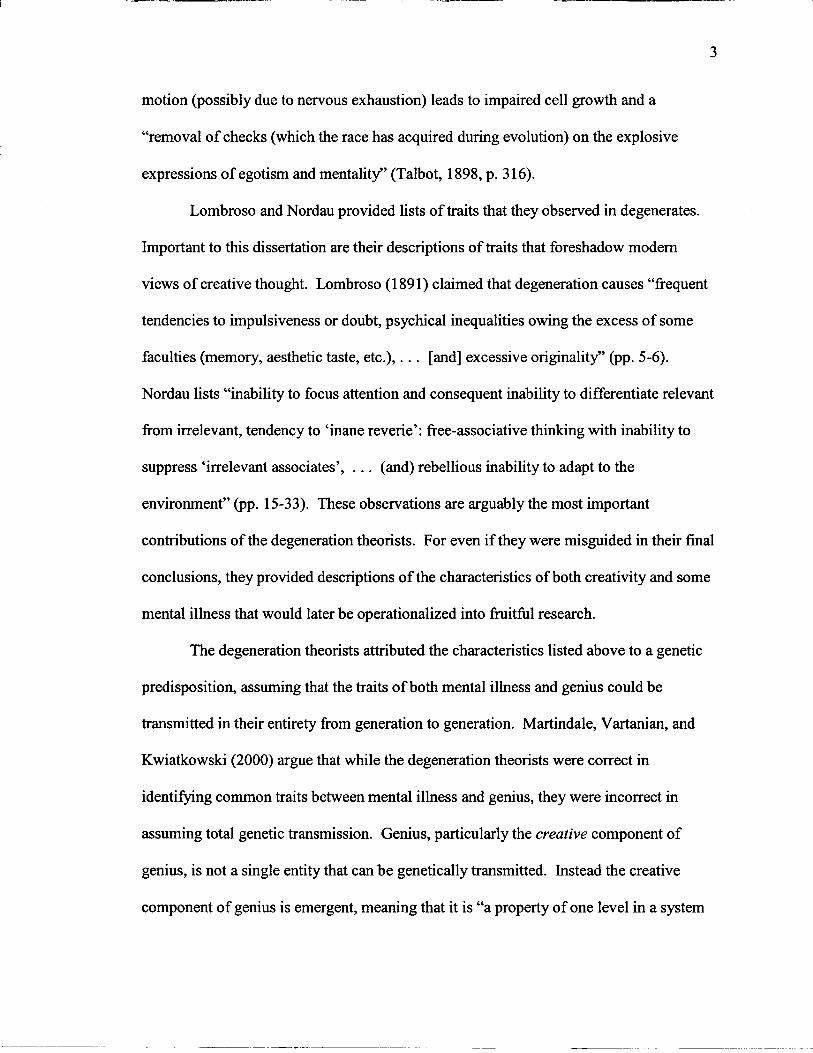
motion (possibly due to nervous exhaustion) leads to impaired cell growth and a
"removal of checks (which the race has acquired during evolution) on the explosive
expressions of egotism and mentality" (Talbot, 1898, p. 3 16).
Lombroso and Nordau provided lists of traits that they observed in degenerates.
Important to this dissertation are their descriptions of traits that foreshadow modem
views of creative thought. Lombroso (1 891) claimed that degeneration causes "frequent
tendencies to impulsiveness or doubt, psychical inequalities owing the excess of some
faculties (memory, aesthetic taste, etc.), . . . [and] excessive originality" (pp. 5-6).
Nordau lists "inability to focus attention and consequent inability to differentiate relevant
from irrelevant, tendency to 'inane reverie': free-associative thinking with inability to
suppress 'irrelevant associates', . . . (and) rebellious inability to adapt to the
environment" (pp. 15-33). These observations are arguably the most important
contributions of the degeneration theorists. For even if they were misguided in their final
conclusions, they provided descriptions of the characteristics of both creativity and some
mental illness that would later be operationalized into fruitful research.
The degeneration theorists attributed the characteristics listed above to a genetic
predisposition, assuming that the traits of both mental illness and genius could be
transmitted in their entirety from generation to generation. Martindale, Vartanian, and
Kwiatkowski (2000) argue that while the degeneration theorists were correct in
identifjmg common traits between mental illness and genius, they were incorrect in
assuming total genetic transmission. Genius, particularly the creative component of
genius, is not a single entity that can be genetically transmitted. Instead the creative
component of genius is emergent, meaning that it is "a property of one level in a system
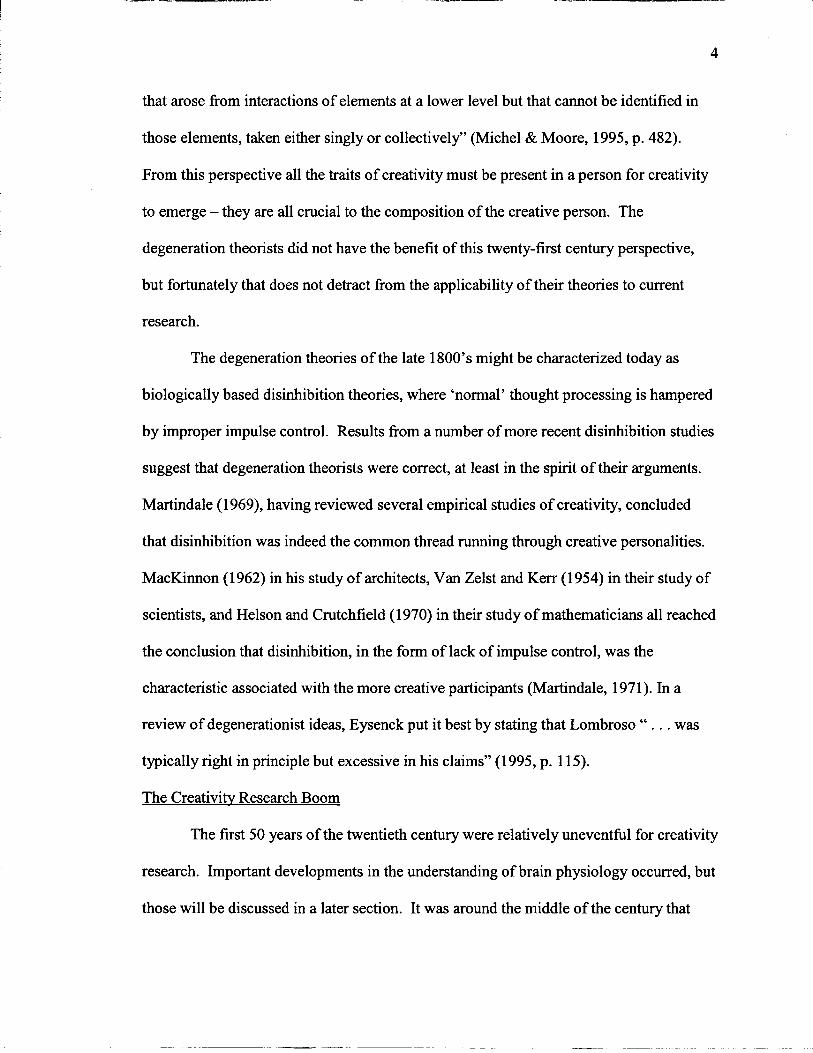
that arose from interactions of elements at a lower level but that cannot be identified in
those elements, taken either singly or collectively" (Michel & Moore, 1995, p. 482).
From this perspective all the traits of creativity must be present in a person for creativity
to emerge - they are all crucial to the composition of the creative person. The
degeneration theorists did not have the benefit of this twenty-first century perspective,
but fortunately that does not detract from the applicability of their theories to current
research.
The degeneration theories of the late 1800's might be characterized today as
biologically based disinhibition theories, where 'normal' thought processing is hampered
by improper impulse control. Results fi-om a number of more recent disinhibition studies
suggest that degeneration theorists were correct, at least in the spirit of their arguments.
Martindale (1969), having reviewed several empirical studies of creativity, concluded
that disinhibition was indeed the common thread running through creative personalities.
MacKinnon (1962) in his study of architects, Van Zelst and Kerr (1954) in their study of
scientists, and Helson and Crutchfield (1970) in their study of mathematicians all reached
the conclusion that disinhibition, in the form of lack of impulse control, was the
characteristic associated with the more creative participants (Martindale, 1971). In a
review of degenerationist ideas, Eysenck put it best by stating that Lombroso " . . . was
typically right in principle but excessive in his claims" (1 995, p. 1 15).
The Creativity Research Boom
The first 50 years of the twentieth century were relatively uneventful for creativity
research. Important developments in the understanding of brain physiology occurred, but
those will be discussed in a later section. It was around the middle of the century that

resurgence in interest in creativity and genius occurred. This interest is often attributed to
J.P. Guilford's 1950 presidential address to the American Psychological Association
where he challenged all psychologists to pursue research of creativity.
&s
In 1952 Ernst Kris introduced his theory of creativity. He used a psychoanalytic
model to explain the thinking process of the creative individual. The two main elements
to hls model were primary and secondary process thought, which represented the two
ends of a continuum. Primary process thought, at its most extreme, is free-associative
and dream-like in content. Secondary process thought, at its most extreme, is the logical,
reality-based thought commonly associated with conscious, purposeful thought. Kris
proposed that everyone is capable of traversing the primary-secondary process
continuum, but that creative people are more likely to do it more often. Uncreative
people (a) are more likely to have a greatly truncated range on the primary-secondary
process continuum where they remain for most of their conscious lives, (b) are less able
to change their mode of thought to respond to task demands, and (c) are most likely to
move into primary process mode when considering personally relevant thoughts (e.g.,
daydreaming). In contrast, creative people (a) are more likely to have ready access to the
full range of the primary-secondary thought process continuum, (b) are more able to
change their focus in the face of task demands, and (c) are just as likely to move into
primary process mode to solve creative problems as to consider personally relevant
thoughts. For example, when given a task demanding creative thought, the more creative
person would respond by shifting to a more primary process thinking state, which affords
more associative abilities. This shift in focus would allow the creative person to make

more unusual associations between ideas. Once the creative solution has been found, the
creative person would shift back to a more secondary process state, allowing the person
to formalize the idea. The less creative person, Kris theorized, would attempt to solve all
problems fiom a more secondary process state of consciousness. This approach to
problem solving would lead to a less unique solution or no solution.
Mednick
There are two other historically significant theories of creativity that are similar to
Kris' (Martindale, 1999): Mednick (1 962) and Mendelsohn (1 976). Mednick (1 962)
proposed a theory of creativity based upon associative hierarchies. An associative
hierarchy is a model for how individuals store associations between concepts. It is
helpful to think of an associative hierarchy of words to understand this theory. In this
explanation, the word 'fish' and words associated with fish will be used as the example
associative hierarchy.
Medmck's theory proposes that a given person's associative hierarchy might be
steep or flat. A steep associative hierarchy is one that has few and relatively rigid
associations between concepts, reducing the likelihood that new or unusual associations
will arise in connection with a given concept. For example, a steep hierarchy for the
word 'fish' might only include very common, predictable associations like bowl, water,
and gold. A flatter associative hierarchy is one that has a greater number and more
flexible associations between concepts, which allows individuals to make unusual and
more associations between concepts. For example, a flat hierarchy for the word 'fish'
might include bowl, water, gold, flying, Sweden, caviar, and the Grateful Dead.
According to Mednick's theory, for people to be creative it is necessary that they have an
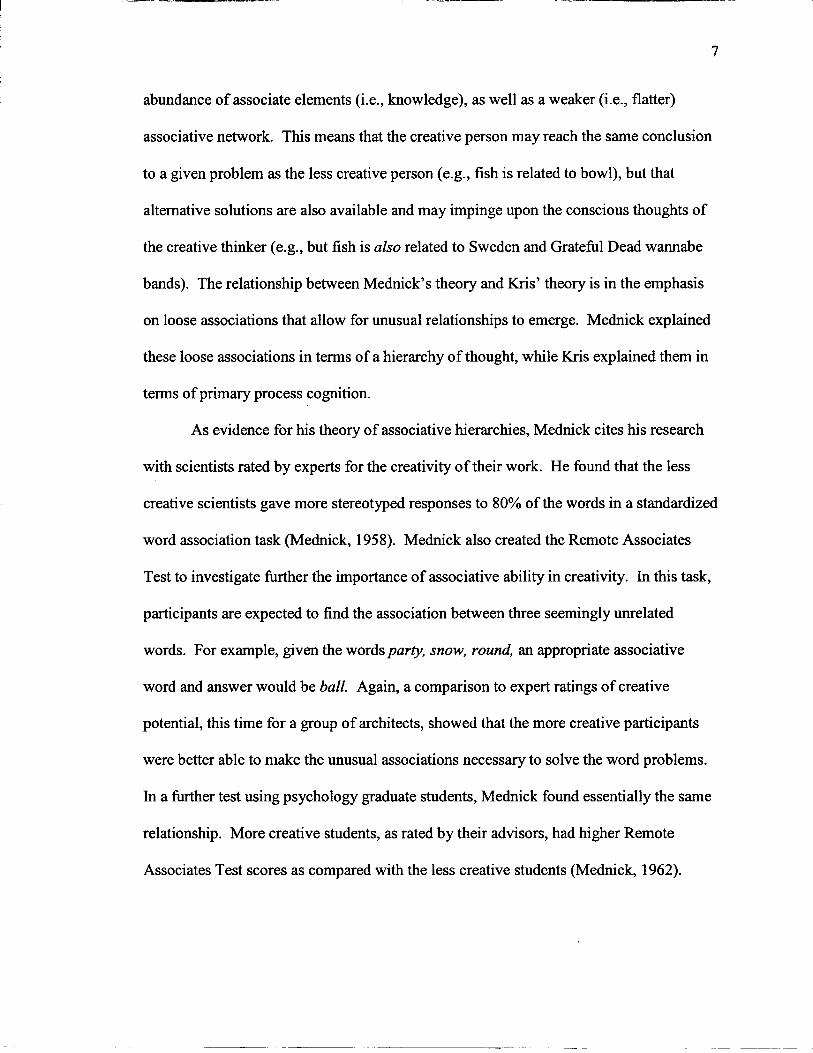
abundance of associate elements (i.e., knowledge), as well as a weaker (i.e., flatter)
associative network. This means that the creative person may reach the same conclusion
to a given problem as the less creative person (e.g., fish is related to bowl), but that
alternative solutions are also available and may impinge upon the conscious thoughts of
the creative thinker (e.g., but fish is also related to Sweden and Grateful Dead wannabe
bands). The relationship between Mednick's theory and Kris' theory is in the emphasis
on loose associations that allow for unusual relationships to emerge. Mednick explained
these loose associations in terms of a hierarchy of thought, while Kris explained them in
terms of primary process cognition.
As evidence for his theory of associative hierarchies, Mednick cites his research
with scientists rated by experts for the creativity of their work. He found that the less
creative scientists gave more stereotyped responses to 80% of the words in a standardized
word association task (Mednick, 1958). Mednick also created the Remote Associates
Test to investigate further the importance of associative ability in creativity. In this task,
participants are expected to find the association between three seemingly unrelated
words. For example, given the words party, snow, round, an appropriate associative
word and answer would be ball. Again, a comparison to expert ratings of creative
potential, this time for a group of architects, showed that the more creative participants
were better able to make the unusual associations necessary to solve the word problems.
In a further test using psychology graduate students, Mednick found essentially the same
relationship. More creative students, as rated by their advisors, had higher Remote
Associates Test scores as compared with the less creative students (Mednick, 1962).
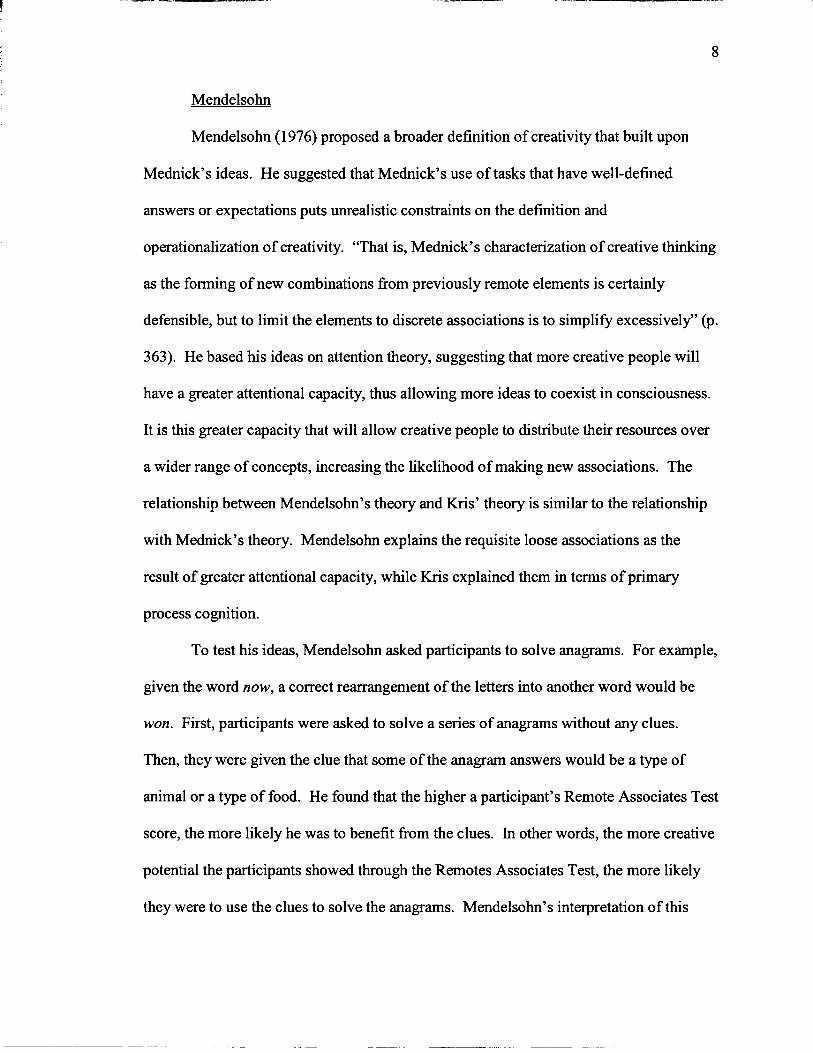
Mendelsohn
Mendelsohn (1 976) proposed a broader definition of creativity that built upon
Medmck's ideas. He suggested that Mednick's use of tasks that have well-defined
answers or expectations puts unrealistic constraints on the definition and
operationalization of creativity. "That is, Mednick's characterization of creative thinking
as the forming of new combinations from previously remote elements is certainly
defensible, but to limit the elements to discrete associations is to simplify excessively" (p.
363). He based his ideas on attention theory, suggesting that more creative people will
have a greater attentional capacity, thus allowing more ideas to coexist in consciousness.
It is this greater capacity that will allow creative people to distribute their resources over
a wider range of concepts, increasing the likelihood of making new associations. The
relationship between Mendelsohn's theory and Kris' theory is similar to the relationship
with Mednick's theory. Mendelsohn explains the requisite loose associations as the
result of greater attentional capacity, while Kris explained them in terms of primary
process cognition.
To test his ideas, Mendelsohn asked participants to solve anagrams. For example,
given the word now, a correct rearrangement of the letters into another word would be
won. First, participants were asked to solve a series of anagrams without any clues.
Then, they were given the clue that some of the anagram answers would be a type of
animal or a type of food. He found that the higher a participant's Remote Associates Test
score, the more likely he was to benefit from the clues. In other words, the more creative
potential the participants showed through the Remotes Associates Test, the more likely
they were to use the clues to solve the anagrams. Mendelsohn's interpretation of this
result was that the clues were retained more effectively in the high Remotes Associates
Test scorers. Interestingly, the low Remotes Associates Test score group actually did
slightly, although not statistically, better without the clue. Other research using
shadowing has supported the idea that less creative people have a more narrowly focused
attentional capacity (e.g., Dykes & McGhie, 1976).
Current Creativity Research
Eysenck
Two more recent theories have taken the ideas of the above theorists and applied
them to a cognitive disinhibition theory of creativity: Eysenck (1 995) and Martindale
(1 995, 1999). Eysenck (1 995) explains creativity as the result of overinclusive thought,
where the creative person's attentional filtering mechanisms are not as stringent as those
generally found in the population. "This overinclusiveness may be due to a failure of
inhibition, characteristic of psychotics, high P-scorers, creative people, and geniuses" (p.
248). Psychoticism (P) is the personality factor on Eysenck's personality questionnaire
that is related to psychopathologies such as schizophrenia and manic depression.
Eysenck argues that creative people and psychotics are similar in their expression of the
Psychoticism personality factor, but that creative people are differentiated from
psychotics by their higher intelligence and their ability to evaluate and reject
inappropriate responses. Therefore according to Eysenck's theory, creative people and
psychotics are similar in that they are overinclusive (disinhibited) in their general thought
processes, but they differ in that creative people can reject inappropriate responses that
result from their overinclusive thought processing, whereas psychotics cannot.
Martindale
Martindale (1 999) agrees in principle with Eysenck's theory. He gives
disinhibition a central role in explaining the creative thought process. However,
Martindale argues that while creative people are able to use cognitive disinhibition to
think creatively (i.e., achieve primary process thought, work with a flatter associative
gradient, or have a looser attentional focus), they are not bound to that mode of thought.
The creative person, unlike the psychotic, is able to shift into a cognitive disinhibition
mode when a task warrants looser associations (i.e., creative thought). The creative
person is not continuously in a state of cognitive disinhibition, unable to filter responses,
as Eysenck suggests. Instead, the creative person has access to cognitive disinhibition as
well as other cognitive states, and draws upon these various cognitive processing styles as
necessary to complete tasks. According to Martindale, this variability in cognitive
processing is the hallmark of the creative individual. In comparison, the cognitive
processing of psychotics is generally fixed in a state of cognitive disinhibition, whereas
the cognitive processing of normal, non-creative individuals is essentially fixed in a state
of cognitive inhibition.
Section Two: Overview of Neurophysiological Measurement Techniques
History of Neurophysiolo~cal Measurement
The history of recording electrical activity from the scalp of an animal begins
with Richard Caton (1 877). He reported that it was possible to record a weak current
from the scalp. However, this work was applied only to non-humans until Hans Berger
(1929). Berger is credited as the father of electroencephalogram (EEG) for his detailed
descriptions of the principles and qualities of EEG. He described alpha wave activity (8-
13 cycles per second) and noted that it decreased with intention (physical or mental) or
external stimulation.
Berger was also the first to associate EEG with attention. He attributed the
changes in alpha wave activity to excitation of a particular action center (e.g., visual
cortex excitation in response to a visual stimulus), which initiated general inhibition
across the rest of the cortex. He reasoned that changes in alpha wave activity reflected
the changes in cortical inhibition that accompanied excitation of different action centers,
and that this inhibition-excitation variation was necessary for the processing of external
or internal stimuli (Ray, 1990). Subsequently, widely distributed attention was associated
with alpha wave activity, whereas focused attention was associated with a reduction or
disappearance in alpha wave activity. With additional research, Berger associated higher
frequency waves (which he named beta waves) with focused mental activity. He
speculated that the generator for patterned wave activity was probably thalamic, as this
was the assumed region for general arousal.
While most of Berger's original observations still hold, it should be noted that
research has failed to show that subcortical activity is the sole generator of EEG patterns.
Current research favors the hypothesis that subcortical structures such as the thalamus
serve as presynaptic inputs to cortical neural pathways. The presynaptic inputs
coordinate the neural activity of a large group of cortical neurons, which in turn fire.
Thus it is not the neural activity of the subcortical structure itself that is recorded, but the
resultant activity of an organized set of cortical neurons. Modern researchers largely
agree that the likely source of scalp-recorded brain wave patterns is "depolarizations of
the dendritic trees of a pyramidal cell in the cerebral cortex" (Ray, 1990, p. 390).
Overview of Frequency-based Waveforms
The following is a brief overview of the divisions of frequency-based waveforms.
These are the waves that are analyzed across time, most often through Fourier analysis.
There are four major divisions of EEG waveforms (delta, theta, alpha, beta). Delta
waves are associated with sleep in healthy humans, or with diseased tissue such as brain
tumors. They are identified by a frequency between 0.5-4 Hz and amplitudes up to 100-
200 pV. Theta waves are associated with a number of psychological processes including
hypnagogic imagery, REM, problem solving, hypnosis, and meditation (Ray, 1990).
They are identified by a frequency between 4-7.5 Hz and amplitudes less than 30 pV.
Alpha waves, as identified by Berger (1929), are associated with relaxed consciousness
in normal humans. The frequency of alpha waves ranges between 8-13 Hz with
amplitudes between 30-50 pV. Alpha waves are sometimes divided into a lower (-8-10
Hz) and upper (-10-13 Hz) band for research purposes. This further segmentation of the
frequency band is a response to factor analyses that suggest that the two segments may
represent different types of cognitive activities, as reviewed below (Petsche, Kaplan, von
Stein, & Filz, 1997). Beta waves are associated with alert consciousness in normal
humans. They are also often divided into two bands (slow and fast), based on statistical
analyses. The slow beta is defined as ranging from 13-19 Hz, whereas fast beta
represents the upper end of the beta spectrum from 20-30 Hz. Both components show
amplitudes less than 20 pV.
Identification and Analysis of Frequency-based Waveforms
The waveforms described above can be visually detected in an EEG record. This
is especially true for alpha and beta waveforms, as these are the higher frequency, and
therefore more visually dominant, waveforms. However, it is often true that while one
waveform is most prominent in the EEG record, other frequencies are contributing to the
complex wave. Since it is difficult to detect all of the components of any complex
waveform, statistical techniques have been developed to assist with analysis. The most
common analysis used on EEG records is the fast Fourier Transform (FFT). FFT is based
on an algorithm developed by Cooley and Tukey (1965). This algorithm has been
incorporated into many computer programs. In this project, the SAS Spectra procedure
for FFT was used.
This is the method by which FFT analyzes the component frequencies within a
complex waveform. The FFT analyzes equally sized and sequential epochs (pieces) of
the EEG record by breaking down each epoch (i.e., the complex waveform of each
epoch) into frequency band estimates. "PROC SPECTRA uses the finite Fourier
transform to decompose data series into a sum of sine and cosine waves of different
amplitudes and wavelengths" (SASISTAT User's Guide, 1999, p. 751). The equation for
the Fourier transform decomposition of the series xj is xj = a0 1 2 + E [ak cos(ok t) + bk
sin(ok t )] where t is the time subscript, x, are the data, n is the number of data points, m
is the number of frequencies in the Fourier decomposition (m = n I 2 if n is even; m = n -
1 1 2 if n is odd), is the mean term, ak are the cosine coefficients, bk are the sine
coefficients, and o k are the Fourier frequencies (SAS Program Documentation, 2000).
The Fourier coefficients for the sine and cosine components are then plotted
against frequency to produce a periodograrn of the amplitudes at each frequency using
the equation Jk = n 1 2 (a: + b:). However, this periodogram is "a volatile and
inconsistent estimator of the spectrum" (SAS Program Documentation, 2000, p.752), and
must be smoothed. To smooth the periodogram, it is subjected to a weighting function.
There are many weighting functions, commonly called windows, but the Hanning
window is most commonly used in EEG analysis. The Hanning window function is w(i)
= 0.5 + 0.5 cos(2 pi i / W) for -W/2 <= i <= W/2 else w(i) = 0. The smoothed
periodogram is called the spectral density estimate. The spectral density plot shows the
amplitude for each frequency band in the record. These amplitudes are sometimes
referred to as the power of the band. These power estimates are used in all further
analyses.
Coherence in Frequency-based Waveforms
Coherence is another tool of the EEG researcher. It provides information about
the relationship between pairs of electrodes, and therefore information about "functional
relations between specific brain regions and the more general state-dependent
'competition' between functional segregation and integration reflected by brain
dynamics" (Nunez et al., 1999, p. 469). In other words, coherence is meant to clarify the
underlying neurophysiological mechanisms that contribute to the EEG record, and
therefore the spectral density estimate. By comparing the EEG record across electrode
pairs, it is possible to hone predictions about underlying brain regions that contribute to
the cognitive activity.
For coherence, instead of averaging the spectral density plots, the plots are
compared across electrode locations to determine how similar the EEG record is at each
site. In other words, spectral density plots for different electrode locations are subjected
to a specialized correlation that produces an estimate of the similarity in signal activity
between sites, called the cross-spectral density. Cross-spectral density is defined as JkxY =
n / 2 (akx akY + bkx bkY) + i n 1 2 (akx akY - bkx bkY) where i represents the imaginary unit -1.
Coherence is calculated with a cross-spectral density function that produces a
cross-spectral density plot that represents the phase consistency between two electrode
locations. The input to the cross-spectral density function is the spectral plots calculated
using the FFT analysis for the EEG record at each of the two electrode locations to be
compared. The output is the cross-spectral density plot. High coherence is achieved
when there is high phase consistency between two electrode locations. Perfect coherence
means that the power for a given frequency remained constant across all of the epoch
pairs for the two electrode recording sites. Therefore, it is not necessary for a given
frequency or frequency band to have high power in the original complex waveform for it
to have high coherence.
Overview of Event-related Potential Waveforms
As the methods of EEG became more popular in the 1960s, it was discovered that
it was also possible to record reliably shaped waveforms in response to particular stimuli
and to particular thought processes. Vaughn (1969) proposed to call these dependent
waveforms event-related potentials (ERPs). ERP research has extended the study of
brain physiology by developing methods that show a time-linked relationship between a
stimulus that requires some type of cognitive processing and the associated reaction.
While EEG research has been important in delineating neurophysiological states
associated with different types of thought and action, ERP has provided evidence of
specific neurophysiological responses to stimuli and cognitive activity. ERP
measurement is a powerful tool in determining how an individual responds to a particular
stimulus.
Identification of Event-related Potential Waveforms
Most ERP waveforms are identified by their amplitude direction and latency.
Positive amplitude components are indicated with a 'P', whereas negative amplitude
components are indicated with an 'N'. The latency designation is given in milliseconds,
which represents the average amount of time fiom stimulus onset until the expected form
appears. Thus, a waveform identified as Nl 00 can be interpreted as a negative
component that occurs an average 100 msec after stimulus onset. It should be noted that
in an interpretation of a waveform, the component (e.g., N100) is represented by the
highest amplitude within a predetermined range. For example, an individual Nl 00
amplitude score will be the highest negative amplitude point between 0-200 msec after
stimulus onset (Coles, Gratton, Fabiani, 1990). A latency score for the same waveform
will be the actual number of milliseconds that have passed when the highest negative
amplitude is recorded. There are a number of statistical considerations involved in
finding the individual amplitude and latency scores. These will be discussed in detail in
the analysis section of the dissertation. To continue with the discussion of event-related
potentials, the following paragraphs outline some basic features of the major ERP
waveforms.
NlOO
Nl 00 is a negative waveform that occurs between 0-200 msec after stimulus
onset. It was the first waveform identified that suggested that ERPs could be used to
study attention (Coles, Gratton, & Fabiani, 1990). Specifically, NlOO is associated with
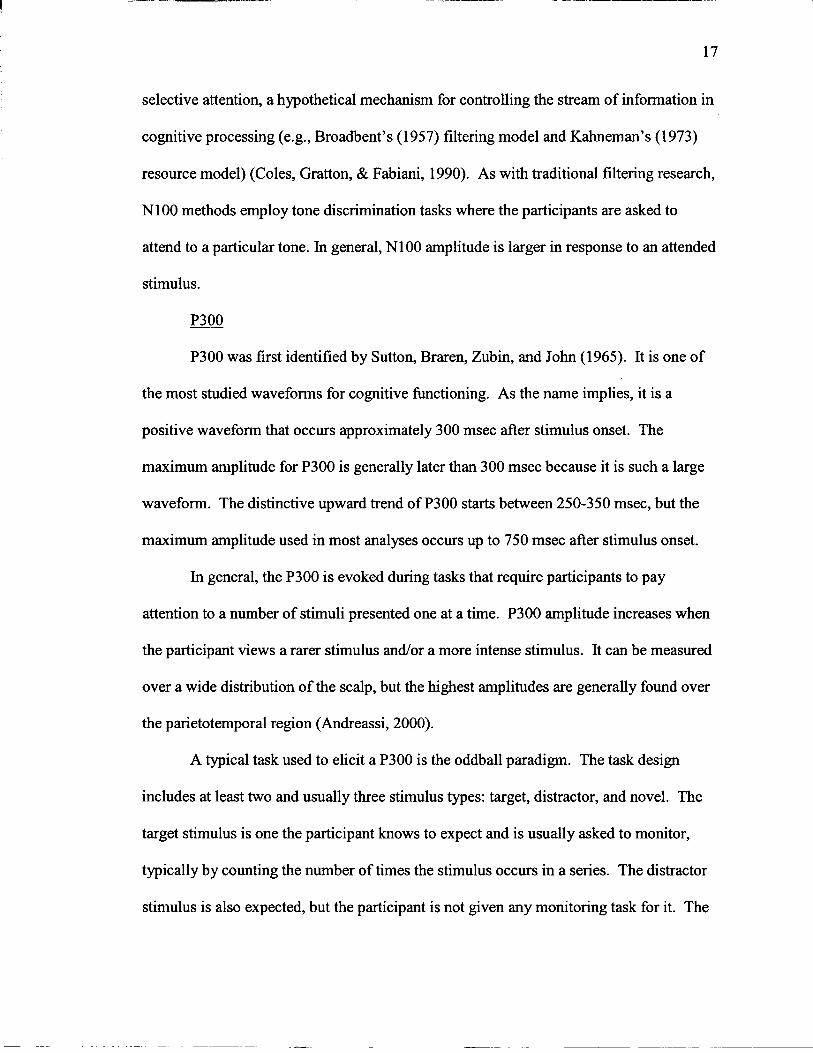
selective attention, a hypothetical mechanism for controlling the stream of information in
cognitive processing (e.g., Broadbent's (1957) filtering model and Kahneman's (1973)
resource model) (Coles, Gratton, & Fabiani, 1990). As with traditional filtering research,
NlOO methods employ tone discrimination tasks where the participants are asked to
attend to a particular tone. In general, NlOO amplitude is larger in response to an attended
stimulus.
P300
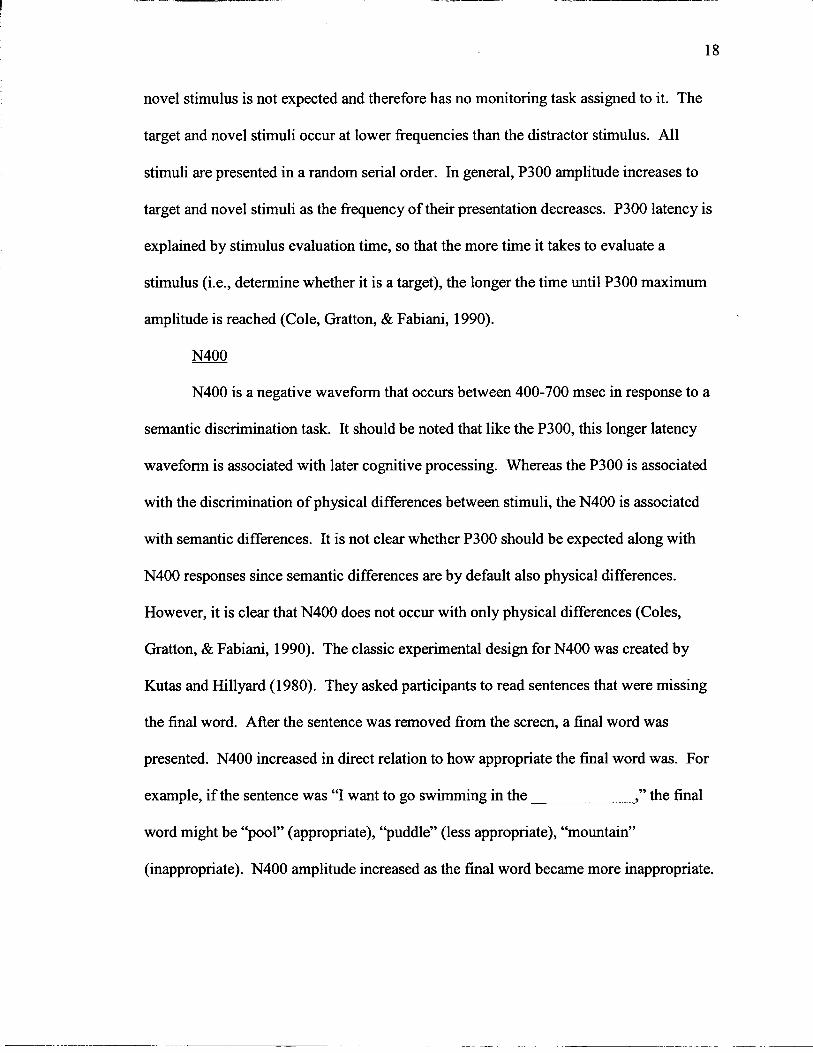
P300 was first identified by Sutton, Braren, Zubin, and John (1965). It is one of
the most studied waveforms for cognitive functioning. As the name implies, it is a
positive waveform that occurs approximately 300 msec after stimulus onset. The
maximum amplitude for P300 is generally later than 300 msec because it is such a large
waveform. The distinctive upward trend of P3OO starts between 250-350 msec, but the
maximum amplitude used in most analyses occurs up to 750 msec after stimulus onset.
In general, the P300 is evoked during tasks that require participants to pay
attention to a number of stimuli presented one at a time. P300 amplitude increases when
the participant views a rarer stimulus andlor a more intense stimulus. It can be measured
over a wide distribution of the scalp, but the highest amplitudes are generally found over
the parietotemporal region (Andreassi, 2000).
A typical task used to elicit a P300 is the oddball paradigm. The task design
includes at least two and usually three stimulus types: target, distractor, and novel. The
target stimulus is one the participant knows to expect and is usually asked to monitor,
typically by counting the number of times the stimulus occurs in a series. The distractor
stimulus is also expected, but the participant is not given any monitoring task for it. The
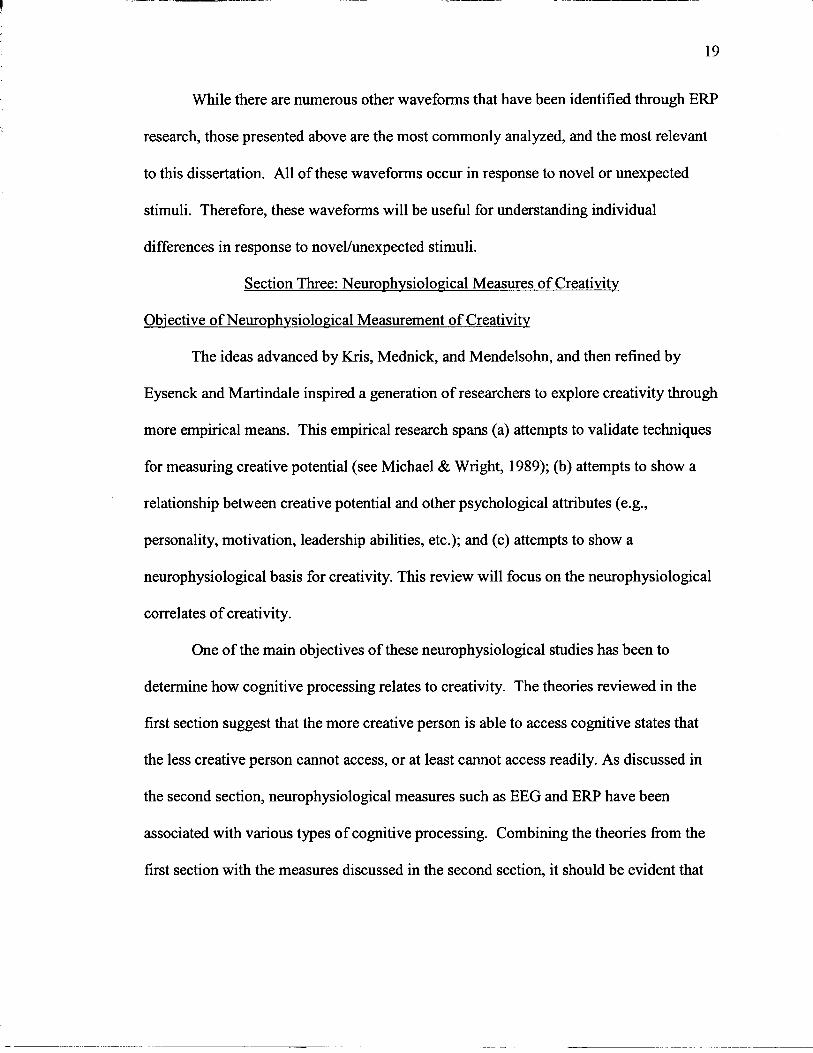
novel stimulus is not expected and therefore has no monitoring task assigned to it. The
target and novel stimuli occur at lower frequencies than the distractor stimulus. All
stimuli are presented in a random serial order. In general, P300 amplitude increases to
target and novel stimuli as the frequency of their presentation decreases. P300 latency is
explained by stimulus evaluation time, so that the more time it takes to evaluate a
stimulus (i.e., determine whether it is a target), the longer the time until P300 maximum
amplitude is reached (Cole, Gratton, & Fabiani, 1990).
N400
N400 is a negative waveform that occurs between 400-700 msec in response to a
semantic discrimination task. It should be noted that like the P300, this longer latency
waveform is associated with later cognitive processing. Whereas the P300 is associated
with the discrimination of physical differences between stimuli, the N400 is associated
with semantic differences. It is not clear whether P300 should be expected along with
N400 responses since semantic differences are by default also physical differences.
However, it is clear that N400 does not occur with only physical differences (Coles,
Gratton, & Fabiani, 1990). The classic experimental design for N400 was created by
Kutas and Hillyard (1980). They asked participants to read sentences that were missing
the final word. After the sentence was removed from the screen, a final word was
presented. N400 increased in direct relation to how appropriate the final word was. For
example, if the sentence was "I want to go swimming in the ," the final
word might be "pool" (appropriate), "puddle" (less appropriate), "mountain"
(inappropriate). N400 amplitude increased as the final word became more inappropriate.
While there are numerous other waveforms that have been identified through ERP
research, those presented above are the most commonly analyzed, and the most relevant
to this dissertation. All of these waveforms occur in response to novel or unexpected
stimuli. Therefore, these waveforms will be useful for understanding individual
differences in response to novelhnexpected stimuli.
Section Three: Neuroph~siolo~cal Measures of Creativity
Obiective of Neurophysiolorzical Measurement of Creativity
The ideas advanced by Kris, Mednick, and Mendelsohn, and then refined by
Eysenck and Martindale inspired a generation of researchers to explore creativity through
more empirical means. This empirical research spans (a) attempts to validate techniques
for measuring creative potential (see Michael & Wright, 1989); (b) attempts to show a
relationship between creative potential and other psychological attributes (e.g.,
personality, motivation, leadership abilities, etc.); and (c) attempts to show a
neurophysiological basis for creativity. This review will focus on the neurophysiological
correlates of creativity.
One of the main objectives of these neurophysiological studies has been to
determine how cognitive processing relates to creativity. The theories reviewed in the
first section suggest that the more creative person is able to access cognitive states that
the less creative person cannot access, or at least cannot access readily. As discussed in
the second section, neurophysiological measures such as EEG and ERP have been
associated with various types of cognitive processing. Combining the theories from the
first section with the measures discussed in the second section, it should be evident that
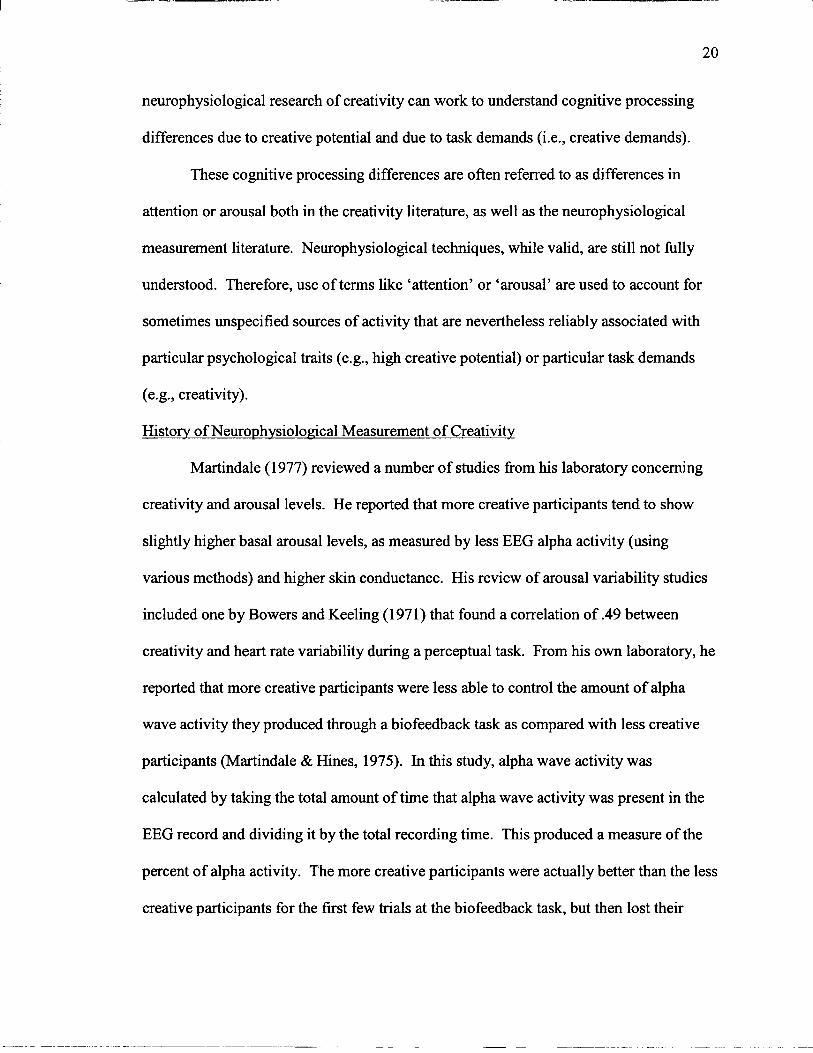
neurophysiological research of creativity can work to understand cognitive processing
differences due to creative potential and due to task demands (i.e., creative demands).
These cognitive processing differences are often referred to as differences in
attention or arousal both in the creativity literature, as well as the neurophysiological
measurement literature. Neurophysiological techniques, while valid, are still not fully
understood. Therefore, use of terms like 'attention' or 'arousal' are used to account for
sometimes unspecified sources of activity that are nevertheless reliably associated with
particular psychological traits (e.g., high creative potential) or particular task demands
(e.g., creativity).
History of Neurophysiological Measurement of Creativity
Martindale (1977) reviewed a number of studies from his laboratory concerning
creativity and arousal levels. He reported that more creative participants tend to show
slightly higher basal arousal levels, as measured by less EEG alpha activity (using
various methods) and higher skin conductance. His review of arousal variability studies
included one by Bowers and Keeling (1 97 1) that found a correlation of .49 between
creativity and heart rate variability during a perceptual task. From his own laboratory, he
reported that more creative participants were less able to control the amount of alpha
wave activity they produced through a biofeedback task as compared with less creative
participants (Martindale & Hines, 1975). In this study, alpha wave activity was
calculated by taking the total amount of time that alpha wave activity was present in the
EEG record and dividing it by the total recording time. This produced a measure of the
percent of alpha activity. The more creative participants were actually better than the less
creative participants for the first few trials at the biofeedback task, but then lost their
ability to control the signal. This result, while initially surprising, fits with "the
spontaneous uncontrolled nature of creative inspiration" (p. 76) reported by creative
people. Furthermore, it suggests that the creative person has a fundamental variability in
arousal that can only be controlled for brief periods.
Further results from Martindale and Hines (1 975) showed that arousal levels, as
measured inversely by EEG alpha wave activity, varied based on task type for more but
not less creative participants. In this study, the researchers measured alpha wave activity
while participants completed a task requiring only creative thought, a task requiring
creative and IQ-based thought, and an IQ task. The hgh creativity group showed the
greatest amount of alpha wave activity for the creative-only task, significantly less alpha
for the creative and IQ task, and still less for the IQ-only task. The less creative groups
(medium and low creativity) showed essentially identical alpha levels across tasks, with
little variation either between groups or between tasks. This study supports the attention-
based theories of creativity. In particular, it matches with Kris' (1 952) theory in that the
more creative participants showed task-specific shifts in their arousal levels. Kris did not
use neurophysiological terms to explain his theory, but instead posited shifts in thought
processes between primary and secondary modes. Nevertheless, the Martindale and
Hines results can be interpreted through Kris's theory as a reflection of those shifts. The
more creative task was accomplished while alpha wave activity was greatest, suggesting
that the more creative participants were in a more primary process state while completing
the creative task. The results can also be used to support Martindale's (1995, 1999) view
of the role of disinhibition in creativity. The more creative group did not exhibit a
constant state of disinhibition, which would have been shown through more alpha wave
22
activity across all tasks. Instead, the more creative participants only showed more alpha
wave activity, or less arousal, in response to a creativity task.
Martindale and Hasenfus (1 978) took a slightly different approach, asking
participants to create a creative story. The rationale for this study was to determine
whether arousal varies based on stages of creative production, not just task type. This
study was meant to mimic the stages of creative production first proposed by Helmholtz
(1896), and then elaborated on by Wallas (1926). Wallas, basing his explanation on the
many accounts of creative thought processes, stated that a creative product needed to go
through four stages of production: preparation for the answer through studying likely
sources of information related to the product, incubation of the studied ideas without
active attempts at solving the problem, illumination when the idea for the creative
product is discovered unexpectedly, and elaboration of the idea through a return to study
and itemization of the details necessary to use the solution.
Martindale and Hasenfus's study focused on the two most easily differentiated
stages of Wallas's theory, at least in terms of experimental design. In real-life creative
problem solving, preparation and incubation may involve long periods of study mixed
with other influences (interactions with people, reading seemingly unrelated books, etc.).
To mimic realistically preparation or incubation is almost impossible within a laboratory
setting. However, illumination, the period of creation, and elaboration, the period of
verification, are more amenable to laboratory studies. The researchers recorded alpha
indices while participants thought of a story on a given topic for three minutes
(illumination) and while they wrote their story for five minutes (elaboration). Alpha
indices were calculated by "dividing amount of time alpha waves were present by the
total time and multiplying by 100. Indices for each epoch were then averaged to yield
one score for each phase of the experiment for each subject" (p. 159). The more creative
participants, as rated through a separate writing assignment from a creative writing class,
showed overall significantly higher alpha indices, as well as a significant decrease in
alpha during elaboration. The less creative group, while showing lower alpha indices
across all stages when compared with the more creative group, also did not show any
significant differences in alpha between the stages of story production.
Martindale's results are promising in that they show a consistent difference in
response pattern for the more versus less creative groups. In summary, less creative
participants generally show lower levels of alpha activity across all task types as
compared with more creative participants. Furthermore, less creative participants do not
differ in amount of alpha activity based on task type, whereas the more creative
participants show great variability in alpha activity with tasks that require more creative
thought processes.
It should be noted that while these results are useful in directing Wher research,
they do not form a complete map of the creative person's neurophysiological response.
Martindale's studies measured EEG activity over the right posterior temporal lobe only,
and only isolated activity falling into the alpha (8- 13 Hz) frequency range. While both
the right hemisphere (Bogen & Bogen, 1969) and alpha activity (Petsche, Kaplan, von
Stein, & Filz, 1997, to be discussed below) have been identified as potentially important
components of the creative thought process, they can hardly be isolated as the crucial
components based on this research. It is clear that additional research is necessary to
clarify the relationship between brain wave activity and creative thought. There has been

some research that has helped with this task since Martindale's work in the 1970's. The
following paragraphs will outline this work, starting with that focused on hemispheric
differences, and then covering the work that focused on other EEG frequencies.
Hemispheric Differences in Neurophysiological Investigations of Creativity
It is possible that dynamic relationships exist between the hemispheres that were
not captured by Martindale's research thus far. For example, Andreassi (2000) reports
while it is possible to find hemispheric differences based on task type, it is also likely that
a more detailed analysis of the time course following task completion will reveal several
shifts in dominance between the hemispheres. Furthermore, Martindale's early research
used a single recording site (left posterior), which precludes any measures of coherence, a
method aimed at finding similar patterns of activation at different scalp locations.
Coherence measures have been used as indicators of the amount of information being
processed (Andreassi, 2000).
In the spirit of the work of Sperry (1968) and Gazzaniga (1975), numerous areas
of psychology have attempted to extrapolate fiom split-brain research to their own
interests. Creativity research has been no different. Reports about the skills isolated by
cornmisurotomy bolstered research aimed at showing right hemispheric dominance in
creative thought (McCallum & Glynn, 1979). An example of this research again comes
fiom Martindale's lab (Martindale, Hines, Mitchell, & Covello, 1984). In these later
experiments, participants were again asked to complete tasks that address Wallas's stages
of creative production. This research determined that the highest creativity group showed
the most right hemisphere alpha activity during creative task performance. As with the
previous studies, amount of alpha activity was calculated by dividing the amount of time
alpha waves were present by total time and then dividing by 100.
Studies of hemispheric specialization from other labs found fewer differences
between the hemispheres for more creative participants (Jausovec, 1985; Atchley,
Keeney, & Burgess, 1999). Jausovec (1985) grouped 16 nine year old children into a
High and Low Creativity group based on their performance on the Wallach-Kogan
Creativity Tests (Wallach & Kogan, 1965) and the Torrance Tests of Creativity
(Torrance, 1974). While the children were completing two of the Torrance tests (a
figural task called Incomplete Figures and a verbal task called Circles), EEG was
recorded. These researchers found greater right hemisphere activation for their Low
Creativity group during both creative tasks, and little difference between hemispheres for
their High Creativity group. They explained their results as evidence of greater
"interhemispheric integration" (p. 238) for the High Creativity group.
Atchley, Keeney, and Burgess (1999) grouped 72 college students into three
creativity groups based on their performance on the Wallach-Kogan Similarities subtest
(Wallach & Kogan, 1965). These three groups were compared in performance on a
Visual Field task, where participants were presented with a priming word and then a
target word they had to name. The visual field for the target word was switched at equal
intervals over the course of the experiment. They found that their High and Moderate
Creativity Groups performed better than their Low Creativity Group when the target
word was presented to their Lefi Visual Field. They explained this result as evidence of
Right Hemisphere dominance for more creative participants. However, they also explain
that since the High Creativity Group performed better than the Moderate and Low
Creativity Groups when the target was presented to the Right Visual Field, their research
also offers support to the hemispheric integration hypothesis. The authors concede that
"It would be reaching beyond [their] data to make any firm speculations about the
mechanistic implication of the results from the HC [High Creativity] group" (p. 494).
They conclude that the High Creativity group makes uses of both hemispheres when
processing the target stimuli, whereas the Moderate creativity and the Low Creativity
groups do not seem to have access to such interhemispheric processing.
Frequency Differences in Neurophysiolo~cal Investigations of Creativity
In terms of frequency analyses, it is reasonable to suggest that if alpha wave
activity is related to creativity, then other frequency bands might also be related to
creativity. It seems especially likely that if creativity is related to a lower frequency band
pattern (i.e., alpha), then creativity might also be related to even lower frequency activity
such as theta (4-7 Hz) or delta (53 .5 Hz). Of theta and delta waves, theta is most likely
to be related to creativity. Theta waves are more generally found in babies and young
children. However, they have been associated with experiences of pleasure, and with
poor performance on a vigilance task in adults (Andreassi, 2000). In contrast, delta
waves are generally only found in sleeping adults or in conscious adults with serious
brain abnormalities such as tumors. Using the theoretical positions of Kris, Mednick, and
Mendelsohn as models, beta waves (14-30 Hz) should show less relation to creativity.
Beta waves are associated with alert consciousness, such as one would find in a person
engaged in a conversation. Alert consciousness is the state described by Kris as
secondary process, described by Mednick as steep associative, and described by
Mendelsohn as a tight attentional focus, and should therefore be more prevalent in less
creative individuals during creative tasks. However, it is possible that the shifts between
frequencies will be important in the success of the creative thinker, demonstrated through
a relationship between creativity and beta waves.
There has been research that has investigated a more complete spectrum of EEG
frequency ranges in relation to creativity. For example, Whitton, Maldofsky, and Lue
(1 978) investigated power of frequency bands for delta, theta, low alpha (7-9.99 Hz),
high alpha (10-12.99 Hz), low beta (13-15.99 Hz), and high beta (16-25 Hz). Power for
each frequency band was calculated using fast Fourier Transform (FFT) on an entire
record of interest (i.e., the data was not divided into epochs). The resulting spectrum from
each FFT for each task (described below) was then averaged. The average spectrum for
each participant was used to compare percentage of power for each frequency band
between groups. They used a group of schizophrenic and a group of normal participants.
Both groups were asked to complete a variety of creativity tasks (e.g., list all words that
rhyme with note, what two words comprise the new word brereal, etc.). EEG waveforms
were analyzed for the four seconds prior to answering each question. Interestingly, there
were significant increases in delta and theta activity, and a decrease in high beta activity
(i.e., waveforms between 16-25 Hz) just before the creative task was completed for both
the schizophrenic group and the normal group. The variability in power was greater for
the schizophrenic group, but all effects were significant for both groups. There were no
significant changes in power in the alpha range associated with the creative task.
Unfortunately, the researchers did not report any analyses based on quality of answers. It
is therefore impossible to determine whether these results could generalize to an

understanding of the more versus less creative individual. Furthermore, they did not
perform coherence measures.
Frequency and Coherence Differences in Neurophysiolo~cal Investigations of Creativity
Tucker, Dawson, Roth, and Penland (1985) focused on power and coherence
measures for sites over the fi-ontal, temporal, parietal, and occipital lobe for each
hemisphere (i.e., eight leads) while participants completed a word fluency test. Word
fluency is considered a creative ability, where more creative participants will be able to
produce more words that represent some category (e.g., uses for a brick) (Wallach &
Kogan, 1965). Participants were asked to think of four words that began with a given
letter and ended with a different given letter. They were given 20 seconds to complete
the task before they were asked to verbally report the words they thought. Their report
includes a full analysis of the EEG activity for two participants, analyzed individually
with no quantitative comparisons between participants. They calculated power with fast
Fourier Transform (FFT) on each 2 seconds of data. They calculated coherence using the
power spectra for each epoch and each recording site. Both subjects showed a general
trend toward less power in the alpha, theta, and delta bands during the word fluency task,
as compared to resting. However, they both also showed greater theta and delta
coherence during the word fluency task suggesting that while the task requires less alpha,
theta and delta activity, it benefits fi-om coordinated effort across multiple locations. It
should be noted that the coherence patterns differed between the two participants. The
first participant showed theta coherence in the left fi-ontal lobe and almost complete
coherence across all sites for delta, with a slight emphasis on the left hemisphere sites.
The second participant showed greatest coherence across the right and left occipital lobe

with the addition of hemisphere-specific coherence between the occipital lobes and the
fi-ontal lobes. These researchers also regressed power ratings for each frequency band at
each electrode site onto word production (i.e., the total number of words generated on a
given trial) in an attempt to show performance effects. They found that the patterns
differed between participants and were somewhat difficult to interpret. However, it is an
attempt to use EEG to explain differences in response pattern. While this study can serve
as a general model for further research, it is lacking in generalizability. A study using a
larger sample size and analyses across participants should help to clarify these results.
Petsche, Kaplan, von Stein, and Filz (1997) came closer to reporting a complete
picture of EEG during creative thought. They asked 38 artists and non-artists to complete
four tasks allotted two minutes each: (a) contemplate a slide of a painting projected onto
a wall; (b) silently read a text, a distraction task; (c) memorize the painting shown earlier;
(d) mentally create a picture of their choice. For each task, they looked at delta, theta,
alpha 1 (7.5-9 Hz), alpha 2 (9.5-12.5 Hz), beta 1, and beta 2 power and coherence. The
method of power and coherence calculation is reported as the Fast Fourier Transforms of
every artifact free 2 second period, which were then grand averaged for power and cross-
spectra analyzed for coherence.
They report that both artists and non-artists show decreases in alpha power while
mentally creating a picture (the creativity task), but that these decreases also occur while
contemplating and memorizing a picture. The artists do show less of a decrease in alpha
in response to all of the picture-related tasks, but that may be attributed to their greater
familiarity with the tasks. In terms of coherence, there were no significant differences
between artists and non-artists. However, there were "numerous long-distance
connections with increased coherence both ipsi- and contralaterally . . . " (p. 83) while the
participants were mentally creating a picture, but not for any of the other tasks. The
authors suggest that long-distance coherence findings might be specific to creative
thought. The obvious question is then how will coherence patterns differ across those
with varying creative abilities?
Petsche, Kaplan, von Stein, and Filz (1997) also reported a similar experiment
with seven male composers. In this experiment, participants were presented four pieces
of music of various styles (Bach, Beethoven, Schonberg, and a Jazz piece). Each piece
was presented for five minutes. The composers were also asked to mentally compose for
five minutes, and then write his composition for another five minutes. Their spectral
analysis of the EEG record showed that for all tasks "both alpha bands were considerably
involved in all subjects, but they did not behave uniformly" (p. 86). Given the variability
across participants, the researchers chose to focus on one task (composition) and one
participant for coherence analysis. For this participant, coherence increased in the low
alpha band during composing. There was also increased "intracortical communication
within and between hemispheres" (p. 86). This participant was then compared to a
second composer who showed greater high alpha band coherences. While helpful in
providing a model for the measurement of coherence during a creative task, the lack of
individual difference analyses leaves much to be understood about coherence and
creativity.
Event-related Potential Differences in Neurophysiolo~cal Investigations of Creativity
There are no published studies that have used the ERP technique described above
to examine creativity or creative potential. However, the author conducted a preliminary
experiment using the oddball task (Kwiatkowski & Martindale, 1999). Following the
design of Courchesne (1978), the target stimulus was the letter A, the distractor stimulus
was the letter B, and the novel stimuli were colored random line patterns. ERP data was
gathered from three midline scalp locations (Fz, Cz, Pz). Creativity was defined as the
composite score on three creativity tests: The Remote Associates Test, The Alternate
Uses Test, and the Creative Personality Scale. Participants were split into a high and low
creativity group using a median split of the composite creativity score.
The results were promising in that the more creative participants had higher
amplitude NlOO and P300 waveforms across all three stimulus types. This was a
statistically significant difference between the High Creativity and Low Creativity group.
As explained above, Nl 00 and P300 are well-defined waveforms that have been
associated with attention. Nl 00 amplitude, according to Coles, Gratton, and Fabiani
(1 990), can be interpreted as "early filtering that reduces the processing of irrelevant
information" (p. 437). P300 amplitude can be interpreted as a representation of the
processing resources required for a particular task. Higher P300 amplitude is indicative
of more resource allocation to a particular task. Taken together, greater NlOO and P300
amplitudes for the creative group suggest that more creative participants are allocating
their attentional resources differently than the less creative participants. More
specifically, they seem to be allocating more resources to the processing of the oddball
stimuli, as evidenced by higher amplitudes on both NlOO and P300 wavefoms.
Additionally, the more creative participants showed highly variable P300
amplitudes across presentations of the novel stimuli, whereas the less creative
participants showed little variability. Following Courchesne's design, P300 variability

was measured for six averaged groupings of novel stimulus presentations for both the
frontal and parietal scalp locations. Frontal (Fz) and parietal (Pz) scalp locations were
analyzed because they have previously been associated with change in processing of
novel stimuli (Courchesne, 1978). The frontal electrode location, as opposed to the
parietal electrode location, has been associated with initial processing of a novel stimulus
because hlgher amplitudes are recorded at frontal locations when a new, unexpected
stimulus is presented. The parietal electrode location, in contrast, has been associated
with continued processing of a once-novel stimulus because increasing amplitudes are
recorded with continued presentation. The central electrode location was not analyzed
because it has not been implicated in this particular problem. The raw ERP record matrix
for each of 18 stimuli was used, and broken into 6 averaged matrices. The matrices for
the first three stimuli were averaged to form the first novel presentation group, and the
matrices from the second three stimuli were averaged to form the second novel
presentation group. This procedure was repeated for each of the 6 novel presentation
groups.
For the less creative group, the P300 amplitude between the first and second
averaged group of novel stimuli showed a slight rise in amplitude in the fi-ontal electrode
location (Fz), and the parietal (Pz) location. Then, the amplitude essentially did not vary
across the next four averaged groups. The frontal P300 was slightly, although not
significantly, higher than the parietal P300 across each group. Both the frontal and
parietal locations followed the same amplitude pattern, almost exactly mirroring each
other.

The more creative group's P300 amplitudes oscillated with every group of novel
stimulus presentations. The differences across novel presentation groupings was
statistically significant, although it did not follow Courchesne's predicted pattern of early
increases in Fz followed by decreases at Fz mirroring increases at Pz. Unlike the less
creative group, fi-ontal and parietal P300 amplitudes did not follow the same pattern
across groups. The differences between frontal and parietal recordings across time were
also statistically significant. Overall, the amplitudes for both the frontal and parietal sites
were statistically significant, with overall higher amplitudes for the more creative group
than the less creative group. The striking difference in activation patterns suggests that
more creative participants differ from less creative participants in the distribution of
attentional resources. It is not just that more attention is allocated to stimulus processing,
but the allocation is also more variable, in accord with the theories discussed in previous
sections.
Purpose
There are a number of studies from Martindale and colleagues that examined
individual differences on a variety of creative tasks. However, they did not explore all of
the possible frequency bands, nor did they examine coherence between electrode
locations. The absence of these measures makes it difficult to draw any solid conclusions
about the neurophysiology of the more versus less creative individual. Other labs have
reported more complete analyses of the neurophysiological response to creative tasks, but
have not related the responses to individual differences in creative potential. The lack of
this information prevents any conclusions based on the neurophysiologically-based
models of creativity discussed in the previous sections. To gain a better
neurophysiological understanding of creativity, it is necessary to consider both individual
differences and do a more complete analysis.
Common Method
Participants
Eighty-two participants completed this project, with half (n = 41) males and half
(Q = 41) females. The mean age of participants was 19.55 @ = 3.04), with a range of
18-43 years. The mean years in college was 1.66 (m = 1.04), with a range of 1-5 years.
All participants were self-reported right-handed, and scored between 6-14 points (M =
11.95, SD = 1.9) on a standard handedness questionnaire, with 14 points as the maximum
right-sidedness score.
Participants were recruited fi-om the University of Maine Psychology Department
Introductory Psychology Classes, and received course credit for their participation.
Males and Females were recruited separately to ensure equal numbers of participants by
sex. All participants completed both parts of the assessment (i.e., paper and pencil
measures and neurophysiological measures) in one session. Half of the participants
completed the paper and pencil measures first, and then completed the
neurophysiological assessments. The other half of the participants did the opposite. All
assessments were individually administered.
Paper and Pencil Measures
To capture individual differences in creative potential, five standard creativity
tests were admmistered to all participants. The five tests were chosen because they have
been successfid at measuring creative potential from different perspectives. In the
analysis of the results, the scores from these tests will be standardized and combined to
form a creative potential score. The five creative potential tests are the Alternate Uses
Test, the Remote Associates Test, the Creative Personality Scale, the Word Association
Test, and rated creativity of a story written during one of the EEG tasks (see below for
details). In addition to the creative potential tasks, a measure of intellectual functioning,
the Shipley Institute of Living scale, was included to ensure that results were due to
creative potential and not general intellectual ability.
Alternate Uses Test
The Alternate Uses Test follows the design of Wallach and Kogan (1965) (see
Appendix F). It follows the ideas of Guilford (1 950) who suggested that creative thought
is comprised of at least eight abilities. Based on research, one of the most successful of
those eight abilities is fluency, or the ability to generate a large number of possible
solutions to a problem. Wallach and Kogan's fluency task involved asking participants to
give as many uses for common objects as possible. They scored the test in two ways:
total number of uses and uniqueness of the uses. Total number of uses was scored by
adding up the number of uses given for each object. Uniqueness of uses was scored by
adding up the total number of times each response for a participant was given within the
entire sample. Using the Spearman-Brown split-half reliability coefficient, they found
that the uniqueness score had a .87 reliability score and that the number of instances had
a .93 reliability score. Additionally, the test showed high correlations with Wallach and
Kogan's other measures of creativity and no correlation with a variety of intelligence
measures.
For this study, participants were presented with a common object and were asked
to produce as many uses for the object as possible within three minutes. This procedure
was repeated for each of three nouns. The objects used for this project were Shoe,
Newspaper, and Brick. For each object, an individual total of the number of uses
- produced was summed (Mshoe = 9.34, SDshoe = 3.56; MNewvaF = 12.17, mewspaper -
3.86; &rick = 10.66, SDBrick = 3.43). A high Coefficient Alpha (a = 0.85) indicates that
there was internal consistency in answer patterns across the three subscales, therefore it
was appropriate to combine these scores into a single total score for the Alternate Uses
Test (M_ = 34.09, SD = 10.41). The combined score Alternate Uses Test was used for all
further analyses.
The Alternate Uses Test was positively correlated with the Creative Personality
Scale (1 = .33, E < .01). This indicated that participants showing more creative potential,
as measured through the Alternate Uses Test, also reported more creative personality
traits. No other creative potential measures were correlated with the Alternate Uses Test.
Remote Associates Test
The Remote Associates Test was developed by Mednick (1962) in relation to his
associative theory of creativity (see "History of Creativity" above) (see Appendix F for
test). It builds on the principles of word association by providing three words that have
some isolated association. Participants are asked to determine the appropriate
association. It is a technique meant to force participants to draw upon their ability to
make unusual associations between ideas. The RAT has shown promising reliability and
validity in a number of studies. In two separate studies, Spearman-Brown reliability for
the RAT was .92 and .91. In comparison with expert ratings of the creativity of a group
of practicing architects, the RAT showed a high positive correlation (1 = .70, p < .01).
In this study, participants were presented with 30 of these three-word groups, so
the highest possible raw score for this task was 30. The range of scores for this task was
0 correct to 18 correct (M = 9.33, SD = 4.07).
Creative Personality Scale
The Creative Personality Scale was developed by Gough (1979) (see Appendix
F). It is a subset of Gough and Heilbrun's (1979) Adjective Checklist, which asks
participants to check the adjectives that they believe best describe them. Gough
identified the 18 adjectives that best described the creative person and the 12 adjectives
that best described the uncreative person and used these 30 adjectives to create the
Creative Personality Scale. The Alpha coefficient reliabilities were reported for each sex
as follows: .77 for the male composite, and .81 for the female composite. In the same
study, the Creative Personality Scale was compared to six other adjective checklist scales
for creativity (i.e., Domino, Shaefer, Welsh A-1, Welsh A-2, Welsh A-3, and Welsh A-
4). The Creative Personality Scale was positively related to all six other scales (p < .01).
Additionally, it was compared to expert ratings of creativity for each participant in the
sample and was found to be a better predictor of rated creativity than any of the other six
scales.
Scores on the Creative Personality Scale range between -12 to +18. For this
sample, the average score was approximately in the center of the distribution (M_ = 5.22,
SD = 3.95). -
Word Association Test
The Word Association Test was developed by Palenno and Jenkins (1964) (see
Appendix F). It is based on the idea that the types of associations people make to a given
word provide insight about their cognitive state. Participants are given individual words
and are asked to state the first word that comes to their minds when they see each word.
Palermo and Jenkins gathered norms for each word by recording responses for 4th-12th
grade students and for a sample of college students. Five hundred males and five
hundred females were used for each grade. To score the Word Association Test, each
participant's response to a given word is compared with the responses given by the
appropriate normative sample (i.e., a female college student's response is compared to
the responses given by female college students from the normative sample). The
participant's score for a given word is the number of participants from the normative
sample who gave the same response. Therefore, a higher score is indicative of a more
stereotypical response, although the score is typically reverse coded to make correlations
with other creativity tests easier to understand. The Word Association Test has been
related to creative potential in a number of studies (see Eysenck, 1995). For example,
Merten and Fischer (1999) reported that a group of expert-rated creative writers and
actors provided more unique word association responses than did a group of
schizophrenics or a group of normal controls.
In this study, participants were asked to write down the first word that came to
their mind in association with each of 100 given words. The participants' answers were
then compared with Palermo and Jenkins'(1964) normative sample, where the most
common responses to a given word are listed, along with the number of participants from
the normative sample who gave the response. The more participants from the normative
sample who gave a response, the more common that response. To score the Word
Association Test, each response was compared to the normative sample list, and the
number of participants f?om the normative sample who gave the response was recorded.
The raw Word Association Test score is the total across the 100 words. A higher score
indicated more common answers, while a lower score was indicative of less common
responses. The range of scores for this sample was between 1 168 to 10,926 (M =
4405.94, SD = 1944.67). These raw scores were converted to z-scores and then reverse
coded for all further analyses, so that a lower score is indicative of a more stereotypical
(less creative) response.
Story Originality Scores
In the first EEG experiment, participants were asked to take five minutes to think
of a creative story without saying it out loud. Then, they were asked to write the story
out for the next five minutes. The written version of the stories were subjected to expert
review for originality. Reviewers were asked to rate the originality of each participant's
story on a five-point Likert scale. They were instructed to use their own understanding of
originality to assess the creativity of each story. This method has been shown to produce
highly reliable ratings across a number of types of creative tasks (i.e., spatial and verbal
tasks). Arnabile (1982) reported interrater reliabilities between .72 and .90 across seven
studies of creative products. Sternberg and Lubart (1996) reported an interrater reliability
of .92. Sternberg and Lubart (1996) emphasize the importance of these more open-ended
methods to capture the breadth and depth of the creative process.
Two raters judged the originality of the stories produced in experiment one on a
scale of 1-5 (5 = high originality). They were asked to use their own definitions of
originality to score the stories, but were given an example of a story theme that fit each
score (1-5). Interrater reliability for originality scores was high (a = .96). Given the
high degree of reliability for the originality ratings, the mean rating between the two
judges was used for all further analyses. This mean of the judge's ratings will be referred
to as Originality. The mean Originality score (i.e., score after averaging the two judge's
ratings) was M = 2.77 with a standard deviation of SD = 2.00.
Intellectual Functioning
In addition to the creative potential tasks, participants were also asked to complete
the Shipley Institute of Living Scale (Zachary, 1996). The scale consists of two subtests,
each aimed at assessing general intellectual functioning. The first subscale is a
vocabulary test where participants are asked to find the synonym to a given word out of
four possible choices (e.g., LARGE is a synonym to red, big, silent, or wet - the answer
is big). The second subscale is an abstraction test where participants are asked to
complete a series by providing the next element in the series (e.g., Complete the series A
B C D - - the answer is E). This scale is considered an adequate short version of a test
of intellectual functioning. For example, across 1 1 studies, the median correlation
between the Shipley total score (across both subscales) and the WAIS (a considerably
more complex intelligence test) was .79, with a range in correlations between .73 and .90.
This scale was included to control for the possibility that individual differences in
neurophysiological measures were due to general intellectual functioning and not creative
potential.
In accord with numerous past studies (see Eysenck, 1999, it was not expected
that creativity and intellectual functioning scores would correlate significantly, nor was it
expected that intellectual functioning would have a stronger relationship with the
neurophysiological measures than creative potential scores.

Both subscales of the Shipley Institute of Living Scale were used in this study.
On the vocabulary subscale, participants were asked to find the synonym for each of 40
given words. The raw scores on the vocabulary subscale ranged between 22 to 38 (M =
29.52, SD = 3.67). On the abstraction subscale, participants were asked to complete 20
pattern sets where either numbers, letters, or words are left out of a given pattern. For
easy comparison to the vocabulary subscale where the highest possible score was 40,
Shipley Institute of Living Scale suggests doubling the raw score for the abstraction
subscale where the highest possible score was 20. The doubled raw scores on the
abstraction subscale ranged between 18 and 40 (M = 33.49, SD = 4.62). Coefficient
Alpha (a = 0.46) was moderate, indicating that there was internal consistency in answer
patterns across the two subscale. Therefore, it was appropriate to combine these scores
into a single total score (M = 63.01, SD = 6.72). The combined score was used for all
W e r analyses.
Apparatus
Two adjacent rooms were used for this part of the study. The experimenter's
room housed a Grass Model 89 eight channel electroencephalograph (EEG), a Toshiba
Equium 7000s personal computer (PC), and a computer monitor. The PC had a Keithley
DAS 1202 Analog-to-Digital (A/D) conversion card installed to allow digital recording
and analysis of the analog EEG signal. This card allowed up to 50K sampleslsec over the
total number of channels. All A/D conversions occurred at 200 Hz, which is twice the
highest expected frequency from eye muscle movement, also called the Nyquist
frequency. Sampling at twice the expected frequency is common practice in A/D
conversion because it ensures that aliasing will not occur. Aliasing is the unintended
reduction of a waveform fiom a higher, unsampled, fiequency to a lower frequency
within the sampling range. The signal was output from the EEG to the A/D card through
eight shielded wires, one for each channel. These were single-ended inputs, all referring
to a common ground. Sensitivity and all filters were controlled through a master switch
on the EEG, and were used because they are the settings most commonly used in EEG
recording, as well as the default settings for the equipment. Sensitivity was set to
7pVImm. Low bandpass filter was set to 1Hz. High bandpass filter was set to 70 Hz.
The 60Hz filter was set to eliminate common electrical interference, as 60Hz is the
fiequency at which most building electrical currents are set.
The participant's room held a computer monitor angled at a slight downward tilt
toward the participant's chair. The average visual angle between the participant and the
stimuli on the computer monitor was 2.4' (i.e., tan(Visua1 Angle) = Height of Stimulus I
Distance fkom Stimulus: tan(2.4) = 5 cm / 122 cm or tan(2.4) = 2 inches / 48 inches).
This computer monitor was linked to the PC in the experimenter's room through a Y-
cable. This allowed the participant to view the same scene as the experimenter. The
chair was a comfortable reclining chair. An electrode board was attached to the top and
back of the chair near the participant's head. This electrode board was connected to the
EEG in the experimenter's room through a portal in the adjoining wall. Electrodes were
lcm gold disk electrodes. Electrode application included a light NuPrep pumice scrub, a
swipe of 70% isopropyl alcohol, and finally application with Ten20 conductive paste. A
resistance check was performed for all electrode leads once they were applied.
Electrodes were reapplied until resistances of 5KQ or less were obtained for each
electrode.
All stimulus presentations for the neurophysiological experiments were controlled
through Testpoint, a Keithley data acquisition software product. Stimulus presentations
and data acquisition were coordinated through Testpoint. Data was recorded fiom six
lateral sites: frontal (F3, F4), central (C3, C4), and parietal (P3, P4). Eye movement was
recorded from the outer canthi of the left eye, with one lead above and one lead below the
eye. All electrodes were referenced to linked mastoid leads.
Common Results
Participants
There were very few significant correlations between the Creative Potential or
Intellectual Functioning measures and the Participant Demographic Information (i.e.,
Sex, Age, Years in College, and Handedness), except for the following. Sex and Word
Association Test are positively correlated (1: = 0.36, p < .001), indicating higher Word
Association Test scores for female participants. Considering that a high Word
Association Test score is associated with more typical responses, it can be concluded that
for this sample, female participants were more likely to produce typical responses. Years
in College and Shipley Institute of Living Scale Vocabulary Subscale scores are
positively correlated (E = 0.3 1, p < .01), indicating higher vocabulary scores for those
who have been in college longer. Handedness and Shipley Institute of Living Scale
Vocabulary Subscale scores are negatively correlated (I = -.23, p < .05), indicating higher
vocabulary scores for those who report less right-handedness. Handedness and Alternate
Uses Test total score are negatively correlated (1 = -.40,p < .001), indicating higher total
Alternate Uses Test scores for those who report less right-handedness. There are no other
significant correlations between Participant Demographics and either Creativity or
Intellectual Functioning Scores. All correlations are reported in Appendix A.
Paper and Pencil Measures
Creativity Tests
The Alternate Uses Test was positively correlated with the Creative Personality
Scale (g = .33, p < .01). This indicates that participants showing more creative potential,
as measured through the Alternate Uses Test, also reported more creative personality
traits. The Creative Personality Scale was also correlated with the Word Association Test
(g = .22, p < .05). This indicates that participants reporting more creative personality
traits also supplied more unusual associations on the Word Association Test. The
correlation between the Creative Personality Scale and the Remote Associates Test was
not significant (g = .12), however it was in the expected direction. The correlation
between the Word Association Test and the Alternate Uses Test (g = .06) and the Remote
Associates Test (g = .20) were both in the expected direction, indicating a positive
relationship between all other measures of creative potential with the Word Association
Test. The Originality scores for the creative stories produced in experiment 1 were not
significantly correlated with any other measures of creative potential.
Intellectual Functioning
The Shipley Institute of Living scale (Zachary, 1996) total score was positively
correlated with the Remote Associates Test (g = .32, p < .004). No other creative
potential measures were significantly correlated with the Shipley Institute of Living
Scale. Furthermore, they did not show a consistent pattern of relationship with the
Shipley Institute of Living Scale.
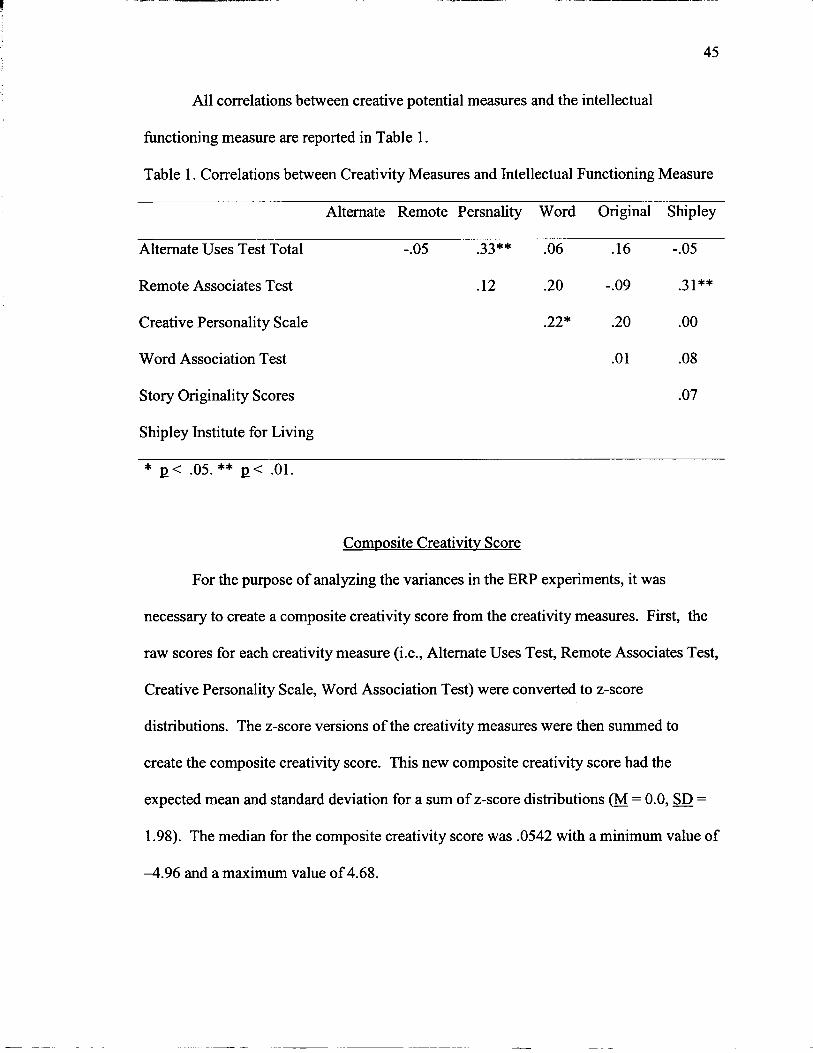
All correlations between creative potential measures and the intellectual
fimctioning measure are reported in Table 1.
Table 1. Correlations between Creativity Measures and Intellectual Functioning Measure
Alternate Remote Persnality Word Original Shipley
Alternate Uses Test Total -.05 .33** .06 .16 -.05
Remote Associates Test .12 .20 -.09 .3 1 **
Creative Personality Scale .22* .20 .OO
Word Association Test .01 .08
Story Originality Scores
Shipley Institute for Living
Composite Creativity Score
For the purpose of analyzing the variances in the ERP experiments, it was
necessary to create a composite creativity score fiom the creativity measures. First, the
raw scores for each creativity measure (i-e., Alternate Uses Test, Remote Associates Test,
Creative Personality Scale, Word Association Test) were converted to z-score
distributions. The z-score versions of the creativity measures were then summed to
create the composite creativity score. This new composite creativity score had the
expected mean and standard deviation for a sum of z-score distributions (&I = 0.0, SD =
1.98). The median for the composite creativity score was .0542 with a minimum value of
-4.96 and a maximum value of 4.68.

The composite creativity scores were not related to the measures of intellectual
functioning, either individually or combined. The correlation with the Vocabulary
subscale was 0.12. The correlation with the Abstraction subscale was 0.003. The
correlation with the combined intellectual functioning scores was 0.07. Furthermore, the
composite creativity scores were not related to sex (I = -. 18).
To create a high and low creativity group for use in experimental analyses, all
scores were split at the median value of .0542. Participants with composite creativity
scores above .0542 were assigned to the High Creativity Group. Participants with
composite creativity scores equal to or below .0542 were assigned to the Low Creativity
Group. Participants were divided evenly between the High Creativity Group (IJ = 40) and
Low Creativity Group (IJ = 40). Furthermore, participant sex was divided essentially
evenly between the High Creativity Group (~lma,, = 19, %-Ie = 21) and the Low
Creativity Group (hl, = 20, memale = 20).
Note that the story originality ratings were not included in this composite score.
They were not included because of the difference in administration between the other
creativity measures and the story creation task. All creativity tasks except the story
creation task were administered individually at a desk in a quiet room, whereas the story
creation task was completed while the participant was completing the neurophysiological
experiments (i.e., wearing electrodes, lying in a chair, receiving instructions from a
computer monitor, etc.). Thls difference in task demand was too great to include the
story originality scores in the composite measure.

Experiment One
Hypotheses
The first neurophysiological task used the methods from Martindale and Hasenfus
(1978), measuring EEG during a creative task. It was hypothesized that the more creative
participants would differ from the less creative participants while creating the creative
story in the lower amplitude fi-equency bands. It was expected that this study would
replicate the findings from the original study in that alpha wave activity would be more
prominent for the more creative group during the creative story task. In addition, theta
and delta activity was expected to increase for the more creative group only during the
creative story task, indicating a reduction in conscious attention to allow for more
disparate relationships to emerge. It was also expected that the right hemisphere would
show greater activity in these lower frequency waveforms during the creative story task
based on the findings of Martindale, Hines, Mitchell, and Cove110 (1984). No differences
between the high and low creative group were expected for the math problems.
For the coherence measures, we know from both the Tucker, Dawson, Roth, and
Penland (1985) study and the Petsche, Kaplan, von Stein, and Filz (1997) study that
coherence seems to increase with creative tasks. Tucker et al. report that it increased
specifically in the alpha, theta, and delta bands for a word fluency task. However, neither
study separated participants based on creativity of response. Therefore, it was expected
that coherence would increase for all participants while creating the creative story, but
that this increase would be greater for the more creative group. This would be reflected
in differences in the ANOVA that would use the condensed measure of entire coherence.
Based on Petsche, Kaplan, von Stein, and Filz (1997), it was predicted that there would

not be differences in coherence between the two hemispheres for either group. Petsche et
a1 reported strong coherence between frontal and parietal locations for both hemispheres.
At best, it was predicted that the more creative group might show stronger coherence in
both hemispheres as compared with the less creative group. However, this would be
further support for the predicted results of the first analysis. It was unclear from the past
research whether any differences would exist between anterior and posterior coherence
values. Strong coherences have been found between both frontal and parietal locations
during creative tasks (Tucker et al, 1985; Petsche et al, 1997). Again, the only prediction
was that the more creative group would show stronger coherence at both locations than
the less creative group.
Unique Methods
Stimuli
After recording five minute eyes-closed and five minute eyes-open baseline
EEG, participants were asked to do the following two tasks. The order of the tasks was
randomized across participants. For the first task, they were instructed to think of a
creative story on the topic 'between the lines.' They were instructed to make the story as
creative a possible (see Appendix G for full instructions). After five minutes, the
participants were asked to write the story they had created in their minds. They were
given five more minutes to write the story on paper. EEG was recorded during the time
when the participants were thinking of their story and when they are writing it out. For
the second task, participants were asked to mentally solve moderately difficult math
problems. The math problems were intended to take no more than 30 seconds each to
complete. EEG was recorded for thirty seconds. After 30 seconds, a new problem was
presented.
Data Cleaning
Neurophysiological records must be subjected to inspection for unwanted
electrical artifacts. This data set was first visually inspected for unusual electrical
activity. A participant's record was rejected from further analysis if more than 25% of
the electrical activity within the record was abnormal. This might occur when a
participant displayed excessive muscle activity, or when there was a machine failure.
Beyond visual inspection, all data were smoothed using a Hanning window, which is
necessary to produce the spectral density plot used in further analyses.
Data Analysis
Spectral Analysis
Six frequency bands were analyzed (i.e., high beta, low beta, high alpha, low
alpha, theta, and delta). Power within each frequency band was identified by spectral
analysis using a fast Fourier Transform (FFT). Calculation of power within each
frequency band was completed in SAS Version 8.02 (2001). To calculate power within a
specified frequency band: (a) the frequency band estimate was calculated for all n 1 2
frequencies (n = total data points recorded); (b) the average power within the frequency
range of interest was computed by calculating the mean for all of the frequency band
estimates within each frequency range (i.e., delta, theta, low alpha, high alpha, low beta,
high beta); and (c) the average power within each of the six frequency bands was
appended to a separate data file for use in repeated measures ANOVA analysis. The
description of calculations applies individually to each electrode location used in the
experiment, and was completed on each participant data file for both imagining and
writing the story.
Cross-spectral Analysis
Electrodes were placed over six sites (i.e., frontal, temporal, and parietal for the
left and right hemisphere). These multiple recording sites allowed for coherence analyses.
The similarity in fi-equency bands (i.e., coherence) across the six recording sites was
calculated by condition and then compared. Calculation of coherence within each
frequency band was completed in SAS Version 8.02 (2001). Coherence was analyzed
separately from power.
The result of coherence analysis can be expressed as a cross-spectral density plot,
or as a coherence matrix for each frequency band of interest. The coherence values in a
coherence matrix for a given fi-equency band should follow the same distribution as
Pearson Product Moment correlation values. Therefore, it was necessary to convert the
coherence values using a Fisher's z transformation before subjecting them to fbrther
analysis. To calculate coherence within a specified frequency band: (a) coherence was
calculated for all n / 2 frequencies (n = total data points recorded); (b) the coherence
values were squared; (c) the coherence values were converted using a Fisher's z
transformation (112 log(1 + coherence2) / (1 - coherence2)); (d) average transformed
coherence values within the fi-equency band of interest were computed; and (e) the
average transformed coherence values within each of the six frequency bands was
appended to a separate data file for use in repeated measures ANOVA analysis. The
description of calculations applies individually to each electrode pair used in the

experiment, and was completed on each participant data file for both imagining and
writing the story.
Results
For this first experiment, the between subjects variable used was the ratings of
story originality. Originality ratings were subjected to a median split, and the resulting
two groups were used as the between subjects variable. Originality ratings were used
instead of the composite creativity score because the essential component of this task was
the originality of the stories written by the participants while EEG was recorded. The
composite creativity score did not include originality ratings because of the difference in
task demands between the paper and pencil tasks and the story writing task. Therefore,
use of composite creativity in these analyses would have been suboptimal.
Additional analyses beyond those reported below were conducted to ensure that
no sex differences, differences within a single creativity test, nor differences by
intellectual functioning were better predictors. There were no more valuable differences
discovered for any of these analyses. These analyses are included in Appendix B.
Further exploratory analyses were conducted individually for each frequency
band, as well as for each electrode location. These analyses did not produce results more
elucidating than the main analysis described below, therefore they have not been included
in this dissertation.
Spectral Analysis
The reduced data resulting from the spectral analysis was subjected to a 2
(Activity: Write Story, Imagine Story) x 6 (Frequency Bands: Delta, Theta, Low Alpha,
High Alpha, Low Beta, High Beta) x 2 (Hemisphere) x 3 (Electrode Location) repeated
measures analysis with Originality Group entered as a between subjects variable. Results
from the analyses are shown in Table 2. Of particular interest to this report are the results
including Originality Group. The effect for Activity x Hemisphere x Originality Group
was statistically significant (E(1,50) = 6.1 1, p < .02). This result was due to a difference
between the High Originality Group and the Low Originality Group while writing the
story versus imagining the story. The High Originality Group shows higher spectral
densities while imaging the story (hllert = .028, Kght = .031) versus while writing the
story (Mlert = .017, aght = .018). In contrast, the Low Originality Group shows
essentially the same spectral densities while imagining the story (Mlefi = .038, Mright =
.038) versus while writing the story (MI,* = .033, = .036). In both the high and low
originality groups, when there is a difference across hemispheres it is accounted for by
lower left hemisphere activation than right hemisphere activation. This difference
accounts for the value of Hemisphere in this interaction. This relationship is shown in
Figure 1.
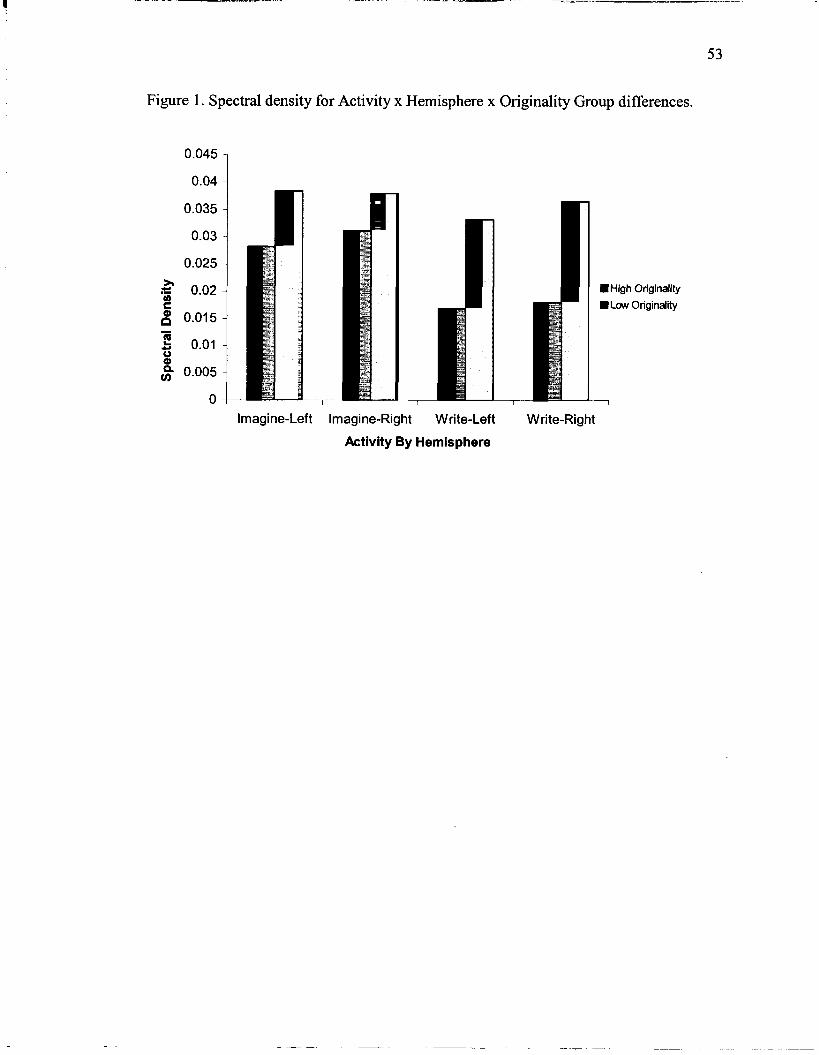
Figure 1. Spectral density for Activity x Hemisphere x Originality Group differences.
Imagine-Left Imagine-Right Write-Left Write-Right
Activity By Hemisphere
DHigh Originality
L o w Originality
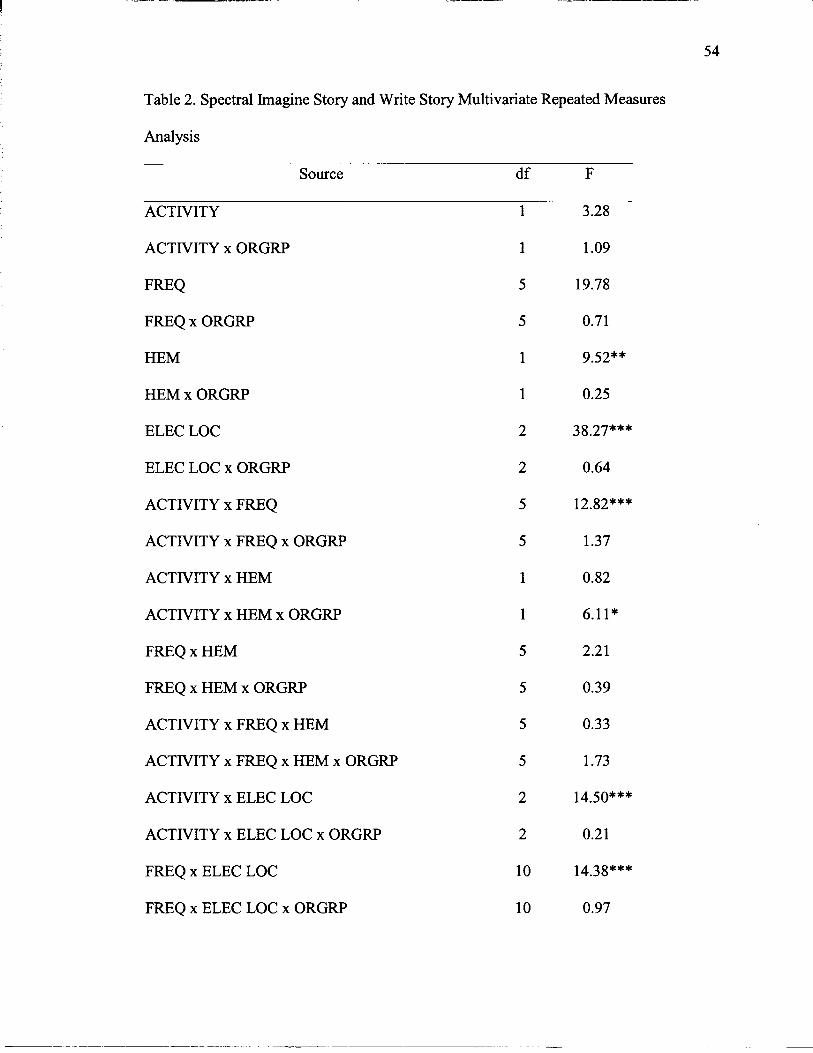
Table 2. Spectral Imagine Story and Write Story Multivariate Repeated Measures
Analysis
ACTIVITY
ACTIVITY x ORGRP
FREQ
FREQ x ORGRP
HEM
HEM x ORGRP
ELEC LOC
ELEC LOC x ORGRP
ACTIVITY x FREQ
ACTIVITY x FREQ x ORGRP
ACTIVITY x HEM
ACTIVITY x HEM x ORGRP
FREQ x HEM
FREQ x HEM x ORGRP
ACTIVITY x FREQ x HEM
ACTIVITY x FREQ x HEM x ORGRP
ACTIVITY x ELEC LOC
ACTIVITY x ELEC LOC x ORGRP
FREQ x ELEC LOC
FREQ x ELEC LOC x ORGRP
Source d f F
3.28
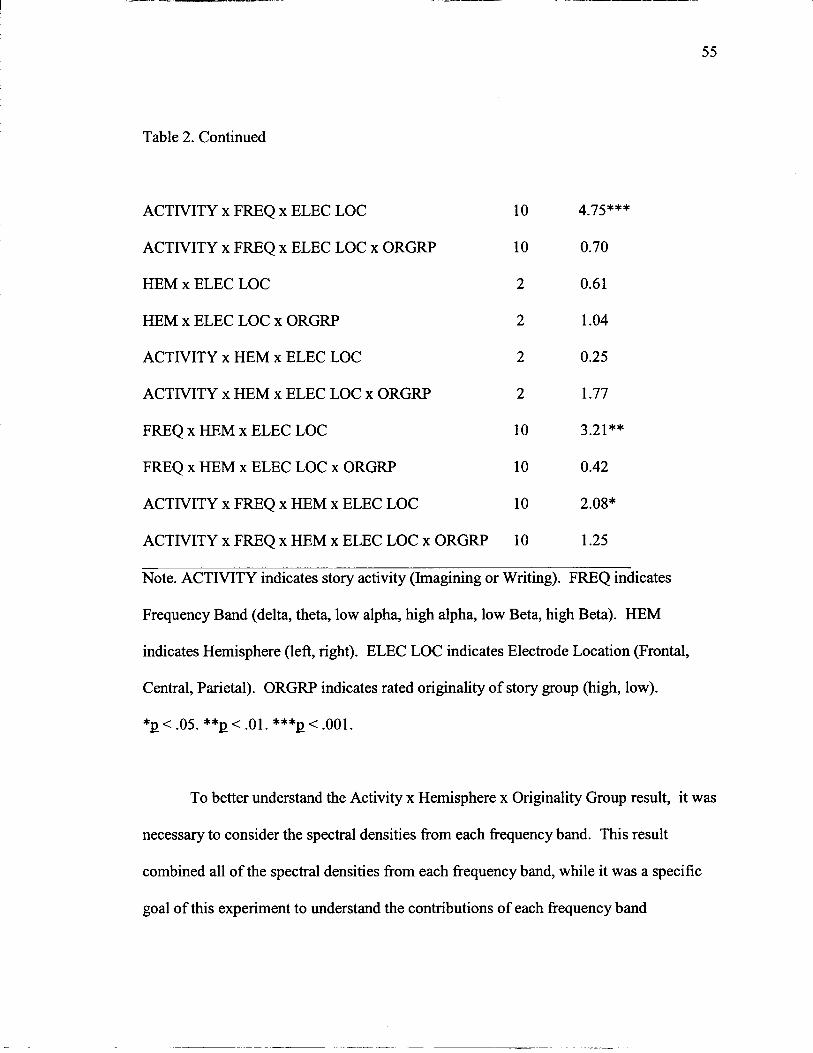
Table 2. Continued
ACTIVITY x FREQ x ELEC LOC
ACTIVITY x FREQ x ELEC LOC x ORGRP
HEM x ELEC LOC
HEM x ELEC LOC x ORGRP
ACTIVITY x HEM x ELEC LOC
ACTIVITY x HEM x ELEC LOC x ORGRP
FREQ x HEM x ELEC LOC
FREQ x HEM x ELEC LOC x ORGRP
ACTIVITY x FREQ x HEM x ELEC LOC
ACTIVITY x FREQ x HEM x ELEC LOC x ORGRP
Note. ACTIVITY indicates story activity (Imagining or Writing). FREQ indicates
Frequency Band (delta, theta, low alpha, high alpha, low Beta, high Beta). HEM
indicates Hemisphere (left, right). ELEC LOC indicates Electrode Location (Frontal,
Central, Parietal). ORGRP indicates rated originality of story group (high, low).
*E < .05. **E < .01. ***E < .001.
To better understand the Activity x Hemisphere x Originality Group result, it was
necessary to consider the spectral densities from each frequency band. This result
combined all of the spectral densities from each frequency band, while it was a specific
goal of this experiment to understand the contributions of each frequency band
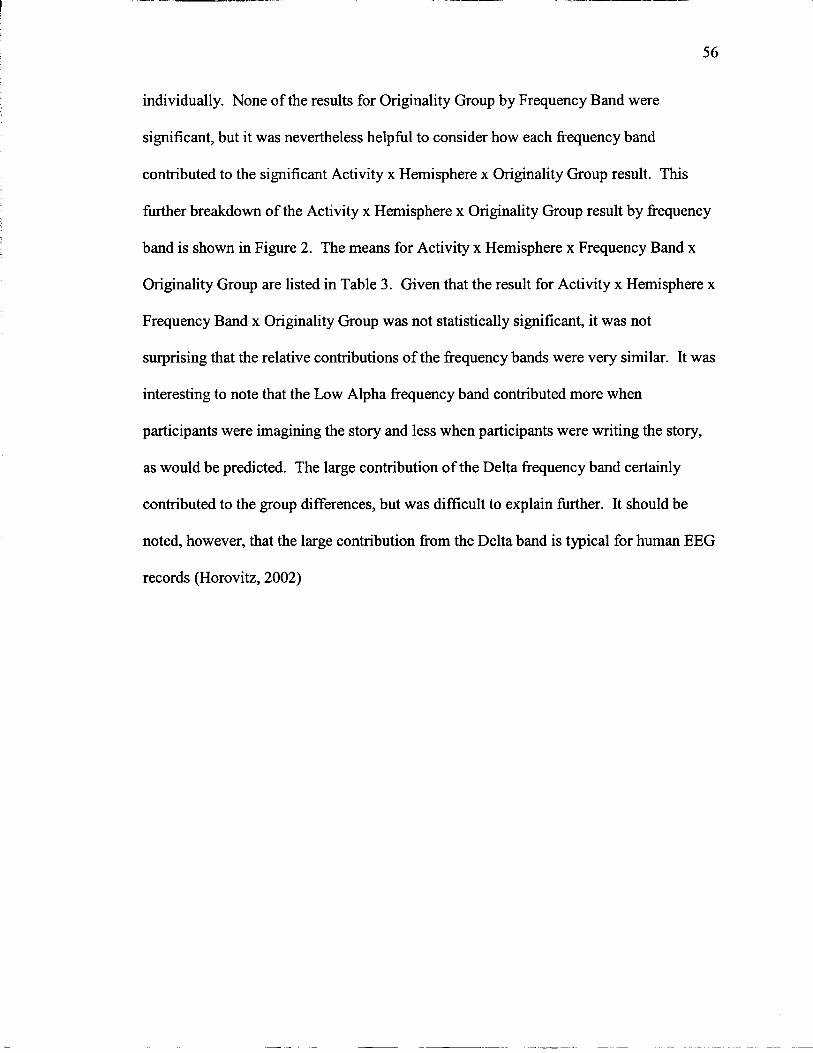
individually. None of the results for Originality Group by Frequency Band were
significant, but it was nevertheless helpful to consider how each frequency band
contributed to the significant Activity x Hemisphere x Originality Group result. This
further breakdown of the Activity x Hemisphere x Originality Group result by fiequency
band is shown in Figure 2. The means for Activity x Hemisphere x Frequency Band x
Originality Group are listed in Table 3. Given that the result for Activity x Hemisphere x
Frequency Band x Originality Group was not statistically significant, it was not
surprising that the relative contributions of the frequency bands were very similar. It was
interesting to note that the Low Alpha frequency band contributed more when
participants were imagining the story and less when participants were writing the story,
as would be predicted. The large contribution of the Delta frequency band certainly
contributed to the group differences, but was difficult to explain further. It should be
noted, however, that the large contribution from the Delta band is typical for human EEG
records (Horovitz, 2002)
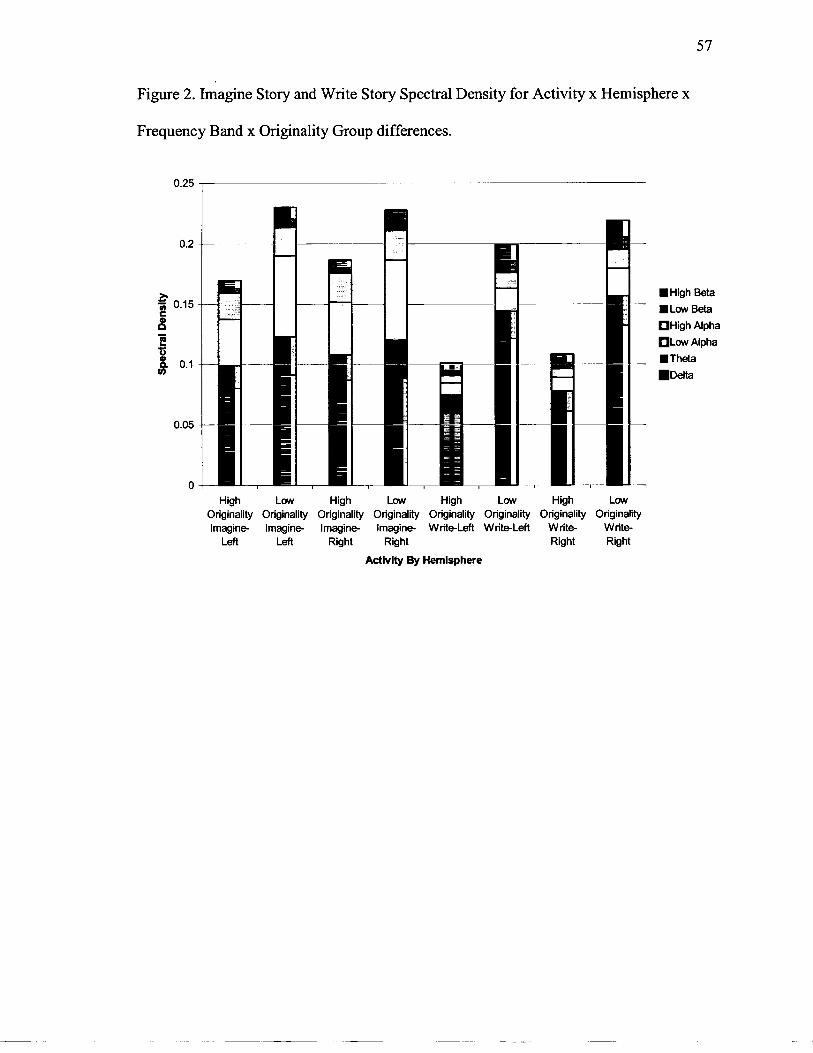
Figure 2. Imagine Story and Write Story Spectral Density for Activity x Hemisphere x
Frequency Band x Originality Group differences.
High Low High Low High Low High Low Originality Originality Originality Originality Originality Originality Originality Originality imagine Imagine lmagine Imagine- WriteLefl WriteLeft Write Write
Lefl Lefl Right Right Right Right
Activity By Hemisphere
W High Beta -
W Low Beta
High Alpha
Low Alpha
- W Theta Delta
Table 3. Imagine Story and Write Story Mean Spectral Densities for Activity x
Frequency x Hemisphere x Originality Group
Originality
Activity Frequency Hemisphere High
Write Delta Left 0.059
Right 0.061
Theta Left 0.015
Right 0.017
Low Alpha Left 0.010
Right 0.012
High Alpha Left 0.006
Right 0.007
Low Beta Left 0.004
Right 0.005
High Beta Left 0.007
Right 0.007
Imagine Delta Left 0.080
Right 0.087
Theta Left 0.019
Right 0.021
Low Alpha Left 0.038
Right 0.044
Low
0.121
0.132
0.023
0.024
0.019
0.023
0.013
0.01 5
0.010
0.01 1
0.013
0.01 3
0.091
0.088
0.032
0.032
0.067
0.066
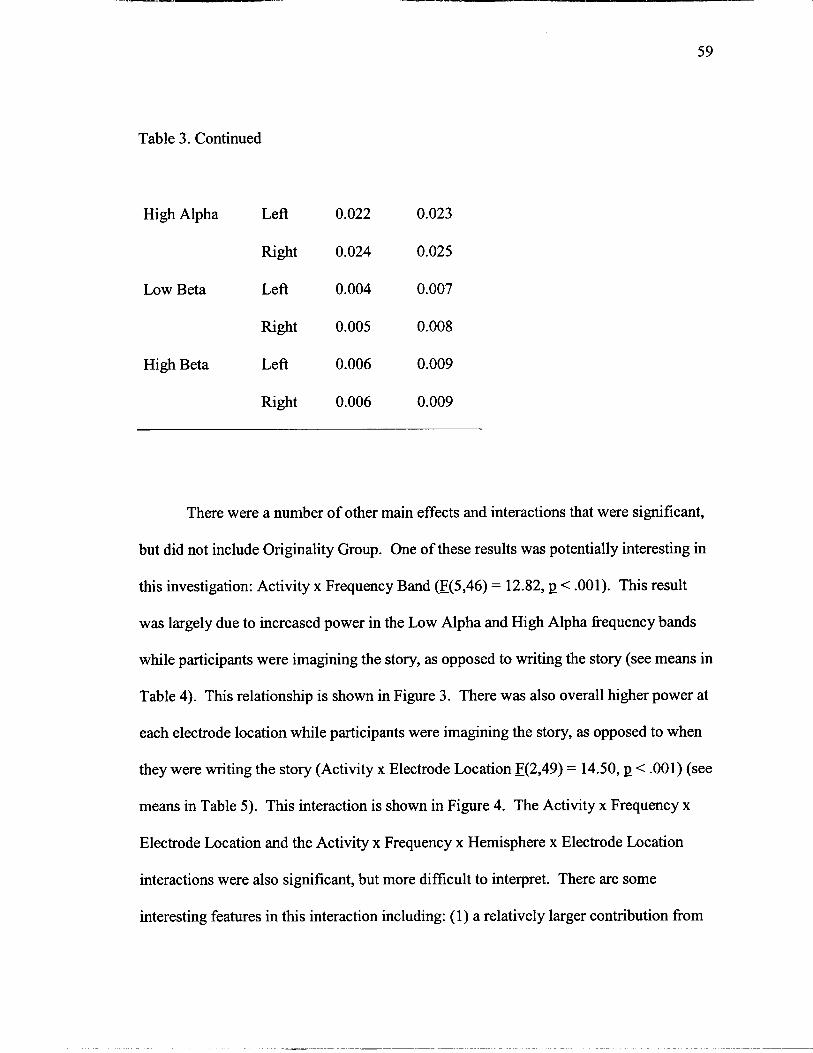
Table 3. Continued
High Alpha Left 0.022 0.023
Right 0.024 0.025
Low Beta Left 0.004 0.007
Right 0.005 0.008
High Beta Left 0.006 0.009
Right 0.006 0.009
There were a number of other main effects and interactions that were significant,
but did not include Originality Group. One of these results was potentially interesting in
this investigation: Activity x Frequency Band (F(5,46) = 12.82, p < .001). This result
was largely due to increased power in the Low Alpha and High Alpha frequency bands
while participants were imagining the story, as opposed to writing the story (see means in
Table 4). This relationship is shown in Figure 3. There was also overall higher power at
each electrode location while participants were imagining the story, as opposed to when
they were writing the story (Activity x Electrode Location E(2,49) = 14.50, p < .001) (see
means in Table 5). This interaction is shown in Figure 4. The Activity x Frequency x
Electrode Location and the Activity x Frequency x Hemisphere x Electrode Location
interactions were also significant, but more difficult to interpret. There are some
interesting features in this interaction including: (1) a relatively larger contribution from

the delta frequency band as compared to the other five frequency bands, (2) greater delta
and theta activity measured at frontal electrode locations as compared to central and
parietal electrode locations, (3) greater low alpha and high alpha activity measured at
parietal locations as compared to central and frontal locations, (4) greater overall
activation in the theta, low alpha, and high alpha frequency bands while participants were
imagining a story as compared to when they were writing a story, and (5) a consistent
pattern across all frequencies showing greater right hemisphere activation than left
hemisphere activation when activation is summed across all electrode locations. The
means for these interactions are shown in Table 6, and these relationships are displayed
graphically in Figure 5.
Figure 3. Write Story and Imagine Story Spectral Density for Activity x Frequency Band
differences.
- -requency
~ e l t a
Theta
L O W Alpha
I High Alpha
Low Beta
0 ~ i ~ h Beta Write Story Imagine Story
Activity
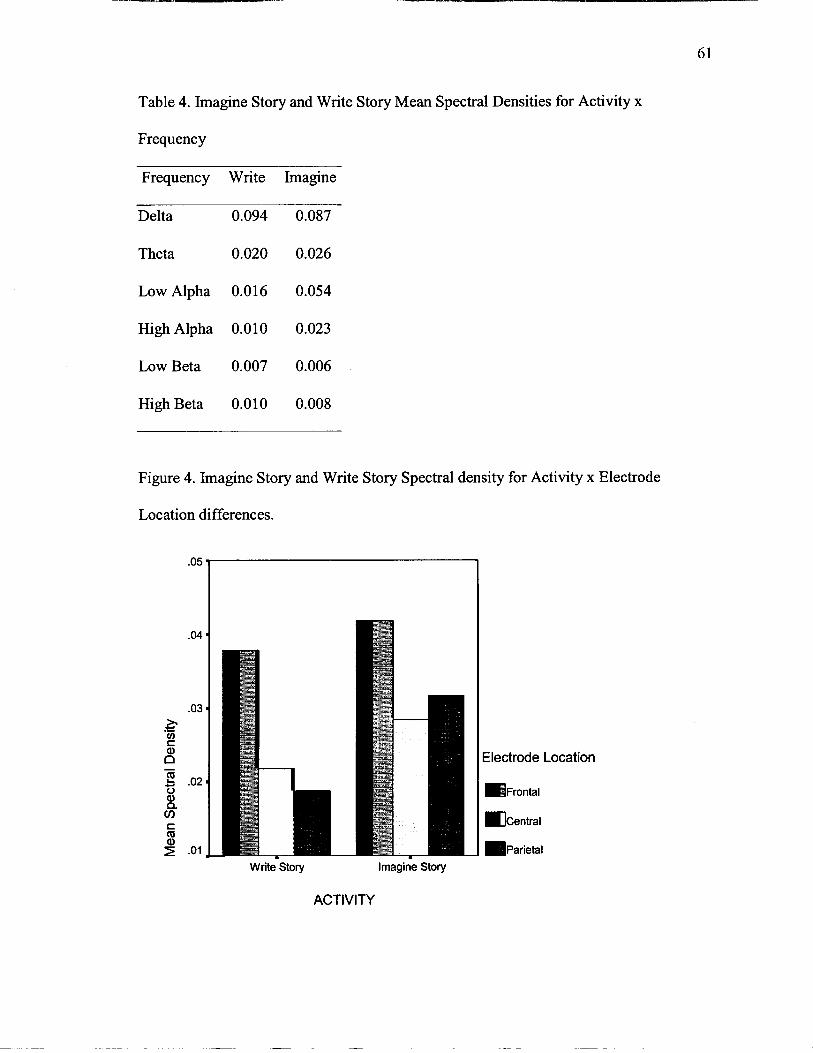
Table 4. Imagine Story and Write Story Mean Spectral Densities for Activity x
Frequency
Frequency Write Imagine
Delta 0.094 0.087
Theta 0.020 0.026
Low Alpha 0.016 0.054
High Alpha 0.010 0.023
Low Beta 0.007 0.006
High Beta 0.010 0.008
Figure 4. Imagine Story and Write Story Spectral density for Activity x Electrode
Location differences.
Write Story Imagine Story
ACTIVITY
Electrode Location
Frontal
m e n t r a i
-parietal
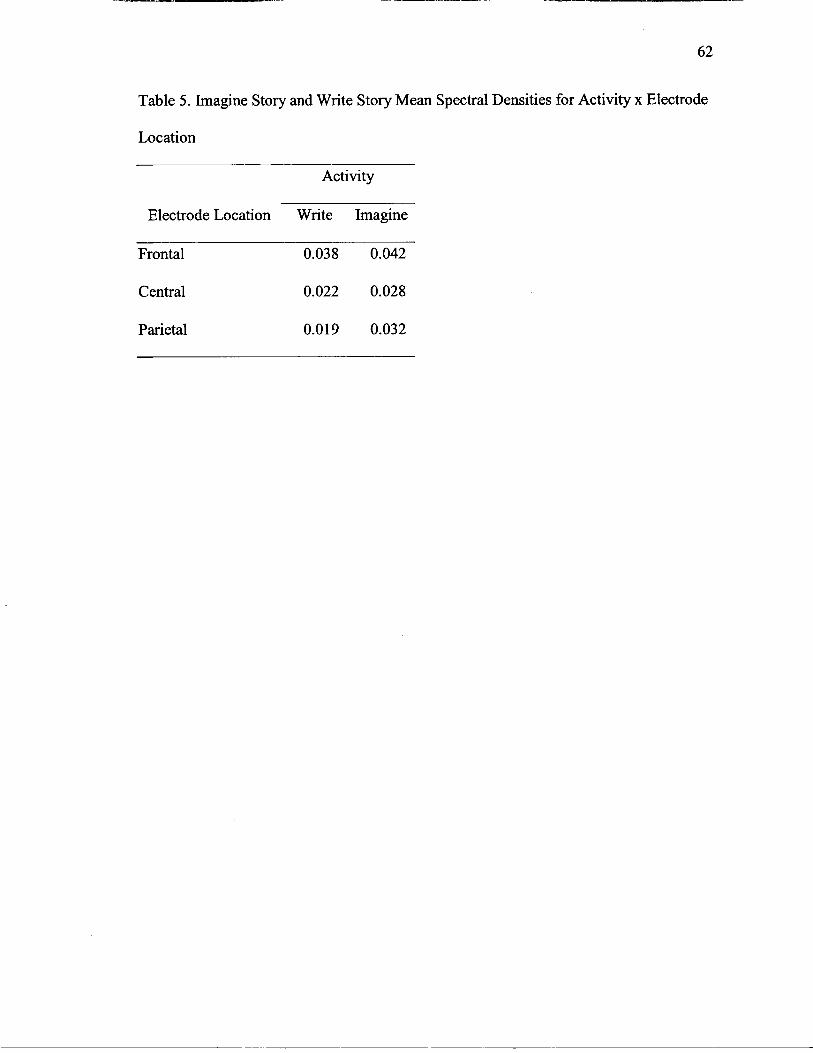
Table 5. Imagine Story and Write Story Mean Spectral Densities for Activity x Electrode
Location
Activity
Electrode Location Write Imagine
Frontal
Central
Parietal
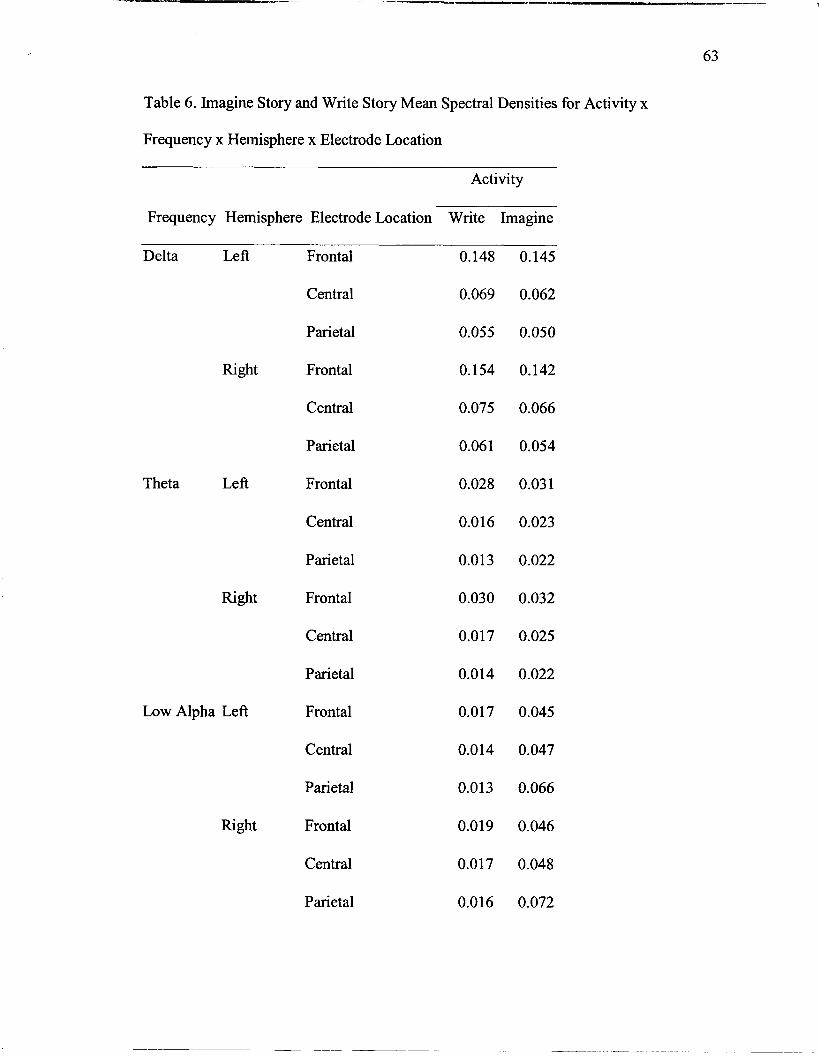
63
Table 6. Imagine Story and Write Story Mean Spectral Densities for Activity x
Frequency x Hemisphere x Electrode Location
Activity
Frequency Hemisphere Electrode Location Write Imagine
Delta Lefi Frontal
Central
Parietal
Right Frontal
Central
Parietal
Theta Le fi Frontal
Central
Parietal
Right Frontal
Central
Parietal
Low Alpha Left Frontal
Central
Parietal
Right Frontal
Central
Parietal
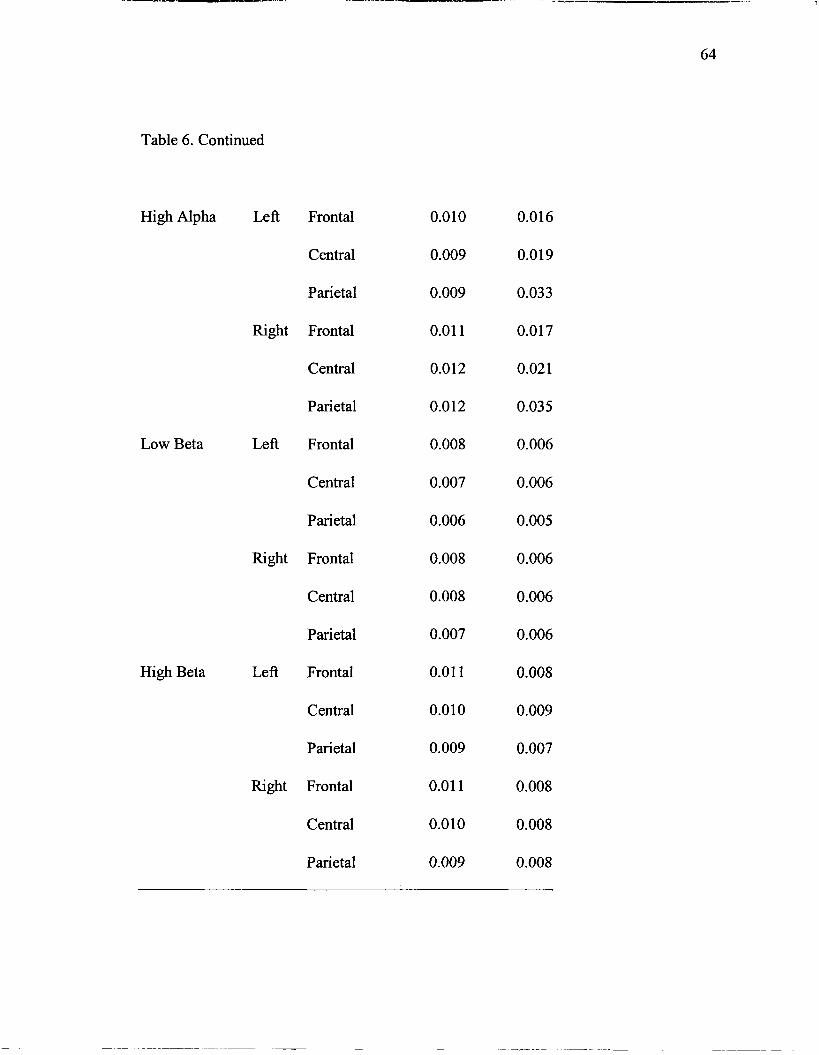
Table 6. Continued
High Alpha
Low Beta
High Beta
Left Frontal
Central
Parietal
Right Frontal
Central
Parietal
Left Frontal
Central
Parietal
Right Frontal
Central
Parietal
Left Frontal
Central
Parietal
Right Frontal
Central
Parietal
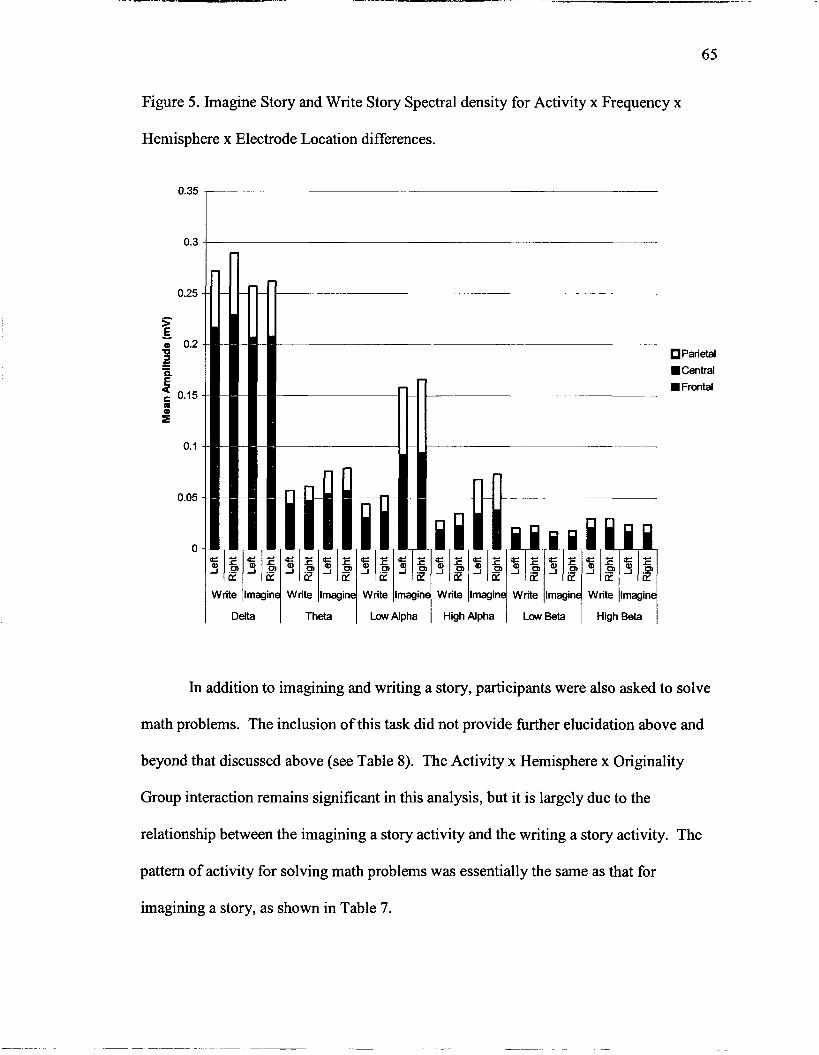
Figure 5. Imagine Story and Write Story Spectral density for Activity x Frequency x
Hemisphere x Electrode Location differences.
Parietal
W Central
W"e 1magin1 w" ~maginj Wite magin1
Delta Theta Low Alpha
Write Ilmagind, W"te 11rnaginI W"te 11maginI
HighAlpha LowBeta HighBeta
In addition to imagining and writing a story, participants were also asked to solve
math problems. The inclusion of this task did not provide firrther elucidation above and
beyond that discussed above (see Table 8). The Activity x Hemisphere x Originality
Group interaction remains significant in this analysis, but it is largely due to the
relationship between the imagining a story activity and the writing a story activity. The
pattern of activity for solving math problems was essentially the same as that for
imagining a story, as shown in Table 7.
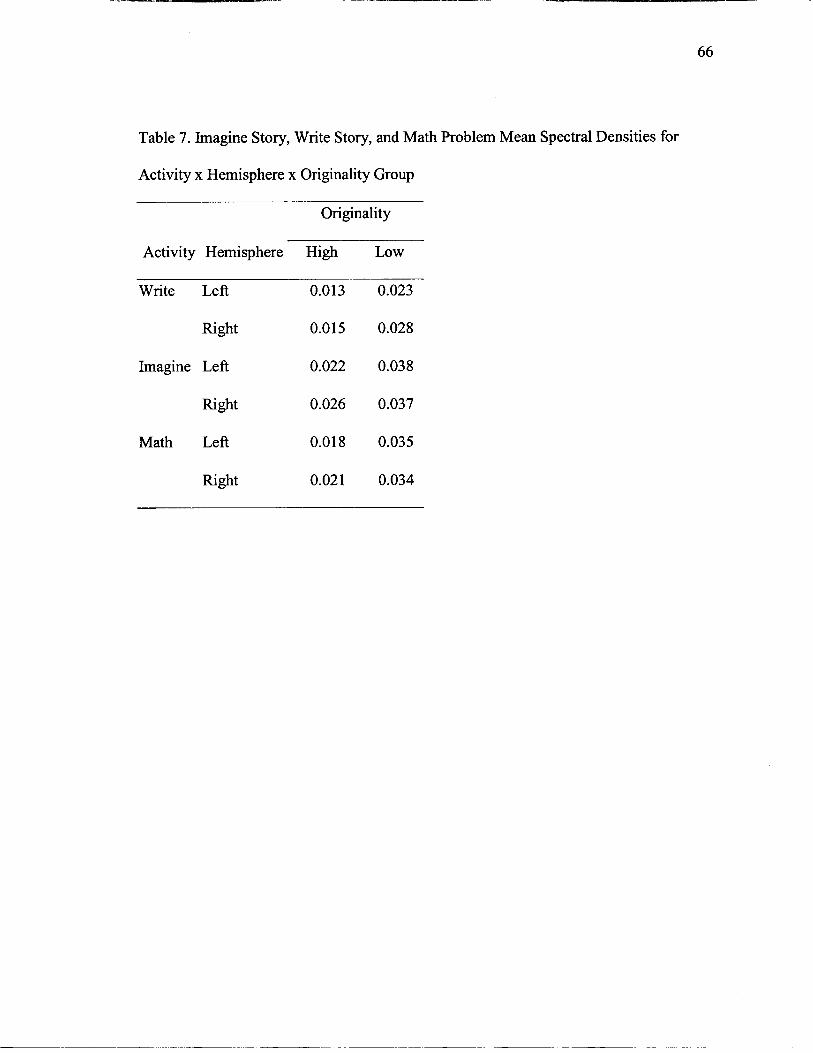
Table 7. Imagine Story, Write Story, and Math Problem Mean Spectral Densities for
Activity x Hemisphere x Originality Group
Originality
Activity Hemisphere High Low
Write Left 0.013 0.023
Right 0.015 0.028
Imagine Left 0.022 0.038
Right 0.026 0.037
Math Left 0.018 0.035
Right 0.021 0.034
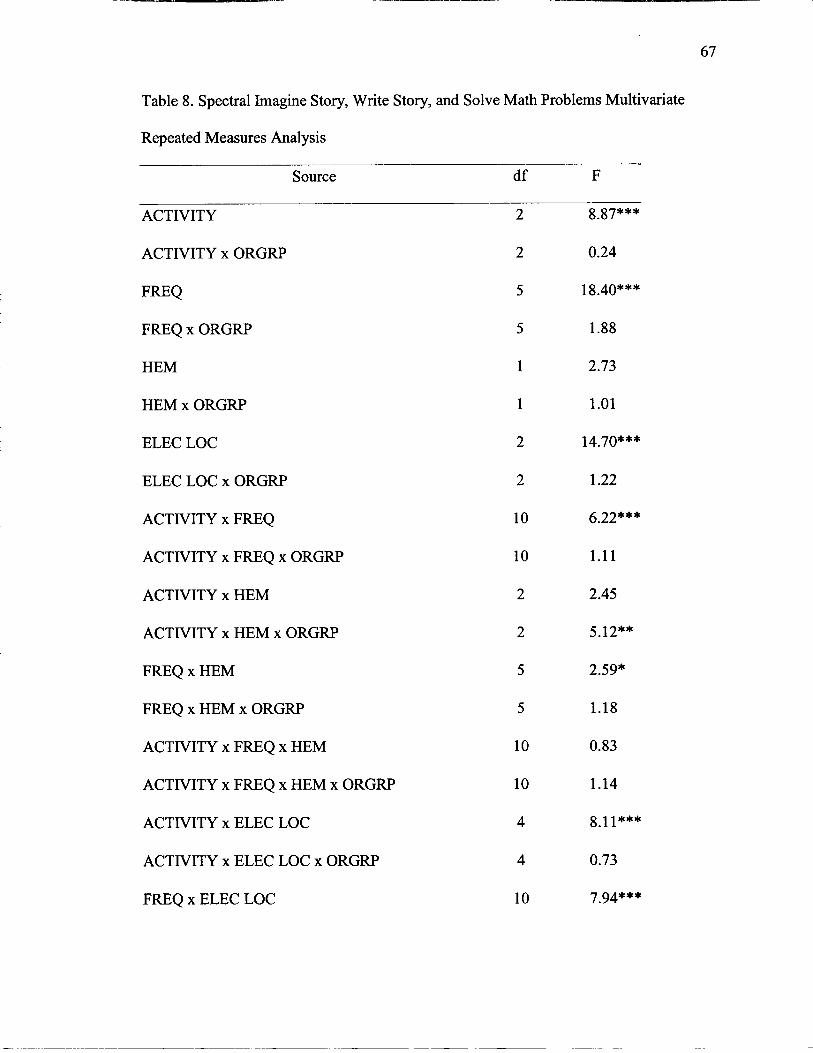
Table 8. Spectral Imagine Story, Write Story, and Solve Math Problems Multivariate
Repeated Measures Analysis
Source d f F
ACTIVITY
ACTIVITY x ORGRP
FREQ
FREQ x ORGRP
HEM
HEM x ORGRP
ELEC LOC
ELEC LOC x ORGRP
ACTIVITY x FREQ
ACTIVITY x FREQ x ORGRP
ACTIVITY x HEM
ACTIVITY x HEM x ORGRP
FREQ x HEM
FREQ x HEM x ORGRP
ACTIVITY x FREQ x HEM
ACTIVITY x FREQ x HEM x ORGRP
ACTIVITY x ELEC LOC
ACTIVITY x ELEC LOC x ORGRP
FREQ x ELEC LOC

Table 8. Continued
FREQ x ELEC LOC x ORGRP
ACTIVITY x FREQ x ELEC LOC
ACTIVITY x FREQ x ELEC LOC x ORGRP
HEM x ELEC LOC
HEM x ELEC LOC x ORGRP
ACTIVITY x HEM x ELEC LOC
ACTIVITY x HEM x ELEC LOC x ORGRP
FREQ x HEM x ELEC LOC
FREQ x HEM x ELEC LOC x ORGRP
ACTIVITY x FREQ x HEM x ELEC LOC
ACTIVITY x FREQ x HEM x ELEC LOC x ORGRP
Note. ACTIVITY indicates story activity (Imagining or Writing) and math problem
solving. FREQ indicates Frequency Band (delta, theta, low alpha, high alpha, low Beta,
high Beta). HEM indicates Hemisphere (left, right). ELEC LOC indicates Electrode
Location (Frontal, Central, Parietal). ORGRP indicates rated originality of story group
(high, low).
*g < .05. **p < .01. ***g < .001.
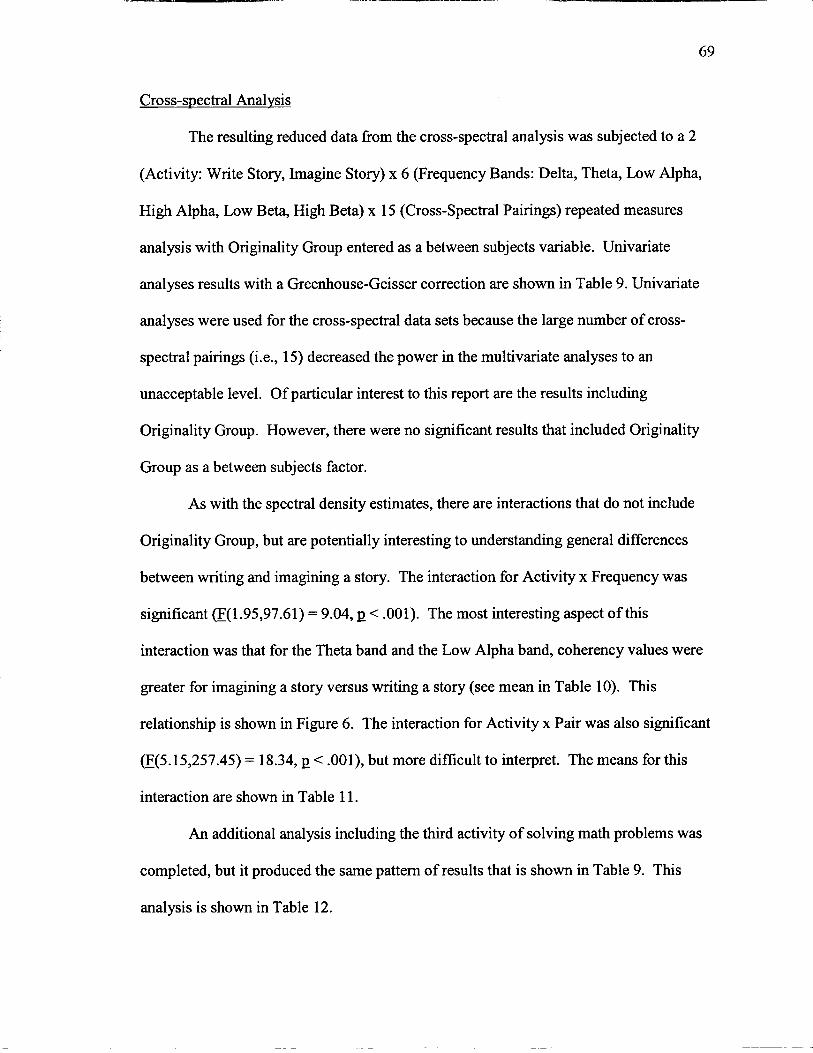
Cross-spectral Analysis
The resulting reduced data from the cross-spectral analysis was subjected to a 2
(Activity: Write Story, Imagine Story) x 6 (Frequency Bands: Delta, Theta, Low Alpha,
High Alpha, Low Beta, High Beta) x 15 (Cross-Spectral Pairings) repeated measures
analysis with Originality Group entered as a between subjects variable. Univariate
analyses results with a Greenhouse-Geisser correction are shown in Table 9. Univariate
analyses were used for the cross-spectral data sets because the large number of cross-
spectral pairings (i.e., 15) decreased the power in the multivariate analyses to an
unacceptable level. Of particular interest to this report are the results including
Originality Group. However, there were no significant results that included Originality
Group as a between subjects factor.
As with the spectral density estimates, there are interactions that do not include
Originality Group, but are potentially interesting to understanding general differences
between writing and imagining a story. The interaction for Activity x Frequency was
significant (l?(1.95,97.61) = 9.04, E < .001). The most interesting aspect of this
interaction was that for the Theta band and the Low Alpha band, coherency values were
greater for imagining a story versus writing a story (see mean in Table 10). This
relationship is shown in Figure 6. The interaction for Activity x Pair was also significant
(F(5.15,257.45) = 18.34, p < .001), but more difficult to interpret. The means for this
interaction are shown in Table 1 1.
An additional analysis including the third activity of solving math problems was
completed, but it produced the same pattern of results that is shown in Table 9. This
analysis is shown in Table 12.
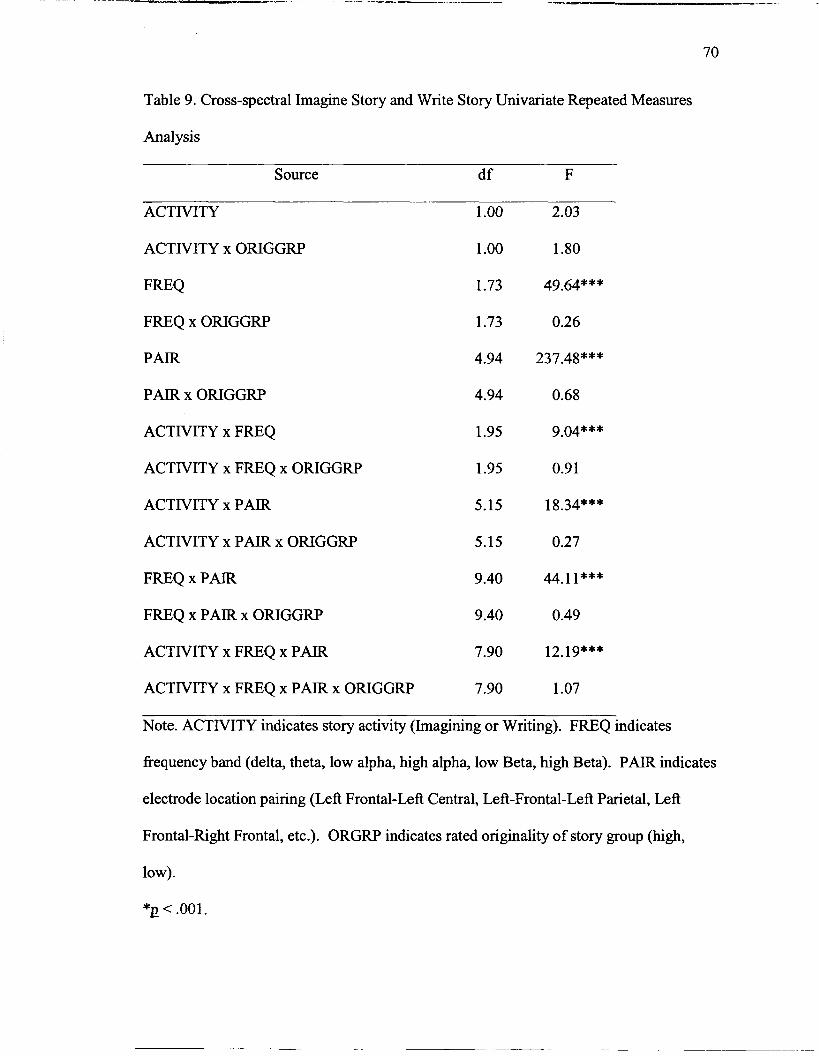
Table 9. Cross-spectral Imagine Story and Write Story Univariate Repeated Measures
Analysis
Source d f F
ACTIVITY
ACTIVITY x ORIGGRP
FREQ
FREQ x ORIGGRP
PAIR
PAIR x ORIGGRP
ACTIVITY x FREQ
ACTIVITY x FREQ x ORIGGRP
ACTIVITY x PAIR
ACTIVITY x PAIR x ORIGGRP
FREQ x PAIR
FREQ x PAIR x ORIGGRP
ACTIVITY x FREQ x PAIR
ACTIVITY x FREQ x PAIR x ORIGGRP
Note. ACTIVITY indicates story activity (Imagining or Writing). FREQ indicates
frequency band (delta, theta, low alpha, high alpha, low Beta, high Beta). PAIR indicates
electrode location pairing (Left Frontal-Left Central, Left-Frontal-Left Parietal, Left
Frontal-hght Frontal, etc.). ORGRP indicates rated originality of story group (high,
low).
*p < .001.
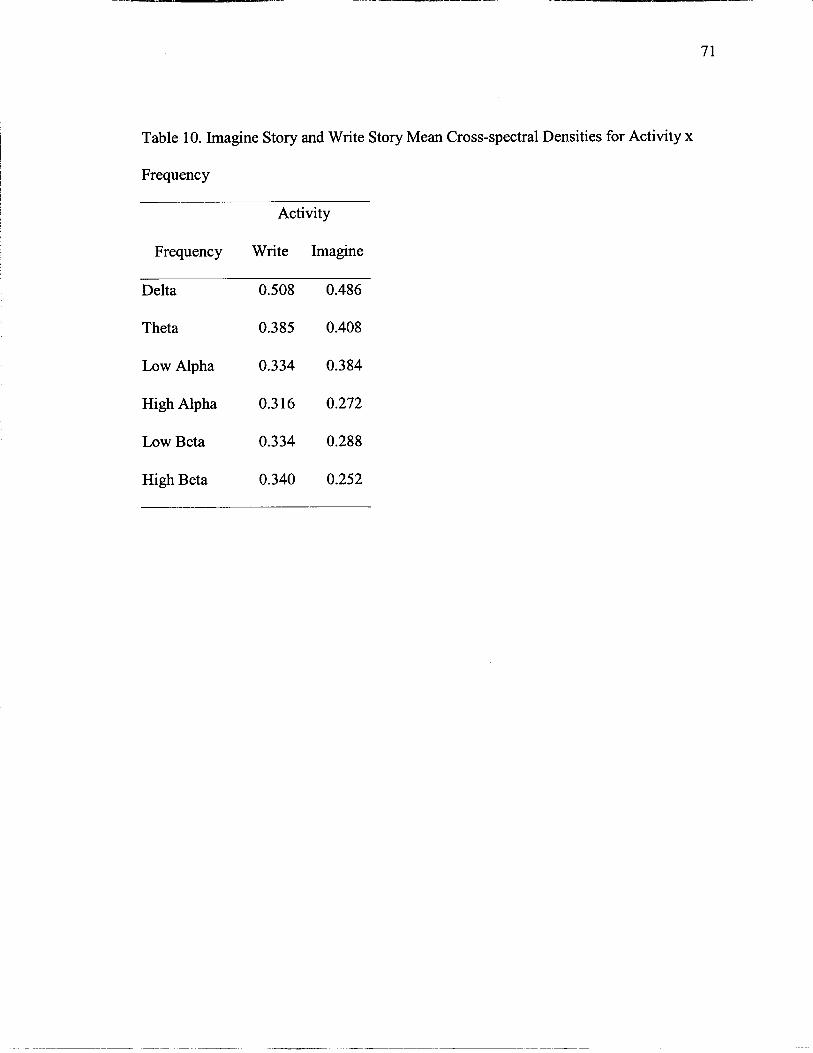
Table 10. Imagine Story and Write Story Mean Cross-spectral Densities for Activity x
Frequency
Activity
Frequency Write Imagine
Delta 0.508 0.486
Theta 0.385 0.408
Low Alpha 0.334 0.384
High Alpha 0.316 0.272
Low Beta 0.334 0.288
High Beta 0.340 0.252
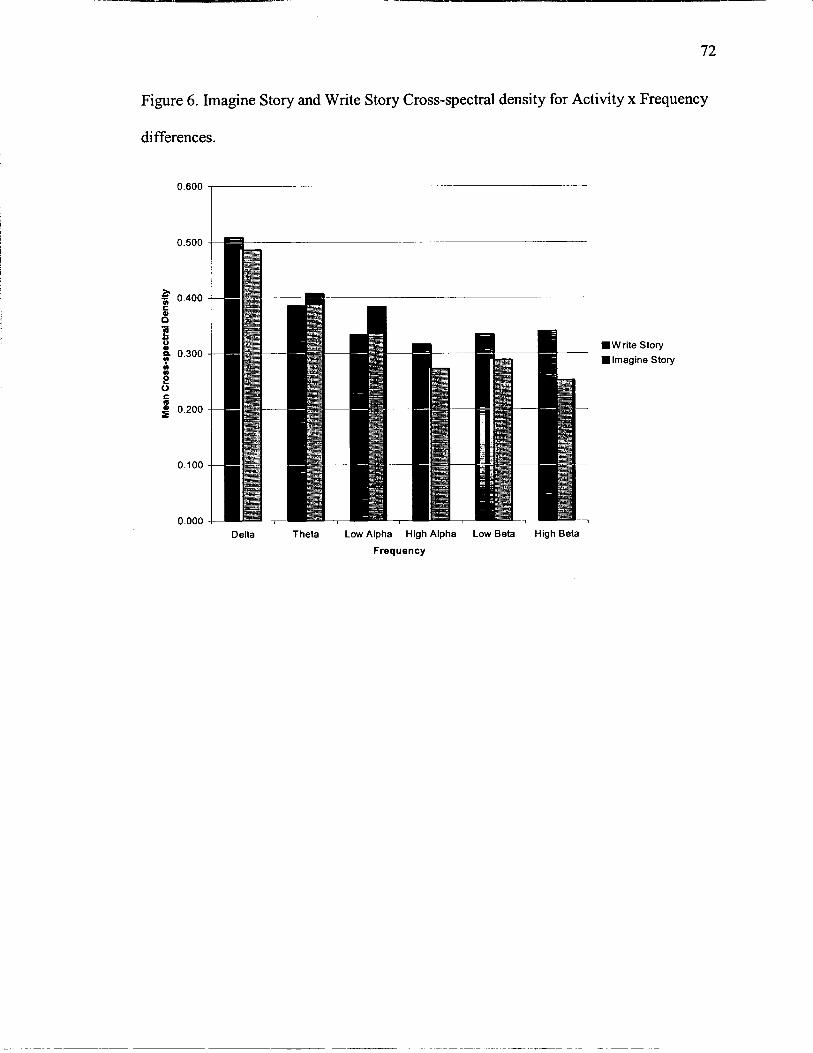
Figure 6. Imagine Story and Write Story Cross-spectral density for Activity x Frequency
differences.
Delta Theta Low Alpha High Alpha Low Beta High Beta
Frequency
I W rite Story
l Imagine Story
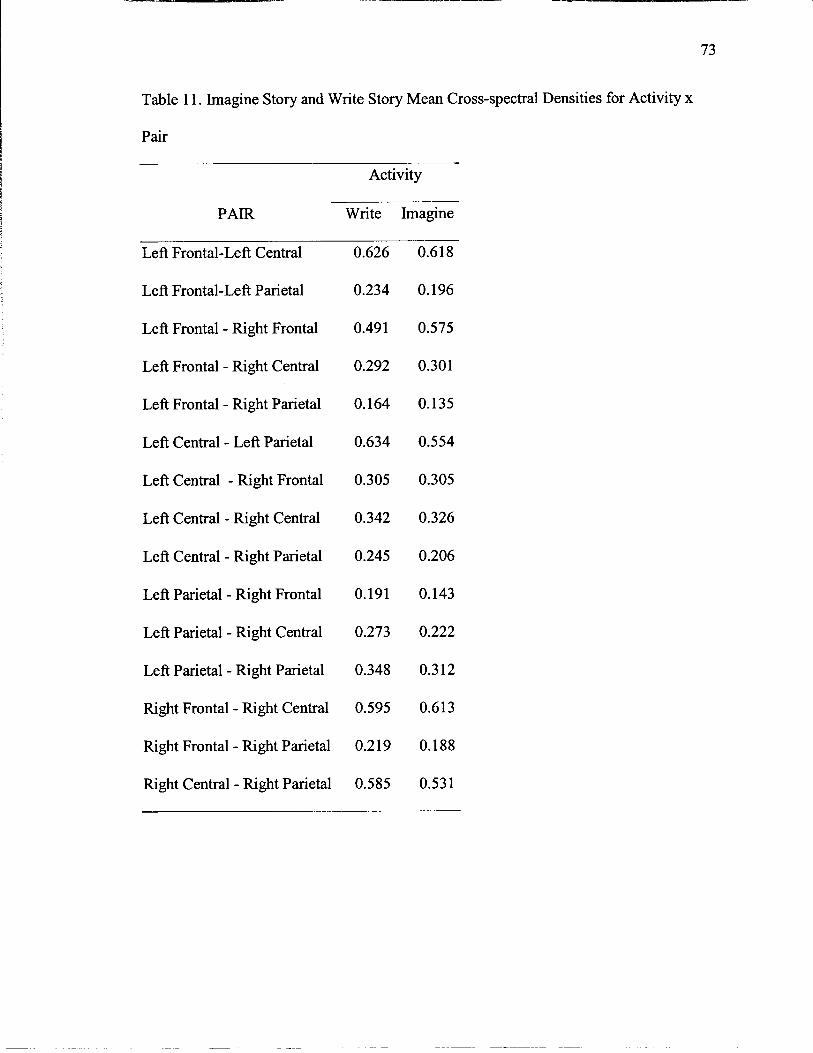
Table 1 1. Imagine Story and Write Story Mean Cross-spectral Densities for Activity x
Pair
Activity
PAIR Write Imagine
Left Frontal-Left Central
Left Frontal-Left Parietal
Left Frontal - Right Frontal
Left Frontal - Right Central
Left Frontal - Right Parietal
Left Central - Left Parietal
Left Central - Right Frontal
Left Central - Right Central
Left Central - Right Parietal
Left Parietal - Right Frontal
Left Parietal - Right Central
Left Parietal - Right Parietal
Right Frontal - Right Central
Right Frontal - Right Parietal
Right Central - Right Parietal
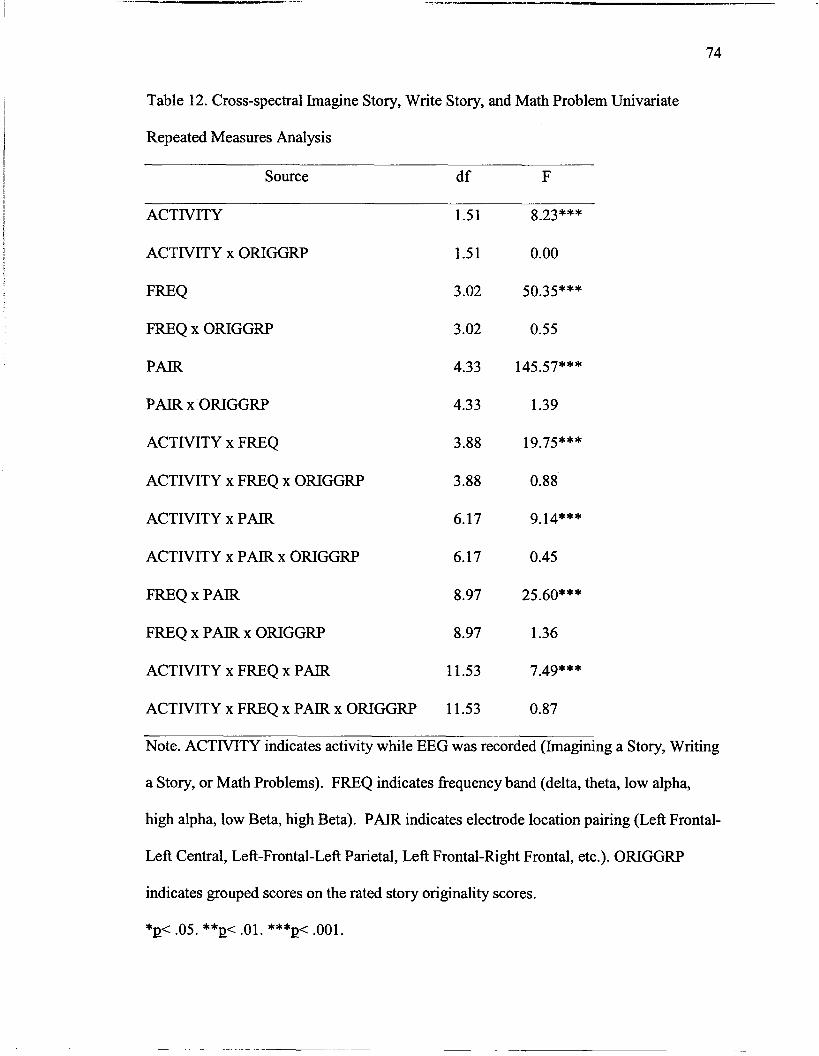
Table 12. Cross-spectral Imagine Story, Write Story, and Math Problem Univariate
Repeated Measures Analysis
Source
ACTIVITY
ACTIVITY x ORIGGRP
FREQ
FREQ x ORIGGRP
PAIR
PAIR x ORIGGRP
ACTIVITY x FREQ
ACTIVITY x FREQ x ORIGGRP
ACTIVITY x PAIR
ACTIVITY x PAIR x ORIGGRP
FREQ x PAIR
FREQ x PAIR x ORIGGRP
ACTIVITY x FREQ x PAIR
ACTIVITY x FREQ x PAIR x ORIGGRP
Note. ACTIVITY indicates activity while EEG was recorded (Imagining a Story, Writing
a Story, or Math Problems). FREQ indicates frequency band (delta, theta, low alpha,
high alpha, low Beta, high Beta). PAIR indicates electrode location pairing (Left Frontal-
Left Central, Left-Frontal-Left Parietal, Left Frontal-Right Frontal, etc.). ORIGGRP
indicates grouped scores on the rated story originality scores.
*p< .05. **p< .01. ***p< .001.

Discussion
Experiment one investigated differences in people's brain wave activity when
they were thinking of a creative story, when they were writing the creative story, and
when they were solving math problems. Brain wave activity was operationalized as the
calculated spectral density and the cross-spectral density (coherence) of the digitally
sampled continuous signal. Brain wave activity was recorded from three electrode sites
(frontal, central, parietal) in each hemisphere (left, right). Most of the previous research
of the relationship between brain wave activity during creative tasks used a mechanical
filtering technique to identify the presence of alpha wave activity (e.g., Martindale &
Hines, 1975; Martindale & Hasenfus, 1978). This technique is less accurate than spectral
density, and limits the number of fi-equency bands that can be identified. By using
spectral density as the technique to capture estimates of frequency band activity, this
study was able to compare activity in multiple frequency bands. This previous research
also used no more than two electrode recording sites, which greatly limited conclusions
about hemispheric or frontal-parietal relationships, whereas this study can draw
conclusions about both.
For this experiment, the addition of electrode sites did not affect results that
included Originality Group as a between subjects variable. The only significant result
including Originality Group was Activity (Imagine Story or Write Story) x Hemisphere x
Originality Group, as shown in Figure 1. This result was somewhat difficult to interpret
because it combined the spectral density estimates for all of the frequency bands (see
Figure 2). However, it was clear that while the High Originality group showed variable
patterns of activation between imaging the story, and writing the story, the Low
Originality Group showed essentially the same pattern of activation while imagining and
writing the story. This fits with theories of creativity that suggest more creative
individuals will vary their cognitive state to best match a given task.
The use of spectral analysis, as opposed to a mechanical filtering technique, to
isolate activity within particular frequency bands produced results different than would
be predicted fi-om earlier research. Alpha band activity did not differentiate the High
Originality group from the Low Originality group, as it had differentiated more and less
creative participants in past research (e.g., Martindale & Hines, 1975; Martindale &
Hasenfus, 1978). However, it was true that there were differential patterns of activation
by frequency band for all participants when they were imagining the story versus writing
the story (see Figure 3). This fits with Wallas's (1926) stages of creative production
discussed in the introduction. Martindale and Hasenfus (1978) compared the last two
stages of creative production using the same story creation task as this experiment. They
proposed that the illumination phase, where creation occurs, could be measured through
EEG while participants imagined a story, and that the elaboration phase, where
verification occurs, could be measured while participants wrote the story they had just
imagined. In Martindale and Hasenfus's study, they found higher alpha indices only for
highly creative participants during the illumination phase (i.e., while imagining the
story). While this experiment did not replicate Martindale and Hasenfus's results for
differences by creativity group, it did show that overall there was more activity in the
alpha bands while participants were imagining the story as opposed to writing the story
(see Figure 3).

This experiment confirmed the general relationship between creative potential, as
measured by rated story originality, and cognitive state. Participants who received higher
ratings for the originality of their written story did show a more flexible pattern of
activation across the two tasks, imagining a story and writing a story. This experiment
could be improved by challenging participants to purposefully oscillate between the two
types of activities (imagining and writing) more than once. It would be interesting to
investigate the consistency of these patterns across a number of activities. It would also
be helpful to combine EEG measurement techniques with other brain imaging techniques
such as fMRI and PET Scan. The combination of methods would clarify the
relationships found here, as well as lend credence to the overall thesis that creative
potential influences cognitive functioning on creative tasks.
Experiment Two
Hvpotheses
This experiment used the odd-ball task, described in the introduction, to
investigate individual differences in response to novel and unexpected stimuli. Given the
results fiom preliminary research, it seemed likely that more creative participants would
again show differential NlOO and P300 amplitudes. It was predicted that these
differences would exist across all electrode sites, with greater amplitudes measured for
the more creative participants. Alexander et al. (1996) report that P300 amplitude to an
auditory odd-ball task was larger over the right anteriorlmedial locations for a sample of
80 right-handed males. Therefore, it was expected that P300 amplitudes would in general
be larger over the right fiontal hemisphere for all participants. However, P300 amplitude
would be greatest for the more creative participants.
Unique Methods
Stimuli
The odd-ball task, as discussed above, is a classic test known to elicit specific
components of the event-related potential. There are many models for this test, however
they all have in common at least two stimulus types (frequent and infrequent) and a
participant task designed to ensure constant focus on the stimuli. This experiment
followed the design of Courchesne (1979). The stimuli were the letter 'A' and the letter
'B,' with 'A' serving as the infrequent stimulus and 'B' serving as the frequent stimulus.
Each stimulus instance was presented individually for 200 msec with a 1200 msec
interval between stimulus presentations. There were three variations of stimulus
presentation, which are presented in the following paragraphs.
First, participants were given a "sample" test that consisted of 24 stimuli, equally
split between 'A' and 'B' types. They were told to count the total number of 'A' stimuli
to themselves without vocalizing the count. They were told that at the end of the
program, the experimenter would them how many 'A' stimuli they counted. This
program took approximately 1.5 minutes. The purpose of this sample was to ensure that
participants understood the task before starting the desired data collection.
The baseline program was followed immediately by a simple odd-ball program. For the
simple odd-ball program, participants were told that they should follow the same
procedure as they did for the sample and count the total number of 'A' stimuli to
themselves. This program was different in that it consisted of 12% 'A' stimuli and 88%
'B' stimuli (6 'A' stimuli and 44 'B' stimuli). The stimuli were presented semi-
randomly. The condition for presentation of an 'A' stimulus was that at least two 'B'
stimuli had been presented since the last 'A' stimulus. This program took approximately
2.5 minutes.
The simple odd-ball program was followed immediately by a novel odd-ball
program. Again, participants were told to do the same task as the simple odd-ball
program and the sample. They were asked to count the total number of 'A' stimuli. This
was meant to establish the same expectations for stimulus types as the previous programs.
However, in this program a new stimulus type was added. In addition to 12% 'A'
stimuli, there were 12% novel stimuli, which were random color patterns. The last 76%
of the stimuli were 'B,' making a total of 18 'A' stimuli, 18 'Novel' stimuli, and 1 14 'B'
stimuli. As with the simple odd-ball program, the stimuli were presented semi-randomly.
The condition for presentation of an 'A' stimulus or a 'Novel' stimulus was that at least
two 'B' stimuli had been presented since the last 'A' stimulus or the last 'Novel'
stimulus. This program took approximately 6 minutes.
Data Collection
There are many steps between the collection of brain activity responses to visual
stimuli and the final analysis of those responses as ERPs. The steps followed for this
analysis followed the method of Courchesne (1978). For this experiment, three types of
visual stimuli were presented (i.e., fiequent presentations of the letter B, infrequent
presentations of the letter A, and infrequent and unexpected presentations of novel color
patterns). Each time a stimulus was presented, a digital sample of the analog signal fiom
the electrodes on the participant was collected. For each presented stimulus, an eight
(electrode location) by 300 (200 Hz digital sample of the signal at each electrode
location) matrix was created. The waveform for a given electrode location was
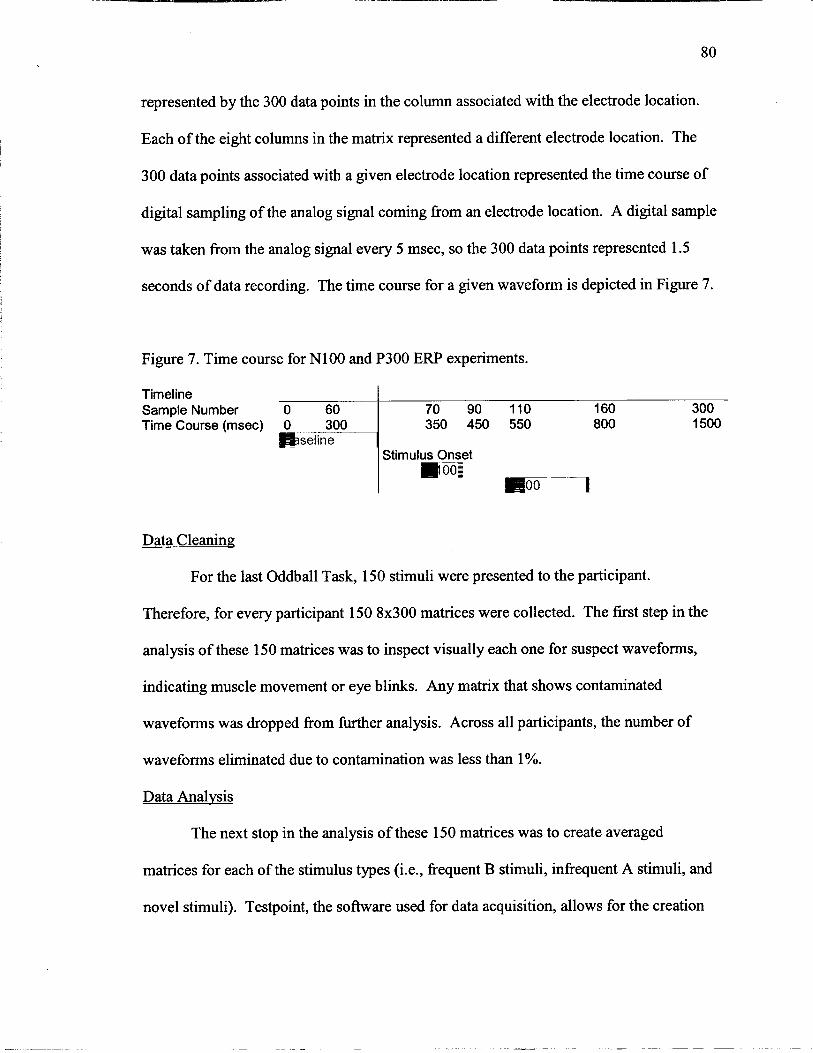
represented by the 300 data points in the column associated with the electrode location.
Each of the eight columns in the matrix represented a different electrode location. The
300 data points associated with a given electrode location represented the time course of
digital sampling of the analog signal coming from an electrode location. A digital sample
was taken from the analog signal every 5 msec, so the 300 data points represented 1.5
seconds of data recording. The time course for a given waveform is depicted in Figure 7.
Figure 7. Time course for NlOO and P300 ERP experiments.
Data Cleaning
For the last Oddball Task, 150 stimuli were presented to the participant.
Therefore, for every participant 150 8x300 matrices were collected. The first step in the
analysis of these 150 matrices was to inspect visually each one for suspect waveforms,
indicating muscle movement or eye blinks. Any matrix that shows contaminated
waveforms was dropped from m h e r analysis. Across all participants, the number of
waveforms eliminated due to contamination was less than 1 %.
Data Analysis
The next stop in the analysis of these 150 matrices was to create averaged
matrices for each of the stimulus types (i.e., frequent B stimuli, infrequent A stimuli, and
novel stimuli). Testpoint, the software used for data acquisition, allows for the creation
Timeline Sample Number 0 60 Time Course (msec) 0 300
B s e l i n e
70 90 110 160 300 350 450 550 800 1500
Stimulus Onset oog
* m o o - 1
of customized computer programs. A customized Testpoint computer program was
written to calculate the averaged matrix for each of the three stimulus types (i.e., B, A,
Novel). This program identified the type of stimulus associated with each 8x300 matrix
and then added it to a repository matrix for that stimulus type. Once all initial (raw)
matrices had been added to the appropriate repository matrix, they were divided by the
total number of initial (raw) matrices to create the grand averaged matrix for each
stimulus type for each participant. The result was three new matrices, one for each
stimulus type.
After averaged matrices had been created for each participant, the waveform for
each electrode location was inspected for peaks w i t h specific time intervals. A
customized Testpoint computer program was written to identi@ peaks within the time
ranges of interest. For this project, NlOO and P300 peaks were of interest. The Testpoint
computer program worked by reading in each value between the 1" - 300" data points.
The first task of the program was to calculate the average value for the first 60 data
points, which represented the baseline period before the stimulus was presented. Then, it
compared data points with the specified range for each peak of interest in search of the
largest data point. For the NlOO peak, the program searched for the largest negative data
point occurring between 50 msec and 150 msec fiom stimulus onset. For the P300 peak,
the program searched for the largest positive data point occurring between 250 and 500
msec. These are ranges that have been reported as appropriate bounds for NlOO and
P300 peaks (e.g., Coles, Gratton, & Fabiani, 1990). For both waveforms, the sample
number associated with the maximum value was also recorded, and is referred to as the
latency value. For a visual representation of the time course for NlOO and P300 peaks,
see Figure 7, noting that the time course for a given stimulus presentation includes 300
msec (60 samples) for baseline recording.
Results
Additional analyses beyond those reported below were conducted to ensure that
no sex differences, differences within a single creativity test, nor differences by
intellectual functioning were better predictors. There were no more valuable differences
discovered for any of these analyses. These analyses are included in Appendix C.
NlOO
The NlOO peak values were subjected to a 3 (Stimulus Type) x 2 (Hemisphere) x
3 (Electrode Location) repeated measures analysis with Creativity Group entered as a
between subjects variable. Multivariate Analyses produced results as shown in Table 13.
Of particular interest to this report are the results including Creativity Group. However,
there were no significant results that included Creativity Group as a between subjects
factor.

STIM TYPE 2
STIM TYPE x CRGRP 2
HEM 1
HEM x CRGRP 2
ELEC LOC 2
ELEC LOC x CRGRP 2
STIM TYPE x HEM 2
STIM TYPE x HEM x CRGRP 2
STIM TYPE x ELEC LOC 4
STIM TYPE x ELEC LOC x CRGRP 4
HEM x ELEC LOC 2
HEM x ELEC LOC x CRGRP 2
STIM TYPE x HEM x ELEC LOC 4
STIM TYPE x HEM x ELEC LOC x CRGRP 4
Table 13. Nl 00 Multivariate Repeated Measures Analysis
Source d f F
20.43*
Note. STIM TYPE indicates Stimulus Type (A, B, Novel). HEM indicates Hemisphere
(left, right). ELEC LOC indicates Electrode Location (Frontal, Central, Parietal).
CRGRP indicates Creativity Group (high, low).
* p < .001.
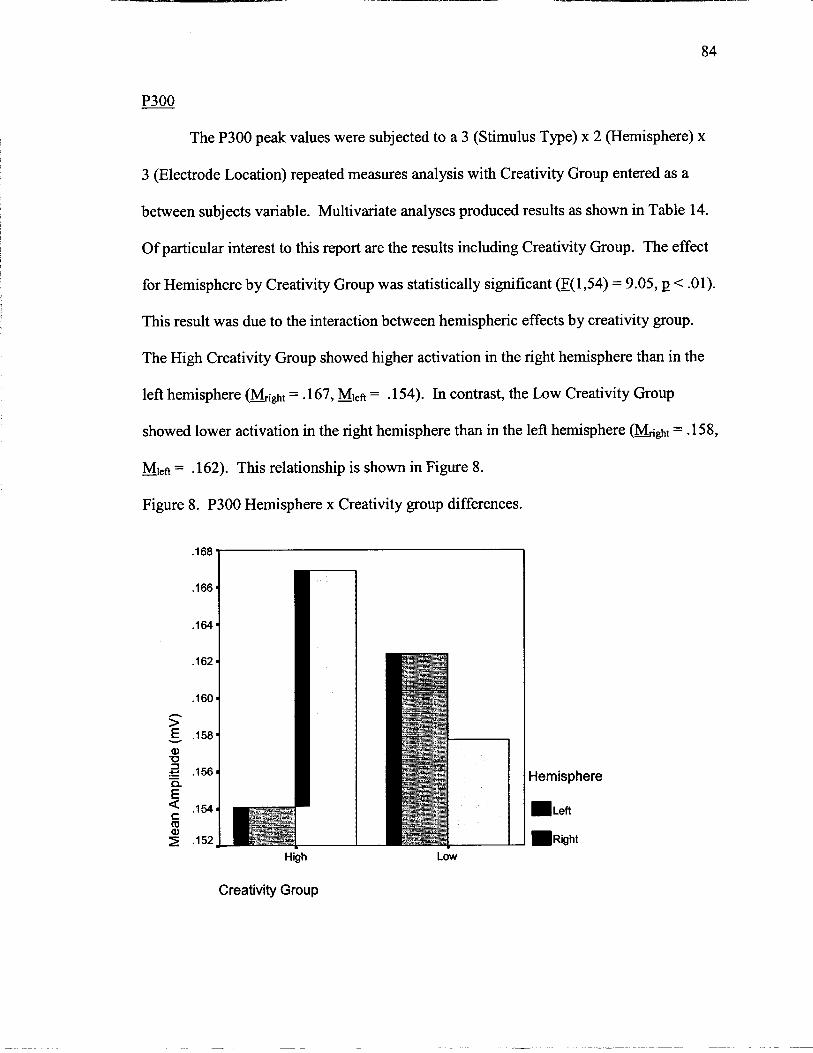
P300
The P300 peak values were subjected to a 3 (Stimulus Type) x 2 (Hemisphere) x
3 (Electrode Location) repeated measures analysis with Creativity Group entered as a
between subjects variable. Multivariate analyses produced results as shown in Table 14.
Of particular interest to this report are the results including Creativity Group. The effect
for Hemisphere by Creativity Group was statistically significant (r(1,54) = 9.05, p < .01).
This result was due to the interaction between hemispheric effects by creativity group.
The High Creativity Group showed higher activation in the right hemisphere than in the
left hemisphere @&&t = .167, MI,* = .154). In contrast, the Low Creativity Group
showed lower activation in the right hemisphere than in the left hemisphere (-M ght = .158,
Mle* = .162). This relationship is shown in Figure 8. -
Figure 8. P300 Hemisphere x Creativity group differences.
High
Creativity Group
Hemisphere
eft ~ i ~ h t
Low
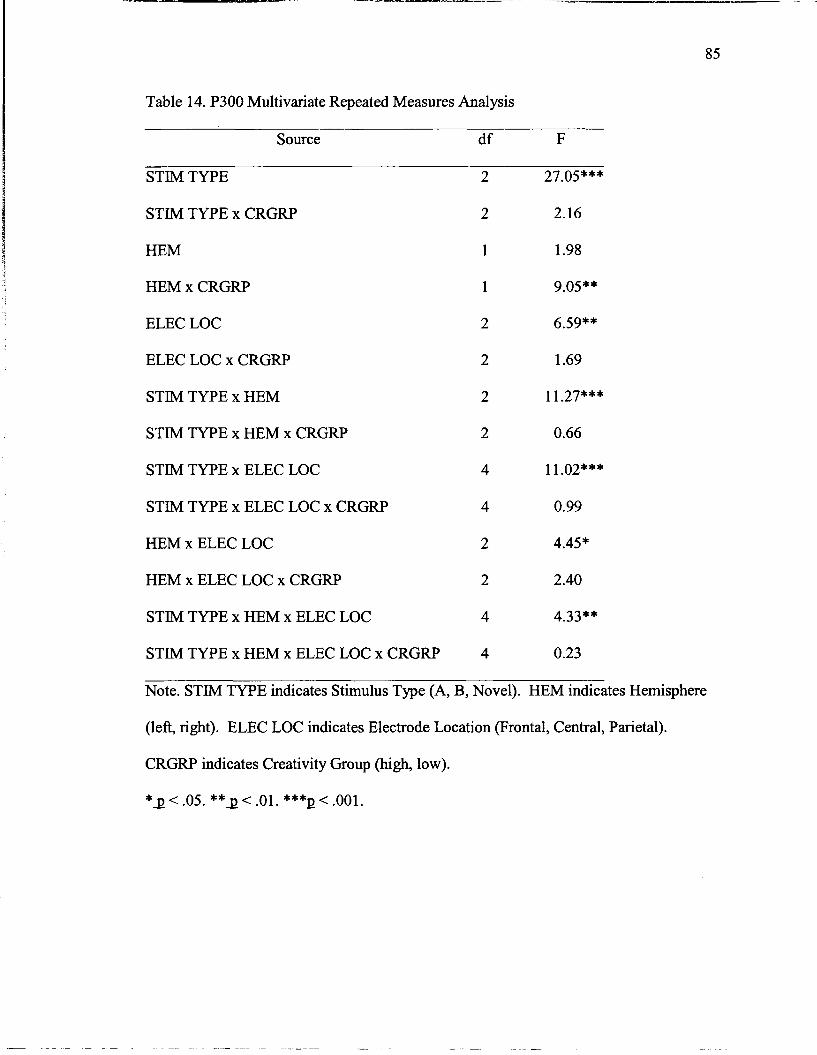
Table 14. P300 Multivariate Repeated Measures Analysis
Source d f F
STIM TYPE 2 27.05***
STIM TYPE x CRGRP 2 2.16
HEM 1 1.98
HEM x CRGRP 1 9.05**
ELEC LOC 2 6.59**
ELEC LOC x CRGRP 2 1.69
STIM TYPE x HEM 2 1 1.27***
STIM TYPE x HEM x CRGRP 2 0.66
STIM TYPE x ELEC LOC 4 11.02***
STIM TYPE x ELEC LOC x CRGRP 4 0.99
HEM x ELEC LOC 2 4.45*
HEM x ELEC LOC x CRGRP 2 2.40
STIM TYPE x HEM x ELEC LOC 4 4.33**
STIM TYPE x HEM x ELEC LOC x CRGRP 4 0.23
Note. STIM TYPE indicates Stimulus Type (A, B, Novel). HEM indicates Hemisphere
(left, right). ELEC LOC indicates Electrode Location (Frontal, Central, Parietal).
CRGRP indicates Creativity Group (high, low).
*p< .O5. **p < .01. ***E < .001.

Discussion
Experiment two investigated differences in people's initial neurophysiological
response to stimuli by measuring event-related potentials in an odd-ball task. This was a
new technique for exploring creativity. It was chosen because there have been
waveforms in the event-related potential that have been related to responses to novel
stimuli, in particular the P300 waveform. The processing of a given potentially novel
stimulus was hypothesized to be related to creativity because all creative ideas are by
definition novel. Preliminary investigations have shown differential patterns of response
for more creative participants versus less creative participants.
Two waveforms were investigated for this experiment: NlOO and P300.
Creativity group was not a significant factor in any interactions for the Nl 00 waveform.
While creativity group was a significant factor in interactions with the NlOO waveform in
preliminary experiments, it is the less relevant waveform, when compared with the P300
waveform. The NlOO waveform is seen in relation to early filtering to reduce the
processing of irrelevant information (Coles, Gratton, & Fabiani, 1990), which could be
argued as a benefit or a detriment to creative thinking.
The P300 waveform is related to the processing of novel stimuli, and therefore
represents the amount of resources allocated to process a particular stimulus based upon
its perceived novelty. This was more directly relevant to creativity, and proved to be
related to creativity in the analysis of participant responses. Creativity group was a
significant factor in the interaction with hemisphere for the P300 waveform. This result
does not reflect a difference for just novel stimuli as defined by the experiment (i.e., not
just for colored pictures), it reflects a general difference in the processing of stimuli

(target A, distractor B, and novel colored pictures) by hemisphere. The High Creativity
group showed much greater P300 amplitudes in the right hemisphere as opposed to the
left hemisphere, whereas the Low Creativity group showed greater left hemisphere
amplitudes than right hemisphere amplitudes, but with less disparity between
hemispheres than the High Creativity group (see Figure 8). This result lends further
support to the overlying theme of the results, showing greater variability in response for
the High Creative group than for the Low Creative group. In addition, right hemisphere
activation is greater for the High Creative group than the Low Creative group. This is in
line with previous research that has found greater right hemisphere activation for more
creative participants (e.g., McCallum & Glynn, 1979; Martindale, Hines, Mitchell, &
Covello, 1984).
This experiment confirmed the general relationship between creative potential, as
measured by composite score from paper and pencil creativity tasks, and cognitive state.
More creative participants did show greater P300 amplitude variability in response to the
novel stimuli across the hemispheres. Future directions for this type of experiment
include varying the type of novel stimuli presented to participants. It would be
interesting to know whether stimulus type would change the P300 response, and whether
the response would also vary by creativity group. It would also be helpful to combine
EEG measurement techniques with other brain imaging techniques such as fMRI and
PET Scan. The combination in methods would clarify the relationships found here, as
well as lend credence to the overall thesis that creative potential influences cognitive
functioning on creative tasks.
Experiment Three
Hypotheses
The final ERP task focused on a different waveform: the N400. As discussed in a
previous section, the N400 has been associated with semantic incongruity. Only the
N400 waveform would be analyzed for this data set, as it has been shown to be the only
valid measurement for semantic incongruity. Based on the theories of creativity discussed
above, it was predicted that more creative participants would show greater variability in
response to the presentation of incongruous words. More creative people assumably have
lower thresholds for unusual word associations (see Mednick, 1962). This should
influence the more creative person's expectations for the semantically incongruous
words, making them more sensitive to the differences.
Unique Methods
S tirnuli
Following the classic methods of Kutas and Hillyard (1980), participants were
shown the first part to a sentence and told that the last word in the sentence would appear
after they had read the first part (e.g., "The pizza was too hot to "). The last
word that appeared was either semantically congruous (e.g., eat), or incongruous (e.g.,
cry). Fifty pairs of sentence beginnings and last words were presented. Of these, the last
word was incongruous 50% of the time, and congruous 50% of the time. Participants
were asked to pay attention to the sentences because questions were asked about them at
the end of the experiment. This was to ensure full attention was paid to the first and
second part of the sentence.
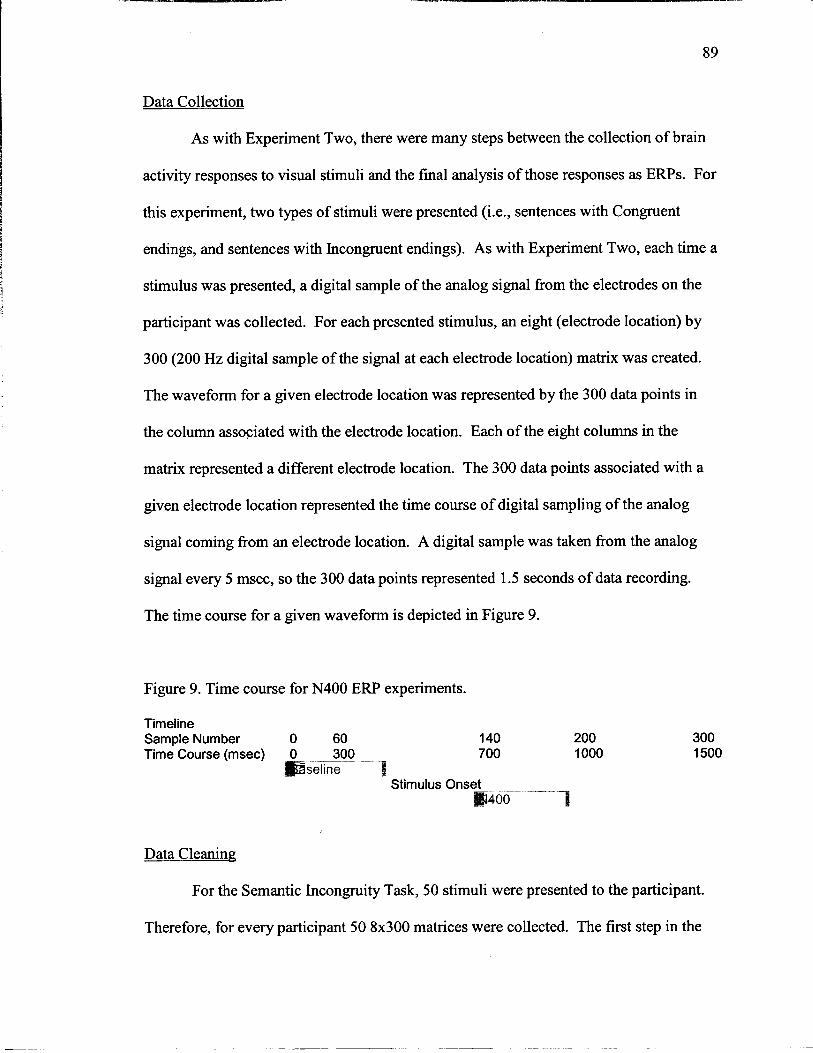
Data Collection
As with Experiment Two, there were many steps between the collection of brain
activity responses to visual stimuli and the final analysis of those responses as ERPs. For
this experiment, two types of stimuli were presented (i.e., sentences with Congruent
endings, and sentences with Incongruent endings). As with Experiment Two, each time a
stimulus was presented, a digital sample of the analog signal fiom the electrodes on the
participant was collected. For each presented stimulus, an eight (electrode location) by
300 (200 Hz digital sample of the signal at each electrode location) matrix was created.
The waveform for a given electrode location was represented by the 300 data points in
the column associated with the electrode location. Each of the eight columns in the
matrix represented a different electrode location. The 300 data points associated with a
given electrode location represented the time course of digital sampling of the analog
signal coming fiom an electrode location. A digital sample was taken fiom the analog
signal every 5 msec, so the 300 data points represented 1.5 seconds of data recording.
The time course for a given waveform is depicted in Figure 9.
Figure 9. Time course for N400 ERP experiments.
Timeline Sam~le Number 0 60
300 ~ i m e Course (msec) 0 700 seline
Stimulus Onset . .. .
00
Data Cleaning
For the Semantic Incongruity Task, 50 stimuli were presented to the participant.
Therefore, for every participant 50 8x300 matrices were collected. The first step in the
analysis of these 50 matrices was to visually inspect each one for suspect waveforms,
indicating muscle movement or eye blinks. Any matrix that showed contaminated
waveforms was dropped from Wher analysis. Across all participants, the number of
wavefornls eliminated due to contamination was less than 1 %.
Data Analysis
The next step in the analysis of these 50 matrices was to create averaged matrices
for each of the stimulus types (i.e., sentences with Congruent endings, and sentences with
Incongruent endings). Testpoint, the software used for data acquisition, allows for the
creation of customized computer programs. A customized Testpoint computer program
was written to calculate the averaged matrix for each of the two stimulus types (i.e.,
Congruent and Incongruent). This program identified the type of stimulus associated
with each 8x300 matrix and then added it to a repository matrix for that stimulus type.
Once all initial (raw) matrices had been added to the appropriate repository matrix, they
were divided by the total number of initial (raw) matrices to create the grand averaged
matrix for each stimulus type for each participant. The result was two new matrices, one
for each stimulus type.
After averaged matrices had been created for each participant, the waveform for
each electrode location was inspected for peaks withn specific time intervals. A
customized Testpoint computer program was written to identify peaks within the time
ranges of interest. For this project, N400 peaks were of interest. The Testpoint computer
program worked by reading in each value between the 1" - 300th data points. The fist
task of the program was to calculate the average value for the first 60 data points, which
represented the baseline period before the stimulus was presented. Then, it compared
data points with the specified range for each peak of interest in search of the largest data
point. For the N400 peak, the program searched for the largest negative data point
occurring between 400 msec and 700 msec fiom stimulus onset. These are ranges that
have been reported as appropriate bounds for N400 peaks (e.g., Coles, Gratton, &
Fabiani, 1990). For both waveforms, the sample number associated with the maximum
value was also recorded, and will be referred to as the latency value. For a visual
representation of the range for N400 peaks, see Figure 9, noting that the time course for a
given stimulus presentation includes 300 msec (60 samples) for baseline recording.
Results
Additional analyses beyond those reported below were conducted to ensure that
no sex differences, differences within a single creativity test, nor differences by
intellectual functioning were better predictors. There were no more valuable differences
discovered for any of these analyses. These analyses are included in Appendix D.
The N400 peak values were subjected to a 2 (Stimulus Type) x 2 (Hemisphere) x
3 (Electrode Location) repeated measures analysis with Creativity Group entered as a
between subjects variable. Multivariate Analyses produced results as shown in Table 15.
Of particular interest to this report are the results including Creativity Group. The effect
for Electrode Location by Creativity Group was statistically significant (E(2,56) = 5.59, p
< .01). This result was due to the interaction between electrode location effects by
creativity group. The High Creativity Group showed greater dispersion between the
frontal-central-parietal electrode locations than the Low Creativity Group. In addition,
the High Creativity Group showed highest amplitudes at frontal locations, followed by
central then parietal locations = -.074, MCmwal = -.083, Mparietal = -.095), whereas
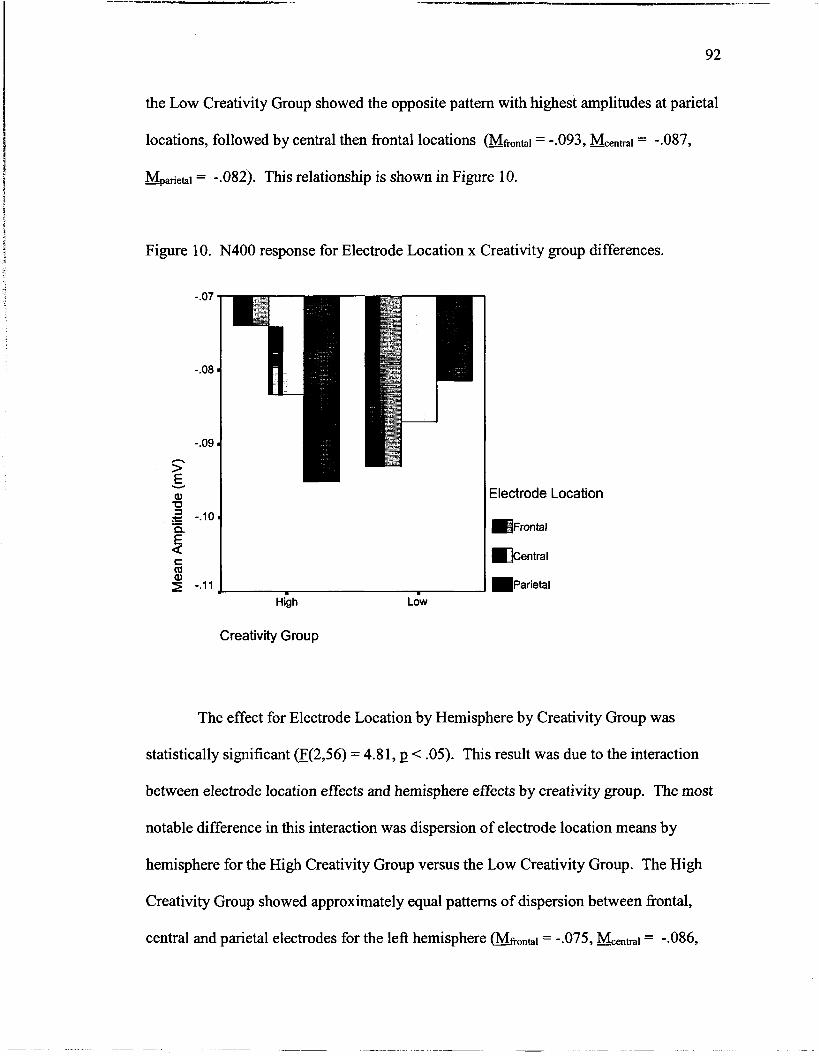
the Low Creativity Group showed the opposite pattern with highest amplitudes at parietal
locations, followed by central then frontal locations (MfrOnbl = -.093, h4c,ml = -.087,
~,,,,+,bl = -.082). This relationship is shown in Figure 10.
Figure 10. N400 response for Electrode Location x Creativity group differences.
Electrode Location
Frontal
m ~ e n t r a l
p a r i e t a l
~ b h Low
Creativity Group
The effect for Electrode Location by Hemisphere by Creativity Group was
statistically significant (E(2,56) = 4 . 8 1 , ~ < .05). This result was due to the interaction
between electrode location effects and hemisphere effects by creativity group. The most
notable difference in this interaction was dispersion of electrode location means by
hemisphere for the High Creativity Group versus the Low Creativity Group. The High
Creativity Group showed approximately equal patterns of dispersion between frontal,
central and parietal electrodes for the left hemisphere = -.075, = -.086,
MPafiehl = -.095) and the right hemisphere (h4fiontal = -.073, Mcentral = -.O8 1, MPafietal = -
.096). The Low Creativity Group showed wide dispersion of means in the left
hemisphere (Mfmntal = -.102, Mcentral = -.087, MPafietal = -.078), but almost no dispersion
in the right hemisphere = -.084, &,,I = -.087, bipa~ehl = -.085). It should also
be noted that the Low Creativity Group showed opposite patterns of means when
compared with the High Creativity Group, with greatest amplitudes in the Parietal
electrode location instead of the Frontal electrode location. Electrode location by
creativity group differences for each hemisphere are shown in Figure 1 1.
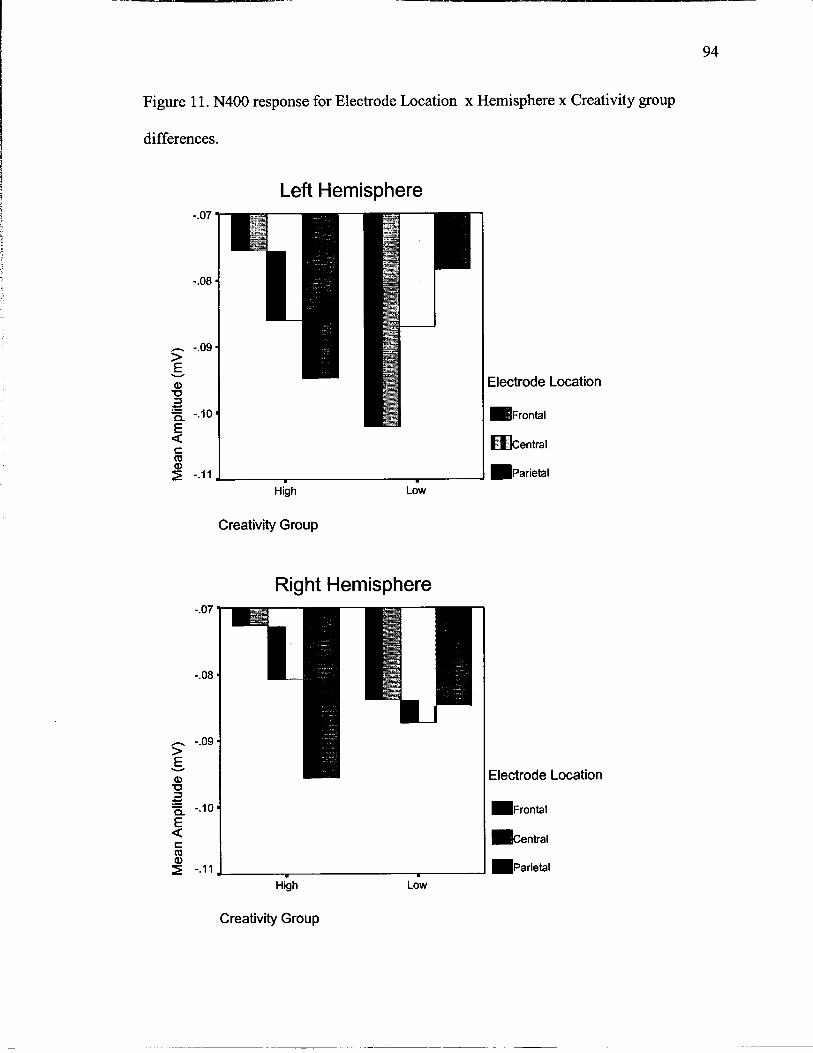
Figure 11 . N400 response for Electrode Location x Hemisphere x Creativity group
differences.
Left Hemisphere
High Low
Creativity Group
Right Hemisphere
High
Creativity Group
Low
Electrode Location
Electrode Location
~ r o n t a l
m e n t r a l
p a r i e t a l

Table 15. N400 Multivariate Repeated Measures Analysis
Source d f F
STIM TYPE 1 2.58
STIM TYPE x CRGRP 1 0.05
HEM 1 1.27
HEM x CRGRP
ELEC LOC
ELEC LOC x CRGRP
STIM TYPE x HEM
STIM TYPE x HEM x CRGRP
STIM TYPE x ELEC LOC 2 7.95***
STIM TYPE x ELEC LOC x CRGRP 2 1.90
HEM x ELEC LOC 2 4.84*
HEM x ELEC LOC x CRGRP 2 4.81*
STIM TYPE x HEM x ELEC LOC 2 0.01
STIM TYPE x HEM x ELEC LOC x CRGRP 2 0.57
Note. STIM TYPE indicates Stimulus Type (Incongruous, Congruous). HEM indicates
Hemisphere (left, right). ELEC LOC indicates Electrode Location (Frontal, Central,
Parietal). CRGRP indicates Creativity Group (high, low).
*p<.05.**p<.Ol.***p<.OOl.
Discussion
Experiment three investigated people's response to incongruous grammars.
Previous research has shown that the N400 waveform occurs when a participant is
presented with an incongruous ending word to a sentence, and increases in amplitude as
the ending word becomes more incongruous (Kutas & Hillyard, 1980). This waveform
was of interest to this investigation for reasons similar to those in the previous
experiment: incongruous stimuli are but another form of unexpected, novel stimuli. This
more specific stimulus type allowed for added validation of the hypothesis that more
creative participants would have more variable responses to stimuli.
There were two significant interactions that included creativity group. First, and
more generally, Electrode Location significantly interacted with creativity group. Again,
the High Creative group had more differentiation in N400 amplitude between the three
electrode locations (frontal, central, and parietal) when compared with the Low Creative
group. In addition, the High Creative group had their largest N400 amplitudes at the
parietal location, whereas the Low Creative group had their smallest N400 amplitudes
parietally. The High Creative group had their smallest N400 amplitudes frontally,
whereas the Low Creative group had their largest N400 amplitudes frontally (see Figure
10). This pattern of results could be interpreted in two ways: (a) It could be seen as
evidence of the importance of parietal regions to the processing of unexpected
grammatical structures, or (b) it could be seen as evidence of the dominance of positive
frontal activation in more creative participants regardless of task. Kutas and Hillyard
(1983) reported that N400 should decrease in amplitude from fi-ontal to parietal electrode
locations, being smallest occipitally. Their result suggests that the parietal importance
hypothesis is unlikely the cause of the creativity group differences. It seems more likely
that the influence of positive kontal activation led to the pattern of activation in the High
Creative group. This is an interesting hypothesis that should be investigated in further
research. The frontal region is implicated in most information processing control
research, and could therefore play a valuable role in the processing of creative ideas.
The second significant interaction that included creativity group was an extension
of the interaction discussed in the previous paragraph: the interaction between
hemisphere, electrode location, and creativity group was significant. This result is
particularly interesting in that the N400 amplitudes in the right hemisphere are quite
different for the High Creative group versus the Low Creative group. The Low Creative
group has essentially no variability in N400 amplitude between electrode locations in the
right hemisphere, whereas the High Creative group has wide variability (see Figure 11).
This lends further support to the idea that high creative ability is related to more
variability in cognitive state. Furthermore, it is additional evidence of the specialized
role of the right hemisphere in information processing for more creative individuals.
Thls experiment confirmed the general relationship between creative potential, as
measured by composite score from paper and pencil creativity tasks, and cognitive state.
More creative participants did show greater N400 amplitude variability across the
hemispheres in response to grammatical challenge. Future directions for this type of
experiment include investigating this response with more and less emotion-laden words.
This experimental design could be easily adapted for investigating the processing of more
and less emotional stimuli. It would also be helpful to combine EEG measurement
techniques with other brain imaging techniques such as MRI and PET Scan. The
combination in methods would clarify the relationships found here, as well as lend
credence to the overall thesis that creative potential influences cognitive functioning on
creative tasks.
General Discussion
The goal of these experiments was to provide further support for theories of
creativity that posit flexibility in cognitive state as an essential mechanism of creative
production. A number of theories of creativity hypothesize that more creative individuals
show greater flexibility in their cognitive state (e.g., Kris, 1952; Mednick, 1962;
Mendelsohn, 1976; Eysenck, 1995; Martindale, 1999). In addition, there is past research
showing that people who do better on tests of creativity also show greater flexibility in
their brain wave activity than those who do not do well on tests of creativity (e.g.,
Martindale, 1977; Martindale & Hines, 1975; Martindale & Hasenfus, 1978). These
experiments extend this earlier research (a) by using better and more comprehensive
methods (experiment one), and (b) by using new and previously unexplored
neurophysiological techniques (experiments two and three).
A consistent pattern of results was found across all of the experiments in this
investigation. In all of the experiments, when originality group (experiment one) or
creativity group (experiments two and three) was a determinant of significant differences,
the high ability group had greater variability in measured EEG activity when compared
with the low ability group (see Figures 1, Figure 8, and Figure 11). Furthermore, the high
ability group consistently had higher levels of activation in the right hemisphere than the
low ability group. This pattern of results supports the theories of creativity that
emphasize flexibility in cognitive state as essential to creativity.
REFERENCES
Alexander, J.E., Bauer, L.O., Kupennan, S., Morzorati, S., O'Connor, S.J., Rohrbaugh, J.,
Porjesz, B., Begleiter, H., Polich, J. (1996). Hemispheric differences for P300
amplitude fiom an auditory oddball task. International Journal of
Psychophysiology. 21, 189- 196.
Amabile, T. M. (1982). Social psychology of creativity: A consensual assessment
technique. Journal of Personality and Social Psychology, 43,997- 10 13.
Anderson, C. C. (1968). Psychology of the scientist: XXVIII. Speculations on nonverbal
creativity. Perceptual and Motor Skills, 27, 883-889.
Andreassi, J. L. (2000). Psychophysiology, Fourth Edition. Mahwah, New Jersey:
Lawrence Erlbaum Associates.
Atchley, R. A., Keeney, M., Burgess, C. (1999) Cerebral hemispheric mechanisms
linking ambiguous word meaning retrieval and creativity. Brain and Cognition,
40(3), 479-499.
Barron, F. (1953). Complexity-simplicity as a personality dimension. Journal of
Abnormal and Social Psychology, 48, 142- 172.
Berger, H. (1929). Uber das elektrenkephalograrnrn des menschen. Translated and
reprinted in Pierre Gloor, Hans Berger on the electroencephalogram of man.
Electroencephalography and Clinical Neurophysiology, 28(Supplement), 1969,
Amsterdam: Elsevier.
Blum, G. S. (1961). A model of the mind. New York: Wiley.
Bogen, J. E., Bogen, G. M. (1969). The other side of the brain III. The corpus collosum
and creativity. Bulletin of the Los Angeles Neurological Society, 34, 19 1-220.
Bowers, K. S., Keeling, K. R. (1971). Heart rate variability in creative functioning.
Psychological Reports, 29, 160- 1 62.
Caton, R. (1877). Interim report on investigation of the electric currents of the brain.
British Medical Journal, 1 (Supplement), 62-65.
Cattell, R. B. (1934). Temperament tests: 11. Tests. British Journal of Psychology, 24,
20-49.
Coles, M. G. H., Gratton, G., Fabiani, M. (1990). Event-related brain potentials. In J. T.
Caccioppo & L. G. Tassinary (Eds.) Principles of psychophysiology: Physical,
social, and inferential elements (pp. 385-412). New York: Cambridge University
Press.
Cooley, J. W., Tukey, J. W. (1965). An algorithm for the machine calculation of complex
Fourier series. Mathematics of Computation, 19,297-301.
Courchesne, E. (1978). Changes in P3 waves with event repetition: Long-term effect on
scalp distribution and amplitude. Electroencephalography and Clinical
Neurophysiology, 45,754-766.
Cox, C. (1926). The early mental traits of three hundred geniuses. Stanford: University
Press.
Dykes, M., McGhie, A. (1976). A comparative study of attentional strategies of
schizophrenic and highly creative normal subjects. British Journal of Psychiatry,
128, 50-56.
Ellis, H. (1904). A study of British genius. Oxford: Hurst & Blackwell.
Eysenck, H. J. (1995). Genius: The natural history of creativity. Cambridge: Cambridge
University Press.
Galton, F. (1 950). Hereditary Genius. London: Watts & Co.
Gazzaniga, M. S. (1975). Review of the split brain. UCLA Educator, 17, 9-12.
Gough, H. G. (1979). A creative personality scale for the adjective checklist. Journal of
Personality and Social Psychology, 3 7, 1 398- 1405.
Gough, H. G., Heilbrun, A. B. (1965). The adjective checklist manual. Palo Alto, CA:
Consulting Psychologists Press.
Guilford, J. P. (1950). Creativity. American Psychologist, 5, 444-454.
Hargreaves, H. L. (1 927). The 'faculty' of imagination. British Journal of Psychology.
Monograph Suppl., 10,74.
Helmholtz, H. (1 896). Vortrage und Reden. Braunschweig: Vieweg.
Helson, R., & Crutchfield, R. S. (1970). Mathematicians: The creative researcher and
the average Ph.D. Journal of Consulting and Clinical Psychology, 34,250-257.
Horovitz, S. (2002). Personal communication.
Hyden, H. (1964). Activation of nuclear RNA in neurons and glia in learning. In D. P.
Kimble (Ed.) The anatomy of memory (pp. 178-239). Palo Alto: Science and
Behavior Books.
Jausovec, N. (1985). Hemispheric asymmetries during nine-year-olds performance of
divergent production tasks: A comparison of EEG and YSOLAT measures.
Creative Child and Adult Quarterly, 10,233-238.
Jewett, D.L., Williston, J.S. (1971). Auditory-evoked far fields averaged from the scalp
of humans. Brain, 94, 681-696.
Johnson, R., Jr. (1989). Auditory and visual P300s in temporal lobectomy patients:
Evidence for modality-dependent generators. Psychophysiology, 26, 633-650.
Kahneman, D. (1973). Attention and eflort. Englewood Cliffs, NJ: Prentice Hall.
Kris, E. (195211964). Psychoanalytic explorations in art. New York: Schoken.
Kutas, M., Hillyard, S. A. (1980). Reading senseless sentences: Brain potentials reflect
semantic incongruity. Science, 207,203-205.
Kutas, M., Hillyard, S. A. (1983). Event-related brain potentials to grammatical errors
and semantic anomalies. Memory and Cognition, 11,539-550.
Kwiatkowksi, J., Martindale, C. (1999, August 21). Creativity and evoked potentials
elicited by novel stimuli. American Psychological Association Annual
Conference, Boston.
Kwiatkowski, J., Vartanian, 0. A., & Martindale, C. (1999). Creativity and speed of
information processing. Empirical Studies of the Arts, 1 7, 187-1 96.
Lombroso, C. (1 864). Genio e Follia. Milano: Chinsi.
Lombroso, C. (1896). Man ofgenius. London: Walter Scott.
MacKinnon, D. W. (1962). The personality correlates of creativity: A study of American
architects. In G. S. Nielson (Ed.), Proceedings of the XIV International Congress
of Applied Psychology. Copenhagen: Munksgaard.
Martindale, C. (1999). Biological bases of creativity. In R. J. Stemberg (Ed.), Handbook
of creativity (pp. 1 37- 1 52). Cambridge: Cambridge University Press.
Martindale, C. (1977-78). Creativity, consciousness, and cortical arousal. Journal of
Altered States of Consciousness, 3(1), 69-87.

Martindale, C. (1971). Degeneration, disinhibition, and genius. Journal of the History of
the Behavioral Sciences, 7, 177- 1 82.
Martindale, C. (1969). Femininity, alienation, and arousal in the creative personality.
Unpublished manuscript. Harvard University.
Martindale, C., Hasenfus, N. (1978). EEG differences as a function of creativity, stage of
the creative process, and effort to be original. Biological Psychology, 6, 157-1 67.
Martindale, C., Hines, D. (1975). Creativity and cortical activation during creative,
intellectual, and EEG feedback tasks. Biological Psychology, 3, 71 -80.
Martindale, C., Hines, D., Mitchell, L., Covello, E. (1984). EEG alpha asymmetry and
creativity. Personality and Individual Dzflerences, 5(1), 77-86.
Martindale, C., Vartanian, O., Kwiatkowski, J. (2000). Disinhibition, Dopamine, and
Creativity. American Psychological Association Division Ten Bulletin, Special
Edition on Creativity and Psychopathy.
Mayer, R. E. (1999). Fifty years of creativity research. In R. J. Sternberg (Ed.),
Handbook of creativity (pp. 449-460). Cambridge: Cambridge University Press.
McCallum, A. S., Glynn, S. M. (1979). Hemispheric specialization and creative behavior.
The Journal of Creative Behavior, 13(4), 263 -273.
Mednick, S. A. (1962). The associative basis of the creative process. Psychological
Review, 69, 220-232.
Mednick, S. A. (1958). An orientation to research in creativity (Research Memo Number
Two). Berkeley, CA: University of California, Institute of Personality Assessment
and Research.
Mendelsohn, G. A. (1976). Associative and attentional processes in creative performance.
Journal of Personality, 44, 34 1-369.
Merten, T., Fischer, I. (1 999). Creativity, personality and word association responses:
i Associative behaviour in forty supposedly creative persons. Personality and
Individual Dzflerences, 2 7,933-942.
Michaels, W. B., Wright, C. R. (1989). Psychometric issues in the assessment of
creativity. In J. A. Glover, R. R. Ronning, & C. R. Reynolds (Eds.) Handbook of
Creativity (pp. 33-52). New York: Plenum Press.
Michel, G. F., Moore, C. L. (1995). Developmentalpsychobiology. Cambridge, MA: MIT
Press.
Mora, G. (1964). One hundred years from Lombroso's first essay, 'Genius and Insanity.'
American Journal of Psychiatry, 121,562-571.
Moreau de Tours, P. (1 859). La Psychologie morbide dans ses rapports avec la
philosophie de l'historie, ou de 1 'Influence des nevropathies sur le dynamisme
intellectuel. Paris.
Morel, B. A. (1 857). Traite des degenerescences physiques, intellectuelles et morales de
l'espece humaine. Paris.
Nuntenen, R. (1982). Processing negativity: An evoked potential reflection of selective
attention. Psychological Bulletin, 92,605-640.
Nordau, M. (1 895). Degeneration. London: William Heinemann.
105
Nunez, P. L., Silberstein, R. B., Shi, Z., Carpenter, M. R., Srinivasan, R., Tucker, D. M.,
Doran, S. M., Cadusch, P. J., Wijesinghe, R. S. (1999). EEG coherency 11:
Experimental comparisons of multiple measures. Clinical Neurophysiology, 11 0,
469-486.
Palerrno, D. S., Jenkins, J. J. (1964). Word association norms: Grade school through
college. Minneapolis, MN: University of Minnesota Press.
Penfield, W., Milner, B. (1958). Memory deficit produced by bilateral lesions in the
hippocampal zone. AMA Archives of Neurology and Psychiatry, 79, 475-497.
Petsche, H., Kaplan, S., von Stein, A., Filz, 0. (1997). The possible meaning of the upper
and lower alpha frequency ranges for cognitive and creative tasks. International
Journal of Psychophysiology, 26, 77-97.
Prentky, R. (1989). Creativity and psychopathology: Gamboling at the seat of madness.
In J. A. Glover, R. R. Ronning & C. R. Reynolds (Eds.), Handbook of creativity
(pp. 243-269). New York: Plenum Press.
Ray, W. (1990). The electrocortical system. In J. T. Caccioppo & L. G. Tassinary (Eds.)
Principles ofpsychophysiology: Physical, social, and inferential elements (pp.
385-41 2). New York: Cambridge University Press.
Renault, B. (1983). The visual emitted potentials: Clues for information processing. In A.
W. K. Gaillard & W. Ritter (Eds.) Tutorials in event-relatedpotential research:
Endogenous components (pp. 159-1 76). Amsterdam: North Holland.
SAS/STAT User's Guide (Vols. 1-3). (1999). Cary, NC: SAS Institute, Inc.
Spearman, C. (1 927). The abilities of man. London: MacMillan.
- ---- --
lo6
Speny, R. W. (1968). Hemisphere disconnection and unity in conscious awareness.
American Psychologist, 23, 733-734.
Sternberg, R. J., Lubart, T. I. (1996). Investing in creativity. American Psychologist, 51,
677-688.
Sutton, S., Braren, M., Zubin, J., John, E. R. (1965). Evoked potential correlates of
stimulus uncertainty. Science, 150, 1 187-1 188.
Talbot, E. S. (1 89811901). Degeneracy: Its causes, signs, and results. New York:
Charles Scribner's Sons.
Terrnan, L. M. (1925). Genetic studies of genius: Vol. I. Mental andphysical traits of a
thousand gifted children. Stanford: Stanford University Press.
Tennan, L. M., Oden, M. H. (1959). Genetic studies of genius: Vol. IV. The gifted child
at mid-life. Stanford: Stanford University Press.
Torrance, E. P. (1974). Torrance Tests of Creative Thinking. Scholastic Testing Service.
Tucker, D. M., Dawson, S. L., Roth, D. L., Penland, J. G. (1985). Regional changes in
EEG power and coherence during cognition: Intensive study of two individuals.
Behavioral Neuroscience, 99,564-577.
Van Zelst, R. H., Kerr, W. A. (1954). Personality self-assessment of scientific and
technical personnel. Journal of Applied Psychology, 38, 145-147.
Vaughan, H. G., Jr. (1 969). The relationship of brain activity to scalp recordings of event-
related potentials. In E. Donchin & D. B. Lindsley (Eds.), Averaged evoked
potentials (pp. 45-94). Washington, DC: NASA.
Wallach, M. A., Kogan, N. (1965). Modes of thinking in young children. New York:
Holt, Rinehart, and Winston, Inc.
Wallas, G. (1926). The art of thought. New York: Harcourt, Brace, and World.
Whitton, J. L., Moldofsky, H., Lue, F. (1978). EEG frequency patterns associated with
hallucination in schizophrenia and "creativity" in normals. Biological Psychiatry,
13(1), 123-133.
Zachary, R. A. (1996). Shipley Institute of Living scale, Revised Manual. Los Angeles,
CA: Western Psychological Services.

Appendix A - Full Correlation Matrix
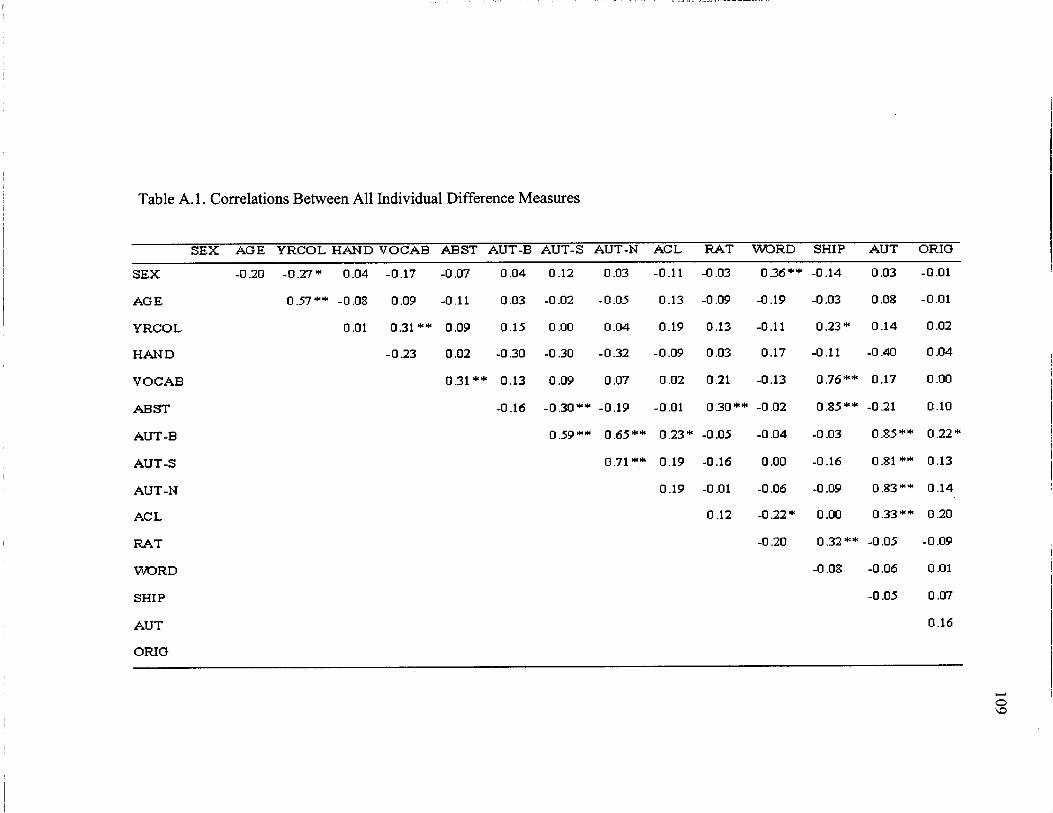
Table A. 1. Correlations Between All Individual Difference Measures
SEX AGE YRCOL HAND VOCAB ABST AUT-B AUT-S AUT-N ACL RAT W R D SHIP AUT ORIG
SEX -0.20 -0.27 *
AGE 0.57** -
YRCOL
HAND
VOCAB
AB ST
AUT -B
AUT -S
AUT -N
AC L
RAT
WORD
SHIP
AUT
ORIG

Note. SEX corresponds to male (1) and female (2). AGE corresponds to reported
birthdate on day of testing. YRCOL corresponds to reported whole year in college.
HAND corresponds to handedness score. VOCAB corresponds to score on the
vocabulary subsection of the Shipley Institute of Living Scale. ABST corresponds to
score on the abstraction subscale of the Shipley Institute of Living Scale. AUT-B, AUT-
S, and AUT-N correspond to number of uses written for a brick, shoe, and newspaper,
respectively, on the Alternate Uses Test. ACL corresponds to score on the Adjective
Checklist. RAT corresponds to score on the Remotes Associates Test. WORD
corresponds to score on the Word Association Test. SHIP corresponds to total score on
the Shipley Institute of Living Scale. AUT corresponds to total score on the Alternate
Uses Test. ORIG corresponds to score on rated originality of written story.
* g < .O5. **g < .01.

Appendix B - Experiment One Spectral Results
Table B. 1. Spectral Analysis Multivariate Repeated Measures Analysis by Adjective
Checklist
Source d f F
ACTIVITY
ACTIVITY x ACL
FREQ
FREQ x ACL
HEM
HEM x ACL
ELECLOC
ELECLOC x ACL
ACTIVITY x FREQ
ACTIVITY x FREQ x ACL
ACTIVITY x HEM
ACTIVITY x HEM x ACL
FREQ x HEM
FREQ x HEM x ACL
ACTIVITY x FREQ x HEM
ACTIVITY x FREQ x HEM x ACL
ACTIVITY x ELECLOC

Table B. 1. Continued
ACTIVITY x ELECLOC x ACL
FREQ x ELECLOC
FREQ x ELECLOC x ACL
ACTIVITY x FREQ x ELECLOC
ACTIVITY x FREQ x ELECLOC x ACL
HEM x ELECLOC
HEM x ELECLOC x ACL
ACTIVITY x HEM x ELECLOC
ACTIVITY x HEM x ELECLOC x ACL
FREQ x HEM x ELECLOC
FREQ x HEM x ELECLOC x ACL
ACTIVITY x FREQ x HEM x ELECLOC
ACTIVITY x FREQ x HEM x ELECLOC x ACL 10
Note. ACTIVITY indicates story activity (Imagining or Writing). FREQ indicates
Frequency Band (delta, theta, low alpha, high alpha, low Beta, high Beta). HEM
indicates Hemisphere (left, right). ELEC LOC indicates Electrode Location (Frontal,
Central, Parietal). ACL indicates grouped scores on the Adjective Checklist.
*p< .05. **p< .01. ***p< .001.
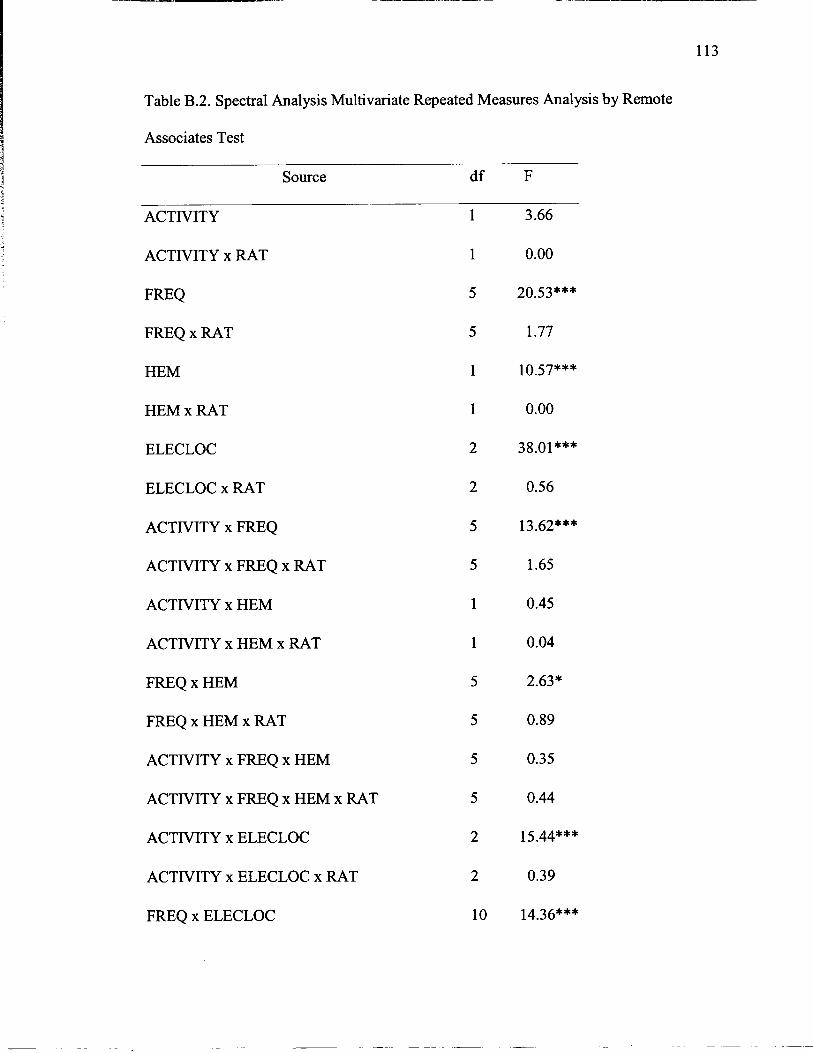
Table B.2. Spectral Analysis Multivariate Repeated Measures Analysis by Remote
Associates Test 3 ?
4 Source d f F
ACTIVITY
ACTIVITY x RAT
FREQ
FREQ x RAT
HEM
HEM x RAT
ELECLOC
ELECLOC x RAT
ACTIVITY x FREQ
ACTIVITY x FREQ x RAT
ACTIVITY x HEM
ACTIVITY x HEM x RAT
FREQ x HEM
FREQ x HEM x RAT
ACTIVITY x FREQ x HEM
ACTIVITY x FREQ x HEM x RAT
ACTIVITY x ELECLOC
ACTIVITY x ELECLOC x RAT
FREQ x ELECLOC
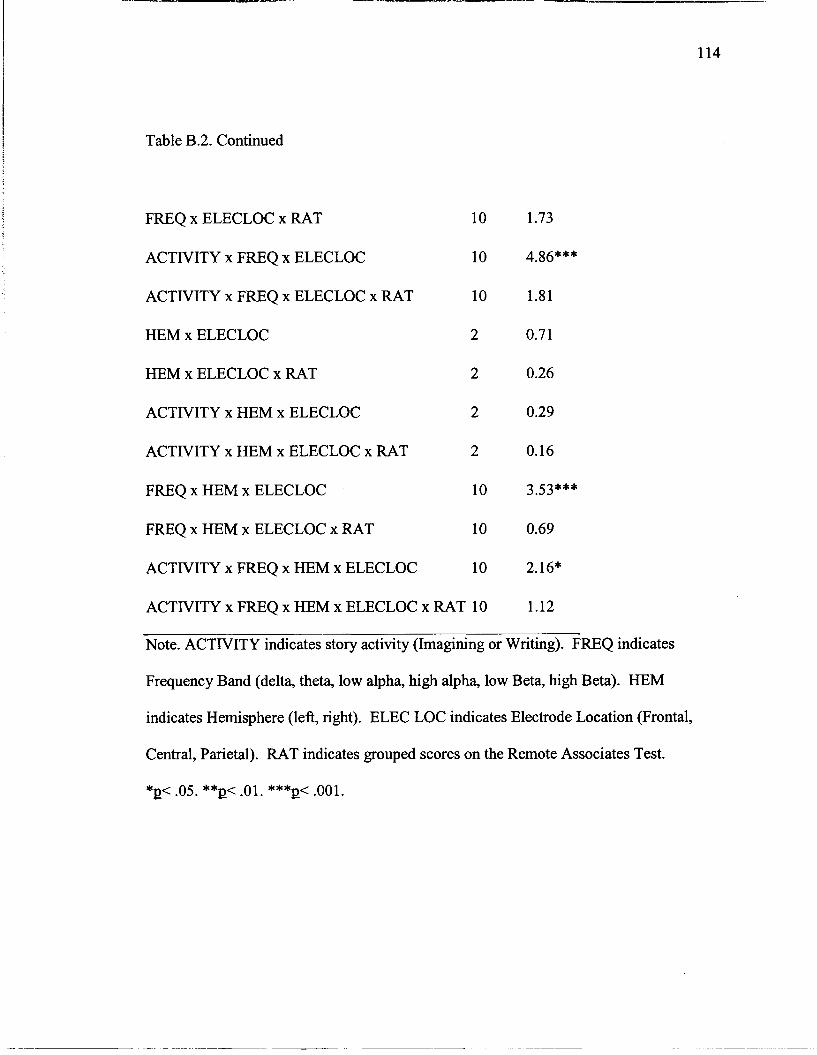
Table B.2. Continued
FREQ x ELECLOC x RAT 10
ACTIVITY x FREQ x ELECLOC 10
ACTIVITY x FREQ x ELECLOC x RAT 10
HEM x ELECLOC 2
HEM x ELECLOC x RAT 2
ACTIVITY x HEM x ELECLOC 2
ACTIVITY x HEM x ELECLOC x RAT 2
FREQ x HEM x ELECLOC 10
FREQ x HEM x ELECLOC x RAT 10
ACTIVITY x FREQ x HEM x ELECLOC 10
ACTIVITY x FREQ x HEM x ELECLOC x RAT 10
Note. ACTIVITY indicates story activity (Imagining or Writing). FREQ indicates
Frequency Band (delta, theta, low alpha, high alpha, low Beta, high Beta). HEM
indicates Hemisphere (left, right). ELEC LOC indicates Electrode Location (Frontal,
Central, Parietal). RAT indicates grouped scores on the Remote Associates Test.
*p< .05. **p< .01. ***p< .001.
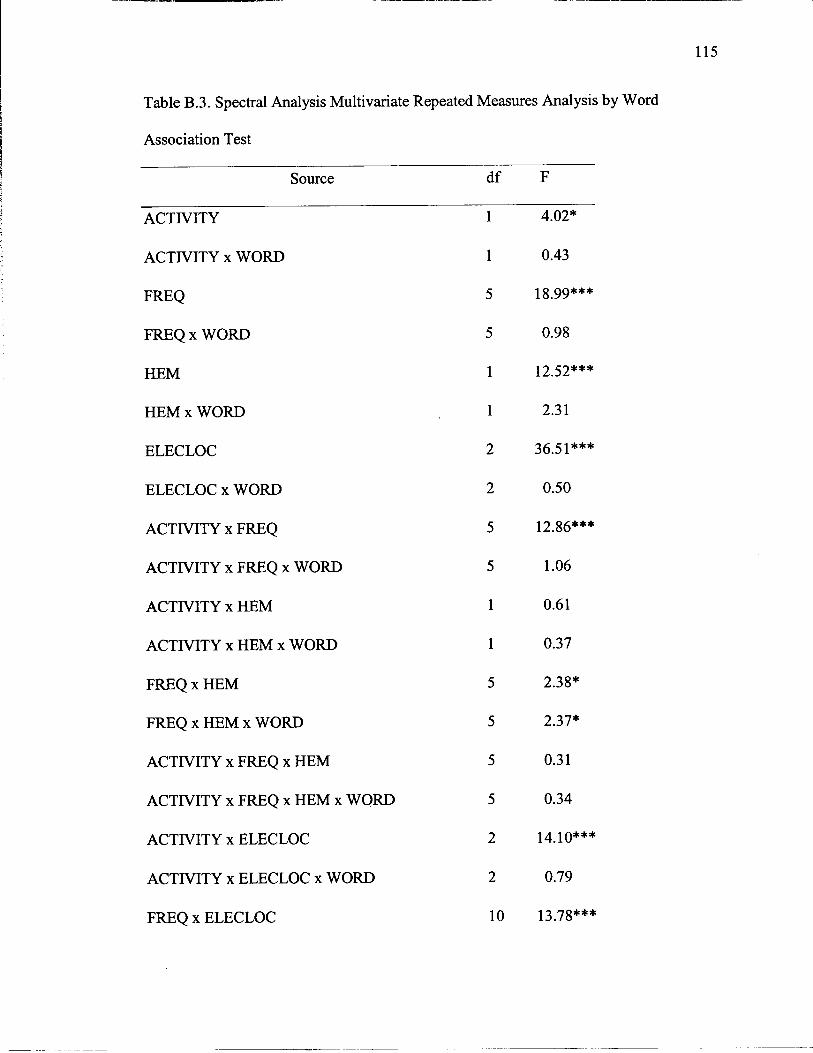
Table B.3. Spectral Analysis Multivariate Repeated Measures Analysis by Word
Association Test
Source
ACTIVITY
ACTIVITY x WORD
FREQ
FREQ x WORD
HEM
HEM x WORD
ELECLOC
ELECLOC x WORD
ACTIVITY x FREQ
ACTIVITY x FREQ x WORD
ACTIVITY x HEM
ACTIVITY x HEM x WORD
FREQ x HEM
FREQ x HEM x WORD
ACTIVITY x FREQ x HEM
ACTIVITY x FREQ x HEM x WORD
ACTIVITY x ELECLOC
ACTIVITY x ELECLOC x WORD
FREQ x ELECLOC
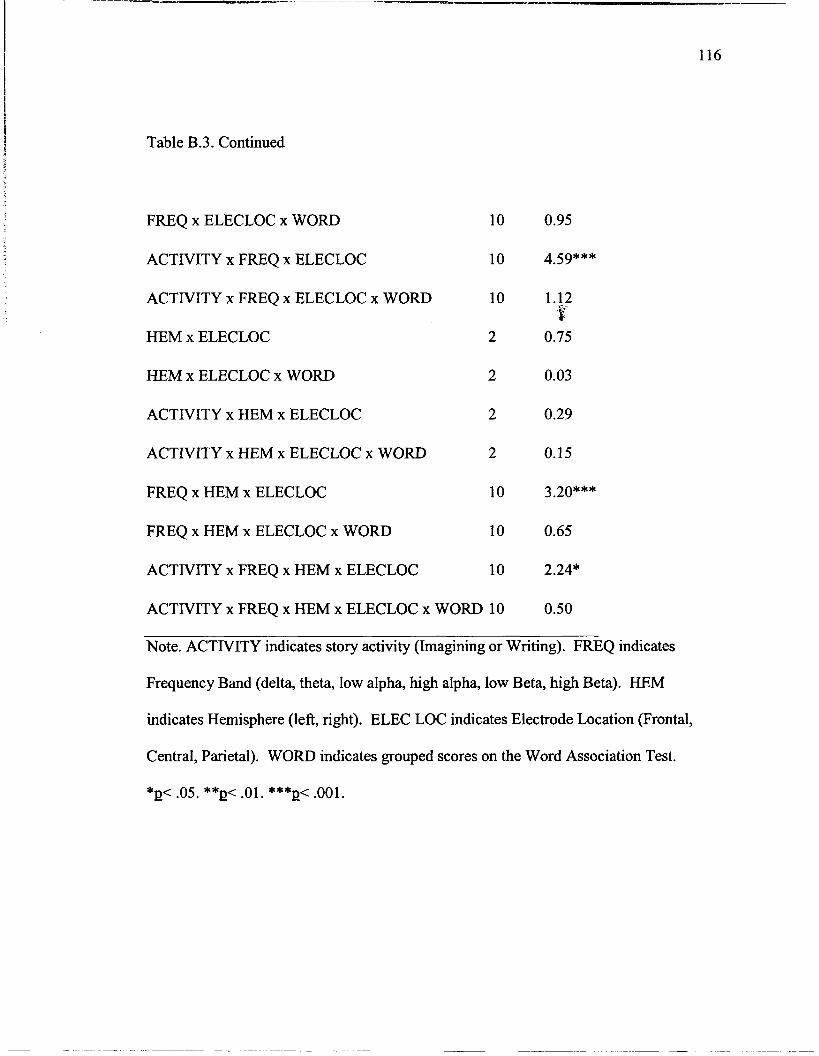
Table B.3. Continued
FREQ x ELECLOC x WORD 10
ACTIVITY x FREQ x ELECLOC 10
ACTIVITY x FREQ x ELECLOC x WORD 10
HEM x ELECLOC 2
HEM x ELECLOC x WORD 2
ACTIVITY x HEM x ELECLOC 2
ACTIVITY x HEM x ELECLOC x WORD 2
FREQ x HEM x ELECLOC 10
FREQ x HEM x ELECLOC x WORD 10
ACTIVITY x FREQ x HEM x ELECLOC 10
ACTIVITY x FREQ x HEM x ELECLOC x WORD 10
Note. ACTIVITY indicates story activity (Imagining or Writing). FREQ indicates
Frequency Band (delta, theta, low alpha, high alpha, low Beta, high Beta). HEM
indicates Hemisphere (left, right). ELEC LOC indicates Electrode Location (Frontal,
Central, Parietal). WORD indicates grouped scores on the Word Association Test.
*p< .05. **Q< .01. ***p< .001.
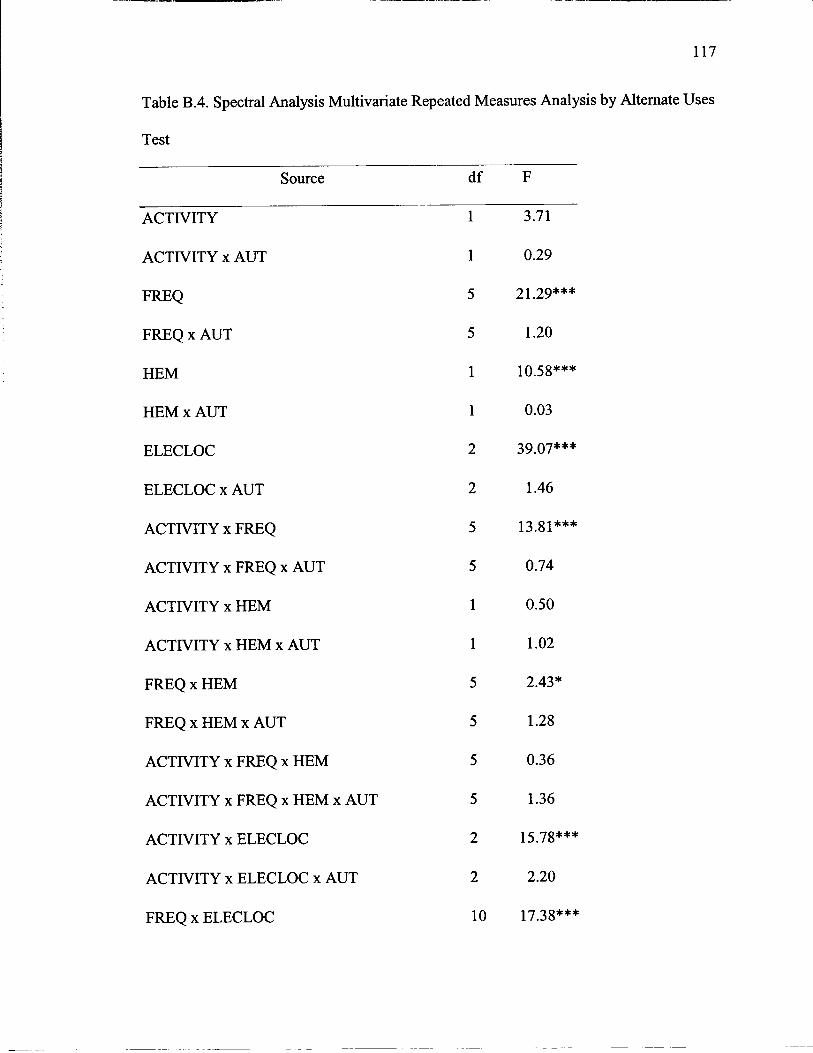
Table B.4. Spectral Analysis Multivariate Repeated Measures Analysis by Alternate Uses
Test
Source d f F
ACTIVITY
ACTIVITY x AUT
FREQ
FREQ x AUT
HEM
HEM x AUT
ELECLOC
ELECLOC x AUT
ACTIVITY x FREQ
ACTIVITY x FREQ x AUT
ACTIVITY x HEM
ACTIVITY x HEM x AUT
FREQ x HEM
FREQ x HEM x AUT
ACTIVITY x FREQ x HEM
ACTIVITY x FREQ x HEM x AUT
ACTIVITY x ELECLOC
ACTIVITY x ELECLOC x AUT
FREQ x ELECLOC
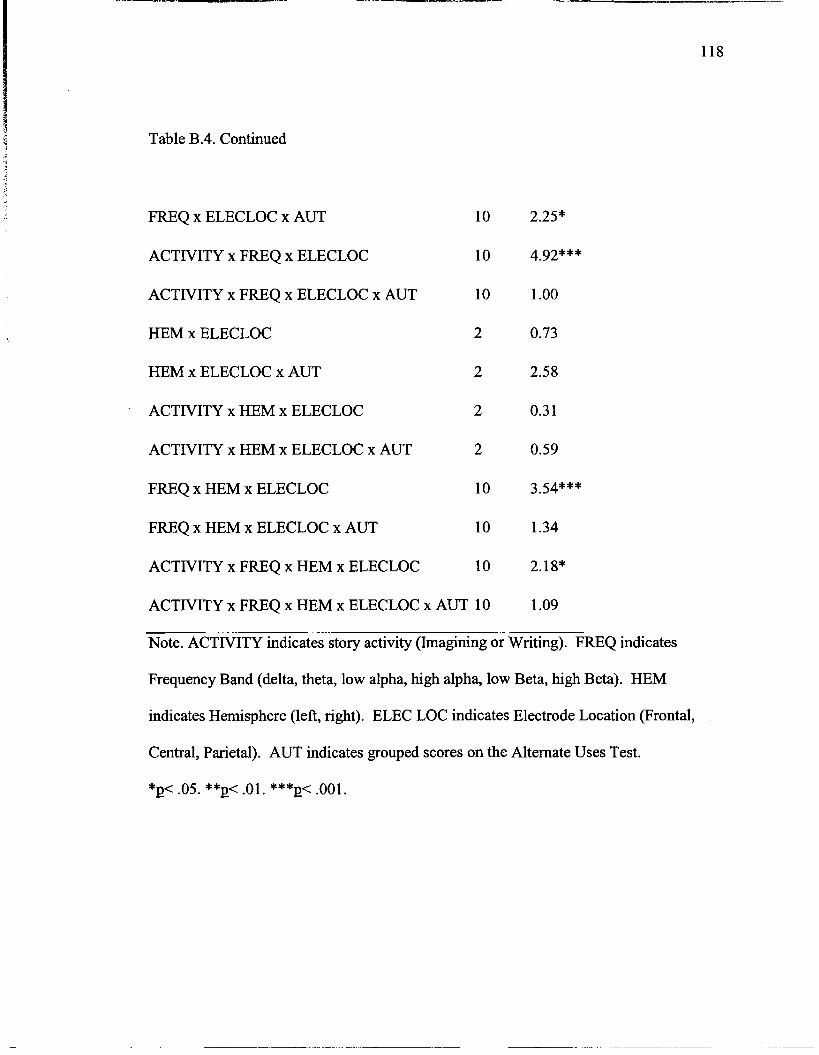
Table B.4. Continued
FREQ x ELECLOC x AUT 10
ACTIVITY x FREQ x ELECLOC 10
ACTIVITY x FREQ x ELECLOC x AUT 10
HEM x ELECLOC 2
HEM x ELECLOC x AUT 2
ACTIVITY x HEM x ELECLOC 2
ACTIVITY x HEM x ELECLOC x AUT 2
FREQ x HEM x ELECLOC 10
FREQ x HEM x ELECLOC x AUT 10
ACTIVITY x FREQ x HEM x ELECLOC 10
ACTIVITY x FREQ x HEM x ELECLOC x AUT 10
Note. ACTIVITY indicates story activity (Imagining or Writing). FREQ indicates
Frequency Band (delta, theta, low alpha, high alpha, low Beta, high Beta). HEM
indicates Hemisphere (left, right). ELEC LOC indicates Electrode Location (Frontal,
Central, Parietal). AUT indicates grouped scores on the Alternate Uses Test.
*p< .05. **p< .01. ***p< .001.
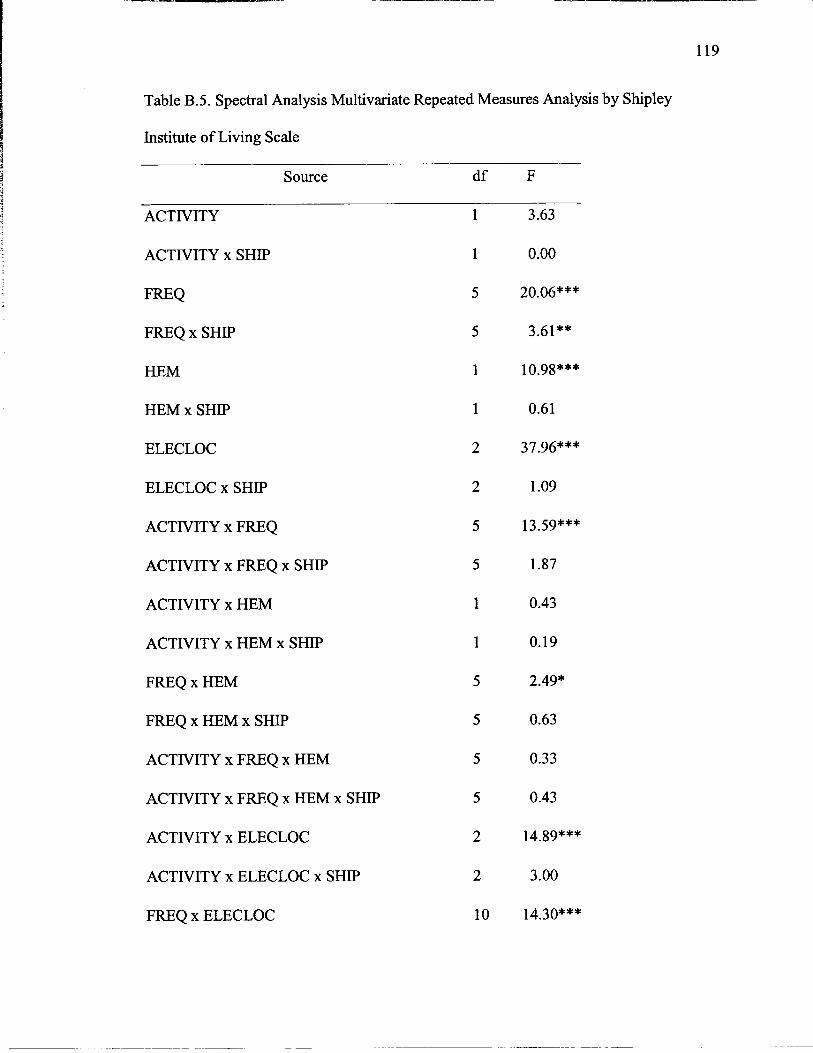
Table B.5. Spectral Analysis Multivariate Repeated Measures Analysis by Shipley
Institute of Living Scale
Source d f
ACTIVITY
ACTIVITY x SHIP
FREQ
FREQ x SHIP
HEM
HEM x SHIP
ELECLOC
ELECLOC x SHIP
ACTIVITY x FREQ
ACTIVITY x FREQ x SHIP
ACTIVITY x HEM
ACTIVITY x HEM x SHIP
FREQ x HEM
FREQ x HEM x SHIP
ACTIVITY x FREQ x HEM
ACTIVITY x FREQ x HEM x SHIP
ACTIVITY x ELECLOC
ACTIVITY x ELECLOC x SHIP
FREQ x ELECLOC

Table B.5. Continued
FREQ x ELECLOC x SHIP 10
ACTIVITY x FREQ x ELECLOC 10
ACTIVITY x FREQ x ELECLOC x SHIP 10
HEM x ELECLOC 2
HEM x ELECLOC x SHIP 2
ACTIVITY x HEM x ELECLOC 2
ACTIVITY x HEM x ELECLOC x SHIP 2
FREQ x HEM x ELECLOC 10
FREQ x HEM x ELECLOC x SHIP 10
ACTIVITY x FREQ x HEM x ELECLOC 10
ACTIVITY x FREQ x HEM x ELECLOC x SHIP 10
Note. ACTIVITY indicates story activity (Imagining or Writing). FREQ indicates
Frequency Band (delta, theta, low alpha, high alpha, low Beta, high Beta). HEM
indicates Hemisphere (left, right). ELEC LOC indicates Electrode Location (Frontal,
Central, Parietal). SHIP indicates grouped scores on the Shipley Institutes of Living Test
(intellectual functioning measure).
*p< .05. **p< .01. ***p< .001.
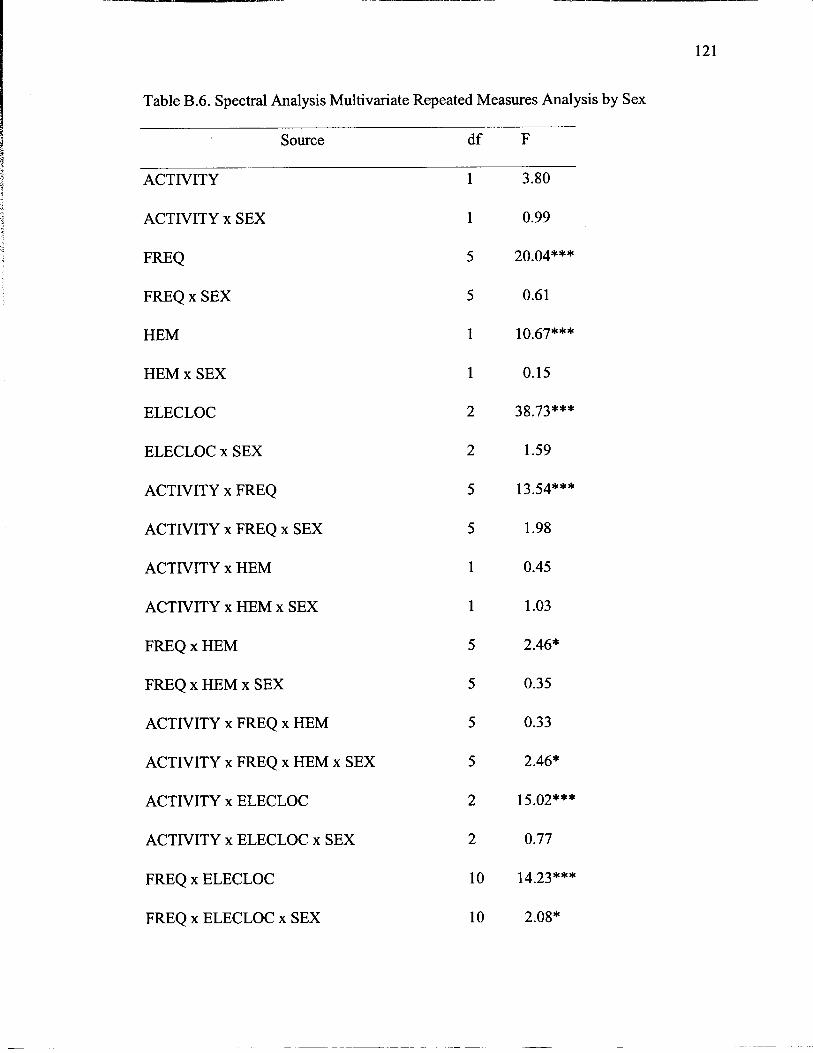
121
Table B.6. Spectral Analysis Multivariate Repeated Measures Analysis by Sex
Source d f F
ACTIVITY
ACTIVITY x SEX
FREQ
FREQ x SEX
HEM
HEM x SEX
ELECLOC
ELECLOC x SEX
ACTIVITY x FREQ
ACTIVITY x FREQ x SEX
ACTIVITY x HEM
ACTIVITY x HEM x SEX
FREQ x HEM
FREQ x HEM x SEX
ACTIVITY x FREQ x HEM
ACTIVITY x FREQ x HEM x SEX
ACTIVITY x ELECLOC
ACTIVITY x ELECLOC x SEX
FREQ x ELECLOC
FREQ x ELECLOC x SEX
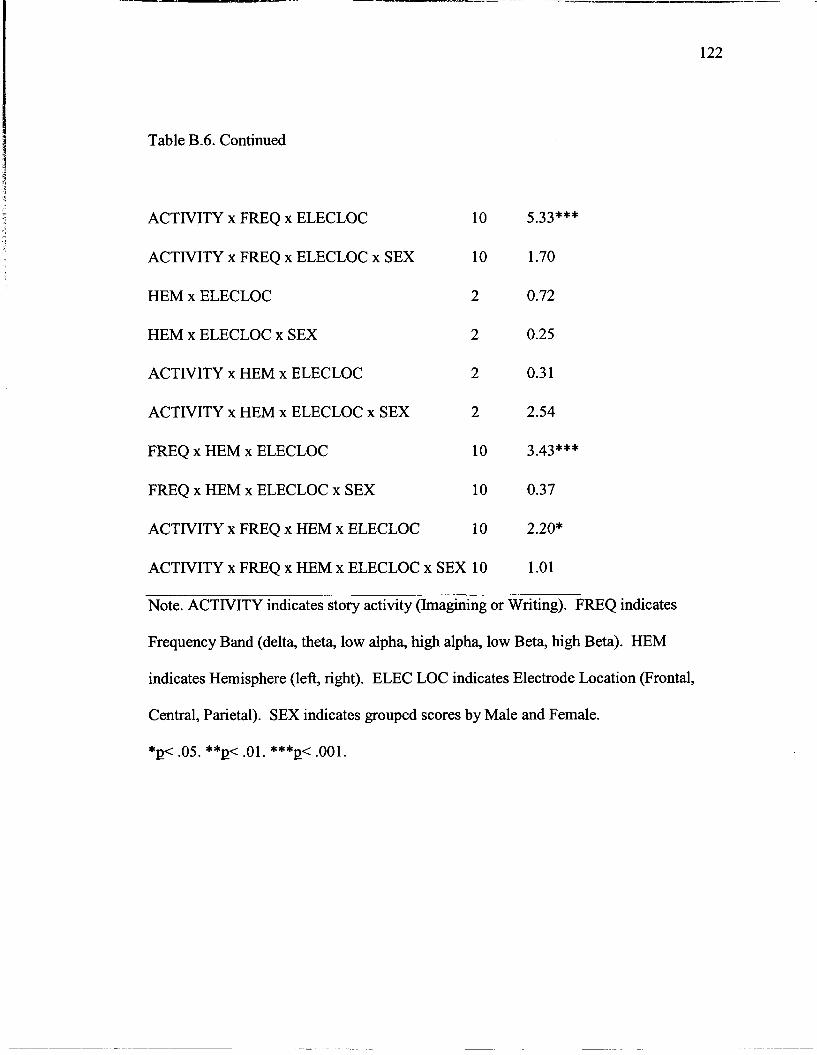
Table B.6. Continued
ACTIVITY x FREQ x ELECLOC 10
ACTIVITY x FREQ x ELECLOC x SEX 10
HEM x ELECLOC 2
HEM x ELECLOC x SEX 2
ACTIVITY x HEM x ELECLOC 2
ACTIVITY x HEM x ELECLOC x SEX 2
FREQ x HEM x ELECLOC 10
FREQ x HEM x ELECLOC x SEX 10
ACTIVITY x FREQ x HEM x ELECLOC 10
ACTIVITY x FREQ x HEM x ELECLOC x SEX 10
Note. ACTIVITY indicates story activity (Imagining or Writing). FREQ indicates
Frequency Band (delta, theta, low alpha, high alpha, low Beta, high Beta). HEM
indicates Hemisphere (left, right). ELEC LOC indicates Electrode Location (Frontal,
Central, Parietal). SEX indicates grouped scores by Male and Female.
*p< .05. **p< .01. ***PC .001.
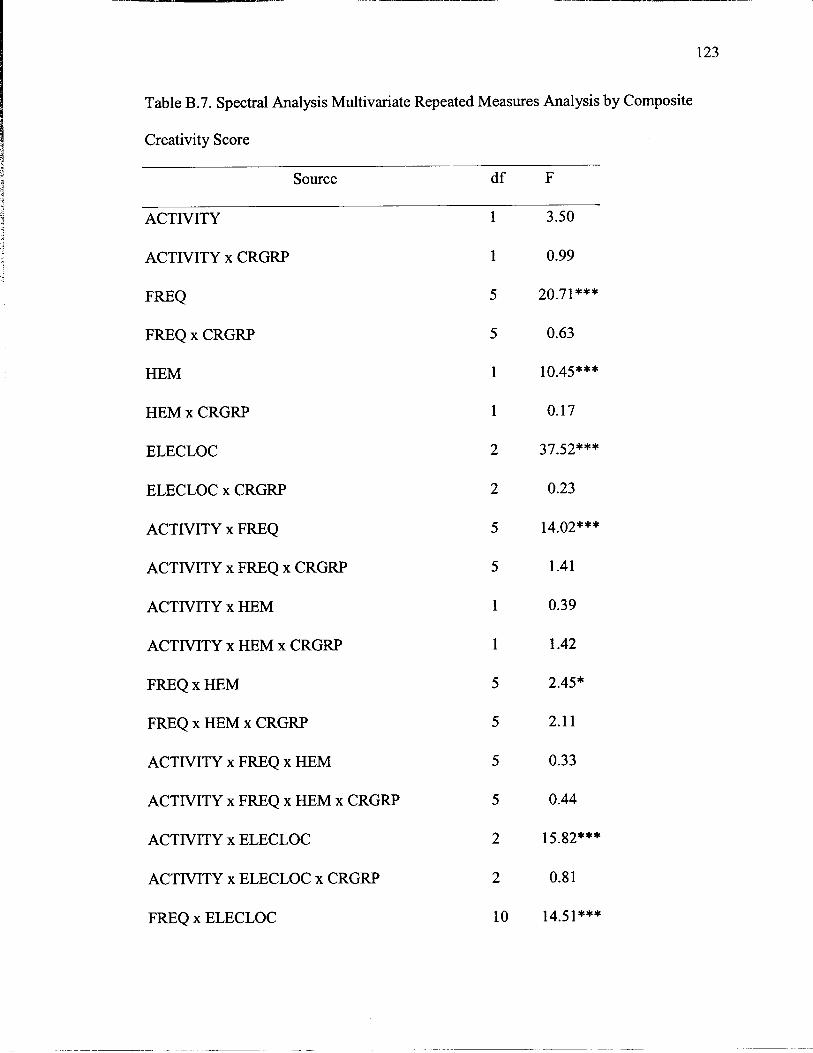
Table B.7. Spectral Analysis Multivariate Repeated Measures Analysis by Composite
Creativity Score
Source d f F
ACTIVITY
ACTIVITY x CRGRP
FREQ
FREQ x CRGRP
HEM
HEM x CRGRP
ELECLOC
ELECLOC x CRGRP
ACTIVITY x FREQ
ACTIVITY x FREQ x CRGRP
ACTIVITY x HEM
ACTIVITY x HEM x CRGRP
FREQ x HEM
FREQ x HEM x CRGRP
ACTIVITY x FREQ x HEM
ACTIVITY x FREQ x HEM x CRGRP
ACTIVITY x ELECLOC
ACTIVITY x ELECLOC x CRGRP
FREQ x ELECLOC

FREQ x ELECLOC x CRGRP 10
ACTIVITY x FREQ x ELECLOC 10
ACTIVITY x FREQ x ELECLOC x CRGRP 10
HEM x ELECLOC 2
HEM x ELECLOC x CRGRP 2
ACTIVITY x HEM x ELECLOC 2
ACTIVITY x HEM x ELECLOC x CRGW 2
FREQ x HEM x ELECLOC 10
FREQ x HEM x ELECLOC x CRGRP 10
ACTIVITY x FREQ x HEM x ELECLOC 10
ACTIVITY x FREQ x HEM x ELECLOC x CRGRP 10
Note. ACTIVITY indicates story activity (Imagining or Writing). FREQ indicates
Frequency Band (delta, theta, low alpha, high alpha, low Beta, high Beta). HEM
indicates Hemisphere (left, right). ELEC LOC indicates Electrode Location (Frontal,
Central, Parietal). CRGW indicates grouped scores on the composite creativity score.
*e< .05. **Q< .01. ***p< .OOl.
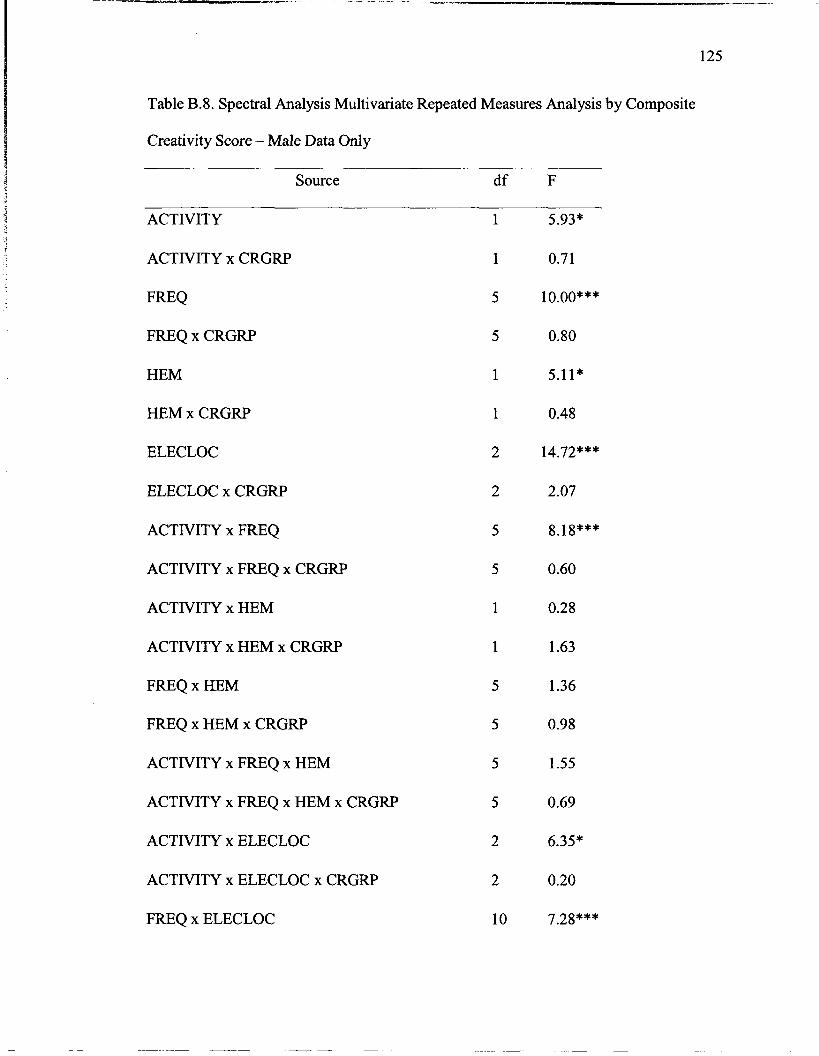
Table B.8. Spectral Analysis Multivariate Repeated Measures Analysis by Composite
Creativity Score - Male Data Only
Source d f F
ACTIVITY
ACTIVITY x CRGRP
FREQ
FREQ x CRGRP
HEM
HEM x CRGRP
ELECLOC
ELECLOC x CRGRP
ACTIVITY x FREQ
ACTIVITY x FREQ x CRGRP
ACTIVITY x HEM
ACTIVITY x HEM x CRGRP
FREQ x HEM
FREQ x HEM x CRGRP
ACTIVITY x FREQ x HEM
ACTIVITY x FREQ x HEM x CRGRP
ACTIVITY x ELECLOC
ACTIVITY x ELECLOC x CRGRP
FREQ x ELECLOC
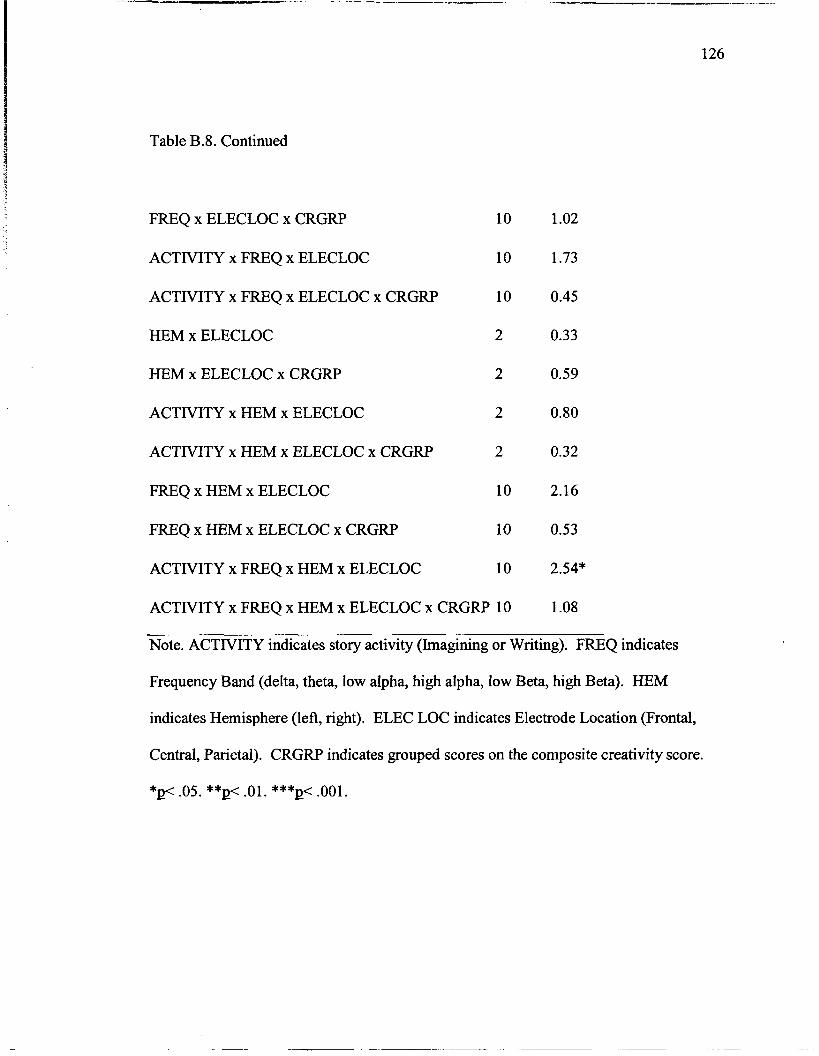
Table B.8. Continued
FREQ x ELECLOC x CRGRP 10
ACTIVITY x FREQ x ELECLOC 10
ACTIVITY x FREQ x ELECLOC x CRGRP 10
HEM x ELECLOC 2
HEM x ELECLOC x CRGRP 2
ACTIVITY x HEM x ELECLOC 2
ACTIVITY x HEM x ELECLOC x CRGRP 2
FREQ x HEM x ELECLOC 10
FREQ x HEM x ELECLOC x CRGRP 10
ACTIVITY x FREQ x HEM x ELECLOC 10
ACTIVITY x FREQ x HEM x ELECLOC x CRGRP 10
Note. ACTIVITY indicates story activity (Imagining or Writing). FREQ indicates
Frequency Band (delta, theta, low alpha, high alpha, low Beta, high Beta). HEM
indicates Hemisphere (left, right). ELEC LOC indicates Electrode Location (Frontal,
Central, Parietal). CRGRP indicates grouped scores on the composite creativity score.
*p< .05. **p< .01. ***p< .001.
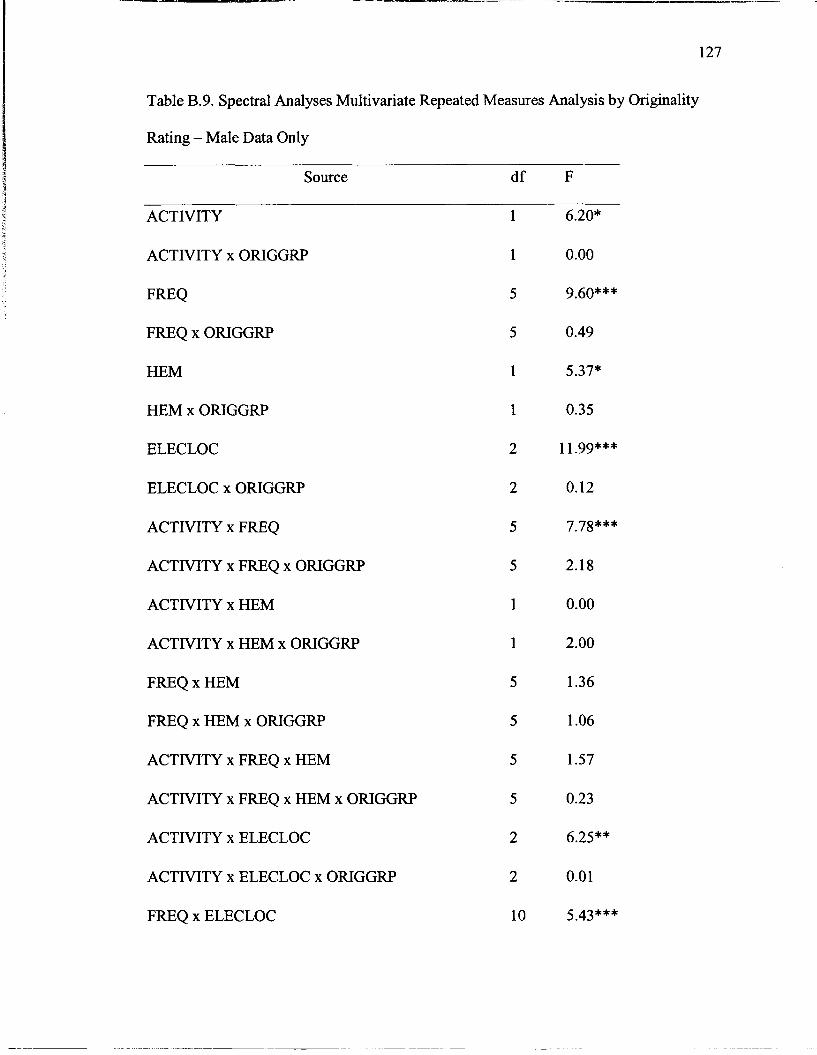
Table B.9. Spectral Analyses Multivariate Repeated Measures Analysis by Originality
Rating - Male Data Only
Source d f F
ACTIVITY
ACTIVITY x OFUGGRP
FREQ
FREQ x ORIGGRP
HEM
HEM x ORIGGRP
ELECLOC
ELECLOC x OFUGGRP
ACTIVITY x FREQ
ACTIVITY x FREQ x ORIGGRP
ACTIVITY x HEM
ACTIVITY x HEM x ORIGGRP
FREQ x HEM
FREQ x HEM x OFUGGRP
ACTIVITY x FREQ x HEM
ACTIVITY x FREQ x HEM x ORIGGRP
ACTIVITY x ELECLOC
ACTIVITY x ELECLOC x ORIGGRP
FREQ x ELECLOC
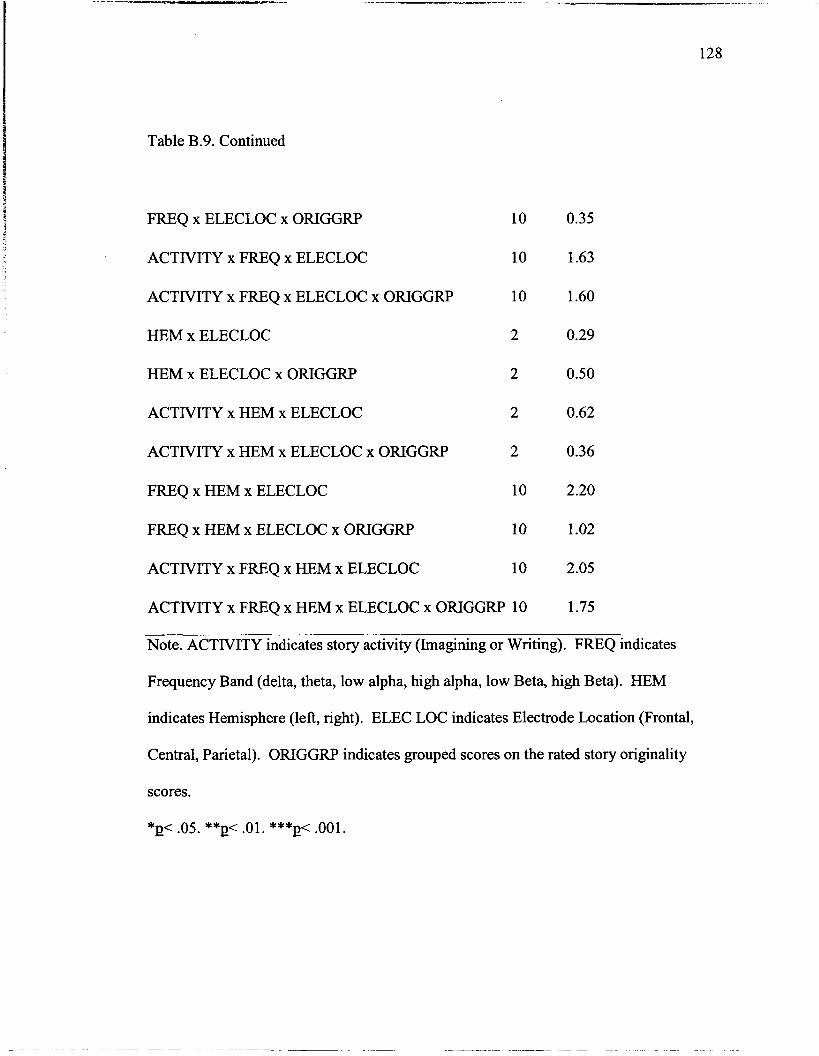
Table B.9. Continued
FREQ x ELECLOC x ORIGGRP 10
ACTIVITY x FREQ x ELECLOC 10
ACTIVITY x FREQ x ELECLOC x ORIGGRP 10
HEM x ELECLOC 2
HEM x ELECLOC x ORIGGRP 2
ACTIVITY x HEM x ELECLOC 2
ACTIVITY x HEM x ELECLOC x ORIGGRP 2
FREQ x HEM x ELECLOC 10
FREQ x HEM x ELECLOC x ORIGGRP 10
ACTIVITY x FREQ x HEM x ELECLOC 10
ACTIVITY x FREQ x HEM x ELECLOC x ORIGGRP 10
Note. ACTIVITY indicates story activity (Imagining or Writing). FREQ indicates
Frequency Band (delta, theta, low alpha, high alpha, low Beta, high Beta). HEM
indicates Hemisphere (left, right). ELEC LOC indicates Electrode Location (Frontal,
Central, Parietal). ORIGGRP indicates grouped scores on the rated story originality
scores.
*p< .05. **p< .01. ***p< .001.
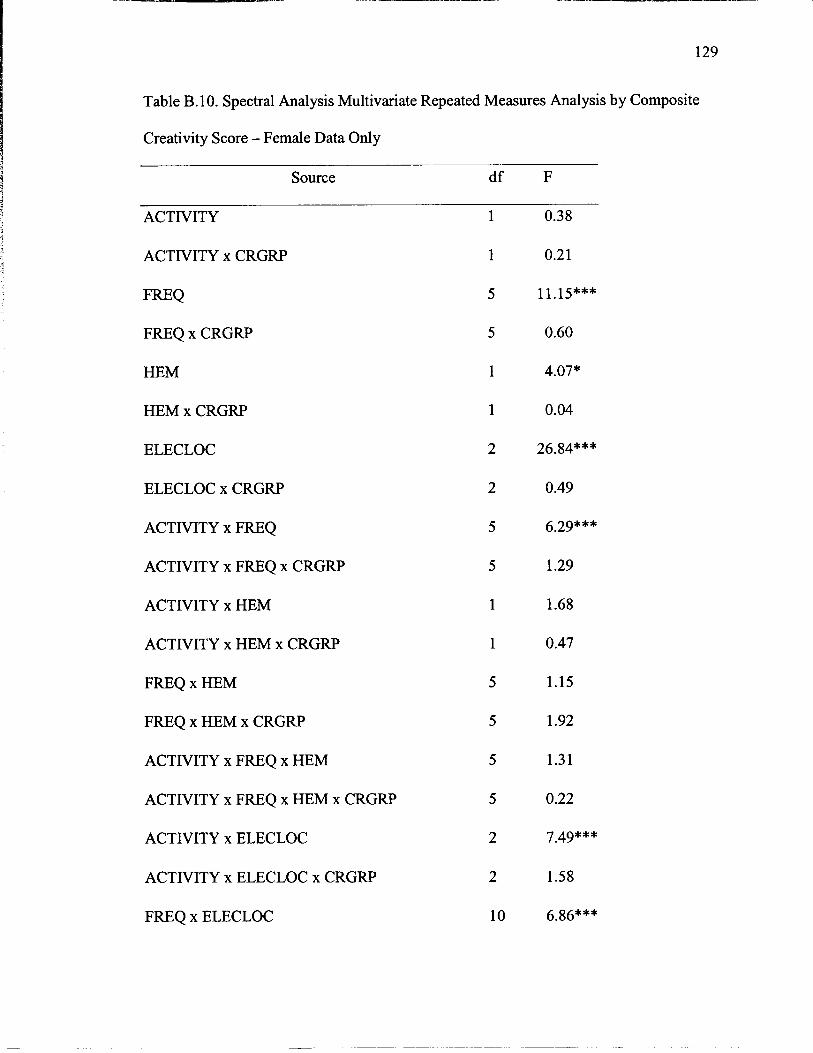
Table B. 10. Spectral Analysis Multivariate Repeated Measures Analysis by Composite
Creativity Score - Female Data Only
Source d f F
ACTIVITY
ACTIVITY x CRGRP
FREQ
FREQ x CRGRP
HEM
HEM x CRGRP
ELECLOC
ELECLOC x CRGRP
ACTIVITY x FREQ
ACTIVITY x FREQ x CRGRP
ACTIVITY x HEM
ACTIVITY x HEM x CRGRP
FREQ x HEM
FREQ x HEM x CRGRP
ACTIVITY x FREQ x HEM
ACTIVITY x FREQ x HEM x CRGRP
ACTIVITY x ELECLOC
ACTIVITY x ELECLOC x CRGRP
FREQ x ELECLOC
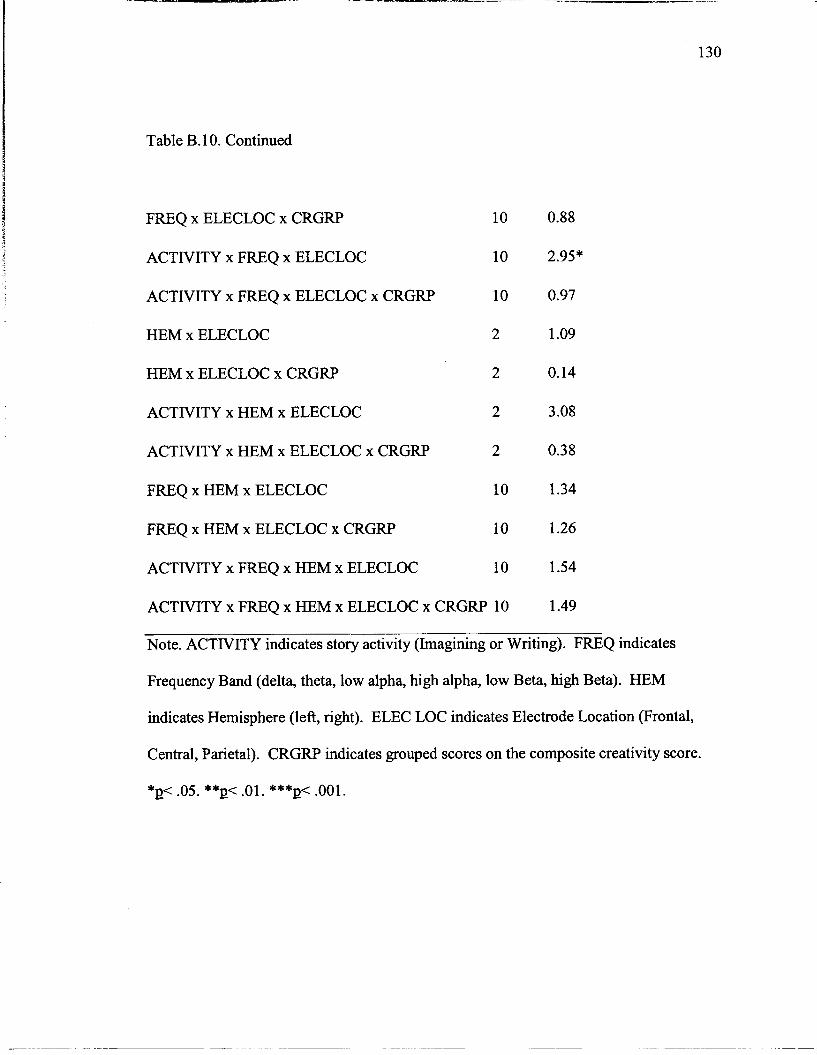
Table B. 10. Continued
FREQ x ELECLOC x CRGRP 10
ACTIVITY x FREQ x ELECLOC 10
ACTIVITY x FREQ x ELECLOC x CRGRP 10
HEM x ELECLOC 2
HEM x ELECLOC x CRGRP 2
ACTIVITY x HEM x ELECLOC 2
ACTIVITY x HEM x ELECLOC x CRGRP 2
FREQ x HEM x ELECLOC 10
FREQ x HEM x ELECLOC x CRGRP 10
ACTIVITY x FREQ x HEM x ELECLOC 10
ACTIVITY x FREQ x HEM x ELECLOC x CRGRP 10
Note. ACTIVITY indicates story activity (Imagining or Writing). FREQ indicates
Frequency Band (delta, theta, low alpha, high alpha, low Beta, high Beta). HEM
indicates Hemisphere (left, right). ELEC LOC indicates Electrode Location (Frontal,
Central, Parietal). CRGRP indicates grouped scores on the composite creativity score.
*p< .05. **p< .01. ***p< .001.

Table B. 1 1. Spectral Analysis Multivariate Repeated Measures Analysis by Originality
Rating - Female Data Only
Source d f F
ACTIVITY
ACTIVITY x ORIGGRP
FREQ
FREQ x ORIGGRP
HEM
HEM x ORIGGRP
ELECLOC
ELECLOC x ORIGGRP
ACTIVITY x FREQ
ACTIVITY x FREQ x ORIGGRP
ACTIVITY x HEM . .
ACTIVITY x HEM x ORIGGRP
FREQ x HEM
FREQ x HEM x ORIGGRP
ACTIVITY x FREQ x HEM
ACTIVITY x FREQ x HEM x ORIGGRP
ACTIVITY x ELECLOC
ACTIVITY x ELECLOC x ORIGGRP
FREQ x ELECLOC
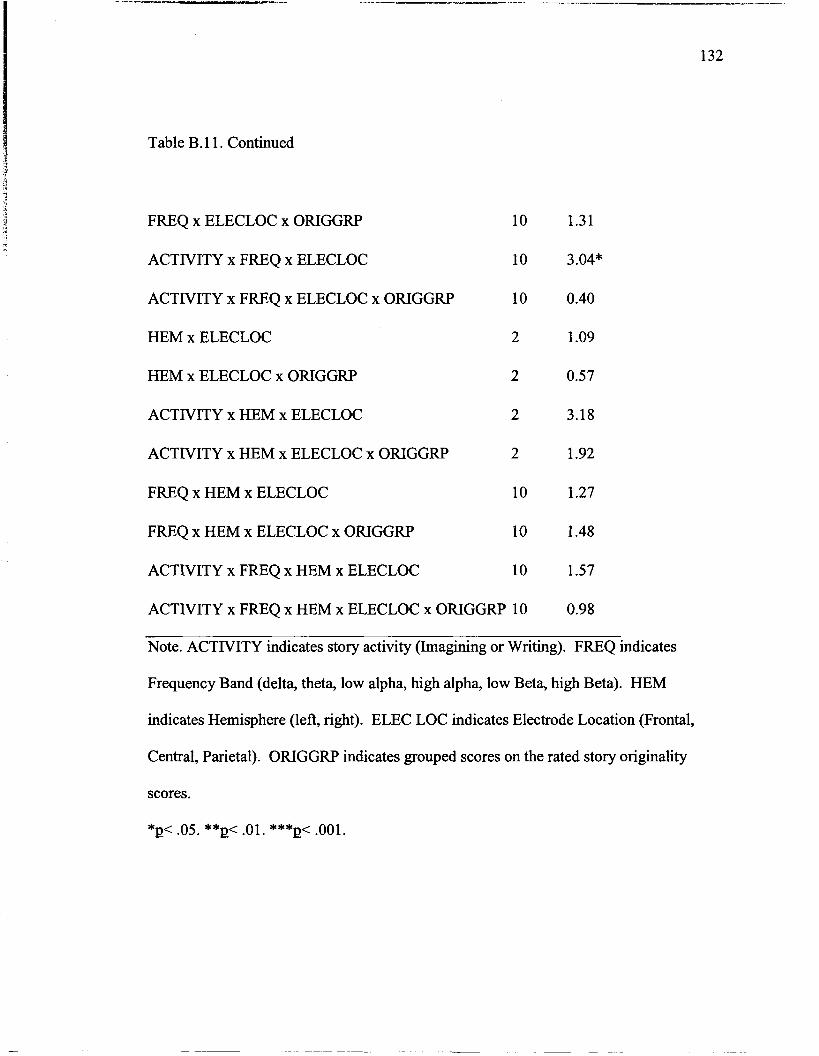
Table B. 1 1. Continued
FREQ x ELECLOC x ORIGGRP 10
ACTIVITY x FREQ x ELECLOC 10
ACTIVITY x FREQ x ELECLOC x ORIGGRP 10
HEM x ELECLOC 2
HEM x ELECLOC x ORIGGRP 2
ACTIVITY x HEM x ELECLOC 2
ACTIVITY x HEM x ELECLOC x ORIGGRP 2
FREQ x HEM x ELECLOC 10
FREQ x HEM x ELECLOC x ORIGGRP 10
ACTIVITY x FREQ x HEM x ELECLOC 10
ACTIVITY x FREQ x HEM x ELECLOC x ORIGGRP 10
Note. ACTIVITY indicates story activity (Imagining or Writing). FREQ indicates
Frequency Band (delta, theta, low alpha, high alpha, low Beta, high Beta). HEM
indicates Hemisphere (left, right). ELEC LOC indicates Electrode Location (Frontal,
Central, Parietal). ORIGGRP indicates grouped scores on the rated story originality
scores.
*p< .05. **p< .01. ***p< .001.
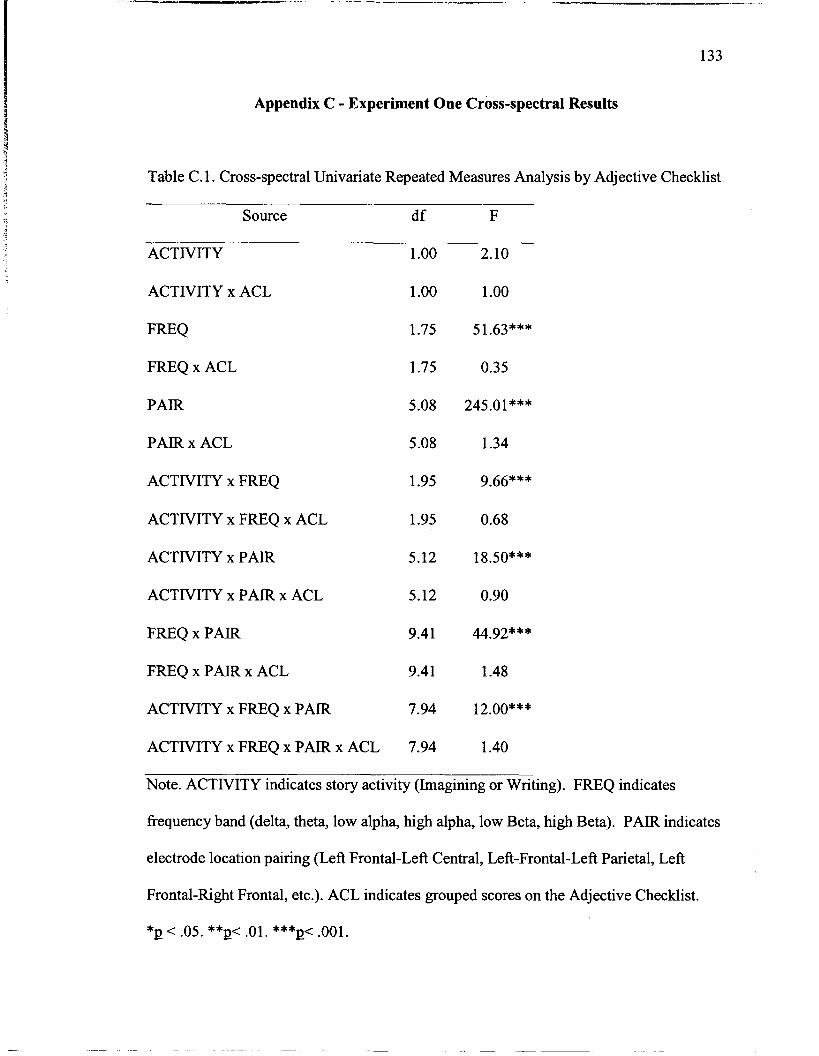
- -- - - - -- -- -- . --
133
Appendix C - Experiment One Cross-spectral Results
Table C. 1. Cross-spectral Univariate Repeated Measures Analysis by Adjective Checklist
Source d f F
ACTIVITY
ACTIVITY x ACL
FREQ
FREQ x ACL
PAIR
PAIR x ACL
ACTIVITY x FREQ
ACTIVITY x FREQ x ACL
ACTIVITY x PAIR
ACTIVITY x PAIR x ACL
FREQ x PAIR
FREQ x PAR x ACL
ACTIVITY x FREQ x PAIR
ACTIVITY x FREQ x PAIR x ACL
Note. ACTIVITY indicates story activity (Imagining or Writing). FREQ indicates
frequency band (delta, theta, low alpha, high alpha, low Beta, high Beta). PAIR indicates
electrode location pairing (Left Frontal-Left Central, Left-Frontal-Left Parietal, Left
Frontal-Right Frontal, etc.). ACL indicates grouped scores on the Adjective Checklist.
*E < .05. **p< .01. ***Q< .001.

Table C.2. Cross-spectral Univariate Repeated Measures Analysis by Remote Associates
Test
Source d f F
ACTIVITY 1 .OO
ACTIVITY x RAT 1 .OO
FREQ 1.73
FREQ x RAT 1.73
PAIR 4.95
PAIR x RAT 4.95
ACTIVITY x FREQ 1.97
ACTIVITY x FREQ x RAT 1.97
ACTIVITY x PAIR 5.23
ACTIVITY x PAIR x RAT 5.23
FREQ x PAIR 9.54
FREQ x PAIR x RAT 9.54
ACTIVITY x FREQ x PAIR 7.94
ACTIVITY x FREQ x PAIR x RAT 7.94
Note. ACTIVITY indicates story activity (Imagining or Writing). FREQ indicates
fkequency band (delta, theta, low alpha, high alpha, low Beta, high Beta). PAIR indicates
electrode location pairing (Left Frontal-Left Central, Left-Frontal-Left Parietal, Left
Frontal-Right Frontal, etc.). RAT indicates grouped scores on the Remote Associates
Test.
*p< .05. **p< .01. ***p< .001.

Table C.3. Cross-spectral Univariate Repeated Measures Analysis by Word Association
Test
Source d f F
ACTIVITY
ACTIVITY x WORD
FREQ x WORD
PAIR
PAIR x WORD
ACTIVITY x FREQ
ACTIVITY x FREQ x WORD
ACTIVITY x PAIR
ACTIVITY x PAIR x WORD
FREQ x PAIR
FREQ x PAIR x WORD
ACTIVITY x FREQ x PAIR
ACTIVITY x FREQ x PAIR x WORD
Note. ACTIVITY indicates story activity (Imagining or Writing). FREQ indicates
fkequency band (delta, theta, low alpha, high alpha, low Beta, high Beta). PAIR indicates
electrode location pairing (Left Frontal-Left Central, Left-Frontal-Left Parietal, Left
Frontal-Right Frontal, etc.). WORD indicates grouped scores on the Word Association
Test.
*p< .05. **p< .01. ***p< .001.
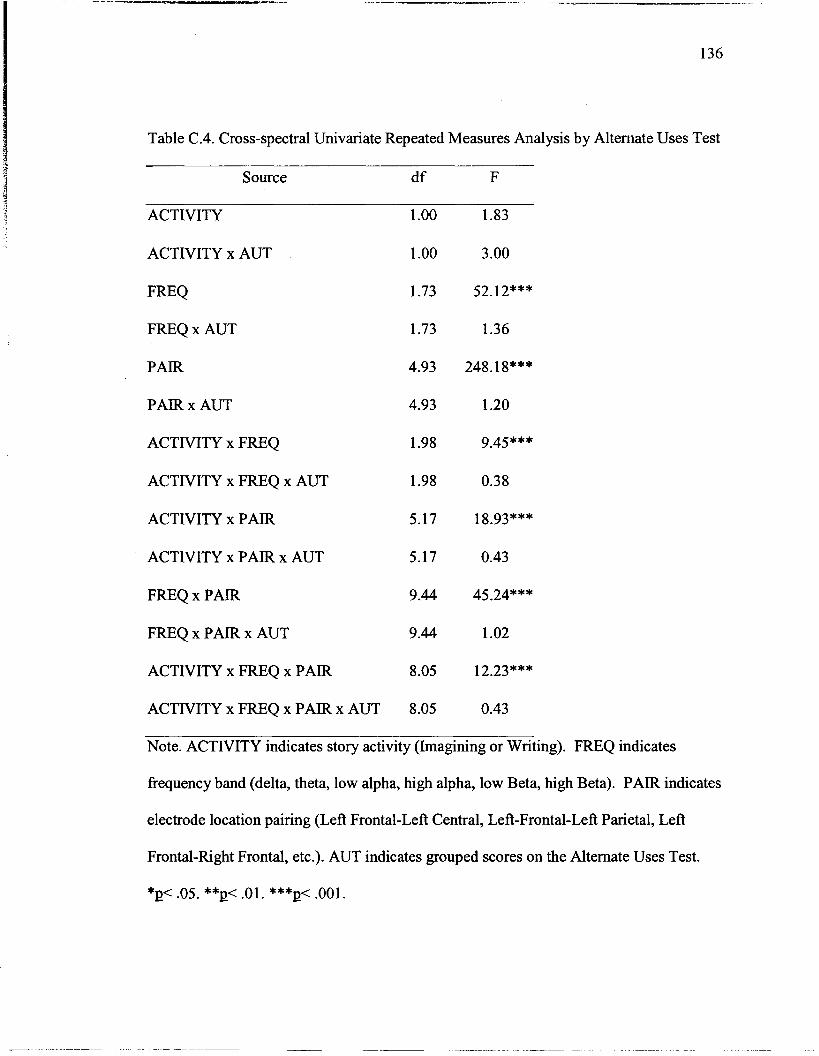
7 -- --
136
Table C.4. Cross-spectral Univariate Repeated Measures Analysis by Alternate Uses Test
Source d f F
5 ACTIVITY 1 .OO
ACTIVITY x AUT 1 .OO
F R - Q 1.73
FREQ x AUT 1.73
PAIR 4.93
PAIR x AUT 4.93
ACTIVITY x FREQ 1.98
ACTIVITY x FREQ x AUT 1.98
ACTIVITY x PAIR 5.17
ACTIVITY x PAIR x AUT 5.17
FREQ x PAIR 9.44
FREQ x PAIR x AUT 9.44
ACTIVITY x FREQ x PAIR 8.05
ACTIVITY x FREQ x PAIR x AUT 8.05
Note. ACTIVITY indicates story activity (Imagining or Writing). FREQ indicates
frequency band (delta, theta, low alpha, high alpha, low Beta, high Beta). PAIR indicates
electrode location pairing (Left Frontal-Left Central, Left-Frontal-Left Parietal, Left
Frontal-Right Frontal, etc.). AUT indicates grouped scores on the Alternate Uses Test.
*p< .05. **p< .01. ***p< .001.

Table C.5. Cross-spectral Univariate Repeated Measures Analysis by Shipley Institute of
Living Scale
Source d f F
ACTIVITY
ACTIVITY x SHIP
FREQ
FREQ x SHIP
PAIR
PAIR x SHIP
ACTIVITY x FREQ
ACTIVITY x FREQ x SHIP
ACTIVITY x PAIR
ACTIVITY x PAIR x SHIP
FREQ x PAIR
FREQ x PAIR x SHIP
ACTIVITY x FREQ x PAIR
ACTIVITY x FREQ x PAIR x SHIP
Note. ACTIVITY indicates story activity (Imagining or Writing). FREQ indicates
frequency band (delta, theta, low alpha, high alpha, low Beta, high Beta). PAIR indicates
electrode location pairing (Left Frontal-Left Central, Left-Frontal-Left Parietal, Left
Frontal-Right Frontal, etc.). SHIP indicates grouped scores on the Shipley Institutes of
Living Test (intellectual functioning measure).
*Q< .05. **g< .01. ***PC .001.
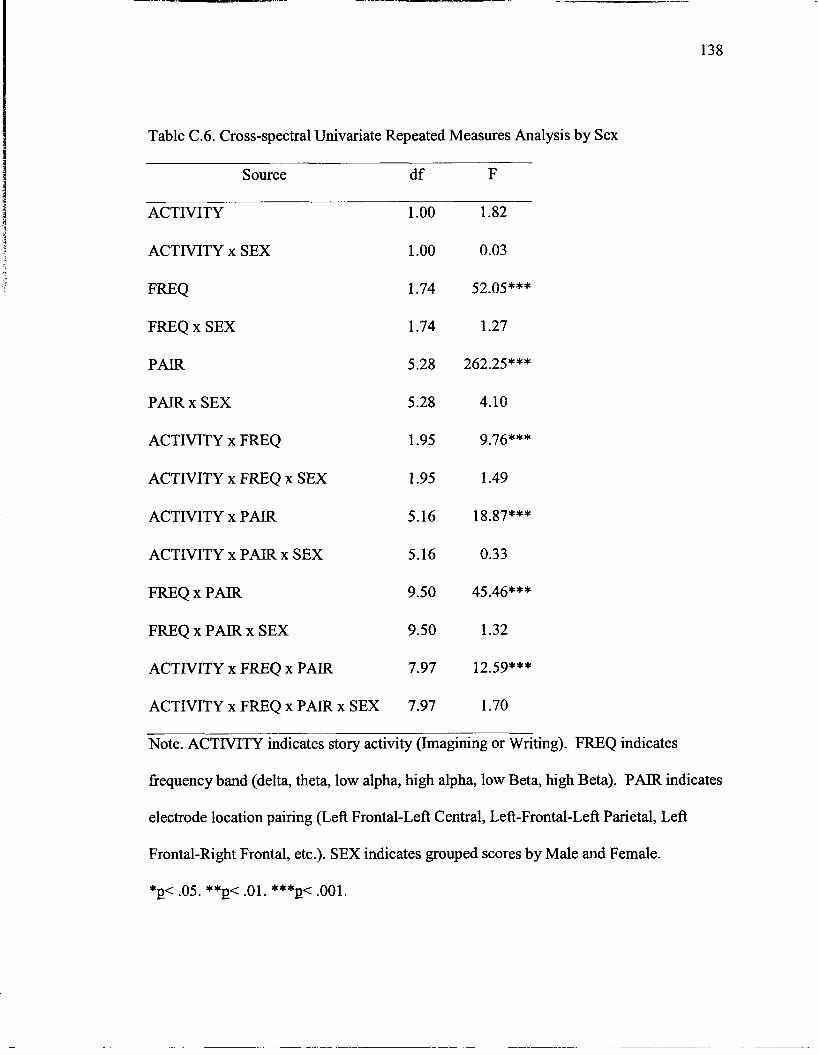
Table C.6. Cross-spectral Univariate Repeated Measures Analysis by Sex
Source d f F
ACTIVITY
ACTIVITY x SEX
FREQ
FREQ x SEX
PAIR
PAIR x SEX
ACTIVITY x FREQ
ACTIVITY x FREQ x SEX
ACTIVITY x PAIR
ACTIVITY x PAIR x SEX
FREQ x PAIR
FREQ x PAIR x SEX
ACTIVITY x FREQ x PAIR
ACTIVITY x FREQ x PAIR x SEX
Note. ACTIVITY indicates story activity (Imagining or Writing). FREQ indicates
frequency band (delta, theta, low alpha, high alpha, low Beta, high Beta). PAIR indicates
electrode location pairing (Left Frontal-Left Central, Left-Frontal-Lefi Parietal, Left
Frontal-Right Frontal, etc.). SEX indicates grouped scores by Male and Female.
*p< .05. **p< .01. ***p< .001.
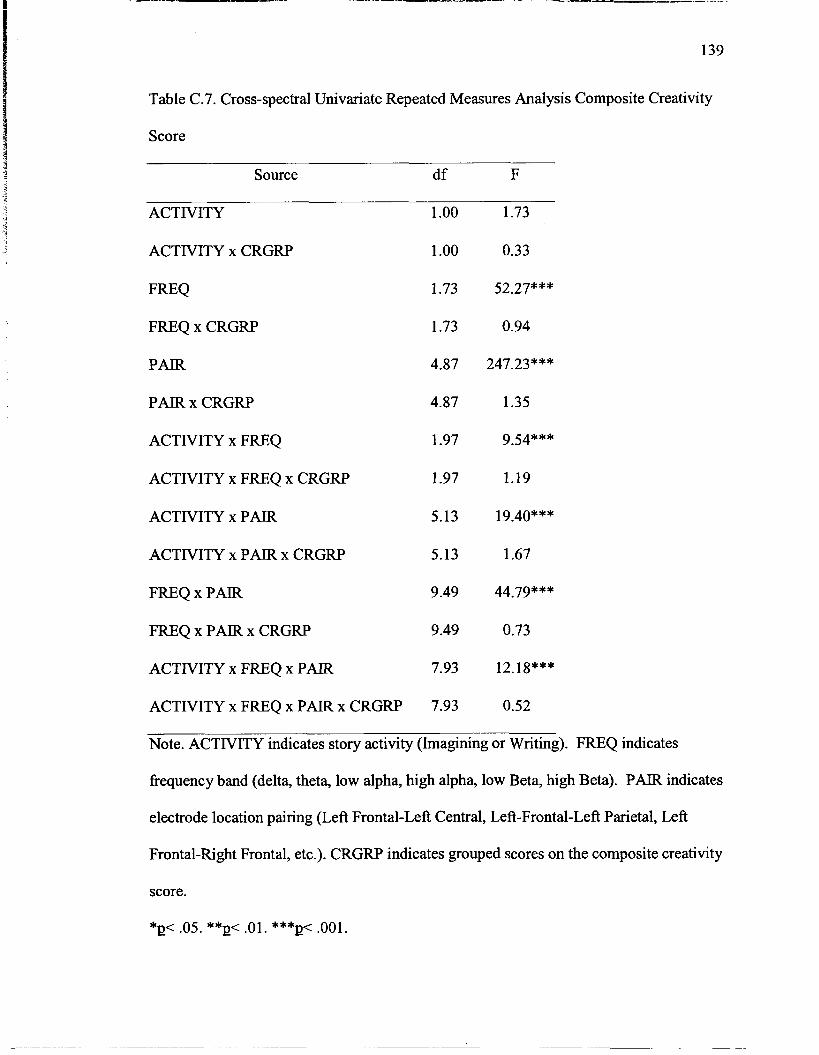
Table C.7. Cross-spectral Univariate Repeated Measures Analysis Composite Creativity
Score
Source d f F
ACTIVITY
ACTIVITY x CRGRP
FREQ x CRGRP
PAIR
PAIR x CRGRP
ACTIVITY x FREQ
ACTIVITY x FREQ x CRGRP
ACTIVITY x PAIR
ACTIVITY x PAIR x CRGRP
FREQ x PAIR
FREQ x PAIR x CRGRP
ACTIVITY x FREQ x PAIR
ACTIVITY x FREQ x PAIR x CRGRP
Note. ACTIVITY indicates story activity (Imagining or Writing). FREQ indicates
frequency band (delta, theta, low alpha, high alpha, low Beta, high Beta). PAIR indicates
electrode location pairing (Left Frontal-Left Central, Left-Frontal-Left Parietal, Left
Frontal-Right Frontal, etc.). CRGRP indicates grouped scores on the composite creativity
score.
*p< .05. **p< .01. ***p< .001.
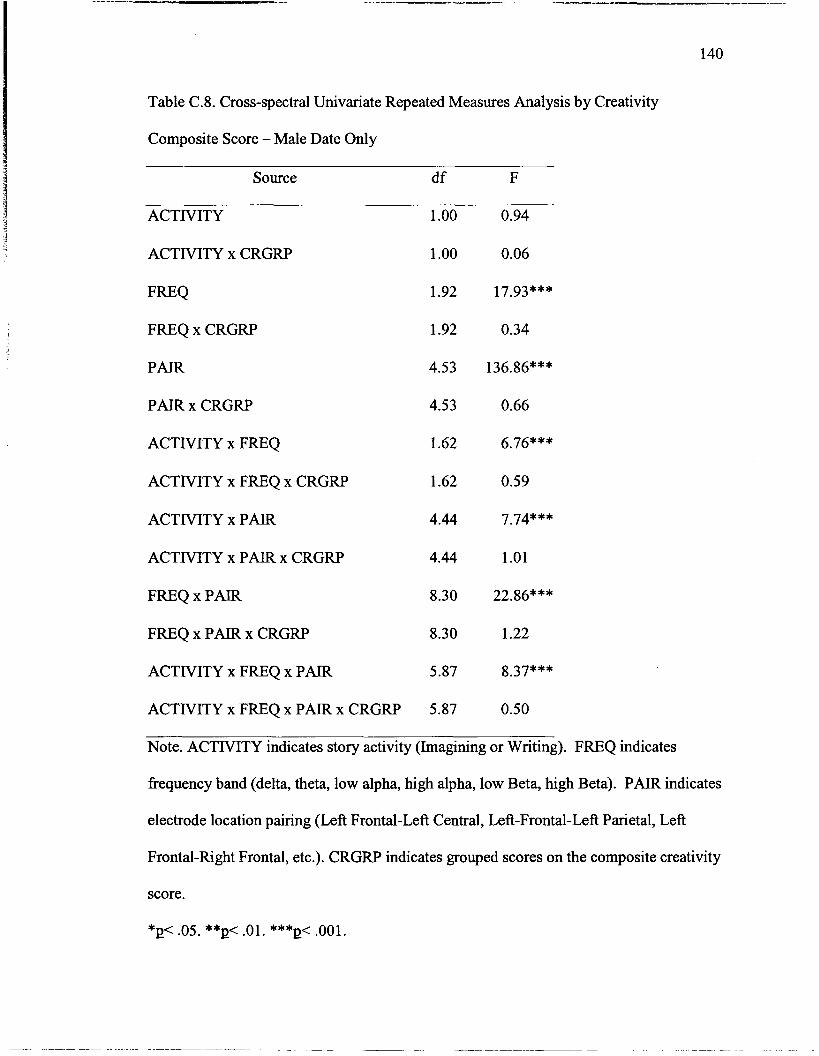
7 - -
140
Table C.8. Cross-spectral Univariate Repeated Measures Analysis by Creativity
Composite Score - Male Date Only
Source d f F i I 3 ACTIVITY
3
ACTIVITY x CRGRP
FREQ
FREQ x CRGRP
PAIR
PAIR x CRGRP
ACTIVITY x FREQ
ACTIVITY x FREQ x CRGRP
ACTIVITY x PAIR
ACTIVITY x PAIR x CRGRP
FREQ x PAIR
FREQ x PAIR x CRGRP
ACTIVITY x FREQ x PAIR
ACTIVITY x FREQ x PAIR x CRGRP
Note. ACTIVITY indicates story activity (Imagining or Writing). FREQ indicates
frequency band (delta, theta, low alpha, high alpha, low Beta, high Beta). PAIR indicates
electrode location pairing (Left Frontal-Left Central, Left-Frontal-Left Parietal, Left
Frontal-Right Frontal, etc.). CRGRP indicates grouped scores on the composite creativity
score.
*p< .05. **p< .01. ***p< -001.
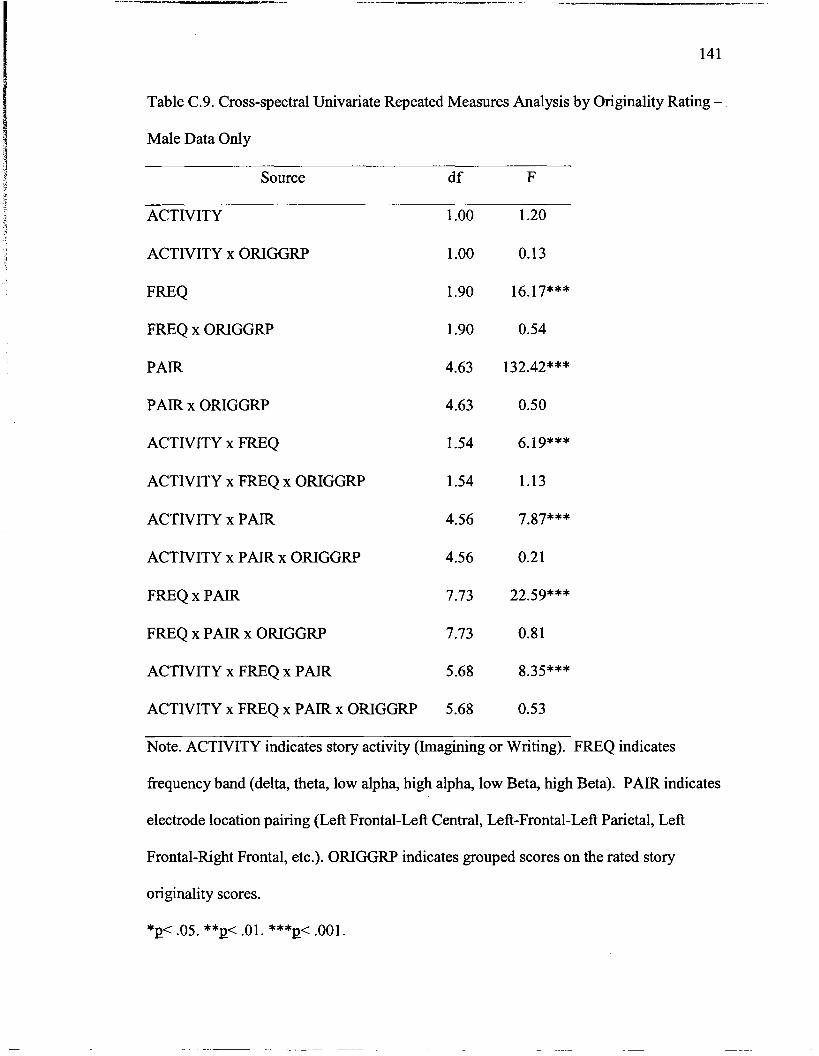
Table C.9. Cross-spectral Univariate Repeated Measures Analysis by Originality Rating -
Male Data Only
Source d f F
ACTIVITY
ACTIVITY x ORIGGRP
FREQ
FREQ x ORIGGRP
PAIR
PAIR x ORIGGRP
ACTIVITY x FREQ
ACTIVITY x FREQ x ORIGGRP
ACTIVITY x PAIR
ACTIVITY x PAIR x ORIGGRP
FREQ x PAIR
FREQ x PAIR x ORIGGRP
ACTIVITY x FREQ x PAIR
ACTIVITY x FREQ x PAIR x ORIGGRP
Note. ACTIVITY indicates story activity (Imagining or Writing). FREQ indicates
frequency band (delta, theta, low alpha, high alpha, low Beta, high Beta). PAIR indicates
electrode location pairing (Left Frontal-Left Central, Left-Frontal-Left Parietal, Left
Frontal-Right Frontal, etc.). ORIGGRP indicates grouped scores on the rated story
originality scores.
*Q< .05. **p< .01. ***E< .001.
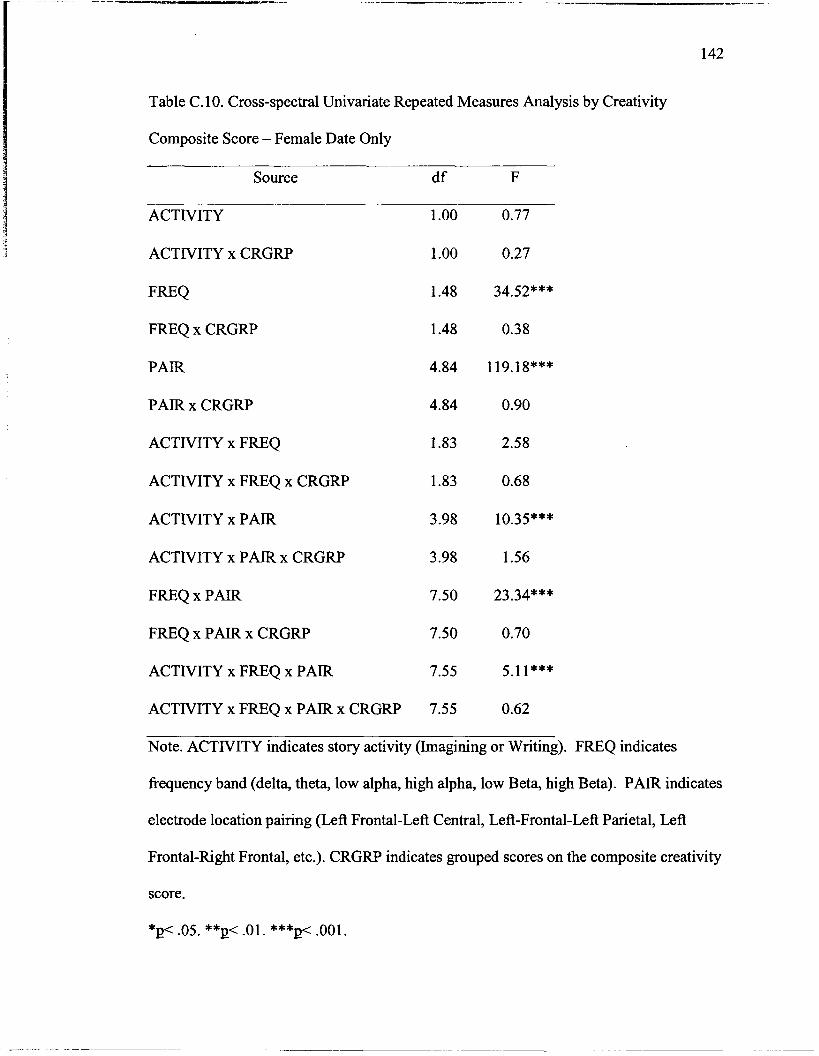
-- - ---- -- --
142
Table C. 10. Cross-spectral Univariate Repeated Measures Analysis by Creativity
Composite Score - Female Date Only
Source d f F
ACTIVITY
ACTIVITY x CRGRP
FREQ
FREQ x CRGRP
PAIR
PAIR x CRGRP
ACTIVITY x FREQ
ACTIVITY x FREQ x CRGRP
ACTIVITY x PAIR
ACTIVITY x PAIR x CRGRP
FREQ x PAIR
FREQ x PAIR x CRGRP
ACTIVITY x FREQ x PAIR
ACTIVITY x FREQ x PAIR x CRGRP
Note. ACTIVITY indicates story activity (Imagining or Writing). FREQ indicates
frequency band (delta, theta, low alpha, high alpha, low Beta, high Beta). PAIR indicates
electrode location pairing (Left Frontal-Left Central, Left-Frontal-Left Parietal, Left
Frontal-Right Frontal, etc.). CRGRP indicates grouped scores on the composite creativity
score.
*p< .05. **p< -01. ***p< .001.

Table C. 1 1 . Cross-spectral Univariate Repeated Measures Analysis by Originality Rating
- Female Data Only
Source d f F
ACTIVITY
ACTIVITY x ORIGGRP
FREQ
FREQ x ORIGGRP
PAIR
PAIR x ORIGGRP
ACTIVITY x FREQ
ACTIVITY x FREQ x ORIGGRP
ACTIVITY x PAIR
ACTIVITY x PAIR x ORIGGRP
FREQ x PAIR
FREQ x PAIR x ORIGGRP
ACTIVITY x FREQ x PAIR
ACTIVITY x FREQ x PAIR x ORIGGRP
Note. ACTIVITY indicates story activity (Imagining or Writing). FREQ indicates
frequency band (delta, theta, low alpha, high alpha, low Beta, high Beta). PAIR indicates
electrode location pairing (Left Frontal-Left Central, Left-Frontal-Left Parietal, Left
Frontal-Right Frontal, etc.). ORIGGRP indicates grouped scores on the rated story
originality scores.
*p< .05. **p< .01. ***p< .001.
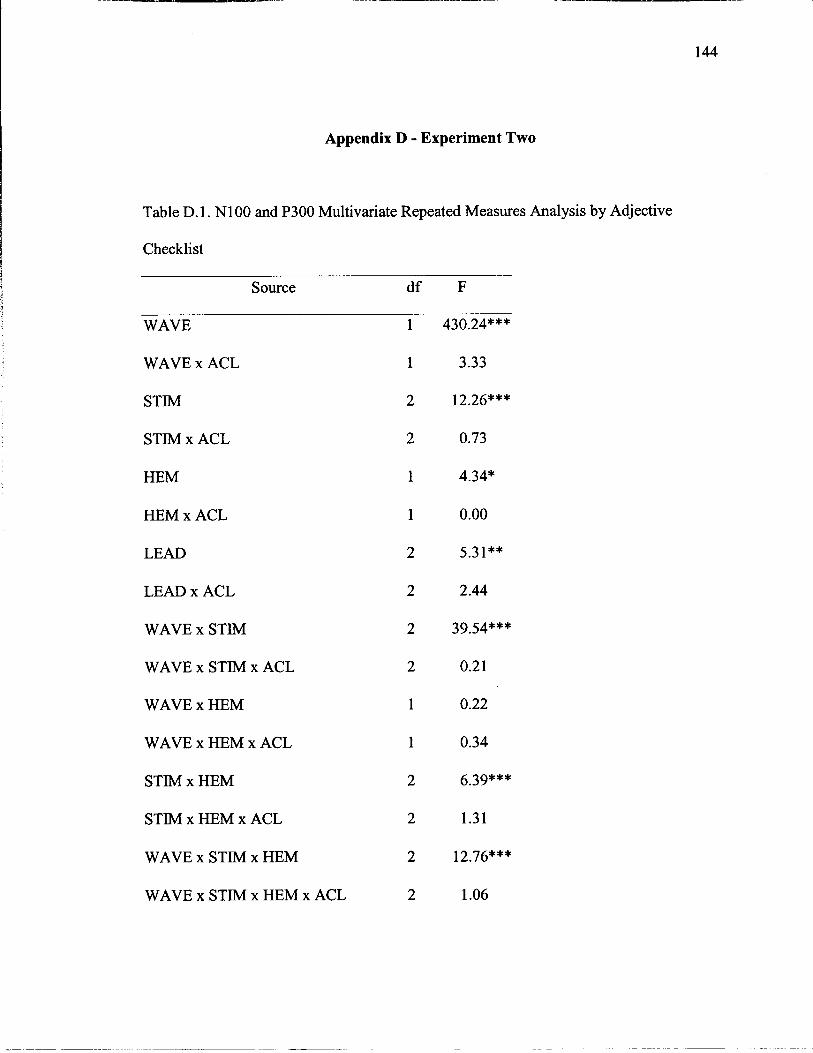
Appendix D - Experiment Two
Table D.1. NlOO and P300 Multivariate Repeated Measures Analysis by Adjective
Checklist
Source d f F
WAVE
WAVE x ACL
STIM
STIM x ACL
HEM
HEM x ACL
LEAD
LEAD x ACL
WAVE x STIM
WAVE x STIM x ACL
WAVE x HEM
WAVE x HEM x ACL
STIM x HEM
STIM x HEM x ACL
WAVE x STIM x HEM
WAVE x STIM x HEM x ACL

Table Dl. Continued
WAVE x LEAD
WAVE x LEAD x ACL
STIM x LEAD
STIM x LEAD x ACL
WAVE x STIM x LEAD
WAVE x STIM x LEAD x ACL
HEM x LEAD
HEM x LEAD x ACL
WAVE x HEM x LEAD
WAVE x HEM x LEAD x ACL
STIM x HEM x LEAD
STIM x HEM x LEAD x ACL
WAVE x STIM x HEM x LEAD
WAVE x STIM x HEM x LEAD x ACL 4
Note. WAVE indicates waveform (N100 or P300). STIM TYPE indicates Stimulus Type
(A, B, Novel). HEM indicates Hemisphere (left, right). ELEC LOC indicates Electrode
Location (Frontal, Central, Parietal). ACL indicates grouped scores on the Adjective
Checklist.
*p< .05. **p< .01. ***p< .001.

Table D.2. NlOO and P300 Multivariate Repeated Measures Analysis by Remote
Associates Test
Source d f F -
WAVE
WAVE x RAT
STIM
STIM x RAT
HEM
HEM x RAT
LEAD
LEAD x RAT
WAVE x STIM
WAVE x STIM x RAT
WAVE x HEM
WAVE x HEM x RAT
STIM x HEM
STIM x HEM x RAT
WAVE x STIM x HEM
WAVE x STIM x HEM x RAT
WAVE x LEAD
WAVE x LEAD x RAT
STIM x LEAD

Table D.2. Continued
STIM x LEAD x RAT 4
WAVE x STIM x LEAD 4
WAVE x STIM x LEAD x RAT 4
HEM x LEAD 2
HEM x LEAD x RAT 2
WAVE x HEM x LEAD 2
WAVE x HEM x LEAD x RAT 2
STIM x HEM x LEAD 4
STIM x HEM x LEAD x RAT 4
WAVE x STIM x HEM x LEAD 4
WAVE x STIM x HEM x LEAD x RAT 4
Note. WAVE indicates waveform (NO0 or P300). STIM TYPE indicates Stimulus Type
(A, B, Novel). HEM indicates Hemisphere (left, right). ELEC LOC indicates Electrode
Location (Frontal, Central, Parietal). RAT indicates grouped scores on the Remote
Associates Test.
*p< .05. **p< .01. ***p< .001.
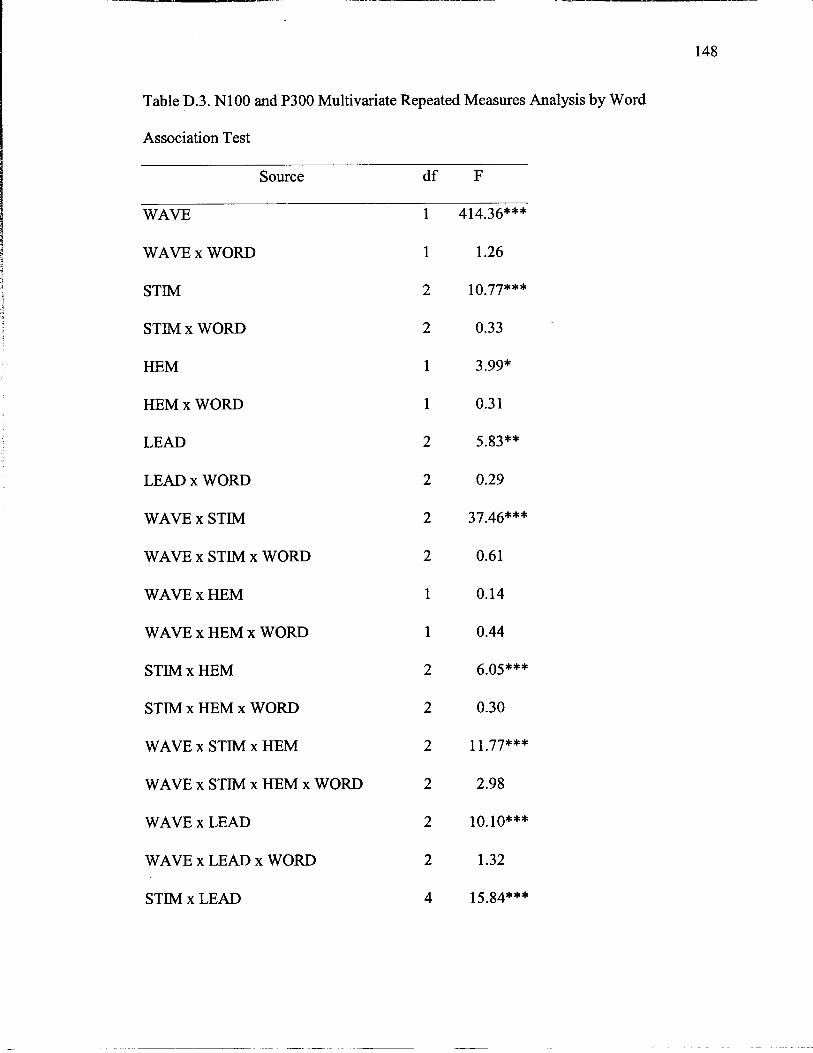
Table D.3. NlOO and P300 Multivariate Repeated Measures Analysis by Word
Association Test
Source d f
WAVE
WAVE x WORD
STIM
STIM x WORD
HEM
HEM x WORD
LEAD
LEAD x WORD
WAVE x STIM
WAVE x STIM x WORD
WAVE x HEM
WAVE x HEM x WORD
STIM x HEM
STIM x HEM x WORD
WAVE x STIM x HEM
WAVE x STIM x HEM x WORD
WAVE x LEAD
WAVE x LEAD x WORD
STIM x LEAD

Table D.3. Continued
STIM x LEAD x WORD 4
WAVE x STIM x LEAD 4
WAVE x STIM x LEAD x WORD 4
HEM x LEAD 2
HEM x LEAD x WORD 2
WAVE x HEM x LEAD 2
WAVE x HEM x LEAD x WORD 2
STIM x HEM x LEAD 4
STIM x HEM x LEAD x WORD 4
WAVE x STIM x HEM x LEAD 4
WAVE x STIM x HEM x LEAD x WORD 4
Note. WAVE indicates waveform (NO0 or P300). STlM TYPE indicates Stimulus Type
(A, B, Novel). HEM indicates Hemisphere (left, right). ELEC LOC indicates Electrode
Location (Frontal, Central, Parietal). WORD indicates grouped scores on the Word
Association Test.
*p< .05. **p< .01. ***PC .001.
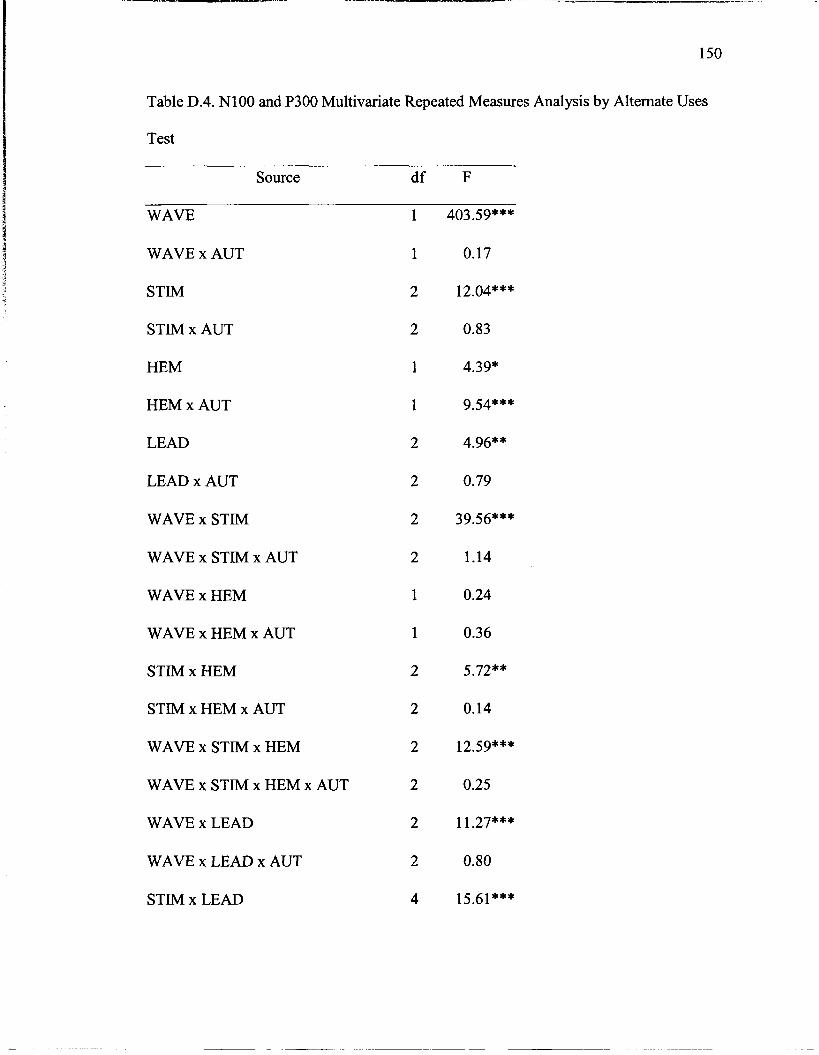
Table D.4. NlOO and P300 Multivariate Repeated Measures Analysis by Alternate Uses
Test
Source d f F
WAVE
WAVE x AUT
STIM
STIM x AUT
HEM
HEM x AUT
LEAD
LEAD x AUT
WAVE x STIM
WAVE x STIM x AUT
WAVE x HEM
WAVE x HEM x AUT
STIM x HEM
STIM x HEM x AUT
WAVE x STIM x HEM
WAVE x STIM x HEM x AUT
WAVE x LEAD
WAVE x LEAD x AUT
STIM x LEAD
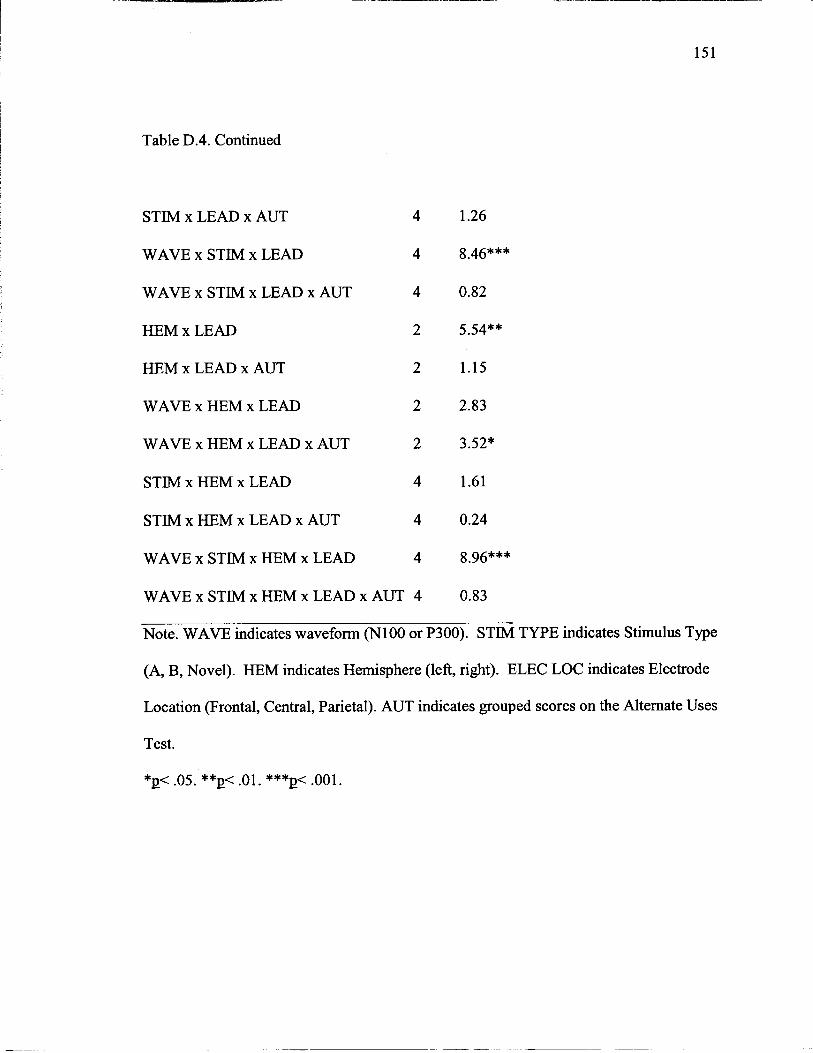
Table D.4. Continued
STlM x LEAD x AUT 4 1.26
WAVE x STlM x LEAD 4 8.46***
WAVE x STlM x LEAD x AUT 4 0.82
HEM x LEAD 2 5.54**
HEM x LEAD x AUT 2 1.15
WAVE x HEM x LEAD 2 2.83
WAVE x HEM x LEAD x AUT 2 3.52*
STIM x HEM x LEAD 4 1.61
STIM x HEM x LEAD x AUT 4 0.24
WAVE x STIM x HEM x LEAD 4 8.96***
WAVE x STIM x HEM x LEAD x AUT 4 0.83
Note. WAVE indicates waveform (N100 or P300). STIM TYPE indicates Stimulus Type
(A, B, Novel). HEM indicates Hemisphere (left, right). ELEC LOC indicates Electrode
Location (Frontal, Central, Parietal). AUT indicates grouped scores on the Alternate Uses
Test.
*Q< .05. **Q< .01. ***PC .001.
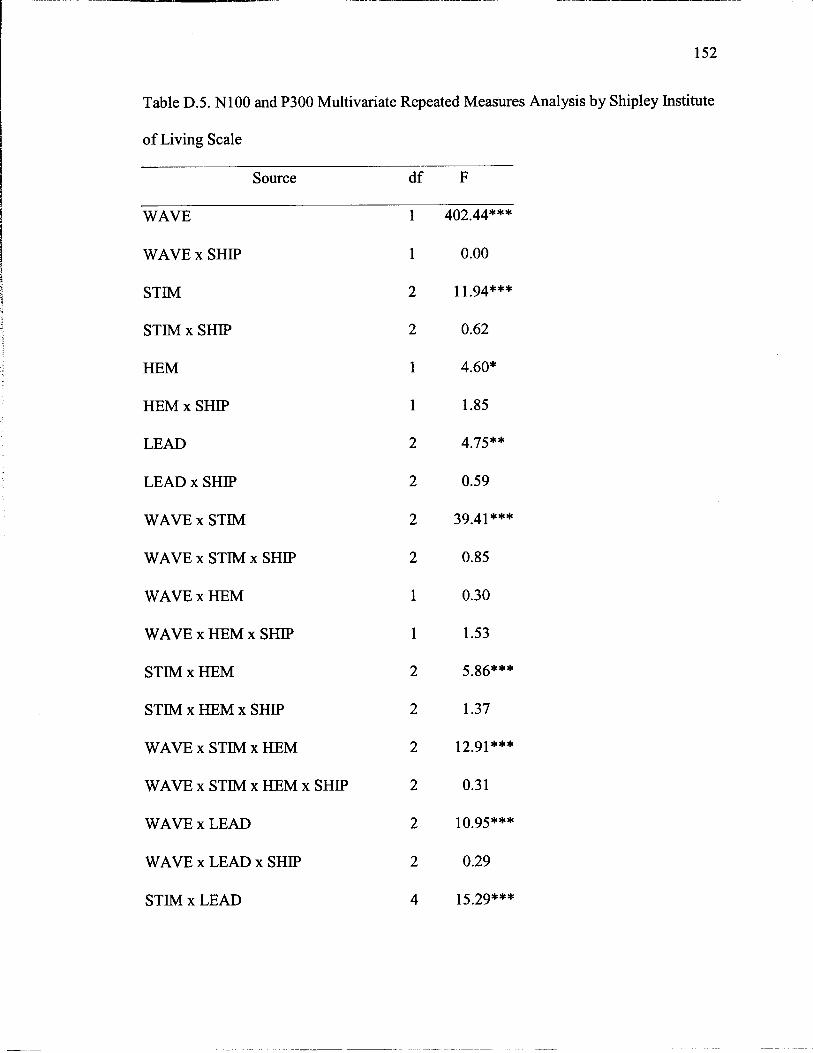
Table D.5. NlOO and P300 Multivariate Repeated Measures Analysis by Shipley Institute
of Living Scale
Source d f F
WAVE
WAVE x SHIP
STIM
STIM x SHIP
HEM
HEM x SHIP
LEAD
LEAD x SHIP
WAVE x STIM
WAVE x STIM x SHIP
WAVE x HEM
WAVE x HEM x SHIP
STIM x HEM
STIM x HEM x SHIP
WAVE x STIM x HEM
WAVE x STIM x HEM x SHIP
WAVE x LEAD
WAVE x LEAD x SHIP
STIM x LEAD
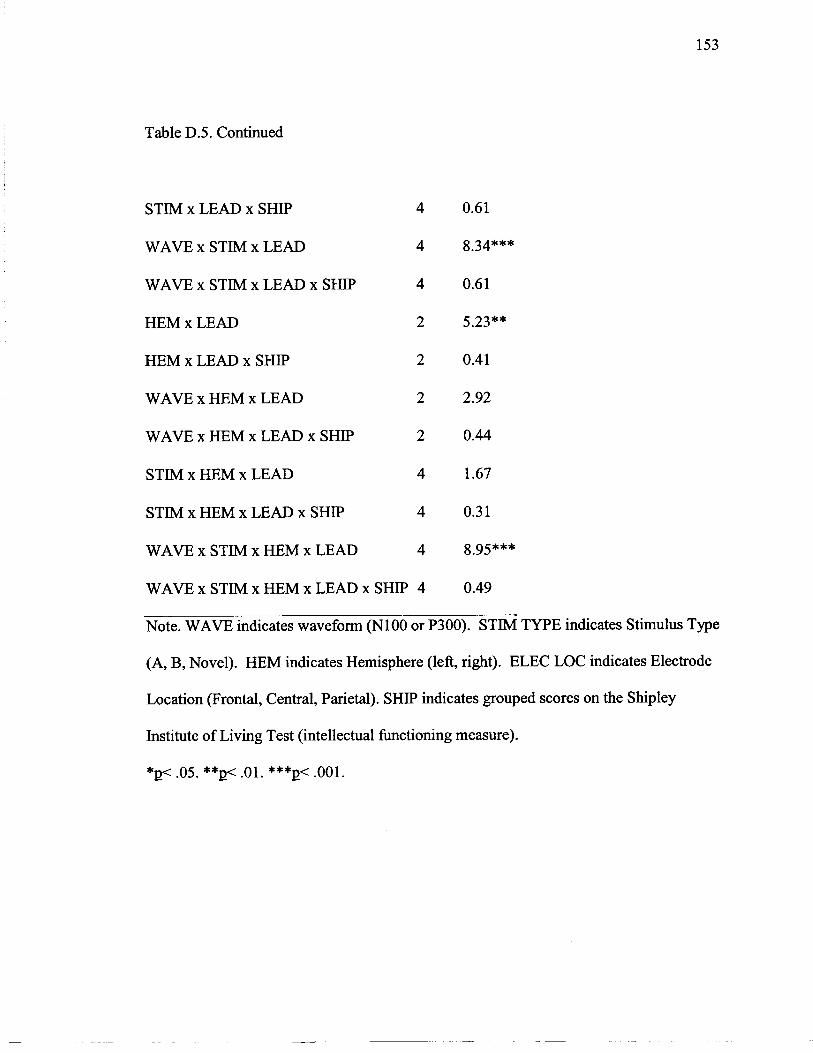
Table D.5. Continued
STIM x LEAD x SHIP 4
WAVE x STIM x LEAD 4
WAVE x STIM x LEAD x SHIP 4
HEM x LEAD 2
HEM x LEAD x SHIP 2
WAVE x HEM x LEAD 2
WAVE x HEM x LEAD x SHIP 2
STIM x HEM x LEAD 4
STIM x HEM x LEAD x SHIP 4
WAVE x STIM x HEM x LEAD 4
WAVE x STIM x HEM x LEAD x SHIP 4
Note. WAVE indicates waveform (NO0 or P300). STIM TYPE indicates Stimulus Type
(A, B, Novel). HEM indicates Hemisphere (left, right). ELEC LOC indicates Electrode
Location (Frontal, Central, Parietal). SHIP indicates grouped scores on the Shipley
Institute of Living Test (intellectual functioning measure).
*p< .05. **p< .01. ***g< .001.
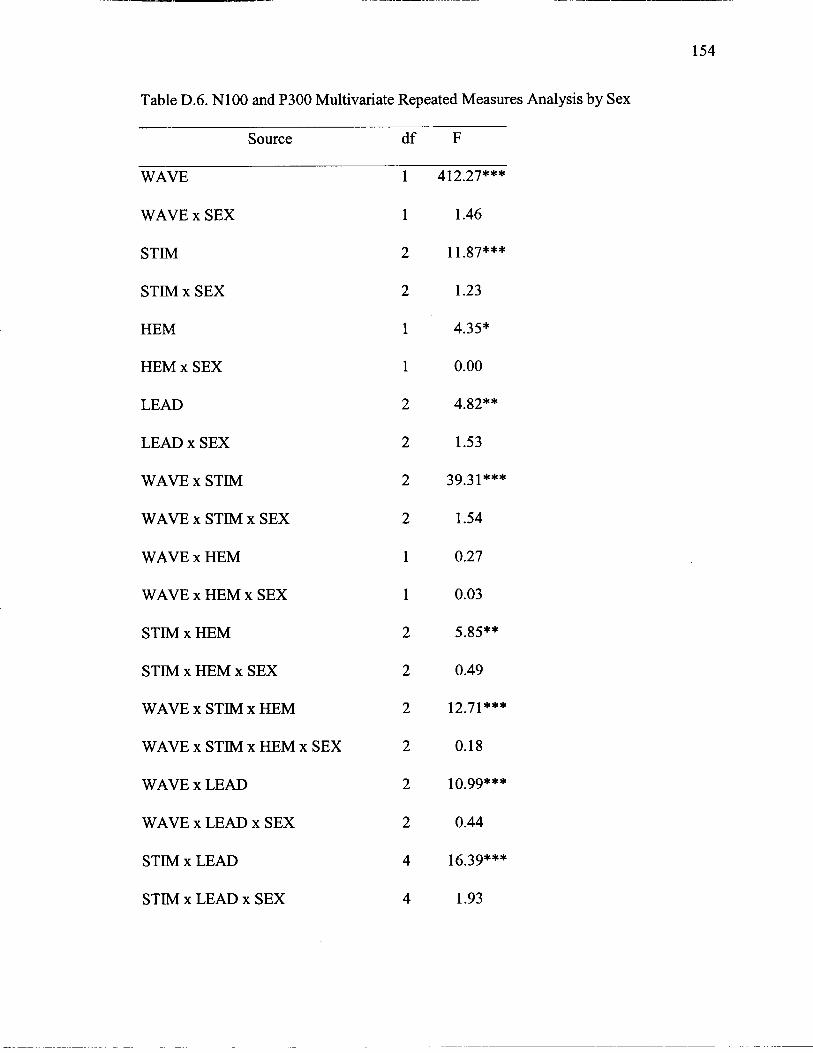
154
Table D.6. NlOO and P300 Multivariate Repeated Measures Analysis by Sex
Source d f F
WAVE
WAVE x SEX
STIM
STIM x SEX
HEM
HEM x SEX
LEAD
LEAD x SEX
WAVE x STIM
WAVE x STIM x SEX
WAVE x HEM
WAVE x HEM x SEX
STIM x HEM
STIM x HEM x SEX
WAVE x STIM x HEM
WAVE x STIM x HEM x SEX
WAVE x LEAD
WAVE x LEAD x SEX
STIM x LEAD
STIM x LEAD x SEX

Table D.6. Continued
WAVE x STIM x LEAD 4
WAVE x STlM x LEAD x SEX 4
HEM x LEAD 2
HEM x LEAD x SEX 2
WAVE x HEM x LEAD 2
WAVE x HEM x LEAD x SEX 2
STIM x HEM x LEAD 4
STIM x HEM x LEAD x SEX 4
WAVE x STIM x HEM x LEAD 4
WAVE x STIM x HEM x LEAD x SEX 4
Note. WAVE indicates waveform (N100 or P300). STIM TYPE indicates Stimulus Type
(A, B, Novel). HEM indicates Hemisphere (left, right). ELEC LOC indicates Electrode
Location (Frontal, Central, Parietal). SEX indicates grouped scores by Male and Female.
*p< .05. **p< .01. ***PC .001.
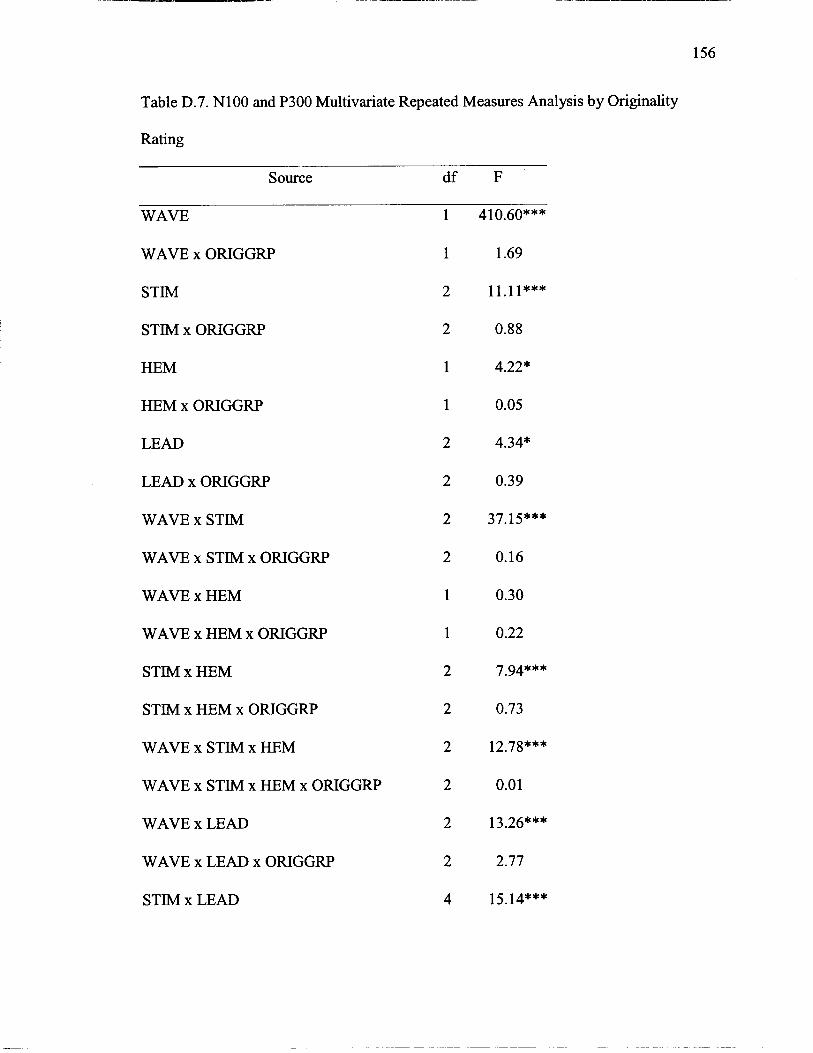
Table D.7. NlOO and P300 Multivariate Repeated Measures Analysis by Originality
Rating
Source d f F
WAVE
WAVE x ORIGGRP
STIM
STIM x ORIGGRP
HEM
HEM x ORIGGRP
LEAD
LEAD x ORIGGRP
WAVE x STIM
WAVE x STIM x ORIGGRP
WAVE x HEM
WAVE x HEM x ORIGGRP
STIM x HEM
STIM x HEM x ORIGGRP
WAVE x STIM x HEM
WAVE x STIM x HEM x ORIGGRP
WAVE x LEAD
WAVE x LEAD x ORIGGRP
STIM x LEAD

Table D.7. Continued
STIM x LEAD x ORIGGRP 4
WAVE x STIM x LEAD 4
WAVE x STIM x LEAD x ORIGGRP 4
HEM x LEAD 2
HEM x LEAD x ORIGGRP 2
WAVE x HEM x LEAD 2
WAVE x HEM x LEAD x ORIGGRP 2
STIM x HEM x LEAD 4
STIM x HEM x LEAD x ORIGGRP 4
WAVE x STIM x HEM x LEAD 4
WAVE x STIM x HEM x LEAD x ORIGGRP 4
Note. WAVE indicates wavefonn (N100 or P300). STIM TYPE indicates Stimulus Type
(A, B, Novel). HEM indicates Hemisphere (left, right). ELEC LOC indicates Electrode
Location (Frontal, Central, Parietal). ORIGGRP indicates grouped scores on the rated
story originality scores.
*p< .05. **p< .01. ***p< .001.

Table D.8. NlOO and P300 Multivariate Repeated Measures Analysis by Originality
Rating - Male Data Only
WAVE
Source
WAVE x ORIGGRP
STIM
STIM x ORIGGRP
HEM
HEM x ORIGGRP
LEAD
LEAD x ORIGGRP
WAVE x STIM
WAVE x STIM x ORIGGRP
WAVE x HEM
WAVE x HEM x ORIGGRP
STIM x HEM
STIM x HEM x ORIGGRP
WAVE x STIM x HEM
WAVE x STIM x HEM x ORIGGRP
WAVE x LEAD
WAVE x LEAD x ORIGGRP
STIM x LEAD

Table D.8. Continued
STIM x LEAD x ORIGGRP 4
WAVE x STIM x LEAD 4
WAVE x STIM x LEAD x ORIGGRP 4
HEM x LEAD 2
HEM x LEAD x ORIGGRP 2
WAVE x HEM x LEAD 2
WAVE x HEM x LEAD x ORIGGRP 2
STIM x HEM x LEAD 4
STIM x HEM x LEAD x ORIGGRP 4
WAVE x STIM x HEM x LEAD 4
WAVE x STIM x HEM x LEAD x ORIGGRP 4
Note. WAVE indicates waveform (NO0 or P300). STlM TYPE indicates Stimulus Type
(A, B, Novel). HEM indicates Hemisphere (left, right). ELEC LOC indicates Electrode
Location (Frontal, Central, Parietal). ORIGGRP indicates grouped scores on the rated
story originality scores.
*E< .05. **p< .01. ***p< .001.
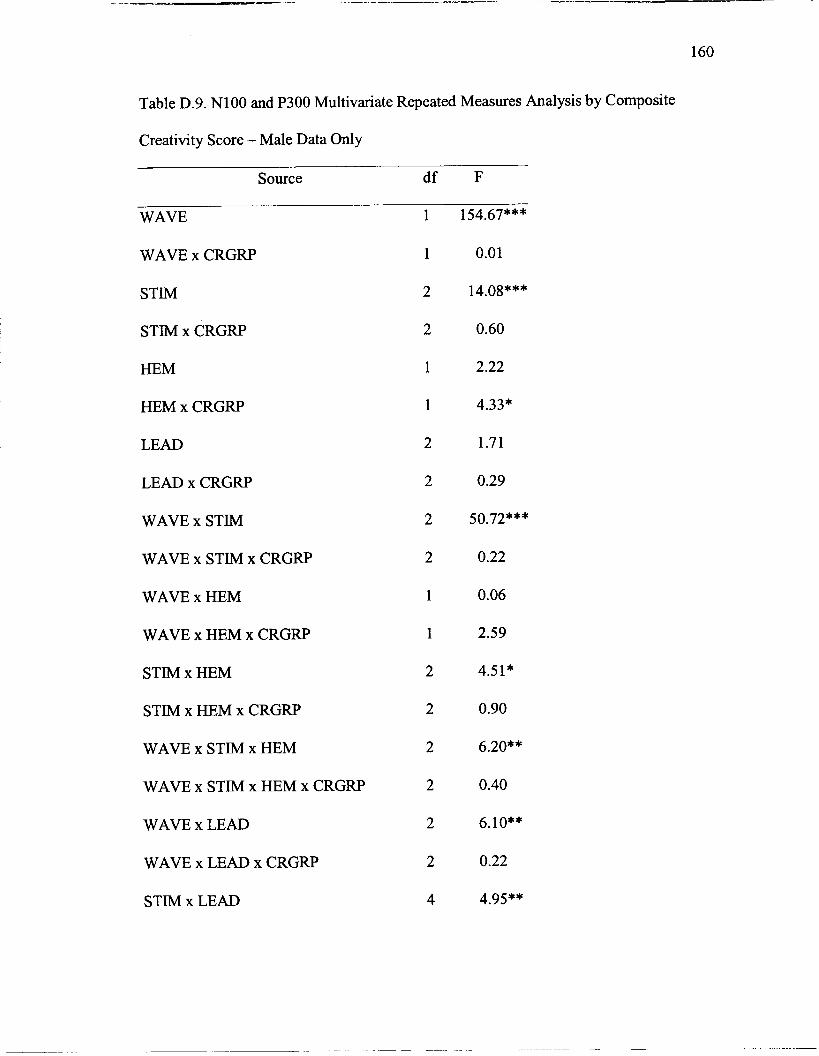
Table D.9. NlOO and P300 Multivariate Repeated Measures Analysis by Composite
Creativity Score - Male Data Only
Source d f F
WAVE
WAVE x CRGRP
STIM
STlM x CRGRP
HEM
HEM x CRGRP
LEAD
LEAD x CRGRP
WAVE x STIM
WAVE x STIM x CRGRP
WAVE x HEM
WAVE x HEM x CRGRP
STIM x HEM
STIM x HEM x CRGRP
WAVE x STIM x HEM
WAVE x STIM x HEM x CRGRP
WAVE x LEAD
WAVE x LEAD x CRGRP
STIM x LEAD

Table D.9. Continued
STIM x LEAD x CRGRP 4 0.67
WAVE x STIM x LEAD 4 3.02*
WAVE x STIM x LEAD x CRGRP 4 0.30
HEM x LEAD
HEM x LEAD x CRGRP
WAVE x HEM x LEAD 2 1.29
WAVE x HEM x LEAD x CRGRP 2 0.44
STIM x HEM x LEAD 4 0.69
STIM x HEM x LEAD x CRGRP 4 0.13
WAVE x STIM x HEM x LEAD 4 4.24**
WAVE x STIM x HEM x LEAD x CRGRP 4 0.74
Note. WAVE indicates waveform (N100 or P300). STIM TYPE indicates Stimulus Type
(A, B, Novel). HEM indicates Hemisphere (left, right). ELEC LOC indicates Electrode
Location (Frontal, Central, Parietal). CRGRP indicates grouped scores on the composite
creativity score.
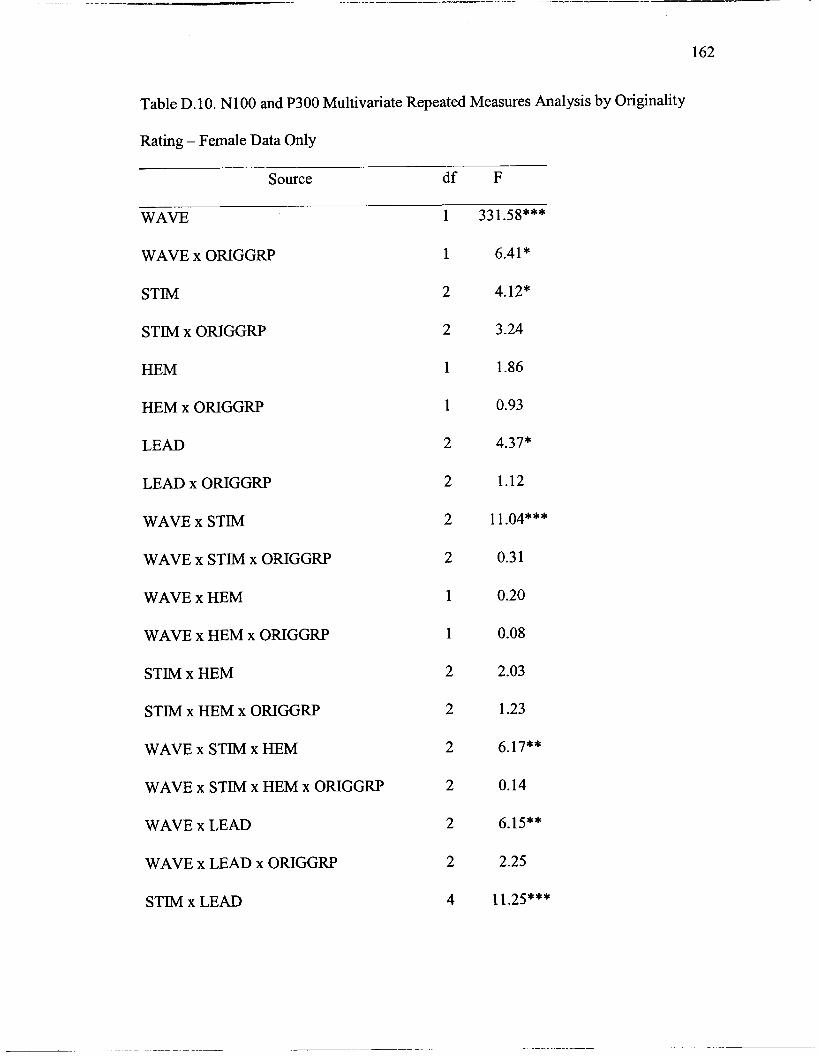
Table D. 10. Nl 00 and P300 Multivariate Repeated Measures Analysis by Originality
Rating - Female Data Only
Source d f F
WAVE
WAVE x ORIGGRP
STIM
STIM x ORIGGRP
HEM
HEM x ORIGGRP
LEAD
LEAD x ORIGGRP
WAVE x STIM
WAVE x STIM x ORIGGRP
WAVE x HEM
WAVE x HEM x ORIGGRP
STIM x HEM
STIM x HEM x ORIGGRP
WAVE x STIM x HEM
WAVE x STIM x HEM x ORIGGRP
WAVE x LEAD
WAVE x LEAD x ORIGGRP
STIM x LEAD
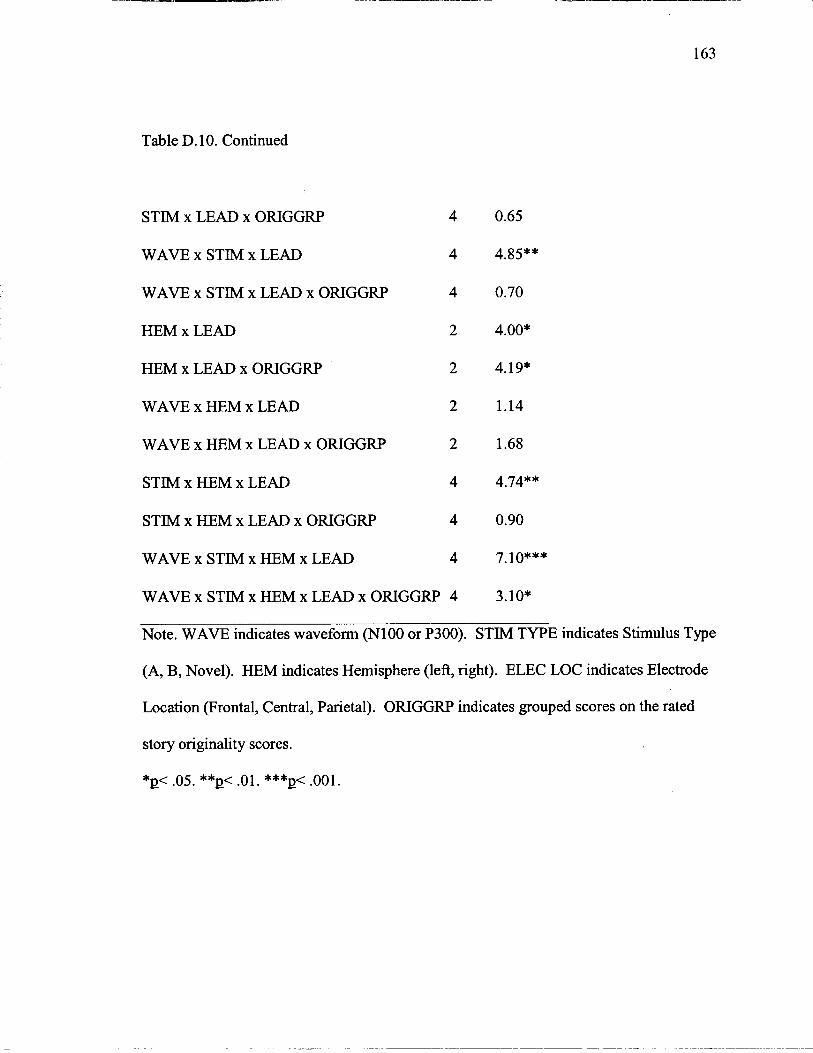
Table D. 10. Continued
STIM x LEAD x ORIGGRP 4
WAVE x STIM x LEAD 4
WAVE x STIM x LEAD x ORIGGRP 4
HEM x LEAD 2
HEM x LEAD x ORIGGRP 2
WAVE x HEM x LEAD 2
WAVE x HEM x LEAD x ORIGGRP 2
STIM x HEM x LEAD 4
STIM x HEM x LEAD x ORIGGRP 4
WAVE x STIM x HEM x LEAD 4
WAVE x STIM x HEM x LEAD x ORIGGRP 4
Note. WAVE indicates waveform (NO0 or P300). STIM TYPE indicates Stimulus Type
(A, B, Novel). HEM indicates Hemisphere (left, right). ELEC LOC indicates Electrode
Location (Frontal, Central, Parietal). ORIGGRP indicates grouped scores on the rated
story originality scores.
*p< .05. **p< .01. ***p< .001.

Table D. 1 1. Nl 00 and P300 Multivariate Repeated Measures Analysis by Composite
Creativity Score - Female Data Only
Source d f F
WAVE
WAVE x CRGRP
STIM
STIM x CRGRP
HEM
HEM x CRGRP
LEAD
LEAD x CRGRP
WAVE x STIM
WAVE x STIM x CRGRP
WAVE x HEM
WAVE x HEM x CRGRP
STIM x HEM
STIM x HEM x CRGRP
WAVE x STIM x HEM
WAVE x STIM x HEM x CRGRP
WAVE x LEAD
WAVE x LEAD x CRGRP
STIM x LEAD
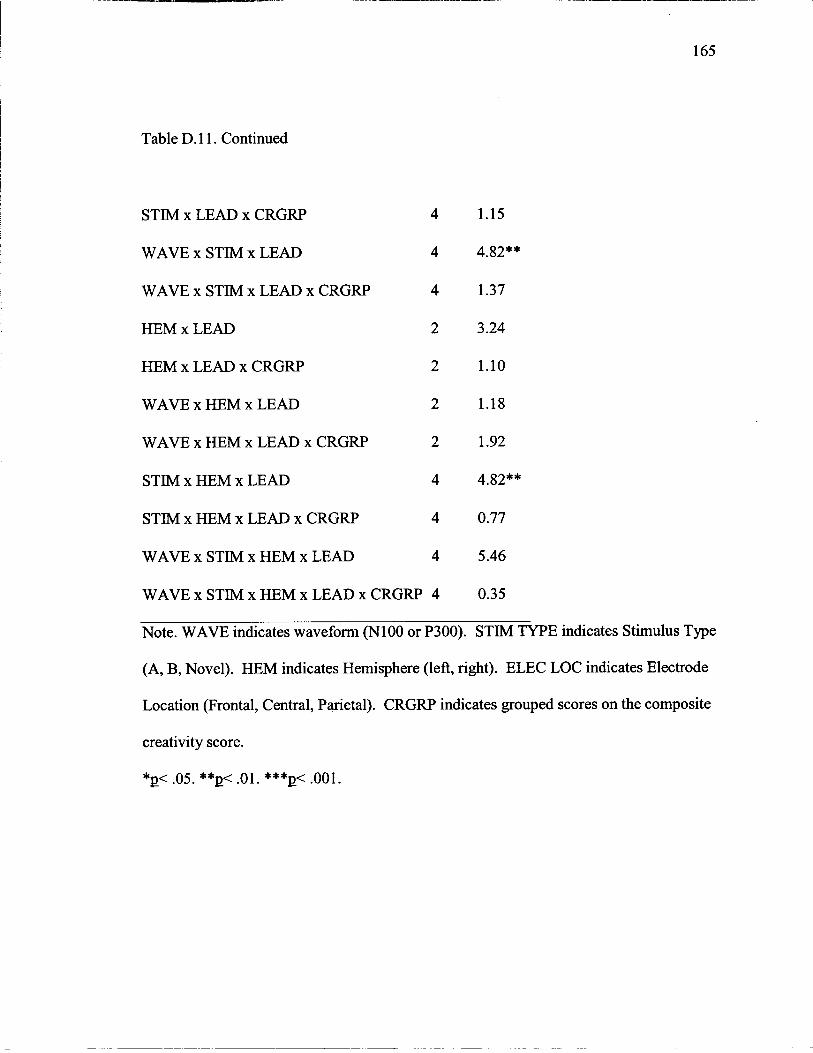
Table D. 1 1. Continued
STIM x LEAD x CRGRP 4 1.15
WAVE x STIM x LEAD 4 4.82**
WAVE x STIM x LEAD x CRGRP 4 1.37
HEM x LEAD 2 3.24
HEM x LEAD x CRGRP 2 1.10
WAVE x HEM x LEAD 2 1.18
WAVE x HEM x LEAD x CRGRP 2 1.92
STIM x HEM x LEAD 4 4.82**
STIM x HEM x LEAD x CRGRP 4 0.77
WAVE x STIM x HEM x LEAD 4 5.46
WAVE x STlM x HEM x LEAD x CRGRP 4 0.35
Note. WAVE indicates waveform (N100 or P300). STIM TYPE indicates Stimulus Type
(A, B, Novel). HEM indicates Hemisphere (left, right). ELEC LOC indicates Electrode
Location (Frontal, Central, Parietal). CRGRP indicates grouped scores on the composite
creativity score.
*p< .05. **E< .01. ***p< .001.

Appendix E - Experiment Three
Table E. 1. N400 Multivariate Repeated Measures Analysis by Adjective Checklist
Source d f F
STIM 1 3.40
STIM x ACL 1 0.46
HEM 1 0.81
HEM x ACL
ELECLOC
ELECLOC x ACL
STIM x HEM 1 1.38
STIM x HEM x ACL 1 0.14
STIM x ELECLOC 2 4.47*
STIM x ELECLOC x ACL 2 0.14
HEM x ELECLOC 2 4.42*
HEM x ELECLOC x ACL 2 1.64
STIM x HEM x ELECLOC 2 0.06
STIM x HEM x ELECLOC x ACL 2 0.46
Note. STIM indicates Stimulus Type (Incongruous, Congruous). HEM indicates
Hemisphere (left, right). ELEC LOC indicates Electrode Location (Frontal, Central,
Parietal). ACL indicates grouped scores on the Adjective Checklist.
*p< .05. **p< .01. ***p< .001.

Table E.2. N400 Multivariate Repeated Measures Analysis by Remote Associates Test
Source d f F
STIM
STIM x RAT
HEM
HEM x RAT
ELECLOC 2
ELECLOC x RAT 2
STIM x HEM 1
STIM x HEM x RAT 1
STIM x ELECLOC 2
STIM x ELECLOC x RAT 2
HEM x ELECLOC 2
HEM x ELECLOC x RAT 2
STIM x HEM x ELECLOC 2
STIM x HEM x ELECLOC x RAT 2
Note. STIM indicates Stimulus Type (Incongruous, Congruous). HEM indicates
Hemisphere (left, right). ELEC LOC indicates Electrode Location (Frontal, Central,
Parietal). RAT indicates grouped scores on the Remote Associates Test.
*E< .05. **p< .01. ***p< .001.
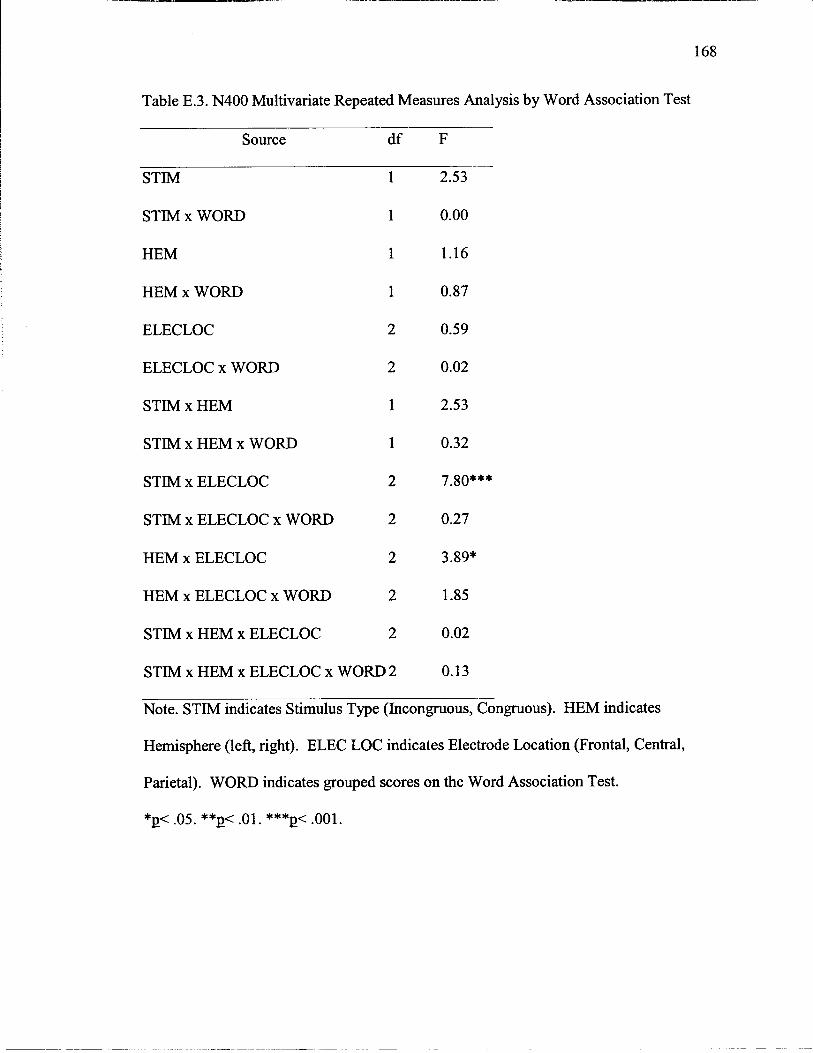
168
Table E.3. N400 Multivariate Repeated Measures Analysis by Word Association Test
Source d f F
STIM
STIM x WORD
HEM
HEM x WORD
ELECLOC
ELECLOC x WORD
STIM x HEM
STIM x HEM x WORD
STIM x ELECLOC
STIM x ELECLOC x WORD
HEM x ELECLOC
HEM x ELECLOC x WORD
STIM x HEM x ELECLOC
STIM x HEM x ELECLOC x WORD 2
Note. STIM indicates Stimulus Type (Incongruous, Congruous). HEM indicates
Hemisphere (left, right). ELEC LOC indicates Electrode Location (Frontal, Central,
Parietal). WORD indicates grouped scores on the Word Association Test.
*p< .05. **p< .01. ***p< .001.

Table E.4. N400 Multivari ate Repeated Measures Analysis 1:
169
~y Alternate Uses Test
Source d f F
STIM
STIM x AUT
HEM
HEM x AUT
ELECLOC 2
ELECLOC x AUT 2
STIM x HEM 1
STIM x HEM x AUT 1
STIM x ELECLOC 2
STIM x ELECLOC x AUT 2
HEM x ELECLOC 2
HEM x ELECLOC x AUT 2
STIM x HEM x ELECLOC 2
STIM x HEM x ELECLOC x AUT 2
Note. STIM indicates Stimulus Type (Incongruous, Congruous). HEM indicates
Hemisphere (left, right). ELEC LOC indicates Electrode Location (Frontal, Central,
Parietal). AUT indicates grouped scores on the Alternate Uses Test.
*p< .05. **p< .01. ***p< .001.
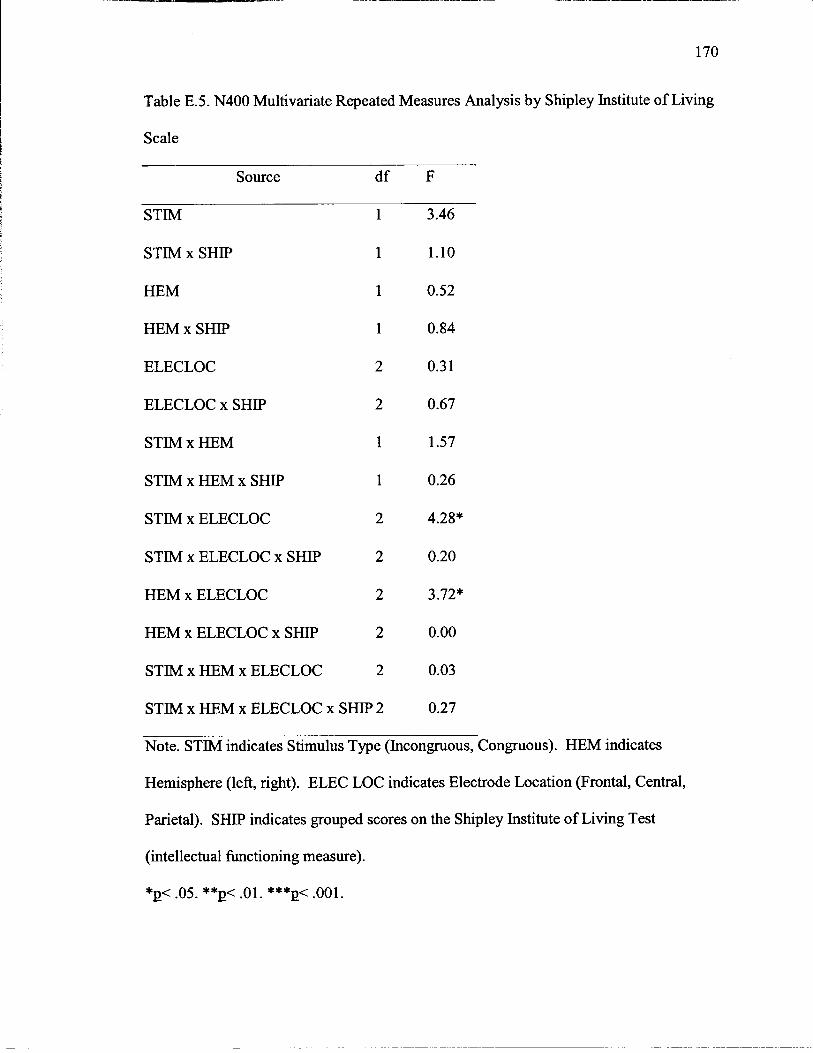
Table E.5. N400 Multivariate Repeated Measures Analysis by Shipley Institute of Living
Scale
Source df F
STIM
STIM x SHIP
HEM
HEM x SHIP
ELECLOC
ELECLOC x SHIP
STIM x HEM
STIM x HEM x SHIP
STIM x ELECLOC
STIM x ELECLOC x SHIP
HEM x ELECLOC
HEM x ELECLOC x SHIP
STIM x HEM x ELECLOC
STIM x HEM x ELECLOC x SHIP 2
Note. STIM indicates Stimulus Type (Incongruous, Congruous). HEM indicates
Hemisphere (left, right). ELEC LOC indicates Electrode Location (Frontal, Central,
Parietal). SHIP indicates grouped scores on the Shipley Institute of Living Test
(intellectual hctioning measure).
*Q< .05. **p< .01. ***p< .001.
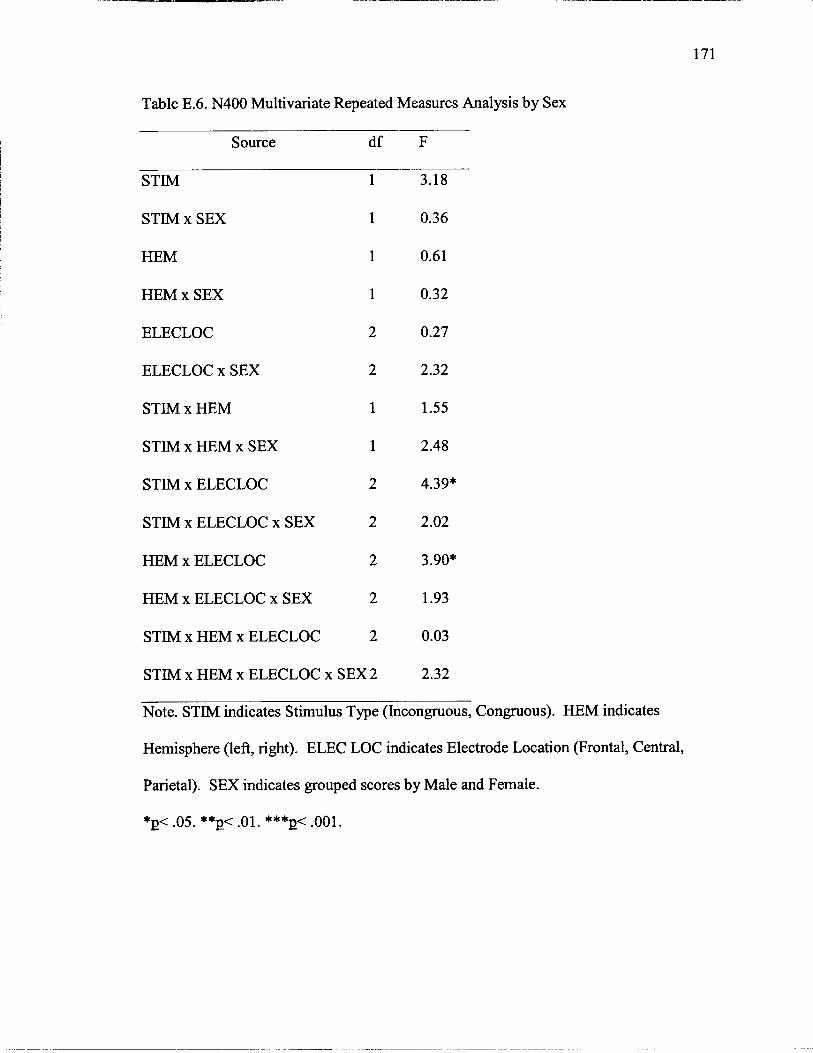
Table E.6. N400 Multivariate Repeated Measures Analysis b by Sex
STIM x SEX
HEM
HEM x SEX
-
Source d f F
STIM 1 3.18
0.36
0.61
0.32
ELECLOC 2
ELECLOC x SEX 2
STIM x HEM 1
STIM x HEM x SEX 1
STIM x ELECLOC 2
STIM x ELECLOC x SEX 2
HEM x ELECLOC 2
HEM x ELECLOC x SEX 2
STIM x HEM x ELECLOC 2
STIM x HEM x ELECLOC x SEX 2
Note. STIM indicates Stimulus Type (Incongruous, Congruous). HEM indicates
Hemisphere (left, right). ELEC LOC indicates Electrode Location (Frontal, Central,
Parietal). SEX indicates grouped scores by Male and Female.
*E< .05. **PC .01. ***p< .001.
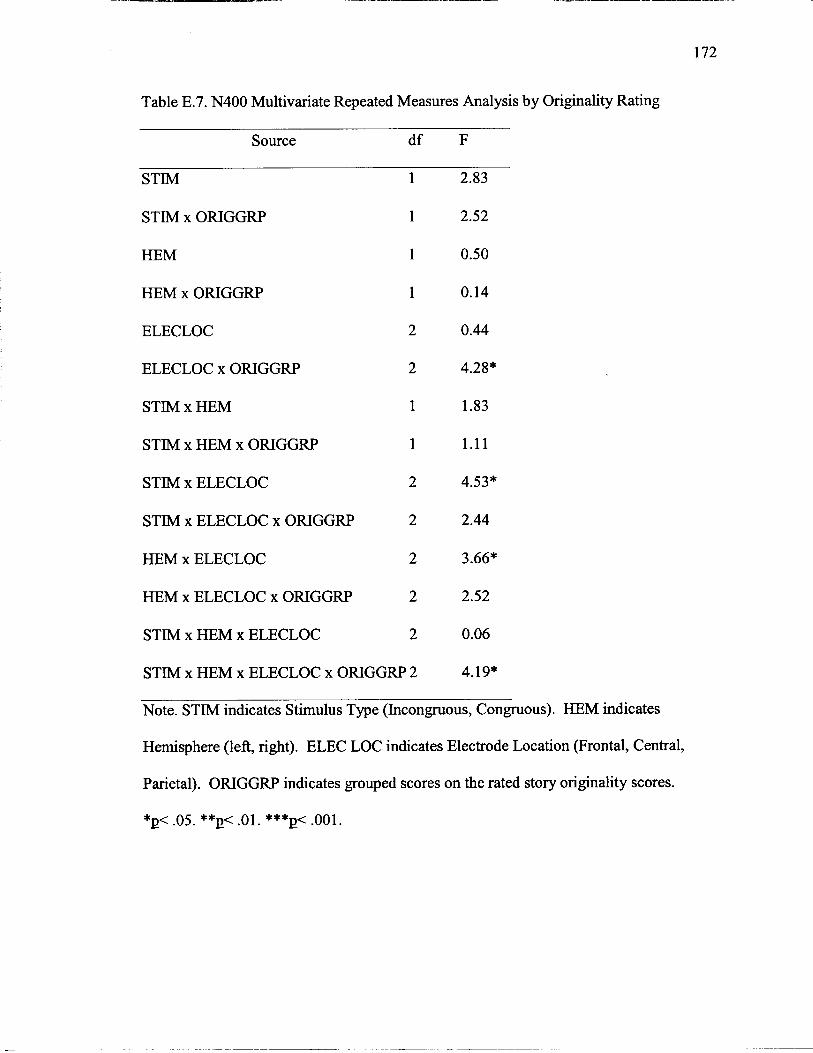
Table E.7. N400 Multivariate Repeated Measures Analysis by Originality Rating
Source d f F
STIM
STIM x ORIGGRP
HEM
HEM x ORIGGRP
ELECLOC
ELECLOC x ORIGGRP
STIM x HEM
STIM x HEM x ORIGGRP
STIM x ELECLOC
STIM x ELECLOC x ORIGGRP
HEM x ELECLOC
HEM x ELECLOC x ORIGGRP
STIM x HEM x ELECLOC
STIM x HEM x ELECLOC x ORIGGRP 2
Note. STIM indicates Stimulus Type (Incongruous, Congruous). HEM indicates
Hemisphere (left, right). ELEC LOC indicates Electrode Location (Frontal, Central,
Parietal). ORIGGRP indicates grouped scores on the rated story originality scores.
*p< -05. **Q< .01. ***Q< .001.
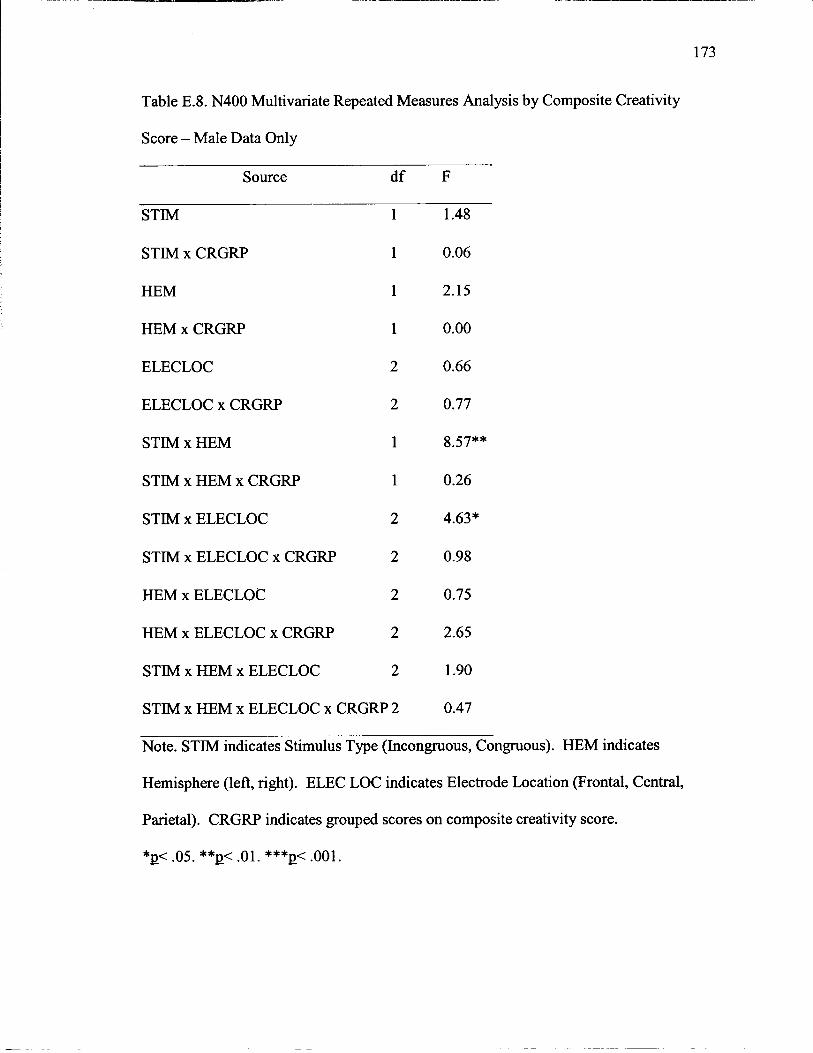
Table E.8. N400 Multivariate Repeated Measures Analysis by Composite Creativity
Score - Male Data Only
Source d f F
STIM
STIM x CRGRP
HEM
HEM x CRGRP
ELECLOC
ELECLOC x CRGRP
STIM x HEM
STIM x HEM x CRGRP
STIM x ELECLOC
STIM x ELECLOC x CRGRP
HEM x ELECLOC
HEM x ELECLOC x CRGRP
STIM x HEM x ELECLOC
STIM x HEM x ELECLOC x CRGRP 2
Note. STIM indicates Stimulus Type (Incongruous, Congruous). HEM indicates
Hemisphere (left, right). ELEC LOC indicates Electrode Location (Frontal, Central,
Parietal). CRGRP indicates grouped scores on composite creativity score.
*Q< .05. **p< .01. ***p< .001.
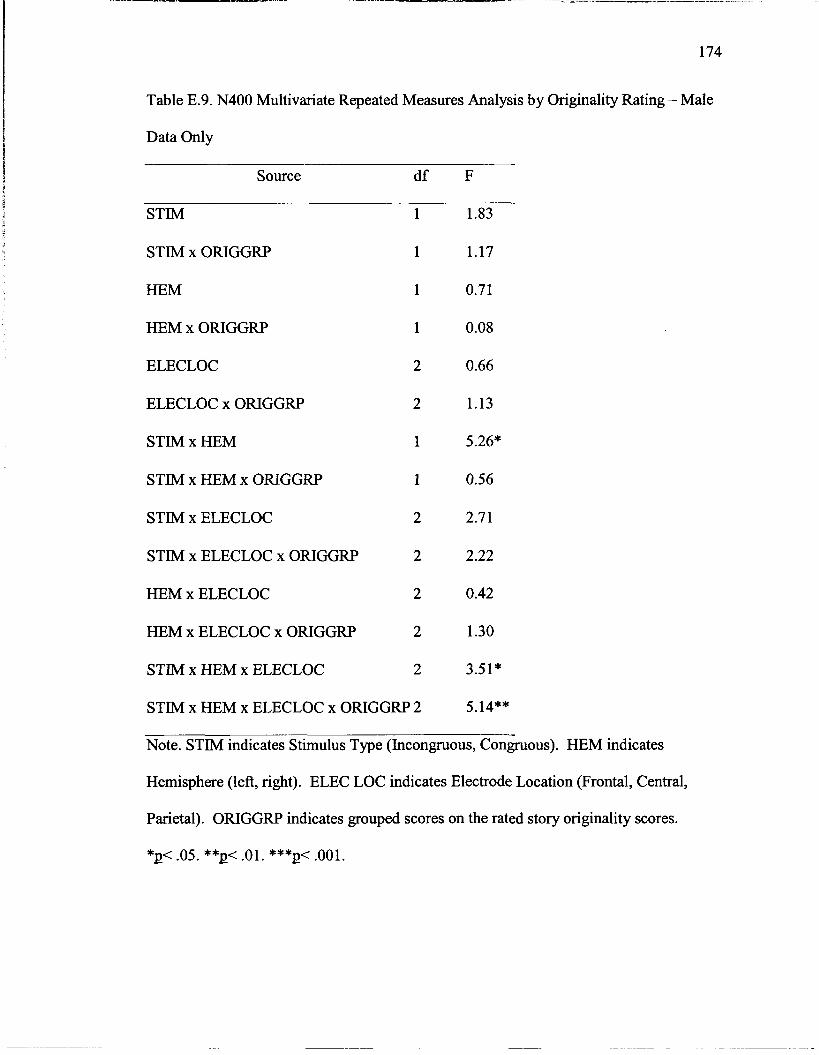
Table E.9. N400 Multivariate Repeated Measures Analysis by Originality Rating - Male
Data Only
Source d f F
STIM
STIM x ORIGGRP
HEM
HEM x ORIGGRP
ELECLOC
ELECLOC x ORIGGRP
STIM x HEM
STlM x HEM x ORIGGRP
STIM x ELECLOC
STIM x ELECLOC x ORIGGRP
HEM x ELECLOC
HEM x ELECLOC x ORIGGRP
STIM x HEM x ELECLOC
STIM x HEM x ELECLOC x ORIGGRP 2
Note. STIM indicates Stimulus Type (Incongruous, Congruous). HEM indicates
Hemisphere (left, right). ELEC LOC indicates Electrode Location (Frontal, Central,
Parietal). ORIGGRP indicates grouped scores on the rated story originality scores.
*E< .05. **p< .01. ***PC .001.

Table E. 10. N400 Multivariate Repeated Measures Analysis by Composite Creativity
Score - Female Data Only
Source d f F -
STIM
STIM x CRGRP
HEM
HEM x CRGRP
ELECLOC
ELECLOC x CRGRP
STIM x HEM
STIM x HEM x CRGRP
STIM x ELECLOC
STIM x ELECLOC x CRGRP
HEM x ELECLOC
HEM x ELECLOC x CRGRP
STIM x HEM x ELECLOC
STIM x HEM x ELECLOC x CRGRP 2
Note STIM indicates Stimulus Type (Incongruous, Congruous). HEM indicates
Hemisphere (left, right). ELEC LOC indicates Electrode Location (Frontal, Central,
Parietal). CRGRP indicates grouped scores on composite creativity score.
*p< .05. **p< -01. ***g< .001.

Table E. 1 1. N400 Multivariate Repeated Measures Analysis by Originality Rating -
Female Data Only
Source d f
STIM
STIM x ORIGGRP
HEM
HEM x ORIGGRP
ELECLOC
ELECLOC x ORIGGRP
STIM x HEM
STIM x HEM x ORIGGRP
STIM x ELECLOC
STIM x ELECLOC x ORIGGRP
HEM x ELECLOC
HEM x ELECLOC x ORIGGRP
STIM x HEM x ELECLOC
STIM x HEM x ELECLOC x ORIGGRP 2
Note. STIM indicates Stimulus Type (Incongruous, Congruous). HEM indicates
Hemisphere (left, right). ELEC LOC indicates Electrode Location (Frontal, Central,
Parietal). ORIGGRP indicates grouped scores on the rated story originality scores.
*p< .05. **p< .01. ***p< -001.

Appendix F - Paper and Pencil Test Instructions
Alternate Uses Test
On each of the next three pages will appear the name of a familiar object. Write
down all the different ways you can think of in which the object might be used. Do not
hesitate to write down whatever ways you can think of in which the object might be used
as long as they are possible uses for the object. Try to be as original and creative as you
can. Write each use on a separate line.
Brick
Shoe
Newspaper

Remote Associates Test
INSTRUCTIONS: In this test you are presented with three words and asked to find a
fourth work which is related to all three. Write this word in the space to the right.
For example, what word do you think is related to these three?
A. Cookies Sixteen Heart
The answer in this case is "sweet". Coolues are sweet; sweet is part of the phrase "sweet
sixteen", and part of the word "sweetheart".
Here is another example:
B: Poke Go Molasses
You should have written "slow" in the space provided. "slow Poke", "go slow", "slow as
molasses". As you can see, the fourth word may be related tot he other three for various reasons.
Try these next two:
C. Surprise Line
D. Base Snow
Birthday
Dance
The answers are at the bottom of the page.
Now turn to page two and try this group of words. Many of these are not easy and you
will have to think about some for a while. If you have trouble with some groups of three, go on
to the next and come back to them later. You will have 30 Minutes.
Make sure your name is on this test.
The answers are: C: Party D: Ball

Page 2.
stop
elephant
lick
shopping
stalk
sea
walker
mouse
envy
board
athletes
Pot
bald
note
cherry
Southern
chocolate
bass
wicked
skunk
habit
soap
blood
room
widow
chamber
inch
puss
jump
sore
Petty
lapse
sprinkle
washer
trainer
home
main
sharp
golf
magic
web
butterflies
screech
dive
time
console
fortune
complex
bustle
kings
pouch
shoe
music
Saturday
bite
staff
deal
spit
kill
shoulder
sneak
vivid
mines
picture
king
stomach
sweeper
blue
beans
death
rabbit
Pump
emblem
chair
smell
station
tin
sleep
slick
boiled
road
tissue
cheese
salts
monkey
box
Peg
spoiled
bliss
sweat

Creative Personality Scale
Please check of the words that you would use to describe yourself. Please
check & the words that you would use to describe yourself.
Affected
Capable
Cautious
Clever
Commonplace
Confident
Conservative
Conventional
Dissatisfied
Egotistical
Honest
Humorous
Individualistic
Informal
Insightful
Intelligent
Interests-narrow
Interests-wide
Inventive
Mannerly
Original
Reflective
Resourceful
Self-confident
Sexy
Sincere
Snobbish
Submissive
Suspicious
Unconventional
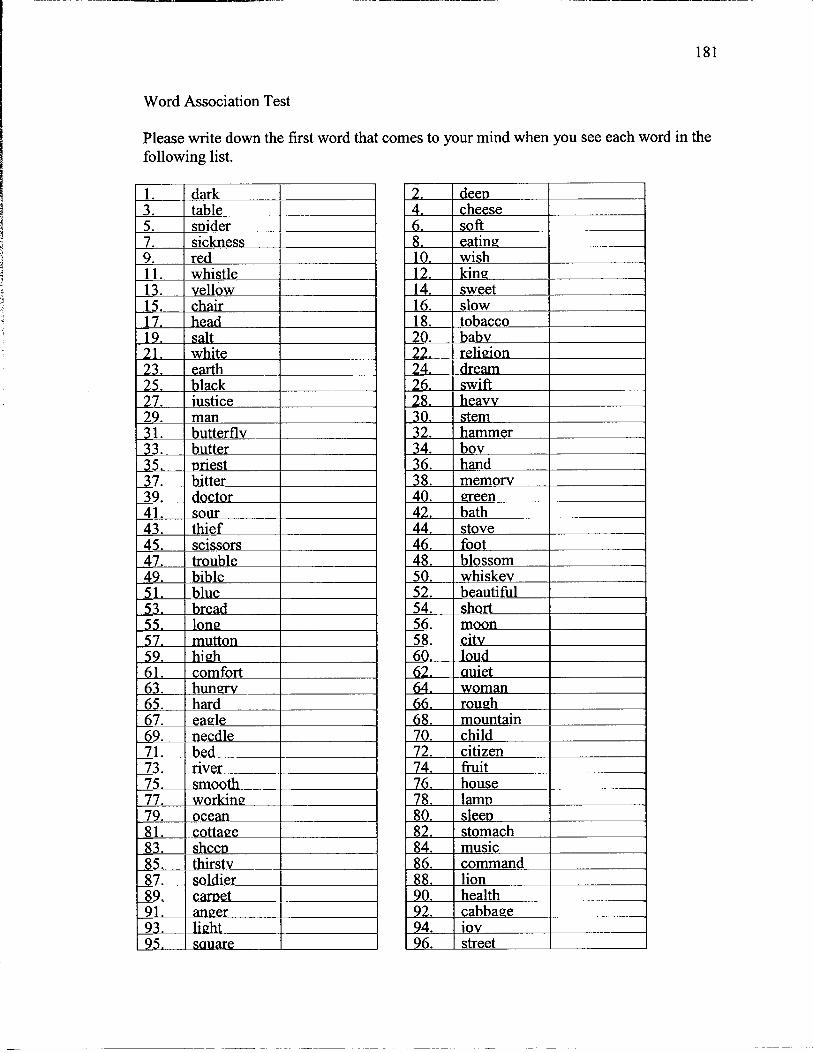
I I Please write down the first word that comes to your mind when you see each word in the
following list.
97. 1 window 1 I 98. 1 girl 99. 1 cold 100. 1 afraid
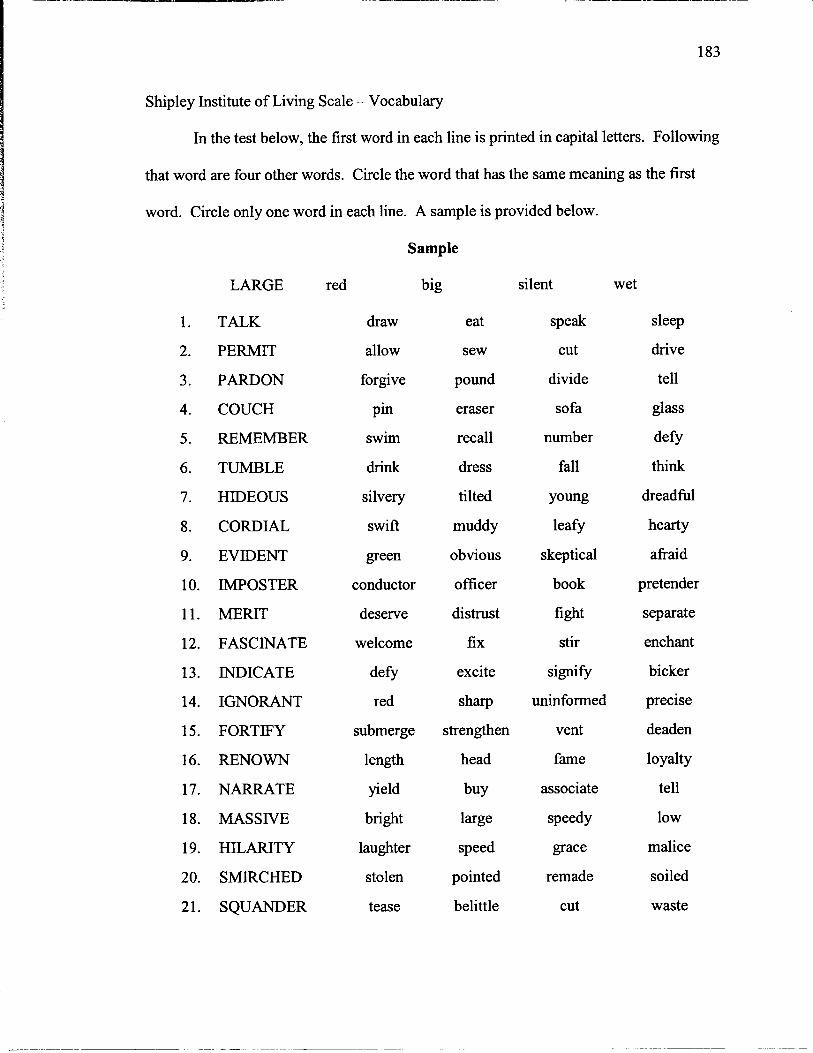
Shipley Institute of Living Scale - Vocabulary
In the test below, the first word in each line is printed in capital letters. Following
that word are four other words. Circle the word that has the same meaning as the first
word. Circle only one word in each line. A sample is provided below.
LARGE
TALK
PERMIT
PARDON
COUCH
REMEMBER
TUMBLE
HIDEOUS
CORDIAL
EVIDENT
IMPOSTER
MERIT
FASCINATE
INDICATE
IGNORANT
FORTIFY
RENOWN
NARRATE
MASSIVE
HILARITY
SMIRCHED
SQUANDER
Sample
red big
draw
allow
forgive
pin
swim
drink
silvery
swift
green
conductor
deserve
welcome
defy
red
submerge
length
yield
bright
laughter
stolen
tease
eat
sew
pound
eraser
recall
dress
tilted
muddy
obvious
officer
distrust
fix
excite
sharp
strengthen
head
buy
large
speed
pointed
belittle
silent
speak
cut
divide
sofa
number
fall
YOU"%
leafy
skeptical
book
fight
stir
signify
uninformed
vent
fame
associate
speedy
grace
remade
cut
wet
sleep
drive
tell
glass
defy
think
dreadful
hearty
afraid
pretender
separate
enchant
bicker
precise
deaden
loyalty
tell
low
malice
soiled
waste

CAPTION
FACILITATE
JOCOSE
APPRAISE
RUE
DENIZEN
DIVEST
AMULET
INEXORABLE
SERRATED
LISSOM
MOLLIFY
PLAGIARIZE
ORIFICE
QUERULOUS
PARIAH
ABET
TEMERITY
PRISTINE
drum
help
humorous
reduce
eat
senator
dispossess
charm
untidy
dried
moldy
mitigate
appropriate
brush
maniacal
outcast
waken
rashness
vain
ballast
tum
paltry
strewn
lament
inhabitant
intrude
orphan
involatile
notched
loose
direct
intend
hole
curious
priest
ensue
timidity
sound
heading
strip
fervid
inform
dominate
fish
rally
dingo
rigid
armed
supple
pertain
revoke
building
devout
lentil
incite
desire
first
ape
bewilder
plain
delight
cure
atom
pledge
pond
sparse
blunt
convex
abuse
maintain
lute
complaining
locker
placate
kindness
level

Shipley Institute of Living Scale - Abstraction
Complete the following by filling in either a number or a letter for each dash
( . Do the items in order, but don't spend too much time on any one item.
Example:
B C D - E
1 . 1 2 3 4 5 -
2. white black short long down
3. AB BC CD D-
4. Z Y x W V U -
5. 1 2 3 2 1 2 3 4 3 2 3 4 5 4 3 4 5 6
6. NE/SW S E N E/W N/ -
7. escape scape cape
8. oh ho rat tar mood
9. A Z B Y C x D -
10. tot tot barddrab 537
1 1 . mist is wasp as pint in tone
12.57326 73265 32657 26573
13. knit in spud up both to stay
14. Scotland landscape scapegoat ee
15. surgeon 1234567 snore 17635 rogue
16. tam tan rib rid rat raw hip
17. tar pitch throw saloon bar rod fee tip end plank meals
18.3124 82 73 154 46 13-

19. lag leg pen pin big bog rob
20. two w four r one o three -

Handedness
1. Have you ever had any tendency towards left-handedness?
2. Which hand would you most often use to throw a ball to hit a target? -
3. Which hand would you most often use to draw a picture?
4. Which hand would you most often use to erase something off of
paper?
5. Which hand would you most often use to deal cards in a card game?
6 . Which foot would you most often use to kick a ball?
7. Which foot would you most often use to pick up things with your
toes?
8. Which foot would you step with first when starting up a staircase?
9. Which eye would you use most often to look through a keyhole? -
10. If you had to look into a dark bottle to see how full it was, which eye
would you use? -
1 1 . Which eye would you use most often to sight down a rifle?
12. If you wanted to listen to a conversation going on behind a closed
door, which ear would you place against the door?
13. If you wanted to hear somebody's heartbeat, which ear would you
place against their chest?
14. Into whch ear would you place the earpiece of a transistor radio?
Yes
Right
Right
Right
Right
Right
Right
Right
Right
Right
Right
Right
Right
Right
Lefi
Lefi
Left
Left
Left
Left
Left
Left
Left
Left
Left
Left
Left

Informed Consent Form
Overview of the Study
For this study, all participants need to be at least 18 years age. I am at least 18 years
of age. I understand that this experiment involves two parts and should take no longer
than four hours. It may distort the results of the study if I were told the complete nature
of the experiment in the beginning. However, a complete explanation of the procedure
and purpose of the research will be given to me after the experimental trial period is
complete. The next two sections explain what I will be asked to do.
Part One - Filling out Questionnaires
For this part of the study, I will be asked to complete some thinking style tasks. The total
time for completing these questionnaires is approximately 1 '/z hours. These thinking
style tasks involve:
Thinking of uses for common objects (e.g., all the possible uses for a book)
Comparing three words with the goal of identifying a fourth word that is related to the
first three words (e.g., Base, Snow, Dance are related through the word Ball)
Choosing the adjectives fiom a given list that describe me
Writing the first word that comes to me when I see each of 100 words
Choosing the synonym to a given word (e.g., the synonym for BIG is LARGE)
Completing a series with the next item in the series (e.g., A B C D IZ)
Part Two - Brain Wave Recording

This part of the study uses an electroencephalography (EEG) machine. I understand that
before I begin this part of the study, there will be small metal disks attached to my scalp -
to allow recording of my brain wave activity while I complete six tasks. To attach the
disks, it is necessary for the experimenter to mark the locations for the disks with a grease
pencil and then lightly scrub my scalp to prepare the surface. Then, the disks will be held
in place with a water-based gel and some surgical tape. I understand that once the disks
are attached, I will be asked to remain relaxed and as motionless as possible, unless I
choose to discontinue my participation in this research project. It takes approximately %
hour to attach all of the disks.
After the disks have been attached to my scalp, I will be asked to complete five tasks.
The total time for completing the five tasks is approximately 1 ?4 hours. The tasks are
described as follows:
1. I will be asked to think of a story about a topic I will be given. I will have five
minutes to think of my story. Then, I will be asked to write down my story. I will
be given five more minutes to write down my story.
2. I will be asked to solve 15 addition math problems. I will be shown a problem to
solve (e.g., 354 + 298) and will be asked to give an answer to the problem as
quickly as possible. If I cannot solve the problem, I can tell the experimenter and
the next problem will be presented.
3. I will be asked to look at letters from the alphabet presented on a computer screen.
I will be asked to count the total number of times that I see a particular letter. I
will be asked at the end of this task how many times I saw the letter.

4. I will be asked to listen to tones presented through headphones. I will be asked to
count the total number of times that I hear a particular tone. I will be asked at the
end of the task how many times I heard the tone.
5. I will be asked to read the first part of sentence on a computer screen. Then, the
last word for the sentence will be presented on the computer screen. I will be
asked to read the last word as well. I understand that I will be asked to remember
as much about each sentence that is presented as possible because I will be asked
questions about the sentences after the task is complete.
What are the risks associated with participation in this project?
This research does not involve risk greater than that normally encountered in daily life or
during the performance of routine psychological testing. However, there may be slight
discomfort during the electrode (disk) application.
What are the benefits of participation in this project?
Most participants think that the main benefit of participation in this project is extra credit
towards their PSY 100 final grade. This research is also contributing to our understanding
of the relationship between brain waves and thinking styles. The results will be used to
develop a model of how different thinking styles can be reflected in brain waves.
What are my rights?
I have the right to refuse to participate or withdraw my participation at any time, as well
as the right to refuse to answer any particular questions asked during the research project.

These refusals will not be penalized and there will be no loss of credit for research
participation time allocated for the study. Also, no information which identifies me will
be released without my separate consent.
I acknowledge that I have received a copy of this consent form, and my signature below
indicates agreement to participate.
Participant's signature
If I have any questions about the study, I may write or phone the office of the Project
Investigator, Jonna Kwiatkowslu, as 325 Little Hall, 58 1-201 6.

Debriefing Form
This experiment was created to examine how people's brain activity is affected by
multiple presentations of a stimulus. In past experiments, it was found that as a person
became more comfortable with a stimulus, the parts of their brain that were activated by
the stimulus shifted. We are interested in the same phenomenon, but have added
measures of thinking style. Thinking style is the different ways people focus their
attention during problem solving. Some people are better at focusing on the key elements
of a problem, and therefore are better at solving problems with one clear solution. Others
focus their attention less tightly, and are better at solving loosely-defined problems with
more than one correct answer. We would like to compare the brain activity of those
who focus their attention tightly versus those that focus their attention loosely. We
expect to find that the brain activity of those with less focused attention will shift more
slowly than the brain activity of those with more tightly focused attention.
If you have any further questions about this study, feel fiee to contact Jonna Kwiatkowski
at 58 1-201 6 . Thank you for your time.

Appendix G - Experimenter Scripts for Neurophysiological Test
I Experiment One - Record Baseline
FILENAME
INSTRUCTIONS
1. This is always the first task
2. Explain that you want himher to lie very still for five minutes with hisher eyes
closed. Let himher know that she should not talk during the five minutes. Also tell
himher that you will let himher know when five minutes have passed.
3. To open the Eyes Closed program, click on the "Start" button in the lower left side of
the screen, slide up to the "TestPoint" file at the top of the Start menu, slide over to
the "Research" file in the Testpoint menu, and finally slide down to the "Eyes
Closed" file and click on it.
4. You will get a place to fill in a file name. Fill it in as follows: c:\Testpt\Data\D###-
closed.txt
5. Explain that you want himher to lie very still for five minutes with hisher eyes open.
Let himlher know that s h e should not talk during the five minutes. Also tell himher
that you will let himher know when five minutes have passed.
6. To open the Eyes Open program, click on the "Start" button in the lower left side of
the screen, slide up to the "TestPoint" file at the top of the Start menu, slide over to
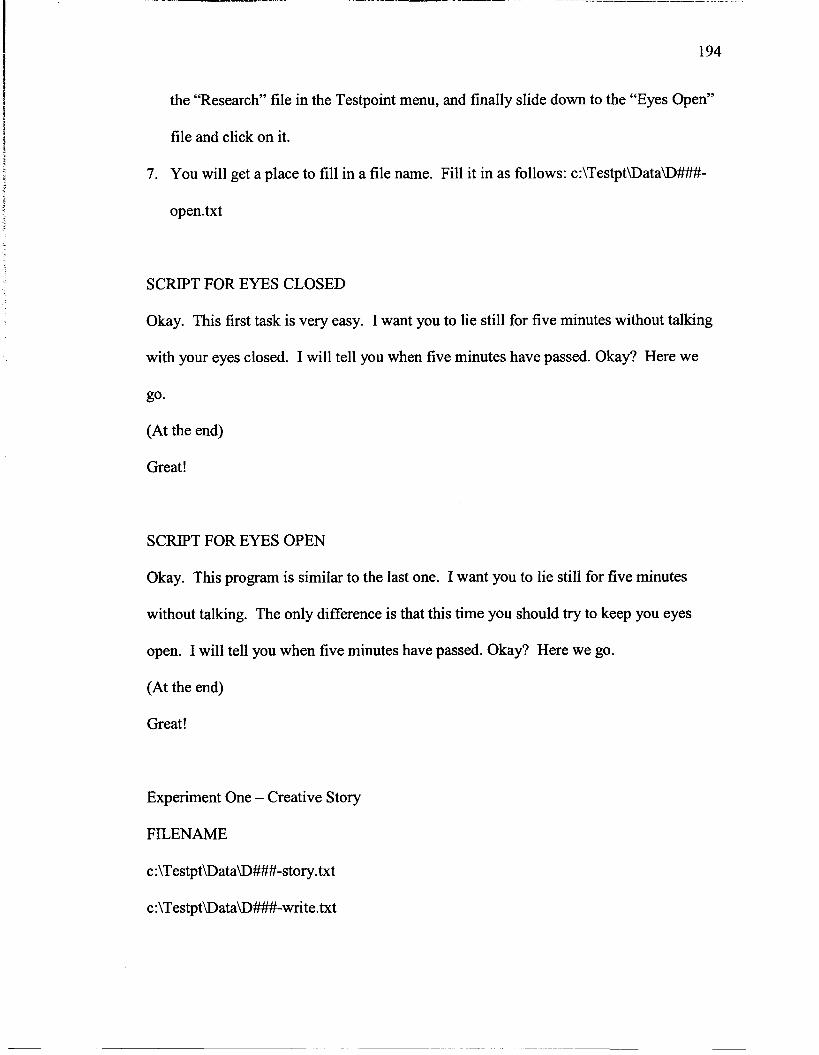
194
the 'Research" file in the Testpoint menu, and finally slide down to the "Eyes Open" ?. 5 I file and click on it. 4 f
7. You will get a place to fill in a file name. Fill it in as follows: c:\Testpt\Data\D###-
open. txt
SCRIPT FOR EYES CLOSED
Okay. This first task is very easy. I want you to lie still for five minutes without talking
with your eyes closed. I will tell you when five minutes have passed. Okay? Here we
go.
(At the end)
Great!
SCRIPT FOR EYES OPEN
Okay. This program is similar to the last one. I want you to lie still for five minutes
without talking. The only difference is that this time you should try to keep you eyes
open. I will tell you when five minutes have passed. Okay? Here we go.
(At the end)
Great!
Experiment One - Creative Story
FILENAME
c:\Testpt\Data\D###-story.txt
c:\Testpt\Data\D###-write.txt
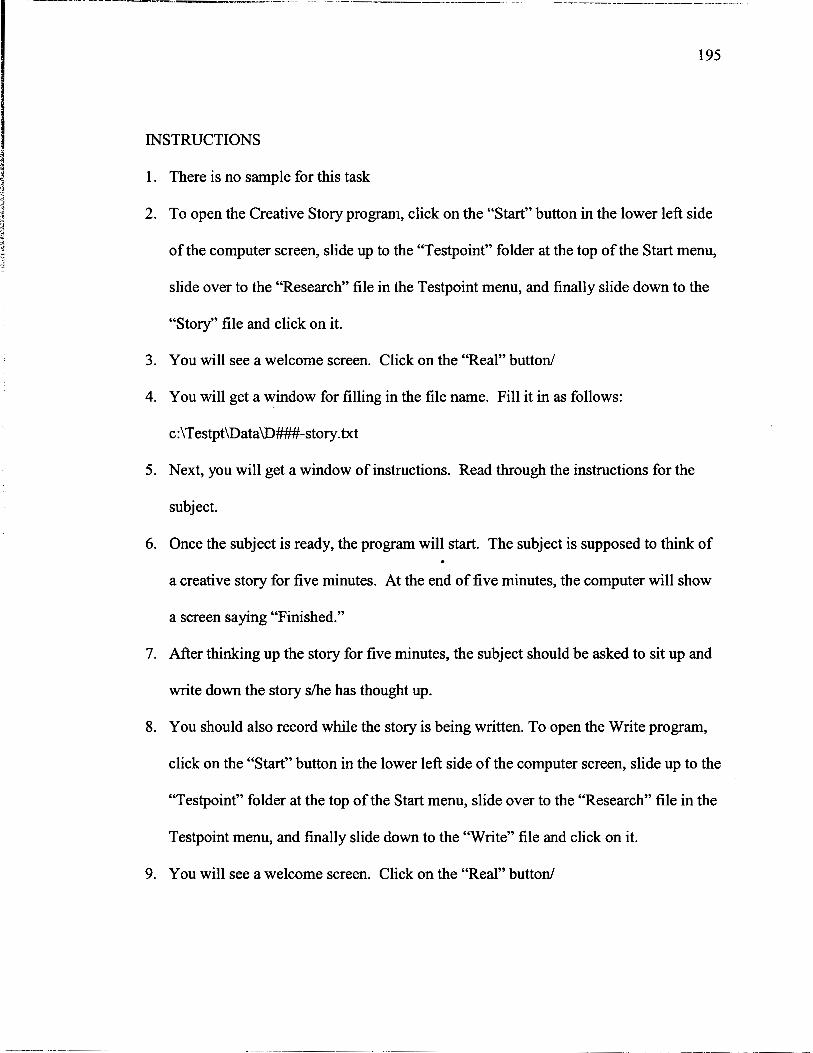
INSTRUCTIONS
There is no sample for this task
To open the Creative Story program, click on the "Start" button in the lower left side
of the computer screen, slide up to the "Testpoint" folder at the top of the Start menu,
slide over to the "Research" file in the Testpoint menu, and finally slide down to the
"Story" file and click on it.
You will see a welcome screen. Click on the "Real" button/
You will get a window for filling in the file name. Fill it in as follows:
c:\Testpt\Data\D###-story.txt
Next, you will get a window of instructions. Read through the instructions for the
subject.
Once the subject is ready, the program will start. The subject is supposed to think of
a creative story for five minutes. At the end of five minutes, the computer will show
a screen saying "Finished."
After thinking up the story for five minutes, the subject should be asked to sit up and
write down the story she has thought up.
You should also record while the story is being written. To open the Write program,
click on the "Start" button in the lower left side of the computer screen, slide up to the
"Testpoint" folder at the top of the Start menu, slide over to the "Research" file in the
Testpoint menu, and finally slide down to the "Write" file and click on it.
You will see a welcome screen. Click on the "Real" button1
10. You will get a window for filling in the file name. Fill it in as follows:
c:\Testpt\DataD###-write.txt
1 1. Next, you will get a window of instructions. Read through the instructions for the
subject.
12. Once the subject is ready, the program will start. The subject is supposed to write the
creative story for five minutes. At the end of five minutes, the computer will show a
screen saying "Finished."
SCRIPT FOR STORY
Okay. What I want you to do now is think of a creative story in your head. I will give
you the topic for the story in a few minutes. It is important that you just think of the story
in your head. Do not say it out loud. After five minutes, I will ask you to write your
story down on paper. Do you have any questions? Okay. Let's go through the official
instructions.
(THE FOLLOWING IS DISPLAYED ON THE COMPUTER SCREEN FOR THE
PARTICIPANT, AND READ BY THE EXPERIMENTER)
For the next five minutes, I would like you to create a story about a topic that I will give
you. You will have five minutes to think of the story in your mind. Your story should be
as creative as possible. You should not talk while you are thinking of the story. You
should keep your eyes closed while you are thinking of your story. After five minutes
have passed, I will ask you to write down your creative story. You will have five more
minutes to write the story down.
(At the end)
Okay. Now I am going to set up for you to write the story. (SET UP)
SCRIPT FOR WRITING
Okay. Now I want you to write the story you thought up. I need you to try to move as
little as possible while you are writing. You should not talk out loud at all while you are
writing. You should write for five minutes. I will let you know when your time is up.
Do you have any questions? Okay. Let's go through the official instructions.
(THE FOLLOWING IS DISPLAYED ON THE COMPUTER SCREEN FOR THE
PARTICIPANT, AND READ BY THE EXPERIMENTER)
For the next five minutes, I would like you to write down the story you created over the
last five minutes. You will have five more minutes to write your story down. Remember
that your story is supposed to be creative, and that your topic is "Between the Lines."
(At the end)
Okay. Your time is up. Good job. Let's move on to the next task.
Experiment One - Math Problems
FILENAME
c:\Testpt\Data\D##-math.txt

INSTRUCTIONS
1. There is no sample for this task
2. Explain that the computer is going to show addition problems that the participant
should try to solve as quickly as possible.
3. Once the subject has solved the problem or 45 seconds has passed, the computer will
display a black dot that the subject should look at until the next math problem
appears.
4. To open the Math program, click on the "Start" button in the lower left side of the
computer screen, slide up to the "Testpoint" folder at the top of the Start menu, slide
over to the "Research" file in the Testpoint menu, and finally slide down to the
"Math" file and click on it.
5. You will see a welcome screen. Click on the "Real" button1
6. You will get a window for filling in the file name. Fill it in as follows:
c:\Testpt\Data\D###-math.txt
7. Next, you will get a window of instructions. Read through the instructions for the
subject.
SCRIPT FOR MATH PROBLEMS
Okay. For this program, the computer will display an addition problem that you should
try to solve. An example of an addition problem is 693+942. You will be given 45
seconds to solve the problem. As soon as you solve the problem, you should say the
answer. If you have not solved the problem in 45 seconds, the computer will move on to
I -- - - - - - ---- - -- -- - -. -- - - - -- - -. -- - -
199
the next problem. Do you have any questions? Okay. Let's move onto the official
3 instructions.
(At the end)
Great job. Let's move on to the next program.
Experiment Two - NlOO and P300
FILE NAMES
Sample - c:\Testpt\Data\D###-ABsamp.txt
AB - c:\Testpt\Data\D###-ab.txt
c:\Testpt\Data\D###-ABnov.txt
INSTRUCTIONS
1. Always do a sample first
2. Explain that the computer is going to show himher pictures of the letter A and
pictures of the letter B. Ask himher to count the total number of letter As and at the
end you will ask him how many he counted. Remind him that he should count the
number of As to himself.
3. To open the Count AB program, click on the "Start" button in the lower left side of
the screen, slide up to the "TestPoint" file at the top of the Start menu, slide over to
the "Research" file in the Testpoint menu, and finally slide down to the "Count AB"
file and click on it.
4. For the sample, click on the "Sample" button on the Welcome window.
a 5. For the sample, you will get a place to fill in a file name. Fill it in as follows: 4 3
c:\Testpt\Data\D###-Al3samp.txt
6 . After the sample, the program will close
7. Ask how many As he counted - record that number
8. Reopen the Count Al3 program
9. Click on the "Real" button on the Welcome window
10. For the sample, you will get a place to fill in a file name. Fill it in as follows:
c:\Testpt\Data\D##-ab.txt
11. Ask how many As he counted - record that number
12. Explain that the computer is going to show him pictures of the letter A and pictures of
the letter B. Ask him to count the total number of letter As and at the end you will
ask him how many he counted. Remind him that he should count the number of As to
himself. DO NOT tell him that there will be pictures of colored drawings.
13. To open the Count ABNovel program, click on the "Start" button in the lower left
side of the screen, slide up to the "TestPoint" file at the top of the Start menu, slide
over to the "Research" file in the Testpoint menu, and finally slide down to the
"Count ABNovel" file and click on it.
14. You will get a place to fill in a file name. Fill it in as follows: c:\Testpt\Data\D###-
Al3nov.txt
15. Ask how many As he counted - record that number
SCRIPT FOR SAMPLE
Okay before we start this program for real, I'm going to have you
go through a sample run. What I'd like you to do is count the total number of A's that
flash on the screen. I don't want you to count out loud. Count to yourself. After the
program is finished, I will ask you how many A's you counted. Okay? Here we go.
(At the end)
Okay. How many A's did you count?
(subject answers)
Great !
SCRIPT FOR AB
Okay. Now we are ready to begin for real. I want you to do the same thing this time.
Just count the total number of A's that flash on the screen to yourself. At the end I will
ask you how many you counted. Do you have any questions? Okay. Here we go.
(At the end)
Okay. How many A's did you count?
Great!
SCRIPT FOR ABNOVEL
Okay. This program is the same as the last one. I want you to just count the total number
of A's that flash on the screen to yourself. At the end I will ask you how many you
counted. Okay? Here we go.
(At the end)
Okay. How many A's did you count?
(subject answers)
Great!
Experiment Three - N400
FILENAME
c:\Testpt\Data\D###-sent.txt
INSTRUCTIONS
1. There is no sample for this task
2. Explain that the computer is going to show the first part of a sentence for two
seconds.
3. Then, the computer is going to show the last word in the sentence.
4. Ask h i d e r to read each sentence and try to remember it. Tell h i d e r that at the
end she will be asked to remember the sentences.
5. To open the Sentences program, click on the "Start" button in the lower left side of
the computer screen, slide up to the "Testpoint" folder at the top of the Start menu,
slide over to the "Research" file in the Testpoint menu, and finally slide down to the
"Sentence" file and click on it.
6. You will see a welcome screen. Click on the "Real" button/
7. You will get a window for filling in the file name. Fill it in as follows:
c:\TestptV>ataV>###-sent.txt
8. Next, you will get a window of instructions. Read through the instructions for the
subject.
SCRIPT FOR SENTENCES
Okay. For this program, you will see the first part of a sentence on the computer screen.
Then, the last word of the sentence will appear by itself. I want you to read the first part
of the sentence and the last word of the sentence. At the end, 1 will ask you to remember
as many of the sentences as you can. Do you have any questions? Okay. Here we go.
(At the end)
Okay. When we finish all of the programs, I will ask you to remember the sentences.
Good job.

BIOGRAPHY OF THE AUTHOR
Jonna Kwiatkowski was born in Toledo, Ohio on November 1 1, 1971. She was
raised in Toledo, Ohio and graduated fiom Central Catholic High School. She attended
Saint Mary's College, Notre Dame, IN and graduated in 1994 with a Bachelor's degree in
Psychology, with minors in Computer Science and Mathematics. She worked as a
computer programmer in Chicago until 1996 when she returned to school for graduate
work. She entered the Psychology graduate program at The University of Maine in the
fall of 1996.
After receiving her degree, Jonna will be continuing postdoctoral work at Yale
University where she is responsible for the research on a U.S. Department of Education
grant titled "Transitions in the Development of Giftedness." Jonna is a candidate for the
Doctor of Philosophy degree in Psychology fiom The University of Maine in August,
2002.
![NEURurofisiologia - neurophysiology[1]](https://static.fdocuments.net/doc/165x107/5571f1d449795947648bb940/neururofisiologia-neurophysiology1.jpg)