INDIAN POWER SECTOR SCENARIO & FLEXIBILITY REQUIREMENT NOW ... · indian power sector scenario &...
23
INDIAN POWER SECTOR SCENARIO & FLEXIBILITY REQUIREMENT – NOW & IN 5 YEARS AMMI RUHAMA TOPPO DIRECTOR CENTRAL ELECTRICITY AUTHORITY
Transcript of INDIAN POWER SECTOR SCENARIO & FLEXIBILITY REQUIREMENT NOW ... · indian power sector scenario &...

INDIAN POWER SECTOR SCENARIO &
FLEXIBILITY REQUIREMENT – NOW & IN 5 YEARS
AMMI RUHAMA TOPPO
DIRECTOR
CENTRAL ELECTRICITY AUTHORITY

INSTALLED CAPACITY
TOTAL:331,118 MW
Hydro 44,765
14%
Coal 193,427
58%
Gas 25,988
8% Nuclear 6,780
2%
RES 60,158
18%
FUEL TYPE-WISE ALL INDIA INSTALLED CAPACITY (IN MW) AS ON 31.10.2017
CENTRAL 81102.25
25%
STATE 102998.27
31%
PRIVATE 147017.06
44%
SECTOR-WISE ALL INDIA INSTALLED CAPACITY (IN MW) AS ON 31.10.2017

GENERATION(2016-17)
Hydro 122,377.6
9.85%
Coal+Lignite 944,860.9
76.08%
Gas+Diesel 49,369.2
3.97%
Nuclear 37,915.9
3.05%
Bhutan Import 5,617.3 0.45%
RES 81,868.7
6.59%
TOTAL 12,42,009.7 GWh
ALL FIGURES IN GWh

CAPACITY ADDITION FROM CONVENTIONAL SOURCES
40,245 41,110
[VALUE]
88,537
19,119 21,180
54,964
99209
0
20,000
40,000
60,000
80,000
100,000
120,000
1997-2002 2002-07 2007-12 2012-17
MW
TARGET ACHIEVED

INSTALLED CAPACITY- RES
[CATEGORY NAME]
14771.69 24.55%
[CATEGORY NAME]
32700.64 54.36%
[CATEGORY NAME] 8295.78 13.79%
[CATEGORY NAME] 4389.55
7.3%
RES Installed capacity in MW as on 30th September, 2017
Total : 60,158 MW
0
5000
10000
15000
20000
25000
30000
35000
40000
MARCH,2008 MARCH,2012 MARCH,2017
2 941
12289
7667
16897
32280
2045
3411
4380
1411 3255
8296
MW
Development of RE in India
Solar Wind Small hydro(SHP) Bio-Power

0%
10%
20%
30%
40%
50%
60%
70%
80%
90%
100%
19
80
-81
19
81
-82
19
82
-83
19
83
-84
19
84
-85
19
85
-86
19
86
-87
19
87
-88
19
88
-89
19
89
-90
19
90
-91
19
91
-92
19
92
-93
19
93
-94
19
94
-95
19
95
-96
19
96
-97
19
97
-98
19
98
-99
19
99
-20
00
20
00
-01
20
01
-02
20
02
-03
20
03
-04
20
04
-05
20
05
-06
20
06
-07
20
07
-08
20
08
-09
20
09
-10
20
10
-11
20
11
-12
20
12
-13
20
13
-14
20
14
-15
20
15
-16
20
16
-17
Coal+Lignite Gas+Diesel Hydro Nuclear RES
CAPACITY MIX (SINCE MARCH,1981)

POWER SUPPLY POSITION IN THE COUNTRY
862 937
996 1,002 1,069
1,114 1,143
621
788 858 909
960 1,031 1,091 1,135
617
8.5 8.5
8.7
4.2 3.6
2.1
0.7 0.6 0
1
2
3
4
5
6
7
8
9
10
0
200
400
600
800
1,000
1,200
1,400
2010-1
1
2011-1
2
2012-1
3
2013-1
4
2014-1
5
2015-1
6
2016-1
7
2017-1
8(
up
to
Se
pte
mb
er,
2017)
En
erg
y (
BU
)
Year
Power Supply Position in terms of Energy
since 2010-11
Energy Requirement
Energy Supplied
Energy not Supplied (%)
122 130 135 136
148 153 160 164
110 116 123
130 141
148 157 161
9.8 10.6
9
4.5 4.7
3.2
1.6 0.9
0
2
4
6
8
10
12
0
20
40
60
80
100
120
140
160
180
2010-1
1
2011-1
2
2012-1
3
2013-1
4
2014-1
5
2015-1
6
2016-1
7
2017-1
8(
up
to
Se
pte
mb
er,
2017)
Pe
ak
in
(G
W)
Year
Power Supply Position in terms of Peak
since 2010-11
Peak Demand
Peak Met
Demand not Met (%)
1. At present, demand supply gap at an all time low of less than 1%. This gap is on account of factors other than non-availability of power.
2. Adequate power available in the country.
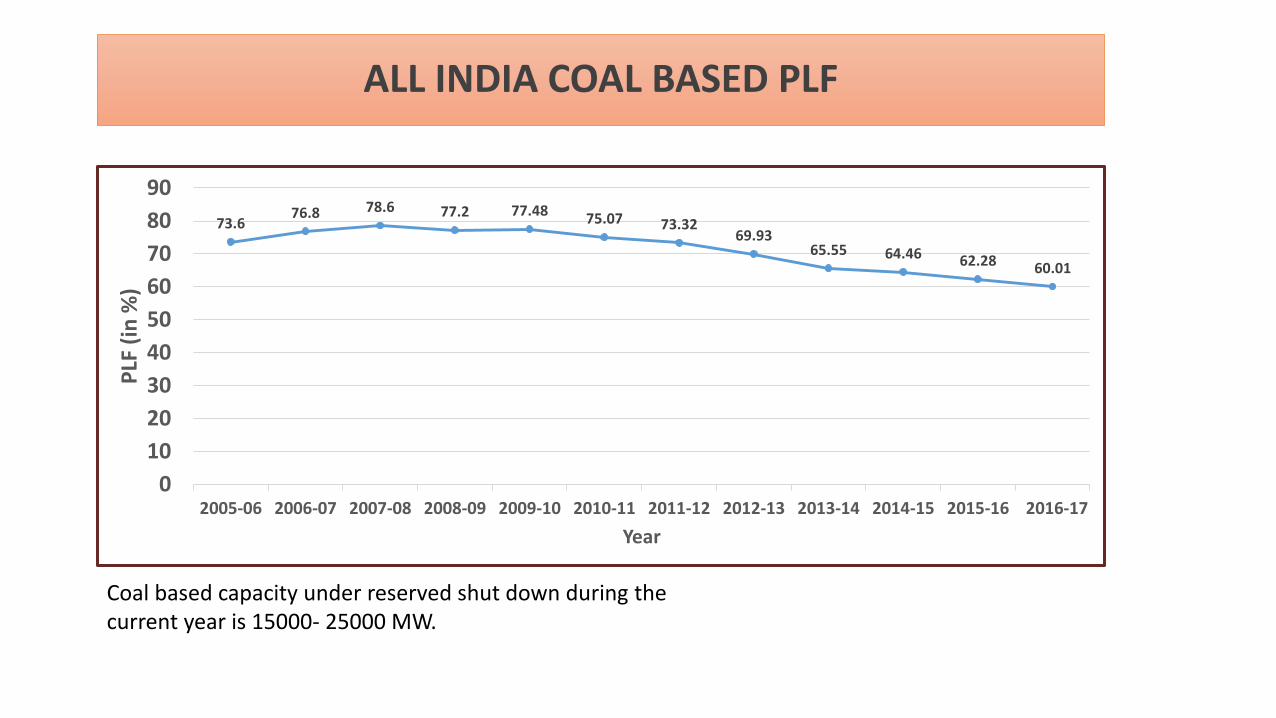
Coal based capacity under reserved shut down during the current year is 15000- 25000 MW.
73.6 76.8 78.6 77.2 77.48 75.07 73.32
69.93 65.55 64.46 62.28 60.01
0
10
20
30
40
50
60
70
80
90
2005-06 2006-07 2007-08 2008-09 2009-10 2010-11 2011-12 2012-13 2013-14 2014-15 2015-16 2016-17
PLF
(in
%)
Year
ALL INDIA COAL BASED PLF

32.53 31.25 30.42
28.65 27.2
25.47 25.39 23.97 23.65 23.04
21.46 22.77
34.78 34.33 33.02
30.62 29.45 27.37 26.58 26.15 27
25.38 22.58
24.62
0
5
10
15
20
25
30
35
40
%
YEARS
T&D AND AT&C LOSSES
T&D losses (Source: PDM CEA) AT&C Losses (Source: PFC)
59
2
61
2
63
1
67
2
71
7
73
3
77
9
81
9
88
4
91
4
95
7
10
10
10
75
11
22
0
200
400
600
800
1000
1200
20
03
-04
20
04
-05
20
05
-06
20
06
-07
20
07
-08
20
08
-09
20
09
-10
20
10
-11
20
11
-12
20
12
-13
20
13
-14
20
14
-15
20
15
-16
20
16
-17
KW
H
YEARS
PER CAPITA CONSUMPTION
ALL INDIA LOSSED AND PER CAPITA CONSUMPTION

FUTURE SCENARIO

226 299 370 448 1,566
2,047 2,531
3,049
0
50
100
150
200
250
300
350
400
450
500
0
500
1,000
1,500
2,000
2,500
3,000
3,500
2021-22 2026-27 2031-32 2036-37
PEA
K D
EMA
ND
GW
ENER
GY
REQ
UIR
EMEN
T B
U
YEAR PEAK DEMAND ENERGY REQUIREMENT
Growth Rate (%)
2016-17 to
2021-22 2021-22 to
2026-27
CAGR of Electrical Energy Requirement 6.18 5.51
CAGR of Peak Electricity Demand 6.88 5.77
PROJECTIONS OF ELECTRICITY DEMAND-19TH ELECTRIC POWER SURVEY

57,260
71,768
95,319
120,772
147,541
174,998
12,289
25,475
43,035
61,693
80,899 100,000
32,280 33,578
39,078 45,305
52,258 60,000
-10,000
40,000
90,000
140,000
190,000
20
16
-17
20
17
-18
20
18
-19
20
19
-20
20
20
-21
20
21
-22
MW
YEAR
PROJECTED GROWTH OF RES INSTALLED GENERATING CAPACITY (MW)
WIND
SOLAR
TOTAL
TARGET RES INSTALLED CAPACITY MARCH,2022

4400
14400
24400
34400
44400
54400
64400
74400
84400
4/1
/20
21
4/1
1/2
021
4/2
1/2
021
5/1
/20
21
5/1
1/2
021
5/2
1/2
021
5/3
1/2
021
6/1
0/2
021
6/2
0/2
021
6/3
0/2
021
7/1
0/2
021
7/2
0/2
021
7/3
0/2
021
8/9
/20
21
8/1
9/2
021
8/2
9/2
021
9/8
/20
21
9/1
8/2
021
9/2
8/2
021
10
/8/2
021
10
/18
/202
1
10
/28
/202
1
11
/7/2
021
11
/17
/202
1
11
/27
/202
1
12
/7/2
021
12
/17
/202
1
12
/27
/202
1
1/6
/20
22
1/1
6/2
022
1/2
6/2
022
2/5
/20
22
2/1
5/2
022
2/2
5/2
022
3/7
/20
22
3/1
7/2
022
3/2
7/2
022
4/6
/20
22
MW
Daily Peak solar & Wind 2021-22
Solar Wind

44400
54400
64400
74400
84400
94400
104400
114400
124400
4/1
/20
21
4/2
1/2
021
5/1
1/2
021
5/3
1/2
021
6/2
0/2
021
7/1
0/2
021
7/3
0/2
021
8/1
9/2
021
9/8
/20
21
9/2
8/2
021
10
/18
/202
1
11
/7/2
021
11
/27
/202
1
12
/17
/202
1
1/6
/20
22
1/2
6/2
022
2/1
5/2
022
3/7
/20
22
3/2
7/2
022
MW
Total VRE(Solar+Wind)Peak of each day
2021-22
0
10000
20000
30000
40000
50000
60000
70000
80000
90000
100000
110000
120000
1
18
35
52
69
86
10
3
12
0
13
7
15
4
17
1
18
8
20
5
22
2
23
9
25
6
27
3
29
0
30
7
32
4
34
1
35
8
MW
Days of the Year
VRE Peak of each day Duration Curve
2021-22

Year
Installed
capacity of
RES
(GW)
Expected Generation in (BU)
Solar Wind Biomass SHP Total
Total Energy
Requirement
(BU)
Contribution
of RES to
Total Energy
Demand(%)
2021-22 175 162 112 37 15 326 1,566 20.1%
2026-27 275 243 188 63 24 518 2,047 24.4%
Estimated Electricity Generation from RES in years 2021-22 and 2026-27

TYPICAL ALL INDIA DEMAND & NET LOAD CURVE(PEAK DAY) (2021-22)
16
20
36
75
20
03
24
19
69
01
19
47
71
19
53
54
19
94
12
20
49
88
20
55
98
20
51
94
20
71
61
20
94
87
21
03
31
20
80
52
20
52
04
20
45
51
20
53
89
20
54
10
20
28
24
20
23
70
22
07
98
22
57
51
22
10
86
21
77
90
21
57
02
19
68
01
19
43
56
19
11
76
18
88
76
18
86
36
19
24
83
19
87
26
19
40
79
17
26
74
15
66
13
14
71
47
14
10
50
13
67
40
13
79
38
14
56
95
16
07
06
17
94
18
19
31
63
19
43
62
21
03
23
21
53
26
21
12
14
20
77
65
20
70
85
111,000
131,000
151,000
171,000
191,000
211,000
231,000
251,000
1 2 3 4 5 6 7 8 9 10 11 12 13 14 15 16 17 18 19 20 21 22 23 24
MW
HOUR
ALL INDIA DEMAND NET DEMAND
DUCK CURVE

0.4000
0.5000
0.6000
0.7000
0.8000
0.9000
1.0000
1-A
pr-
21
11
-Ap
r-2
1
21
-Ap
r-2
1
1-M
ay-2
1
11
-May
-21
21
-May
-21
31
-May
-21
10
-Ju
n-2
1
20
-Ju
n-2
1
30
-Ju
n-2
1
10
-Ju
l-2
1
20
-Ju
l-2
1
30
-Ju
l-2
1
9-A
ug-
21
19
-Au
g-2
1
29
-Au
g-2
1
8-S
ep
-21
18
-Se
p-2
1
28
-Se
p-2
1
8-O
ct-2
1
18
-Oct
-21
28
-Oct
-21
7-N
ov-
21
17
-No
v-2
1
27
-No
v-2
1
7-D
ec-
21
17
-Dec
-21
27
-Dec
-21
6-J
an-2
2
16
-Jan
-22
26
-Jan
-22
5-F
eb
-22
15
-Feb
-22
25
-Feb
-22
7-M
ar-2
2
17
-Mar
-22
27
-Mar
-22
Off
Pe
ak V
alu
e/P
eak
val
ue
(24
ho
urs
)
Day of the year
Off-Peak / Peak Comparison Total Demand & Net Load 2021-22
Total DemandNet Load
154000
174000
194000
214000
234000
4/1
/20
21
4/1
1/2
021
4/21
/202
1
5/1
/20
21
5/1
1/2
021
5/2
1/2
021
5/3
1/2
021
6/1
0/2
021
6/2
0/2
021
6/3
0/2
021
7/1
0/2
021
7/20
/202
1
7/3
0/2
021
8/9
/20
21
8/1
9/2
021
8/2
9/2
021
9/8
/20
21
9/1
8/2
021
9/2
8/2
021
10
/8/2
021
10
/18
/202
1
10
/28
/202
1
11
/7/2
021
11
/17
/202
1
11
/27
/202
1
12
/7/2
021
12
/17
/202
1
12
/27
/202
1
1/6
/20
22
1/1
6/2
022
1/2
6/2
022
2/5
/20
22
2/1
5/2
022
2/2
5/2
022
3/7/2
022
3/1
7/2
022
3/2
7/2
022
MW
Daily Total Peak Demand vs Net Peak Demand 2021-22
Total Demand Net Demand
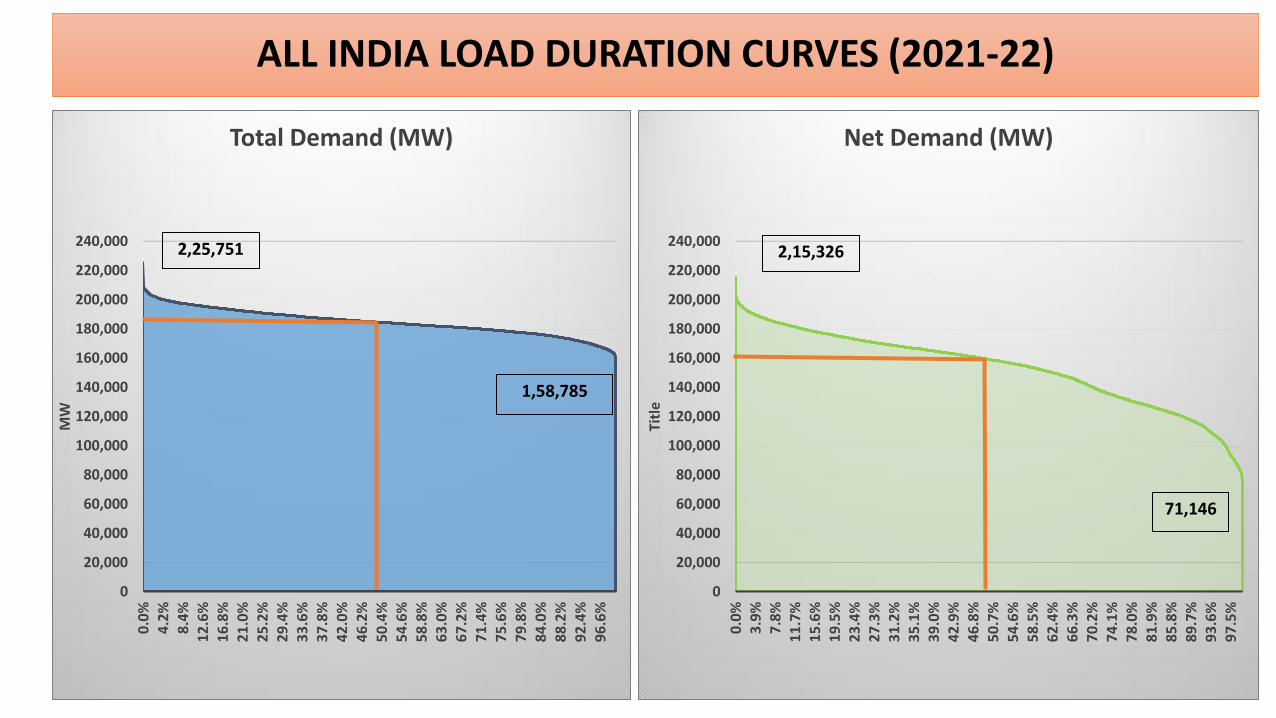
ALL INDIA LOAD DURATION CURVES (2021-22)
0
20,000
40,000
60,000
80,000
100,000
120,000
140,000
160,000
180,000
200,000
220,000
240,000
0.0
%
4.2
%
8.4
%
12
.6%
1
6.8
%
21
.0%
2
5.2
%
29
.4%
3
3.6
%
37
.8%
4
2.0
%
46
.2%
5
0.4
%
54
.6%
5
8.8
%
63
.0%
6
7.2
%
71
.4%
7
5.6
%
79
.8%
8
4.0
%
88
.2%
9
2.4
%
96
.6%
MW
Total Demand (MW)
2,25,751
1,58,785
0
20,000
40,000
60,000
80,000
100,000
120,000
140,000
160,000
180,000
200,000
220,000
240,000
0.0
%
3.9
%
7.8
%
11
.7%
1
5.6
%
19
.5%
2
3.4
%
27
.3%
3
1.2
%
35
.1%
3
9.0
%
42
.9%
4
6.8
%
50
.7%
5
4.6
%
58
.5%
6
2.4
%
66
.3%
7
0.2
%
74
.1%
7
8.0
%
81
.9%
8
5.8
%
89
.7%
9
3.6
%
97
.5%
Titl
e
Net Demand (MW)
2,15,326
71,146

RAMP DURATION CURVES (2021-22)
-32,500-30,000-27,500-25,000-22,500-20,000-17,500-15,000-12,500-10,000
-7,500-5,000-2,500
02,5005,0007,500
10,00012,50015,00017,50020,00022,50025,000
0%
5%
9%
14
%
18
%
23
%
27
%
32
%
36
%
41
%
54
%
50
%
45
%
41
%
36
%
32
%
27
%
23
%
18
%
13
%
9%
4%
MW
/HR
Ramping Duration Curve
(Total Demand)
-32,500-30,000-27,500-25,000-22,500-20,000-17,500-15,000-12,500-10,000
-7,500-5,000-2,500
02,5005,0007,500
10,00012,50015,00017,50020,00022,50025,000
0%
5
%
9%
1
4%
1
8%
2
3%
2
7%
3
2%
3
6%
4
1%
5
4%
5
0%
4
5%
4
1%
3
6%
3
2%
2
7%
2
3%
1
8%
1
3%
9
%
4%
MW
/HR
Ramping Duration Curve
(Net Demand)

RAMPING CAPABILITIES OF CONVENTIONAL GENERATION
1 1 119
1,068
3,887
2,067
1,393
211 13 1 0 2
268
4,796
2,944
588
146 15
0
500
1,000
1,500
2,000
2,500
3,000
3,500
4,000
4,500
5,000
5,500
-30,000 to -24,000-24,000 to -18,000-18,000 to -12,000 -12,000 to -6,000 -6,000 to 0 1 to 6,000 6,000 to 12,000 12,000 to 18,000 18,000 to 24,000
Ho
urs
HOURLY RAMP RATES(MW/HOUR)
FREQUENCY DISTRIBUTION OF RAMP RATES OVER THE YEAR
Frequency(f1) Net Load Frequency(f2) Total Demand

Thank you

20
36
75
20
03
24
19
69
01
19
47
71
19
53
54
19
94
12
20
49
88
20
55
98
20
51
94
20
71
61
20
94
87
21
03
31
20
80
52
20
52
04
20
45
51
20
53
89
20
54
10
20
28
24
20
23
70
22
07
98
22
57
51
22
10
86
21
77
90
21
57
02
0
50,000
100,000
150,000
200,000
250,000
1 2 3 4 5 6 7 8 9 10 11 12 13 14 15 16 17 18 19 20 21 22 23 24
MW
Hours
27th March,2022 (Retirements of Coal during 2017-22 : 22,716 MW)
Solar Wind Gas Hydro Imports Small Hydro +Biomass Coal Nuclear
HYDRO SOLAR
WIND
GAS
IMPORTS
SHP+BIOMASS
COAL
NUCLEAR

1
42
100
202
20
0
50
100
150
200
250
140000 - 155000 155000 - 170000 170000 - 185000 185000 - 200000 200000 - 216000
No
. of
Day
s/ye
ar
MW
Daily Peak Demand (Net) Distribution 2021-22