Indian Paradox: Rising Education, Declining Womens’ Employment · Rising Education, Declining...
30
India Human Development Survey Working Paper No. 2018-1 Indian Paradox: Rising Education, Declining Womens’ Employment Esha Chatterjee University of Maryland [email protected] Sonalde Desai University of Maryland [email protected] Reeve Vanneman University of Maryland [email protected] February 2018 These results are based on the India Human Development Survey, 2004-05. This survey was jointly organized by researchers at the University of Maryland and the National Council of Applied Economic Research, Delhi. Data collection was funded by grants R01HD041455 and R01HD061048 from the National Institutes of Health to the University of Maryland. Analytical work was carried out with the aid of a grant from the International Development Research Centre, Ottawa, Canada. The views expressed herein do not necessarily represent those of IDRC or its Board of Governors.
Transcript of Indian Paradox: Rising Education, Declining Womens’ Employment · Rising Education, Declining...

IndiaHumanDevelopmentSurveyWorkingPaperNo.2018-1
IndianParadox:RisingEducation,DecliningWomens’Employment
ReeveVannemanUniversityofMaryland
February2018 These results are based on the India Human Development Survey, 2004-05. This survey was jointly organized by researchers at the University of Maryland and the National Council of Applied Economic Research, Delhi. Data collection was funded by grants R01HD041455 and R01HD061048 from the National Institutes of Health to the University of Maryland. Analytical work was carried out with the aid of a grant from the International Development Research Centre, Ottawa, Canada. The views expressed herein do not necessarily represent those of IDRC or its Board of Governors.

1|P a g e
IndianParadox:RisingEducation,DecliningWomens’Employment
Abstract
Theories of human capital would suggest that with more education, women acquire
greater skills and their earnings increase, resulting in higher labor force participation.
However, it has been long known that in India, women’s education has a U-shaped
relationship with labor force participation. Part of the decline at moderate levels of education
may be due to an income effect whereby women with more education marry into richer
families that enable them to withdraw from the labor force. The paper uses the first
comprehensive Indian income data to evaluate whether the other family income effect
explains the negative relationship between moderate women’s education and their labor force
participation. Using two waves of the India Human Development Survey, a comprehensive
measure of labor force participation is regressed on educational levels for currently married
women, 25-59.
We find a strong other family income effect that explains some but not all of the U-shape
education relationship. Further analyses suggest the importance of a lack of suitable
employment opportunities for moderately educated women. Other factors need to be
identified to explain the paradoxical U-shape relationship. We suggest the importance of
occupational sex segregation, which excludes moderately educated Indian women from
clerical and sales jobs. This paper provides a more definitive test of the other family income
effect and identifies new directions for future research that might explain the paradoxical U-
curve relationship.

2|P a g e
1. INTRODUCTION
The low rates of Indian women’s labor force participation have long been a magnet for
academic inquiry. Most recent studies have noted the generally J-shaped or U-shaped relationship
of women’s education with their labor force participation (Reddy 1979, Sathar and Desai 2000,
Das and Desai 2003; Kingdon and Unni 2001, Das 2006; Klasen and Pieters 2015). As national
participation rates have continued to decline over the last few decades (Abraham 2013; Chatterjee,
Murgai, and Rama 2015), cohort shifts out of low levels of education to intermediate and secondary
education have been blamed for much of this decline (Afridi, Dinkelman, and Mahajan 2016).
Nevertheless, the curvilinear relationship itself has received surprisingly little direct
research attention. Most studies note the U-shaped relationship but usually fail to take the next step
of trying to explain it empirically. This is especially surprising since the downward sloping part of
the curve is so counter-theoretical. Neo-classical theory predicts that increases in women’s
education should usually lead to a rise in women’s labor force participation rate. More education
makes you more productive so your potential earnings rise, creating a greater incentive to join the
labor force and substitute employment for leisure or home labor.
India is unusual but not unique for having lower rates of labor force participation among
adult women with secondary education. Among 71 countries with appropriate census data in the
IPUMS-I data archive, only 14 countries have lower rates of labor force participation for adult
women with secondary education than for women with less than completed primary school. And
India has the second largest gap (19% vs. 35%), exceeded only by Rwanda (72% vs. 92%). But
several other countries also show lower rates of labor force participation for secondary educated
women (e.g., Indonesia, 47% vs. 63%; Turkey, 34% vs. 46%; and Ghana, 76% vs. 84%). So, this
counter-theoretical result deserves more research attention than it has been given.
3|P a g e
Past studies have suggested that both cultural factors, such as norms restricting the mobility
of women, and structural factors, such as a lack of appropriate job opportunities for educated
women, play important roles in determining the U-shaped relationship between women’s education
and labor force participation in India (Das and Desai, 2003; Das 2006). But these cultural and
structural explanations are more often asserted than tested.
Theory also predicts that the relationship between education and employment is governed
by both an income and a substitution effect. The substitution effect implies that educated women
command higher wages that would encourage them to substitute participation in the labor force for
leisure or home work. But the income effect on the other hand posits that educated women have
higher incomes for the same amount of work encouraging them to devote more time to leisure or
home work. In addition, and more importantly, educated women tend to marry educated men with
higher incomes so the higher (unearned) family incomes would further discourage women’s
participation in the labor market. Combined with a cultural norm that confers higher status on
women at home, other family income can act as a powerful deterrent to educated women’s labor
force participation. Where patriarchal norms are less dominant, the substitution effect should
overshadow the income effect (Brinton, Lee, and Parish 1995). But in India, we would expect the
income effect to be especially strong.
However, most past studies in India have used National Sample Survey data in which it is
not possible to separate other family member’s income from a women’s own earnings, thus making
it difficult to distinguish income and substitution effects. The present study uses the India Human
Development Surveys (IHDS) that measure both a woman’s own earnings and other household
income, thus permitting a better separation of income and substitution effects for educated women.
While the results confirm a strong negative effect of other family income on women’s labor force
participation, they again find a U-shaped relationship between women’s education and her labor
force participation even after taking into account other family income. The other family income

4|P a g e
controls make the negative sloping part of the curve flatter and the positively sloping part steeper
but the relationship remains curvilinear rather than uniformly positive.
A further analysis examines the relationship between women’s education and three different
categories of work: salaried positions paid monthly, casual wage work, and work in family farms or
businesses. For salary work, the expected positive linear relationship is observed: the more
education she has, the more likely she is to work in a salaried position. However, for women
employed in their family farms and businesses, or as wage labor, the relationship is also linear but
negative. The observed U-curve is a resolution of these separate linear relationships.
The negative relationships are likely because more educated women do not want to work in
jobs that do not match their aspirations. The positive relationship with salaried positions is not
sufficient to produce the expected overall positive relationship because there are not enough
salaried positions open to women with moderate levels of education. The paper concludes by
noting the possible importance of occupational sex segregation in excluding women from clerical
and sales jobs that in most countries have been a major source of employment for moderately
educated women.
2. LITERATURE REVIEW
While “economic factors largely determine male participation in employment, the factors
that influence a woman’s participation in work are varied and include reproductive, demographic,
social, religious and cultural factors” (Srivastava and Srivastava 2010). Of these, education and
family income are especially important because of their prominent role in labor supply theory.
a) Education
Theories of human capital predict that an increase in skills would provide women a greater
opportunity to earn higher wages, and this in turn would increase women’s labor force participation

5|P a g e
(Smith and Ward 1985; Goldin 1990; England, Garcia-Beaulieu, and Ross 2004). In most
developed countries, increases in education cause an increase in women’s labor force participation
(Cain 1966; Tienda, Donato, and Cordero-Guzman 1992; England, Gornick, and Shafer 2012).
Interestingly, however, the story is often quite different in the low and middle-income countries. In
Peru, King (1990) reported that while education was associated with a decline in women’s labor
force participation, it did increase the proportion of women in paid employment. On the other hand,
in Ecuador, Jakubson and Psacharopoulos (1992) find that schooling has a positive effect on
women’s labor force participation even though the effect is small. The predicted probability of
labor force participation of a woman with 16 years of schooling (other traits unchanged) is 11
percentage points higher than for a woman with no schooling.
Reports from South Asia have often highlighted a generally negative relation between
increased levels of education and decreases in women’s workforce participation rate, noting that
illiterate women are more likely to be employed than educated women (Sathar and Desai 2000; Das
and Desai 2003). Other studies with more educational detail (e.g., Reddy 1979) find a J-shaped
relationship between women’s education and their labor force participation with increases only at
the highest educational levels. Others (Mathur 1994, Kingdon and Unni 2001, Das 2006) find a U-
shaped relationship with schooling beyond the junior/middle level enhances women’s wage work
participation.
Complex socio-economic phenomena underlie this paradox. Explanations generally rely on
some combination of structural and normative ideas: the disincentives from other family income,
restrictive gender norms especially those that attribute higher social status to non-working women,
greater emphasis on domestic duties and child-rearing in a newly competitive educational system,
and the lack of “suitable” work for educated women. But it is difficult to test these explanations
empirically with existing data.

6|P a g e
b) Other family Income
Increases in women’s labor force participation as education increases (as predicted by
human capital theory) could be depressed somewhat due to the income effect of other family
income. More educated women are likely to marry more educated men with higher incomes. If
family income is high, women would have less incentive to work (Goldin 1990, England, Gornick,
and Shafer 2012). Abraham (2013) argues that the rising incomes of Indian households have
enabled Indian women to withdraw from the labor market and focus on their role in “status
production”. As with the United States at the turn of the century, one of the markers of the
household having attained a middle class status may be to ensure that women from these
burgeoning middle classes do not have to work (Treas 1987). Using unit level data from the
National Employment Survey in urban areas of India, Klasen and Pieters (2015) have confirmed
that rising levels of household income play an important role in declining rates of women’s labor
force participation.
c) Other Factors
It has always been more socially acceptable for women of lower castes (such as Adivasis,
Dalits and Other Backward Castes) to be in the labor market (Kingdon and Unni 2001). Women
from the higher castes tend to face greater restrictions on their mobility. However, women from
families of the middle and lower castes with improved social standing also prefer to stay at home as
an effort at “Sanskritization” (Srinivas 1966, Chen and Drèze, 1995), an attempt to follow a more
Brahminical way of life. The greater the seclusion for the woman, the greater would be the prestige
for the family (Chen 1995).
Caste also has an impact on the educational opportunities women face (Dunn 1993). Thus,
part of the higher rates of labor force participation among illiterate women may be a result of their
7|P a g e
lower caste status. Similarly, some of the decline in labor force participation with more education
may result from the higher concentrations of higher status forward castes (such as Brahmins,
Kayasthas, Kshatriyas etc.) among moderately educated women.
Historical perspectives on women’s labor force participation in India note that a majority of
female workers have been involved in agriculture (e.g., Nath 1968). Consequently, women’s labor
force participation has always been higher for rural then urban areas. Few women have been
employed in the modern sector where educational credentials are more important. India is one of
the exceptional countries where the modern sector has experienced a fall in women’s work force
participation despite women’s rising education (World Bank 1991, Swaminathan 1994).
A slow shift in the industrial structure out of agriculture (Abraham 2013) has been a leading
cause of recent declines in women’s labor force participation (Mehrotra and Perida 2017). Critics of
India’s Structural Adjustment Program, introduced in 1991, have argued that these policies also led
to a decline in women’s employment because of declines in the unorganized sector (Mundle 1992).
Others (e.g., Papola 1994), on the other hand, proposed that a newly restructured economy could
favor the unorganized sector where wages were low and working conditions poor, perhaps having a
favorable impact on women’s employment. In India, the growth in the female share of employment
in industries and services is behind other South and South East Asian countries (other than Nepal)
although declines in female employment have long been theorized to follow the early stages of
development (Boserup 1970). Pampel and Tanaka (1986) and Mammen and Paxson (2000), for
instance, observe the expected U-shaped relationship between women’s labor force participation
and GDP per capita. All of these studies point to the importance of the type of jobs available as a
central moderating influence on the relationship between education and women’ labor force
participation.

8|P a g e
3. WHY IHDS?
The IHDS enjoys several advantages over other surveys for analyzing employment. It has a
more complete measure of women’s labor force participation by reviewing each household
economic activity (own farm work, nonfarm businesses, wage or salaried labor) and asks which
members participate in each activity. This gives a clearer picture of who is participating in the labor
force than does a single question about each person’s principal or secondary activity. Even if a
woman’s principal and secondary activities are household work, she could still be engaged in
seasonal farm work or assisting other household enterprises. Another advantage of IHDS is that
unlike previous studies that have information only on total household consumption (which is
endogenous to the woman’s own earnings) or husband’s and other family members’ wage earnings,
IHDS has more complete estimates of other family incomes. Abraham (2013), for instance,
recognizes the theoretical importance of other family income, but can only use household
consumption (“a robust proxy”) from the NSS. He finds an unexpected curvilinear U-shape
relationship of women’s labor force participation with household consumption levels for urban
households, a result that we suspect is driven by the additional women’s income in high
consumption households. In the IHDS measure, the relationship is consistently linear and
negative, as theory would predict.
Klasen and Pieters (2015) measure total other household earnings in their NSS data but try
to avoid problems of self-employed incomes by restricting their sample to urban areas and imputing
self-employed earnings based on earnings of similar employees (“a fairly rough approximation”).
The IHDS has a more direct measure of self-employed incomes and also has several additional
measures of unearned income (e.g., remittances, rents, pensions). According to the two waves of
IHDS about 45% of households are engaged in own farm work and 20% have at least one nonfarm
business (29% in urban areas). Moreover, 46% of households report some type of unearned

9|P a g e
income. Thus, it is difficult to measure the impact of other household income effects if these
income sources are ignored.
10|P a g e
4. HYPOTHESES
The present study uses the IHDS data to test the following hypotheses:
Hypothesis 1: More women’s education is associated with a decline in women’s labor force participation rate (LFPR) up to secondary education with a slight uptick for post secondary education.
Hypothesis 1 restates the often observed relationship between Indian women’s labor force
participation and education as U-shaped. The next hypotheses evaluate two theories that could
explain the U-shaped relationship. While hypothesis 2 evaluates the “income effect”, hypothesis 3
examines a labor market hypothesis.
Hypothesis 2a: Higher levels of other family income are associated with a decline in women’s LFPR.
Hypothesis 2b: Women with more education live in households with higher levels of other family income and those higher income levels explain the initial declines in their labor force participation.
As husband’s and other family income increases, women’s incentive to work declines. Holding
constant other family income should straighten out the U-curve and reveal the more theoretically
conventional positive increases with increasing education.
Hypothesis 3a: An increase in education is associated with an increase in women’s employment in salaried jobs.
Hypothesis 3b: An increase in education is associated with a decline in women’s employment in their own family farms and businesses.
Hypothesis 3c: An increase in education is associated with a decline in women’s employment in agricultural and non-agricultural wage work.
It is difficult for women with little education to get high quality, salaried, jobs. With post-secondary
school education better quality jobs become more accessible, so the higher returns to a better quality
job and the increase in social status associated with it lead to more employment. On the other hand,
11|P a g e
educated women would not want to work in outside jobs perceived to be below their educational
level as it lowers their social status. Therefore employment in manual labor or even household
enterprises would decline.
Hypotheses 3a to 3c explain the U-shaped relationship only when different types of work
are aggregated together. While on one hand there will be a steady increase in demand for white-
collar jobs among educated women, these jobs would be available only to women with the highest
levels of education. Because there is a limited supply of such jobs, women with moderate levels of
education are left out of the labor market.
5. DATA AND VARIABLES
The present study uses data from the two waves of IHDS (India Human Development
Survey 2016a). IHDS1 is a nationally representative sample of 41,554 households in 2004-2005
spread across all the States and Union Territories of India (except for the small territories of
Andaman Nicobar and Lakshadweep). The sample covers 384 districts, 1503 villages and 971
urban blocks. These 41,554 households include 215,754 individuals. In 2011-12 a second wave re-
interviewed the same households with an 83% re-contact rate. The IHDS2 sample was augmented
slightly to adjust for higher attrition in urban areas. The analysis sample is restricted to married
women, age 25-59. Many women below 25 are still enrolled in an educational institution and
women above the age of 59 would be likely to retire.
The IHDS is a multi-topic survey that encompasses different modules related to health,
education, employment, marriage, gender relations, economic status, social capital, and other
issues. The household economic questionnaire was usually answered by the head of the household,
or by someone who had sufficient knowledge about the income, expenditure, and employment
status of household members.
12|P a g e
Measuring women’s employment can be especially challenging because often women are
involved in part time or seasonal jobs, or they could work from home, or they may participate in the
labor market only in times of a family crisis (Beneria 1982, Folbre 1995, Hirway 2002, Das 2006).
As noted above, the IHDS measure of workforce participation is more detailed than for other
surveys. Unlike the NSS that asks for a woman’s principal and secondary status activities, the
IHDS has separate modules for different types of work (e.g., on the household farm, wage labor, in
household nonfarm businesses) and asks which household members participated in each type of
work during the previous year. In the present study anyone who worked for at least 240 hours in the
previous year across all types of work is considered to be in the labor force. Caring for household
animals, collection of firewood or other fuels, and fetching water from public sources were not
included as labor force participation as these are usually regarded as normal household chores in
India.
In addition to the overall measure of labor force participation, the analysis also
disaggregates work participation into three types: self-employment in own farm and nonfarm
businesses, salaried work (defined as monthly remuneration), and casual agricultural and
nonagricultural wage labor paid daily. For each category of work, if the woman works for more
than 0 hours per year in that type of work and for greater than 240 hours per year in any kind of
work, they are considered to be working in that work category. It should be noted that women can
be considered employed in multiple work categories.
Women’s education is divided into six categories: illiterate, pre-primary (0-4 years),
primary & post primary (5-9 years), secondary (10-11 years), higher secondary (12 + years with no
degree) and college graduate or higher.
Like employment, personal earnings and household incomes are also aggregate measures
built up across many survey modules. In addition to income and benefits from each type of work,
13|P a g e
the survey also asked about household income from remittances, rental and property income,
pensions, and government programs (India Human Development Survey 2016b). Other family
income was calculated for each household member by subtracting that person’s earnings from total
family income. For household enterprises with multiple household workers, each member’s own
earnings were calculated as their proportion of total household hours worked multiplied by the net
income from that enterprise. The log of other household income was calculated except for a small
percentage (2.1%) of women with negative or negligible other household incomes below Rs.1000
(usually households with crop failures resulting in negative net incomes). A separate dummy
variable identified these women who were then assigned the floor value of ln(1000) for other
household incomes.
The analysis also includes controls for years of husband’s education (a continuous variable
ranging from 0 to 15), the number of children under six and six to fifteen in the household; the
number of married women in the household; age in five year categories; four caste groups: Forward
Castes, Other Backward Castes, Scheduled Castes (SCs or Dalits), and Scheduled Tribes (STs or
Adivasis); three religious groups: Hindus, Muslims, and other minority religions; urban or rural
residence; and dummy variables for state fixed effects.
6. ANALYSIS
6.1 Descriptive Statistics
Table 1 gives descriptive statistics of all variables for the sample of 72,620 currently
married women aged 25-59. Of these, 41.6% are employed in some kind of work for at least 240
hours in the preceding 12 months: 4.8% are employed in salaried work, 26.9 % work in family
farms or businesses and 20.3% in agricultural and non-agricultural wage work. In the sample,

14|P a g e
47.4% of women are illiterate, 26.7% have completed primary school education and only 5% are
college graduates.
Table 1. Summary Statistics Mean Std. Dev. Any Work 0.416 0.493 Salaried Work 0.048 0.214 Work in family farms or businesses 0.269 0.443 Work in daily wage labor 0.203 0.402 Education
Illiterate 0.474 0.499 Incomplete primary 0.076 0.266 Primary and post primary 0.267 0.442 Secondary 0.086 0.281 Higher Secondary 0.047 0.211 College graduate or higher 0.050 0.217
Log of annual other family income 10.982 1.212 Other family income < Rs 1000 0.021 0.145 Husband's Education (years) 6.438 4.958 Caste
Forward caste 0.298 0.457 Other Backward Caste (OBC) 0.416 0.493 Scheduled caste (SC) 0.208 0.406 Scheduled Tribes (ST) 0.079 0.270
Religion Hindu 0.828 0.377
Muslim 0.113 0.317 Other religion 0.059 0.235
Urban 0.319 0.466 Number of children ages 0-5 0.646 0.963 Number of children ages 6-15 1.281 1.338 Number of married women 1.815 0.974 Age
25-30 0.249 0.432 31-35 0.173 0.378 36-40 0.177 0.381 40-45 0.143 0.350 46-50 0.124 0.330 51-55 0.094 0.291 56-59 0.041 0.198
Survey (=1 for IHDS2, =0 for IHDS1) 0.561 0.496

15|P a g e
Source: IHDS1 and IHDS2. N= 72,620
16|P a g e
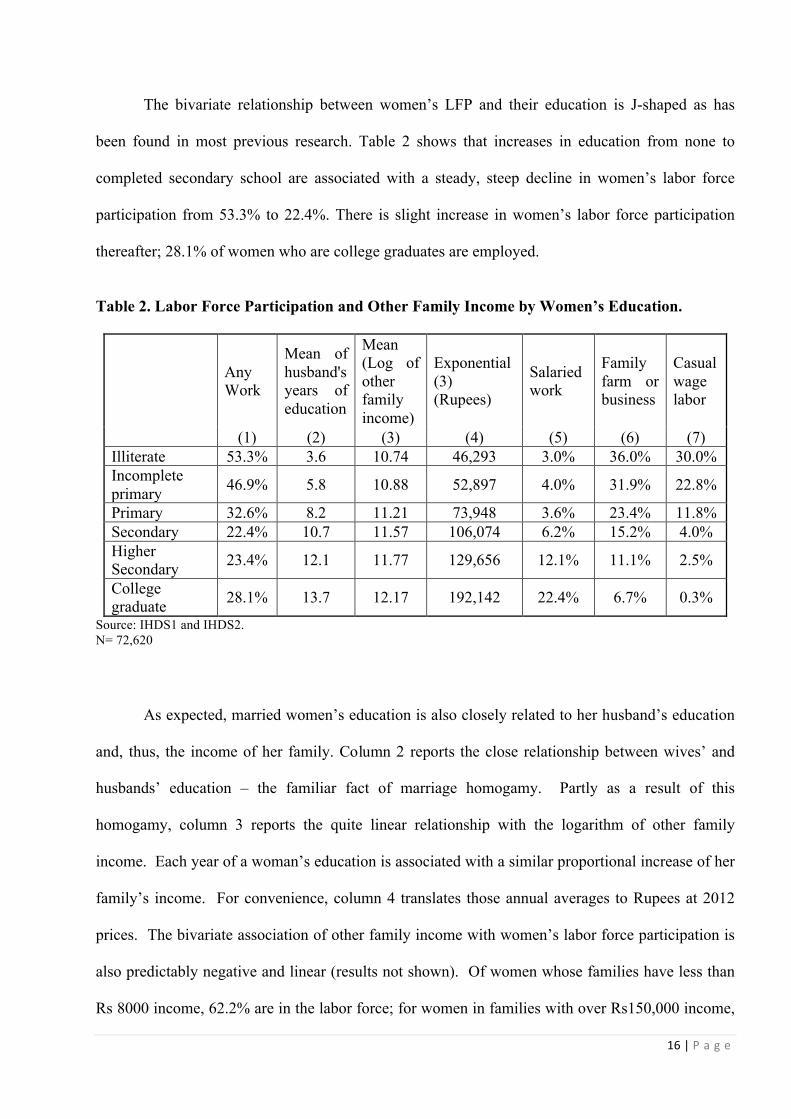
The bivariate relationship between women’s LFP and their education is J-shaped as has
been found in most previous research. Table 2 shows that increases in education from none to
completed secondary school are associated with a steady, steep decline in women’s labor force
participation from 53.3% to 22.4%. There is slight increase in women’s labor force participation
thereafter; 28.1% of women who are college graduates are employed.
Table 2. Labor Force Participation and Other Family Income by Women’s Education.
Any Work
Mean of husband's years of education
Mean (Log of other family income)
Exponential (3) (Rupees)
Salaried work
Family farm or business
Casual wage labor
(1) (2) (3) (4) (5) (6) (7) Illiterate 53.3% 3.6 10.74 46,293 3.0% 36.0% 30.0% Incomplete primary 46.9% 5.8 10.88 52,897 4.0% 31.9% 22.8%
Primary 32.6% 8.2 11.21 73,948 3.6% 23.4% 11.8% Secondary 22.4% 10.7 11.57 106,074 6.2% 15.2% 4.0% Higher Secondary 23.4% 12.1 11.77 129,656 12.1% 11.1% 2.5%
College graduate 28.1% 13.7 12.17 192,142 22.4% 6.7% 0.3%
Source: IHDS1 and IHDS2. N= 72,620
As expected, married women’s education is also closely related to her husband’s education
and, thus, the income of her family. Column 2 reports the close relationship between wives’ and
husbands’ education – the familiar fact of marriage homogamy. Partly as a result of this
homogamy, column 3 reports the quite linear relationship with the logarithm of other family
income. Each year of a woman’s education is associated with a similar proportional increase of her
family’s income. For convenience, column 4 translates those annual averages to Rupees at 2012
prices. The bivariate association of other family income with women’s labor force participation is
also predictably negative and linear (results not shown). Of women whose families have less than
Rs 8000 income, 62.2% are in the labor force; for women in families with over Rs150,000 income,

17|P a g e
only 21.5% are in the labor force. The research question is whether these other family income
relationships are sufficient to explain the steep decline of women’s labor force participation in
column 1. We address that question in the next section.
Finally, columns 5 through 7 show the bivariate relationships of a woman’s education with
the three types of employment: salaried work, family enterprises (farm or nonfarm), and casual
wage labor. Each of these is a fairly linear relationship. With rising education, employment in
salaried work increases steadily, falls dramatically for casual wage labor, and falls more gradually
for work in family farms and businesses. What is important here is that whereas each relationship
is quite linear, aggregated together the relationship becomes the familiar curvilinear J-shape
(column 1).
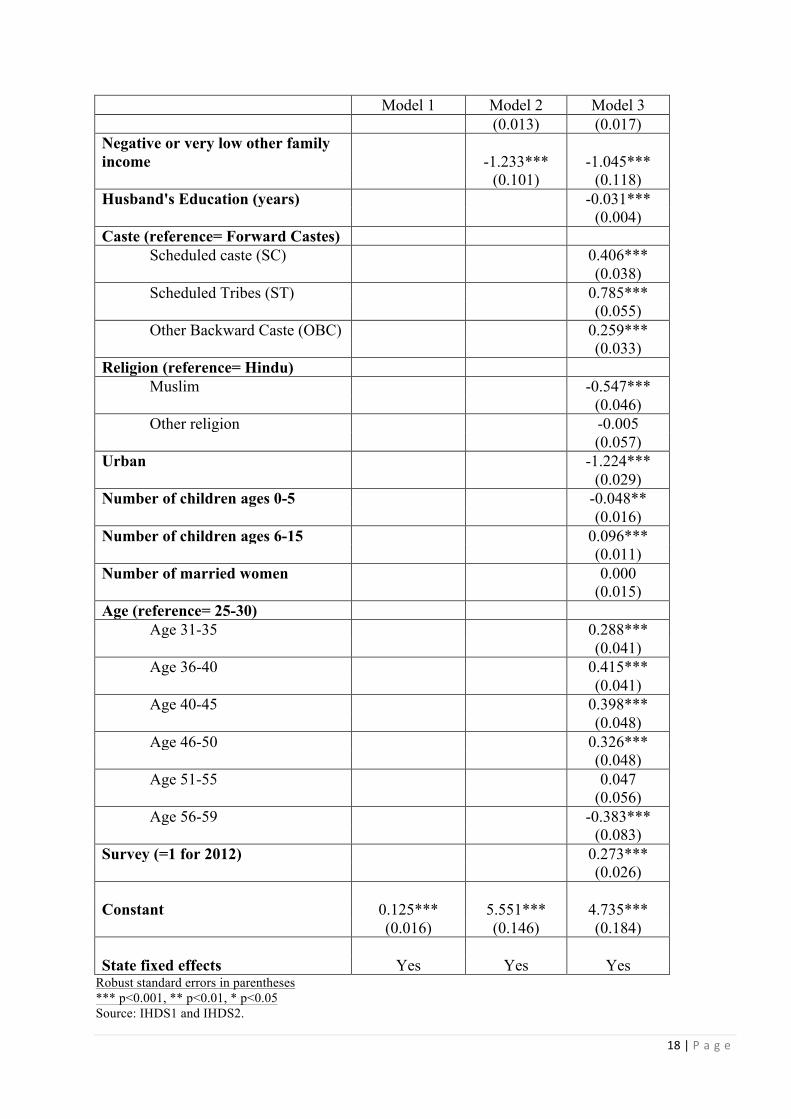
6.2 Logistic Regressions of Labor Force Participation.
Three logistic regression models predicting the log odds of a woman being employed are
estimated. In the first model, the log odds of a woman being employed is estimated using only the
education categories. The estimated coefficients reflect the J-shape curve seen in the bivariate
relationship of Table 2. The odds decline steadily from illiteracy to secondary completion and then
bend upwards for higher secondary and college graduates.
Table 3. Logistic Regressions of Women’s Labor Force Participation. Model 1 Model 2 Model 3 Education (reference= illiterate)
Incomplete primary -0.278*** -0.196*** -0.064 (0.040) (0.041) (0.048)
Primary -0.874*** -0.677*** -0.452*** (0.028) (0.029) (0.037)
Secondary -1.403*** -1.038*** -0.652*** (0.042) (0.044) (0.056)
Higher Secondary -1.321*** -0.858*** -0.313*** (0.061) (0.061) (0.075)
College graduate -1.066*** -0.389*** 0.530*** (0.046) (0.051) (0.068) Log of other family income
-0.507*** -0.426***
18|P a g e
Model 1 Model 2 Model 3
(0.013) (0.017)
Negative or very low other family income -1.233*** -1.045*** (0.101) (0.118) Husband's Education (years)
-0.031***
(0.004) Caste (reference= Forward Castes)
Scheduled caste (SC)
0.406***
(0.038)
Scheduled Tribes (ST)
0.785***
(0.055)
Other Backward Caste (OBC)
0.259***
(0.033)
Religion (reference= Hindu) Muslim
-0.547***
(0.046)
Other religion
-0.005
(0.057)
Urban
-1.224***
(0.029)
Number of children ages 0-5
-0.048**
(0.016)
Number of children ages 6-15
0.096***
(0.011)
Number of married women
0.000
(0.015)
Age (reference= 25-30) Age 31-35
0.288***
(0.041)
Age 36-40
0.415***
(0.041)
Age 40-45
0.398***
(0.048)
Age 46-50
0.326***
(0.048)
Age 51-55
0.047
(0.056)
Age 56-59
-0.383***
(0.083)
Survey (=1 for 2012)
0.273***
(0.026)
Constant 0.125*** 5.551*** 4.735***
(0.016) (0.146) (0.184)
State fixed effects Yes Yes Yes Robust standard errors in parentheses *** p<0.001, ** p<0.01, * p<0.05 Source: IHDS1 and IHDS2.
19|P a g e
N= 72,620
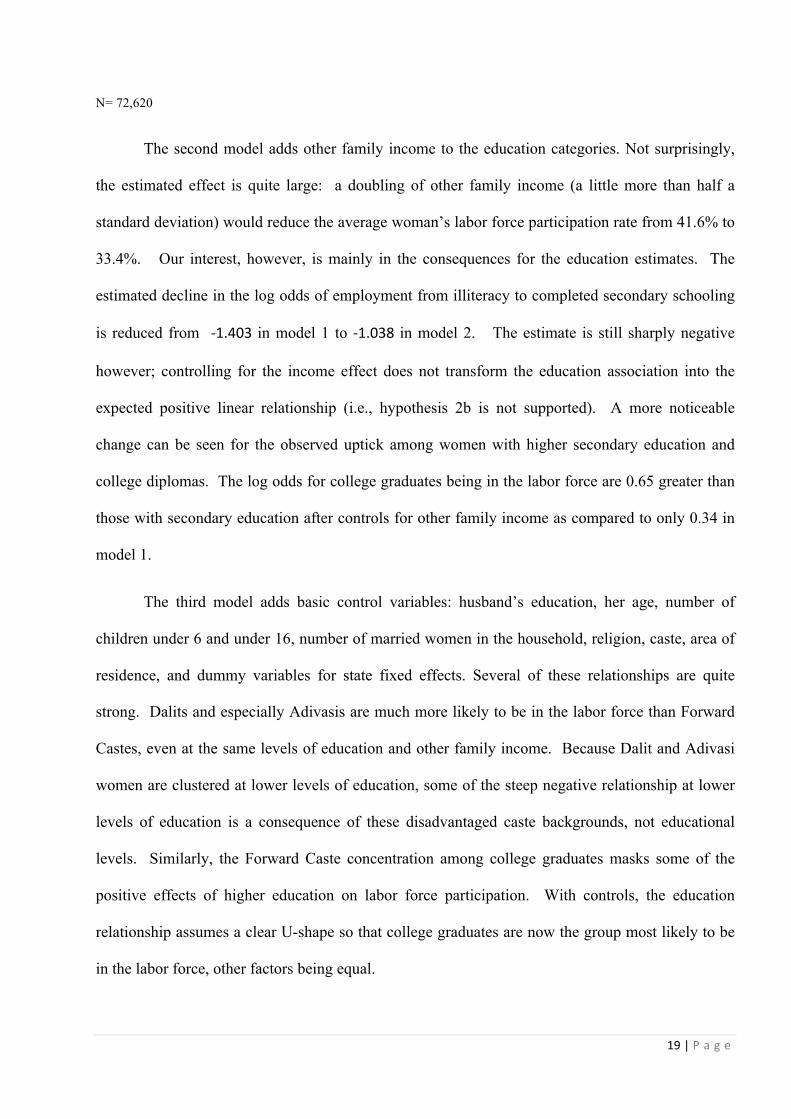
The second model adds other family income to the education categories. Not surprisingly,
the estimated effect is quite large: a doubling of other family income (a little more than half a
standard deviation) would reduce the average woman’s labor force participation rate from 41.6% to
33.4%. Our interest, however, is mainly in the consequences for the education estimates. The
estimated decline in the log odds of employment from illiteracy to completed secondary schooling
is reduced from -1.403 in model 1 to -1.038 in model 2. The estimate is still sharply negative
however; controlling for the income effect does not transform the education association into the
expected positive linear relationship (i.e., hypothesis 2b is not supported). A more noticeable
change can be seen for the observed uptick among women with higher secondary education and
college diplomas. The log odds for college graduates being in the labor force are 0.65 greater than
those with secondary education after controls for other family income as compared to only 0.34 in
model 1.
The third model adds basic control variables: husband’s education, her age, number of
children under 6 and under 16, number of married women in the household, religion, caste, area of
residence, and dummy variables for state fixed effects. Several of these relationships are quite
strong. Dalits and especially Adivasis are much more likely to be in the labor force than Forward
Castes, even at the same levels of education and other family income. Because Dalit and Adivasi
women are clustered at lower levels of education, some of the steep negative relationship at lower
levels of education is a consequence of these disadvantaged caste backgrounds, not educational
levels. Similarly, the Forward Caste concentration among college graduates masks some of the
positive effects of higher education on labor force participation. With controls, the education
relationship assumes a clear U-shape so that college graduates are now the group most likely to be
in the labor force, other factors being equal.

20|P a g e
The effect of the income and other controls on the education relationship can be seen more
clearly in the predicted probabilities displayed in Figure 1. In comparison to the bivariate
relationship (the heavy line), the graph after controls is more U-shaped. Though the control for
other family income doesn’t make the association completely positive, it does reduce the negatively
sloped part of the curve and shows a much greater increase in the probability of being employed at
higher levels of education. The predicted probability of a woman college graduate being employed
after controlling for other family income and background controls is 0.55 compared to 0.28 in the
case without controls. This gives support to the “income effect” whereby women belonging to
richer families have higher education but withdraw from the labor force because they do not have
as great a need to work for additional income as compared to women belonging to poorer families.
Figure 1. Predicted probabilities of a married woman aged 25-59 being employed by education levels.
Even though the income effect does explain a part of the “paradoxical relationship” between
women’s LFPR and her educational level, it doesn’t explain it fully. Secondary school matriculates
are still less likely to be in the labor force than the uneducated despite their higher human capital
that should make employment more attractive.
0
0.1
0.2
0.3
0.4
0.5
0.6
NoControls
Controlforotherfamilyincome
Allcontrols
21|P a g e
Urban residence has a powerful negative effect on women’s labor force
participation, but, interestingly, a similar U-shape relationship with education is observed
in both urban and rural areas (results not reported). In both rural and urban areas, women
with completed secondary school have the lowest levels of labor force participation which
rises with post-secondary education in both rural and urban areas (slightly stronger in urban
areas) and declines from no education in both rural and urban areas (slightly stronger in
rural areas). The strong but mostly additive effect of urban location suggests that to
understand the U-shape curve, it may be necessary to observe the different kinds of jobs that
educated women perform compared to the jobs of illiterate women.
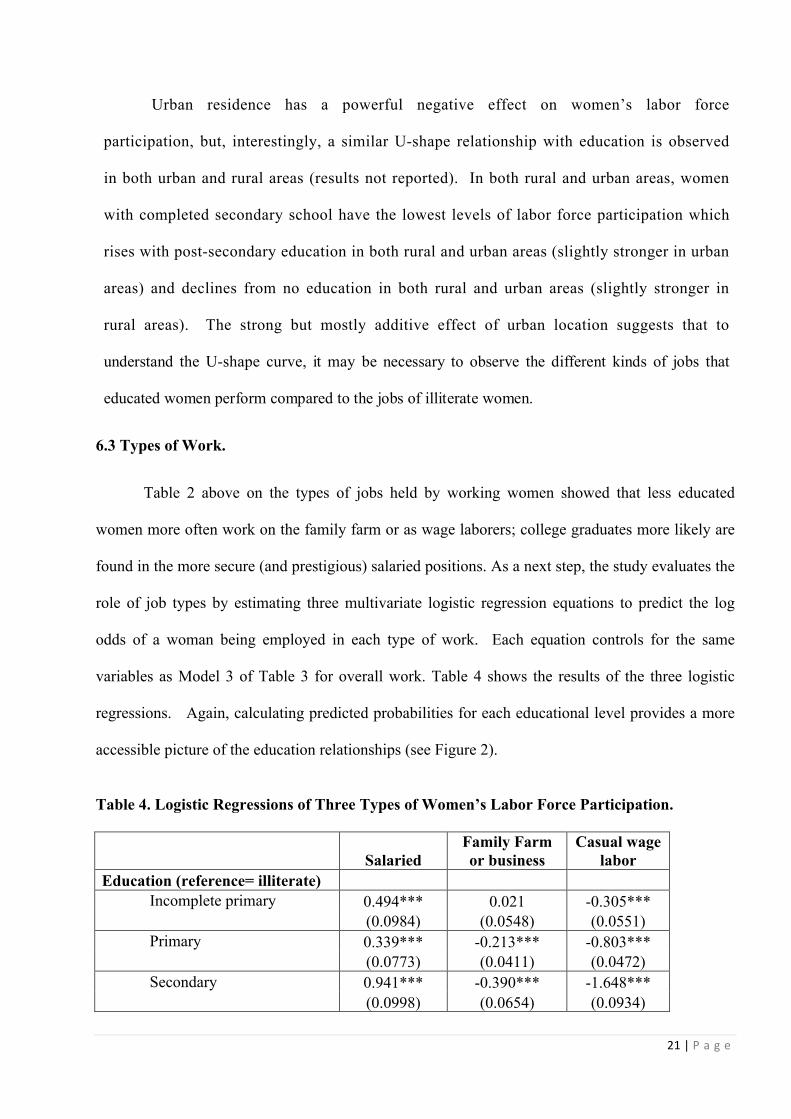
6.3 Types of Work.
Table 2 above on the types of jobs held by working women showed that less educated
women more often work on the family farm or as wage laborers; college graduates more likely are
found in the more secure (and prestigious) salaried positions. As a next step, the study evaluates the
role of job types by estimating three multivariate logistic regression equations to predict the log
odds of a woman being employed in each type of work. Each equation controls for the same
variables as Model 3 of Table 3 for overall work. Table 4 shows the results of the three logistic
regressions. Again, calculating predicted probabilities for each educational level provides a more
accessible picture of the education relationships (see Figure 2).
Table 4. Logistic Regressions of Three Types of Women’s Labor Force Participation.
Salaried Family Farm or business
Casual wage labor
Education (reference= illiterate) Incomplete primary 0.494*** 0.021 -0.305***
(0.0984) (0.0548) (0.0551) Primary 0.339*** -0.213*** -0.803***
(0.0773) (0.0411) (0.0472) Secondary 0.941*** -0.390*** -1.648***
(0.0998) (0.0654) (0.0934)

22|P a g e
Salaried Family Farm or business
Casual wage labor
Higher Secondary 1.698*** -0.530*** -1.620*** (0.1109) (0.1062) (0.1629)
College graduate 2.598*** -0.616*** -3.354*** (0.1031) (0.1008) (0.3230) Log of other family income -0.245*** -0.366*** -0.370*** (0.0249) (0.0171) (0.0203) Negative or very low other family income -0.646** -0.356** -1.939*** (0.2028) (0.1138) (0.1448) Husband's Education (years) -0.020** 0.005 -0.081*** (0.0073) (0.0040) (0.0045) Caste (reference= Forward Castes)
Scheduled caste (SC) 0.624*** -0.293*** 1.267*** (0.0733) (0.0460) (0.0549)
Scheduled Tribes (ST) 0.810*** 0.346*** 1.257*** (0.0960) (0.0540) (0.0671)
Other Backward Caste (OBC) 0.194** 0.189*** 0.578***
(0.0625) (0.0368) (0.0494) Religion (reference= Hindu)
Muslim -0.292*** -0.625*** -0.152* (0.0878) (0.0548) (0.0728)
Other religion 0.195* 0.001 0.109 (0.0797) (0.0701) (0.0786) Urban 0.794*** -1.785*** -1.356*** (0.0639) (0.0363) (0.0415) Number of children ages 0-5 -0.146*** 0.014 -0.060** (0.0392) (0.0165) (0.0203) Number of children ages 6-15 0.067** 0.071*** 0.078*** (0.0211) (0.0111) (0.0129) Number of married women -0.039 0.079*** -0.111*** (0.0269) (0.0164) (0.0213) Age (reference= 25-30)
Age 31-35 0.306*** 0.265*** 0.084 (0.0751) (0.0478) (0.0518)
Age 36-40 0.419*** 0.447*** 0.077 (0.0766) (0.0475) (0.0543)
Age 40-45 0.317*** 0.551*** -0.090 (0.0826) (0.0524) (0.0587)
Age 46-50 0.234** 0.552*** -0.229*** (0.0909) (0.0535) (0.0623)
Age 51-55 -0.020 0.313*** -0.519*** (0.0964) (0.0603) (0.0704)
23|P a g e
Salaried Family Farm or business
Casual wage labor
Age 56-59 -0.184 0.043 -1.100*** (0.1450) (0.0865) (0.1181) Survey (=1 for 2012) 0.166*** 0.218*** 0.559*** (0.0462) (0.0287) (0.0339) Constant -1.526*** 2.253*** 3.805*** (0.2781) (0.1997) (0.2203) State fixed effects Yes Yes Yes
Robust standard errors in parentheses *** p<0.001, ** p<0.01, * p<0.05 Source: IHDS1 and IHDS2. N= 72,620
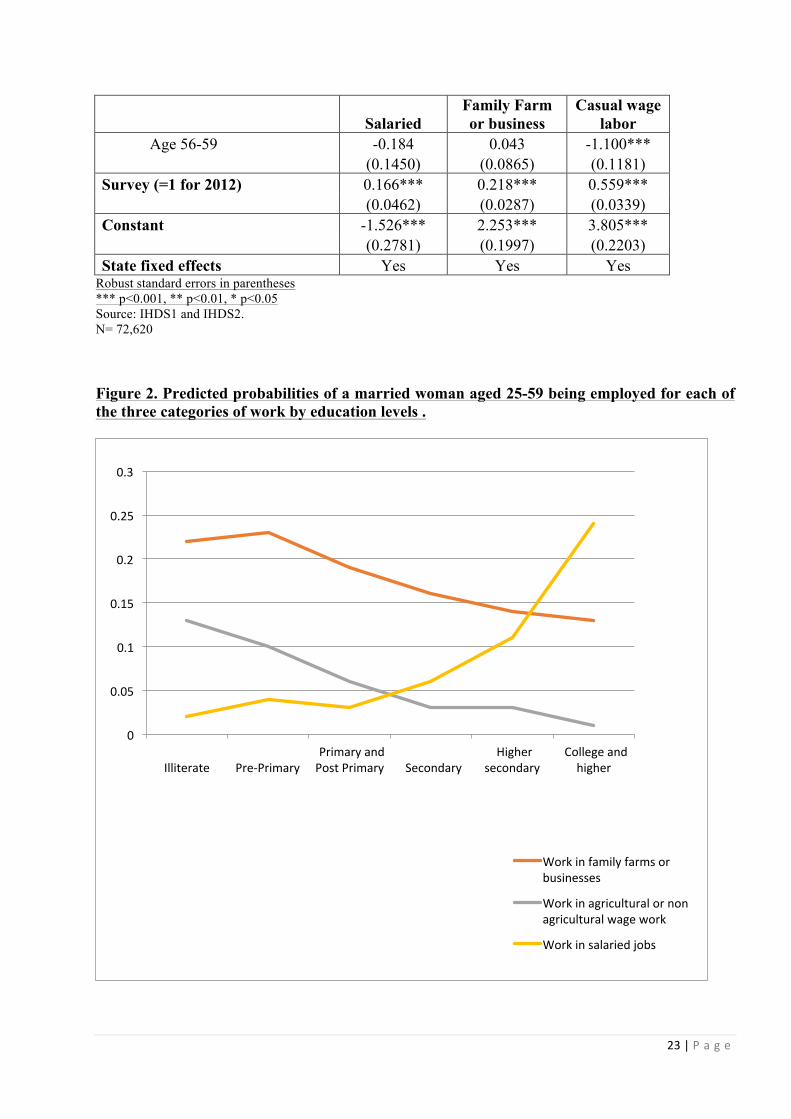
Figure 2. Predicted probabilities of a married woman aged 25-59 being employed for each of the three categories of work by education levels .
0
0.05
0.1
0.15
0.2
0.25
0.3
Illiterate
Pre-Primary
PrimaryandPostPrimary
Secondary
Highersecondary
Collegeandhigher
Workinfamilyfarmsorbusinesses
Workinagriculturalornonagriculturalwagework
Workinsalariedjobs

24|P a g e
For salaried positions, more education has the expected positive relationship with a greater
likelihood of work. The predicted probability of a currently married woman aged 25-59 being
employed in a salaried position increases from 0.02 to 0.24 as her education level increases from
being illiterate to being a college graduate. On the other hand, all other kinds of work show
declining probabilities as her education level increases. The predicted probability of her being
employed in a family farm or business decreases from 0.22 to 0.13; and in agricultural or
nonagricultural wage labor from 0.13 to 0.01.
These results are consistent with an explanation of women’s labor force participation that
educated women look mainly for better quality jobs, especially salaried work. The inference might
be that if all or most available jobs were salaried, Indian women would show the usual positive
relationship of higher rates of employment with more education. However, such jobs are limited
and are accessible mainly with higher levels of education. If appropriate jobs were available for
women with intermediate levels of education, we might expect higher levels of their labor force
participation. The answers to the remaining paradoxical U-shape relationship should best be sought
in the demand side of the Indian labor market.
7. DISCUSSION AND CONCLUSION
The present study examined the often-observed J-shaped relationship between education
and Indian women’s labor force participation. This relationship, especially the strong decline from
illiteracy to secondary completion, is contrary to what would be predicted by most human capital
theory. Secondary school graduates have more skills and human capital than those with only
primary education; and those with completed primary schooling have some literacy and numeracy
compared to those without any education. These skills should make them more productive workers
with higher earnings and thus more likely to be in the labor force. But the opposite is the case for

25|P a g e
Indian women.
The analysis takes advantage of the IHDS as the only national survey in India that has direct
measures of other household income. The results show support for the other income effect; the
greater the income women’s households have apart from their own earnings, the lower the chances
of the woman being in the labor force. But other family incomes hardly explain all of the lower
labor force participation of women with moderate levels of education. Caste and other background
factors also explain some of these differences. But even after taking into account other family
income, caste, and other background characteristics, the relationship between education and
women’s labor force participation becomes just U-shaped but not uniformly positive. Although the
lower participation rates of secondary school graduates are attenuated after the controls, they do not
disappear. However, after controls, education beyond secondary levels does lead to a much steeper
increase in the predicted probabilities of being a part of the labor force.
Further analysis points to the kinds of work available and the lack of demand for moderately
educated women’s more skilled labor as the main suspect for explaining the declining segment of
the U-curve. For salaried work, the probability of being employed steadily increases as a woman’s
education increases, whereas for casual wage labor and for work in family farms and businesses,
women’s LFPR decreases with an increase in education. Once they attain moderate levels of
education, women do not work in manual labor. The decline in women’s LFPR with more
education is greatest for agricultural and non-agricultural wage work, even more than for work in
family enterprises. It is especially manual work outside the household that is perceived to be below
one’s educational attainment. The preference for salaried jobs as women attain moderate education
could reverse the downward part of the U-curve, but such jobs are limited for women.
The lack of demand in India, despite economic growth, has been noted by other researchers
(Klasen and Pieters 2015). But why economic growth has not generated these jobs remains mostly

26|P a g e
an unanswered question. One place to look for answers that has not been sufficiently appreciated
would be the high levels of occupational segregation. In India, as everywhere, a major employer of
moderately educated workers is white-collar employment in clerical and sales jobs. But in India,
these jobs are still reserved for men. The 2001 census reports that 87.3% of office clerks, and
93.1% of sales jobs are held by men. It is not so much the lack of adequate jobs for moderate levels
of education but the exclusion of women from these jobs that explains the low rates of labor force
participation for these women.
In contrast, skilled work in education and health sectors is not nearly so gender segregated,
perhaps in part because this type of work conforms better with gender stereotypes of women’s
nurturing roles. But much of this work requires education beyond secondary school so the weaker
sex segregation in these jobs results in a greater demand for educated female labor and the observed
rise in labor force participation among female graduates. Over three quarters of teachers, for
instance, have education above secondary level and over a third, 36.8%, are women.
Much of the recent work on Indian women’s labor force participation has focused on the
important issue of declining rates over recent years. The U-shaped relationship between education
and women’s labor participation receives notice in these studies and is recognized as one of the
causes of the declining rates. Women’s increasing levels of education in recent years have put a
larger share of women in the lowest portion of the U-curve (Andres et al. 2017). But the U-curve
itself has received surprisingly little research attention. The observed difference between illiterate
women and women with some secondary education in fact exceeds the over time decline, but has
not inspired the same level of research attention. This lack of interest is all the more surprising
given its discrepancy with most labor supply theory. Explanations in the literature often cite
restrictive gender norms or the lack of “suitable” work for educated women, but a lack of adequate
data means that these explanations usually go untested. And the role of occupational segregation

27|P a g e
and the possibility of discrimination and exclusion of women from white-collar work is almost
absent from this literature.
The IHDS results do show that an adequate measure of other family income does explain
some of the paradoxical decline in women’s labor force participation with more education. But the
U-curve remains, so we need a renewed focus on explaining why these additional levels of human
capital are not brought into the labor market. Much of labor supply theory derives from high-
income countries’ (especially U.S.) experience; the Indian results offer an opportunity to expand
that limited background.
REFERENCES Abraham, V. (2013). Missing labour or consistent de-feminisation? Economic and Political Weekly 48(31): 99-108. Afridi, F., Dinkelman, T., and Mahajan, K. (2016). Why are fewer married women joining the work force in India? A decomposition analysis over two decades. Bonn, Germany: Institute for Labor Study (IZA Discussion Paper 9722). Andres, L.A., Dasgupta, B., Joseph, G., Abraham, V., and Correia, M. (2017). Precarious drop: Reassessing patterns of female labor force participation in India. Washington DC: World Bank (World Bank Policy Research Working Paper 8024). Benería, L. (1982). Accounting for women's work. In Benería, L. (Ed.), Women and Development, The Sexual Division of Labor in Rural Societies. New York: Praeger. Boserup, E. 1970. Woman’s Role in Economic Development. New York: St. Martin’s. Brinton, M. C., Lee, Y., and Parish, W.L. (1995). Married women’s employment in rapidly industrializing societies: Examples from East Asia. American Journal of Sociology 100(5): 1099-1130. Cain, G.G. (1966). Married Women in the Labor Force. Chicago: University of Chicago Press. Chatterjee, U., Murgai, R., and Rama, M. (2015). Job opportunities along the rural‐urban gradation and female labor force participation in India. Washington, DC: World Bank (Policy Research Working Paper 7412). Chen, M. (1995). A matter of survival: Women’s right to employment in India and Bangladesh. In Nussbaum, M and Glover,J. (eds) Women, Culture and Development. Oxford: Clarendon Press.

28|P a g e
Chen, M. and Dreze, J. (1995). Recent research on widows in India: Workshop and conference report. Economic and Political Weekly. 30(39): 2435-2450. Das, M. B. and Desai, S. (2003). Are Educated Women Less Likely to be Employed in India? Social Protection Discussion Paper No. 313. Washington DC: The World Bank. Das, M. B. (2006). Do Traditional Axes of Exclusion Affect Labor Market Outcomes in India? South Asia Series, Paper No.97. Washington DC: The World Bank. Dunn, D. (1993). Gender inequality in education and employment in the scheduled castes and tribes of India. Population Research and Policy Review 12(1): 53-70. England, P., Garcia-Beaulieu, C. and Ross, M. (2004). Women’s Employment among Blacks, Whites, and Three Groups of Latinas Do More Privileged Women Have Higher Employment? Gender & Society 18(4): 494-509. England, P., Gornick, J. and Shafer, E. F. (2012). Women's employment, education, and the gender gap in 17 countries. Monthly Labor Review 135(4): 3-12. Folbre, N. (1995). Engendering economics: New perspectives on women, work and demographic change. In: Bruno, M. and Pleskovic, M. (eds) Annual World Bank Conference on Development Economics. Washington D.C.: The World Bank: 127-153. Goldin, C.J. (1990). Understanding the Gender Gap: An Economic History of American Women. New York: Oxford University Press. Hirway, I. (2002). Employment and unemployment situation in 1990s: How good are NSS data? Economic and Political Weekly 37(21): 2027-2036. India Human Development Survey (2016a). Data and documentation [electronic resource]. College Park, MD: University of Maryland. http://ihds.info/data-documentation. India Human Development Survey (2016b). Data and documentation [electronic resource]. College Park, MD: University of Maryland. http://ihds.info/income. Jakubson, G. and Psacharopoulos, G. (1992). The effect of education on female labor force participation and earnings in Ecuador. In Psacharopoulos, G. and Tzannatos, Z. (eds) Women's Employment and Pay in Latin America: Country Case Studies, Washington, DC: The World Bank: 255-71. King, E. M. (1990). Does education pay in the labor market? The labor force participation, occupation and earnings of Peruvian women. Washington, D.C.: World Bank. (Living Standards Measurement Study Working Paper 67). Kingdon, G. G. and Unni, J. (2001). Education and Women’s Labour Market Outcomes in India. Education Economics 9(2): 173-95. Klasen, S. and Pieters, J. (2015). What explains the stagnation of female labor force participation in urban India? World Bank Economic Review 29(3): 449-478.

29|P a g e
Mammen, K. and Paxon, C. (2000). Women’s work and economic development. Journal of Economic Perspectives 14(4): 141–164. Mathur, A. (1994). Work participation, gender and economic development: a quantitative anatomy of the Indian scenario. The Journal of Development Studies 30(2): 466-504. Mehrotra, S. and Parida, J.K. (2017). Why is the labor force participation of women declining in India? World Development. 98, 360-38. Minnesota Population Center (2017). Integrated Public Use Microdata Series, International: Verion 6.5 [electronic resource]. Minneapolis: University of Minnesota. http://doi.org/10.18128/D020.V6.5. Mundle, S. (1992). The employment effects of stabilisation and related policy changes in India, 1991-92 to 1993-94. Indian Journal of Labour Economics 35(2): 227-237. Nath, K. (1968). Women in the working force in India. Economic and Political Weekly: 3(31): 1205-1213. Pampel, F.C. and Tanaka, K. (1986). Economic development and female labor force participation: A reconsideration. Social Forces 64(3): 599-619. Papola, T.S. (1994). Structural adjustment, labour market flexibility and employment. Indian Journal of Labour Economics 37(1): 3-16. Reddy, D. N. (1979). Female work participation in India: Facts, problems, and policies. Indian Journal of Industrial Relations: 197-212. Sathar, Z. and Desai ,S. (2000). Class and gender in rural Pakistan: Differentials in economic activity. In Garcia, B. (Ed.) Women, Poverty and Demographic Change. Oxford: Oxford University Press: 175-192. Smith, James P. and Ward, M.P. (1985). Time-series growth in the female labor force. Journal of Labor Economics 3(1): S59-S90. Srinivas, M.N. (1966). Social Change in Modern India. Bombay: Orient Longman. Srivastava, N. and Srivastava, R. (2010). Women, work, and employment outcomes in rural India. Economic and Political Weekly 45(28): 49-63. Swaminathan, P. (1994). Development Experience(s) in India: Gendered Perspectives on Industrial Growth, Employment and Education, Social Scientist 22(3/4): 60-92. Tienda, M., Donato, K. M. and Cordero-Guzman, H. (1992). Schooling, color, and the labor force activity of women. Social Forces 71:365-395. Treas, J. (1987). The effect of women's labor force participation on the distribution of income in the United States. Annual Review of Sociology 13: 259-288. World Bank. (1991). Gender and Poverty in India. Washington, D.C.: The World Bank.