Rising growth, declining investment The puzzle of the Philippines Breaking the...
41
Rising growth, declining investment The puzzle of the Philippines Breaking the “Low-Capital-Stock” Equilibrium Alessandro Magnoli Bocchi Washington, DC December 12, 2007
-
Upload
dortha-burke -
Category
Documents
-
view
220 -
download
0
Transcript of Rising growth, declining investment The puzzle of the Philippines Breaking the...

Rising growth, declining investment
The puzzle of the PhilippinesBreaking the “Low-Capital-Stock” Equilibrium
Alessandro Magnoli BocchiWashington, DCDecember 12, 2007

Table of contents1. The puzzle: an open and growing economy, but investment is declining
1a. What’s falling is domestic investment1b. Despite a more favorable environment, appetite is low
2. Why the decline? Investment is not a driver of current growth
2a. The public sector cannot invest2b. The capital-intensive private sector does not want to invest
2bi. Insufficient public investment2bii. Expensive inputs
2c. The rest of the private sector does not need to invest
3. What keeps growth going? The least protected sectors of the economy
3a. Unhappy work-seekers leave and send remittances, fuelling consumption3b. The service sector boost exports, lifting growth
4. What is the result? The economy is in a “Low-Capital-Stock” equilibrium
5. Why is this a concern? Growth could be faster and more inclusive
6. What can be done? Diversify the economy and gradually push reforms
6a. Pursue better-performing economic zones and a competitive exchange rate6b. Increase revenues, to finance spending in infrastructure and education6c. Gradually reduce élite-capture, to lower the cost of strategic inputs
Bibliography
Methodology (2/3 BC + 1/3 NEG)
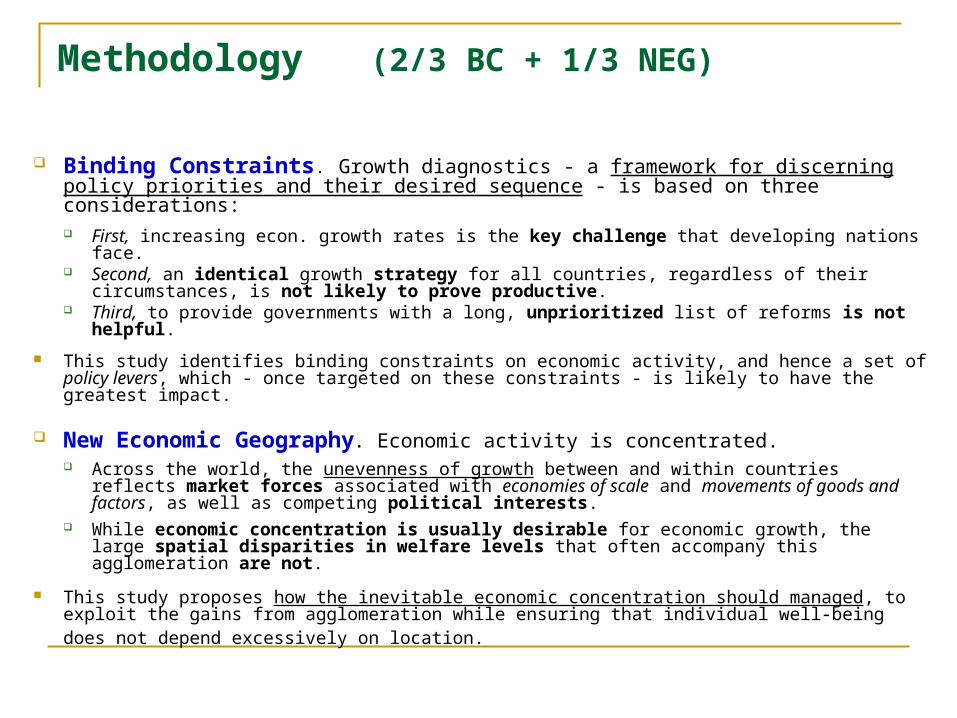
Binding Constraints. Growth diagnostics - a framework for discerning policy priorities and their desired sequence - is based on three considerations: First, increasing econ. growth rates is the key challenge that developing nations face. Second, an identical growth strategy for all countries, regardless of their
circumstances, is not likely to prove productive. Third, to provide governments with a long, unprioritized list of reforms is not helpful.
This study identifies binding constraints on economic activity, and hence a set of policy levers, which - once targeted on these constraints - is likely to have the greatest impact.
New Economic Geography. Economic activity is concentrated. Across the world, the unevenness of growth between and within countries reflects
market forces associated with economies of scale and movements of goods and factors, as well as competing political interests.
While economic concentration is usually desirable for economic growth, the large spatial disparities in welfare levels that often accompany this agglomeration are not.
This study proposes how the inevitable economic concentration should managed, to exploit the gains from agglomeration while ensuring that individual well-being does not depend excessively on location.

The puzzle: In an open and growing economy, why does investment decline?
The Filipino economy:
is open to trade and capital inflows; and since 2002, growth has averaged 5.3 percent
Over the last 15 years, however, domestic investment:
has been stagnant in real terms; and consistently declining as a share of GDP

1. Growth with declining investment … in a service economy
Source: National Statistical Coordination Board, 2007. Source: Asian Development Outlook, 2007.
0
5
10
15
20
25
30
35
% G
DP
-10
-8
-6
-4
-2
0
2
4
6
8
%
Fixed InvestmentGDP Growth (secondary axis)
Aquino's assassination
Marcos leaves
Coup attempts
Asian crisis
Economic reforms
Share of Services in GDP (%)
0 10 20 30 40 50 60
Thailand
Philippines
Malaysia
China 2002
2006

1a. Domestic investment falls … because of lower private outlays
0
5
10
15
20
25
30
35
% G
DP
Aquino's assassination
Marcos leaves
Coup attempts
Asian crisis
Total Domestic Investment
Private Domestic Investment
Public Domestic Investment
FDI
Economic reforms
Fixed capital formation
0
5
10
15
20
25
30
35
% G
DP
Others
Construction (public)
Construction (private)
Durable Equipment
Source: National Statistical Coordination Board, 2007.

1b. A more favorable environment : (1) A current account surplus … and rising capital inflows
Source: Central Bank of the Philippines, 2007.
-6000
-4000
-2000
0
2000
4000
6000
8000
Cur
rent
Acc
ount
Bal
ance
(N
SA
, U
SM
)
Aquino's assassination
Marcos leaves
Asian crisis
Coup attempts
Economic reforms
Net Capital Inflows
-10
-8
-6
-4
-2
0
2
4
6
8
10
% G
DP
Aquino's assassination
Marcos leaves
Asian crisis
Economic reforms
Coup attempts

1b. A more favorable environment : (2) Increased liquidity Lending looks profitable
Source: Central Bank of the Philippines, 2007. Source: Asian Development Outlook, 2007.
Contributions to M3 growth (%)
-5
0
5
10
15
20
25
30
35
2002 2003 2004 2005 2006
Net foreign assets Net domestic credit (private)Net domestic credit (public)M3 growth
Lending and deposit rates (%)
-3
-2
-1
0
1
2
3
4
5
6
7
2002 2003 2004 2005 2006
Real lending rateReal deposit rateLending-deposit spread

1b. … still, over the last 15 years, fixed investment decreased
Source: World Bank, 2006a.
Real Fixed Investment (Level. SA. 2000-01=1)
0.8
1.0
1.2
1.4
1.6
1.8
MalaysiaThailandPhilippinesIndonesia
Trend Growth 2002 Q1 - 2006 Q4 Investment GDPIndonesia 8.2% 5.2%Malaysia 4.6% 6.2%Philippines -0.2% 6.0%Thailand 10.3% 5.7%
Gross Fixed Investment as % of GDP (Nominal)
14%
19%
24%
29%
34%
39%
44%
1993 1994 1995 1996 1997 1998 1999 2000 2001 2002 2003 2004 2005
ChinaKorea
Thailand
Indonesia
Philippines
Malaysia

2. Investment is not a driver of current growth
In the Philippines, investment does not grow at the pace of GDP. Three reasons explain this puzzle:
a. The public sector cannot afford it ;
b. The capital-intensive private sector does not want to expand that fast ; and
c. The non-capital-intensive private sector does not need to invest.

2a. The public sector cannot invest
Constrained by serious fiscal pressures, due to:
decades of weak revenue performance; a weighty debt service; and a high cost of inputs
it cannot keep public investment growing at GDP growth rates.

2b. The capital-intensive private sector does not want to invest
It does not find it convenient to expand investment at the economy’s fast pace, as it expects little returns.
The marginal product of capital (MPK) is low, because: i) the public sector does not invest enough to provide incentives for
private investment; and
ii) inputs are expensive because of élite-capture in the traditional sectors of the economy (agriculture, sea and air transport, power, cement, mining, banking, etc).
Controlled by the local élite, the conglomerates use political connections to drive potential investors out, discourage smaller firms to grow bigger, and enjoy oligopolistic rents.

2b. The capital-intensive private sector does not want to invest Declining MPK … and little appetite for investment
Source: S&PIFC EMDB - Price to Book Value Ratios. Source: Central Bank of the Philippines, 2007.
Tobin's q
0
1
2
3
4
5
6
Average (China, Indonesia, Malaysia, Thailand)
Philippines
Domestic credit to private sector
0
10
20
30
40
50
60
70
% G
DP
Aquino's assassination
Marcos leaves
Asian crisis
Economic reforms
Coup attempts
Market value/asset value

Firms
K-intensive Sectors: Oligopolies
Agriculture (rice) Transport Power & cement Mining & banking
Non K-intens. Sectors: Competition
Electronics assembly
Call centers - BPOs
Government
Macroeconomic concerns and fiscal adjustment
Regulatory uncertainty, anticompetitive practices, and (volatility in) corruption
Rules and regulations
protect oligopolies
2bii. Expensive Inputs
Low MPK
2bi. Insufficient Public Investment
Low tax collection
Low Public Savings Pricing power
Barriers to Entry
Source: Author.
2b. The private sector expects low returns. MPK is low

2bi. As the Government struggles with severe
fiscal pressures, public investment keeps falling Sectoral Budget Allocations, 2004-2006
2004 2005 2006 Economic Services 19.4 17.2 18.7
Agric. & Agr. Reform 3.3 2.8 2.6 Social Services 28.9 27.7 27.9
Education 14.9 14.7 13.9 Health 1.7 1.4 1.3
Defense 4.9 4.8 5.0 General Public Services 16.1 15.4 15.3 Net Lending 0.7 0.8 0.8 Debt Interest Payments 30.1 34.1 32.3 Total 100.0 100.0 100.0
Source: Government and Ateneo Center for Economic Research and Development, 2007.

2bii. Rice rents : domestic price above world price Domestic and World Rice Prices
0.00
5.00
10.00
15.00
20.00
25.00
Pe
so
s p
er
kg
World price
Domestic price
Source: World Bank, 2006 and 2007b.

2bii. Transport and cement: oligopolistic rents
Cement prices are the highest …
Cement Price (US$ per tonne, Q4-06) Philippines 72 Indonesia 69 Vietnam 65 India 52 Thailand 50 Malaysia 49 China 35
Source: JP Morgan and National Associations
… and consumption is the lowest
Cement Per Capita Consumption (kgs) China - India - Thailand 450 Malaysia 477 Vietnam 316 Indonesia 144 Philippines 128
Source: Cement Manufacturers Associations
Exporting a container costs up to three times more…
20-footer container US Dollars Philippines 1,336 Thailand 848 China 335 Singapore 382
Source: World Bank (Cross-Border Trading, 2006)

2c. The rest of the private sector does not need to invest
The fast-growing businesses:
electronics assembly; voice-based business process outsourcing (BPO); and information and communication technology (ICT)
do not need to increase their investment at GDP growth rates to enjoy fast-rising profits.

2c. The rest of the private sector does not need to invest Services are growing fast … and are
less capital-intensive
Source: National Statistical Coordination Board, 2007. Source: Author on NSCB, 2007.
Contributions to GDP growth (%)
0
1
2
3
4
5
6
7
2002 2003 2004 2005 2006
ServicesIndustryAgricultureOverall GDP
0
5
10
15
20
25
% G
DP
Industry Investment
Services Investment
Agriculture Investment

3. Despite the decline in investment, the economy keeps growing
The least protected sectors - the informal labor market and the non-capital-intensive activities - stimulate demand and drive supply:
a. On the demand-side, massive migration results in remittances and transfers (13 percent of GDP) which fuel consumption-led-growth - and lower the penalty for élite-capturing policies
b. On the supply-side, the service sector and a few non-capital-intensive manufactures, free from rent-capturing regulations, boost exports

3a. Workers cannot easily enter into the formal labor market Quarterly Unemployment Rate Average monthly wages (by sector)
Source: National Statistical Coordination Board, 2007. Source: Author on Lanzona and NSCB, 2007.
1
3
5
7
9
11
13
15
%
Philippines
China (Urban)
ThailandMalaysia
10%
15%
20%
25%
30%
35%
Nom
inal
pes
os/G
DP
per
cap
ita Total
Services
Industry
Agriculture
Wage setting does not reflect supply and demand

Insider wage premia: rents pay higher wages - relative to other Asian countries – to the formal sector salaried insiders.
0
5001000
15002000
2500
30003500
40004500
5000
0 50 100 150 200 250
Average monthly wage worker in USD
GNI p
er ca
pita Thailand
Philippines
India
China
BangladeshVietnam
Source: J ETRO 16th Survey of Investment Related Cost and World Bank
Indonesia
Malaysia
Monthly Wages in Low and Middle Income Asia (November 2005. In US Dollars)
0
300
600
900
1200
1500
1800
0 50 100 150 200 250Workers (General Industry)
Mid
-leve
l Man
ager
sDhaka
Hanoi
Jakarta
Bangkok
Manila
Shenzen
Bangalore
Kuala Lumpur
Shanghai
Qingdao
Source: JETRO 16th Survey of Investment Related Cost Comparison in Major Cities and regions in Asia. March 2006.
3a. Rents secure “national labor peace” Wages are high … even for skilled workers.
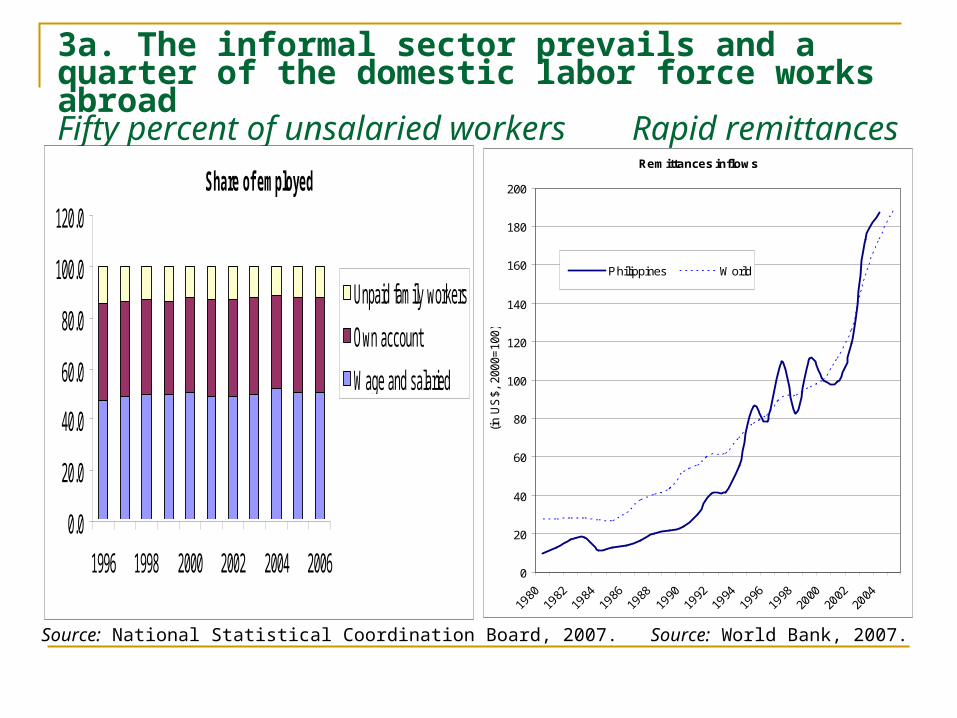
3a. The informal sector prevails and a quarter of the domestic labor force works abroadFifty percent of unsalaried workers Rapid remittances growth
Share of employed
0.0
20.0
40.0
60.0
80.0
100.0
120.0
1996 1998 2000 2002 2004 2006
Unpaid family workers
Own account
Wage and salaried
Source: National Statistics Office
Source: National Statistical Coordination Board, 2007. Source: World Bank, 2007.
Remittances inflows
0
20
40
60
80
100
120
140
160
180
200
(in U
S$,
200
0=10
0)
Philippines World

3a. Qualified workers are increasingly
moving overseas
Overseas Workers by Occupation Based on work contracts only In percent 1993 2004 Service workers 34.9 40.2 Professional and technical 25.3 33.4 Production 36.4 22.6 Clerical 1.6 1.9 Sales 1.0 1.4 Administrative and managerial 0.1 0.2 Agricultural 0.7 0.2
Source: Philippine Overseas Employment Administration
… boosting - and reducing the volatility of - private consumption
The flows of remittances and transfers from overseas workers have grown rapidly …
Despite the higher wages in the service sector, 32.3 percent of the unemployed were high-school graduates and 18.4 percent were college graduates.

3b. The non-K-intensive sector boost exports, lifting growth Semiconductors lead exports TFP is leading the way
Source: National Statistical Coordination Board, 2007. Source: World Bank, 2007a.
Contributions to export growth
-2
0
2
4
6
8
10
12
14
16
2003 2004 2005 2006
SemiconductorsOther manufactures Garments & textiles Mineral and petroleum products Agro-based and forest productsExport growth
Growth accounting
-8.0
-6.0
-4.0
-2.0
0.0
2.0
4.0
1960-80 1981-85 1986-03 2004-06
COntribution to growth
Physical K Human K TFP
Growth comes from non-capital-intensive manufactures and services

4. In equilibrium at a low-level of capital stock In the status quo corporate conglomerates use the political system to limit
economic entry & create rents, and then use the resulting rents to stabilize the economic and political system
The resulting self-interested political constituencies, in equilibrium, perpetuate the status quo.
Economic agents with rational foresight have no incentives to unilaterally increase investment, as the first-mover will bear short-term costs
While the public sector faces macroeconomic fragility, the domestic private sector makes enough money within the status quo (and the capital-intensive private sector is dealing with a low MPK).
Foreign investors “stay out” and non-élite businesses “stay small and informal”. Hence, the economic system is in equilibrium at a low-level of capital stock.
In the short-medium term, low levels of investments are rational, and the “low-capital-stock” equilibrium is delivering …
… economic growth, which - although not creating jobs (the unemployment rate is at almost 8 percent) - seems sustainable.

E
A
Rules and regulations
protect oligopolies
Enforcement
Households
Domestic labor force (DLF)
Formal L Mkt Informal L Mkt
Industry Segmentation
G
F
Emigration
Remittances
25% DLF FDI
ABROAD
C
Incentives:
“Stay small” “Stay informal”
B
E
Firms
K-intensive Sectors: Oligopolies
Agriculture (rice) Transport Power & cement Mining & banking
Non K-intens. Sectors: Competition
Electronics assembly
Call centers - BPOs
D
Labor code
Barriers
Government
Macroeconomic concerns and fiscal adjustment Low Public Investment Under-spending in infrastructure and education
Regulatory uncertainty, anticompetitive practices, and (volatility in) corruption
Via wages, rents buy “national labor peace”
4. The status quo: a “low-capital-stock equilibrium”
Source: Author.

5. Concern: Growth could be faster and more inclusive
The economy needs to move from its “low-capital-stock” equilibrium to a higher one The growth potential is untapped: for future competitiveness, it is essential to
reverse the present under-investment.
It is difficult to see how, at present levels of investment, a sufficiently robust growth can be sustained in the longer term, which is essential to deal with the country’s long-term development challenges (more jobs and less poverty).
Growth is not inclusive Over 2002-2006, higher growth did not translate into higher employment.
For the past few years, poverty reduction has been slower than in the rest of East Asia, and rural poverty remains high.
The sustainability of the growth model is exposed to long-term risks In the long run, of the two engines of growth (export-led services and
remittances-fuelled consumption), the first might “cannibalize” the second.
To reach speedier and more inclusive growth and sustain it in the long term, the country needs to address its lack of competitiveness.

5. Rent-seeking corporate conglomerates limit economic entry
0
100
200
300
400
500
600
700
800
900
1000
0 10,000 20,000 30,000 40,000
GDP per Capita, PPP, Current International $
Inte
rnat
iona
l Inv
estm
ent A
sset
s/G
DP
(%)
China
Philippines
MalaysiaThailand
Hong Kong
Japan
Singapore
Korea
Mexico
Argentina
Brazil
USA
Bahrain
International Investment Assets/GDP
0
100
200
300
400
500
600
700
800
900
1000
Philippines
Median
Average
EAP Total
Sources: IMF, Consolidated Portfolio Investment Survey; World Bank, World Development Indicators, 2007.
International Foreign Asset Holdings … and GDP per Capita, 2004

5. Recent growth is jobless … and poverty reduction is slower
Source: Author on NSCB, 2007 and Canlas et al., 2006. Source: Author on World Develop. Indicators , 2007.
-200
-150
-100
-50
0
50
100
150
%
94
95
96
97
98
99
100
101
GDP Growth (1980=100)
Employment rate (1980=100 - secondary axis) 25
30
35
40
45
50
55
60
65
70
1990 1996 1999 2000 2001 2002 2003 2004 2005 2006 2007
$2-a
-day
Hea
dcou
nt I
ndex
(%)
EAP
Philippines

6. To sustain growth, the economy needs a phased competitive diversification and then push reforms
What is needed is a market-driven expansion of non-traditional products …
Given the strength of rent-seeking interests, moving too abruptly would entail political risks; the reform can occur only gradually.
To mitigate and postpone confrontation with rent-seekers, the Government should follow a three-pronged strategy:
a. start by getting the economic zones right - while pursuing a competitive real exchange rate - in order to promote new exportables;
b. increase revenues, to finance the needed boost in infrastructure and education spending; and
c. implement gradual reforms to tackle the rent-seeking conglomerate economy and reduce the cost of strategic inputs.
… to steadily build a pro-reform political constituency
Over time, the expanding competitive sectors should shrink the relative size of the rent-driven economy, and - with the businesses that are bearing the costs of rent-seeking - reduce élite-capture.

6a. Pursue better-performing economic zones and a competitive exchange rate For speedier growth, policies should promote the manufacturing - and
export - of new and more sophisticated products.
A key starting point is improving the performance of the economic zones … How to do it? PEZA should make convincing commitments to improving
the performance of the economic zones:
(i) provide non-fiscal incentives to the construction in loco of first-rate infrastructure - e.g., via PPP;
(ii) guarantee simplified business procedures; (iii) enhance in situ competition, by ensuring - for example - that local institutions
treat domestic and foreign firms equally and transparently (e.g., in dispute reconciliation); and
(iv) coordinate this “ecozones strengthening process” within an overall growth strategy.
… while pursuing a stable and competitive real exchange rate. How to do it? Stimulate higher saving rates, by (i) tightening of fiscal policy
and (ii) sterilizing capital inflows and remittances.

6a. Nominal appreciation relative to the
US dollar
Philippines
Asian Pacific Currencies100=Jun2006
75
80
85
90
95
100
105
110
Jul/06 Sep/06 Nov/06 Jan/07 Mar/07 May/07 Jul/07 Sep/07
KOR IND PHIL THAI MAL SYN TAIW
Source: Bloomberg

6b. Increase revenues, to finance spending in infrastructure and education
Additional revenues and more public-private risk sharing in infrastructure and education.
How to do it? Increase revenues as a share of GDP by strengthening tax administration and adjusting excise taxes, continue lowering the debt-to-GDP ratio and interest payments, and restrain non-priority current expenditures.
To increase tax collection, the taxpayer register should include the corporate conglomerates and tax arrears should be audited.
Indexation would ensure that excise revenues do not decline in real terms: excises on fuel, alcohol, and tobacco are low by international standards and have not kept up with inflation since the tax reform of 1997.
Finally, starting from the economic zones, it is necessary to stimulate risk-sharing among investors - for example, via PPP in infrastructure, by co-financing public works (transport and communications) and in education, by addressing under-provision of training in areas where skills are lacking.

6c. Gradually reduce élite-capture, to lower the cost of strategic inputs
In the traditional sectors, the rent-seekers are powerful and well established.
How to do it? First steps are improving the investment climate and competitiveness, and disseminating information on the distributional effects of government policies. But concrete measures are needed to open oligopolistic markets.
Reducing protection for agricultural products, particularly rice, will benefit the food processing and livestock industries.
Greater competition in ports and shipping, civil air transport, wholesale electricity and cement production markets would substantially reduce costs, spur investments, and create jobs.
Political reform is needed to trigger and sustain these economic gains … … but leadership matters (as shown in the de-monopolization of
telecoms).

Bibliography ADB-JBIC-World Bank, 2005. Connecting East Asia: A New Framework for Infrastructure. Asian
Development Bank, Japan Bank for International Cooperation, and World Bank, 2005. Aquino, R. Q., 2003. “Does Corporate Diversification Create Value?”, The Philippine Review of
Economics, Vol. XL, No. 2, December 2003. Araral, E. K., 2006. “The Political Economy of Policy Reform in the Philippines: 1992–1998”. The
Journal of Policy Reform Vol. 9, No. 4, 261–274, December 2006. Arrow, K. J., and L. Hurwicz, 1958. “On the Stability of the Competitive Equilibrium.” Econometrica,
Vol. 26, No. 4. (Oct., 1958), pp. 522-552. Asian Development Bank, 2007. Asian Development Outlook, 2007. Ateneo de Manila, 2007. Ateneo Center for Economic Research and Development,
http://www.ateneo.edu/soss/cenfac04.htm Auty, R.M. and N. Pontara, 2008 (Forthcoming). A dual track strategy for managing Mauritania’s
projected oil rent, Development Policy Review, 26, 1. Auty, R.M., 2007. Patterns of Rent-extraction and Deployment in Developing Countries: Implications
for Governance, Economic Policy and Performance, In: Mavrotas, G. and Shorrocks, A. (eds) Advancing Development: Core Themes in Global Economics, London: Palgrave, 555-57.
Balassa, B. (ed.), 1984. Development Strategies in Semi-Industrial Economies. Baltimore: Johns Hopkins University Press for the World Bank, 1984.
Balisacan, A. and H. Hill, 2007. The Dynamics of Regional Development: The Philippines in East Asia. Asian Development Bank and Edward Elgar Publishing.
Balisacan, A. and H. Hill, eds. 2003. The Political Economy: Development, Policies, and Challenges. Loyola Heights, Quezon City: Ateneo De Manila University Press.
Balisacan, A. and N. Fuwa (eds), 2007. Reasserting the Rural Development Agenda: Lessons Learned and Emerging Challenges in Asia. SEARCA and ISEAS. Manila, Philippines.
Balisacan, A. and N. Fuwa, 2004. “Going Beyond Cross-country Averages: Growth Inequality, and Poverty Reduction in the Philippines”. World Development 32(11), pp. 1891-1907.

Bibliography (cont.) Bernardo, R. L. and M. C. G. Tang, 2007. The Political Economy of Reform during the Ramos
Administration (1992-1998). Draft paper. World Bank Commission on Growth and Development. Blomström, M. and A. Kokko, 2003. The Economics of Foreign Direct Investment Incentives. NBER
Working Paper No. 9489, February 2003. Bourguignon F., and T. Verdier, 2000, “Oligarchy, Democracy, Inequality and Growth”, Journal of
Development Economics, 62(2), 285-231. Brooks, R. 2002. Why is Unemployment High in the Philippines? IMF Working Paper No. 02/23. Canlas, D. B., Aldaba, F., and E. Esguerra, 2006. Growth, Employment Creation, and Poverty
Reduction in the Philippines. Draft Paper. Central Bank of the Philippines, 2007. Bangko Sentral ng Pilipinas, http://www.bsp.gov.ph Dasgupta, P., and Maskin, E., 1986. “The Existence of Equilibrium in Discontinuous Economic
Games, I: Theory”. The Review of Economic Studies, Vol. 53, No. 1. (Jan., 1986), pp. 1-26. David, C., P. Intal, and R. Balisacan, 2007. Distortions to Agricultural Incentives in the Philippines.
World Bank Working Paper, 2007. Deininger, K., 2003. Land Policies for Growth and Poverty Reduction. World Bank. Washington D.C. Devereux, J. and L. L. Chen, 1985. Export Zones and Welfare: Another Look. Oxford Economic
Papers, 47, 4, 2, Oct., 1995, 704-713. Dooley, M., D. Folkerts-Landau, and P. Garber, 2003. An Essay on the Revived Bretton Woods
System. NBER Working Paper no. 9971. Esfahani, H. S. 1994. “Regulations, institutions, and economic performance: the political economy of
the Philippines’ Telecommunications Sector”, World Bank Policy Research Working Paper 1294. Fabella, R. V. 2000. “The Soft State, The Market and Governance.” Philippine Review of Economics,
Volume XXXVIII, No. 1. June. Ghosh, S., 2006. “East Asian Finance: The Road to Robust Markets.” World Bank, 2006. Gill, I. and H. Kharas, 2006. An East Asian Renaissance: Ideas for Economic Growth. World Bank,
2006. Government of The Philippines, 2007. National Statistics Office, http://www.census.gov.ph/

Bibliography (cont.) Hausmann, R. and D. Rodrik, 2003. “Economic Development as Self-Discovery”, Journal of
Development Economics, vol. 72, December 2003. Hausmann, R., and D. Rodrik, 2006. Doomed to Choose: Industrial Policy as Predicament, John F.
Kennedy School of Government, Harvard University, September 2006. Hausmann, R., Pritchett L., and D. Rodrik, 2005. “Growth Accelerations,” Journal of Economic Growth,
Vol. 10, 2005, pp. 303–29. Hausmann, R., Rodrik D., and A. Velasco, 2005. Growth Diagnostics, John F. Kennedy School of
Government, Harvard University, March 2005. Hayami, Y., A. Quisimbing, and L. Adriano, 1990. Toward an Alternative Land Reform Paradigm: A
Philippine Perspective. Ateneo de Manila University Press. Manila, Philippines. Hirschman, A., 1958. The Strategy of Economic Development, New Haven, CT, Yale University Press. Hurwicz, L., 1973. “The Design of Mechanisms for Resource Allocation.” American Economic Review,
Vol. 63, No. 2, Papers and Proceedings of the Eighty-fifth Annual Meeting of the American Economic Association. (May, 1973), pp. 1-30.
Hurwicz, L., 1979. “On allocations attainable through Nash equilibria.” Journal of Economic Theory, Elsevier, vol. 21(1), pages 140-165, August 1979.
Hutchcroft, P., 1998. Booty Capitalism: The Politics of Banking in the Philippines, Ateneo de Manila University Press, Quezon City.
IMF, 2005. World Economic Outlook Chapter 2. “When Bubbles Burst.” IMF, 2006a. Asia and Pacific Regional Outlook. May 2006. Chapter V. “Asia’s Investment Decline.” IMF, 2006b. IMF Country Report No. 06/181 and Selected Issues Paper, May 2006. JETRO, 2006. The 16th Survey of Investment-Related Cost Comparison in Major Cities and Regions in
Asia. Japan External Trade Organization, Overseas Research Department. March 2006. JETRO, 2007. The 17th Survey of Investment-Related Cost Comparison in Major Cities and Regions in
Asia. Japan External Trade Organization, Overseas Research Department. March 2007. Jones Lang LaSalle, 2006. Asia Pacific Property Digest. Third Quarter 2006.

Bibliography (cont.) Jones, B. F., and B. A. Olken, 2005. “The Anatomy of Start-Stop Growth,” NBER Working Paper No.
11528, Cambridge, MA: National Bureau of Economic Research, 2005. Kleinschmidt H., 2006. Migration, Regional Integration and Human Security. The Formation and
Maintenance of Transnational Spaces. Ashgate Publishing. Krueger A., 1974. “The Political Economy of a Rent-Seeking Society”, American Economic Review,
64(3), 291-303. Krueger, A., 1993. The Political Economy of Reform in Developing Countries, Cambridge, MA: MIT
Press. Kumar R. 1987. Performance of foreign and domestic firms in export processing zones. World
Development, Volume 15, Issues 10-11, October-November 1987, Pages 1309-1319. Maskin, E., 1999. “Nash Equilibrium and Welfare Optimality.” Review of Economic Studies 66 (1), 23–
38. Maskin, E., and J. Tirole, 1988. “A Theory of Dynamic Oligopoly, I: Overview and Quantity
Competition with Large Fixed Costs.” Econometrica, Vol. 56, No. 3. (May, 1988), pp. 549-569. Maskin, E., and J. Tirole, 1988. “A Theory of Dynamic Oligopoly, II: Price Competition, Kinked
Demand Curves, and Edgeworth Cycles.” Econometrica, Vol. 56, No. 3. (May, 1988), pp. 571-599. Maskin, E., and Riley, J., 1984. “Monopoly with Incomplete Information.” The RAND Journal of
Economics, Vol. 15, No. 2. (Summer, 1984), pp. 171-196. Mirandilla, M. P., 2006. Competition, Regulation and Re-Regulation: Development of
Telecommunications in the Philippines. Draft paper. Myerson, R. B., 1982. “Optimal coordination mechanisms in generalized principal-agent problems,”
Journal of Mathematical Economics, Elsevier, vol. 10(1), pages 67-81, June. Myerson, R. B., 1983. “Mechanism Design by an Informed Principal.” Econometrica, Vol. 51, No. 6.
(Nov., 1983), pp. 1767-1797. Myerson, R. B., 1999. “Nash Equilibrium and the History of Economic Theory.” Journal of Economic
Literature, Vol. 37, No. 3. (Sep., 1999), pp. 1067-1082. North D. C., 1981. Structure and Change in Economic History, New York: Norton.
Bibliography (cont.) North D.C., 1990. Institutions, Institutional Change and Economic Performance, Cambridge:
Cambridge University Press. North, D. C., Wallis J. J., and B. R. Weingast, 2006. A Conceptual Framework for Interpreting
Recorded Human History. NBER Working Paper N. 12795, Cambridge, MA, December 2006. Prasad, E., R. Rajan, and A. Subramanian, 2007. Foreign Capital and Economic Growth. Brookings
Papers on Economic Activity, Vol. 1, March 2007. Radner, R., Myerson, R. B., and E. Maskin, 1986. “An Example of a Repeated Partnership Game
with Discounting and with Uniformly Inefficient Equilibria.” The Review of Economic Studies, Vol. 53, No. 1. (Jan., 1986), pp. 59-69.
Rajan R.G., and L. Zingales, 2003. Saving Capitalism from the Capitalists, Crown Business, New York.
Rajan R.G., and L. Zingales, 2006. The Persistence of Underdevelopment: Institutions, Human Capital or Constituencies, CEPR Discussion Paper No. 5867, October 2006.
Republic of The Philippines, 2007. 2007 Philippines Development Forum, www.pdf.ph Republic of The Philippines, 2007. Bureau of the Treasury, http://www.treasury.gov.ph Republic of The Philippines, 2007. National Statistical Coordination Board, http://www.nscb.gov.ph Republic of The Philippines, 2007. Philippine Economic Zone Authority, http://www.peza.gov.ph/ Rodrik, D., 1993. “The positive economics of policy reform”, American Economic Review 83, 356-61. Rodrik, D., 1996. “Understanding economic policy reform”, Journal of Economic Literature, 34
(March), pp. 9–41. Rodrik, D., 2006. Industrial Development: Stylized Facts and Policies, John F. Kennedy School of
Government, Harvard University, August 2006. Rodrik, D., 2007a. “The Real Exchange Rate and Economic Growth: Theory and Evidence,” John F.
Kennedy School of Government, Harvard University, July 2007. Rodrik, D., 2007b. Normalizing Industrial Policy, John F. Kennedy School of Government, Harvard
University, September 2007.

Bibliography (cont.) Rondinelli, D. A., 1987. Export Processing Zones and Economic Development in Asia: A Review
and Reassessment of a Means of Promoting Growth and Jobs. American Journal of Economics and Sociology, 46, 1, Jan. 1987, 89-105.
Shleifer, A. and R. Vishny, 1999, The Grabbing Hand: Government Pathologies and their Cures. Harvard University Press.
Sturzenegger, F. and M. Tommasi (Eds), 1998. The Political Economy of Reform, Cambridge, MA: The MIT Press.
Williamson, J., 2003. Exchange Rate Policy and Development. Paper presented to the Institute for Policy Dialogue, June 2003.
World Bank, 2005a. Philippines: From Short-Term Growth to Sustained Development. World Bank, 2005b. Philippines: Meeting Infrastructure Challenges. World Bank, 2005c. Philippines: Towards a Better Investment Climate for Growth and Productivity World Bank, 2006a. Investing for Growth in Emerging East Asia, Background paper for APEC
Senior Finance Officials Meeting, December 2006. World Bank, 2006b. East Asia Update. November 2006. World Bank, 2006c. Dancing with Giants. China, India and the Global Economy. (Eds. L. Alan
Winters and Shahid Yusuf). World Bank, 2007a. Philippines: Invigorating Growth, Enhancing Its Impact. World Bank,
Washington D.C. World Bank, 2007b. Agricultural Public Expenditure Review. World Bank, Washington D.C. World Bank, 2007c. World Development Indicators, 2007. World Economic Forum, 2004. “The Global Competitiveness Report, 2003-2004”.