India Apartment Index
8
-
Upload
property-expert -
Category
Real Estate
-
view
894 -
download
3
Transcript of India Apartment Index

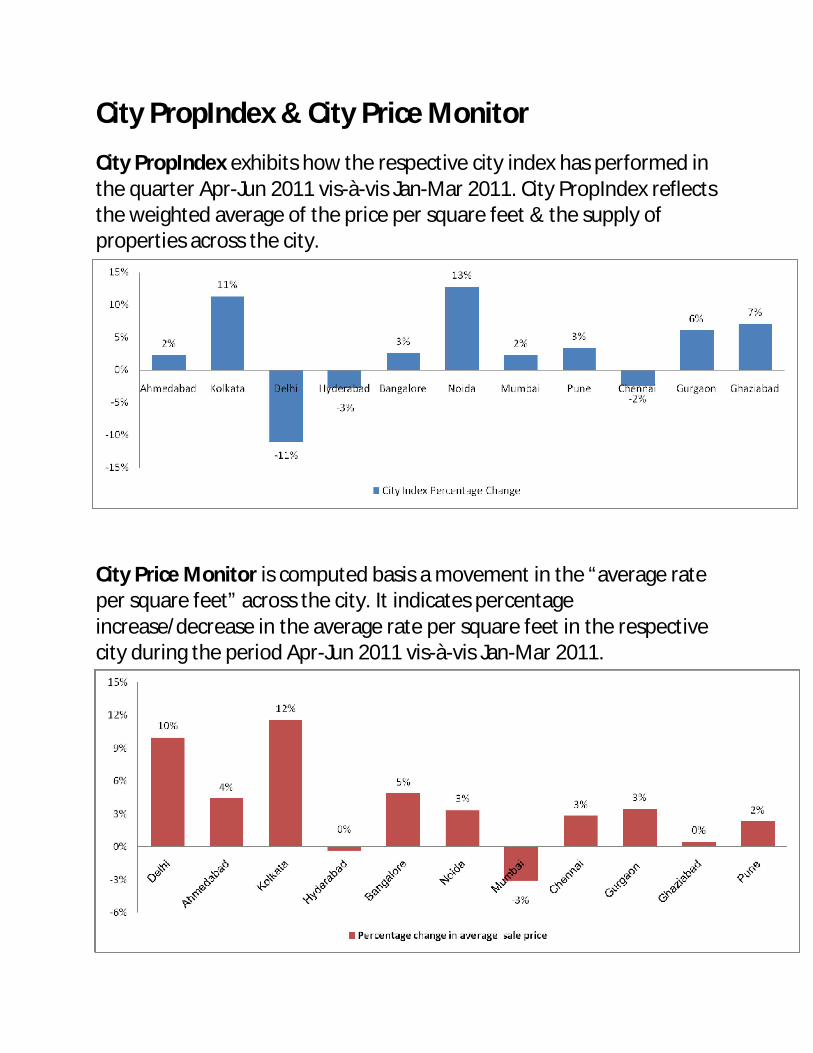
City PropIndex & City Price Monitor
City PropIndex exhibits how the respective city index has performed in the quarter Apr-Jun 2011 vis-à-vis Jan-Mar 2011. City PropIndex reflects the weighted average of the price per square feet & the supply of properties across the city.
City Price Monitor is computed basis a movement in the “average rate per square feet” across the city. It indicates percentage increase/decrease in the average rate per square feet in the respective city during the period Apr-Jun 2011 vis-à-vis Jan-Mar 2011.

APR-JUN 2011
The first MagicBricks PropIndexfeaturing apartment properties in11 cities across the country wentup by 3% in the Apr-Jun 2011quarter as against the Jan-Mar2011 quarter. There have beensignificant regional variations.
The increase in the NationalProperty Index (NPI) reflects theweighted average of rising andfalling supplies and prices acrossthe cities.
In the NPI, out of 11 citiescovered, 8 have shown a positivetrend in their city index and 3cities have shown a decline intheir city index.
The cities such as Noida andKolkata topped the MagicbricksPropIndex with 13% and 11%increase followed by Gurgaonand Ghaziabad from the NCR.Pune, Mumbai and Bangaloreposted 2-3% growth.
Delhi showed the steepest fall inindex values while Hyderabad
and Chennai too posted 2-3% dipduring the Apr-Jun 2011 period.
The NPI is a weighted average ofcity indices. The biggestcontributors to the NPI were themost active markets of Mumbai,Gurgaon, Bangalore, Pune andGhaziabad.
Each city index value depends onthe type of property coming up ineach locality and how well itmatches consumer demand.
The index is impacted by thenumber of properties in eachlocality and the locality’sweightage in the city, based on itscontribution to the city’s propertydatabank.
The index is based on a mix ofnewly developing and establishedlocalities as well as new and oldconstructions.
The composite index value of acity draws from the changingindex values of differentlocalities. This indicates whetherthe city as a whole has shownrising or falling value trends.
n National Property Index(NPI) rose 3%
n Economic corridors drovedemand for residentialproperty
n New corridors displayedenhanced level of activity as compared to establishedcity areas.
n Changing trends in demandfor affordable and premiumproperties across localities,shifted traditionalbenchmarks
n High cost residentialdevelopments yielded lowreturn vis-à-vis small ticketprice development
APR-JUN 2011
IN THIS REPORT:
National Property Index...............1Delhi.........................................4Gurgaon....................................6Noida & Ghaziabad.................... 8Mumbai....................................11Pune........................................14Ahmedabad..............................16Kolkata...........,........................ 18Chennai....................................20Hyderabad................................22Bangalore.................................24Annexures.................................27
NATIONAL PROPERTY INDEX (NPI)
However, certain localities aremore active than others and cancontribute significantly to theindex values of that city.
VOL 1, ISSUE 1, APR-JUN, FY 2011-12

NATIONAL PROPERTY INDEX
There have been certain commonthreads across different city indexvalues.
lNew properties in newdeveloping areas or redevelopedproperties in older areas seemedto be in demand across thecities, primarily because theyboasted newer formats andlifestyle features.
lSupply of new properties,especially along new corridorsof growth have significantlyimpacted the index acrossdifferent cities.
lCapital values across cities roseon the back of either enhanceddemand because of local factorsor a huge amount of supply ofnew projects along growthcorridors at affordable rates.
lBoth enhanced or crunchedsupply and rising or fallingvalues have impacted cityindices
Delhi, despite the 11% fall wasone of the most active propertymarkets with value growthregistered by most localities.However, the mix of propertychanged dramatically in thequarter. The major contributorsto the change were SafdarjangEnclave, Saket, Dwarka andVasundhara. Premium propertiesin Safdarjang Enclave and Saket
with average prices of Rs 16,000-19,000 per sq ft fell in numbers andreceived a lower weightage in thisquarter while affordableproperties in the value range ofRs 6,000-7,000 in Dwarka andVasundhara rose in numbers andtipped the city’s indexdownwards.
Noida showed 11% increase inindex values. The majorcontributors to the change wereSectors 76, 78, 143 & 168.
Upcoming properties in Sectors76 and 78 in the Rs 3,000-3,200 persq ft range witnessed boost innumbers and received a higherweightage in this quarter, addingto the rise of the city’s indexvalue. A similar trend waswitnessed in Sectors 143 and 168along the Taj Expressway.
Ghaziabad Index rose 7%. Themajor contributors to the changewere Indirapuram, Raj NagarExtension and Crossings
2 VOL 1, ISSUE 1, APR-JUN, FY 2011-12

Republik. The latter two are newlydeveloping areas where propertiesare in the possession stage.Therefore, there was an increasein numbers and received higherweightage in this quarter andinclined the city index upwards.
Gurgaon Index remained 6% upin this quarter. New supply inupcoming areas such as Gurgaon-Faridbad Road and Sector 92resulted in higher weightage inthis quarter coupled with increasein values, pushing the indexupwards. Other locations such asSohna Road and Golf Course Roadregistered increase in values by 5-10%. However, there was a fall inweightage on account of fall innumber of listings. The cityaverage remained 2-6% up.Aberrations were noticed in eightlocalities, which may simply be afunction of market dynamics orweak infrastructure.
The Kolkata Index rose 11%primarily because of a rise in thenumber of listings and values inareas such as New Town, EMBypass, Jadavpur and Alipore. Allthese localities registered a spurtin values coupled with significantincrease in numbers and receivedhigher weightage in this quarter.All localities in the Kolkata cityindex rose by 2-9%. Kalikapurregistered a 14% rise even thoughthe number of listings held steady.The only areas that dropped invalues in the city index wereSantoshpur and Baguiati with a 4-5% drop.
Hyderabad’s property market hasbeen depressed because ofpolitical turmoil, even thougheconomic activity still remainsstrong. Professionals from the ITsector are the main drivers withrealtors offering special discountsto woo them. The Hyderabad cityindex fell 3%. Upcoming localitiessuch as Manikonda and Kondapur,dropped in values and rose innumber of listings, thus incliningthe index downwards. On theother hand, old localities such asBegumpet and Maredpalli, whichtoo have registered fall in values
but have clocked significant rise inthe number of listings, havefurther weakened the index.Average values fluctuated acrossthe city, based on local drivers.
The Chennai Index showed 3%dip. Madipakkam and Perungudiwere the major contributors to thedip. Fall in values by 6-8%,together with increase inweightage in this quarter, pushedthe index down. However, otheractive localities such asMedavakkam and Velacheri,where values and weightage rosein this quarter, has arrested thefall of the index.
Inspite of registering an uptrendin values in majority of thelocations, the Pune Index showeda nominal increase of 3%,primarily dropped in number oflistings in localites such asMagarpatta and Kharadi. Thoughvalues rose overall in theselocalities, there was a fall in thenumber of listings in these areasleading to a lower weigthage inthis quarter.
Mumbai’s property marketremained flat except for newdeveloping pockets such as Powai-Kanjur Marg, Navi Mumbai areasof Virar and Vasai as also theThane, Kalyan, Mira Road andBhayender areas, where 3-12% risein values buoyed up the index by2-3%. Worli too showed positivetrends.
The Ahmedabad city indexshowed a nominal increase of 2%on the back of increase in valuesin majority of the locations acrossthe city.
The Bangalore Index rose by 2-3%. Banerghatta Road andKoramangala registered a rise invalues while the number oflistings remained steady.
New investment hubs such asSarjapur Road, Hebbal, Yelahanka,Marthahalli and Whitefield haveshown 3-7% rise in values andstable number of listings. AirportRoad was the only locality thatshowed 13% rise in values.
TOP YIELD GROSSERS
Rental yield is a factor of the changes inrental values locality-wise vis-a-vis thechanges in capital values. Given beloware the top yield-grossing localities ineach city
Locality Gross yield
EM Bypass, Kolkata 5.77%
OMR Road, Chennai 5.33%
Kondapur, Hyderabad 4.67%
Bandra East, Mumbai 4.53%
SG Highway, Ahmedabad 3.82%
Hadapasar 28, Pune 3.78%
Indirapuram, Ghaziabad 3.27%
Sector-82, Noida 3.11%
Vasundhara Enclave, Delhi 2.73%
CAPITAL GAINS
The table given below indicates maximum increase in capital values ineach city
Locality % Change
Noida, Sector-45 19%
Bangalore, Koramangala 19%
Delhi, Panchsheel Enclave 17%
Chennai, Porur 15%
Mumbai, Majiwade 14%
Kolkata, Kalikapur 14%
Gurgaon, Dlf City Phase II 13%
Hyderabad, Nizampet 13%
Ahmedabad, Bodakdev 13%
Pune, Warje 11%
Ghaziabad, Raj Nagar Extn 3%
VOL 1, ISSUE 1; APR-JUN, FY 2011-12 3

MagicBricksPropIndex
MagicBricks PropIndex is atool which empowersproperty seekers andinvestors with detailedinformation on themovement of residentialapartment prices andsupply of properties inIndia. No credible propertyindex can be a function ofdirect values as the changesare governed by multiplefactors.
MagicBricks PropIndex hastaken this reality intoaccount and produced anindex based on listing ofapartments and theircapital and rental values onthe website.
Magicbricks.com has over 4 lakh active propertiesposted by more than 1,00,000active users in 300 cities and3,500 localities. Our usersinclude owners, brokers andbuilders.
Methodology
Apartment values andlistings form the basis ofthe MagicBricks PropIndex.These include multistoreyapartments and single unitson plotted developments,referred to as Builder Floorson MagicBricks.com.
The Index is structured insuch a way that Individualproperties are aggregatedinto respective localitieswhich in turn are weighted
to their respective citywhich in turn is weighted tothe National Index.Weightages for PropIndexare based on the supply ofproperties within thelocality/city. Based on thisstructure, PropIndex gives arealistic picture of trends inprice/supply acrossdifferent property marketsin each city. We have useddifferent weightages forPrice Monitor/RentMonitor. Therefore, read asa whole, PropIndex alongwith tables provided forPrice Monitor, Rent Monitor,Yield Monitor and Capitalvalues. PropIndex gives anexcellent perspective of theproperty marketperformance in the quarter.
While listing and itsvalues/supply provide alevel of understanding intothe market, there aremeticulous data checks toprevent aberrationscreeping into the Index.These are based onstatistical calculations andlogical interpretations.While listing and itsvalues/supply provide alevel of understanding intothe market, there aremeticulous data checks toprevent aberrationscreeping into the Index.These are based onstatistical calculations andlogical interpretations.
The National PropertyIndex (NPI) is indicative ofthe extent of activity as well
as price movements acrosscities and localities in themajor cities active onMagicBricks.com. The indexincludes the top 11 cities(these have been chosenbased on their activitylevels) and has anindividual city report foreach of these cities. Whilethe NPI and its movementsare of interest to the expertcommunity of bankers,builders and investors, thePropIndex has also takencare to explain the nuancesof index movements at thelocality level that wouldhelp the huge base ofMagicBricks.com.consumers
The PropIndex has been puttogether throughmeticulous research at thelocality level and throughdetailed discussions withexperts who have regularlybeen offering market adviceand comments on variousforums in theMagicBricks.com’s offlineand online initiatives.
The real estate markets inIndia are dynamic and thePropIndex reflects thosechanges. Since it is derivedfrom a dynamic database,there will be some additionsand deletions of localitiesthat happen as a function of market dynamics. Thesewill be reflected in futureeditions of the Index. TheMagicBricks PropIndex will be released on aquarterly basis.
METHODOLOGY

There is a wealth of information within these pages. For better readability, we have presented somedata as tables and others as graphs. Between them, you will find how property markets haveperformed in the Apr-June quarter from many different perspectives – from a capital appreciationperspective, from a rental/yield realization perspective & from a supply of properties perspective.We recommend that you evaluate the city report in its entirety – that will provide a roundedperspective of the performance of the property market within each city. Here are details of whatyou will find in each of the city reports enclosed within-
1. City Property Index – This is a composite index which is a function of supply of properties aswell as the average capital appreciation/drop in various localities of the city in the quarter. Thecity index is the weighted average of the average rate per square feet in that locality & thesupply of properties from that locality. Premium localities (with higher average rate per squarefeet) as well as localities with higher supply of properties will have a bigger impact on theIndex.E.g. if the supply of properties from a premium locality drops, that locality will end up havinga lower weightage in the index which in turn will push the Index downwards (and vice-versa).On the other hand, supply of properties remaining unchanged, the index will be influenced bycapital appreciation within the locality.
2. Price Monitor - This reflects the capital appreciation/drop within a locality. It is calculatedbasis a movement in the “average rate per square feet” within that locality. By and large, the movement in the “average rate per square feet” reflects capitalappreciation/drops. However, in a few selected cases, we have observed that the average rate persquare feet moves due to a change in mix of apartments within that locality (e.g. if the ratio ofpremium apartments, which command a higher per square feet rate, changes over the quarter).In these few circumstances, the Price Monitor will in turn depict reflect this input. Suchchanges have been explained in the text of the City reports.
3. Rent Monitor - This reflects the rental appreciation/drop within a locality. It is calculatedbasis a movement in the “average rent per square feet” within that locality. By and large, the movement in the “average rent per square feet” reflects rentalappreciation/drops. However, in a few selected cases, we have observed that the average rentper square feet moves due to a change in mix of apartments within that locality (e.g. if the ratioof premium apartments, which command a higher per square feet rent, changes over thequarter). In these few circumstances, the Rent Monitor will in turn depict reflect this input.Such changes have been explained in the text of the City reports.
4. Yield Meter – Yield is the annual rate of return earned on property. Yield meter depicts thegross yield percentages across the various localities. Gross yield is a ratio of average annualrental value to the average capital value of the property.
5. Capital Value Tables (given in Annexures) - This shows the actual range of Prices withinwhich properties were available in each locality. Prices are shown in rupees per square feetbasis; these are the prevailing rates for properties in each locality.
GLOSSARY & DEFINITIONS

Contact usThis is the excerpt of full PropIndex report. Limited copies of full report are availablefor Sale!!To place an order, please send a DD/Cheque, payable at Delhi, for Rs 5000/- in favourof “Times Business Solutions Ltd”. Cheques may be couriered to Raghavan Krishnan,MagicBricks FC-6 Ground Floor Film City Noida 201 301. For enquiries, send email [email protected] or Call :+91-9971-00-5775