Indepth Annual Report April 2016 - Term Life Insurance ...
31
` ` `` ` ` ` ` ` ` ` ` ` ` ` ` ` ` ` ` ` ` ` ` ANNUAL INVESTMENT REPORT 2015-16
Transcript of Indepth Annual Report April 2016 - Term Life Insurance ...
`
`
``
`
`
`
``
`
`
`
`
`
`
`
`
`
`` `
`
`
`
ANNUAL INVESTMENT REPORT2015-16

Annual Investment Report 2015-16
Annual Investment Report 2015-16
Figures as of 31st March 20161/31
World economy continued to dabble with weak growth and dwindling inflation. Global markets were sluggish with US returning to normalcy with a rate hike, commodity/oil prices falling and strengthening of Dollar. Asset classes across the board witnessed volatile movements during the year with uncertainty rising from the Chinese slowdown amidst transition from an investment led economy to one driven by consumption and US unwinding of quantitative measures. The Chinese currency devaluation has also created some panic with both global as well as local investors.
The Indian economy bucked the trend in FY16 when most of the emerging market economies witnessed significant external vulnerabilities owing to positive external balance and a stable public policy. However, the rising NPAs in the banking system and strong headwinds in the global economy did have an impact on the Indian capital markets.
Equity market witnessed extreme volatility during the year and finally ended the year with a point to point of decline of around 9%. Subdued earnings and slow pace of reforms were important domestic reasons for lackluster market. Earnings of Nifty50 companies during FY16 are expected to be less than 2% higher than FY15 earnings. Investors became increasingly wary of capex recovery and reform progress by the government. Foreign Portfolio Investors sold US$2.2 bn worth of equities while Domestic Institutional Investors made huge investments, with US$12.3 bn of net inflows.
The Fixed Income market on the other hand has witnessed a reduction of 75 bps in its benchmark rates by the Reserve Bank of India during FY16. These rate cuts were accompanied by softening headline inflation along, and at times undershooting, the guided glide path by the RBI
backed by falling oil/commodity prices. But paradoxically, despite falling inflation, declining growth and gradual rate cuts the long bond yield defies the basic bond fundamental and remained stubborn till the fag-end of financial year. The reason was tight liquidity condition maintained by the RBI, which was effective on bond yield but was inexplicable to the market. However as the RBI moved to somewhat neutral liquidity mode in its last policy the short end of the yield curve reacted positively and the curve became steep signifying market’s confidence in stable inflation in the short to medium term and economic growth emerging in the longer run.
Under such circumstances, the Investment Department adopted dynamic investment strategy across different funds on the basis of respective risk mandates. As a risk mitigation measure,the Board appointed Investment Committee, closely monitored the strategies and policies adopted by the Investment Department during the year. Besides, an external concurrent auditor vouched the investment functions on a daily basis. There were also two other internal working committees (namely Risk and Capital Committee and Investment Operation Review Committee) that monitored and mitigated the financial and operational risk aspects of Investment function on a continuous basis.
Saibal GhoshChief investment Officer

Fund ManagersFixed Income and Hybrid Funds
Equity
Mr. Jyoti Prakash
CFA-1993 PGDRM (IRMA)
30 years
Qualification :
Experience :
Mr. Imran Sayed
Awarded CFA charter by CFA Institute – 2006 FRM - 2005
15 years
Qualification :
Experience :
2/31Figures as of 31st March 2016
Annual Investment Report 2015-16
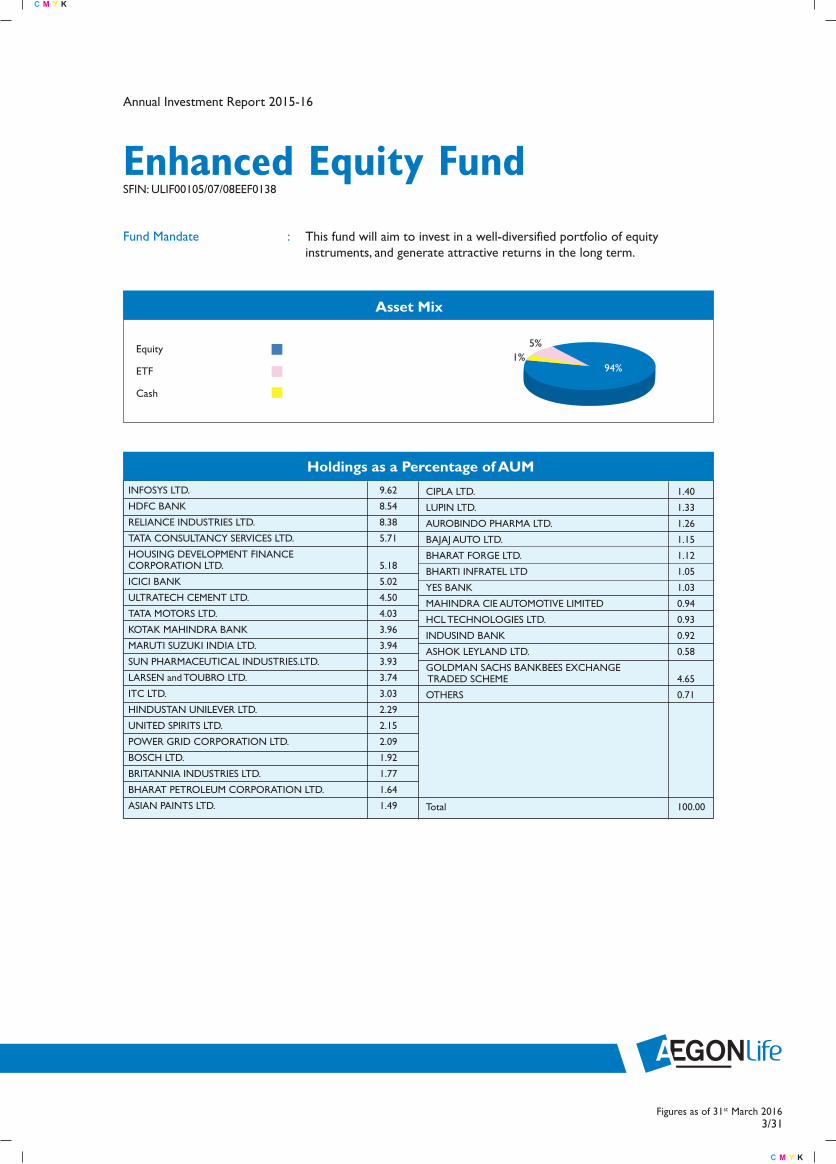
Enhanced Equity Fund SFIN: ULIF00105/07/08EEF0138
This fund will aim to invest in a well-diversified portfolio of equityinstruments, and generate attractive returns in the long term.
Fund Mandate :
Asset Mix
94%
5%
CIPLA LTD. 1.40
LUPIN LTD. 1.33
AUROBINDO PHARMA LTD. 1.26
BAJAJ AUTO LTD. 1.15
BHARAT FORGE LTD. 1.12
BHARTI INFRATEL LTD 1.05
YES BANK 1.03
MAHINDRA CIE AUTOMOTIVE LIMITED 0.94
HCL TECHNOLOGIES LTD. 0.93
INDUSIND BANK 0.92
ASHOK LEYLAND LTD. 0.58
GOLDMAN SACHS BANKBEES EXCHANGE TRADED SCHEME 4.65
OTHERS 0.71
Total 100.00
3/31Figures as of 31st March 2016
Holdings as a Percentage of AUM
INFOSYS LTD. 9.62
HDFC BANK 8.54
RELIANCE INDUSTRIES LTD. 8.38
TATA CONSULTANCY SERVICES LTD. 5.71
HOUSING DEVELOPMENT FINANCE CORPORATION LTD. 5.18
ICICI BANK 5.02
ULTRATECH CEMENT LTD. 4.50
TATA MOTORS LTD. 4.03
KOTAK MAHINDRA BANK 3.96
MARUTI SUZUKI INDIA LTD. 3.94
SUN PHARMACEUTICAL INDUSTRIES.LTD. 3.93
LARSEN and TOUBRO LTD. 3.74
ITC LTD. 3.03
HINDUSTAN UNILEVER LTD. 2.29
UNITED SPIRITS LTD. 2.15
POWER GRID CORPORATION LTD. 2.09
BOSCH LTD. 1.92
BRITANNIA INDUSTRIES LTD. 1.77
BHARAT PETROLEUM CORPORATION LTD. 1.64
ASIAN PAINTS LTD. 1.49
Equity
ETF
Cash
Annual Investment Report 2015-16
1%

0.00 10.00 20.00 30.00
Industry Distribution
FINANCIALS
ENERGY
CONSUMER STAPLES
IT
CONSUMER DISCRETIONARY
INDUSTRIALS
MATERIALS
UTILITIES
TELECOM
OTHERS
HEALTH CARE
Fund
Nifty
-5.63% 36.08% 19.30%
-8.86% 26.65% 17.98%
1 Year
Returns (CAGR)
Industry Distribution %
FINANCIALS 24.65
ENERGY 10.02
CONSUMER STAPLES 9.23
IT 16.26
CONSUMER DISCRETIONARY 14.59
INDUSTRIALS 4.32
MATERIALS 4.50
HEALTH CARE 7.92
UTILITIES 2.09
TELECOM 1.05
OTHERS 5.36
4/31Figures as of 31st March 2016
Annual Investment Report 2015-16
Enhanced Equity Fund SFIN: ULIF00105/07/08EEF0138
This fund will aim to invest in a well-diversified portfolio of equityinstruments, and generate attractive returns in the long term.
Fund Mandate :
2 Year 3Year 4Year 5Year
6.87%
7.31%
-6.23%
-9.23%
Since Inception
10.40%
7.51%

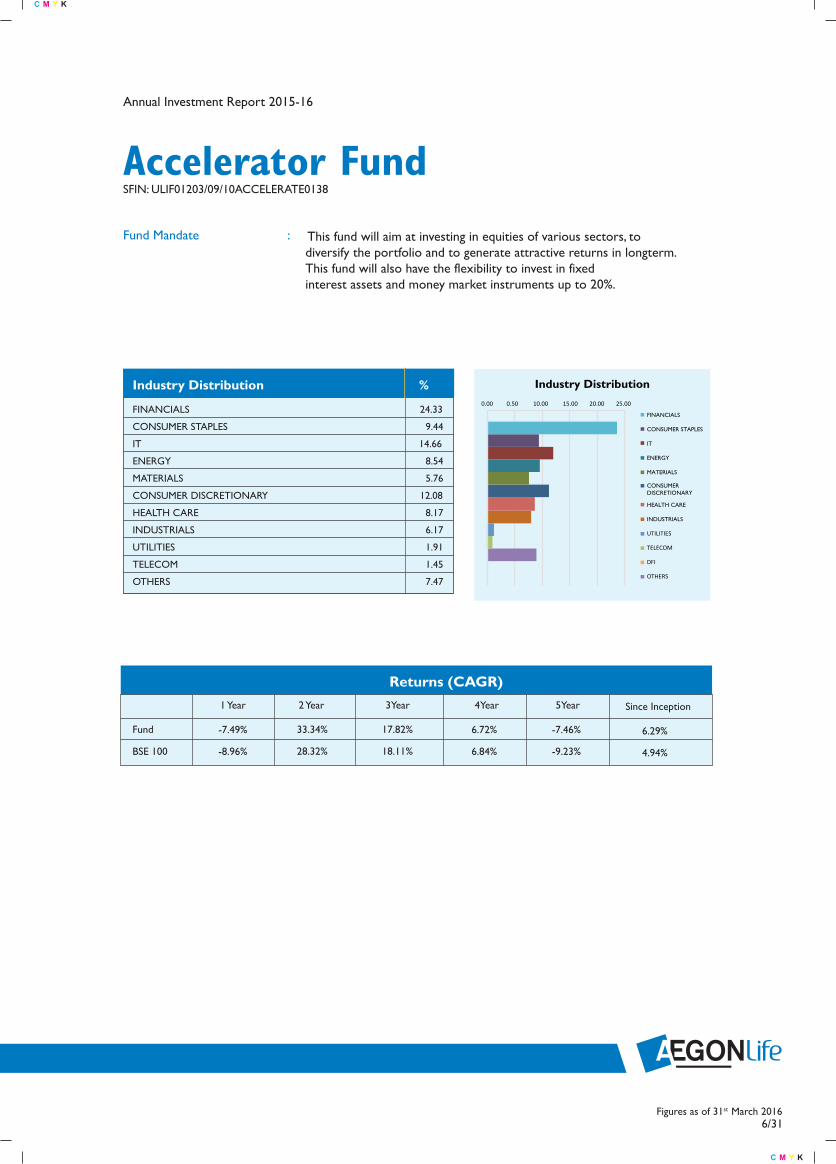
Accelerator Fund SFIN: ULIF01203/09/10ACCELERATE0138
This fund will aim at investing in equities of various sectors, todiversify the portfolio and to generate attractive returns in longterm.This fund will also have the flexibility to invest in fixedinterest assets and money market instruments up to 20%.
Fund Mandate :
BHARAT PETROLEUM CORPORATION LTD. 0.93
ASIAN PAINTS LTD. 0.93
DIVI LABORATORIES LTD. 0.91
HINDUSTAN PETROLEUM CORP. LTD. 0.83
LUPIN LTD. 0.83
MAHINDRA CIE AUTOMOTIVE LIMITED 0.81
TATA CHEMICALS LTD. 0.80
BAJAJ AUTO LTD. 0.73
NTPC LTD. 0.73
CONTAINER CORPORATION OF INDIA LTD. 0.72
CUMMINS INDIA LTD. 0.69
ASHOK LEYLAND LTD. 0.66
BHARAT FORGE LTD. 0.53
MUNDRA PORT AND SPECIAL ECONOMIC
ZONE LTD. 0.52
VOLTAS LTD. 0.52
ZEE ENTERTAINMENT ENTERPRISES LTD. 0.50
PIDILITE INDUSTRIES LTD. 0.49
INDUSIND BANK 0.42
UNITED BREWERIES LIMITED 0.32
GOLDMAN SACHS BANKBEES EXCHANGE TRADED SCHEME 4.57
OTHERS 2.59
Total 100.00
5/31Figures as of 31st March 2016
Holdings as a Percentage of AUM
INFOSYS LTD. 9.30
HDFC BANK 6.99
RELIANCE INDUSTRIES LTD. 6.77
HOUSING DEVELOPMENT FINANCE CORPORATION LTD. 6.00
ICICI BANK 4.78
ITC LTD. 4.46
SUN PHARMACEUTICAL INDUSTRIES.LTD. 3.58
TATA MOTORS LTD. 3.41
MARUTI SUZUKI INDIA LTD. 3.39
TATA CONSULTANCY SERVICES LTD. 3.34
LARSEN and TOUBRO LTD. 3.07
GRASIM INDUSTRIES LTD. 2.50
STATE BANK OF INDIA 2.38
AXIS BANK 2.30
UNITED SPIRITS LTD. 2.17
HCL TECHNOLOGIES LTD. 2.03
ULTRATECH CEMENT LTD. 1.97
BOSCH LTD. 1.77
AUROBINDO PHARMA LTD. 1.68
KOTAK MAHINDRA BANK 1.45
BHARTI INFRATEL LTD 1.45
HINDUSTAN UNILEVER LTD. 1.42
BRITANNIA INDUSTRIES LTD. 1.40
CIPLA LTD. 1.18
POWER GRID CORPORATION LTD. 1.17
Asset Mix
93%3%
Equity
ETF
Cash & Cash Equivalents
4%
Annual Investment Report 2015-16
6/31Figures as of 31st March 2016
0.00 0.50 10.00 15.00 20.00 25.00
Industry Distribution
FINANCIALS
CONSUMER STAPLES
IT
ENERGY
MATERIALS
HEALTH CARE
INDUSTRIALS
UTILITIES
TELECOM
DFI
OTHERS
CONSUMER DISCRETIONARY
FINANCIALS 24.33
CONSUMER STAPLES 9.44
IT 14.66
ENERGY 8.54
MATERIALS 5.76
CONSUMER DISCRETIONARY 12.08
HEALTH CARE 8.17
INDUSTRIALS 6.17
UTILITIES 1.91
TELECOM 1.45
OTHERS 7.47
Industry Distribution %
Annual Investment Report 2015-16
Accelerator Fund SFIN: ULIF01203/09/10ACCELERATE0138
This fund will aim at investing in equities of various sectors, todiversify the portfolio and to generate attractive returns in longterm.This fund will also have the flexibility to invest in fixedinterest assets and money market instruments up to 20%.
Fund Mandate :
Fund
BSE 100
-7.49% 33.34% 17.82%
-8.96% 28.32% 18.11%
1 Year
Returns (CAGR) 2 Year 3Year 4Year 5Year
6.72%
6.84%
-7.46%
-9.23%
Since Inception
6.29%
4.94%
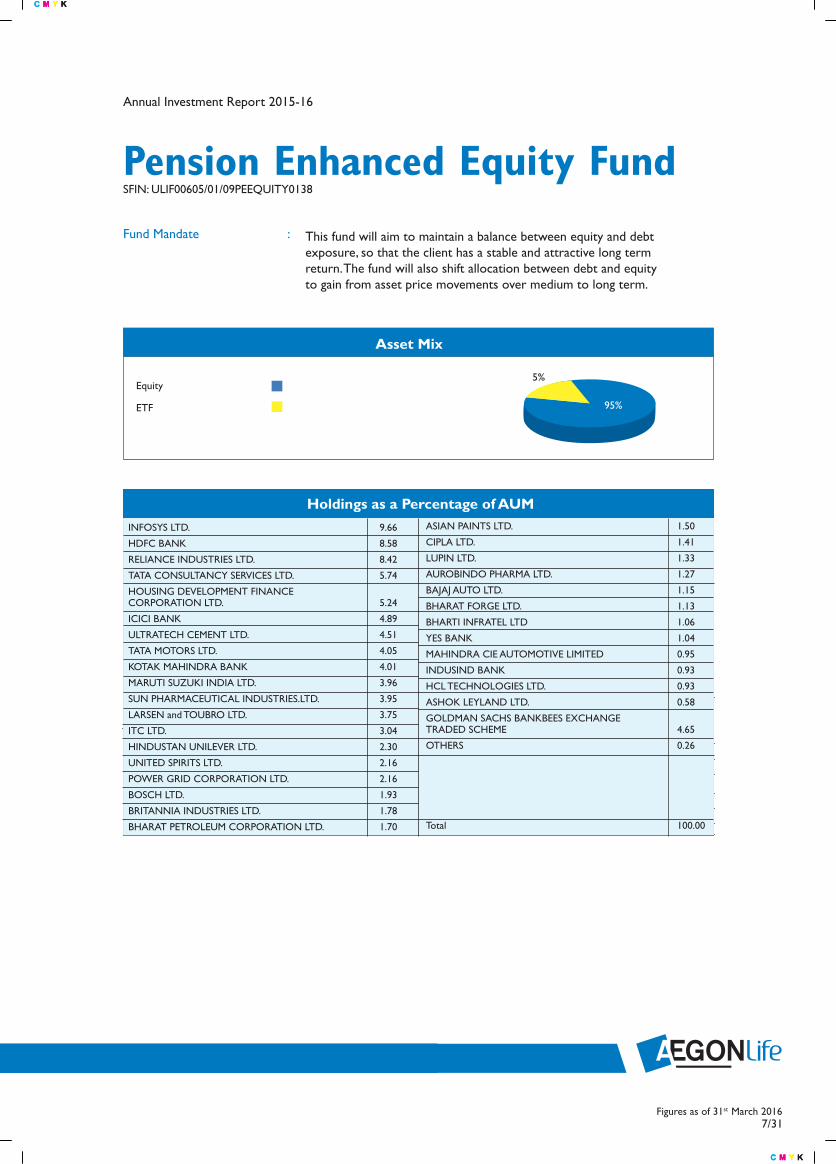
Pension Enhanced Equity FundSFIN: ULIF00605/01/09PEEQUITY0138
This fund will aim to maintain a balance between equity and debtexposure, so that the client has a stable and attractive long termreturn. The fund will also shift allocation between debt and equityto gain from asset price movements over medium to long term.
Fund Mandate :
Asset Mix
7/31Figures as of 31st March 2016
Holdings as a Percentage of AUM
Asset Mix
Holdings as a Percentage of AUMASIAN PAINTS LTD. 1.50
CIPLA LTD. 1.41
LUPIN LTD. 1.33
AUROBINDO PHARMA LTD. 1.27
BAJAJ AUTO LTD. 1.15
BHARAT FORGE LTD. 1.13
BHARTI INFRATEL LTD 1.06
YES BANK 1.04
MAHINDRA CIE AUTOMOTIVE LIMITED 0.95
INDUSIND BANK 0.93
HCL TECHNOLOGIES LTD. 0.93
ASHOK LEYLAND LTD. 0.58
GOLDMAN SACHS BANKBEES EXCHANGE TRADED SCHEME 4.65
OTHERS 0.26
Total 100.00
Holdings as a Percentage of AUM
INFOSYS LTD. 9.66
HDFC BANK 8.58
RELIANCE INDUSTRIES LTD. 8.42
TATA CONSULTANCY SERVICES LTD. 5.74
HOUSING DEVELOPMENT FINANCE CORPORATION LTD. 5.24
ICICI BANK 4.89
ULTRATECH CEMENT LTD. 4.51
TATA MOTORS LTD. 4.05
KOTAK MAHINDRA BANK 4.01
MARUTI SUZUKI INDIA LTD. 3.96
SUN PHARMACEUTICAL INDUSTRIES.LTD. 3.95
LARSEN and TOUBRO LTD. 3.75
ITC LTD. 3.04
HINDUSTAN UNILEVER LTD. 2.30
UNITED SPIRITS LTD. 2.16
POWER GRID CORPORATION LTD. 2.16
BOSCH LTD. 1.93
BRITANNIA INDUSTRIES LTD. 1.78
BHARAT PETROLEUM CORPORATION LTD. 1.70
Annual Investment Report 2015-16
Asset Mix
95%
Equity
ETF
5%

Annual Investment Report 2015-16
8/31Figures as of 31st March 2016
FINANCIALS 24.68
IT 16.33
CONSUMER DISCRETIONARY 14.66
INDUSTRIALS 4.34
ENERGY 10.12
CONSUMER STAPLES 9.28
MATERIALS 4.51
HEALTH CARE 7.96
TELECOM 1.06
UTILITIES 2.16
OTHERS 4.91
Industry Distribution %
Pension Enhanced Equity FundSFIN: ULIF00605/01/09PEEQUITY0138
This fund will aim to maintain a balance between equity and debtexposure, so that the client has a stable and attractive long termreturn. The fund will also shift allocation between debt and equityto gain from asset price movements over medium to long term.
Fund Mandate :
0.00 0.50 10.00 15.00 20.00 30.0025.00
Industry Distribution
FINANCIALS
IT
CONSUMERDISCRETIONARY
MATERIALS
INDUSTRIALS
ENERGY
HEALTH CARE
DFI
TELECOM
UTILITIES
OTHERS
CONSUMER STAPLES
Fund
Nifty
-5.74% 35.92% 18.98%
-8.86% 26.65% 17.98%
1 Year
Returns (CAGR) 2 Year 3Year 4Year 5Year
6.98%
7.31%
-5.99%
-9.23%
Since Inception
18.32%
14.90%
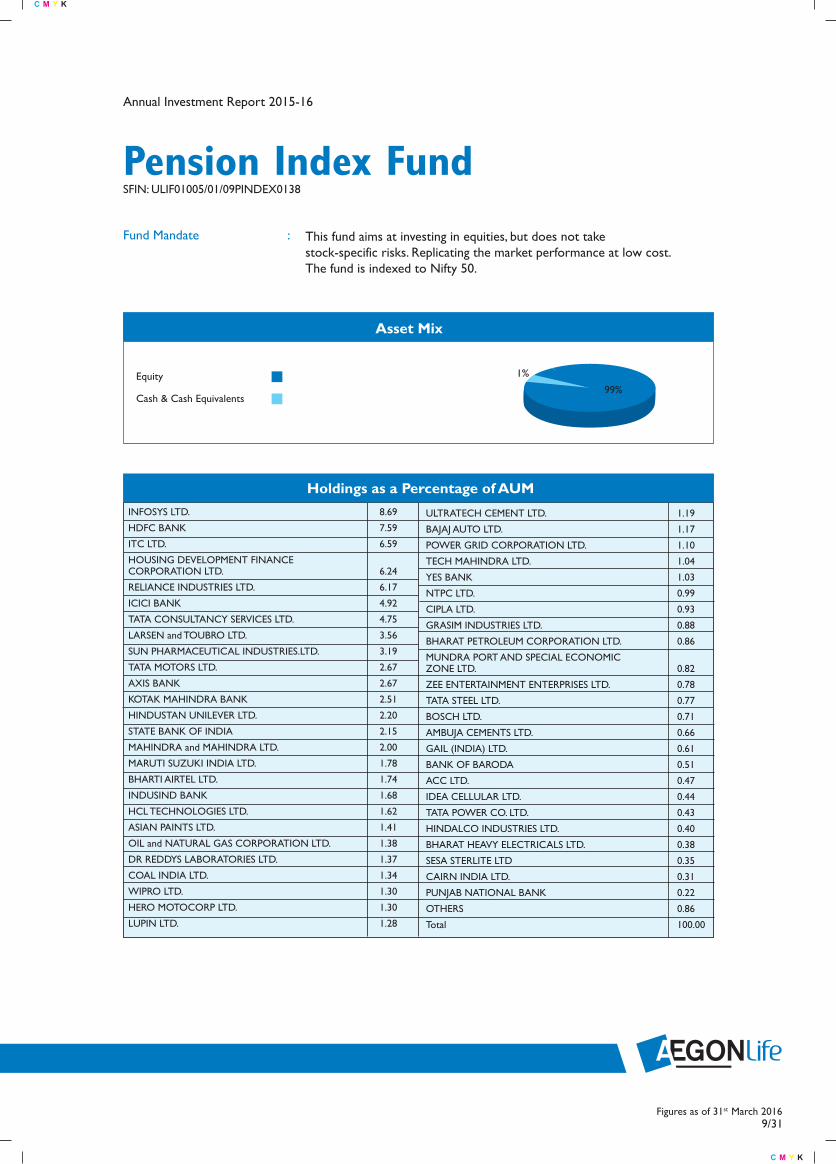
Pension Index Fund
Annual Investment Report 2015-16
SFIN: ULIF01005/01/09PINDEX0138
This fund aims at investing in equities, but does not takestock-specific risks. Replicating the market performance at low cost.The fund is indexed to Nifty 50.
Fund Mandate :
Asset Mix
99%
1%
ULTRATECH CEMENT LTD. 1.19
BAJAJ AUTO LTD. 1.17
POWER GRID CORPORATION LTD. 1.10
TECH MAHINDRA LTD. 1.04
YES BANK 1.03
NTPC LTD. 0.99
CIPLA LTD. 0.93
GRASIM INDUSTRIES LTD. 0.88
BHARAT PETROLEUM CORPORATION LTD. 0.86
MUNDRA PORT AND SPECIAL ECONOMIC ZONE LTD. 0.82
ZEE ENTERTAINMENT ENTERPRISES LTD. 0.78
TATA STEEL LTD. 0.77
BOSCH LTD. 0.71
AMBUJA CEMENTS LTD. 0.66
GAIL (INDIA) LTD. 0.61
BANK OF BARODA 0.51
ACC LTD. 0.47
IDEA CELLULAR LTD. 0.44
TATA POWER CO. LTD. 0.43
HINDALCO INDUSTRIES LTD. 0.40
BHARAT HEAVY ELECTRICALS LTD. 0.38
SESA STERLITE LTD 0.35
CAIRN INDIA LTD. 0.31
PUNJAB NATIONAL BANK 0.22
OTHERS 0.86
Total 100.00
9/31Figures as of 31st March 2016
Holdings as a Percentage of AUM
INFOSYS LTD. 8.69
HDFC BANK 7.59
ITC LTD. 6.59
HOUSING DEVELOPMENT FINANCE CORPORATION LTD. 6.24
RELIANCE INDUSTRIES LTD. 6.17
ICICI BANK 4.92
TATA CONSULTANCY SERVICES LTD. 4.75
LARSEN and TOUBRO LTD. 3.56
SUN PHARMACEUTICAL INDUSTRIES.LTD. 3.19
TATA MOTORS LTD. 2.67
AXIS BANK 2.67
KOTAK MAHINDRA BANK 2.51
HINDUSTAN UNILEVER LTD. 2.20
STATE BANK OF INDIA 2.15
MAHINDRA and MAHINDRA LTD. 2.00
MARUTI SUZUKI INDIA LTD. 1.78
BHARTI AIRTEL LTD. 1.74
INDUSIND BANK 1.68
HCL TECHNOLOGIES LTD. 1.62
ASIAN PAINTS LTD. 1.41
OIL and NATURAL GAS CORPORATION LTD. 1.38
DR REDDYS LABORATORIES LTD. 1.37
COAL INDIA LTD. 1.34
WIPRO LTD. 1.30
HERO MOTOCORP LTD. 1.30
LUPIN LTD. 1.28
Equity
Cash & Cash Equivalents

Annual Investment Report 2015-16
0.00 10.00 20.00 30.00 40.00
Industry Distribution
FINANCIALS
IT
CONSUMERDISCRETIONARY
INDUSTRIALS
MATETRIALS
HEALTHCARE
UTILITIES
TELECOM
OTHERS
ENERGY
CONSUMER STAPLES
FINANCIALS 29.51
ENERGY 10.06
IT 17.40
CONSUMER STAPLES 8.80
CONSUMER DISCRETIONARY 11.82
MATERIALS 4.73
INDUSTRIALS 4.76
HEALTH CARE 6.77
UTILITIES 3.13
TELECOM 2.18
OTHERS 0.86
Industry Distribution %
10/31Figures as of 31st March 2016
Pension Index FundSFIN: ULIF01005/01/09PINDEX0138
This fund aims at investing in equities, but does not takestock-specific risks. Replicating the market performance at low cost.The fund is indexed to Nifty 50.
Fund Mandate :
Fund
Nifty
-7.34% 27.75% 19.66%
-8.86% 26.65% 17.98%
1 Year
Returns (CAGR) 2 Year 3Year 4Year 5Year
8.99%
7.31%
-7.77%
-9.23%
Since Inception
16.83%
15.68%

Group Equity Fund
Annual Investment Report 2015-16
SFIN: ULGF00228/03/11GEQUITY0138
Fund Mandate :
Asset Mix
11/31Figures as of 31st March 2016
Holdings as a Percentage of AUM
Equity
Cash & Cash Equivalent
ETF
Asset Mix
86%
Holdings as a Percentage of AUM
This Fund will aim at investing in equities of various sectors to diversify the portfolio and to generate attractive returns in the long term. The Fund will also have the flexibility to invest in Fixed Interest Assets and Money Market instruments up to 20%.
10%
BHARAT PETROLEUM CORPORATION LTD. 1.49
ASIAN PAINTS LTD. 1.36
CIPLA LTD. 1.27
LUPIN LTD. 1.22
AUROBINDO PHARMA LTD. 1.13
BAJAJ AUTO LTD. 1.04
BHARAT FORGE LTD. 1.00
BHARTI INFRATEL LTD 0.95
YES BANK 0.93
MAHINDRA CIE AUTOMOTIVE LIMITED 0.85
HCL TECHNOLOGIES LTD. 0.85
INDUSIND BANK 0.83
ASHOK LEYLAND LTD. 0.53
GOLDMAN SACHS BANKBEES EXCHANGETRADED SCHEME 4.24
OTHERS 9.84
Total 100.00
INFOSYS LTD. 8.71
HDFC BANK 7.76
RELIANCE INDUSTRIES LTD. 7.61
TATA CONSULTANCY SERVICES LTD. 5.17
HOUSING DEVELOPMENT FINANCE CORPORATION LTD. 4.74
ICICI BANK 4.54
ULTRATECH CEMENT LTD. 4.12
TATA MOTORS LTD. 3.66
KOTAK MAHINDRA BANK 3.63
MARUTI SUZUKI INDIA LTD. 3.57
SUN PHARMACEUTICAL INDUSTRIES.LTD. 3.56
LARSEN and TOUBRO LTD. 3.37
ITC LTD. 2.75
HINDUSTAN UNILEVER LTD. 2.07
UNITED SPIRITS LTD. 1.96
POWER GRID CORPORATION LTD. 1.90
BOSCH LTD. 1.73
BRITANNIA INDUSTRIES LTD. 1.61
4%

0.00 0.50 10.00 15.00 20.00 25.00
Industry Distribution
FINANCIALS
ENERGY
CONSUMER STAPLES
INDUSTRIALS
MATETRIALS
HEALTHCARE
UTILITIES
TELECOM
OTHERS
IT
CONSUMER DISCRETIONARY
FINANCIALS 22.43
ENERGY 9.10
CONSUMER STAPLES 8.38
IT 14.74
CONSUMER DISCRETIONARY 13.21
INDUSTRIALS 3.90
MATERIALS 4.12
HEALTH CARE 7.18
UTILITIES 1.90
TELECOM 0.95
OTHERS 14.08
Industry Distribution %
12/31Figures as of 31st March 2016
Annual Investment Report 2015-16
Group Equity FundSFIN: ULGF00228/03/11GEQUITY0138
Fund Mandate :
Asset Mix
This Fund will aim at investing in equities of various sectors to diversify the portfolio and to generate attractive returns in the long term. The Fund will also have the flexibility to invest in Fixed Interest Assets and Money Market instruments up to 20%.
Fund
Nifty
-5.72% 36.38% 19.38%
-8.86% 26.65% 17.98%
1 Year
Returns (CAGR) 2 Year 3Year 4Year 5Year
7.59%
7.31%
-5.38%
-9.23%
Since Inception
9.43%
6.33%

BlueChip Fund
Annual Investment Report 2015-16
ULIF01511/02/14BLUECHIPEQ0138
Fund Mandate :
Asset Mix
13/31Figures as of 31st March 2016
Holdings as a Percentage of AUM
BHARAT PETROLEUM CORPORATION LTD. 1.30
ASIAN PAINTS LTD. 1.18
CIPLA LTD. 1.11
LUPIN LTD. 1.05
AUROBINDO PHARMA LTD. 1.00
BAJAJ AUTO LTD. 0.91
BHARAT FORGE LTD. 0.89
BHARTI INFRATEL LTD 0.84
YES BANK 0.82
MAHINDRA CIE AUTOMOTIVE LIMITED 0.75
HCL TECHNOLOGIES LTD. 0.74
INDUSIND BANK 0.73
ASHOK LEYLAND LTD. 0.46
GOLDMAN SACHS BANKBEES EXCHANGETRADED SCHEME 3.36
OTHERS 21.59
Total 100.00
INFOSYS LTD. 7.63
HDFC BANK 6.77
RELIANCE INDUSTRIES LTD. 6.65
TATA CONSULTANCY SERVICES LTD. 4.53
HOUSING DEVELOPMENT FINANCE CORPORATION LTD. 4.10
ICICI BANK 3.98
ULTRATECH CEMENT LTD. 3.57
TATA MOTORS LTD. 3.19
KOTAK MAHINDRA BANK 3.14
MARUTI SUZUKI INDIA LTD. 3.13
SUN PHARMACEUTICAL INDUSTRIES.LTD. 3.12
LARSEN and TOUBRO LTD. 2.96
ITC LTD. 2.40
HINDUSTAN UNILEVER LTD. 1.81
UNITED SPIRITS LTD. 1.71
POWER GRID CORPORATION LTD. 1.66
BOSCH LTD. 1.51
BRITANNIA INDUSTRIES LTD. 1.40
The Fund objective is to provide long-term capital appreciation by investing in a diversified equity portfolio consists of predominantly large cap companies with strong financials, quality management and market leadership. Equity: 80% - 100% Money Market & Cash equivalent: 0% - 20%
Equity
Cash & Cash Equivalent
ETF
75%
22%3%

0.00 0.50 10.00 15.00 20.00 25.00
Industry Distribution
FINANCIALS
ENERGY
CONSUMERDISCRETIONARY
INDUSTRIALS
MATETRIALS
HEALTHCARE
UTILITIES
TELECOM
IT
CONSUMER STAPLES
BlueChip FundULIF01511/02/14BLUECHIPEQ0138
Fund Mandate : The Fund objective is to provide long-term capital appreciation by investing in a diversified equity portfolio consists of predominantly large cap companies with strong financials, quality management and market leadership. Equity: 80% - 100% Money Market & Cash equivalent: 0% - 20%
FINANCIALS 19.55
ENERGY 7.95
IT 12.90
CONSUMER STAPLES 7.32
CONSUMER DISCRETIONARY 11.56
MATERIALS 3.57
INDUSTRIALS 3.43
HEALTH CARE 6.28
UTILITIES 1.66
TELECOM 0.84
OTHERS 24.95
Industry Distribution %
14/31Figures as of 31st March 2016
OTHERS
Annual Investment Report 2015-16
Fund
Nifty
-5.53% NA NA
-8.86% NA NA
1 Year
Returns (CAGR) 2 Year 3Year 4Year 5Year
NA
NA
NA
NA
Since Inception
-1.00%
-5.00%
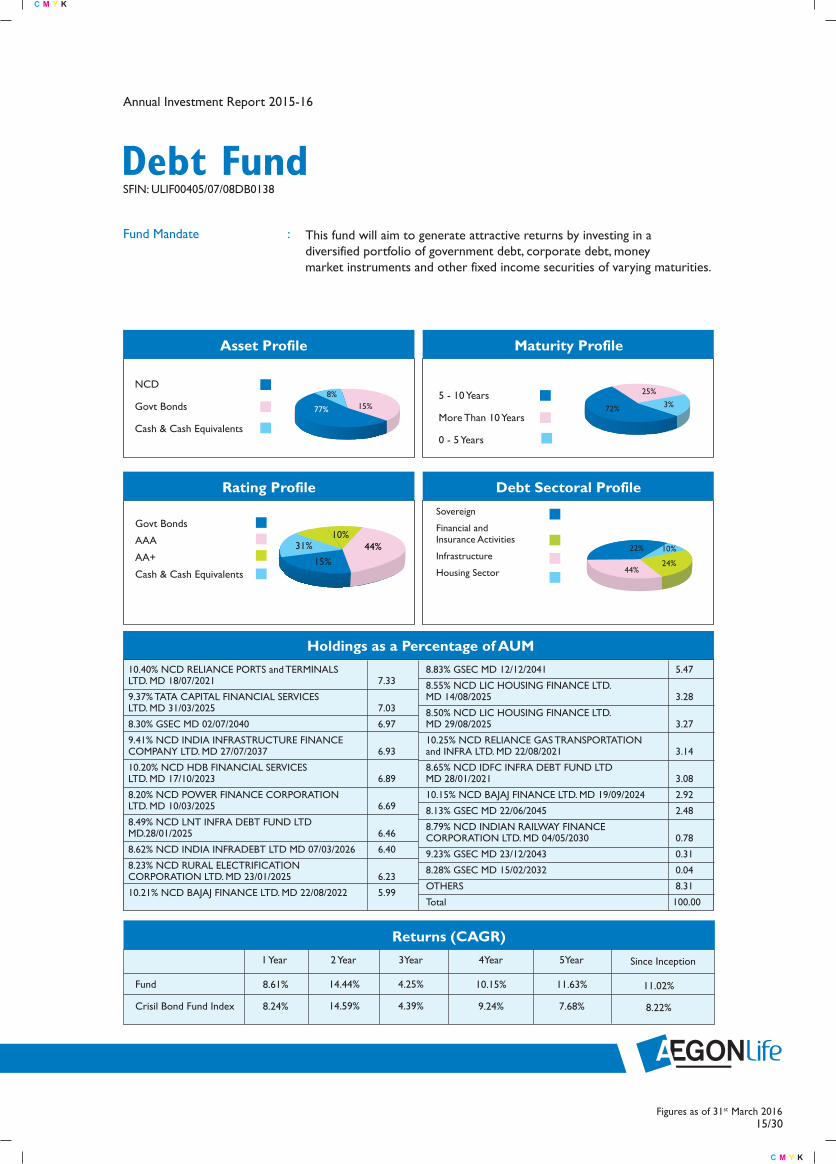
Holdings as a Percentage of AUM10.40% NCD RELIANCE PORTS and TERMINALS LTD. MD 18/07/2021 7.33
9.37% TATA CAPITAL FINANCIAL SERVICES LTD. MD 31/03/2025 7.03
8.30% GSEC MD 02/07/2040 6.97
9.41% NCD INDIA INFRASTRUCTURE FINANCE COMPANY LTD. MD 27/07/2037 6.93
10.20% NCD HDB FINANCIAL SERVICES LTD. MD 17/10/2023 6.89
8.20% NCD POWER FINANCE CORPORATION LTD. MD 10/03/2025 6.69
8.49% NCD LNT INFRA DEBT FUND LTD MD.28/01/2025 6.46
8.62% NCD INDIA INFRADEBT LTD MD 07/03/2026 6.40
8.23% NCD RURAL ELECTRIFICATION CORPORATION LTD. MD 23/01/2025 6.23
10.21% NCD BAJAJ FINANCE LTD. MD 22/08/2022 5.99
Debt Fund
Annual Investment Report 2015-16
Sovereign
Financial and Insurance Activities
Infrastructure
Housing Sector
NCD
Govt Bonds
Cash & Cash Equivalents
5 - 10 Years
More Than 10 Years
0 - 5 Years
24%
25%
72%
44%15%
10%Govt Bonds
AAA
AA+
Cash & Cash Equivalents
Debt Sectoral ProfileRating Profile
Maturity Profile
SFIN: ULIF00405/07/08DB0138
This fund will aim to generate attractive returns by investing in adiversified portfolio of government debt, corporate debt, moneymarket instruments and other fixed income securities of varying maturities.
Fund Mandate :
Asset Profile
77% 15%8%
31%
15/30Figures as of 31st March 2016
44%
22% 10%
3%
8.83% GSEC MD 12/12/2041 5.47
8.55% NCD LIC HOUSING FINANCE LTD. MD 14/08/2025 3.28
8.50% NCD LIC HOUSING FINANCE LTD. MD 29/08/2025 3.27
10.25% NCD RELIANCE GAS TRANSPORTATION and INFRA LTD. MD 22/08/2021 3.14
8.65% NCD IDFC INFRA DEBT FUND LTD MD 28/01/2021 3.08
10.15% NCD BAJAJ FINANCE LTD. MD 19/09/2024 2.92
8.13% GSEC MD 22/06/2045 2.48
8.79% NCD INDIAN RAILWAY FINANCE CORPORATION LTD. MD 04/05/2030 0.78
9.23% GSEC MD 23/12/2043 0.31
8.28% GSEC MD 15/02/2032 0.04
OTHERS 8.31
Total 100.00
Fund
Crisil Bond Fund Index
8.61% 14.44% 4.25%
8.24% 14.59% 4.39%
1 Year
Returns (CAGR) 2 Year 3Year 4Year 5Year
10.15%
9.24%
11.63%
7.68%
Since Inception
11.02%
8.22%
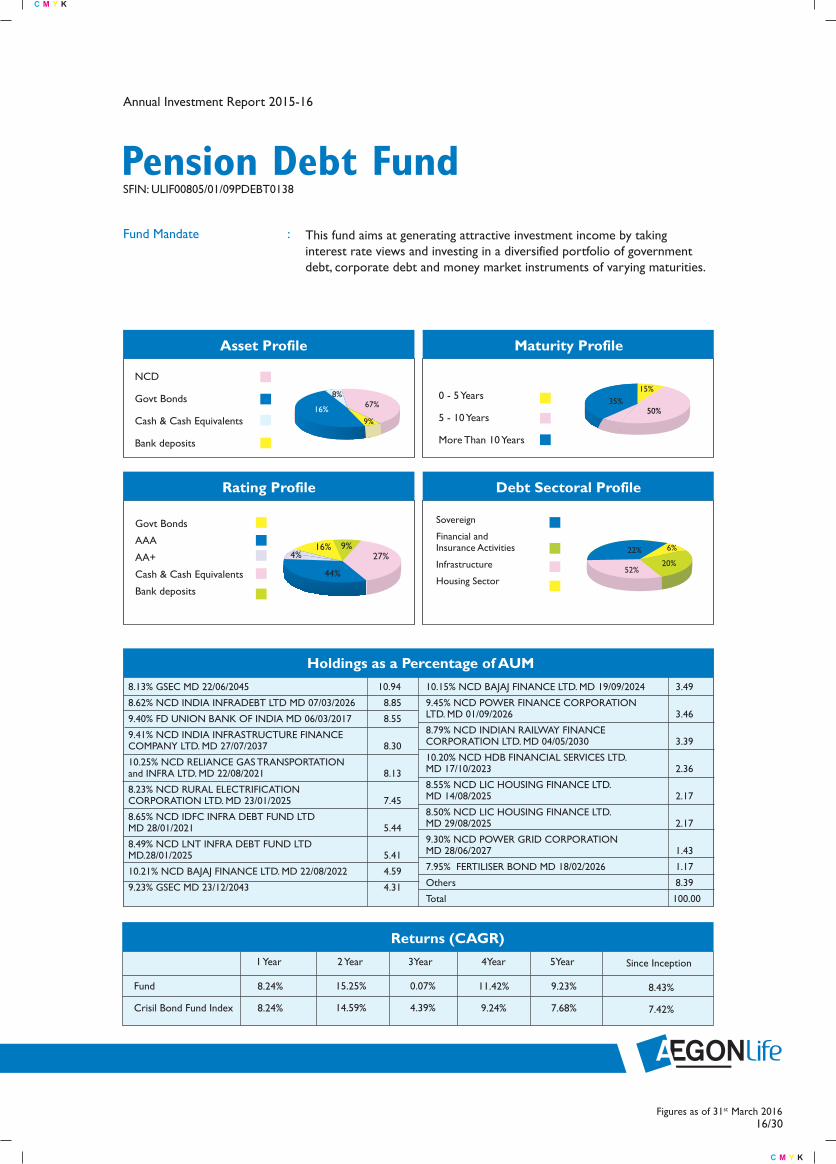
Pension Debt FundSFIN: ULIF00805/01/09PDEBT0138
This fund aims at generating attractive investment income by takinginterest rate views and investing in a diversified portfolio of government debt, corporate debt and money market instruments of varying maturities.
Fund Mandate :
Sovereign
Financial and Insurance Activities
Infrastructure
Housing Sector
NCD
Govt Bonds
Cash & Cash Equivalents
Bank deposits
0 - 5 Years
5 - 10 Years
More Than 10 Years
52%20%
73% 27%
44%
16% 9%
Govt Bonds
AAA
AA+
Cash & Cash Equivalents
Bank deposits
Debt Sectoral ProfileRating Profile
Maturity ProfileAsset Profile
16%
8%67%
9%50%
35%15%
4%
Figures as of 31st March 201616/30
Annual Investment Report 2015-16
22%
Holdings as a Percentage of AUM8.13% GSEC MD 22/06/2045 10.94
8.62% NCD INDIA INFRADEBT LTD MD 07/03/2026 8.85
9.40% FD UNION BANK OF INDIA MD 06/03/2017 8.55
9.41% NCD INDIA INFRASTRUCTURE FINANCE COMPANY LTD. MD 27/07/2037 8.30
10.25% NCD RELIANCE GAS TRANSPORTATION and INFRA LTD. MD 22/08/2021 8.13
8.23% NCD RURAL ELECTRIFICATION CORPORATION LTD. MD 23/01/2025 7.45
8.65% NCD IDFC INFRA DEBT FUND LTD MD 28/01/2021 5.44
8.49% NCD LNT INFRA DEBT FUND LTD MD.28/01/2025 5.41
10.21% NCD BAJAJ FINANCE LTD. MD 22/08/2022 4.59
9.23% GSEC MD 23/12/2043 4.31
10.15% NCD BAJAJ FINANCE LTD. MD 19/09/2024 3.49
9.45% NCD POWER FINANCE CORPORATION LTD. MD 01/09/2026 3.46
8.79% NCD INDIAN RAILWAY FINANCE CORPORATION LTD. MD 04/05/2030 3.39
10.20% NCD HDB FINANCIAL SERVICES LTD. MD 17/10/2023 2.36
8.55% NCD LIC HOUSING FINANCE LTD. MD 14/08/2025 2.17
8.50% NCD LIC HOUSING FINANCE LTD. MD 29/08/2025 2.17
9.30% NCD POWER GRID CORPORATION MD 28/06/2027 1.43
7.95% FERTILISER BOND MD 18/02/2026 1.17
Others 8.39
Total 100.00
27%6%16%
Fund
Crisil Bond Fund Index
8.24% 15.25% 0.07%
8.24% 14.59% 4.39%
1 Year
Returns (CAGR) 2 Year 3Year 4Year 5Year
11.42%
9.24%
9.23%
7.68%
Since Inception
8.43%
7.42%

Balanced Fund
Top 10 Equity Holdings as a Percentage of AUM
1.00 2.00 3.00 4.00 5.00 6.000.00
Equity Industry Distribution
Equity
Debt
Cash & Cash Equivalents
Govt Bonds
NCD
Bank deposits
Cash & Cash Equivalents
Debt Asset Profile
SFIN: ULIF00205/07/08BF0138
This fund will aim to maintain a balance between equity and debt Exposure so as to generate stable and attractive long term returns.
Fund Mandate :
Asset Profile
79%
2% 4%
15%73% 27%
32%3%
65%
5.00 10.00 15.00 20.00 25.000.00
Figures as of 31st March 201620/31
Annual Investment Report 2015-16
FINANCIALS 19.40ENERGY 6.60IT CONSUMER STAPLES 5.80CONSUMER DISCRETIONARY MATERIALS INDUSTRIALS HEALTH CARE 4.46UTILITIES TELECOM
INFOSYS LTD. 5.73HDFC BANK 5.00ITC LTD. HOUSING DEVELOPMENT FINANCE CORPORATION LTD. 4.11RELIANCE INDUSTRIES LTD. ICICI BANK 3.24TATA CONSULTANCY SERVICES LTD. LARSEN and TOUBRO LTD.
SUN PHARMACEUTICAL INDUSTRIES.LTD. AXIS BANK 1.75
3.052.342.10
4.06
4.34
11.38
1.432.01
3.10
3.08
7.67

Debt Sectoral Profile
Sovereign
86%
3%11%
Financial & Insurance Activities
Infrastucture
Details of debt portfolio holdings9.23% GSEC MD 23/12/2043 12.55
8.28% GSEC MD 15/02/2032 6.40
8.83% GSEC MD 12/12/2041 3.27
7.95% FERTILISER BOND MD 18/02/2026 3.11
10.21% NCD BAJAJ FINANCE LTD. MD 22/08/2022 1.88
9.40% FD UNION BANK OF INDIA MD 06/03/2017 1.17
10.20% NCD HDB FINANCIAL SERVICES LTD. MD 17/10/2023 1.10
10.15% NCD BAJAJ FINANCE LTD. MD 19/09/2024 1.09
8.97% GSEC MD 05/12/2030 0.65
8.79% NCD INDIAN RAILWAY FINANCE CORPORATION LTD. MD 04/05/2030 0.53
11.00% NCD POWER FINANCE CORPORATION LTD. MD 15/09/2018 0.27
12.30% GSEC MD 02/07/2016 0.01
Total 32.02
Figures as of 31st March 201621/31
Annual Investment Report 2015-16
Balanced FundSFIN: ULIF00205/07/08BF0138
This fund will aim to maintain a balance between equity and debt Exposure so as to generate stable and attractive long term returns.
Fund Mandate :
Fund
Crisil Balanced Fund Index*
-2.19% 23.13% 13.10%
-2.90% 22.53% 13.40%
1 Year
Returns (CAGR) 2 Year 3Year 4Year 5Year
8.90%
8.18%
-1.57%
-3.17%
Since Inception
9.15%
7.84%
* Due to Crisil Balanced Fund Index, calculations are revealing some enormous figure, hence applied logical conclusion by taking 65% Equity return and 35% Debt fund return to arrive at Balance fund benchmark returns for since inception.

Pension Balanced Fund
Top 10 Equity Holdings as a Percentage of AUM
0.50 1.00 2.00 2.501.50 3.00 3.50 4.00 4.50 5.000.00
Equity Industry Distribution
5.00 10.00 15.00 20.00 25.000.00
Equity
Debt
Cash & Cash Equivalents
Govt Bonds
Bank deposits
Cash & Cash Equivalents
Debt Asset Profile
SFIN: ULIF00105/07/08EEF0138
This fund will aim to protect the capital value of the fund and provide attractivereturns to the policyholder in the long run.
Fund Mandate :
Asset Profile
73% 27%
33%7%
60% 70%
6%
24%
INFOSYS LTD. 5.31HDFC BANK 4.59ITC LTD. HOUSING DEVELOPMENT FINANCE CORPORATION LTD. 3.80RELIANCE INDUSTRIES LTD. ICICI BANK 2.99TATA CONSULTANCY SERVICES LTD. LARSEN and TOUBRO LTD. SUN PHARMACEUTICAL INDUSTRIES.LTD. AXIS BANK 1.63
FINANCIALS 17.95ENERGY 6.13IT 10.52CONSUMER STAPLES 5.36CONSUMER DISCRETIONARY 7.20MATERIALS 2.91INDUSTRIALS 2.90UTILITIES 1.89HEALTH CARE 4.17TELECOM 1.33
Figures as of 31st March 201622/31
Annual Investment Report 2015-16
5.50
4.01
3.76
2.802.17
1.95

75% 25%
Debt Sectoral Profile
Sovereign
Financial & Insurance Activities
Details of debt portfolio holdings8.28% GSEC MD 15/02/2032 11.98
9.40% FD UNION BANK OF INDIA MD 06/03/2017 8.31
8.83% GSEC MD 12/12/2041 6.82
7.95% FERTILISER BOND MD 18/02/2026 2.98
9.23% GSEC MD 23/12/2043 2.48
8.97% GSEC MD 05/12/2030 0.22
Total 32.80
SFIN: ULIF00105/07/08EEF0138
This fund will aim to protect the capital value of the fund and provide attractivereturns to the policyholder in the long run.
Fund Mandate :
Pension Balanced Fund
Annual Investment Report 2015-16
Figures as of 31st March 201623/30
Fund
Crisil Balance Fund Index
-1.67% 22.66% 14.83%
-2.90% 22.53% 13.40%
1 Year
Returns (CAGR)2 Year 3Year 4Year 5Year
8.71%
8.18%
-1.40%
-3.17%
Since Inception
10.86%
13.31%

Stable Fund
Annual Investment Report 2015-16
Top 10 Equity Holdings as a Percentage of AUM
1.00 2.00 3.00 4.00 5.00 6.000.00
Equity Industry Distribution
5.00 10.00 15.00 20.00 25.000.00
Equity
Debt
Cash & Cash Equivalents
Govt Bonds
NCD
Cash & Cash Equivalents
Debt Asset Profile
SFIN: ULIF00105/07/08EEF0138
This fund will aim to maintain a balance between equity and debt exposure, so that the client has a stable and attractive long term return. The fund will also shift allocation between debt and equity to gain from asset price movements over medium to long term.
Fund Mandate :
Asset Profile
73% 27%
3%
65% 86%
2%
12%
INFOSYS LTD. 5.73HDFC BANK 4.90ITC LTD. HOUSING DEVELOPMENT FINANCE CORPORATION LTD. 4.15RELIANCE INDUSTRIES LTD. ICICI BANK 3.20TATA CONSULTANCY SERVICES LTD. LARSEN and TOUBRO LTD. SUN PHARMACEUTICAL INDUSTRIES.LTD. AXIS BANK 1.75
FINANCIALS 19.33ENERGY 6.60IT 11.47CONSUMER STAPLES 5.80CONSUMER DISCRETIONARY 7.64MATERIALS 3.16INDUSTRIALS 3.07UTILITIES 2.07HEALTH CARE 4.48TELECOM 1.44DFI 00.0
Figures as of 31st March 201624/30
32%
4.35
4.05
3.122.31
2.12

94% 6%
Debt Sectoral Profile
Stable FundSFIN: ULIF00105/07/08EEF0138
This fund will aim to maintain a balance between equity and debt exposure, so that the client has a stable and attractive long term return. The fund will also shift allocation between debt and equity to gain from asset price movements over medium to long term.
Fund Mandate :
Details of debt portfolio holdings10.15% NCD BAJAJ FINANCE LTD. MD 19/09/2024 1.23
10.20% NCD HDB FINANCIAL SERVICES LTD.
MD 17/10/2023 0.41
8.13% GSEC MD 21/09/2022 0.40
Total 32.26
Annual Investment Report 2015-16
9.23% GSEC MD 23/12/2043 13.02
8.83% GSEC MD 12/12/2041 5.14
8.28% GSEC MD 15/02/2032 3.10
8.97% GSEC MD 05/12/2030 2.64
10.21% NCD BAJAJ FINANCE LTD. MD 22/08/2022 2.42
7.95% FERTILISER BOND MD 18/02/2026 2.36
8.13% GSEC MD 22/06/2045 1.54
Figures as of 31st March 201625/31
Sovereign
Financial and Insurance Activities
Fund
Crisil Balanced Fund Index
-2.09% 23.03% 12.35%
-2.90% 22.53% 13.40%
1 Year
Returns (CAGR) 2 Year 3Year 4Year 5Year
8.32%
8.18%
-2.06%
-3.17%
Since Inception
6.67%
6.28%

Secure FundSFIN: ULIF00505/07/08SF0138
This fund aims to invest in a diversified portfolio of money market instruments and other fixed income securities of short to medium term maturities. The main objective will be to generate reasonable returns with very low valuation risks.
Fund Mandate :
Holdings as a Percentage of AUM8.75% FD BANK OF BARODA MD 21/04/2016 7.90
8.00% FD INDUSIND BANK MD 20/03/2017 7.90
CP HOUSING DEVELOPMENT FINANCE CORPORATION LTD MD 26/07/2016 7.70
CP TATA MOTORS FINANCE LTD MD 10/08/2016 7.67
CP LNT FINANCE LTD. MD 01/09/2016 7.64
7.90% FD AXIS BANK MD 06032017 7.26
7.75% FD ANDHRA BANK MD 30/12/2016 6.32
IL&FS FINANCIAL SERVICES LIMITED 6.17
7.85% FD ALLAHABAD BANK MD 17/02/2017 5.68
9.40% FD UNION BANK OF INDIA MD 06/03/2017 3.47
8% FD JAMMU & KASHMIR BANK MD 09/01/2017 3.13
8.50% FD KOTAK BANK MD 05/07/2016 3.13
8.50% FD KOTAK BANK MD 06/07/2016 3.13
8% FD JAMMU & KASHMIR BANK MD 10/01/2017 2.84
7.50% FD ALLAHABAD BANK MD 28/12/2016 2.84
8.50% FD KOTAK BANK MD 07/07/2016 0.95
Others 16.28
Total 100.00
Housing Sector
Financial and Insurance Activities
Bank Deposits
CP/CD
Cash & Cash Equivalents
More Than 6 Months
Less Than 6 Months
73% 27%
Bank deposits
Cash & Cash Equivalents
Debt Sectoral ProfileRating Profile
Maturity Profile
Annual Investment Report 2015-16
Asset Profile
63% 29%
63%73% 27%
Figures as of 31st March 201617/30
37% 82%
54%8% 46%
18%
Fund
Crisil Liquid Fund Index
8.64% 9.40% 9.71%
8.06% 8.98% 9.54%
1 Year
Returns (CAGR)2 Year 3Year 4Year 5Year
9.80%
8.17%
10.10%
8.44%
Since Inception
9.09%
7.71%

Pension Secure Fund
Annual Investment Report 2015-16
SFIN: ULIF00905/01/09PSECURE0138
This fund aims at investing in a diversified portfolio of debt andmoney market instruments of short to medium term maturities. The main objective will be to generate investment income with very low volatility risk since asset durations would be reasonably small.
Fund Mandate :
Holdings as a Percentage of AUM7.50% FD ALLAHABAD BANK MD 29/12/2016 8.05
8.50% FD ANDHRA BANK MD 16/05/2016 8.05
7.90% FD AXIS BANK MD 06032017 8.05
8.60% FD CORPORATION BANK MD 16/05/2016 8.05
8.75% FD INDIAN BANK MD 12/05/2016 8.05
8% FD JAMMU & KASHMIR BANK MD 04/01/2017 8.05
7.9% FD KOTAK BANK MD 31/01/2017 8.05
CP HOUSING DEVELOPMENT FINANCE CORPORATION LTD MD 26/07/2016 7.86
CP TATA MOTORS FINANCE LTD MD 10/08/2016 7.82
IL&FS FINANCIAL SERVICES LIMITED 7.49
8.75% FD STATE BANK OF MYSORE MD 13/05/2016 6.04
7.75% FD STATE BANK OF HYDERABAD MD 12/01/2017 4.03
Others 10.38
Total 100.00
Housing Sector
Financial and Insurance Activities
More Than 6 Months
Less Than 6 Months
73% 27%
Bank deposits
Cash & Cash Equivalents
Debt Sectoral ProfileRating Profile
Maturity ProfileAsset Profile
66%
Bank deposits
CP/ CD
Cash & Cash Equivalents 67%
73% 27%
Figures as of 31st March 201618/31
10%
23%
56%
44%
79%
34%
21%
Fund
Crisil Liquid Fund Index
8.49% 8.42% 9.13%
8.06% 8.98% 9.54%
1 Year
Returns (CAGR) 2 Year 3Year 4Year 5Year
9.80%
8.17%
10.12%
8.44%
Since Inception
8.75%
7.57%

Conservative FundSFIN: ULIF00105/07/08EEF0138
The aim of this fund is to invest not only into secured instruments but also to invest into equities, to ensure attractive returns. This fund will primarily invest into government debt, corporate debt and money market instruments.
Fund Mandate :
Holdings as a Percentage of AUM8.19% GSEC MD 16/01/2020 45.00
8.28% GSEC MD 15/02/2032 26.96
9.23% GSEC MD 23/12/2043 3.34
Others 24.70
Total 100.00
Sovereign
Debt
Cash & Cash Equivalents
Equity
0 - 5 Years
More Than 10 Years
73% 27%
Govt Bonds
Cash & Cash Equivalents
Debt Sectoral ProfileDebt Asset Profile
Maturity ProfileAsset Profile
100%
75%
25%
75%
Figures as of 31st March 201619/31
Annual Investment Report 2015-16
19%
60%40%
6%
Fund
Crisil Bond Fund Index (80%) Nifty (20%)
7.80% 15.92% 5.85%
4.82% 17.00% 7.11%
1 Year
Returns (CAGR)2 Year 3Year 4Year 5Year
9.62%
8.85%
7.20%
4.30%
Since Inception
10.08%
7.77%

NAVPF Fund
Top 10 Equity Holdings as a Percentage of AUM
1.00 1.50 2.00 2.50 3.00 4.00 4.503.500.00 0.50
Equity Industry Distribution
5.00 10.00 15.00 20.000.00
Equity
Debt
Cash & Cash Equivalents
T Bills
CP/ CD
Cash & Cash Equivalents
Debt Asset Profile
SFIN: ULIF01124/08/09NAVPF0138
This fund aims at restricting the fall in NAV at any point of time below 80% of the highest NAV recorded from the date of inception of this fund.
Annual Investment Report 2015-16
Fund Mandate :
Asset Profile
73% 27%
11%
48% 51%
21%
28%
INFOSYS LTD. 4.21HDFC BANK 3.64ITC LTD. HOUSING DEVELOPMENT FINANCE CORPORATION LTD. 3.01RELIANCE INDUSTRIES LTD. ICICI BANK 2.37TATA CONSULTANCY SERVICES LTD. LARSEN and TOUBRO LTD. SUN PHARMACEUTICAL INDUSTRIES.LTD. AXIS BANK 1.29
FINANCIALS 14.22ENERGY 4.86IT 8.36CONSUMER STAPLES 4.24CONSUMER DISCRETIONARY 5.66MATERIALS 2.28INDUSTRIALS 2.30UTILITIES 1.50HEALTH CARE 3.28TELECOM 1.05
Figures as of 31st March 201626/31
41%
3.18
2.98
2.241.721.54

69%31%
Debt Sectoral Profile
Sovereign
Details of debt portfolio holdings91 DAYS TREASURY BILL MD 21/04/2016 23.60
IL&FS FINANCIAL SERVICES LIMITED 6.25
CD ORIENTAL BANK OF COMMERCEMD 28/04/2016 5.09
364 DAYS TREASURY BILL MD 23/06/2016 3.15
CD IDBI BANK MD 04/04/2016 1.92
CP HOUSING DEVELOPMENT FINANCE CORPORATION LTD MD 26/07/2016 1.44
Total 41.44
Figures as of 31st March 201627/31
Annual Investment Report 2015-16
Housing Sector
NAVPF FundSFIN: ULIF01124/08/09NAVPF0138
This fund aims at restricting the fall in NAV at any point of time below 80% of the highest NAV recorded from the date of inception of this fund.
Fund Mandate :
Fund
Crisil Balanced Fund Index
-4.08% 22.33% 13.30%
-2.90% 22.53% 13.40%
1 Year
Returns (CAGR)2 Year 3Year 4Year 5Year
7.13%
8.18%
-2.34%
-3.17%
Since Inception
7.47%
8.01%
Figures as of 31st March 201628/31
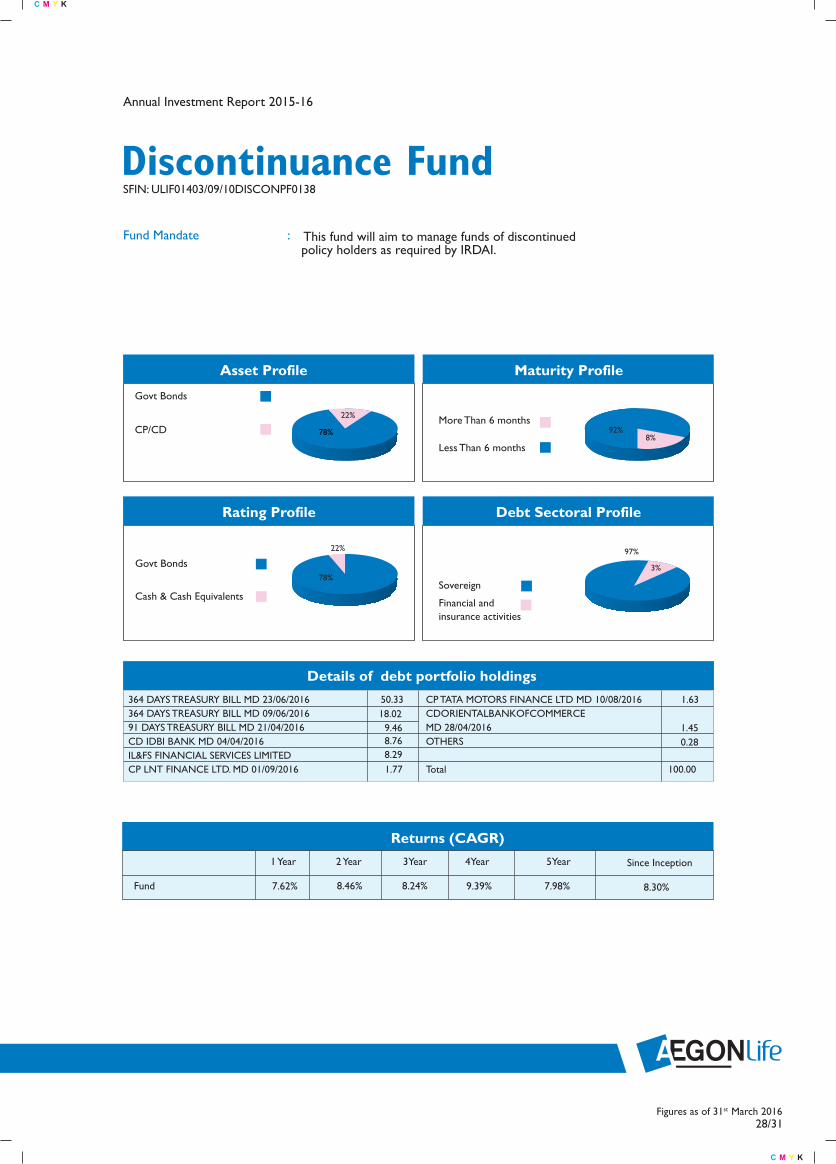
Discontinuance FundSFIN: ULIF01403/09/10DISCONPF0138
This fund will aim to manage funds of discontinuedpolicy holders as required by IRDAI.
Fund Mandate :
Details of debt portfolio holdings364 DAYS TREASURY BILL MD 23/06/2016 50.33 364 DAYS TREASURY BILL MD 09/06/2016 91 DAYS TREASURY BILL MD 21/04/2016 CD IDBI BANK MD 04/04/2016 IL&FS FINANCIAL SERVICES LIMITED CP LNT FINANCE LTD. MD 01/09/2016 1.77
CP TATA MOTORS FINANCE LTD MD 10/08/2016 1.63 CD ORIENTAL BANK OF COMMERCEMD 28/04/2016 OTHERS
Total 100.00
Sovereign
Financial and
Govt Bonds
CP/CDMore Than 6 months
Less Than 6 months
73% 27%
Govt Bonds
Cash & Cash Equivalents
Debt Sectoral ProfileRating Profile
Maturity ProfileAsset Profile
97%
78%
22%
78%
Annual Investment Report 2015-16
8%92%
22%
insurance activities
3%
Fund 7.62% 8.46% 8.24%
1 Year
Returns (CAGR) 2 Year 3Year 4Year 5Year
9.39% 7.98%
Since Inception
8.30%
18.02 9.46 8.76 8.29
1.450.28

Figures as of 31st March 201629/31
Annual Investment Report 2015-16
ABOUT AEGON LIFE
Aegon Life Insurance Company Limited (formerly AEGONReligare Life Insurance Company Limited) launched its pan-India operations in July, 2008 following a multi-channeldistribution strategy with a vision to help people plan theirlife better. The fulfillment of this vision is based upon havinga complete product suite, providing customised advice andenhancing the overall customer experience. Aegon, aninternational provider of life insurance, pensions and assetmanagement and Bennett, Coleman & Company, India'sleading media conglomerate, have come together to launchAegon Life Insurance. This joint venture adopts a localapproach with the power of global expertise to launchproducts that are focused on providing customers with themeans to meeting their long-terms financial goals. Thecompany is headquartered in Mumbai having 53 branchesacross 46 cities. The company has around 9600 life insuranceagents serving over 4 lakh customers across India.
ABOUT AEGON
Aegon's roots go back 170 years – to the first half of thenineteenth century. Since then, Aegon has grown into aninternational company, with businesses in more than 20countries in the Americas, Europe and Asia. In the US,Aegon's leading market, it operates under the Transamericabrand. Today, Aegon is one of the world's leading financialservices organizations, providing life insurance, pensions andasset management. Aegon never loses sight of its purpose tohelp its customers secure their long-term financial future.With around 28,000 employees, it has 635 billion Euros ofrevenue-generating investments.
ABOUT BENNETT, COLEMAN &COMPANY LIMITED
The Times Group is one of the leading media conglomeratein India having presence in print, radio, TV, outdoor media andthe internet through Bennett, Coleman and Company Limited (BCCL) and its subsidiaries. The Times of India, the flagship brand of the company, is the number 1 English newspaper in India and the World by circulation. With a turnover exceeding a billion dollars, the group has the support of over 25,000 advertisers, 11,000 employees and an audience spanning across all continents.

Disclaimers
THE INVESTMENT RISK IN THE INVESTMENT PORTFOLIO IS BORNE BY THE POLICY HOLDER. Funds do not offer guaranteed or assured returns. Investments are subject to market risk. For more details, please contact your Financial Advisors. Unit Link Life Insurance Products are different from the Traditional Insurance Products and are subject to the risk factors. The premium paid in Unit Linked Life Insurance policies are subject to investment risks associated with capital markets and the NAVs of the units may go up or down based on the performance of fund and factors influencing the capital market and the insured is responsible for his/her decisions. Aegon Life Insurance company Limited is only the name of the Insurance company and the specified Unit Linked funds do not in any way indicate the quality of the contract, its future prospects or returns. For more details on ARLI products and respective risk factors, terms and conditions please read respective sales brochure documents carefully before concluding a sale. The respective sales brochure documents for various products are published in the website - www.aegonlife.com.This document is issued by Aegon Life Insurance Company Limited. While reasonable care has been taken in preparing this document, no responsibility or liability is accepted for errors of fact or for any opinion expressed herein. This document is for information purposes only. It does not constitute any offer, recommendation or solicitation to any person to enter into any transaction or adopt any investment strategy, nor does it constitute any prediction of likely future movements in NAVs. Past performance is not necessarily indicative of future performance. We have reviewed the report, and insofar as it includes current or historical information, it is believed to be reliable though its accuracy or completeness cannot be guaranteed. Neither Aegon Life Insurance Company Limited, nor any person connected with it, accepts any liability arising from the use of this document. You are advised to make your own independent judgment with respect to any matter contained herein. Insurance is the subject matter of the solicitation. Corporate Identity No.: U66010MH2007PLC169110. Website: www.aegonlife.com. Fax: 022-61180200/300. Email: [email protected]. Aegon Life Insurance Company Limited Registration No. 138. Registered office: Aegon Life Insurance Ltd. Building No. 3, Third Floor, Unit No. 1, Nesco IT Park, Western Express Highway, Goregaon (East), Mumbai - 400063.
Figures as of 31st March 201630/31
Annual Investment Report 2015-16
Beware of spurious phone calls and fictitious/fraudulent offers IRDA clarifies to public that • IRDAI or its officials do not involve in activities like sale of any kind of Insurance or financial products nor invest premiums • IRDAI does not announce any bonus. Public receiving such phone calls are requested to lodge a police complaint along with details of phone call, number.