Independent Power Producers - PACRA · Demand and Supply during Peak Hours Supply ... 10 1994 Gul...
19
Independent Power Producers February 2016 Power Chain Generation Independent Power Producers Circular Debt Outlook
Transcript of Independent Power Producers - PACRA · Demand and Supply during Peak Hours Supply ... 10 1994 Gul...
Independent Power
Producers
February 2016
Power Chain GenerationIndependent
Power ProducersCircular Debt Outlook

Power Chain
Generation Transmission Distribution Consumption
Thermal
Furnace OilIndependent Power Plants,
Generations Companies,
and K-Electric
National Transmission and
Distribution Company
FESCO
Gas GEPCO Domestic
Coal HESCO
Nuclear IESCO Industrial
Renewable
Water Dams LESCO
Solar
Independent Power Plants
MEPCO Commercial
Wind PESCO
Hydel IPPs QESCO Agriculture
TESCO
SEPCO Others
K-Electric K-Electric
Power Chain GenerationIndependent
Power ProducersCircular Debt Outlook

Installed vs Actual
Thermal –
the largest
source of
electricity
generation
Addition of
Wind and
Bagasse
based IPPs
Largely
stagnant
capacity
utilization
% % % %
IPPs 7,939 34% 7,939 37%
GENCOs 4,669 20% 3,160 15%
K-Electric 2,247 10% 2,247 11%
Others (CPPs/SPPs) 285 1% 285 1%
WAPDA 6,902 30% 6,755 32%
IPPs 213 1% 213 1%
Nuclear Two Nuclear plants 615 3% 3% 615 3% 3%
Wind IPPs 205 1% 1% 106 0% 0%
Solar IPPs 100 -
Bagasse IPPs 76 0% 0% 26 0% 0%
23,251 100% 100% 21,346 100% 100%
65%
31%
MixJun-15 Jun-14
Mix
Dependable Generation Capacity (MW)
64%
33%
Capacity Source
Total
Thermal
Hydel
Power Chain GenerationIndependent
Power ProducersCircular Debt Outlook
FY15 FY14 FY13 FY12 FY11 FY10
Generation (GWh) 103,966 103,857 102,989 98,664 100,582 99,766
Growth (%) 0.1% 0.8% 4.4% -1.9% 0.8% 3.2%
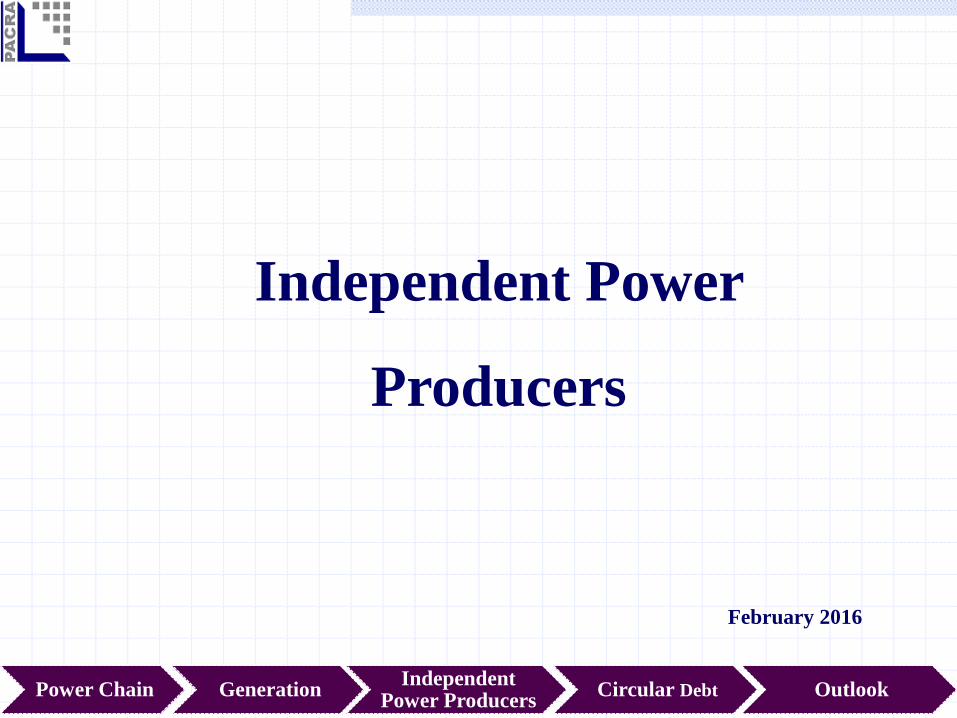
Demand and Supply during Peak
Hours
Supply
deficient
country
As per
NEPRA,
Pakistan
would be
electricity
surplus by
end of 2020
Actual
Production (MW) Demand (MW)Surplus / (Deficit)
(MW)
FY10 15,144 21,029 (5,885)
FY11 15,430 18,753 (3,323)
FY12 14,483 21,536 (7,053)
FY13 16,846 21,605 (4,759)
FY14 18,121 23,505 (5,384)
Projected
Production (MW) Demand (MW)Surplus / (Deficit)
(MW)
FY15 20,324 26,317 (5,993)
FY16 20,888 26,940 (6,052)
Power Chain GenerationIndependent
Power ProducersCircular Debt Outlook

Generation Mix (Fuel) and Cost
Heavy reliance on RFO generation
HSD – most expensive source of generation
Hydel – cheapest source of generation
Reduced cost / unit owing to decline in generation cost of RFO and HSD
FY13
Source Generation (%)Energy
Cost (%)
Cost/Unit
(PKR/KWh)Generation (%)
Energy
Cost (%)
Cost/Unit
(PKR/KWh)
Cost/Unit
(PKR/KWh)
RFO 32.0% 66.4% 13.0 38.3% 76.9% 15.6 15.8
Hydel 30.9% 0.5% 0.1 31.0% 0.3% 0.1 0.1
Gas 27.4% 21.9% 5.0 23.0% 15.8% 5.4 5.2
Nuclear 4.7% 0.9% 1.2 4.2% 0.7% 1.3 1.2
HSD 2.8% 7.8% 17.7 1.6% 4.5% 22.3 21.1
Mixed 1.0% 1.5% 8.9 1.1% 1.3% 9.3 10.0
Wind 0.4% 0.0% 0.0 0.3% 0.0% 0.0 0.5
Import 0.4% 0.7% 10.0 0.4% 0.5% 9.3 9.7
Bagasse 0.2% 0.2% 6.2 0.0% 0.0% - -
Coal 0.1% 0.1% 4.6 0.1% 0.1% 4.2 4.4
Gross NTDC + K-Electric 100% 100% 6.3 100% 100% 7.8 7.6
FY15 FY14
Power Chain GenerationIndependent
Power ProducersCircular Debt Outlook
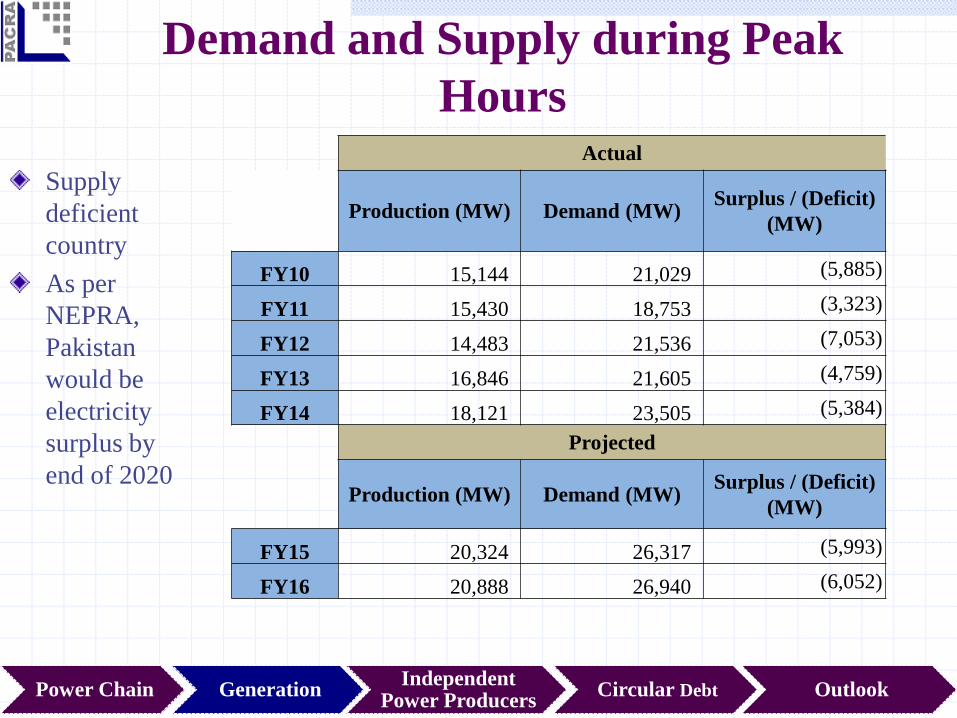
Generation Mix (Entity) and Cost
IPPs continue to contribute significant share in generation followed by WAPDA
GENCOs inefficient source
FY13
Source Generation (%)Energy
Cost (%)
Cost/Unit
(PKR/KWh)Generation (%)
Energy
Cost (%)
Cost/Unit
(PKR/KWh)
Cost/Unit
(PKR/KWh)
Thermal IPPs 42.4% 67.6% 10.0 42.1% 65.7% 12.2 12.1
WAPDA (Hydel) 29.9% 0.5% 0.1 30.0% 0.3% 0.1 0.1
GENCOs 11.2% 19.8% 11.1 12.4% 23.4% 14.7 12.2
K-Electric 8.8% 9.1% 6.4 8.4% 7.9% 7.4 7.9
Two Nuclear plants 4.7% 0.9% 1.2 4.2% 0.7% 1.3 1.2
Others (CPPs/SPPs) 1.0% 1.4% 8.9 1.2% 1.4% 9.4 9.8
Hydel IPPs 1.0% 0.1% 0.4 1.0% 0.0% 0.4 0.9
Wind IPPs 0.5% 0.0% 0.0 0.3% 0.0% 0.0 0.5
Mainly from Iran 0.4% 0.7% 10.0 0.4% 0.5% 9.3 9.9
100% 100% 6.3 100% 100% 7.8 7.6
FY15 FY14
Power Chain GenerationIndependent
Power ProducersCircular Debt Outlook
FY15 FY14
Total Energy Price (PKR mln) 652,906 809,046
Total Capacity Price (PKR mln) 228,145 218,136
Total Price (PKR mln) 881,051 1,027,182

Consumption Centre FY14 FY13 FY12 FY11 FY10
Domestic 47% 47% 46% 46% 46%
Industrial 29% 29% 29% 28% 27%
Agriculture 10% 10% 11% 12% 13%
Commercial 8% 8% 8% 8% 8%
Bulk Supply and Others 5% 6% 5% 5% 6%
Public Lighting 1% 1% 1% 1% 1%
Traction 0% 0% 1% 1% 0%
100% 100% 100% 100% 100%
Share in Consumption
Consumption Mix
Domestic users – largest consumers
Largely sustained consumption pattern
Power Chain GenerationIndependent
Power ProducersCircular Debt Outlook

Hydro Power Generation
Potential of ~40,000 MW of hydropower generation
Installed capacity – 7,116 MW
Most (97%) of the installed hydro power capacity is owned by
Pakistan Water and Power Development Authority (WAPDA) while
only 3% is owned by private sector
Currently contributing only 31% to the total national capacity
Power Chain GenerationIndependent
Power ProducersCircular Debt Outlook

Tarbela –
the largest
source of
hydel
electricity
generation
Nominal
addition in
the capacity
of WAPDA
in recent
years
Hydro Power Generation WAPDA Installed Capacity (MW)
Sr. # Project share June-15 June-14 June-13
1 Tarbela 50% 3,478 3,478 3,478
2 Ghazi Barotha 21% 1,450 1,450 1,450
3 Mangla 14% 1,000 1,000 1,000
4 Warsak 4% 243 243 243
5 Chashma 3% 184 184 184
6 Dubair Khwar 2% 130 130 -
7 Allai Khawar 2% 121 121 121
8 Jinnah 1% 96 96 96
9 Khan Khawar 1% 72 72 72
10 Rasul 0% 22 22 22
11 Jabban 0% 22 22 -
12 Dargai 0% 20 20 20
13 Gomal Zam 0% 17 17 17
14 Nandipur 0% 14 14 14
15 Shadiwal 0% 14 14 14
16 Chichoki 0% 13 13 13
17 Kurram Garhi 0% 4 4 4
18 Renala 0% 1 1 1
19 Chitral (Hydel) 0% 1 1 1
Total 100% 6,902 6,902 6,750
IPPs Installed Capacity (MW)
Sr. # Project share June-15 June-14 June-13
1 Laraib Energy 39% 84 84 84
2 Malakand - III 38% 81 81 81
3 Jagran AJ&K 14% 30 30 30
4 Pehur 8% 18 18 18
5 Garam Chashma 0% 1 1 1
Total 100% 214 214 214
Power Chain GenerationIndependent
Power ProducersCircular Debt Outlook

Upcoming Hydro Projects
Upcoming IPPs
Sr. # Project Location Capacity (MW)
1
Suki Kinari Hydropower (Pvt.)
Limited Kunhar River, KPK 870
2Azad Pattan Jhelum River, KPK 640
3Chakothi Hattian Jhelum River, AJ&K 500
4Karot
Jhelum River, Rawalpindi
district 720
5Patrind Kunhar River,AJ&K 147
Total 2,877
WAPDA Projects under construction
Sr. # Project MW Expected Completion
1 Neelum Jhelum 969 2017
2 Golen Gol 106 2017
3 Tarbela 4th Extension 1,410 2018
4 Keyal Khwar 122 2018
5 Dasu I 2,160 2021
6 Diamer Basha 4,500 2024
Total 9,267
Power Chain GenerationIndependent
Power ProducersCircular Debt Outlook

Pakistan – IPPs
30 IPPs in
Pakistan
KAPCO – the
largest IPP
RFO based net
capacity –
5,118 MW
( 62% of the
total net
capacity)
Sr. # Power Policy IPP FuelGross Capacity
(MW)
Net Capacity
(MW)COD
1 2002 KAPCO RFO 1,638 1,386 Dec-96
2Prior to
1994 HUBCO RFO 1,292 1,200 Mar-97
3 1994 Pakgen RFO 365 350 Feb-98
4 1994Lalpir RFO 362 350
Nov-
97
5 2002Hubco
Narowal RFO 220 214 Apr-11
6 2002 Atlas RFO 225 214 9-Dec
9 2002Liberty Power
Tech RFO 200 196 Jan-11
7 2002 Nishat RFO 200 195 Jun-10
8 2002Nishat
Chunian RFO 200 195 Jul-10
16 2002 Attock-Gen RFO 165 156 Mar-09
13 1994 Kohinoor RFO 131 126 Jun-97
10 1994 Gul Ahmed RFO 136 125 Nov-97
12 1994 Saba Power RFO 125 125 Dec-99
11 1994 Japan Power RFO 135 120 Mar-00
14 1994 Tapal Energy RFO 126 120Junn-97
15 1994Southern
Power RFO 136 119 Jun-99
Total RFO (MW) 5,656 5,191
Power Chain GenerationIndependent
Power ProducersCircular Debt Outlook

Pakistan – IPPs
Gas based
net capacity
– 2,028 MW
( 25% of the
total net
capacity)
Dual fuel
based net
capacity –
1,039 MW
(13% of the
total net
capacity)
Sr. # Power Policy IPP FuelGross Capacity
(MW)
Net Capacity
(MW)COD
17 1994 Uch Gas 586 551 Oct-00
18 1994 Rousch Gas 450 395 Dec-99
19 2002 Uch II Gas 404 375 Apr-14
20 2002Engro
Powergen Gas 227 217 Mar-10
21 2002 OrientGas
229 213May-
10 HSD
22 2002 Saphire Gas
225 212 Oct-10HSD
23 2002 TNB Liberty Gas 235 211 Sep-01
24 2002 SaifGas
229 209 Apr-10 HSD
25 2002 Halmore Gas
225 209 Jun-11 HSD
26 2002Foundation
Power Gas 185 177
May-
11
27 1994Fauji
Kabirwala Gas 157 151 Oct-99
28 1994 Habibullah Gas 140 126 Sep-99
29 1994 Altern Gas 29 29 8-Sep
30 1994 Davis Energen Gas 10 10 Jul-13
Total Gas & HSD (MW) 3,331 3,085
Total IPPs (MW) 8,987 8,276
Power Chain GenerationIndependent
Power ProducersCircular Debt Outlook

Pakistan | Bagasse Production & Upcoming IPPs
Power Chain GenerationIndependent
Power ProducersCircular Debt Outlook
Tonnes
Days Cane Crushed Bagasse Production*
J.D.W - I 149 2,866,631 859,989
J.D.W - II 145 1,186,269 355,881
J.D.W.-III 139 1,504,768 451,430
JDW Total 5,557,668 1,667,300
R.Y.K Mills 143 1,261,098 378,329
Ramzan Sugar Mills 121 432,720 129,816
Total Industry 56,460,254 16,938,076
* Based on assumption that cane crushed to bagasse production ratio is 1:3
Pakistan Sugar Industry | 2014
Capacity (MW) Oct Nov Dec Jan Feb Mar Apr May Jun Jul Aug Sep Oct Total
JDW I 27 9,772 6,119 14,835 12,300 11,500 13,600 17,200 11,100 17,900 18,300 17,600 11,670 - 161,896
JDW II 27 14,381 10,018 13,965 13,800 11,800 13,300 17,200 10,300 16,700 17,600 16,100 7,900 - 163,064
RYK 30 - - - - - 12,800 10,800 2,500 6,800 171 - - - 33,071
CPL 63 - - - - - - - - - - - - 69 69
Total 146 24,153 16,137 28,800 26,100 23,300 39,700 45,200 23,900 41,400 36,071 33,700 19,570 69 358,100
Capacity (MW) Oct Nov Dec Jan Feb Mar Apr May Jun Jul Aug Sep Oct Average
JDW I 27 14 8 21 17 16 19 24 15 25 25 24 16 - 17
JDW II 27 20 14 19 19 16 18 24 14 23 24 22 11 - 17
RYK 30 - - - - - 18 15 3 9 0 - - - 4
CPL 63 - - - - - - - - - - - - 0 0
Total 146 34 22 40 36 32 55 63 33 58 50 47 27 0 38
Pakistan Bagasse Driven Electricity Supply to NTDC (MWh)
2015
Company
2014
Company
2014 2015
Pakistan Bagasse Driven Electricity Supply to NTDC (MW)

Pakistan | Upcoming Bagasse Based Projects
Power Chain GenerationIndependent
Power ProducersCircular Debt Outlook
Company Location Capacity (MW) Milestone
Alliance Sugar Mills Limited Rasheedabad, Ubauro, District
Ghotki, Sindh
19 LoI issued
Layyah Sugar Mills Limited Karoor Road, District Layyah, Punjab 41 LoI issued
Safina Sugar Mills Limited Sargodha Road, Lalian, District
Chiniot, Punjab
20 LoI issued
Almoiz Industries Limited Adda Hameed Kot, District Mianwali,
Punjab
36 LoI issued
Etihad Power Generation Limited Mouza Karamabad, District Rahim
Yar Khan, Punjab
67 LoI issued
Shahtaj Sugar Mills Limited Mandi Bahauddin, Punjab 15 LoI issued
Chanar Energy Limited District Faisalabad 22 LoI issued
Total 235
Generation (On season | 5.5 months) 930,600,000 KWh
Bagasse Consumption for Upcoming Plants 1,861,200 Tonnes
Hamza Sugar Mill Limited 15Khanpur, District Rahim Yar Khan,
Punjab
LoS issued Pakistan total bagasse
production for 2014: ~17
mln tonnes
Expected bagasse
requirement for upcoming
IPPs: ~1.9 mln tonnes
Tariff Components
1-10 years
(PKR/KWh)
11-30 years
(PKR/KWh)
Fuel Cost 5.98 5.98
Variable O&M Local 0.12 0.12
Variable O&M Foreign 0.34 0.34
Fixed O&M Local 0.32 0.32
Insurance 0.22 0.22
Working Capital 0.17 0.17
Debt Service 3.90
Return on Equity 1.03 1.03
Total 12.09 8.19
Annual
Total Energy Sold (KWh) 219,506,692
Total Revenue (PKR Mln) 2,653
Debt Repayment (PKR Mln) 1,145
1,508
No. of days (Season) 108
No. of days (Off Season) 60
Bagasse Upfront Tariff

Upcoming Projects - Achieved Financial Close
Hydel
Wind
Sr. #Number of
Projects
Cumulative Capacity
(MW)
Expected
COD
1 6 46 2016
2 3 150 2017
3 22 514 2018
31 710
Sr. #Number of
Projects
Cumulative Capacity
(MW)
Expected
COD
1 1 147 2017
Sr. #Number of
Projects
Cumulative Capacity
(MW)
Expected
COD
1 1 50 2015
2 8 429 2016
9 479
Solar
Power Chain GenerationIndependent
Power ProducersCircular Debt Outlook

Risk Bubble | Where to find it?
• Generates
• i) Gencos
• ii) Hydro
• iii) IPPs
Generation
• Receives and Transmits
• -Transmission Cos
Transmission
• Receives and Distributed
• DISCOS
Distribution
• Consumes Power
• i) Pay Bills
• ii) Domestic
• Industrial & Commercial
• Agri
End Consumers
Fuel
Supplier
Circular Debt | Build up over the years
Receivables (PKR bln)
Jun-15 Jun-14
PSO 181 175
OGDCL 121 101
PPL 59 50
Attock & Shell 12 16
Total 373 342
(PKR bln) FY15 FY14
Subsidy 221 309
Loss to Discos 64 79
Short Recovery 81 120
Total 366 508
Circular Debt Settlement through PEPCO 0 (138)
Total Circular Debt 366 370
Power Chain GenerationIndependent
Power ProducersCircular Debt Outlook

Sector OutlookChallenges Developments
Circular Debt
Expensive and unsustainable fuel mix
Tariff subsidies pressure on fiscal reserve
Supply deficit: Low capacity; High T&D losses
GENCOs: Inefficient; Expensive; Weak governance
High foreign investment (CPEC: 19 projects; 15,425MW; $33.8bln)
Power subsidies reduced in FY16 budget (PKR 185bln; FY15: PKR 245bln) – positive step to curtail circular debt
479MW wind projects under construction; 1014MW wind projects in pre-financial close stage
710 MW solar projects expected to be completed by CY18
Power Chain GenerationIndependent
Power ProducersCircular Debt Outlook

Bibliography
1. Petitions filed by IESCO, PESCO, LESCO, GEPCO, FESCO, MEPCO, QESCO, HESCO,
SEPCO and TESCO : ww.nepra.org.pk/Tariff/Petitions/DISCOs/ : http://www.nepra.org.pk/
2. K-Electric Annual Report 2015: http://www.ke.com.pk/investor/financial-data/index.html
3. Decision of the Authority (NEPRA) in the matter of Fuel Charges Adjustment for 12 months
(Jul14 –Jun15) : http://www.nepra.org.pk/
4. State of Industry Report 2013-2014 : http://www.nepra.org.pk/industryreports.htm
5. Private Power and Infrastructure Board (PPIB) : www.ppib.gov.pk
Note : All year wise Electricity Statistics of Pakistan relate to Fiscal Year (which starts from
Jul and ends in Jun)

DISCLAIMERPACRA has used due care in preparation of this document. Our information has been obtained from sources
we consider to be reliable but its accuracy or completeness is not guaranteed. The information in this
document may be copied or otherwise reproduced, in whole or in part, provided the source is duly
acknowledged. The presentation should not be relied upon as professional advice.
Analysts
Rana Nadeem
Unit Head Ratings
Aisha Khalid
Manager Ratings
Zain Tariq
Senior Financial Analyst
Contact Number: +92 42 3586 9504