INCREASING EXPORTS OF ALBANIAN CULTIVATED FISH...
24
2015 Alejandra Jimenez Center for International Development, Harvard University INCREASING EXPORTS OF ALBANIAN CULTIVATED FISH TO THE EU
Transcript of INCREASING EXPORTS OF ALBANIAN CULTIVATED FISH...

2015 Alejandra Jimenez
Center for International Development, Harvard University
INCREASING EXPORTS OF ALBANIAN CULTIVATED FISH
TO THE EU

1
Contents
List of Figures ................................................................................................................................... 2 List of Tables .................................................................................................................................... 2 About this Study ............................................................................................................................... 3 Abstract ............................................................................................................................................ 4 Executive Summary .......................................................................................................................... 5 The Aquaculture Industry in the World and in Albania ................................................................. 6
European Seabass and Gilthead Seabream Culture ................................................................... 11
Albanian Seabass and Seabream Production ................................................................................. 12 Barriers to achieve full potential in Seabass and Seabream Production .................................... 13
Cost structure ........................................................................................................................... 13 Marketing ................................................................................................................................. 16 Regulation ................................................................................................................................ 17
Bridging the Gaps to Achieve Full Production Potential ............................................................ 17
Reducing Costs ......................................................................................................................... 17 Improving the market .............................................................................................................. 17 Clarifying regulation ................................................................................................................ 18 Private sector initiatives that can foster full potential production: Producer organizations 20
Conclusions ..................................................................................................................................... 21 References ...................................................................................................................................... 23

2
List of Figures
FIGURE 1 - CLASSIFICATION OF AQUACULTURE PRODUCTS ................................................................................... 6 FIGURE 2 - COMMON STRUCTURES FOR FISH CULTIVATION ................................................................................. 7 FIGURE 3 - EVOLUTION OF GLOBAL AQUACULTURE BY PRODUCTION ENVIRONMENT (1990 - 2013) ..................... 8 FIGURE 4 - EVOLUTION OF EUROPEAN AQUACULTURE ......................................................................................... 9 FIGURE 5 - ALBANIAN AQUACULTURE PRODUCTION 1990 - 2013 ....................................................................... 10 FIGURE 6 - EVOLUTION OF EUROPEAN SEABASS AND SEABREAM PRODUCTION (1990 – 2013) ............................ 11
List of Tables
TABLE 1 - AQUACULTURE PRODUCTION IN 2013 BY CONTINENT ........................................................................... 8 TABLE 2 - ALBANIAN AND EUROPEAN AQUACULTURE PRODUCTION (2013) ........................................................ 10 TABLE 3 - SEABASS AND SEABREAM 2013 PRODUCTION (IN TONS) FOR RELEVANT COUNTRIES ............................. 11 TABLE 4- COST DISTRIBUTION FOR SMALL SCALE (0-200 TONS) PRODUCTION OF SEABASS AND SEABREAM ........... 14 TABLE 5. COST COMPOSITION FOR SEABASS AND SEABREAM PRODUCTION IN ALBANIA AND GREECE. ................... 15

3
About this Study The author acknowledges financial support by the Open Society Foundations, as a part of the grant OR2013-10995 Economic Growth in Albania, given to the Center for International Development at Harvard University.
For the past two years, the Center for International Development (CID) at Harvard University has been leading, with strong support from the Government of Albania, a project to identify a growth strategy for the country. The strategy is the result of understanding the constraints that hinder growth in specific sectors and finding ways to ease these constraints. In May this year, the Albanian Ministry of Agriculture tasked the CID to analyze marine aquaculture production and suggest ways to increase it.
This document is the result of a review of the existing literature in English on Albanian fish and aquaculture production and of conversations with Albanian entrepreneurs and experts on this subject. Data was obtained from INSTAT –The Albanian Statistics Institute- and FAO publications. Discussions with experts and stakeholders were complemented with site visits.
Special thanks are due to Marsela Maci for her constant support to the completion of this project. This document could not have been completed without the cooperation and contribution of the Albanian Government and its staff in the Ministry of Agriculture, the Food and Veterinary Institute, the National Food Authority, and the Ministry of Environment. Thanks are due to Edmond Panariti, Vojo Bregu, Arben Kipi, Alban Suzi, Lauresha Grezda, Arjan Demiri, Mimoza Cobani, Rudin Qehajaj, Ardian Xinxo, Merjem Bushati, Erlinda Koni, Afrim Bakaj, Bledar Kazazi, Ornela Shoshi, Elvana Ramaj, and Gjergji Mano.
Thanks are also due to experts in the aquaculture and veterinary sector; Roland Kristo, Arjan Palluqi, Llazar Kora, Robert Connor, and Ylli Pema for information, insight and inputs.

4
Abstract
This document explores Albanian aquaculture in the context of European aquaculture and compares it to neighboring countries, especially Greece. Using information from fieldwork, multiple reports by the United Nations’ Food and Agriculture Organization (FAO), and interviews with experts in government and non-government institutions, we analyze the production of European seabass and Gilthead seabream in Europe in general and in Albania in particular. Albanian cultivation of seabass and seabream has increased sevenfold since production started in the early 2000’s, but it represented only 0.38% of European aquaculture of these two species in 2013. Albania has significantly lower productivity than its neighbors, especially Greece, the dominant actor in the market. The analysis indicates that Albania’s lower productivity is caused by: (i) high costs of cages, fingerlings, and feed; which are all imported; (ii) lack of a formal fish market; and (iii) lack of clarity in the regulation. The document concludes by offering recommendations to get over these impediments for growth including reducing tariffs; encouraging national production of cages, fingerlings, and feed through investment in research; offering more and better financing options for cage acquisition; improving quality controls; establishing a national fish market; and passing the Aquaculture Law to bring clarity to the sector regulation.
5
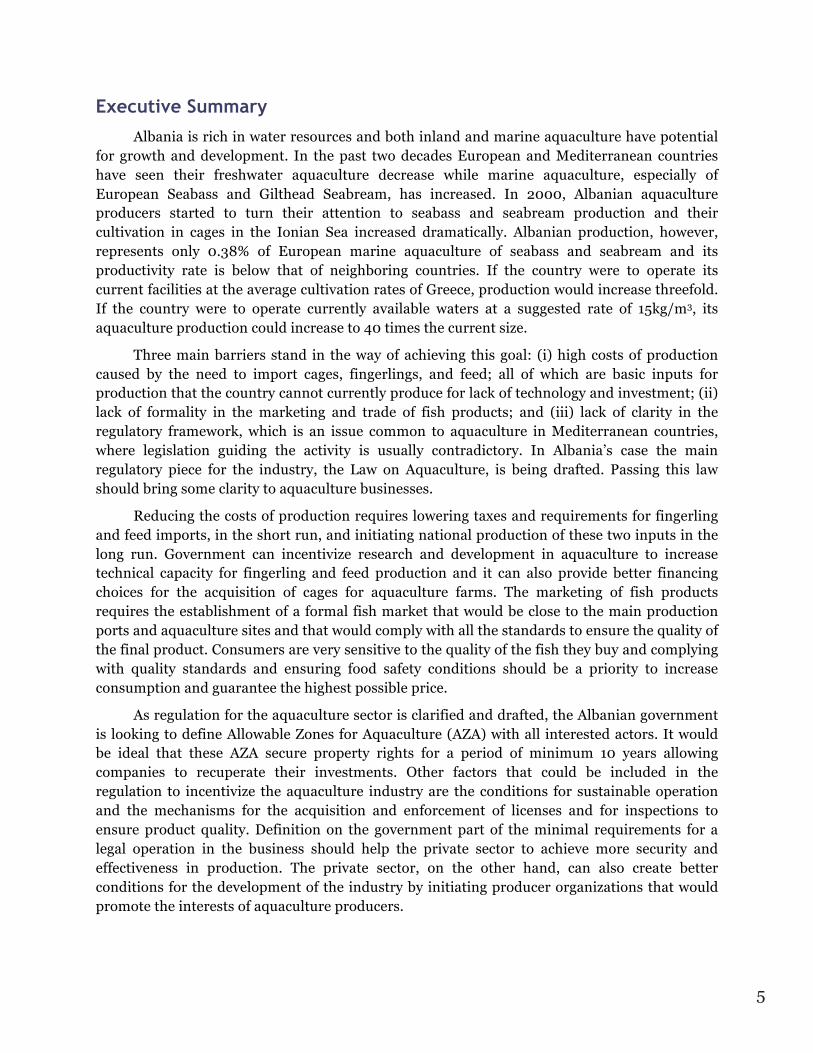
Executive Summary Albania is rich in water resources and both inland and marine aquaculture have potential
for growth and development. In the past two decades European and Mediterranean countries have seen their freshwater aquaculture decrease while marine aquaculture, especially of European Seabass and Gilthead Seabream, has increased. In 2000, Albanian aquaculture producers started to turn their attention to seabass and seabream production and their cultivation in cages in the Ionian Sea increased dramatically. Albanian production, however, represents only 0.38% of European marine aquaculture of seabass and seabream and its productivity rate is below that of neighboring countries. If the country were to operate its current facilities at the average cultivation rates of Greece, production would increase threefold. If the country were to operate currently available waters at a suggested rate of 15kg/m3, its aquaculture production could increase to 40 times the current size.
Three main barriers stand in the way of achieving this goal: (i) high costs of production caused by the need to import cages, fingerlings, and feed; all of which are basic inputs for production that the country cannot currently produce for lack of technology and investment; (ii) lack of formality in the marketing and trade of fish products; and (iii) lack of clarity in the regulatory framework, which is an issue common to aquaculture in Mediterranean countries, where legislation guiding the activity is usually contradictory. In Albania’s case the main regulatory piece for the industry, the Law on Aquaculture, is being drafted. Passing this law should bring some clarity to aquaculture businesses.
Reducing the costs of production requires lowering taxes and requirements for fingerling and feed imports, in the short run, and initiating national production of these two inputs in the long run. Government can incentivize research and development in aquaculture to increase technical capacity for fingerling and feed production and it can also provide better financing choices for the acquisition of cages for aquaculture farms. The marketing of fish products requires the establishment of a formal fish market that would be close to the main production ports and aquaculture sites and that would comply with all the standards to ensure the quality of the final product. Consumers are very sensitive to the quality of the fish they buy and complying with quality standards and ensuring food safety conditions should be a priority to increase consumption and guarantee the highest possible price.
As regulation for the aquaculture sector is clarified and drafted, the Albanian government is looking to define Allowable Zones for Aquaculture (AZA) with all interested actors. It would be ideal that these AZA secure property rights for a period of minimum 10 years allowing companies to recuperate their investments. Other factors that could be included in the regulation to incentivize the aquaculture industry are the conditions for sustainable operation and the mechanisms for the acquisition and enforcement of licenses and for inspections to ensure product quality. Definition on the government part of the minimal requirements for a legal operation in the business should help the private sector to achieve more security and effectiveness in production. The private sector, on the other hand, can also create better conditions for the development of the industry by initiating producer organizations that would promote the interests of aquaculture producers.

6
The Aquaculture Industry in the World and in Albania The Food and Agriculture Organization of the United Nations (FAO, hereafter) formulated
the following working definition of aquaculture: “Aquaculture is the farming of aquatic organisms: fish, mollusks, crustaceans, aquatic plants, crocodiles, alligators, turtles, and amphibians. Farming implies some form of intervention in the rearing process to enhance production, such as regular stocking, feeding, protection from predators, etc. Farming also implies individual or corporate ownership of the stock being cultivated. For statistical purposes, aquatic organisms which are harvested by an individual or corporate body which has owned them throughout their rearing period contribute to aquaculture, while aquatic organisms which are exploitable by the public as a common property resource, with or without appropriate licenses, are the harvest of capture fisheries.”1 Figure 1 shows the distribution of the types of aquatic organisms farmed in aquaculture.
Figure 1 - Classification of Aquaculture Products
Aquaculture can happen in different water environments, namely: freshwater (rivers, lakes, and other water bodies with salinity below 0.5%), brackish water (estuaries, coves, lagoons, and other water bodies with salinity between 0.5% and full strength sea water), and seawater (open waters and inland seas wit salinity over 20%). Fish and other aquatic species are farmed in diverse sites that are characterized by the rate at which they allow for water interchange. Figure 2 shows some of the most common structures for cultivation: (i) ponds and tanks that are constructed above or below ground and have a low rate of water exchange; (ii) raceways and silos are constructed above or below ground and are capable of high water exchanges; (iii) enclosures, pens, and cages are water areas confined by net, mesh, or a similar barrier that permit water exchange whether they are floating, suspended or fixed to the substrate; and (iv) rafts, ropes or stakes that are used to cultivate mainly shellfish, ropes are
1 http://www.fao.org/fishery/cwp/handbook/j/en Retrieved on December 15, 2015
48%
28%
16%
7% 1%
Fish Plants Mollusks Crustaceans Other animals
Source: FAO FishtatJ (2015) - CID Calculations

7
suspended from buoys in deep waters. Fish are brought to grow in these units when they are in fingerling or juvenile states after being bred in hatcheries and reared in nurseries.
Figure 2 - Common Structures for Fish Cultivation
Food produced through aquaculture has been gaining importance over capture fisheries in the past two decades. The World Bank (2013) predicts, based on global fish production data, that by 2030, 62 percent of food fish will be produced by aquaculture2. According to FAO’s Fishery and Aquaculture Statistics, in the past two decades, global aquaculture production including all categories and species3 expanded at an average annual rate of about 8 percent, from 16.8 million tons in 1990 to 97.2 million tons in 2013. In 2013, marine aquaculture represented 48% of all aquaculture, while aquaculture in freshwater and brackish water accounted for 45% and 7% of the total, respectively. Figure 3 shows the yearly evolution from 1990 to 2013. Asia, Europe, and the Americas are the continents with the highest aquaculture production. Table 1 shows percentages of global production by continent. Asia produces nearly 30 times more aquatic organisms than either Europe or the Americas. Starting in 2005, the 2 World Bank. (2013). Fish to 2030: Prospects for Fisheries and Aquaculture . Agriculture and Environmental Services Discussion Paper. World Bank Report Number 83177-GLB. 3 The data reported in this section are taken from FAO [2015]. Fishery and Aquaculture Statistics. Global aquaculture production 1950-2013 (FishStatJ). Aggregated data for the world and by continent include all aquatic organisms cultivated: plants, fish, mollusks, crustaceans, amphibians, and reptiles.

8
Americas displaced Europe as the second largest global aquaculture producer due to its higher production in freshwater. Europe remains the second largest world producer of marine aquaculture.
Figure 3 - Evolution of Global Aquaculture by Production Environment (1990 - 2013)
Table 1 - Aquaculture Production in 2013 by Continent
Continent Production in tons % Asia 89,357,606 91.93%
Europe 2,822,160 2.90% Americas 3,082,079 3.17%
Africa 1,737,802 1.79% Other 202,225 0.21% Total 97,201,872 100.00%
Source: FAO FishtatJ (2015) - CID Calculations
European aquaculture has expanded at a rate of 2.6% per year on average, and over this period of two decades, it went from representing 10% of total global aquaculture to 3%. Total production went from 1.6 million tons to 2.8 million, a 75% growth that is explained by a 184% growth in marine aquaculture, which had an average annual growth of 4.8%. Aquaculture in fresh and brackish waters decreased over this period.
0
5
10
15
20
25
30
35
40
45
50
Mil
lion
s of
tons
Brackish water Freshwater Marine
Source: FAO FishtatJ (2015) - CID Calculations

9
Figure 4 - Evolution of European Aquaculture
European marine aquaculture takes place mainly in the Mediterranean Sea and offshore
floating cages are the system most commonly used. Cages placed on the open sea are more cost effective than aquaculture on coastal land, which is very expensive on the Mediterranean, Adriatic, and Ionian coasts. Land based facilities are also more expensive because they require high initial investments and have high running costs. Besides, open sea aquaculture offers other advantages like lower energy costs and lower environmental impact while providing a better environment for the development of fish. Circular cages located at a minimum depth of 20 meters are becoming the preferred method for marine aquaculture production (Barazi-Yeroulanos, 2010).
-
.50
1.0
1.50
2.0
2.50
1990
19
91
1992
19
93
1994
19
95
1996
19
97
1998
19
99
2000
20
01
2002
20
03
2004
20
05
2006
20
07
2008
20
09
2010
20
11
2012
20
13
Mil
lion
s of
tons
Brackish water Freshwater Marine
Source: FAO FishtatJ (2015) - CID Calculations

10
Figure 5 - Albanian Aquaculture Production 1990 - 2013
Table 2 - Albanian and European Aquaculture Production (2013)
Brackish water Freshwater Marine Total Albania 800 620 670 2,090 Europe 62,678 455,722 2,303,760 2,822,160 % of European production coming from Albania 1.28% 0.14% 0.03% 0.07%
Source: FAO FishtatJ (2015) - CID Calculations
Albania’s aquaculture production trends, shown in Figure 5, are very different from the European general trend. The country’s highest aquaculture production comes from the cultivation of the Mediterranean mussel in the brackish waters of the Butrint lagoon. Due to a ban imposed on mussel exports from Albania to the European Union, production declined after 1990 and only began to recuperate in the early 2000’s. The year 1990 also marked a decline in freshwater aquaculture, after a change in the country’s political regime; the previous regime incentivized freshwater aquaculture through technical cooperation from Russia and China. Albania’s freshwater aquaculture has been concentrated on different species of carp (common carp, Chinese carp, Wuchang carp) and trout. The private sector started looking for new fish species and markets to explore and marine aquaculture gained importance from 2000 on. Albania started cultivation of Japanese shrimp, European Seabass, and Gilthead Seabream. Albania’s marine aquaculture today is based exclusively on the latter two species. Mediterranean
-
.50
1.0
1.50
2.0
2.50
3.0
3.50
4.0
4.50
1990
19
91
1992
19
93
1994
19
95
1996
19
97
1998
19
99
2000
20
01
2002
20
03
2004
20
05
2006
20
07
2008
20
09
2010
20
11
2012
20
13
Thou
sand
s of
tons
Brackish water Freshwater Marine
Source: FAO FishtatJ (2015) - CID Calculations

11
aquaculture in general is largely based on the production of these two fish species as well (Barazi-Yeroulanos, 2010).
European Seabass and Gilthead Seabream Culture
Figure 6 - Evolution of European Seabass and Seabream Production (1990 – 2013)
European Seabass and Gilthead Seabream production has shown a rapid growth in the
past two decades and has come to dominate marine aquaculture in Europe because of the fish high value and high demand. Seabass and seabream are usually cultivated together, so their production is analyzed together in the rest of the report. Aggregate production is shown in Figure 6. Greece, Turkey, and Spain are the regional and the world’s main producers, as Table 3 shows. Italy, Croatia, Cyprus, and France follow. Europe dominates the global production of seabass and seabream; countries outside of Europe cultivating bream and/or bass in 2013 include Israel, Saudi Arabia, Egypt, and Tunisia. The latter two, according to FAO statistics, cultivate bass and bream in brackish water. This production will not be analyzed in the following sections which will be concentrated on European marine aquaculture in general and Albanian marine aquaculture in particular. In this context, Greece, Turkey, Spain, and Italy are the most important producers of European seabass and Gilthead seabream in the open Mediterranean Sea.
Table 3 - Seabass and Seabream 2013 Production (in tons) for relevant countries
Brackish water Marine Aquaculture
Country Gilthead Seabream
European Seabass
Total Brackish
Gilthead Seabream
European Seabass
Total Marine Aquaculture
Greece 300 100 400 73,000 48,500 121,500
3.743
175.388
-
20.0
40.0
60.0
80.0
100.0
120.0
140.0
160.0
180.0
200.0 19
90
1991
19
92
1993
19
94
1995
19
96
1997
19
98
1999
20
00
2001
20
02
2003
20
04
2005
20
06
2007
20
08
2009
20
10
2011
20
12
2013
Thou
sand
s of
Ton
s
Source: FAO FishtatJ (2015) - CID Calculations

12
Turkey 35,701 67,913 103,614 Spain 478 637 1,115 18,419 14,308 32,728 Egypt 14,487 12,278 26,765 Italy 2,100 3,900 6,000 3,300 2,800 6,100 Tunisia 8,475 1,968 10,443 Croatia 2,978 2,826 5,804 Cyprus 3,795 1,422 5,217 France 1,300 2,300 3,600 Israel 79 115 194 2,441 89 2,530 Malta 2,550 127 2,677 Saudi Arabia 1,300 1,300 Albania 500 170 670
Source: FAO FishtatJ (2015) - CID Calculations
European bass and Gilthead seabream are sold fresh in markets close to production centers. The majority of fish sold weigh from 300 to 500 grams. Bigger fish have high production costs and are less profitable but are still produced to create product differentiation. Countries with small industries have a production that is usually focused on fish smaller than average with a weigh ranging from 300 to 400 grams. Albania produces seabass and seabream of this size exclusively. Most of Croatia’s, Italy, Montenegro’s, Israel, and Turkey’s productions are concentrated on fish this size as well. Most of Greece and Spain’s production, on the other hand, is of fish weighing more than 400 grams (Barazi-Yeroulanos, 2010. Table 39).
Production in Greece in 2013 was 121,500 tons. The Greek aquaculture industry is highly concentrated with a few companies controlling most of the national production. The biggest companies are also vertically integrated owning hatcheries for fingerling production (Barazi-Yeroulanos, 2010). Turkey’s production of 103,614 tons in 2013 comes mainly from the Aegean coast, where availability is limited and competition for space might force small companies out of business. Spain has also seen a trend of decreasing number of companies and increasing average production per company. This trend is the result of merger between small companies and growth in the average production of existing ones. Bass and bream production in both Spain and Italy occurs mainly in offshore cages and pens. The Italian industry uses the most modern equipment and seabass and seabream cultivation technology is high.
Albanian Seabass and Seabream Production Albanian aquaculture production is small compared to these big producers. The 670 tons
of both bass and bream that FAO calculates were produced in Albania in 2013 make up only 0.38% of European production. Albania, unlike Greece, Turkey, Spain, and Italy does not produce its own fingerlings and must import them. Fingerlings are imported mainly from Greece. The cages and feed needed for production are also imported. This increases the cost of production and reduces the number of companies in the market. However, unlike Turkey, Albanian waters are still quite available for aquaculture development and there is consensus in both the government and the private sector that current production can be increased.

13
According to the latest FAO National Aquaculture Sector Overview for Albania, there are currently 23 fish farms in the Albanian Ionic Sea dedicated to seabass and seabream production; the water surface area for aquaculture use is 73,840 m2 and its volume is 1,872,100 m3 (Cobani, 2015). With a reported production of only 670 tons in 2013 (FAO Fishery and Aquaculture Department [online], 2015), Albanian productivity would be 0.36kg/m3, which is far below its potential. Under the European Commission rules for organic aquaculture, seabass and seabream can be produced at a maximum of 15kg/m3 4. Operating at this rate and using the reported water available for aquaculture, Albania could produce around 28,000 tons of sea bass and seabream in a period of 12-24 months while the fish achieve desired size. This production level is 40 times current Albanian production. Using the currently installed 23 cages at Greece’s productivity level5, Albania would produce about 2,710 tons of seabass and seabream per year, or 3 times its 2013 production, and it would achieve a production level similar to Malta´s. Hence, Albania’s production could increase from 3 times to 40 times the current production assuming the figures just presented are true and don’t change.
Barriers to achieve full potential in Seabass and Seabream Production
Albania faces three main barriers to increasing its aquaculture production: high costs of inputs, low internal and external demand for its fish products, and outdated regulation for the aquaculture sector. Each of these barriers is further developed below.
Cost structure
Seabass and seabream production requires the following inputs: (i) cages, (ii) fingerlings, (iii) feed, (iv) medicines, (v) labor, (vi) energy, and (vii) packaging, marketing, and transportation. All of these are variable except for the installation of cage farms which in turn imply a number of fixed costs like: (i) maintenance, (ii) financing, (iii) depreciation, and (iv) management. Seabass and seabream are usually produced together and although they grow at different paces, the costs are calculated for the aggregate without differentiating between both species. Barazi-Yeroulanos (2010) calculates that for small and medium scale production6, variable costs are about 81% of total cost. There are economies of scale only when production is over 1,000 tons per farm, and, in this case, variable costs represent 89% of total cost (Barazi-Yeroulanos, 2010).
Albania’s cost structure is radically different from average. Fixed costs account for 45% of total costs in small scale facilities and 48% in medium scale ones. This is due to very high financial costs that make up more than 40% of total cost. Financial costs are incurred because of the loans taken to buy cages. Variable costs are about 55% in small-scale facilities and 52% in 4 http://ec.europa.eu/agriculture/organic/eu-policy/eu-rules-on-production/seaweed-and-aquaculture/index_en.htm Retrieved December 19, 2015 5 The latest FAO National Aquaculture Sector Overview for Greece reports that this country has 1,086 cages for marine aquaculture production, and 95% of them, or 1031 are dedicated to seabass and seabream production (Christofilogiannis, P. In: FAO Fisheries and Aquaculture Department [online], 2010). Greece’s 2013 production of 121,500 tons of seabass and seabream is thus achieved at rate of 118 tons per cage. 6 Small scale production is less than 200 tons/year, medium ranges from 200 to 500 tons, and large scale is more than 500 tons/year.
14
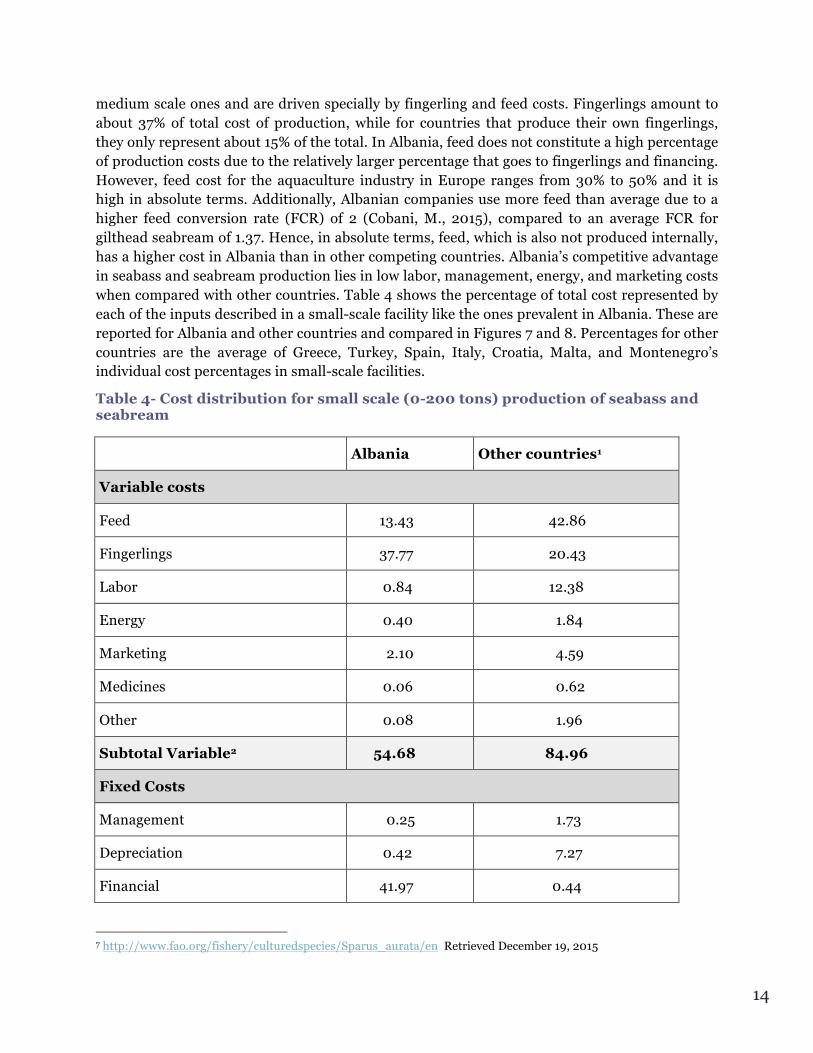
medium scale ones and are driven specially by fingerling and feed costs. Fingerlings amount to about 37% of total cost of production, while for countries that produce their own fingerlings, they only represent about 15% of the total. In Albania, feed does not constitute a high percentage of production costs due to the relatively larger percentage that goes to fingerlings and financing. However, feed cost for the aquaculture industry in Europe ranges from 30% to 50% and it is high in absolute terms. Additionally, Albanian companies use more feed than average due to a higher feed conversion rate (FCR) of 2 (Cobani, M., 2015), compared to an average FCR for gilthead seabream of 1.37. Hence, in absolute terms, feed, which is also not produced internally, has a higher cost in Albania than in other competing countries. Albania’s competitive advantage in seabass and seabream production lies in low labor, management, energy, and marketing costs when compared with other countries. Table 4 shows the percentage of total cost represented by each of the inputs described in a small-scale facility like the ones prevalent in Albania. These are reported for Albania and other countries and compared in Figures 7 and 8. Percentages for other countries are the average of Greece, Turkey, Spain, Italy, Croatia, Malta, and Montenegro’s individual cost percentages in small-scale facilities.
Table 4- Cost distribution for small scale (0-200 tons) production of seabass and seabream
Albania Other countries1
Variable costs
Feed 13.43 42.86
Fingerlings 37.77 20.43
Labor 0.84 12.38
Energy 0.40 1.84
Marketing 2.10 4.59
Medicines 0.06 0.62
Other 0.08 1.96
Subtotal Variable2 54.68 84.96
Fixed Costs
Management 0.25 1.73
Depreciation 0.42 7.27
Financial 41.97 0.44
7 http://www.fao.org/fishery/culturedspecies/Sparus_aurata/en Retrieved December 19, 2015

15
Maintenance 0.59 3.82
Fees and Rents 1.93 1.18
Other 0.16 1.00
Subtotal Fixed3 45.32 15.04
Total Costs 100.00 100.00
1. Greece, Turkey, Spain, Italy, Croatia, Malta, Montenegro
2. Italy is not reported in subtotals. Subtotals are calculated as the average of all reported subtotals by country.
3. Italy is not reported in subtotals. Subtotals are calculated as the average of all reported subtotals by country.
Source: Barazi-Yeroulanos, L. (2010). CID calculations
Labor, energy, and other variable costs are low in Albania, but Albanian companies are less cost effective than their competitors in other countries due to high fixed costs to finance initial investment and the lack of internal production of feed and fingerlings. Decreasing the cost on fingerlings and feed is critical to guarantee the survival of the industry in the long term. Table 5 compares the cost structure of seabass and seabream production for Greece and Albania based on the information on Table 4 and Cozzolino’s (2004) report. Each component contributed to total cost in a percentage equal to the one presented in Table 4. Financial costs are assumed to be split equally between credits on fingerlings sales and cage investments. Credit on fingerlings, raises their price by 21%; a single fingerling has a price of €0.19 if paid in cash and €0.23 if paid by credit (Cozzolino, 2004). Additionally, producers must pay a preferential tariff for fish products imported from the EU of 4.5% (Barazi-Yeroulanos, 2010) and a value added tax of 20% that applies to both feed and fingerlings. This explains the difference in price in these two products between Greece and Albania.
Table 5. Cost Composition for seabass and seabream production in Albania and Greece.
Price (€/kg) Greece Albania Variable costs Feed 1.68 2.11 Fingerlings 0.67 1.42 Labor 0.55 0.04 Energy 0.04 0.02 Marketing 0.25 0.10 Medicines 0.08 0.00 Other 0.15 0.00 Subtotal Variable 3.42 3.70 Fixed Costs Management 0.18 0.01

16
Depreciation 0.26 0.02 Maintenance 0.05 1.03 Financial - 0.03 Subtotal Fixed 0.49 1.06 Total Costs 3.91 4.76
Source: Cozzolino (2004). CID Calculations
Even with lower costs for labor, energy, and other inputs for production, Albania’s seabass and seabream production is 22% more expensive than production in Greece. Albania could reduce costs and increase competitiveness by reducing taxes and import costs for feed and fingerlings before starting its own production. Breeding and raising of fingerlings for carp and other freshwater species is already in place in Albania, but it needs support. Marine aquaculture hatcheries can be started using the technical knowledge already available in the country and encouraging university programs that would increase this knowledge.
Marketing
Other approach to increase the viability of the Albanian aquaculture industry is to increase demand and obtain the highest possible price, which require an increase in the quality of the final product. Both internal and external customers are reluctant to acquire farmed fish due to a concern with their quality and the effects on health of the feed used in their cultivation (Christofilogiannis, P., 2010). Albania does not comply with all the safety requirements of external markets, which would be a guarantee to consumers about the quality of Albanian fish products and a needed step to increase demand and competitiveness for the industry. Raising quality of Albanian fish would require:
- Getting quality certifications for the product. These include the ISO 9001 and the implementation of the Hazard and Critical Control Point Program (HACPP). The Albanian government can also develop its own certification scheme.
- Establishing a modern fish market and modernizing processing and packaging facilities. To ensure fish quality, time between capture and sale must be minimized and fish must be brought to the market sorted, boxed, and stored at temperatures close to freezing (Flloko). Albania’s fish marketing is quite informal with internal sales occurring on the roadsides near to water bodies or products sold directly to the nearby Italian market. The establishment of a fish auction market where more national international sellers can have access to the product and from where the Albanian product can be easily dispatched has been suggested by experts as a necessity for the country (Flloko). Albania has four main fish production sites in Durres, Vlore, Shengjin, and Sarande. The fish market established should be close to all four and to the aquaculture cages in the Ionian Sea.
- Promoting fish products through advertising and information campaigns that reduce consumers’ concerns about quality and possible health risks. These may include advertisements in television, radio, and newspapers and could possibly finish with the

17
organization of an aquaculture fair where aquaculture products are offered (Christofilogiannis, 2010).
Regulation
Aquaculture regulation in Mediterranean countries faces two main problems that Albania shares: (i) lack of spatial planning and (ii) complicated regulation and unclear responsibilities among government actors (Barazi-Yeroulanos, 2010). National aquaculture regulation in Mediterranean countries usually adopts European Union guidelines with some transfer to local realities. Most countries end up translating the required regulation into many pieces of legislation that are not commonly known to all establishments and that can overlap and contradict each other (Barazi-Yeroulanos, 2010). Albania, additionally has not updated the conditions for obtaining and enforcing aquaculture licenses; these will be updated by a new version of the law on aquaculture that is being prepared. In general, regulation should clarify the process and requirements to settle and operate an aquaculture facility. The process normally includes: (i) approval of the species to be cultivated, (ii) approval of the site for placement of the cage, (iii) approval of environmental conditions as studied and analyzed in an environmental impact assessment that the license petitioner does, (iv) regular inspections to ensure the facility is complying with all conditions for operation including the quality of the final product and its safety for human consumption. The regulation should clarify all the conditions to get approval in each of these phases and the organizations that would be responsible for providing the necessary approvals.
Bridging the Gaps to Achieve Full Production Potential
Reducing Costs
The import of cages, fingerlings, and feed reduces the profitability of Albanian business. Local production of fingerlings and feed would improve the cost effectiveness of Albanian production. Albania has hatcheries for carp juvenile production and increasing research and development in the aquaculture sector could create an internal production of seabass and seabream fingerlings as well. One way to do this would be to increase funding and support for the Fisheries Research Institute. Reducing costs of cages and feeds can occur through reducing taxes and facilitating the import of these products into the country. The government could also offer financing for the acquisition of cages and aquaculture farms so that firms face less of a burden when making the initial investments for the business.
Improving the market
Facilities to trade and acquire fresh fish should be developed not only to guarantee the quality of aquaculture product but also of fish caught in the open sea. Albania’s fish marketing remains informal, its chill chain is incomplete and it does not comply with hygiene standards (Cobani, 2015). A fish auction market connecting the main production sites, where transportation to outside buyers is easy and efficient, can increase sales and demand for fish products. A formal market is also necessary to comply with European regulation referring to

18
food safety and consumer health. Exporting into the EU requires getting checks on product quality and packing regulations8.
Clarifying regulation
Aquaculture regulation is complex in all Mediterranean countries due to the number of legislation pieces where it is found and the many organizations responsible for approval and inspection of aquaculture sites. Once the production of a species is decided, the regulation should guide the process for site selection, specify requirements for compliance with environmental conditions and food safety, and identify the conditions and information being checked during inspection. The Albanian regulation for aquaculture, which is being finalized by the Ministry of Agriculture, would bring clarity to aquaculture businesses about these steps of the process. Regulation and its enforcement are aimed to provide security and protection to the investments done by companies and to the consumer of the final products. It is in the companies’ best interest to have certainty that they will be able to obtain returns to long term investments that beginning aquaculture facilities implies and also to provide a high quality product that consumer will enjoy and be willing to pay for. Government regulation should: (i) secure property rights, (ii) define the conditions for a sustainable aquaculture operation, and (iii) enforce licensing conditions that include conditions for both tenancy and operation.
Secure Property Rights
Securing property rights implies giving companies the certainty that the sites they will occupy for aquaculture operation will not be taken away before they realize the benefits of their investment. Tenure of an aquaculture site should be secured to promote long term investments and requires the following:
- Definition of sites available for aquaculture solely. Aquaculture development could contradict the use of the coastline for tourism purposes. The presence of cages makes the coast less attractive for tourists to visit and chemicals such as feed and medicines used in fish production make the water around cages not suitable for tourists to use. The Albanian government must define which waters and coastline can be used for aquaculture and which can be used for tourism only and create Allowable Zones for Aquaculture (AZA). These zones should be defined for a period of at least 10 years so that businesses entering the aquaculture industry have a protection for their investments for the time that they can extract value from them. Additionally, the processing of aquaculture products needs facilities on land where it will not interfere with other activities like tourism.
- Interinstitutional coordination and decision making. The spatial planning to define both AZA and land to be used in processing facilities involves diverse government institutions that must come into agreement on the best ways to use water and land resources for Albania’s economic growth. The decision about land and water licensing for tourism and aquaculture should be approved by the Ministers’ council or other formal authority integrating the diverse institutions with a stake on the process. Spatial planning, specifically, requires agreement from the Ministry of Agriculture,
8 Permits for export are defined in the following legislation: 94/356/EC, 91/493/EEC, and LN 255 of 2000 (Barazi-Yeroulanos, 2010).

19
Rural Development and Water Management, the Ministry of Tourism and the Ministry of Environment.
Definition of the Conditions for a Sustainable Aquaculture Operation
New enterprises entering the aquaculture industry benefit from knowing the limits for water use, the amount of fish allowed per cage, the types of chemicals that can’t be put into the water and that feed and medicines can’t contain, and the conditions for operation and regular handling of water in and surrounding the cages. All of these limits on aquaculture production need to be measured regularly by government authorities and businesses must know how often inspections will happen, the variables that will be tested, and the acceptable levels for each of them.
Enforcement of License Conditions
Albania faces major challenges in enforcement of the conditions previously defined which require coordination among different organizations and many qualified inspectors. Currently, inspection in Albania is understaffed and some inspectors are underqualified for their job. Also, there is no clarity about the role that different inspection agencies must play on the ground and there is no data about aquaculture operations that can be used to assess the evolution of the industry and its needs. All of these barriers need to be solved to ensure a better operation of the industry.
- Defining authorities responsible for inspection. Monitoring and control of aquaculture companies involves the functions of different Albanian government institutions, namely: The Ministry of Agriculture, the Fisheries Directorate, the Ministry of Environment, the Food and Veterinary Institute, and the National Food Authority. Right now, all of these institutions have a responsibility in either defining the conditions and processes for licensing or in controlling that these are met. On the ground, the inspectors seem to work together but their roles are not clearly defined. A clear division between the responsibilities that each organization should assume would save resources from the government and guarantee better inspections of aquaculture sites. The lack of clarity creates unnecessary repetition of work by inspectors of different organizations and introduces uncertainty for business owners who may face many inspections from different actors or none at all.
- Defining the profile for inspectors and providing training: Not only are inspectors not aware of what their responsibilities are versus those of the inspectors at other organizations, the qualifications they must meet to perform at their jobs are also not established and defining them would bring order and effectiveness to the operation of aquaculture businesses, and most of all, could add quality to Albanian fish products. Once the qualifications needed for inspection are defined, hiring inspectors meeting the qualification required and training on the job for those who are already hired should follow.
- Gathering statistical data for decision making and improved monitoring. Lack of data is a challenge to evaluate the operation and results of the aquaculture industry. A separate body of government workers should work on collecting data on production, marketing, costs and prices of aquaculture products. Right now inspectors from the

20
Directorate of Fisheries gather data for the group in charge of fisheries and aquaculture policy in the Ministry of Agriculture. However, there is no incentive to reveal actual data to control inspectors and a separate group should be gathering the information that guides policy making.
The most appropriate actor to lead the execution of the processes explained so far is the government. However, business owners can also be proactive in creating better conditions for the development of a profitable aquaculture industry through the creation of producer organizations.
Private sector initiatives that can foster full potential production: Producer organizations
“A producer organization is a cooperative that controls production and marketing by its members”9. Producer organizations could be favorable to the aquaculture industry and support the initiatives stated before in the following ways:
Cost reduction.
a. Pooling to purchase imported inputs. b. Providing advice to members on operation of cage farms and marketing.
Improving marketing.
c. Assist each other in selling their products. d. Collect and provide accurate information on prices, industry production, consumption
trends, EU export policies, and government requirements that can help the members do their regular planning.
e. Promote Albanian aquaculture products together. f. Establish quality standards together and develop an Albanian brand with certified
quality.
Clarifying regulation.
g. Increase members’ negotiating power to put pressure on government to advance policies that benefit the sector.
h. Provide support to the enforcement of legal production conditions. Companies can check and monitor one another and guarantee that final products are high quality and produced in a sustainable way. It is in the best interest of all members in the organization to have a high quality product that will earn reputation from consumers and will be produced in a way that won’t risk future production by taking care of the water resources.
Currently there are organizations that represent fish producers’ interests in Italy, Greece, Spain, Tunisia, Morocco, and Turkey (Barazi-Yeroulanos, 2010), but even in these countries they do not operate as a producer organization. The closest example to a producer organization effective for the objectives listed before is the French “France AgriMer”, an organization created by law that defends the interest of fisheries and aquaculture companies. 9 Barazi-Yeroulanos, L. (2010). Synthesis Of Mediterranean Marine Finfish Aquaculture - A Marketing And Promotion Strategy. General Fisheries Commission for The Mediterranean Studies and Reviews No. 88. Page 79

21
Conclusions Aquaculture is a source of cheap and high quality protein and has become increasingly
important in global food production displacing capture fisheries as a source of food fish. Europe is the second largest producer of marine aquaculture; Greece, Turkey, Italy, and Spain are the region’s biggest producers. The European market is dominated by European seabass and Gilthead seabream production and the biggest producers have a vertically integrated production with fingerlings produced in the same facility as cultivated fish. European aquaculture production is becoming increasingly concentrated on big businesses that have their own hatcheries, the biggest companies also produce the feed provided for fish. Most companies dedicated to aquaculture are small and there are still many family businesses operating in the sector.
Both the size of production and the cost structure of Albanian aquaculture are distinct from the European average. Albanian marine aquaculture is devoted exclusively to small scale production of European Seabass and Gilthead Seabream. According to FAO statistics, the country produced 670 tons of both these fish in 2013 (FAO Fishery and Aquaculture Department [online], 2015), which is just 0.38% of the total European production of these species. Total production has a potential to increase. The current number of cages available in Albania could yield a production 3 times higher if operated at the Greek productivity. The total water available for cage aquaculture in Albania could yield a production 40 times higher than current if operated at the recommended production rate for organic fish.
One of the main barriers to increasing production is the high cost that the country pays from importing the technology for production including cages, fingerlings, and feed. Albanian aquaculture costs are higher than for the rest of Mediterranean countries that are producers of these inputs. The financial costs of the initial investment and the credit obtained when buying the fingerlings are the highest portion of the total cost of Albanian production. The costs of fingerlings alone and feed are the next highest components of total cost. Other barriers to maximizing profit in seabass and seabream production are a suboptimal quality of the final product and lack of clarity of regulation for the sector. Quality is affected by the lack of a formal fish market that is accompanied by a formal process to transport and store fish from production sites to final sale. Regulation for aquaculture is often unclear and contradictory in all Mediterranean countries. Albania has the opportunity to clarify and set a straightforward process for the settlement and operation of aquaculture sites in the drafting of a new version of the Law on Aquaculture that is currently happening.
Some recommendations suggested in this report to bridge these barriers to a higher production with higher profit are: (i) reduce costs for fingerling and feed imports; (ii) promote research and development for aquaculture hatcheries and develop an internal production of seabass and seabream fingerlings; (iii) offer businesses financing and credit with better terms than what they currently have access to; (iv) develop a fish market of high standards; (v) advertise aquaculture products; (vi) secure property rights through definition of AZA and of the process for its licensing; (vii) define conditions for sustainable operation and the way that they will be enforced; (viii) clarify roles of the different organizations involved in enforcement of aquaculture conditions; (ix) define the qualifications that inspectors need to have; (x) hire inspectors that fulfill the qualification requirements and provide training for inspectors

22
currently on the job; (xi) have a separate body of inspector gathering data about the aquaculture industry. All of these recommendations can be implemented by government and some of them can and probably will become real in the final aquaculture law. The private sector can also promote the industry by starting producer organizations that promote the interests of its members and support the enforcement of regulations that make the business sustainable and profitable. Producer organizations can also support its members in lowering costs for inputs by acquiring them together, advertise aquaculture products to provide security about quality to consumers, and develop quality standards for Albanian seabass and seabream.

23
References Barazi-Yeroulanos, L. (2010). Synthesis Of Mediterranean Marine Finfish Aquaculture - A Marketing And Promotion Strategy. General Fisheries Commission for The Mediterranean Studies and Reviews No. 88 .
Christofilogiannis, P. In: FAO Fisheries and Aquaculture Department [online]. (2010, November 19). National Aquaculture Sector Overview. Greece. Retrieved December 19, 2015, from http://www.fao.org/fishery/countrysector/naso_greece/en
Cobani, M. In: FAO Fisheries and Aquaculture Department [online]. (2015, March 6). National Aquaculture Sector Overview Fact Sheets. Albania. Retrieved December 19, 2015, from http://www.fao.org/fishery/countrysector/naso_albania/en
Cozzolino, M. (2004). Study of the market for aquaculture produced seabass and seabream species. Official Report to the European Commission DG Fisheries. In collaboration with University of Stirling- UK.
European Commission: Agriculture and Rural Development. (n.d.). European commission rules for organic farming. Retrieved Diciembre 19, 2015, from http://ec.europa.eu/agriculture/organic/eu-policy/eu-rules-on-production/seaweed-and-aquaculture/index_en.htm
FAO Fisheries and Aquaculture Department. (n.d.). Cultured Aquatic Species Information Programme: Sparus Aurata. Retrieved December 19, 2015, from http://www.fao.org/fishery/culturedspecies/Sparus_aurata/en
FAO Fishery and Aquaculture Department [online]. (2015). Fishery and Aquaculture Statistics. Global aquaculture production 1950-2013. (FishStatJ) . Rome.
Flloko, A. (n.d.). Fish marketing and trading in Albania. Retrieved from http://www.faoadriamed.org/pdf/publications/TD10/web-td-10-F.pdf
Image for figure 2 - cages. (n.d.). Retrieved from http://www.seachoice.org/state-of-our-oceans-2/aquaculture-issues/aquaculture-methods/
Image for Figure 2 - Mussel rope. (n.d.). Retrieved from https://www.nsf.gov/discoveries/disc_images.jsp?cntn_id=132832&org=NSF
Image for Figure 2 - Raceways. (n.d.). Retrieved from http://intecsciwri.wikidot.com/aquaculture
Image for Figure 2 - Tanks. (n.d.). Retrieved from www.e-education.psu.edu
Monfort, M. (2007). Marketing of aquacultured seabass and seabream from the Mediterreanean basin. Studies and Reviews. General Fisheries Commission for the Mediterranean (82).
World Bank. (2013). Fish to 2030: Prospects for Fisheries and Aquaculture . Agriculture and Environmental Services Discussion Paper. World Bank Report Number 83177-GLB .