Increased serum QUIN/KYNA is a reliable biomarker of post ...
20
RESEARCH ARTICLE Open Access Increased serum QUIN/KYNA is a reliable biomarker of post-stroke cognitive decline Adrien Cogo 1,2 , Gabrielle Mangin 1,2 , Benjamin Maïer 2 , Jacques Callebert 3 , Mikael Mazighi 1,4 , Hughes Chabriat 4 , Jean-Marie Launay 3 , Gilles Huberfeld 5,6 and Nathalie Kubis 1,2,7* Abstract Background: Strokes are becoming less severe due to increased numbers of intensive care units and improved treatments. As patients survive longer, post-stroke cognitive impairment (PSCI) has become a major health public issue. Diabetes has been identified as an independent predictive factor for PSCI. Here, we characterized a clinically relevant mouse model of PSCI, induced by permanent cerebral artery occlusion in diabetic mice, and investigated whether a reliable biomarker of PSCI may emerge from the kynurenine pathway which has been linked to inflammatory processes. Methods: Cortical infarct was induced by permanent middle cerebral artery occlusion in male diabetic mice (streptozotocin IP). Six weeks later, cognitive assessment was performed using the Barnes maze, hippocampi long- term potentiation using microelectrodes array recordings, and neuronal death, white matter rarefaction and microglia/macrophages density assessed in both hemispheres using imunohistochemistry. Brain and serum metabolites of the kynurenin pathway were measured using HPLC and mass fragmentography. At last, these same metabolites were measured in the patient’s serum, at the acute phase of stroke, to determine if they could predict PSCI 3 months later. Results: We found long-term spatial memory was impaired in diabetic mice 6 weeks after stroke induction. Synaptic plasticity was completely suppressed in both hippocampi along with increased neuronal death, white matter rarefaction in both striatum, and increased microglial/macrophage density in the ipsilateral hemisphere. Brain and serum quinolinic acid concentrations and quinolinic acid over kynurenic acid ratios were significantly increased compared to control, diabetic and non-diabetic ischemic mice, where PSCI was absent. These putative serum biomarkers were strongly correlated with degradation of long-term memory, neuronal death, microglia/ macrophage infiltration and white matter rarefaction. Moreover, we identified these same serum biomarkers as potential predictors of PSCI in a pilot study of stroke patients. Conclusions: we have established and characterized a new model of PSCI, functionally and structurally, and we have shown that the QUIN/KYNA ratio could be used as a surrogate biomarker of PSCI, which may now be tested in large prospective studies of stroke patients. Keywords: Post-stroke dementia • mouse • electrophysiology • tryptophane • cerebral ischemia • indolamine 2, 3- dioxygenase © The Author(s). 2021 Open Access This article is licensed under a Creative Commons Attribution 4.0 International License, which permits use, sharing, adaptation, distribution and reproduction in any medium or format, as long as you give appropriate credit to the original author(s) and the source, provide a link to the Creative Commons licence, and indicate if changes were made. The images or other third party material in this article are included in the article's Creative Commons licence, unless indicated otherwise in a credit line to the material. If material is not included in the article's Creative Commons licence and your intended use is not permitted by statutory regulation or exceeds the permitted use, you will need to obtain permission directly from the copyright holder. To view a copy of this licence, visit http://creativecommons.org/licenses/by/4.0/. The Creative Commons Public Domain Dedication waiver (http://creativecommons.org/publicdomain/zero/1.0/) applies to the data made available in this article, unless otherwise stated in a credit line to the data. * Correspondence: [email protected] 1 Université de Paris, INSERM U1148, Laboratory for Vascular Translational Science, F-75018 Paris, France 2 Université de Paris, INSERM U965, CART, F-75010 Paris, France Full list of author information is available at the end of the article Cogo et al. Molecular Neurodegeneration (2021) 16:7 https://doi.org/10.1186/s13024-020-00421-4
Transcript of Increased serum QUIN/KYNA is a reliable biomarker of post ...
RESEARCH ARTICLE Open Access
Increased serum QUIN/KYNA is a reliablebiomarker of post-stroke cognitive declineAdrien Cogo1,2, Gabrielle Mangin1,2, Benjamin Maïer2, Jacques Callebert3, Mikael Mazighi1,4, Hughes Chabriat4,Jean-Marie Launay3, Gilles Huberfeld5,6 and Nathalie Kubis1,2,7*
Abstract
Background: Strokes are becoming less severe due to increased numbers of intensive care units and improvedtreatments. As patients survive longer, post-stroke cognitive impairment (PSCI) has become a major health publicissue. Diabetes has been identified as an independent predictive factor for PSCI. Here, we characterized a clinicallyrelevant mouse model of PSCI, induced by permanent cerebral artery occlusion in diabetic mice, and investigatedwhether a reliable biomarker of PSCI may emerge from the kynurenine pathway which has been linked toinflammatory processes.
Methods: Cortical infarct was induced by permanent middle cerebral artery occlusion in male diabetic mice(streptozotocin IP). Six weeks later, cognitive assessment was performed using the Barnes maze, hippocampi long-term potentiation using microelectrodes array recordings, and neuronal death, white matter rarefaction andmicroglia/macrophages density assessed in both hemispheres using imunohistochemistry. Brain and serummetabolites of the kynurenin pathway were measured using HPLC and mass fragmentography. At last, these samemetabolites were measured in the patient’s serum, at the acute phase of stroke, to determine if they could predictPSCI 3 months later.
Results: We found long-term spatial memory was impaired in diabetic mice 6 weeks after stroke induction.Synaptic plasticity was completely suppressed in both hippocampi along with increased neuronal death, whitematter rarefaction in both striatum, and increased microglial/macrophage density in the ipsilateral hemisphere.Brain and serum quinolinic acid concentrations and quinolinic acid over kynurenic acid ratios were significantlyincreased compared to control, diabetic and non-diabetic ischemic mice, where PSCI was absent. These putativeserum biomarkers were strongly correlated with degradation of long-term memory, neuronal death, microglia/macrophage infiltration and white matter rarefaction. Moreover, we identified these same serum biomarkers aspotential predictors of PSCI in a pilot study of stroke patients.
Conclusions: we have established and characterized a new model of PSCI, functionally and structurally, and wehave shown that the QUIN/KYNA ratio could be used as a surrogate biomarker of PSCI, which may now be testedin large prospective studies of stroke patients.
Keywords: Post-stroke dementia • mouse • electrophysiology • tryptophane • cerebral ischemia • indolamine 2, 3-dioxygenase
© The Author(s). 2021 Open Access This article is licensed under a Creative Commons Attribution 4.0 International License,which permits use, sharing, adaptation, distribution and reproduction in any medium or format, as long as you giveappropriate credit to the original author(s) and the source, provide a link to the Creative Commons licence, and indicate ifchanges were made. The images or other third party material in this article are included in the article's Creative Commonslicence, unless indicated otherwise in a credit line to the material. If material is not included in the article's Creative Commonslicence and your intended use is not permitted by statutory regulation or exceeds the permitted use, you will need to obtainpermission directly from the copyright holder. To view a copy of this licence, visit http://creativecommons.org/licenses/by/4.0/.The Creative Commons Public Domain Dedication waiver (http://creativecommons.org/publicdomain/zero/1.0/) applies to thedata made available in this article, unless otherwise stated in a credit line to the data.
* Correspondence: [email protected]é de Paris, INSERM U1148, Laboratory for Vascular TranslationalScience, F-75018 Paris, France2Université de Paris, INSERM U965, CART, F-75010 Paris, FranceFull list of author information is available at the end of the article
Cogo et al. Molecular Neurodegeneration (2021) 16:7 https://doi.org/10.1186/s13024-020-00421-4

BackgroundStroke is a major cause of death, with 15 million deathsglobally each year. It is the major cause of acquired dis-ability and the second most frequent cause of dementia[1]. Up to 30% of stroke survivors develop dementiawithin 5 years. As life expectancy is prolonged [2], thesequels of stroke in survivors will generate increasinghealth costs. And yet, there is no biomarker to predictpost-stroke dementia and no treatment is currentlyavailable to prevent or slow the progress of dementiaafter stroke.Vascular cognitive impairment (VCI) encompasses all
vascular contributions to cognitive impairment includingstroke. It is a heterogeneous syndrome, including lesionsof large and/or small brain vessels that lead to large in-farcts or haemorrhages, lacunar infarcts, microbleedsand/or white matter lesions [3], and ultimately to mem-ory degradation and executive dysfunction [4]. This con-cept emphasizes the fact that cardiovascular risk factorsare involved, could be treated and that VCI could thenbe prevented [5, 6]. Recently, a group of experts pro-posed a consensus updated conceptualization of VCI inorder to facilitate standardization in research [7], sup-ported by imaging (i.e. diffuse white matter hyperintensi-ties, ischemic strokes and lacunes, microbleeds …) [8].They defined post-stroke cognitive impairment (PSCI) asoccurring when cognitive function is degraded immedi-ately or within 6 months of a stroke and does notrecover.The 5-year risk of dementia after stroke has been asso-
ciated with a single vascular risk factor, diabetes, by re-cent data from the Oxford Vascular study group [9]. Inthe general population, diabetes prevalence may be ashigh as 10%. It significantly increases the risk for cardio-vascular diseases [10] and has been associated with cog-nitive decline [11]. Systematic reviews have revealed anoverall increased incidence of vascular dementia andAlzheimer’s disease in diabetic compared with non-diabetic patients [12]. However, diabetes is rarely inte-grated in animal models of post-stroke dementia and in-cluding this risk factor may well open new perspectives.Pre-clinical models of post-stroke cognitive impair-
ment (PSCI) are very diverse. Ischemic stroke has beeninduced by permanent or transient occlusion of the mid-dle cerebral artery [13], by chronic hypoperfusion witharterial ligatures [14] or in genetic models such as mus-carinic acetylcholine receptor M5 knockout mice [15].Vascular risk factors have rarely been included in thesestudies [16–18]. Assessment of cognitive deficit andbrain damage has also varied greatly between studiesusing Y maze or Morris water maze, blood-brain-barrierdisruption or white matter rarefaction [19, 20].This study therefore aimed to establish a reliable
model of PSCI in diabetic mice. A permanent middle
cerebral artery occlusion (pMCAo) was used to induce asmall cortical infarct, comparable to those observed inthe clinical setting. The model was validated with behav-ioral, electrophysiological, histological and serum bio-markers. Searching for a potential biomarker of PSCI,we focussed on tryptophan (TRP)-derived kynurenine(KYN) metabolism, since 1) post-stroke inflammationthat develops early after stroke and persists over timemay be a key factor in PSCI [21]; 2) inflammation acti-vates indoleamine-2,3-dioxygenase (IDO), leading to anincreased production of KYN and possibly TRP deple-tion, and thereby increasing the kynurenine/tryptophan(KYN/TRP) ratio, an index of IDO activity; 3) serumIDO activity has been correlated in 41 patients to cogni-tive impairment, 4 weeks after ischemic stroke [22]; 4)KYN metabolites, quinolinic acid (QUIN) [23, 24] andkynurenic acid (KYNA) [25] are known to induce synap-tic plasticity. We therefore used this stroke-diabetesmouse model to ask whether serum metabolites of thekynurenine pathway (KP) could be useful biomarkers,correlated with defined indices of PSCI. We then mea-sured serum metabolites of the kynurenine pathway inpost-stroke patients, to investigate if they could be goodpredictors of post-stroke cognitive decline.
MethodsAll experiments and surgical procedures were performedaccording to European Community Directive (2010/63/EU) and the French National guidelines for the care anduse of laboratory animals. The study was specifically ap-proved by the Local Ethics Committee in Animal Experi-mentation and by the French ministry of HigherEducation for Research and Innovation (APAFIS#4100-2015111714376561v6).
Experimental design (Fig. 1)Focal cerebral ischemia was induced, in diabetic andnon-diabetic mice, by permanent middle cerebral arterythermocoagulation (pMCAo) on day 0 (D0). Sensori-motor examination was conducted 1 day before surgery(D-1), then at D1, D3, D7, D14 and D21. An index of“anxiety” was derived from the open field test at D28,and the marble burying test at D29, and an index of “de-pression” was obtained using the splash test at D29.Spatial memory was evaluated between D30 and D40with the Barnes maze test. These multimodal behav-ioural analyses were made sequentially to avoid bias.First, we established that if stroke diabetic mice had agreater sensorimotor deficit than stroke non-diabeticmice, the sensorimotor score was normalized by D21, soperformance on the Barnes maze would not be affectedby deficit. For the same reason, because anxiety and de-pression are two common manifestations that developafter stroke [26], and might interfere with the Barnes
Cogo et al. Molecular Neurodegeneration (2021) 16:7 Page 2 of 20

maze test interpretation, open field, the marble buryingtest and the splash test were performed at D28 and D29.Long-term potentiation (LTP) at hippocampal synap-
ses was measured at D40. Histology, immunohistochem-istry, and biochemical studies were made on brain tissueand blood sampled at D40. The following groups wereinvestigated: control mice without diabetes and withoutpMCAo (C); diabetic mice without pMCAo (D); non-diabetic mice subjected to focal cerebral ischemia(pMCAo), and diabetic mice subjected to focal cerebralischemia (pMCAo+D). All scorings and analyses weremade by investigators blind to animal status in thesegroups. Behavioural, histological, immunohistochemical,and serum biochemical tests were performed in thesame animals, whereas LTP studies and brain biochem-ical tests were performed in a subset of mice.
Diabetes inductionSix-week-old male C57BL/6 J mice (Janvier, Le GenestSaint-Isle, France) were divided into two groups: one re-ceived five consecutive daily intraperitoneal (IP) injec-tions of Streptozotocine (STZ, 60 mg/kg in 100 μL ofcitrate buffer) to induce diabetes; the other group re-ceived a sham injection of citrate buffer. Glycemia wasassessed weekly for 8 weeks. Mice with sustained hyper-glycemia (> 300 mg/dL) were considered as diabetic(90% of treated mice). Mice were housed in a 12-h light-dark cycle, with free access to food and water.
Permanent middle cerebral artery occlusion (pMCAo)Fourteen-week-old male C57BL/6 J mice were anesthe-tized with isoflurane (1.5 to 1.8% in O2) and bodytemperature was continuously monitored and main-tained at 37 ± 0.5 °C using a heating blanket (Homeo-thermic Blanket Control Unit; Harvard ApparatusLimited, UK). Mice were subjected to pMCAo by ther-mocoagulation of the middle cerebral artery, as de-scribed elsewhere [27]. D0 refers to the day of pMCAo.
Sensorimotor assessmentMice were trained on sensorimotor procedures on theday before pMCAo to avoid stress bias. Periodically afterpMCAo (D1, D3, D7, D14 and D21), mice were assessedon five tests: neurological score, grip and string test,beam walking and pole test. Results from these tests aregiven as neurological score. The maximal score value forthis index was 19 with lower scores indicating a moresevere deficit [27, 28].
Cognitive assessmentMice were housed in the behaviour room so that theycould be accustomed to the environment where theywere subjected to a 12-h night-day cycle with food andwater ad libitum. Before testing spatial memory at D40with the Barnes maze (BM), the absence of residual sen-sorimotor deficit was verified by determining the globalneurological score at D21. Impulsivity and anxiety-related behaviour were assessed at D28 and D29 with
Fig. 1 Timeline of experimental protocol. pMCAo: permanent middle cerebral artery occlusion; IP: intraperitoneal; n: number of mice/group. Longterm potentiation, neuronal death and microglia/macrophage densities were studied in both hippocampus; white matter density and microglia/macrophages density were studied in both striatums; microglia/macrophage density was studied in the peri-infarct and contralateralhomonymous area. Indoleamine 2, 3 dioxygenase (IDO) activity that converts Tryptophan (TRP) to Kynurenine (KYN), and kynurenine metabolites,quinolinic acid (QUIN) and kynurenic acid (KYNA) were measured in serum and brain at D40. Four groups were evaluated for each time point:control mice (C), diabetic mice (D), pMCAo mice (mice subjected to permanent middle cerebral artery occlusion without diabetes) and pMCAo +D (mice subjected to permanent middle cerebral artery occlusion with diabetes); n is the number of mice/group
Cogo et al. Molecular Neurodegeneration (2021) 16:7 Page 3 of 20

the open field and marble burying test. The splash testwas performed at D29 to assess anhedonia, a symptomof depression.
AnxietyAnxious mice tend to freeze, a behaviour inconsistentwith accurate results in the Barnes maze test. We usedthe open field and marble burying tests to detect anxiety.In the open field test, mice were placed in a chamber(PVC; 50x50x40cm; TSE Systems GmbH, Bad Homburg,Germany). Spontaneous activity was measured as thetotal distance travelled (cm) from images obtained withan infrared video camera by EthoVision XT 11.5 Track-ing Software (Noldus Wageningen, Holland). In the mar-ble burying test, twenty black glass marbles werearranged in a 4 × 5 equidistant grid pattern on top ofsawdust in a cage. Animals entered the cage for 30 min.After 30 min the number of buried marbles (includingthose only 2/3 covered) was counted. The number ofburied marbles was assumed to be negatively correlatedwith anxiety [29].
DepressionIn the splash test, used to assess depression, an animalwas placed in a cage for 2 min and a 10% sucrose solu-tion was vaporized onto its dorsal coat. The total dur-ation (seconds) of grooming, licking or scratching toremove the sucrose, was determined over 5 min [30][31].
Spatial learningThe Barnes maze was used to test spatial learning andmemory as we previously described [21]. Briefly, 20holes are spaced around the maze, one-meter diameterbrightly illuminated, and the mouse must find an “es-cape box” hidden under one of the holes. The first 4days (1st to 4th day) consisted of the learning phase.After 2 days of rest, the mice were placed back on theplatform (7th day) and had to remember the location ofthe escape box (retention phase). Finally, the next day,the escape box was moved to a different location, andthe ability of the mouse to learn and remember the newlocation was measured for 4 days (8th, 9th, 10th and11th day) (reversal phase). Mouse behaviour was filmedand the time required to find the escape box measured(latency to escape in seconds).
Electrophysiological assessmentAt 6 weeks after cerebral artery occlusion, we evaluatedlong-term potentiation (LTP) of synaptic efficacy in-duced by high-frequency stimulation [32], in hippocam-pal slices.
Slice preparation14-week-old mice were anesthetized with IP injection ofketamine and xylaxine (20 and 10% respectively) andsacrificed by decapitation after 2–3 min intra-cardiacperfusion of a 4 °C sucrose-based artificial cerebrospinalfluid (aCSF). The aCSF contained: 250 mM sucrose, 3mM KCl, 25 mM NaHCO3, 10 mM D-Glucose, 1 mMCaCl2, 10 mM MgCl2 (in mM). It was warmed to 34 °Cand equilibrated with 5% CO2 in 95% O2. The brain wascarefully removed and 400 μm thick slices were cut in avibratome (Leica VT1200S, Germany) in the oxygenatedsucrose-based aCSF. Slices containing the hippocampuswere stored in an interface chamber (Brain Slice Cham-ber 2, Scientific Systems Design, USA) at 34 °C and per-fused at 2 ml/min for at least 1 h with an aCSFcontaining (in mM): 124 NaCl, 3 KCl, 26 NaHCO3, 10D-Glucose, 1.6 CaCl2, 1.3 MgCl2, bubbled with 5% CO2
in 95% O2.
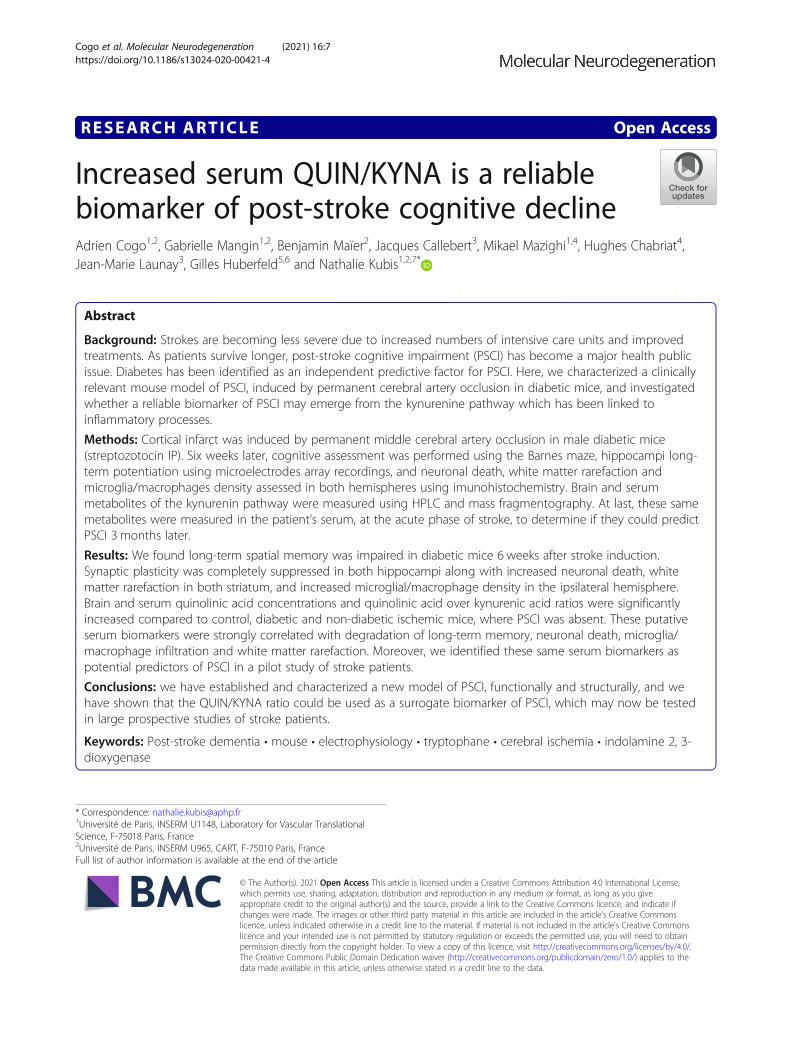
Multi-electrode array (MEA) recordingsHippocampal slices were transferred from the interfacechamber to planar MEA petri dishes (200–30 indium-tinoxide electrodes of 30 μm diameter at 200 μm separationin a 12 × 12 matrix, with a reference electrode; Multi-channel Systems, Germany). Slices were perfused withaCSF at 2 ml/min with a platinum anchor used to pre-vent movement. Electrical signals were acquired at 10kHz with a MEA2100–120 system (MultiChannel Sys-tems) and software (MC_Rack, MultiChannel Systems)[33]. Schaffer collateral fibres were stimulated with bi-phasic 100 μs voltage pulses delivered in monopolarmode by one of the array electrodes. Stimulus strengthand frequency were controlled by MC Rack software.Stimuli were adjusted to induce a field Excitatory PostSynaptic Potential (fEPSP) in the CA1 area [34]. Afterrecording stable fEPSP responses to Schaffer collateralstimulation at interval 10 s for at least 10 min, tetanic,high-frequency stimulation was applied (5 trains of 100stimuli at 100 Hz). The interval between stimuli wasreturned to 10 s, and fEPSP amplitude was monitoredfor 45 min. fEPSP amplitude before and 45min after tet-anic stimulation, were compared for mice of the fourgroups: with or without diabetes, with or without stroke.LTP was measured from the ipsi-lateral and contralateralhippocampus with results expressed as the % changefrom baseline fEPSP values.
Biochemical assaysTryptophan (TRP) is mainly utilized for protein synthe-sis (> 90%), but a small fraction is converted into sero-tonin and kynurenine (KYN) [35]. KYN is in turnmetabolized into kynurenic acid (KYNA) or quinolinicacid (QUIN). TRP, KYN, and KYNA were measuredusing HPLC, whereas QUIN was measured by mass
Cogo et al. Molecular Neurodegeneration (2021) 16:7 Page 4 of 20

fragmentography as previously described [36]. Thesemetabolites were expressed in μM (TRP, KYN), and nM(KYNA, QUIN). The in vivo Indoleamine 2,3 Dioxygen-ase (IDO) activity was estimated by the product to sub-strate (KYN/TRP) ratio and expressed as a percentage(%).Brains were weighed and sonicated at 4 °C until
complete homogenization in an ice-cold ascorbate/HClO410
−2M solution (dilution 1/10, w/v). The sampleswere then centrifuged at 12,000 g for 5 min at 4 °C. Thesupernatant was removed and placed in a Costar Spin-Xtube filter and then centrifuged at 12,000 g for 5 min at4 °C. The brain samples were then diluted to 1/10 in a0.06 mM ascorbate solution. Serum (100 μL) was mixedwith 10 μL 0.1% (v/v) aqueous formic acid (FA) and370 μL ice-cold acetone–methanol (1:1, v/v) containing10 μL internal standard (e.g. 25 nM d3-QUIN for quino-linic acid determination). It was allowed to rest for 15min at − 20 °C, vortexed for 60s to support protein pre-cipitation, and incubated for another 15 min at − 20 °C.The supernatant was obtained via centrifugation of themixture for 15 min at 12,000 g at 4 °C.For TRP, KYN and KYNA analysis a high-
performance liquid chromatography technique based onan ESA Coulochem III detector was used. The liquidphase (pH = 3.0) consisted of a solution of 75 mMNaH2PO4, 25 μM EDTA, 1.7 mM octanesulfonic acidand triethylamine in acetonitrile water (100 μl/L). Forquinolinic acid determination 400 μL supernatant weretransferred to a new tube, centrifuged for 15 s, and splitinto two equal parts. After concentration under vacuum(Savant SC 110 A Speed Vac Plus, Savant, USA), half ofthe sample was treated with 70 μL derivatizing reagent(n-butanol-acetylchloride, 9:1, v/v) and incubated for 1 hat 60 °C. The mixture was dried under nitrogen beforereconstitution. Both parts of the sample were dissolvedin 100 μL starting eluent (10% methanol containing 0.1%(v/v) FA in 0.1% (v/v) aqueous FA), vortexed, centri-fuged, and combined. Finally, 20 μL of the sample wasinjected into the UHPLC–MS/MS system (ACQUITY I-Class UPLCTM liquid chromatography system, Waters,Manchester, UK).
Histological analysisOn the day of sacrifice (D40), mice were transcardiallyperfused with heparinized saline, followed by 4% para-formaldehyde (PFA) in 0.1M phosphate buffer, pH 7.4.Brains were removed, post-fixed overnight in PFA andcryoprotected in 20% sucrose. Thirty μm thick floatingcoronal sections were incubated with a primary antibodyovernight at 4 °C. Immunohistochemistry was performedwith anti-Iba 1 (Ionized calcium binding adaptor mol-ecule 1, 1:400, Wako, Japan), anti-MBP (Myelin BasicProtein, 1:1600. Millipore, USA) antibodies to detect
microglia/macrophages and white matter, respectively.Secondary antibodies used Alexa-Fluor 488 as fluoro-phore (1:400, Molecular Probes, Eugene, OR). Fluorojadestaining (Millipore, USA) was used to estimate neuronaldegeneration.
Morphological analysisNeuronal death was assessed in both whole hippocampiby counting the number of fluorojade+ cells at − 1.28mm and − 2.12 mm relative to bregma. Microglia/mac-rophages cell density was assessed by calculating theIba1 area in two randomly chosen regions of interest(20X) in both hippocampi, both striata, in the peri-infarct area and in the homonymous contralateral area.White matter density was evaluated by calculating theMBP+ area in both striata at + 0.74 mm relative tobregma. These cells densities were expressed as contrastdensity using NIH ImageJ software (arbitrary units).
PatientsBlood samples of patients admitted in the stroke unit ofour hospital for thrombolysis and/or thrombectomy aresystematically stored at the acute phase (BioBank N° BB-0033-00064). We measured and compared tryptophan-derived kynurenine metabolites from blood samples ofconsecutive patients admitted in the stroke unit andwho had had a neuropsychological assessment 3 monthsor more after their stroke. Patients were then classifiedaccording to their cognitive status (Mini Mental Stateexamination, Montreal Cognitive assessment, Wais-IV,Frontal Assessment Battery, trail making test B, trail B-trail A, Rey Figure, Stroop Victoria). As a retrospectiveevaluation, the battery of tests was not standardized. Pa-tients were classified as having no cognitive decline (C-)or with global cognitive decline/executive dyfunction(C+). In addition, gender, age, infarct location, vascularrisk factors, stroke etiology according to TOAST classifi-cation [37] was collected.This study was approved by by our Institutional Re-
view Board (IRB00003888; number 20–695), and there-fore, has been performed in accordance with the ethicalstandards laid down in 1964 declaration of Helsinki andits later amendments.
Statistical analysisPrism 6 software (GraphPad, San Diego, CA) was usedfor statistical analyses. Data were expressed as mean ±SD. The Shapiro-Wilk normality test was used to testwhether data might conform to a Gaussian distribution.Data comparisons between groups were performed usingthe Wilcoxon test for pre- and post-tetanic fEPSPs inLTP experiments; t-test or Mann & Whitney test wasused to compare serum metabolites in the two groups ofpatients and effect size calculated. Fishers’exact test was
Cogo et al. Molecular Neurodegeneration (2021) 16:7 Page 5 of 20

used for comparison of their demographic and clinicaldata. Two-way ANOVA tests for repeated measureswere used to analyse sensorimotor data and learning orreversal phases from Barnes maze tests. All other evalua-tions were made using 2-way ANOVA tests with a post-hoc Tukey test. Grubb’s test was used to identify outliers.Statistical significance was set at P < 0.05. Spearman cor-relations were used to assess possible relations betweenthe kynurenine pathway and functional assessments orimmunohistochemical data, across the groups andwithin each group.
ResultsStroke diabetic mice present a more severe sensorimotordeficit that recovers by D21The neurological score of pMCAo+D mice was signifi-cantly lower on the day after arterial occlusion than onthe day before occlusion (P < 0.0001). Neurologicalscores for this group of mice were consistently worsethan those of C, D and pMCAo animals at D1, 3, 7 and14 (P < 0.0001). At day 21, sensorimotor deficit had re-covered in pMCAo mice with no significant differencesin neurological score to the other animal groups (n = 9–
10) (time effect, P < 0.0001; group effect, P < 0.0001;time*group, P < 0.0001) (Fig. 2a and Table 1).
Diabetic mice with or without stroke show increasedanxiety features; no depression is evidenced in any group(Fig. 2b-d)Having shown that sensorimotor function had recoveredat D21 after cerebral artery occlusion in pMCAo+Dmice, we asked whether anxiety or depression couldinterfere with tests of spatial memory (n = 9–10). Both Dand pMCAo+D mice were more anxious according tothe open field and marble burying task. At open field,diabetic animals with or without stroke, covered lowerdistances than control mice (P < 0.001) but were similarto pMCAo mice (diabetes effect, P < 0.0001; stroke ef-fect, P = 0.03; diabetes*stroke effect, P = 0.16) (Fig. 2b).Similarly, they buried significantly fewer marbles thancontrol mice (pMCAo+D, P < 0.01; D, P < 0.05) but dif-ferences with pMCAo mice were not significant (dia-betes effect, P = 0.0002; stroke effect, P = 0.14;diabetes*stroke effect, P = 0.58) (Fig. 2c). Since sensori-motor function had normalized at this time, residual def-icits could not be involved. Data from the splash test didnot indicate mice were in a depressive state. There were
Fig. 2 Functional evaluations were made in C, D, pMCAo and pMCAo+D mice. a From D1 to D14, the pMCAo + D group had significantly lowerneurological scores than C, D and pMCAo mice) (P < 0.0001). By D21, pMCAo + D mice had completely recovered and no significant differencesbetween groups remained. b In the open field test, at D28, the total distance travelled by pMCAo+D mice was significantly less than that of Cmice (P < 0.001) and also less for D mice than C mice (P < 0.001). c In the marble burying test, at D29, significantly fewer marbles were buried bypMCAo+D mice than by C mice (P < 0.01) and by D mice compared to C mice (P < 0.05). d There were no significant differences between the 4groups in the splash test at D29. *P < 0.05, **P < 0.01, ***P < 0.001, ****P < 0.0001
Cogo et al. Molecular Neurodegeneration (2021) 16:7 Page 6 of 20

no significant differences in grooming time between ani-mal groups (diabetes effect, P = 0.15; stroke effect, P =0.68; diabetes*stroke effect, P = 0.23) (Fig. 2d).
Only pMCAo+D mice present a cognitive decline (Fig. 3and Table 2)Animals from all four groups learned the Barnes mazetask, with significant decreases in the latency to escapebetween the 1st and the 4th training day (P < 0.0001).pMCAo+D animals took longer than non-diabeticpMCAo mice on the 1st day, the 2nd day and the 3rdday (P < 0.05), but no deficit remained on the 4th day(Fig. 3a). Spatial memory performance was not affectedat this time point (subject effect, P < 0.0001; time effect,P = 0.086; group effect, P = 0.006; interaction effect, P =0.9474).On the 7th day of the retention phase, pMCAo+D
mice took longer times to find the escape box than the
three other animal groups: C (P < 0.01), D (P < 0.01) andpMCAo mice (P < 0.001; n = 9–10) (Fig. 3b). ANOVAanalysis showed the diabetic*stroke effect was most sig-nificant (diabetic effect, P = 0.0122; stroke effect, P =0.0096; diabetic*stroke effect, P = 0.0002).pMCAo+D mice also performed poorly during the re-
versal phase. Latency for these animals to find the escapebox was significantly longer on the 8-11th days than forC (P < 0.01 for the 8th day, P < 0.05 for 9-11th days), D(P < 0.05 for the 9th and 10th day) or pMCAo mice(P < 0.01 for the 8th and 9th day, and P < 0.05 for the10th and 11th day) (Fig. 3c). ANOVA analysis suggestspMCAo+D mice (n = 9–10) do not adapt efficiently tonovel instructions (subject effect, P < 0.0001; time effect,P < 0.0001; group effect, P = 0.0025; interaction, P =0.8105).The degraded performance of pMCAo+D mice on the
spatial memory task cannot be explained by an enhancedanxiety. Diabetic mice, with or without cerebral ische-mia, had higher scores on anxiety tests but onlypMCAo+D animals were deficient in the spatial memorytest.
Long-term potentiation is impaired in mice subject tocerebral ischemiaAfter the LTP induction procedure, fEPSPs were signifi-cantly potentiated in both C (185.5 ± 91.3 μV vs. 104.9 ±53.6 μV) (n = 11) (P < 0.001) (Fig. 4a) and D mice(78.8 ± 22.0 μV vs. 58.5 ± 13.2 μV; n = 9; P = 0.05) (Fig.4b). In contrast no significant potentiation was detectedin pMCAo mice (ipsilateral hippocampus, 61.7 ± 12.9 μVvs. 63.6 ± 15.5 μV, n = 11; contralateral hippocampus,
Table 1 Sensorimotor assessment. Control mice (C), diabeticmice (D), mice subjected to permanent middle cerebral arteryocclusion (pMCAo) and diabetic mice subjected to permanentmiddle cerebral artery occlusion (pMCAo+D)
Day C(n = 10)
D(n = 9)
pMCAo(n = 10)
pMCAo + D(n = 10)
D-1 19.0 ± 0.0 19.0 ± 0.0 19.0 ± 0.0 19.0 ± 0.0
D1 19.0 ± 0.0 19.0 ± 0.0 18.2 ± 1.0 13.6 ± 2.5
D3 19.0 ± 0.0 19.0 ± 0.0 19.0 ± 0.0 13.1 ± 4.4
D7 19.0 ± 0.0 19.0 ± 0.0 19.0 ± 0.0 13.8 ± 4.0
D14 19.0 ± 0.0 19.0 ± 0.0 19.0 ± 0.0 15.2 ± 1.7
D21 19.0 ± 0.0 19.0 ± 0.0 19.0 ± 0.0 17.9 ± 2.0
Fig. 3 Spatial memory evaluated by the Barnes maze between D30 and D40. a During the learning phase, the latency to escape of pMCAo+Dmice was significantly longer on the first three days than that for the other three groups (P < 0.05) but was no longer significantly different onthe 4th day. b During the retention phase, pMCAo+D mice showed significantly longer latencies to escape than all other groups: C (P < 0.01), D(P < 0.01) and pMCAo mice (p < 0.001). c During the 4 days of the reversal phase, pMCAo+D mice showed significantly longer latencies to escapethan animals of all other groups (P < 0.05). Overall, pMCAo+D mice showed spatial memory deficits and impaired plasticity especially during theretention and reversal phases of the maze test. For the learning phase *P < 0.05 between pMCAo+D and pMCAo mice; for the retention phase,**P < 0.01, ***P < 0.001; for the reversal phase, *P < 0.05 and **P < 0.01, between pMCAo+D and C mice; # P < 0.05 and ##P < 0.01 betweenpMCAo+D and pMCAo mice; & P < 0.05, between pMCAO+D and D mice
Cogo et al. Molecular Neurodegeneration (2021) 16:7 Page 7 of 20

88.2 ± 33.5 μV vs. 62.8 ± 16.7 μV; n = 6) (Fig. 4c, d) or inpMCAo+D (ipsilateral, 65.0 ± 22.9 μV vs. 71.7 ± 29.5 μV,n = 7; contralateral hippocampus, 88.6 ± 26.0 μV vs.76.7 ± 21.2 μV; n = 5) (Fig. 4e, f). Thus stroke apparentlysuppressed LTP in both ipsilateral and contralateralhippocampus. We note that mean basal fEPSP ampli-tudes differed: 178.7 ± 42.6 μV in C mice, 143.1 ±64.6 μV in D mice, 100.1 ± 25.4 μV in pMCAo animalsand 94.6 ± 20.8 μV in pMCAo+D animals. For
comparison between groups, fEPSP amplitudes werenormalized to a percentage of the baseline (Fig. 5).
Serum and brain changes in kynurenine pathways arefound specifically in pMCAo+D miceThere were no significant differences in serum TRPlevels in different groups of animals (C mice, 36.7 ±11.0 μM; D mice, 33.2 ± 12.2 μM; pMCAo 33.9 ±10.2 μM; pMACo+D mice, 26.8 ± 9.2 μM) (n = 9–10)(diabetes effect, P = 0.14; stroke effect, P = 0.20; diabe-tes*stroke effect, P = 0.60) (Fig. 6a). No significant differ-ences in brain TRP levels in different groups of animalswere found either (n = 7–8) (diabetes effect, P = 0.24;stroke effect, P = 0.61; diabetes*stroke effect, P = 0.64)(Fig. 6d). Serum KYN levels were significantly elevatedin D mice (632 ± 307 nM) compared to C mice (379 ±107 nM) (P < 0.05) (n = 9–10) (diabetes effect, P = 0.02;stroke effect, P = 0.40; diabetes*stroke effect, P = 0.14)(Fig. 6b). Brain KYN levels were significantly higher inpMCAo+D animals than in pMCAo or C mice(P < 0.0001). They were higher in D mice than inpMCAo or C mice (P < 0.0001) (n = 7–8) (diabetes ef-fect, P < 0.0001; stroke effect, P = 0.21; diabetes*strokeeffect, P = 0.57) (Fig. 6e). Serum activity of IDO, the ratelimiting enzyme that converts TRP to KYN, was signifi-cantly higher in pMCAo+D mice (1.83 ± 0.42%) than inpMCAo (1.26 ± 0.25%; P < 0.01) or C mice (1.04 ± 0.13%;
Table 2 Barnes maze assessment. Control mice (C), diabeticmice (D), mice subjected to permanent middle cerebral arteryocclusion (pMCAo) and diabetic mice subjected to permanentmiddle cerebral artery occlusion (pMCAo + D)
Days C(n = 10)
D(n = 9)
pMCAo(n = 10)
pMCAo + D(n = 10)
1st 162.9 ± 51.5 173.4 ± 55.7 148.2 ± 25.39 189.4 ± 37.7
2nd 81.1 ± 31.5 102.5 ± 42.5 71.3 ± 40.65 113.5 ± 35.8
3rd 47.9 ± 18.1 41.7 ± 28.8 64.5 ± 20.10 83.1 ± 28.7
4th 41.4 ± 23.5 32.9 ± 11.4 33.9 ± 15.15 62.1 ± 53.7
7th 40.7 ± 21.8 28.0 ± 10.7 28.9 ± 12.6 87.6 ± 46.2
8th 60.2 ± 21.8 82.9 ± 47.0 61.5 ± 29.1 113.2 ± 32.6
9th 36.7 ± 15.2 34.1 ± 15.2 31.0 ± 38.6 84.1 ± 67.0
10th 44.6 ± 26.6 39.3 ± 13.9 38.3 ± 25.4 86.8 ± 69.7
11th 31.3 ± 16.6 36.9 ± 13.6 29.9 ± 9.5 77.0 ± 63.4
Fig. 4 Effects of pMCAo and diabetes on long-term potentiation (LTP) of CA1 field Excitatory Post-Synaptic Potentials (fEPSP) induced inhippocampal slices by tetanic stimulation of Schaffer collaterals. Graphs show fEPSP amplitudes (μV) before (pre) and after (post) tetanicstimulation in (a) control, (b) diabetic, (c, d) pMCAo and (e, f) pMCAo+D mice. LTP was assessed for both pMCAo and pMCAo+D mice inhippocampus ipsilateral (c, e) or contralateral (d, f) to the infarct. Significant synaptic LTP was detected in slices from control (P < 0.001) anddiabetic mice (P < 0.05). LTP was not induced in either ipsi- or contralateral slices from both pMCAo and pMCAo+D mice. fEPSP, field excitatorypost synaptic potential. *P < 0.05, ***P < 0.001
Cogo et al. Molecular Neurodegeneration (2021) 16:7 Page 8 of 20
P < 0.0001). IDO activity was also higher in D mice(1.88 ± 0.46%) than in pMCAo (P < 0.01) or control mice(P < 0.0001) (n = 9–10) (Fig. 6c). Diabetes alone in-creased serum IDO activity (diabetes effect, P < 0.0001;stroke effect, P = 0.45; diabetes*stroke effect, P = 0.23).Brain IDO activity was significantly higher in pMCAo+Danimals than in pMCAo mice (P < 0.01) or C mice(P < 0.01). It was higher in D mice than in pMCAo(P < 0.0001) or C mice (P < 0.001) (n = 7–8) (diabetes ef-fect, P < 0.0001; stroke effect, P = 0.16; diabetes*strokeeffect, P = 0.80) (Fig. 6f).We next assessed the KYN metabolites, KYNA and
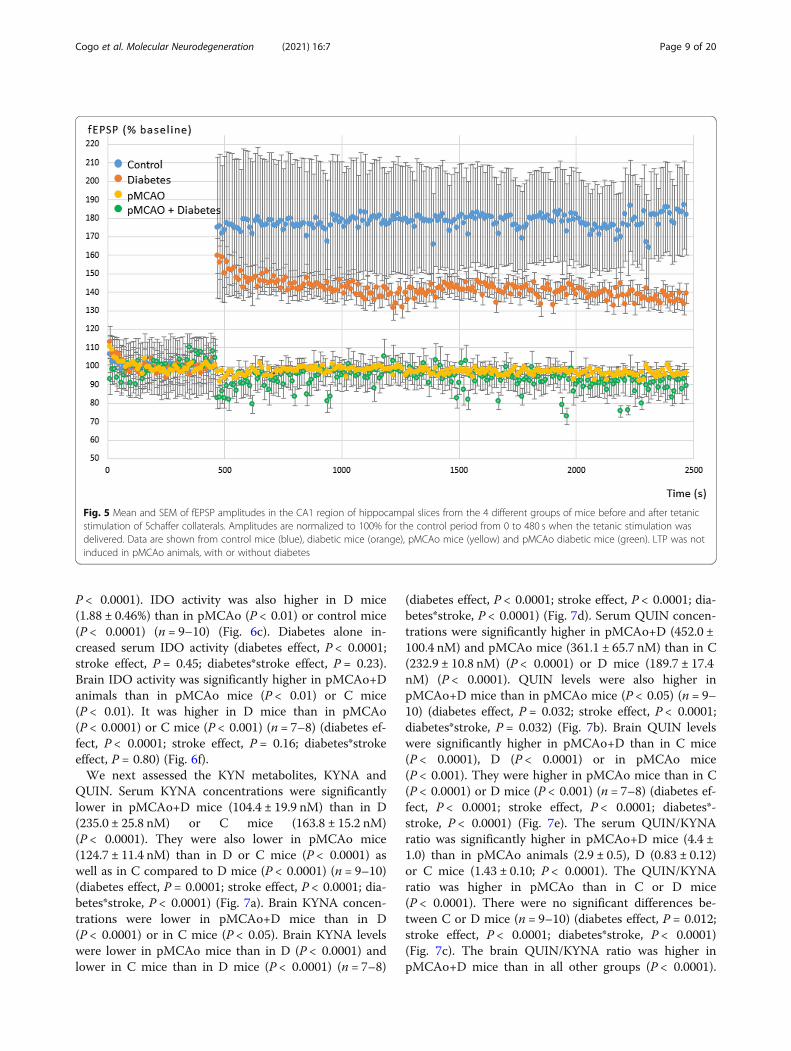
QUIN. Serum KYNA concentrations were significantlylower in pMCAo+D mice (104.4 ± 19.9 nM) than in D(235.0 ± 25.8 nM) or C mice (163.8 ± 15.2 nM)(P < 0.0001). They were also lower in pMCAo mice(124.7 ± 11.4 nM) than in D or C mice (P < 0.0001) aswell as in C compared to D mice (P < 0.0001) (n = 9–10)(diabetes effect, P = 0.0001; stroke effect, P < 0.0001; dia-betes*stroke, P < 0.0001) (Fig. 7a). Brain KYNA concen-trations were lower in pMCAo+D mice than in D(P < 0.0001) or in C mice (P < 0.05). Brain KYNA levelswere lower in pMCAo mice than in D (P < 0.0001) andlower in C mice than in D mice (P < 0.0001) (n = 7–8)
(diabetes effect, P < 0.0001; stroke effect, P < 0.0001; dia-betes*stroke, P < 0.0001) (Fig. 7d). Serum QUIN concen-trations were significantly higher in pMCAo+D (452.0 ±100.4 nM) and pMCAo mice (361.1 ± 65.7 nM) than in C(232.9 ± 10.8 nM) (P < 0.0001) or D mice (189.7 ± 17.4nM) (P < 0.0001). QUIN levels were also higher inpMCAo+D mice than in pMCAo mice (P < 0.05) (n = 9–10) (diabetes effect, P = 0.032; stroke effect, P < 0.0001;diabetes*stroke, P = 0.032) (Fig. 7b). Brain QUIN levelswere significantly higher in pMCAo+D than in C mice(P < 0.0001), D (P < 0.0001) or in pMCAo mice(P < 0.001). They were higher in pMCAo mice than in C(P < 0.0001) or D mice (P < 0.001) (n = 7–8) (diabetes ef-fect, P < 0.0001; stroke effect, P < 0.0001; diabetes*-stroke, P < 0.0001) (Fig. 7e). The serum QUIN/KYNAratio was significantly higher in pMCAo+D mice (4.4 ±1.0) than in pMCAo animals (2.9 ± 0.5), D (0.83 ± 0.12)or C mice (1.43 ± 0.10; P < 0.0001). The QUIN/KYNAratio was higher in pMCAo than in C or D mice(P < 0.0001). There were no significant differences be-tween C or D mice (n = 9–10) (diabetes effect, P = 0.012;stroke effect, P < 0.0001; diabetes*stroke, P < 0.0001)(Fig. 7c). The brain QUIN/KYNA ratio was higher inpMCAo+D mice than in all other groups (P < 0.0001).
Fig. 5 Mean and SEM of fEPSP amplitudes in the CA1 region of hippocampal slices from the 4 different groups of mice before and after tetanicstimulation of Schaffer collaterals. Amplitudes are normalized to 100% for the control period from 0 to 480 s when the tetanic stimulation wasdelivered. Data are shown from control mice (blue), diabetic mice (orange), pMCAo mice (yellow) and pMCAo diabetic mice (green). LTP was notinduced in pMCAo animals, with or without diabetes
Cogo et al. Molecular Neurodegeneration (2021) 16:7 Page 9 of 20

The ratio was significantly higher in pMCAo mice thanin D (P < 0.0001) or C mice (P < 0.01) (n = 7–8) (dia-betes effect, P < 0.01; stroke effect, P < 0.0001; diabetes*-stroke, P < 0.0001) (Fig. 7f).Overall, these data reveal significant increases in
serum QUIN concentrations and QUIN/KYNA ratio inpMCAo+D mice compared to all other animal groupsthat mirror the same increased concentrations in thebrain.
pMCAo exacerbates neuronal death in ipsilateralhippocampusFluorojade staining was used to label degenerating neu-rons at D40 after stroke (Fig. 8a). In ipsilateral hippo-campus, numbers of degenerating cells were significantlyhigher in pMCAo+D mice (106.8 ± 75.0) than in C(2.1 ± 5.7) (P < 0.0001) or D mice (13.2 ± 24.2)(P < 0.001). There were significantly more degeneratingneurons in pMCAo animals than in C or D mice(P < 0.01) (n = 9–10). There was no significant differencebetween pMCAo mice and pMCAo+D mice (89.6 ±44.6) (n = 9–10) (Fig. 8b). This data suggests that neur-onal degeneration in ipsilateral hippocampus is moststrongly linked to the stroke effect (diabetes effect, P =0.35; stroke effect, P < 0.0001; diabetes*stroke, P = 0.84).
A similar picture was evidenced in contralateral hippo-campus. There were significantly more Fluorojade+ neu-rons in pMCAo+D mice (78.8 ± 63.5) than in C (0.3 ±1.0) (P < 0.001) or D mice (6.1 ± 13.6) (P < 0.01). Num-bers of Fluorojade+ cells were significantly higher inpMCAo (53.7 ± 37.6) than in C mice (P < 0.05) (n = 9–10) but differences between D and pMCAo mice werenot significant (Fig. 8c) (diabetes effect, P = 0.22; strokeeffect, P < 0.0001; diabetes*stroke, P = 0.44). Thus, strokeinduction induced neuronal degeneration in both hippo-campi, far from the infarct and peri-infarct area.
Microglia/macrophage density is increased ipsilaterally inall pMCAo miceMicroglia/macrophages were quantified as Iba1+ cells inthe peri-infarct area, striatum and hippocampus, bothipsilateral and contralateral to the lesion (Fig. 9a, b). Wehypothesize that inflammation may be mediated at sitesremote from a unilateral cortical lesion by activated im-mune cells, or via cytokines they release.In the peri-infarct area, microglia/macrophage density
was significantly increased in pMCAo+D mice (76.0 ±21.1 a.u.) compared to C (12.6 ± 6.4 a.u.), D (14.4 ± 10.6a.u.) (P < 0.0001) or pMCAo mice (52.4 ± 22.3 a.u.)(P < 0.05). Density was higher in pMCAo mice than in C
Fig. 6 Serum and brain changes of the tryptophan (TRP) and kynurenine (KYN) concentrations and indoleamine 2, 3-dioxygenase (IDO) activity inpMCAo+D mice. These elements of the tryptophan/kynurenine pathway are shown at the left. a-f show changes in concentrations or activity ofthese molecules in the C, D, pMCAo and pMCAo+D mice, in serum (a, b, c) and brain (d, e, f). a Serum TRP levels did not differ between the fourgroups. b Serum KYN levels were significantly higher in D than in C mice (P < 0.05). c Serum IDO activity was significantly higher in pMCAo+Danimals than in pMCAo mice (P < 0.01) or C mice (P < 0.0001). It was higher in D mice than in pMCAo (P < 0.01) or C mice (P < 0.0001). d BrainTRP levels did not differ between the four groups. e Brain KYN levels were significantly higher in pMCAo+D animals than in pMCAo or C mice(P < 0.0001). They were higher in D mice than in pMCAo or C mice (P < 0.0001). f Brain IDO activity was significantly higher in pMCAo+D animalsthan in pMCAo mice (P < 0.01) or C mice (P < 0.01). It was higher in D mice than in pMCAo (P < 0.0001) or C mice (P < 0.001) (*P < 0.05,**P < 0.01, ***P < 0.001, ****P < 0.0001)
Cogo et al. Molecular Neurodegeneration (2021) 16:7 Page 10 of 20
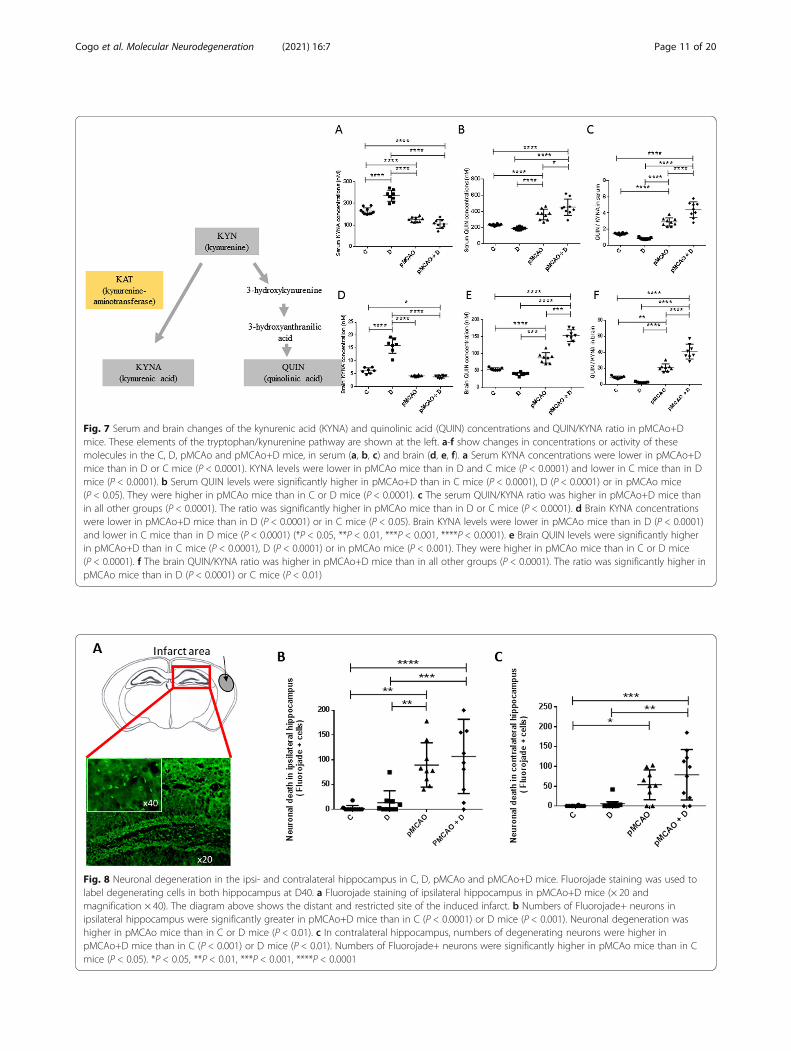
Fig. 7 Serum and brain changes of the kynurenic acid (KYNA) and quinolinic acid (QUIN) concentrations and QUIN/KYNA ratio in pMCAo+Dmice. These elements of the tryptophan/kynurenine pathway are shown at the left. a-f show changes in concentrations or activity of thesemolecules in the C, D, pMCAo and pMCAo+D mice, in serum (a, b, c) and brain (d, e, f). a Serum KYNA concentrations were lower in pMCAo+Dmice than in D or C mice (P < 0.0001). KYNA levels were lower in pMCAo mice than in D and C mice (P < 0.0001) and lower in C mice than in Dmice (P < 0.0001). b Serum QUIN levels were significantly higher in pMCAo+D than in C mice (P < 0.0001), D (P < 0.0001) or in pMCAo mice(P < 0.05). They were higher in pMCAo mice than in C or D mice (P < 0.0001). c The serum QUIN/KYNA ratio was higher in pMCAo+D mice thanin all other groups (P < 0.0001). The ratio was significantly higher in pMCAo mice than in D or C mice (P < 0.0001). d Brain KYNA concentrationswere lower in pMCAo+D mice than in D (P < 0.0001) or in C mice (P < 0.05). Brain KYNA levels were lower in pMCAo mice than in D (P < 0.0001)and lower in C mice than in D mice (P < 0.0001) (*P < 0.05, **P < 0.01, ***P < 0.001, ****P < 0.0001). e Brain QUIN levels were significantly higherin pMCAo+D than in C mice (P < 0.0001), D (P < 0.0001) or in pMCAo mice (P < 0.001). They were higher in pMCAo mice than in C or D mice(P < 0.0001). f The brain QUIN/KYNA ratio was higher in pMCAo+D mice than in all other groups (P < 0.0001). The ratio was significantly higher inpMCAo mice than in D (P < 0.0001) or C mice (P < 0.01)
Fig. 8 Neuronal degeneration in the ipsi- and contralateral hippocampus in C, D, pMCAo and pMCAo+D mice. Fluorojade staining was used tolabel degenerating cells in both hippocampus at D40. a Fluorojade staining of ipsilateral hippocampus in pMCAo+D mice (× 20 andmagnification × 40). The diagram above shows the distant and restricted site of the induced infarct. b Numbers of Fluorojade+ neurons inipsilateral hippocampus were significantly greater in pMCAo+D mice than in C (P < 0.0001) or D mice (P < 0.001). Neuronal degeneration washigher in pMCAo mice than in C or D mice (P < 0.01). c In contralateral hippocampus, numbers of degenerating neurons were higher inpMCAo+D mice than in C (P < 0.001) or D mice (P < 0.01). Numbers of Fluorojade+ neurons were significantly higher in pMCAo mice than in Cmice (P < 0.05). *P < 0.05, **P < 0.01, ***P < 0.001, ****P < 0.0001
Cogo et al. Molecular Neurodegeneration (2021) 16:7 Page 11 of 20

or D animals (P < 0.001) (n = 8–9) (diabetes effect, P =0.0133; stroke effect, P < 0.0001; diabetes*stroke, P =0.06) (Fig. 9c). We found no differences between groupsin contralateral equivalent region (n = 7–9) (diabetes ef-fect, P = 0.31; stroke effect, P = 0.98; diabetes*stroke,P = 0.64) (Fig. 9d).In ipsilateral striatum, microglia/macrophage density
was significantly increased in pMCAo+D (15.5 ± 6.7 a.u.)and pMCAo mice (14.1 ± 7.5 a.u.) compared to C mice(5.6 ± 4.4 a.u.) (P < 0.05). Anova analysis revealed strokewas most significantly linked to this observation (dia-betes effect, P = 0.32; stroke effect, P = 0.0009; diabetes*-stroke, P = 0.72) (n = 6–9) (Fig. 9e). We found nodifferences between groups in the contralateral striatum(n = 7–8) (diabetes effect, P = 0.87; stroke effect, P =0.26; diabetes*stroke, P = 0.09) (Fig. 9f).In ipsilateral hippocampus, microglia/macrophage
density was not significantly different between animalgroups (n = 6–9) (diabetes effect, P = 0.49; stroke effect,P = 0.0062; diabetes*stroke, P = 0.70) (Fig. 9g). In contra-lateral hippocampus, microglia/macrophage density wassignificantly increased in pMCAo mice (9.1 ± 3.4 a.u.)compared to C mice (4.9 ± 1.6 a.u.) (P < 0.05) (n = 7–8)(diabetes effect, P = 0.94; stroke effect, P = 0.0047; diabe-tes*stroke, P = 0.31) (Fig. 9h).
These data show that at D40, microglia/macrophagedensities remain elevated in the peri-infarct area, less inremote regions such as striatum and not in hippocam-pus. Immune cell density was unaffected in contralateralbrain regions, except in the hippocampus of stroke mice.
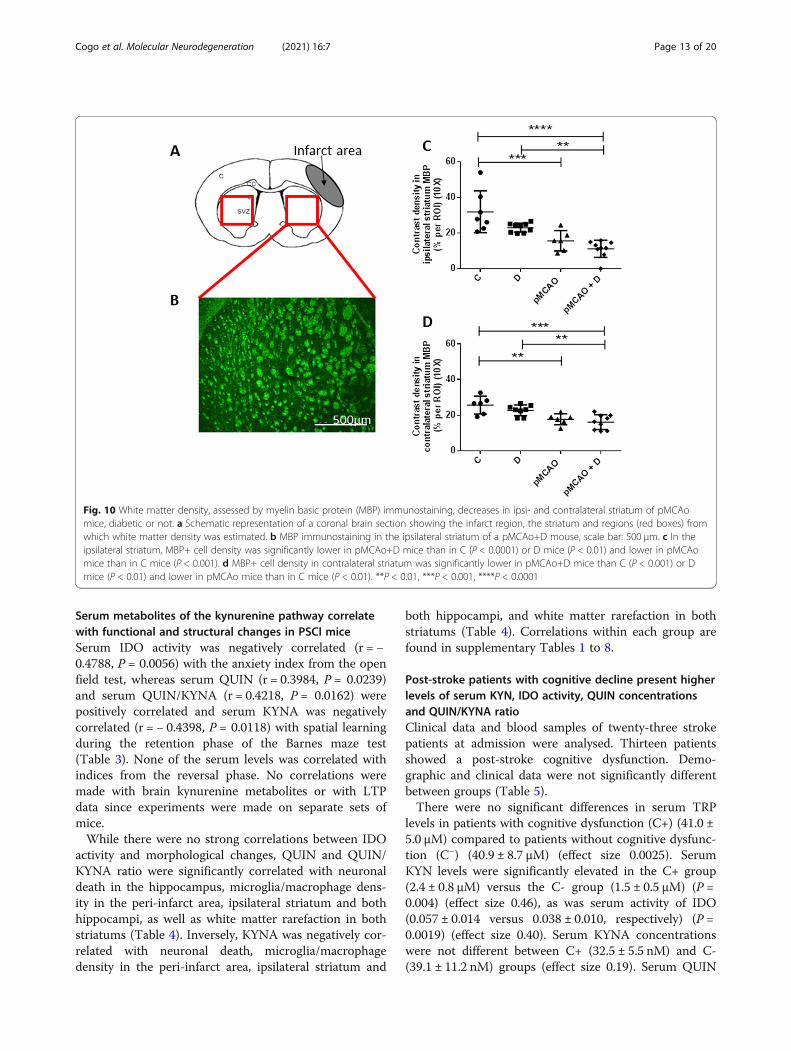
pMCAo induces rarefaction of white matter in bothstriatumWe quantified MBP+ cells in both striatum to providean index of white matter density (Fig. 10a, b). MBP+cells contrast density was significantly lower in the ipsi-lateral striatum of pMCAo+D mice (11.2 ± 4.9 a.u.) thanin C (31.9 ± 11.7 a.u.) (P < 0.0001) or D mice (23.0 ± 2.5a.u.) (P < 0.01). MBP+ cell contrast density was lower inpMCAo (15.6 ± 5.7 a.u.) than in C mice (P < 0.001) (n =6–9) (diabetes effect, P = 0.01; stroke effect, P < 0.0001;diabetes*stroke, P = 0.36) (Fig. 10c).In contralateral striatum, MBP+ cells contrast density
was significantly lower in pMCAo+D (16.1 ± 4.2 a.u.)than in C (25.7 ± 5.0 a.u.) (P < 0.001) or D mice (22.8 ±3.0 a.u.) (P < 0.01). MBP+ cell contrast density was lowerin pMCAo (17.7 ± 3.1 a.u.) than in C mice (P < 0.01)(n = 6–9) (diabetes effect, P = 0.14; stroke effect,P < 0.0001; diabetes*stroke, P = 0.64) (Fig. 10d).
Fig. 9 Microglial/macrophage infiltration is most strong in the ipsilateral peri-infarct area of pMCAo+D mice. Microglial/macrophages werestained by Iba1 immunostaining. a Schematic representation of the infarct area at 2 levels of a coronal brain section and regions (red boxes) fromwhich numbers of stained cells were estimated. c, cortex; CC, corpus callosum; V, ventricle; SVZ, subventricular zone. b Iba1 immunostaining inpMCAo + D mice, ramified Iba1+ cells in the peri-infarct area and amoeboid Iba1+ cells in the core of the infarct; scale bar: 100 μm. c In the peri-infarct area, microglia/macrophages density was significantly higher in pMCAo+D mice than in C, D (P < 0.0001) or pMCAo mice (P < 0.05). Celldensity was higher in pMCAo mice than in C or D mice (P < 0.001). d No significant differences were evidenced in the contralateral mirror regionof the infarct. e Iba1+ cell density was higher in ipsilateral striatum of pMCAo+D mice than for C mice and in pMCAo mice than for C mice(P < 0.05). f No significant differences in cell density were detected in contralateral striatum for the different animal groups.g No significantdifferences in cell density were evidenced in ipsilateral hippocampus. h Iba1+ cell density was higher in contralateral hippocampus of pMCAomice than in C mice. P < 0.05, *P < 0.05, ***P < 0.001, ****P < 0.0001
Cogo et al. Molecular Neurodegeneration (2021) 16:7 Page 12 of 20
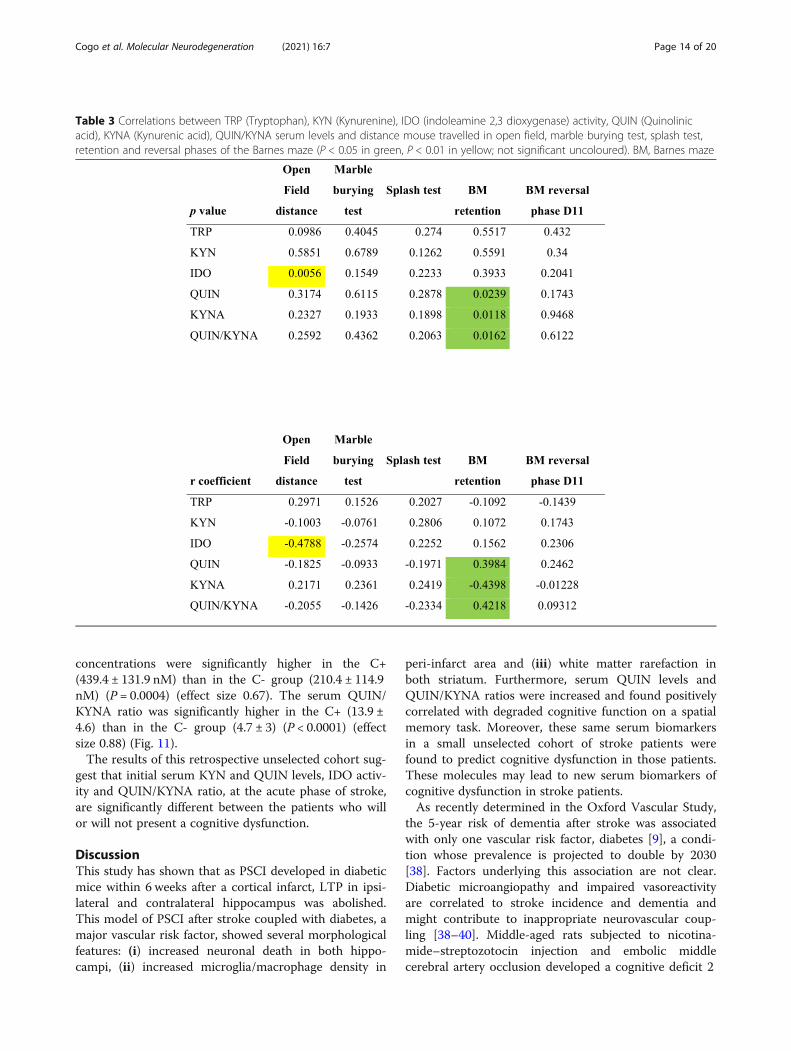
Serum metabolites of the kynurenine pathway correlatewith functional and structural changes in PSCI miceSerum IDO activity was negatively correlated (r = −0.4788, P = 0.0056) with the anxiety index from the openfield test, whereas serum QUIN (r = 0.3984, P = 0.0239)and serum QUIN/KYNA (r = 0.4218, P = 0.0162) werepositively correlated and serum KYNA was negativelycorrelated (r = − 0.4398, P = 0.0118) with spatial learningduring the retention phase of the Barnes maze test(Table 3). None of the serum levels was correlated withindices from the reversal phase. No correlations weremade with brain kynurenine metabolites or with LTPdata since experiments were made on separate sets ofmice.While there were no strong correlations between IDO
activity and morphological changes, QUIN and QUIN/KYNA ratio were significantly correlated with neuronaldeath in the hippocampus, microglia/macrophage dens-ity in the peri-infarct area, ipsilateral striatum and bothhippocampi, as well as white matter rarefaction in bothstriatums (Table 4). Inversely, KYNA was negatively cor-related with neuronal death, microglia/macrophagedensity in the peri-infarct area, ipsilateral striatum and
both hippocampi, and white matter rarefaction in bothstriatums (Table 4). Correlations within each group arefound in supplementary Tables 1 to 8.
Post-stroke patients with cognitive decline present higherlevels of serum KYN, IDO activity, QUIN concentrationsand QUIN/KYNA ratioClinical data and blood samples of twenty-three strokepatients at admission were analysed. Thirteen patientsshowed a post-stroke cognitive dysfunction. Demo-graphic and clinical data were not significantly differentbetween groups (Table 5).There were no significant differences in serum TRP
levels in patients with cognitive dysfunction (C+) (41.0 ±5.0 μM) compared to patients without cognitive dysfunc-tion (C−) (40.9 ± 8.7 μM) (effect size 0.0025). SerumKYN levels were significantly elevated in the C+ group(2.4 ± 0.8 μM) versus the C- group (1.5 ± 0.5 μM) (P =0.004) (effect size 0.46), as was serum activity of IDO(0.057 ± 0.014 versus 0.038 ± 0.010, respectively) (P =0.0019) (effect size 0.40). Serum KYNA concentrationswere not different between C+ (32.5 ± 5.5 nM) and C-(39.1 ± 11.2 nM) groups (effect size 0.19). Serum QUIN
Fig. 10 White matter density, assessed by myelin basic protein (MBP) immunostaining, decreases in ipsi- and contralateral striatum of pMCAomice, diabetic or not. a Schematic representation of a coronal brain section showing the infarct region, the striatum and regions (red boxes) fromwhich white matter density was estimated. b MBP immunostaining in the ipsilateral striatum of a pMCAo+D mouse, scale bar: 500 μm. c In theipsilateral striatum, MBP+ cell density was significantly lower in pMCAo+D mice than in C (P < 0.0001) or D mice (P < 0.01) and lower in pMCAomice than in C mice (P < 0.001). d MBP+ cell density in contralateral striatum was significantly lower in pMCAo+D mice than C (P < 0.001) or Dmice (P < 0.01) and lower in pMCAo mice than in C mice (P < 0.01). **P < 0.01, ***P < 0.001, ****P < 0.0001
Cogo et al. Molecular Neurodegeneration (2021) 16:7 Page 13 of 20
concentrations were significantly higher in the C+(439.4 ± 131.9 nM) than in the C- group (210.4 ± 114.9nM) (P = 0.0004) (effect size 0.67). The serum QUIN/KYNA ratio was significantly higher in the C+ (13.9 ±4.6) than in the C- group (4.7 ± 3) (P < 0.0001) (effectsize 0.88) (Fig. 11).The results of this retrospective unselected cohort sug-
gest that initial serum KYN and QUIN levels, IDO activ-ity and QUIN/KYNA ratio, at the acute phase of stroke,are significantly different between the patients who willor will not present a cognitive dysfunction.
DiscussionThis study has shown that as PSCI developed in diabeticmice within 6 weeks after a cortical infarct, LTP in ipsi-lateral and contralateral hippocampus was abolished.This model of PSCI after stroke coupled with diabetes, amajor vascular risk factor, showed several morphologicalfeatures: (i) increased neuronal death in both hippo-campi, (ii) increased microglia/macrophage density in
peri-infarct area and (iii) white matter rarefaction inboth striatum. Furthermore, serum QUIN levels andQUIN/KYNA ratios were increased and found positivelycorrelated with degraded cognitive function on a spatialmemory task. Moreover, these same serum biomarkersin a small unselected cohort of stroke patients werefound to predict cognitive dysfunction in those patients.These molecules may lead to new serum biomarkers ofcognitive dysfunction in stroke patients.As recently determined in the Oxford Vascular Study,
the 5-year risk of dementia after stroke was associatedwith only one vascular risk factor, diabetes [9], a condi-tion whose prevalence is projected to double by 2030[38]. Factors underlying this association are not clear.Diabetic microangiopathy and impaired vasoreactivityare correlated to stroke incidence and dementia andmight contribute to inappropriate neurovascular coup-ling [38–40]. Middle-aged rats subjected to nicotina-mide–streptozotocin injection and embolic middlecerebral artery occlusion developed a cognitive deficit 2
Table 3 Correlations between TRP (Tryptophan), KYN (Kynurenine), IDO (indoleamine 2,3 dioxygenase) activity, QUIN (Quinolinicacid), KYNA (Kynurenic acid), QUIN/KYNA serum levels and distance mouse travelled in open field, marble burying test, splash test,retention and reversal phases of the Barnes maze (P < 0.05 in green, P < 0.01 in yellow; not significant uncoloured). BM, Barnes maze
Cogo et al. Molecular Neurodegeneration (2021) 16:7 Page 14 of 20

months after diabetes induction and one month afterstroke, reduced spine density and dendritic arborisationin hippocampal neurons and aggravated neurovasculardisruption [18]. Moreover, we have previously shown anunbalance between brain pro- and anti-inflammatory cy-tokines in diabetic mice subjected to pMCAo, with ashift towards a higher inflammatory response (IL-1β,MCP1, IL-6 and TNFα) [21]. This pro-inflammatoryshift could explain aggravating effects of diabetes inpost-stroke recovery of patients [41] and rodents [16]. Itmay be linked to the increased IDO activity detected indiabetic mice. IDO, a key enzyme in the conversion ofTRP into KYN is activated by pro-inflammatory cyto-kines such as IFNγ, IL-1, IL-6 [42], and inhibited byanti-inflammatory cytokines such as IL-4 [43]. IDO ac-tivity is then assumed to reflect inflammation [44]. Ourdata support this view in that IDO activity levels werecorrelated with the open field index of anxiety, which
Table 4 Correlations between TRP (Tryptophan), KYN (Kynurenine), IDO (indoleamine 2,3 dioxygenase) activity, QUIN (Quinolinicacid), KYNA (Kynurenic acid), QUIN/KYNA serum levels and neuronal death, microglia/macrophages infiltration, and white matterdensity. Ipsi, ipsilateral; Hip, hippocampus; Contra, contralateral; MBP, Myelin Basic Protein (P < 0.05 in green, P < 0.01 in yellow,P < 0.001 in orange, P < 0.0001 in red; not significant uncolored)
Table 5 Demographic and clinical data of patients without (C-)or with (C+) post-stroke cognitive decline. F, female; M, male
C- patients (n = 10) C+ patients (n = 13) P
Gender (F/M) 4/6 5/8 1
Mean age ± SD(years)
64.7 ± 13.3 69.4 ± 17.8 0.38
Diabetes 1 2 1
Hypertension 5 8 0.685
Fibrinolysis 8 12 0.5596
Thrombectomy 5 6 1
Anterior circulation 7 13 0.4561
Posteriorcirculation
3 0 0.0678
Cardio-embolic 4 6 1
Atheroma 4 5 1
Undetermined 2 2 1
Cogo et al. Molecular Neurodegeneration (2021) 16:7 Page 15 of 20

was enhanced in diabetic mice with or without stroke.IDO activity was not correlated with spatial memory im-pairment, neuronal loss, microglia/macrophage prolifera-tion or white matter rarefaction. This finding contrastswith a clinical study [22] suggesting that IDO activity iscorrelated to cognitive decline at one month post-stroke.Direct comparison is difficult since while 27% of studiedpatients were diabetic, 85% of patients were hypertensiveand little is known on how distinct vascular risk factorsaffect IDO activity.As serum IDO did not discriminate between mice with
or without post-stroke cognitive impairment, we nextstudied metabolites produced by the kynurenine path-way, including QUIN and KYNA active in glutamatergictransmission. QUIN, largely produced by activatedmicroglia/macrophages, is a neurotoxic NMDA receptor
agonist [23, 24]. KYNA, mainly produced by astrocytes[45], in contrast is an NMDA receptor antagonist. It isconsidered neuro-protective [25], as it attenuates ische-mia induced learning deficits in the rat [46]. We foundserum and brain QUIN levels were highest in stroke-diabetic mice. In these animals, numbers of microglia/macrophages, which produce QUIN, were significantlyhigher in the peri-infarct area [47]. Conversely, serumKYNA levels were significantly decreased in pMCAomice with or without diabetes. We thus evaluated the ra-tio of these two KYN metabolites, QUIN/KYNA, whichwas dramatically higher in stroke-diabetic mice than inall other groups. The serum ratio was positively corre-lated with degraded spatial memory performance, hippo-campal neuronal death and microglia/macrophageinfiltration in both hippocampi, the peri-infarct and
Fig. 11 Serum changes of the tryptophane (TRP) (a) and kynurenine (KYN) (b) concentrations, indoleamine 2, 3-dioxygenase (IDO) activity (c),kynurenic acid (KYNA) (d) and quinolinic acid (QUIN) (e) concentrations and QUIN/KYNA ratios (f) in patients without (C-) or with (C+) cognitivedecline. There were no significant differences in serum TRP (a) or KYNA concentrations (d) between patients. Serum levels of KYN (b) (P < 0.01),IDO enzymatic activity (c) (P < 0.01), QUIN (e) (P < 0.001), and QUIN/KYNA (f) (P < 0.0001) were significantly elevated in the C+ group compared tothe C- group. **P < 0.01, ***P < 0.001, ****P < 0.0001
Cogo et al. Molecular Neurodegeneration (2021) 16:7 Page 16 of 20

ipsilateral striatal areas, and white matter rarefaction.Serum QUIN levels were also positively correlated withthese indices, while correlations were negative for serumKYNA concentrations.Interestingly, these serum kynurenine pathway metab-
olites closely mirrored brain concentrations. They maycontribute to our data on synaptic plasticity, eventhough our data do not permit proper comparison sinceLTP was tested in a separate set of mice. An enhancedQUIN/KYNA ratio could favor neurotoxic rather thanprotective effects with an increase in NMDA receptoractivation. Recent work with the pMCAo mice model, inthe absence of diabetes, revealed remodelling of hippo-campal circuitry consequent on stroke-induced neuro-genesis. These data supported the loss of hippocampus-dependent memory, but synaptic plasticity was not ex-amined [48].We evaluated hippocampal-dependent spatial memory
[49] using the Barnes maze test as in our previous workson models of Alzheimer’s disease and stroke [21, 50].Strikingly, we found impaired performances in the reten-tion and reversal phases of the task were associated withsuppression of LTP in ipsi- and contralateral hippocam-pus in pMCAo mice, with or without diabetes. Thesedata imply that cerebral ischemia exerts sustained ac-tions over time, at a distance from the infarct area. Pos-sibly products of biochemical cascades triggered byischemia diffused to both hippocampi, induced neuronaldeath and suppressed synaptic plasticity. We suggestthat inflammatory signalling induced by stroke and en-hanced by diabetes [21], evidenced here as higher serumQUIN levels and QUIN/KYNA ratios, should be a targetof novel stroke therapies. For instance, peripheral ad-ministration of the soluble TNF inhibitor XPro1595 hasbeen shown to rescue impaired LTP in 5xFAD mice, amouse model of Alzheimer’s disease, together with a de-creased beta-amyloid load [51]. Further, we have shownthat long term memory impairment is prevented by theimmunomodulatory drug Glatiramer acetate [21],already FDA approved in multiple sclerosis. Overall,these data confirm a key role for inflammation in cogni-tive decline. QUIN inhibitors administration may be analternative approach and we plan to study this questionin detail.Ischemic stroke was modelled in this work using the
pMCAo model rather than using the ischemia/reperfu-sion model transient MCAo (tMCAO). This choice en-sured that the infarct spared the hippocampus.Moreover, mortality is much lower in diabetic pMCAomice than in diabetic tMCAo animals. A further advan-tage of the pMCAo model is that mice had completelyrecovered from sensorimotor deficit when cognitive as-sessment was made, so data of the Barnes maze testcould be interpreted without bias. We wished also to
develop a clinically relevant model and post-stroke re-canalization induced in the tMCAO procedure is presentin only a minority of patients [52]. Moreover, even smallischemic cortical lesions are associated with significantcognitive impairment in animal models [53, 54] as in pa-tients [9, 55] as we have shown here.While the mechanisms of PSCI are not completely re-
solved, our data have shown a strong link to the kynure-nine pathway. Within this pathway, we showed serumand brain levels of TRP did not differ between groups.Serotonin signalling has been linked to post-stroke re-covery [56], since selective serotonin reuptake inhibitorsimprove motor function in stroke patients [57], and en-hance excitatory synaptic transmission in rat hippocam-pus [32]. However, such serotonin based treatments arestill debated. Discrepancies in trials of these therapieshave been attributed to heterogeneity between protocols,methodological limitations [56] and the small cohortsizes [58]. Our data also suggest that the TRP down-stream metabolites should rather be targeted rather thanserotonin and that this could explain the lack of effi-ciency in some trials. In the clinical study we conductednext, we showed that this pathway is promising, butneeds larger multicentre confirmatory studies. Indeed, inthis small cohort, diabetes was only found in 3 out ofthe 23 patients and its role per se in the development ofthe cognitive impairement remains difficult to assess aswe did in our model. Another hypothesis would be thatdiabetes in our murine model increases the inflamma-tory post-stroke status, that might exist in humans,whatever the vascular risk factor. Our working hypoth-esis was that post-stroke inflammation may trigger re-mote and delayed dysfunctions and lesions responsiblefor cognitive decline as also suggested by the work per-formed by Doyle et al. [53]. It could be that in ourmouse stroke model, diabetes ensures a higher level ofpost-stroke brain inflammation as we have shown previ-ously [21] and that the level of inflammation is compar-able to the one encountered in older patients who mayalso combine other comorbidities (hypertension, meta-bolic syndrome, etc) that could also contribute to in-creased inflammation. This hypothesis is reinforced byculture cells experiments performed by Du et al. [59],showing an interspecies difference in the inflammatoryresponse of microglial cells in conditions of oxygen-glucose deprivation, human cells upregulating a highernumber of genes involved in inflammation than mousecells. The additive impact of age, comorbidities and vas-cular risk factors in particular on brain inflammationand subsequently PSCI has yet to be determined. More-over, as all patients were admitted for fibrinolysis andpotential thrombectomy because of proximal artery oc-clusion indicates that this selected cohort is more severethan the classical stroke population. At last, as clinical
Cogo et al. Molecular Neurodegeneration (2021) 16:7 Page 17 of 20

data were collected retrospectively, the neuropsycho-logical investigation was very heterogeneous; we cannotexclude either that some of the patients already pre-sented a cognitive decline before stroke. A new largerstudy to confirm these data should be designedprospectively.Clinically, the kynurenine pathway has been linked to
Alzheimer’s disease. KYNA levels in CSF have beenshown to be significantly reduced, although QUIN con-centrations were not elevated [60]. Further, QUIN im-munoreactivity has been shown to be enhanced in thehippocampus of patients with Alzheimer’s disease [61].In this study, changes in the QUIN level and the QUIN/KYNA ratio were robust and we suggest they may serveas a reliable biomarker for PSCI in patients. They fulfilall the necessary criteria for a biomarker: they are re-leased from damaged tissue and elevated in blood, repro-ducible fashion providing an index, which can be easilymeasured and interpreted and serve as reliable indicatorof pathogenic processes [62].We should note some limitations of the present
study. While our current data show that IDO activityincreases in stroke-diabetic mice and previous workhas revealed enhanced levels of pro-inflammatory cy-tokines in stroke-diabetic mice [21], further details oninnate and adaptive immune responses in the hippo-campus in particular, are needed to completelycharacterize PSCI inflammation. We did not eitherdirectly evaluate the essential pyridine nucleotide endproduct, NAD+, produced by the kynurenine pathwayand with a major role in cell homeostasis [63]. Atlast, the discrepancy of sex and age between mice(only young adult males) in our preclinical study andthe cohort of patients in early 60s, including femalesand males, may limit the translational impact of ourstudy. Our primary aim was to build a PSCI preclin-ical model that shares common characteristics withthose encountered in patients and then, in a transla-tional purpose, we wished to validate experimentaldata on QUIN and QUIN/KYNA in a small explora-tory cohort of patients. Despite sex and age differ-ences between the two species, we found similarmodifications of the biomarkers QUIN and QUIN/KYNA in mice and in patients with PSCI. Neverthe-less, a large prospective clinical study is mandatory toconfirm these preliminary results and the effects ofage and sex should be specifically studied in mice, asrecommended by the STAIR preclinical recommenda-tions [64].
ConclusionsThis well characterized PSCI model is a close mimic ofthe clinical setting and accurately encompasses patho-physiological aspects of the syndrome. It will provide a
realistic setting to develop a specific QUIN inhibitor asproposed in one preclinical work [46]. There are cur-rently no therapeutic options to cure or prevent PSCI.Limiting the size of the triggering stroke is not sufficient[9]. Large prospective clinical studies are now needed toconfirm our preliminary data in stroke patients, whichshow that serum QUIN concentrations and QUIN/KYNA ratios are reliable biomarkers to predict PSCI andask whether these indices are predictive biomarkers of ahigher risk or severity of the syndrome. Clinical work toprovide a useful biomarker will most importantly needto define an accurate cut-off value beyond which theserum biomarker is reliably correlated with PSCIdevelopment.
Supplementary InformationThe online version contains supplementary material available at https://doi.org/10.1186/s13024-020-00421-4.
Additional file 1.
AbbreviationsaCSF: Artificial cerebrospinal fluid; BM: Barnes maze; C: Control mice;CA1: Cornu ammonis 1; D: Diabetes; fEPSP: Field excitatory post synapticpotential; Iba1: Ionized calcium binding adaptor molecule 1; IDO: Indolamine2,3-dioxygénase; IFN: InTERFERON; IL: Interleukin; IP: Intra-peritoneal;KYN: Kynurenine; KYNA: Kynurenic acid; LTP: Long-term potentiation;MBP: Myelin basic protein; MEA: Multi-electrode array; MRI: Magneticresonance imaging; NMDA: N-methyl-D-aspartic acid; pMCAo: Permanentmiddle cerebral artery occlusion; pMCAo+D: Permanent middle cerebralartery occlusion in diabetic mice; PSCI: Post stroke cognitive impairment;QUIN: Quinolinic acid; TRP: Tryptophan; VCI: Vascular cognitive impairment
AcknowledgementsWe thank Richard Miles for help in editing the english manuscript.
Availability of data and materialsData sets used and analysed during the current study area available from thecorresponding author upon reasonable request.
Authors’ contributionsAC carried out the experiments, analysed and interpreted data, generatedfigures and participated in writing the manuscript. GM carried out thecognitive assessment. BM participated in data interpretation and in writingthe manuscript. MM and HC gave clinician expertize. JC and JML performedthe biochemical dosages and participated in data interpretation, GHparticipated in the electrophysiological recordings, data interpretation and inwriting the manuscript. NK conceived and designed the study, interpretedthe data and wrote the manuscript. All authors have read and approved thefinal manuscript
FundingThis work was supported by the French National Institute for Health andMedical Research INSERM, a public grant overseen by the French NationalResearch Agency (ANR) as part of the Investments for the Future program(PIA) under grant agreement No. ANR-18-RHUS-0001. Adrien Cogo wasfunded by the French Ministry of Higher Education and Research. GabrielleMangin was funded from the European Union’s Horizon 2020 research andinnovation programme under grant agreement No 681044 RESSTORE project(www.resstore.eu) and Benjamin Maïer by the research scholarship AnnéeRecherche, Assistance Publique-Hôpitaux de Paris.
Ethics approval and consent to participateAll experiments and surgical procedures were performed according to theEuropean Community Directive (2010/63/EU) and the French National
Cogo et al. Molecular Neurodegeneration (2021) 16:7 Page 18 of 20
guidelines for the care and use of laboratory animals. The study wasspecifically approved by the Local Ethics Committee in AnimalExperimentation and by the French ministry of Higher Education forResearch and Innovation (APAFIS#4100-2015111714376561v6). Thepatients’study was approved by by our Institutional Review Board(IRB00003888; number 20–695), and therefore, has been performed inaccordance with the ethical standards laid down in 1964 declaration ofHelsinki and its later amendments.
Consent for publicationThe patients’study was approved by by our Institutional Review Board(IRB00003888; number 20–695), and therefore, has been performed inaccordance with the ethical standards laid down in 1964 declaration ofHelsinki and its later amendments.
Competing interestsThe authors declare that they have no competiting interests.
Author details1Université de Paris, INSERM U1148, Laboratory for Vascular TranslationalScience, F-75018 Paris, France. 2Université de Paris, INSERM U965, CART,F-75010 Paris, France. 3Université de Paris, Inserm UMR-S 942; Départementde Biochimie et de Biologie Moléculaire, APHP, Hôpital Lariboisière, F-75010Paris, France. 4Service de Neurologie, APHP, Hôpital Lariboisière, F-75010Paris, France. 5Neuroglial Interactions in Cerebral Physiopathology, Center forInterdisciplinary Research in Biology, Collège de France, CNRS UMR 7241,INSERM U1050, Labex Memolife, PSL Research University, F-75005 Paris,France. 6Clinical Neurophysiology department, APHP, Pitie-SalpetriereHospital, Sorbonne Université, APHP, F-75013 Paris, France. 7Service dePhysiologie Clinique-Explorations Fonctionnelles, DMU DREAM, APHP, HôpitalLariboisière, F-75010 Paris, France.
Received: 17 July 2020 Accepted: 29 December 2020
References1. Disease GB, Collaborators. Global, regional, and national incidence,
prevalence, and years lived with disability for 328 diseases and injuries for195 countries, 1990–2016: a systematic analysis for the Global Burden ofDisease Study 2016. Lancet. 2017;390:1211–59.
2. Kalaria RN, Akinyemi R, Ihara M. Stroke injury, cognitive impairment andvascular dementia. Biochim Biophys Acta. 2016;1862:915–25.
3. Narayanan L, Murray AD. What can imaging tell us about cognitiveimpairment and dementia? World J Radiol. 2016;8:240–54.
4. Korczyn AD, Vakhapova V, Grinberg LT. Vascular dementia. J Neurol Sci.2012;322:2–10.
5. Bowler JV, Hachinski V. Vascular cognitive impairment: a new approach tovascular dementia. Baillieres Clin Neurol. 1995;4:357–76.
6. Hachinski VC, Bowler JV. Vascular dementia. Neurology. 1993;43:2159–60author reply 60–1.
7. Skrobot OA, O'Brien J, Black S, Chen C, DeCarli C, Erkinjuntti T, Ford GA,Kalaria RN, Pantoni L, Pasquier F, Roman GC, Wallin A, Sachdev P, Skoog I, VG, Ben-Shlomo Y, Passmore AP, Love S, Kehoe PG. The vascular impairmentof cognition classification consensus study. Alzheimers Dement. 2017;13:624–33.
8. Wardlaw JM, Smith C, Dichgans M. Mechanisms of sporadic cerebral smallvessel disease: insights from neuroimaging. Lancet Neurol. 2013;12:483–97.
9. Pendlebury ST, Rothwell PM, Oxford Vascular S. Incidence and prevalence ofdementia associated with transient ischaemic attack and stroke: analysis ofthe population-based Oxford Vascular Study. Lancet Neurol. 2019;18:248–58.
10. Emerging Risk Factors C, Sarwar N, Gao P, Seshasai SR, Gobin R, Kaptoge S,Di Angelantonio E, Ingelsson E, Lawlor DA, Selvin E, Stampfer M, StehouwerCD, Lewington S, Pennells L, Thompson A, Sattar N, White IR, Ray KK,Danesh J. Diabetes mellitus, fasting blood glucose concentration, and risk ofvascular disease: a collaborative meta-analysis of 102 prospective studies.Lancet. 2010;375:2215–22.
11. Stegmayr B, Asplund K. Diabetes as a risk factor for stroke. A populationperspective. Diabetologia. 1995;38:1061–8.
12. Biessels GJ, Staekenborg S, Brunner E, Brayne C, Scheltens P. Risk ofdementia in diabetes mellitus: a systematic review. Lancet Neurol. 2006;5:64–74.
13. Jiwa NS, Garrard P, Hainsworth AH. Experimental models of vasculardementia and vascular cognitive impairment: a systematic review. JNeurochem. 2010;115:814–28.
14. Guo LL, Wang DS, Xu YY, Cui KG. Effects of IL-1beta on hippocampus cellapoptosis and learning ability of vascular dementia rats. Eur Rev MedPharmacol Sci. 2018;22:6042–8.
15. Araya R, Noguchi T, Yuhki M, Kitamura N, Higuchi M, Saido TC, Seki K,Itohara S, Kawano M, Tanemura K, Takashima A, Yamada K, Kondoh Y,Kanno I, Wess J, Yamada M. Loss of M5 muscarinic acetylcholine receptorsleads to cerebrovascular and neuronal abnormalities and cognitive deficitsin mice. Neurobiol Dis. 2006;24:334–44.
16. Rom S, Zuluaga-Ramirez V, Gajghate S, Seliga A, Winfield M, Heldt NA,Kolpakov MA, Bashkirova YV, Sabri AK, Persidsky Y. Hyperglycemia-drivenneuroinflammation compromises BBB leading to memory loss in bothdiabetes mellitus (dm) type 1 and type 2 mouse models. Mol Neurobiol.2019;56:1883–96.
17. Yang Y, Kimura-Ohba S, Thompson J, Rosenberg GA. Rodent models ofvascular cognitive impairment. Transl Stroke Res. 2016;7:407–14.
18. Zhang L, Chopp eM, Zhang Y, Xiong Y, Li C, Sadry N, Rhaleb I, Lu M, Zhang ZG.Diabetes mellitus impairs cognitive function in middle-aged rats andneurological recovery in middle-aged rats after stroke. Stroke. 2016;47:2112–8.
19. Hattori Y, Enmi J, Iguchi S, Saito S, Yamamoto Y, Tsuji M, Nagatsuka K, KalariaRN, Iida H, Ihara M. Gradual carotid artery stenosis in mice closely replicateshypoperfusive vascular dementia in humans. J Am Heart Assoc. 2016;5.
20. Wakita H, Tomimoto H, Akiguchi I, Kimura J. Protective effect of cyclosporinA on white matter changes in the rat brain after chronic cerebralhypoperfusion. Stroke. 1995;26:1415–22.
21. Mangin G, Poittevin M, Charriaut-Marlangue C, Giannesini C, Merkoulova-Rainon T, Kubis N. Glatiramer acetate reduces infarct volume in diabeticmice with cerebral ischemia and prevents long-term memory loss. BrainBehav Immun. 2019.
22. Gold AB, Herrmann N, Swardfager W, Black SE, Aviv RI, Tennen G, KissA, Lanctot KL. The relationship between indoleamine 2,3-dioxygenaseactivity and post-stroke cognitive impairment. J Neuroinflammation.2011;8:17.
23. Santamaria A, Galvan-Arzate S, Lisy V, Ali SF, Duhart HM, Osorio-Rico L, RiosC, St'astny F. Quinolinic acid induces oxidative stress in rat brainsynaptosomes. Neuroreport. 2001;12:871–4.
24. Stone TW, Darlington LG. Endogenous kynurenines as targets for drugdiscovery and development. Nat Rev Drug Discov. 2002;1:609–20.
25. Sapko MT, Guidetti P, Yu P, Tagle DA, Pellicciari R, Schwarcz R. Endogenouskyneurenate controls the vulnerability of striatal neurons to quinolinate:Implications for Huntington's disease. Exp Neurol. 2006;197:31–40.
26. Mitchell AJ, Sheth B, Gill J, Yadegarfar M, Stubbs B, Yadegarfar M, Meader N.Prevalence and predictors of post-stroke mood disorders: A meta-analysisand meta-regression of depression, anxiety and adjustment disorder. GenHosp Psychiatry. 2017;47:48–60.
27. Poittevin M, Deroide N, Azibani F, Delcayre C, Giannesini C, Levy BI, PocardM, Kubis N. Glatiramer Acetate administration does not reduce damageafter cerebral ischemia in mice. J Neuroimmunol. 2013;254:55–62.
28. Hilal R, Poittevin M, Pasteur-Rousseau A, Cogo A, Mangin G, Chevauche M,Ziat Y, Vilar J, Launay JM, Gautier JF, Broqueres-You D, Levy BI, Merkulova-Rainon T, Kubis N. Diabetic Ephrin-B2-Stimulated Peripheral BloodMononuclear Cells Enhance Poststroke Recovery in Mice. Stem Cells Int.2018;2018:2431567.
29. Thomas A, Burant A, Bui N, Graham D, Yuva-Paylor LA, Paylor R. Marbleburying reflects a repetitive and perseverative behavior more than novelty-induced anxiety. Psychopharmacology (Berl). 2009;204:361–73.
30. Surget A, Saxe M, Leman S, Ibarguen-Vargas Y, Chalon S, Griebel G, Hen R,Belzung C. Drug-dependent requirement of hippocampal neurogenesis in amodel of depression and of antidepressant reversal. Biol Psychiatr. 2008;64:293–301.
31. Yalcin I, Aksu F, Belzung C. Effects of desipramine and tramadol in a chronicmild stress model in mice are altered by yohimbine but not by pindolol.Eur J Pharmacol. 2005;514:165–74.
32. Van Dyke AM, Francis TC, Chen H, Bailey AM, Thompson SM. Chronicfluoxetine treatment in vivo enhances excitatory synaptic transmission inthe hippocampus. Neuropharmacology. 2019;150:38–45.
33. Dossi E, Blauwblomme T, Nabbout R, Huberfeld G, Rouach N. Multi-electrode array recordings of human epileptic postoperative cortical tissue. JVis Exp. 2014;92:e51870.
Cogo et al. Molecular Neurodegeneration (2021) 16:7 Page 19 of 20

34. Kopanitsa MV, Afinowi NO, Grant SG. Recording long-term potentiation ofsynaptic transmission by three-dimensional multi-electrode arrays. BMCNeurosci. 2006;7:61.
35. Peters JC. Tryptophan nutrition and metabolism: an overview. Adv Exp MedBiol. 1991;294:345–58.
36. Laugeray A, Launay JM, Callebert J, Mutlu O, Guillemin GJ, Belzung C,Barone PR. Chronic Treatment with the IDO1 Inhibitor 1-Methyl-D-Tryptophan Minimizes the Behavioural and Biochemical AbnormalitiesInduced by Unpredictable Chronic Mild Stress in Mice - Comparison withFluoxetine. PLoS One. 2016;11:e0164337.
37. Adams HP Jr, Bendixen BH, Kappelle LJ, Biller J, Love BB, Gordon DL, MarshEE 3rd. Classification of subtype of acute ischemic stroke. Definitions for usein a multicenter clinical trial. TOAST. Trial of Org 10172 in Acute StrokeTreatment. Stroke. 1993;24:35–41.
38. Rowley WR, Bezold C, Arikan Y, Byrne E, Krohe S. Diabetes 2030: Insights fromYesterday, Today, and Future Trends. Popul Health Manag. 2017;20:6–12.
39. Mankovsky BN, Ziegler D. Stroke in patients with diabetes mellitus. DiabetesMetab Res Rev. 2004;20:268–87.
40. Iadecola C. The pathobiology of vascular dementia. Neuron. 2013;80:844–66.41. Desilles JP, Meseguer E, Labreuche J, Lapergue B, Sirimarco G, Gonzalez-
Valcarcel J, Lavallee P, Cabrejo L, Guidoux C, Klein I, Amarenco P, Mazighi M.Diabetes mellitus, admission glucose, and outcomes after strokethrombolysis: a registry and systematic review. Stroke. 2013;44:1915–23.
42. Capuron L, Miller AH. Cytokines and psychopathology: lessons frominterferon-alpha. Biol Psychiatry. 2004;56:819–24.
43. Musso T, Gusella GL, Brooks A, Longo DL, Varesio L. Interleukin-4 inhibitsindoleamine 2,3-dioxygenase expression in human monocytes. Blood. 1994;83:1408–11.
44. Kiank C, Zeden JP, Drude S, Domanska G, Fusch G, Otten W, Schuett C.Psychological stress-induced, IDO1-dependent tryptophan catabolism:implications on immunosuppression in mice and humans. PLoS One. 2010;5:e11825.
45. Guillemin GJ, Kerr SJ, Smythe GA, Smith DG, Kapoor V, Armati PJ, Croitoru J,Brew BJ. Kynurenine pathway metabolism in human astrocytes: a paradoxfor neuronal protection. J Neurochem. 2001;78:842–53.
46. Wood ER, Bussey TJ, Phillips AG. A glycine antagonist 7-chlorokynurenic acidattenuates ischemia-induced learning deficits. Neuroreport. 1993;4:151–4.
47. Guillemin GJ, Smythe GA, Veas LA, Takikawa O, Brew BJ. A beta 1–42induces production of quinolinic acid by human macrophages andmicroglia. Neuroreport. 2003;14:2311–5.
48. Cuartero MI, de la Parra J, Perez-Ruiz A, Bravo-Ferrer I, Duran-Laforet V,Garcia-Culebras A, Garcia-Segura JM, Dhaliwal J, Frankland PW, Lizasoain I,Moro MA. Abolition of aberrant neurogenesis ameliorates cognitiveimpairment after stroke in mice. J Clin Invest. 2019;129:1536–50.
49. Holland LL, Wagner JJ. Primed facilitation of homosynaptic long-termdepression and depotentiation in rat hippocampus. J Neurosci. 1998;18:887–94.
50. Cifuentes D, Poittevin M, Bonnin P, Ngkelo A, Kubis N, Merkulova-Rainon T,Levy BI. Inacetivation of nitric oxide synthesis exacerbates the developmentof alzheimer disease pathology in APPPS1 mice (amyloid precursor protein/presenilin-1). Hypertension. 2017;70:613–23.
51. MacPherson KP, Sompol P, Kannarkat GT, Chang J, Sniffen L, Wildner ME,Norris CM, Tansey MG. Peripheral administration of the soluble TNF inhibitorXPro1595 modifies brain immune cell profiles, decreases beta-amyloidplaque load, and rescues impaired long-term potentiation in 5xFAD mice.Neurobiol Dis. 2017;102:81–95.
52. Aguiar de Sousa D, von Martial R, Abilleira S, Gattringer T, Kobayashi A, GallofreM, Fazekas F, Szikora I, Feigin V, Caso V, Fischer U. Access to and delivery ofacute ischaemic stroke treatments: A survey of national scientific societies andstroke experts in 44 European countries. Eur Stroke J. 2019;4:13–28.
53. Doyle KP, Quach LN, Sole M, Axtell RC, Nguyen TV, Soler-Llavina GJ, JuradoS, Han J, Steinman L, Longo FM, Schneider JA, Malenka RC, Buckwalter MS.B-lymphocyte-mediated delayed cognitive impairment following stroke. JNeurosci. 2015;35:2133–45.
54. Shih AY, Blinder P, Tsai PS, Friedman B, Stanley G, Lyden PD, Kleinfeld D.The smallest stroke: occlusion of one penetrating vessel leads to infarctionand a cognitive deficit. Nat Neurosci. 2013;16:55–63.
55. Rendon J, Zuluaga Y, Velilla L, Ochoa J, Arboleda-Velasquez JF, Budson A,Lopera F, Quiroz YT. Event-related potential correlates of recognitionmemory in asymptomatic individuals with CADASIL. Brain Res. 2019;1707:74–8.
56. Chollet F, Rigal J, Marque P, Barbieux-Guillot M, Raposo N, Fabry V, AlbucherJF, Pariente J, Loubinoux I. Serotonin Selective Reuptake Inhibitors (SSRIs)and Stroke. Curr Neurol Neurosci Rep. 2018;18:100.
57. Chollet F, Tardy J, Albucher JF, Thalamas C, Berard E, Lamy C, Bejot Y,Deltour S, Jaillard A, Niclot P, Guillon B, Moulin T, Marque P, Pariente J,Arnaud C, Loubinoux I. Fluoxetine for motor recovery after acute ischaemicstroke (FLAME): a randomised placebo-controlled trial. Lancet Neurol. 2011;10:123–30.
58. Ankolekar S, Geeganage C, Anderton P, Hogg C, Bath PM. Clinical trials forpreventing post stroke cognitive impairment. J Neurol Sci. 2010;299:168–74.
59. Du Y, Deng W, Wang Z, Ning M, Zhang W, Zhou Y, et al. Differentialsubnetwork of chemokines/cytokines in human, mouse, and rat brain cellsafter oxygen-glucose deprivation. J Cerebral Blood Flow Metab. 2017;37(4):1425–34.
60. Heyes MP, Saito K, Crowley JS, Davis LE, Demitrack MA, Der M, Dilling LA,Elia J, Kruesi MJ, Lackner A, et al. Quinolinic acid and kynurenine pathwaymetabolism in inflammatory and non-inflammatory neurological disease.Brain. 1992;115(Pt 5):1249–73.
61. Guillemin GJ, Brew BJ, Noonan CE, Takikawa O, Cullen KM. Indoleamine 2,3dioxygenase and quinolinic acid immunoreactivity in Alzheimer's diseasehippocampus. Neuropathol Appl Neurobiol. 2005;31:395–404.
62. Simats A, Garcia-Berrocoso T, Montaner J. Neuroinflammatory biomarkers:From stroke diagnosis and prognosis to therapy. Biochim Biophys Acta.2016;1862:411–24.
63. Badawy AA. Kynurenine Pathway of Tryptophan Metabolism: Regulatoryand Functional Aspects. Int J Tryptophan Res. 2017;10:1178646917691938.
64. Fisher M, Feuerstein G, Howells DW, Hurn PD, Kent TA, Savitz SI. Lo EH; STAIR Group. Update of the stroke therapy academic industry roundtablepreclinical recommendations. Stroke. 2009;40(6):2244–50.
Publisher’s NoteSpringer Nature remains neutral with regard to jurisdictional claims inpublished maps and institutional affiliations.
Cogo et al. Molecular Neurodegeneration (2021) 16:7 Page 20 of 20