Increased hepatic UCP2 expression in rats with nonalcoholic steatohepatitis is associated with...
13
Increased Hepatic UCP2 Expression in Rats With Nonalcoholic Steatohepatitis Is Associated With Upregulation of Sp1 Binding to Its Motif Within the Proximal Promoter Region Ying Jiang, 1 Hua Zhang, 2 Ling-yue Dong, 1 Dan Wang, 2 and Wei An 1 * 1 Department of Cell Biology and Municipal Laboratory for Liver Protection and Regulation of Regeneration, Capital Medical University, 100069 Beijing, China 2 Department of Anatomy and Histology, Capital Medical University, 100069 Beijing, China ABSTRACT Uncoupling protein-2 (UCP2) is a mitochondrial inner-membrane carrier protein that is involved in the control of fatty acid metabolism. To understand the mechanism of the transcriptional regulation of ucp2 in the pathogenesis of nonalcoholic steatohepatitis (NASH), we cloned 500 bp upstream of the ucp2 exon 1 from a rat liver cDNA library and identified cis-acting regulatory elements. The transcriptional start site was identified as ‘‘C,’’ 359 bp from the ATG codon. A reporter gene assay showed that deletion of the nucleotide sequence between 264 and 60 bp resulted in a significant decrease in promoter activity in HepG2 and H4IIE cells. Electrophoretic mobility shift assay (EMSA) and chromatin immunoprecipitation (ChIP) revealed that the increase in promoter activity is related to an enhanced ability of Sp1 to bind to its motifs at 84 to 61 bp within the ucp2 proximal promoter. Overexpression of exogenous Sp1 in H4IIE cells also increased the promoter activity. We demonstrated that the expression of UCP2 mRNA and protein is markedly increased in rats with nonalcoholic steatohepatitis (NASH). Coincidently, levels of Sp1 binding to 84/61 bp were also increased. Overall, our data indicate that the Sp1-binding site located at the proximal promoter is involved in the regulation of rat UCP2 expression. J. Cell. Biochem. 105: 277–289, 2008. ß 2008 Wiley-Liss, Inc. KEY WORDS: UNCOUPLING PROTEIN-2; PROMOTER; TRANSCRIPTION; Sp1; NONALCOHOLIC STEATOHEPATITIS N onalcoholic fatty liver disease (NAFLD) is a chronic disease with a spectrum of hepatic pathology such as simple steatosis, steatohepatitis [also known as nonalcoholic steatohepatitis (NASH)], fibrosis and cirrhosis [Ludwig et al., 1980; Clark et al., 2002]. Steatosis is usually considered to be benign, but NASH is increasingly acknowledged as being a precursor to more severe liver disease, and sometimes evolves into ‘‘cryptogenic’’ cirrhosis [Caldwell et al., 1999; Neuschwander-Tetri and Caldwell, 2003]. NASH is a clinically important type of chronic liver disease in industrialized countries and, in addition, rates are increasing in developing countries. The mechanisms that lead to NASH are unclear, although it is thought to arise from the interaction of many different genes and lifestyle factors. Mitochondrial impairment, oxidative stress and metabolic deregulation have all been implicated in the pathogenesis of steatohepatitis [Day, 2002; Farrell et al., 2007]. Uncoupling protein-2 (UCP2) is a mitochondrial inner-membrane carrier protein. As their name indicates, uncoupling proteins (UCPs) serve an uncoupling function, specifically by uncoupling mitochondrial electron transport from ATP synthesis. Genetic Journal of Cellular Biochemistry ARTICLE Journal of Cellular Biochemistry 105:277–289 (2008) 277 Abbreviations used: UCP2, uncoupling protein-2; NASH, nonalcoholic steatohepatitis; NAFLD, nonalcoholic fatty liver disease; EMSA, electrophoretic mobility shift assay, ChIP, chromatin immunoprecipitation; SREBP-1c, sterol- regulatory-element binding protein-1c; ECL, enhanced chemiluminescence; ALT, alanine aminotransferase; AST, aspartic aminotransferase; GLU, glucose; TC, total cholesterol; TG, triglyceride; LDL, low density lipoprotein; HDL, high density lipoprotein; 5 0 -RACE, 5 0 -rapid amplification of cDNA ends; FLA, firefly luciferase activity; RLA, renilla luciferase activity; TSS, transcriptional start site. Grant sponsor: National Natural Science Foundation of China; Grant number: 30470643; Grant sponsor: National ‘‘863’’ Project; Grant number: 2006AA02A410; Grant sponsor: Beijing Municipal Commission of Education. *Correspondence to: Dr. Wei An, Department of Cell Biology and Municipal Laboratory for Liver Protection and Regulation of Regeneration, Capital Medical University, 10 You An Men Wai Xi Tou Tiao, Beijing 100069, China. E-mail: [email protected] Received 12 December 2007; Accepted 28 April 2008 DOI 10.1002/jcb.21827 2008 Wiley-Liss, Inc. Published online 9 June 2008 in Wiley InterScience (www.interscience.wiley.com).
-
Upload
ying-jiang -
Category
Documents
-
view
213 -
download
1
Transcript of Increased hepatic UCP2 expression in rats with nonalcoholic steatohepatitis is associated with...

Increased Hepatic UCP2 Expression in Rats WithNonalcoholic Steatohepatitis Is Associated WithUpregulation of Sp1 Binding to Its Motif Withinthe Proximal Promoter Region
Ying Jiang,1 Hua Zhang,2 Ling-yue Dong,1 Dan Wang,2 and Wei An1*1Department of Cell Biology and Municipal Laboratory for Liver Protection and Regulation of Regeneration,Capital Medical University, 100069 Beijing, China
2Department of Anatomy and Histology, Capital Medical University, 100069 Beijing, China
ABSTRACTUncoupling protein-2 (UCP2) is a mitochondrial inner-membrane carrier protein that is involved in the control of fatty acid metabolism. To
understand the mechanism of the transcriptional regulation of ucp2 in the pathogenesis of nonalcoholic steatohepatitis (NASH), we cloned
500 bp upstream of the ucp2 exon 1 from a rat liver cDNA library and identified cis-acting regulatory elements. The transcriptional start site
was identified as ‘‘C,’’�359 bp from the ATG codon. A reporter gene assay showed that deletion of the nucleotide sequence between�264 and
�60 bp resulted in a significant decrease in promoter activity in HepG2 and H4IIE cells. Electrophoretic mobility shift assay (EMSA) and
chromatin immunoprecipitation (ChIP) revealed that the increase in promoter activity is related to an enhanced ability of Sp1 to bind to its
motifs at �84 to �61 bp within the ucp2 proximal promoter. Overexpression of exogenous Sp1 in H4IIE cells also increased the promoter
activity. We demonstrated that the expression of UCP2 mRNA and protein is markedly increased in rats with nonalcoholic steatohepatitis
(NASH). Coincidently, levels of Sp1 binding to�84/�61 bp were also increased. Overall, our data indicate that the Sp1-binding site located at
the proximal promoter is involved in the regulation of rat UCP2 expression. J. Cell. Biochem. 105: 277–289, 2008. � 2008 Wiley-Liss, Inc.
KEY WORDS: UNCOUPLING PROTEIN-2; PROMOTER; TRANSCRIPTION; Sp1; NONALCOHOLIC STEATOHEPATITIS
N onalcoholic fatty liver disease (NAFLD) is a chronic disease
with a spectrum of hepatic pathology such as simple
steatosis, steatohepatitis [also known as nonalcoholic steatohepatitis
(NASH)], fibrosis and cirrhosis [Ludwig et al., 1980; Clark et al.,
2002]. Steatosis is usually considered to be benign, but NASH is
increasingly acknowledged as being a precursor to more severe liver
disease, and sometimes evolves into ‘‘cryptogenic’’ cirrhosis
[Caldwell et al., 1999; Neuschwander-Tetri and Caldwell, 2003].
NASH is a clinically important type of chronic liver disease in
industrialized countries and, in addition, rates are increasing in
developing countries. The mechanisms that lead to NASH are
unclear, although it is thought to arise from the interaction of many
different genes and lifestyle factors. Mitochondrial impairment,
oxidative stress andmetabolic deregulation have all been implicated
in the pathogenesis of steatohepatitis [Day, 2002; Farrell et al.,
2007].
Uncoupling protein-2 (UCP2) is a mitochondrial inner-membrane
carrier protein. As their name indicates, uncoupling proteins
(UCPs) serve an uncoupling function, specifically by uncoupling
mitochondrial electron transport from ATP synthesis. Genetic
Journal of CellularBiochemistry
ARTICLEJournal of Cellular Biochemistry 105:277–289 (2008)
277
Abbreviations used: UCP2, uncoupling protein-2; NASH, nonalcoholic steatohepatitis; NAFLD, nonalcoholic fattyliver disease; EMSA, electrophoretic mobility shift assay, ChIP, chromatin immunoprecipitation; SREBP-1c, sterol-regulatory-element binding protein-1c; ECL, enhanced chemiluminescence; ALT, alanine aminotransferase; AST,aspartic aminotransferase; GLU, glucose; TC, total cholesterol; TG, triglyceride; LDL, low density lipoprotein; HDL,high density lipoprotein; 50-RACE, 50-rapid amplification of cDNA ends; FLA, firefly luciferase activity; RLA, renillaluciferase activity; TSS, transcriptional start site.
Grant sponsor: National Natural Science Foundation of China; Grant number: 30470643; Grant sponsor: National‘‘863’’ Project; Grant number: 2006AA02A410; Grant sponsor: Beijing Municipal Commission of Education.
*Correspondence to: Dr. Wei An, Department of Cell Biology and Municipal Laboratory for Liver Protection andRegulation of Regeneration, Capital Medical University, 10 You An Men Wai Xi Tou Tiao, Beijing 100069, China.E-mail: [email protected]
Received 12 December 2007; Accepted 28 April 2008 � DOI 10.1002/jcb.21827 � 2008 Wiley-Liss, Inc.
Published online 9 June 2008 in Wiley InterScience (www.interscience.wiley.com).

studies have shown that the gene ucp2 is mapped to the
chromosome region 1q33 in rats [Kaisaki et al., 1998]. The ucp2
mRNA is transcribed from the distal six of eight existing exons
of ucp2 [Fleury et al., 1997; Ricquier and Bouillaud, 1997]. Rat UCP2
protein comprises 309 amino acids, has a molecular mass of 33 kDa
and shares 99% and 95% homology to mouse and human UCP2,
respectively [Matsuda et al., 1997; Tu et al., 1998; Pecqueur et al.,
1999]. The ucp2mRNA has been detected in many tissues in humans
and rodents, and the ubiquitous expression of ucp2 indicates that
the protein may be important. Genetic studies have indicated that
the ucp2 gene is localized in the proximity of a cluster of five genes
related to energy homeostasis and obesity [Fleury et al., 1997;
Ricquier and Bouillaud, 1997]. Therefore, ucp2 might be theore-
tically linked to hyperinsulinemia or to the resting metabolic rate
and, consequently, to the control of body weight. It has also been
proposed that UCP2 contributes to the inflammatory response and
regulates the production of reactive oxygen species in mitochondria
[Pecqueur et al., 2001].
The relationship between UCP2 and NAFLD seems to be more
than serendipitous. In line with the ‘‘two-hit’’ theory of NAFLD
progression, it seems more feasible that UCP2 contributes to the
transition of steatosis into steatohepatitis. UCP2 has the ability to
affect hepatocellular bioenergetics upon additional challenges.
Under normal conditions, the level of ucp2 mRNA expression in
hepatocytes is very low or undetectable [Larrouy et al., 1997], but
in the livers of fa/fa rats or rats fed a high-fat diet the levels of
UCP2 protein and mRNA were increased [Matsuda et al., 1997;
Hidaka et al., 1998]. UCP2 also enhances fat accumulation in the
liver and increases insulin resistance, resulting in increased levels
of plasma fatty acid and various fat-derived bioactive factors
[Baffy, 2005]. Recently, the concept that NASH is a form of
mitochondrial disease has become more acceptable [Fromenty
et al., 2004; Pessayre and Fromenty, 2005]. However, it is unclear
how ucp2 gene transcription is controlled, in addition to its
relationship to the pathobiology of NASH. The ucp2 gene is under
strict transcriptional control, and can be regulated by inflamma-
tion, leptin and peroxisome proliferator-activated receptor g
(PPARg) agonists [Baffy, 2005].
The ucp2mRNA in hepatocytes is upregulated by the stimulation
of bacterial lipopolysaccharide and is overexpressed in genetically
modified ob/ob mice [Cortez-Pinto et al., 1998]. It has been shown
that the proximal promoter of the mouse ucp2 gene contains
potential binding sites for sterol-regulatory-element binding
protein-1c (SREBP-1c), E box and Sp1, in addition to liver X recep-
tor. In HIB-1B pre-adipocytes and islet INS-1b-cells, ucp2 transcrip-
tion can be enhanced by increasing binding to SRE, E box and Sp1,
or by the addition of PPARg [Medvedev et al., 2001, 2002].
The aim of the present study was to observe the hepatic
expression of UCP2 in rats with NASH. Transcriptional character-
istics of the rat ucp2 promoter were identified using a gene reporter
assay. A cis-element Sp1 in the proximal promoter was found to be
essential for governing ucp2 transcription. Moreover, the relation-
ship between UCP2 expression and Sp1 binding was clearly
demonstrated in rats with NASH. We conclude that UCP2 expression
in the livers of rats with NASH is attributable to the regulation of Sp1
binding to the ucp2 proximal promoter.
MATERIALS AND METHODS
MATERIALS
HepG2 and H4IIE cells (rat hepatoma) were obtained from American
Type Culture Collection (ATCC). Marathon-ready rat liver cDNA was
purchased from Clontech Company (USA). RNA extraction kit using
Trizol reagent and pBlue-TOPO TA vector were products of
Invitrogen Company (USA). For DNA cloning, TA vector was
obtained as pMD18-T vector from TaKaRa Company (Japan). For the
promoter assay, pGL3-Basic luciferase vector, its control vector
pRL-TK and DNA transfection agent Tfx-20 were obtained from
Promega Company (USA). The chemiluminescent EMSA assay kit
was obtained from Pierce Company (USA). The ChIP assay kit was a
product of Upstate (USA). Primary antibody against UCP2 and
enhanced chemiluminescence (ECL) kit were manufactured by Santa
Cruz Company (USA). The SYBR Green PCR assay kit for real-time
PCR analysis was from Applied Biosystems Company (USA).
ANIMALS
Male Sprague-Dawley rats (110–130 g) were caged, maintained on a
12:12-h light–dark cycle at 22–258C and allowed free access to
water during all stages of the study. Food intake and bodymass were
recorded. All protocols for animal care and experiments were
approved by the Ethical Committee of Capital Medical University
Beijing. The animals in the control group were fed a standard diet
(5% of energy derived from fat, 23% from protein, 55% from
carbohydrate, 6% from fibrate, 1.2% from calcium, 0.8% from
phosphorus and 9% from water) with ad libitum food intake,
whereas the rats in the NASH group were fed a high-fat diet (88%
standard diet plus 2% cholesterol and 10% lard) with ad libitum food
intake. All animals were fed between 8 am and 9 am each day.
After the 12-week dietary intervention period, the rats were killed
by puncture of the abdominal aorta after overnight fasting, and the
livers were removed rapidly, weighed and dissected. Blood glucose
(GLU), total cholesterol (TC), triglyceride (TG), low density
lipoprotein (LDL), and high density lipoprotein (HDL) levels were
measured. Serum activities of the liver-associated enzymes
alanine aminotransferase (ALT) and aspartic aminotransferase
(AST) were determined using an autoanalyzer in the Clinical
Chemistry Laboratory of the Youan Hospital, Capital Medical
University Beijing. Partial liver specimens were snap frozen in liquid
nitrogen and stored at �808C for subsequent analysis. Formalin-
fixed and paraffin-embedded livers were processed routinely for
hematoxylin–eosin staining and Masson’s staining. Sections of
frozen rat liver tissue were stained with oil red O for hepatic lipid
droplets. Tissues samples were placed into 2.5% buffered glutar-
aldehyde, processed into resin, and cut for transmission electron
microscopy. The histology results were analyzed by a pathologist
who was unaware of animal grouping.
IDENTIFICATION OF THE INITIATION OF RAT ucp2 TRANSCRIPTION
To elucidate the regulatory elements of ucp2, the transcription start
site was determined by amplifying Marathon-ready rat liver cDNA
with 50-rapid amplification of cDNA ends (50-RACE). All of the
primers employed in 50-RACE are shown in the Table I. Adapter
primer (AP) 1 and gene-specific primer (GSP)1 were applied in the
278 REGULATION OF UCP2 IN NASH JOURNAL OF CELLULAR BIOCHEMISTRY

first round of PCR. In the second round, AP2 and the upstream
internal GSP2 were used. After two rounds of amplification, a major
RACE product (�900 bp) was obtained, subcloned into TA pMD18-T
vector and verified using DNA sequencing. The transcription
initiation site was determined using sequence analysis in five
independent clones, and was defined as þ1.
CONSTRUCTION OF RAT ucp2 PROMOTER LUCIFERASE PLASMIDS
A DNA fragment of ucp2 promoter region from position �868 to
position þ93 was amplified by PCR, using rat genomic DNA as a
template. The positive PCR product was ligated into pBlue-TOPO TA
vector and verified using DNA sequencing. Subsequently, this 961-
bp fragment was used as the template for promoter deletion assay of
ucp2. The deletions were generated by PCR, using a primer targeted
on exon 1 at the 30 end of ucp2, and three 50 primers complementary
to nucleotides �458 to þ87, �264 to þ87, and �60 to þ87 bp.
These constructs were nominated p458, p264, and p60, respectively.
These fragments (�458 to þ87, �264 to þ87, and �60 to þ87 bp)
were inserted into KpnI (upstream) and NheI (downstream) of the
pGL3-Basic luciferase vector, respectively, forming three ucp2
promoter deletion constructs (pGL3-p458, pGL3-p264, and pGL3-
p60) for further assay. All of the primers used in the construction of
the deleted promoter are listed in Table I.
TRANSIENT TRANSFECTION AND PROMOTER ACTIVITY ASSAY
To identify the promoter elements that govern the transcriptional
activity of ucp2, the gene promoter deletion constructs were
transiently transfected in H4IIE and HepG2 cells by using DNA
transfection agent Tfx-20.
The cells of 80% confluence (�1� 104 cells per well) were co-
transfected with 0.3 mg of one of the pGL3-ucp2 promoter
constructs and 0.03 mg of pRL-TK vector, which expresses Renilla
luciferase under the control of the TK promoter and reflects the
efficiency of DNA transfection. The transfection procedures were
performed following previous description [Samaras et al., 2002].
Subsequently, the cells were lyzed and the luciferase activity was
measured using a luminometer equipped with a dual reporter assay
system (Promega Company). The activity (FLA/RLA) of the
promoterless vector pGL3-Basic was taken as control.
ELECTROPHORETIC MOBILITY SHIFT ASSAY
Nuclear extracts of H4IIE cells and rat liver samples were prepared
with the nuclear extraction reagents kit (Pierce Company). The
protein concentration was determined by the method of Lowry
[Lowry et al., 1951]. The probes (Table I) and experimental
procedures were followed as per product instruction. All of the
reaction mixture [20 fM labeled probe with nuclear extract (5 mg)
and competing oligonucleotides (4 pM) in binding buffer] was
incubated at room temperature for 30 min. Electrophoretic mobility
shift assays (EMSA) were performed using size fractionation of the
reaction mixture on a non-denaturing 6% polyacrylamide gel
containing 0.5� TBE buffer. Following gel separation, DNA/protein
complexes were transferred to a nylonmembrane and detected using
an enhanced chemiluminescence assay for biotin-labeled probes
[Sauzeau et al., 2003].Where supershift assays were performed, 2 mg
of polyclonal anti-Sp1 antibody was added to nuclear extracts and
incubated on ice for 20 min prior to addition of the labeled probe.
CHROMATIN IMMUNOPRECIPITATION ASSAY (CHIP)
H4IIE nuclear extract was used to perform the ChIP assay according
to the instructions of the ChIP assay kit. 1� 106 cells or liver pieces
were fixed with 1% formaldehyde for 10 min at room temperature
[Gummow et al., 2003; Lagor et al., 2005]. An aliquot of the
supernatant was saved as total input chromatin. Anti-Sp1
polyclonal antibodies (4 mg) were used for immunoprecipitation.
As an internal control, an aliquot of anti-Sp1-pulldown chromatin
TABLE I. Oligonucleotide Sequences
Oligos Sequence (50–30) Position (bp) Comments
AP1-F CCATCCTAATACGACTCACTATAGGGC Invitrogen CompanyGSP1-R GAAGGAAGGCATGAACCCCTTGTAG 1,150–1,175 RACE primers (from exon 1)AP2-F ACTCACTATAGGGCTCGAGCGGC Invitrogen CompanyGSP2-R GTGCAATGGTCTTGTAGGCTTCGAC 821–846 RACE primers (from exon 1)P960-F AGCAGCCCAAACCCACTTGAGCTTCTATTA �868 to �838 Promoter deletion primers (from þ1)P960-R AGGAGAATACACAGGAGAACACAGGAGTGC 63–93P458-KpnI-F CATGGTACCGCAGAGGGAAGGTGAGGC �458 to �441P264-KpnI-F CATGGTACCCAGGGCAGGGTAGGAAGT �264 to �247P60-KpnI-F CATGGTACCGACCACGCCCGCCAGACT �60 to �43P-NheI-R TCAGCTAGCATACACAGGAGAACACAG 70–87E-Bio-F TCCCGCCTCTTCACGCCACGCCCC-Bio �84 to �61 EMSA primers (from þ1)E-F TCCCGCCTCTTCACGCCACGCCCC �84 to �61E-R GGGGCGTGGCGTGAAGAGGCGGGA �84 to �61mE-F TCCTACCTCTTCACGCCACGCCCC �84 to �61mE-R GGGGCGTGGCGTGAAGAGGTAGGA �84 to �61UCP2-F GAGAGTCAAGGGCTAGCGC 479–498 Real-time RT-PCR primers (from exon1)UCP2-R GCTTCGACAGTGCTCTGGTA 809–829b-Actin-F ACCCACACTGTGCCCATCTAb-Actin-R GCCACAGGATTCCATACCCAb-Actin-F AACCCTAAGGCCAACCGTGAAAAG RT-PCR primersb-Actin-R TCATGAGGTAGTCTGTCAGGTp149-F ACAGATGGAAACGCCTCCTCACC �128 to �106 Real-time CHIP-PCR primers (from þ1)p149-R AGCGATCCCAGGGCACCGA 3–21p actin-F CGCCGTTCCGAAAGTTGCC �78 to �60 CHIP-PCR b-actin primers (from exon1) (negative control)p actin-R AAGGTTGTACTCGCGGGTGG 16–37
JOURNAL OF CELLULAR BIOCHEMISTRY REGULATION OF UCP2 IN NASH 279

and the input chromatin were amplified in parallel using primers for
the b-actin gene promoter (namely, p-actin, Table I), which is not a
target of Sp1 [Chakravarty et al., 2004; Rubio et al., 2007]. As a
negative control, normal rabbit immunoglobulin G (IgG) was used.
The reaction in which no primary antibody added was used as a
blank control. Finally, nuclear DNA extracts (with or without
antibody) were amplified using primers that spanned the Sp1 region
of the ucp2 promoter (from �264 to þ87 bp). The amplified DNA
fragments were separated by electrophoresis using 2% agarose gels
and stained with ethidium bromide.
For relative quantification of PCR reactions, ChIP DNA was also
subjected to quantitative real-time PCR assay using SYBR Green dye
and an ABI-7300 PCR system, according to the manufacturer’s
protocol (ABI). The input and Sp1-ChIP DNAs were amplified in
triplicate under the following conditions: 508C for 2 min, 958C for
10 min, 40 cycles at 958C for 15 s, and 608C for 1 min. The relative
differences between input sample and Sp1-ChIP product or negative
control were determined using the DCT method [Ou et al., 2004] and
presented as the percentage of the input, which was taken as 100%.
Data are the mean� SD from triplicate samples of three independent
experiments. PCR amplification of ucp2 was performed with primer
149 (�128/þ21, namely p149). The specificity of p149 was
established using dissociation curves.
DETECTION OF HEPATIC UCP2 EXPRESSION
Real-time PCR was performed to analyze the expression of ucp2
mRNA [Schmittgen et al., 2000]. Total hepatic RNA from a liver
tissue sample was extracted using Trizol reagent, and reversely
transcribed into cDNA using Superscript III reverse transcriptase
(Invitrogen Company) according to procedures described pre-
viously. Quantitative real-time PCR assays were performed in the
presence of the oligonucleotide primers for ucp2 and quantified
using SYBR Green PCR reagents. Rat b-actin was used as an internal
control for this method, with each sample determination carried out
in triplicate. The parameters for real-time PCR were similar to that
described in Chromatin Immunoprecipitation Assay (ChIP) Section.
Western blot assays were used to analyze UCP2 protein expression
[Pecqueur et al., 2001]. Total cellular protein from frozen rat liver
tissue was extracted by homogenizing the sample in a buffer
containing 10-mM Tris–HCl (pH 7.6), 5-mM EDTA, 50-mM NaCl, 1%
Triton X-100, 1-mg/ml leupeptin, 1-mg/ml aprotinin, 0.1-mM
phenylmethylsulfonyl fluoride and 50-mM NaF. The homogenate
was then centrifuged at 12,000g for 15 min at 48C and supernatants
were collected. One hundred micrograms of cellular extracts were
separated by 12.5% SDS–polyacrylamide gel and electrotransferred
onto nitrocellulose membranes. The membranes were incubated with
goat anti-human UCP2 polyclonal antibody as the primary antibody
(1:200), and then with horseradish peroxidase conjugated to rabbit
anti-goat IgG as the second antibody (1:2,500). The positive reaction
against UCP2 antibody was visualized using ECL reagent, followed by
exposure to Kodak X-Omat X-ray film.
To verify Western blot detection, UCP2 expression in the liver
was immunohistochemically analyzed. Formalin-fixed, paraffin-
embedded tissue of rat liver was performed as routine. Paraffin-
embedded tissue specimens were deparaffinized, rehydrated and
endogenously blocked. Subsequently, antigens in slides were
retrieved as follows. Briefly, the slides were placed in a plastic
coplin jar filled with 0.01 M citrate buffer and subjected to
microwave treatment at medium power for 5–10 min. To
compensate for evaporation, the buffer was refilled and the process
was repeated. The slides were blocked with 10% goat serum for
30 min at room temperature and incubated (12 h at 48C) with a rat
polyclonal antibody of UCP2 [(1:100), Boster Company, Beijing].
The slides were incubated with secondary antibody (goat anti-rat
IgG labeled with biotin), and positive cells were visualized with
diaminobenzidine (DAB).
STATISTICS
Data are expressed as means� SD. Statistical analysis was
performed using one-way analysis of variance (ANOVA). Differ-
ences were considered to be significant when P< 0.05.
RESULTS
IDENTIFICATION OF THE TRANSCRIPTIONAL START SITE OF
RAT ucp2
50-RACE, which is widely used as an alternative strategy for
detecting the transcriptional initiation of genes, enabled the capture
of extra 50-sequences to compensate for those lost during
the construction of the conventional cDNA library. To elucidate
the regulatory role of ucp2 in the pathogenesis of NASH, the
transcription initiation site was determined by 50-RACE, using
Marathon-ready cDNA as the template with the adaptor primer and
the ucp2-specific primer that binds from 821 to 846 bp and from
1,150 to 1,175 bp distal to ucp2 exon 1 (Fig. 1A). 50-RACE was
carried out for three separate cDNA libraries. For each cDNA library,
50-RACE products were amplified using the pair primers of AP1-
GSP1 and AP2-GSP2. Figure 1B shows PCR amplification of the
cDNA library in combination with two pairs of primers. The products
from 15 different 50-RACE reactions were sequenced. The longest
transcript identified contained 359 bp 50-upstream of the start codon
ATG, indicating that this ‘‘C’’ (denoted by an asterisk in Fig. 1C)
represents the potential transcription initiation site, denoted by þ1.
After identification of the start site of ucp2 transcription, the
sequences of rat ucp2 promoter region between �868 and þ93 bp
were analyzed. Using computer-assisted sequence alignment, it was
observed that the rat ucp2 promoter contained neither a typical
TATA box nor a typical CAAT box; instead, abundant GC-rich
elements comprising several Sp1-, SRE-, E-box-, and AP4-binding
sites were found in the proximal region of the promoter.
ACTIVITY ASSAY OF THE RAT ucp2 PROMOTER
For analysis of the rat ucp2 promoter activity, three promoter
deletion constructs were generated by PCR and the promoter
activities were determined. Three fragments of the promoter with
different lengths—nominated P458, P264, and P60—were fused to
the promoterless vector PGL3-Basic. The resultant three promoter
constructs were then transiently transfected into rat and human
liver-originated cell lines (H4IIE and HepG2 cells), respectively.
Promoter activities in both cell lines were measured using a
luminometer equipped with dual reporter assay system. Even the
promoter fragment P60 (�60 toþ87 bp) exhibited luciferase activity
280 REGULATION OF UCP2 IN NASH JOURNAL OF CELLULAR BIOCHEMISTRY

that was at least 10-fold that of the promoterless construct (PGL3-
Basic) in two cell lines, implying that this region could be regarded
as a minimal promoter of ucp2 (Fig. 2A). Another two constructs,
P264 (�264 to þ87 bp) and P458 (�458 to þ87 bp), also had a
dominant role in controlling promoter activity. In HepG2 and H4IIE
cells, the promoter spanning �264 to �60 bp had an important role
in maintaining activity because deletion of this fragment led to a
marked decrease in luciferase activity. Furthermore, a reduction in
luciferase activity in H4IIE cells was observed after deletion of the
region �458 to �264 bp, indicating that there are functionally
positive cis-acting elements in these regions. We checked these
experimental data further using TRANSFAC 5.0 software, and the
result indicated that several important cis-acting elements such as
Sp1 were located in the region �60 to �458 bp.
It has recently been reported that Sp1 may be involved in the
genesis of steatosis and that other factors such as oxidative stress
Fig. 1. Identification of rat ucp2 transcriptional start site (TSS). A: Schematic drawing of rat ucp2 structure and 50-RACE. B: 50-RACE product obtained using marathon-ready
cDNA library from rat liver with primer GSP2 (Table I). Arrowhead indicated a 50-RACE product. The transcriptional start site was identified by sequence alignment and was
mapped at 359 bp upstream of the sequence in GenBank (accession no. AB010743). C: Partial sequences of the rat ucp2 promoter. The transcription start site is indicated by an
asterisk (designated þ1). The deduced putative binding sites for transcription factors are underlined.
JOURNAL OF CELLULAR BIOCHEMISTRY REGULATION OF UCP2 IN NASH 281
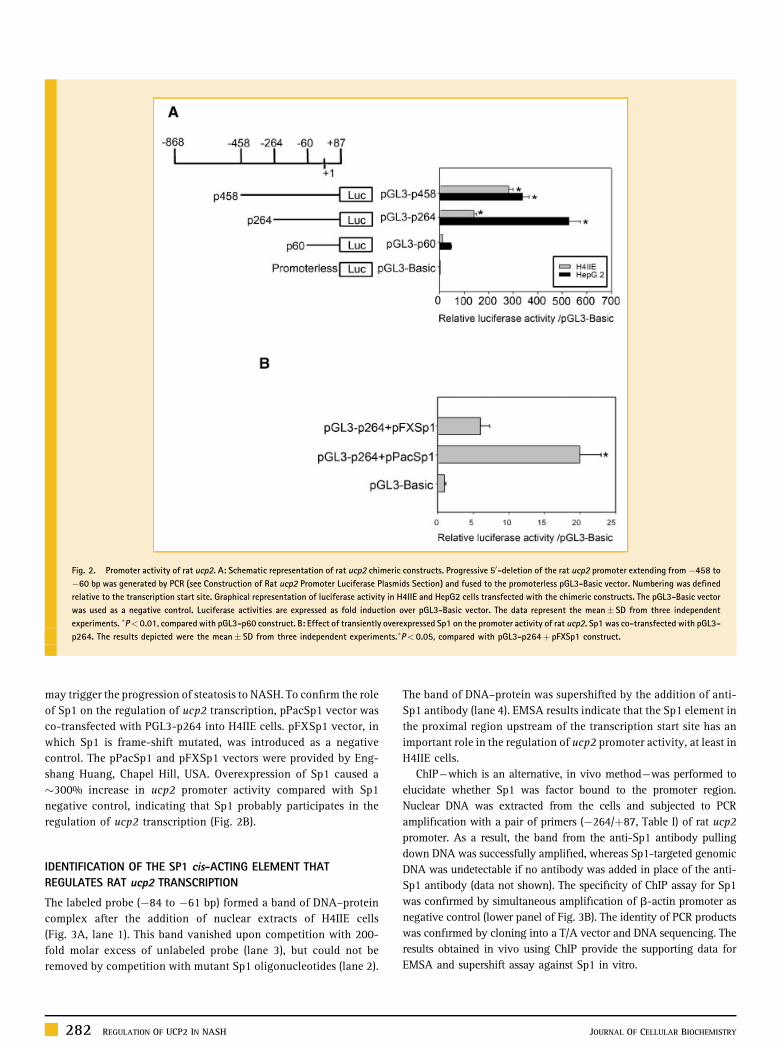
may trigger the progression of steatosis to NASH. To confirm the role
of Sp1 on the regulation of ucp2 transcription, pPacSp1 vector was
co-transfected with PGL3-p264 into H4IIE cells. pFXSp1 vector, in
which Sp1 is frame-shift mutated, was introduced as a negative
control. The pPacSp1 and pFXSp1 vectors were provided by Eng-
shang Huang, Chapel Hill, USA. Overexpression of Sp1 caused a
�300% increase in ucp2 promoter activity compared with Sp1
negative control, indicating that Sp1 probably participates in the
regulation of ucp2 transcription (Fig. 2B).
IDENTIFICATION OF THE SP1 cis-ACTING ELEMENT THAT
REGULATES RAT ucp2 TRANSCRIPTION
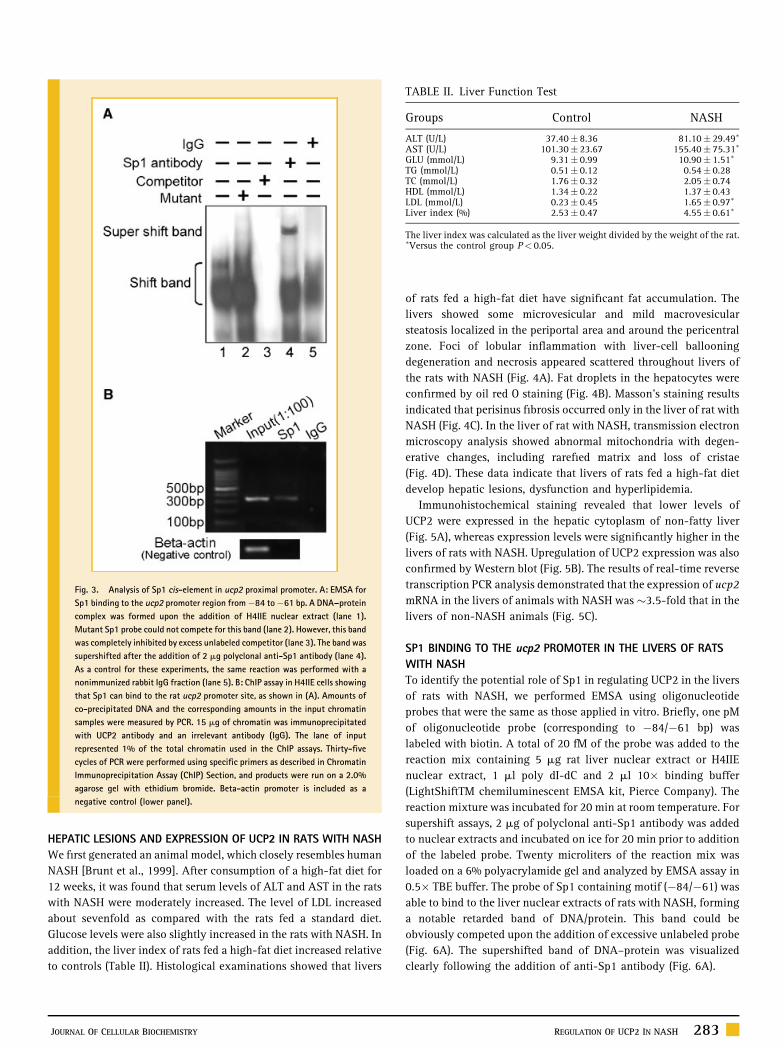
The labeled probe (�84 to �61 bp) formed a band of DNA–protein
complex after the addition of nuclear extracts of H4IIE cells
(Fig. 3A, lane 1). This band vanished upon competition with 200-
fold molar excess of unlabeled probe (lane 3), but could not be
removed by competition with mutant Sp1 oligonucleotides (lane 2).
The band of DNA–protein was supershifted by the addition of anti-
Sp1 antibody (lane 4). EMSA results indicate that the Sp1 element in
the proximal region upstream of the transcription start site has an
important role in the regulation of ucp2 promoter activity, at least in
H4IIE cells.
ChIP—which is an alternative, in vivo method—was performed to
elucidate whether Sp1 was factor bound to the promoter region.
Nuclear DNA was extracted from the cells and subjected to PCR
amplification with a pair of primers (�264/þ87, Table I) of rat ucp2
promoter. As a result, the band from the anti-Sp1 antibody pulling
down DNA was successfully amplified, whereas Sp1-targeted genomic
DNA was undetectable if no antibody was added in place of the anti-
Sp1 antibody (data not shown). The specificity of ChIP assay for Sp1
was confirmed by simultaneous amplification of b-actin promoter as
negative control (lower panel of Fig. 3B). The identity of PCR products
was confirmed by cloning into a T/A vector and DNA sequencing. The
results obtained in vivo using ChIP provide the supporting data for
EMSA and supershift assay against Sp1 in vitro.
Fig. 2. Promoter activity of rat ucp2. A: Schematic representation of rat ucp2 chimeric constructs. Progressive 50-deletion of the rat ucp2 promoter extending from�458 to
�60 bp was generated by PCR (see Construction of Rat ucp2 Promoter Luciferase Plasmids Section) and fused to the promoterless pGL3-Basic vector. Numbering was defined
relative to the transcription start site. Graphical representation of luciferase activity in H4IIE and HepG2 cells transfected with the chimeric constructs. The pGL3-Basic vector
was used as a negative control. Luciferase activities are expressed as fold induction over pGL3-Basic vector. The data represent the mean� SD from three independent
experiments. �P< 0.01, compared with pGL3-p60 construct. B: Effect of transiently overexpressed Sp1 on the promoter activity of rat ucp2. Sp1 was co-transfected with pGL3-
p264. The results depicted were the mean� SD from three independent experiments.�P< 0.05, compared with pGL3-p264þ pFXSp1 construct.
282 REGULATION OF UCP2 IN NASH JOURNAL OF CELLULAR BIOCHEMISTRY
HEPATIC LESIONS AND EXPRESSION OF UCP2 IN RATS WITH NASH
We first generated an animal model, which closely resembles human
NASH [Brunt et al., 1999]. After consumption of a high-fat diet for
12 weeks, it was found that serum levels of ALT and AST in the rats
with NASH were moderately increased. The level of LDL increased
about sevenfold as compared with the rats fed a standard diet.
Glucose levels were also slightly increased in the rats with NASH. In
addition, the liver index of rats fed a high-fat diet increased relative
to controls (Table II). Histological examinations showed that livers
of rats fed a high-fat diet have significant fat accumulation. The
livers showed some microvesicular and mild macrovesicular
steatosis localized in the periportal area and around the pericentral
zone. Foci of lobular inflammation with liver-cell ballooning
degeneration and necrosis appeared scattered throughout livers of
the rats with NASH (Fig. 4A). Fat droplets in the hepatocytes were
confirmed by oil red O staining (Fig. 4B). Masson’s staining results
indicated that perisinus fibrosis occurred only in the liver of rat with
NASH (Fig. 4C). In the liver of rat with NASH, transmission electron
microscopy analysis showed abnormal mitochondria with degen-
erative changes, including rarefied matrix and loss of cristae
(Fig. 4D). These data indicate that livers of rats fed a high-fat diet
develop hepatic lesions, dysfunction and hyperlipidemia.
Immunohistochemical staining revealed that lower levels of
UCP2 were expressed in the hepatic cytoplasm of non-fatty liver
(Fig. 5A), whereas expression levels were significantly higher in the
livers of rats with NASH. Upregulation of UCP2 expression was also
confirmed by Western blot (Fig. 5B). The results of real-time reverse
transcription PCR analysis demonstrated that the expression of ucp2
mRNA in the livers of animals with NASH was �3.5-fold that in the
livers of non-NASH animals (Fig. 5C).
SP1 BINDING TO THE ucp2 PROMOTER IN THE LIVERS OF RATS
WITH NASH
To identify the potential role of Sp1 in regulating UCP2 in the livers
of rats with NASH, we performed EMSA using oligonucleotide
probes that were the same as those applied in vitro. Briefly, one pM
of oligonucleotide probe (corresponding to �84/�61 bp) was
labeled with biotin. A total of 20 fM of the probe was added to the
reaction mix containing 5 mg rat liver nuclear extract or H4IIE
nuclear extract, 1 ml poly dI-dC and 2 ml 10� binding buffer
(LightShiftTM chemiluminescent EMSA kit, Pierce Company). The
reaction mixture was incubated for 20 min at room temperature. For
supershift assays, 2 mg of polyclonal anti-Sp1 antibody was added
to nuclear extracts and incubated on ice for 20 min prior to addition
of the labeled probe. Twenty microliters of the reaction mix was
loaded on a 6% polyacrylamide gel and analyzed by EMSA assay in
0.5� TBE buffer. The probe of Sp1 containing motif (�84/�61) was
able to bind to the liver nuclear extracts of rats with NASH, forming
a notable retarded band of DNA/protein. This band could be
obviously competed upon the addition of excessive unlabeled probe
(Fig. 6A). The supershifted band of DNA–protein was visualized
clearly following the addition of anti-Sp1 antibody (Fig. 6A).
Fig. 3. Analysis of Sp1 cis-element in ucp2 proximal promoter. A: EMSA for
Sp1 binding to the ucp2 promoter region from�84 to�61 bp. A DNA–protein
complex was formed upon the addition of H4IIE nuclear extract (lane 1).
Mutant Sp1 probe could not compete for this band (lane 2). However, this band
was completely inhibited by excess unlabeled competitor (lane 3). The band was
supershifted after the addition of 2 mg polyclonal anti-Sp1 antibody (lane 4).
As a control for these experiments, the same reaction was performed with a
nonimmunized rabbit IgG fraction (lane 5). B: ChIP assay in H4IIE cells showing
that Sp1 can bind to the rat ucp2 promoter site, as shown in (A). Amounts of
co-precipitated DNA and the corresponding amounts in the input chromatin
samples were measured by PCR. 15 mg of chromatin was immunoprecipitated
with UCP2 antibody and an irrelevant antibody (IgG). The lane of input
represented 1% of the total chromatin used in the ChIP assays. Thirty-five
cycles of PCR were performed using specific primers as described in Chromatin
Immunoprecipitation Assay (ChIP) Section, and products were run on a 2.0%
agarose gel with ethidium bromide. Beta-actin promoter is included as a
negative control (lower panel).
TABLE II. Liver Function Test
Groups Control NASH
ALT (U/L) 37.40� 8.36 81.10� 29.49�
AST (U/L) 101.30� 23.67 155.40� 75.31�
GLU (mmol/L) 9.31� 0.99 10.90� 1.51�
TG (mmol/L) 0.51� 0.12 0.54� 0.28TC (mmol/L) 1.76� 0.32 2.05� 0.74HDL (mmol/L) 1.34� 0.22 1.37� 0.43LDL (mmol/L) 0.23� 0.45 1.65� 0.97�
Liver index (%) 2.53� 0.47 4.55� 0.61�
The liver index was calculated as the liver weight divided by the weight of the rat.�Versus the control group P< 0.05.
JOURNAL OF CELLULAR BIOCHEMISTRY REGULATION OF UCP2 IN NASH 283

Fig. 4. Hepatic histology in rats fed a high-fat diet ad libitum. A: The liver samples were stained with hematoxylin and eosin (objective 10�). The livers of rats fed a standard
diet show minimal mononuclear inflammatory cells (left). The livers of the rats fed a high-fat diet show pronounced hepatic steatosis, mononuclear inflammatory cells infiltrate
and liver-cell necrosis. The hepatocytes show ballooning degeneration (right). B: Oil red O stain (objective 10�). The accumulation of fat droplets in hepatocytes was
demonstrated by fat stain (red) on frozen tissue (right). The livers of rats fed a standard diet show minimal fat (left). C: Masson trichroma stain (objective 20�). In control
rat livers, low amounts of collagen (blue) were detected predominantly around the central veins (left). Highlight collagen reveals mild fibrosis of the terminal hepatic vein
and radiating pericellular (Disse space) fibrosis in the livers of NASH rats (right). D: Electron microscopy of hepatic mitochondria. Mitochondria in rats fed a high-fat diet
ad libitum (right) show degenerative changes with rarefied matrix and loss of cristae. The hepatocyte mitochondria in rats fed a standard diet (left). The magnification is
60,000�.
284 REGULATION OF UCP2 IN NASH JOURNAL OF CELLULAR BIOCHEMISTRY

Given its ability to bind in vitro, we attempted to confirm
that Sp1 binds to the rat ucp2 proximal promoter in vivo,
particularly under NASH conditions. To accomplish this, liver
sections from rats with NASH or non-fatty liver were cross-
linked with formaldehyde and subjected to ChIP analysis. In
non-fatty liver (control), it was indicated that Sp1 could bind to
�84/�61 elements of the ucp2 promoter to a small extent; however,
in the case of NASH liver, the level of Sp1 binding was increased
(Fig. 6B).
The binding of Sp1 to its site in the ucp2 gene promoter was
confirmed by ChIP analysis. As shown in Figure 6B, PCR
amplification of the Sp1-ChIP product (�264/þ87) of the ucp2
gene produced a band (lane 3 from control, lane 6 from NASH).
However, no bands could be amplified using b-actin primers as a
Fig. 5. UCP2 expression in rat liver. The expression of UCP2 protein and mRNAwas analyzed using immunohistochemistry, Western blot and real-time PCR. Data shown are the
means of six independent experiments in which P< 0.05 versus control rats. A: Immunohistochemical staining of UCP2 in normal or nonalcoholic steatohepatitis (NASH) rat
liver. In normal rat liver, lower levels of UCP2 are expressed in the hepatic cytoplasm around the central vein, but this protein is ubiquitously expressed in the hepatic cytoplasm
of rats with NASH. B: Western blot analysis of hepatic UCP2 expression. One hundred micrograms of protein extract from the livers of rats with NASH—which are prepared by
being fed a high-fat diet for 12 weeks—was separated by 12% SDS–PAGE and probed with antibody against UCP2. UCP2 protein expression was normalized to b-actin. Results
quantified under the blots are the average values of two representative blots per sample. C: Real-time PCR was carried out to determine the fold difference in UCP2 mRNA
expression between normal and fatty livers. UCP2 mRNA expression was normalized to b-actin. Asterisks indicate a statistically significant difference from controls, P< 0.05, by
ANOVA.
JOURNAL OF CELLULAR BIOCHEMISTRY REGULATION OF UCP2 IN NASH 285

negative control (lower panel, Fig. 6B), demonstrating the specificity
of the Sp1-ChIP product. Therefore, we confirmed that Sp1 can bind
the ucp2 promoter at the �84/�61 site predicted by our gel-shift
analysis of the livers of rats with NASH (Fig. 6A).
To quantify the ChIP results showing an increase in Sp1 binding,
real-time PCR was performed (Fig. 6C/D). The relative quantity of
Sp1-ChIP DNA in non-fatty liver sample was 0.24% of the quantity
of input control DNA; however, this value was increased to 1.87% in
NASH-liver samples, an increase of nearly 7.7-fold. The results
of quantitative real-time PCR indicate that Sp1 can bind the
proximal promoter of ucp2, the binding of which is increased during
NASH.
DISCUSSION
Precious control of mouse ucp2 transcription has been extensively
studied by Medvedev et al. [2001, 2002] during observation of the
response of rat-derived INS-1 pancreatic beta cells to free fatty acid
(FFA) or the response of preadipocytes to PPARg stimulation. These
authors reported that an enhancer region (�86/�44) seems to be
crucial because deletion of this fragment would not only result in
reduction of the basal promoter activity, but also eliminate response
of the ucp2 gene to specific stimulation by FFA or PPARg.
Obviously, this enhancer region contains several potential binding
sites for Sp1, sterol regulatory element (SRE) and E-Box. Of the three
cis-elements, SRE and E-Box have been shown to be the main
modulators of ucp2 transcription. The role of Sp1 on regulation of
ucp2 transcription seemed also important. Mutation of Sp1 site
resulted in nearly 70% reduction in ucp2 promoter activity.
However, whether these factors are related to fatty liver, particularly
its coordinated contribution to pathogenesis of NASH remains
unclear. Here, we aimed to investigate Sp1-regulated ucp2
transcription in the livers of rats with NASH. In the present study,
a 0.5-kb fragment of the rat ucp2 proximal promoter was isolated
and the promoter activity was analyzed using reporter assay, gel
shift and ChIP. In particular, potential consensus Sp1-binding sites
in the 50-flanking region near to the transcription start site were
investigated. Classical regulatory elements such as TATA and CAAT
boxes do not exist in the rat ucp2 proximal promoter; instead, GC-
rich binding elements such as Sp1 and E-box motifs are located in
the proximal promoter, which is identical to the mouse ucp2
promoter [Yamada et al., 1998]. It was reported that the region
between nucleotide �233 and �34 in the mouse ucp2 promoter
revealed particularly strong enhancer activity [Yoshitomi et al.,
1999]. An 80-bp fragment (�141 to �66) in the human ucp2
promoter was considered to be a critical element for promoter
activity and tissue specificity [Tu et al., 1998].
The promoter assay in the present study demonstrated that
removal of the fragment from �458 to �264 bp led to a notable
change in promoter activity in two cell lines. In HepG2 cells, this
fragment seems to regulate ucp2 transcription negatively, whereas it
seems to function as a positive regulator in H4IIE cells (Fig. 2). So
far, we cannot find a reasonable explanation. Further study is
required to clarify whether the results are due to differential
response of the cell lines (H4IIE and HepG2) to Sp1 factor. However,
Fig. 6. In vitro and in vivo assay of Sp1 binding to ucp2 proximal promoter in
rat liver. A: EMSA was performed by incubating liver nuclear extracts from
normal and fatty rat liver tissue with probe (�84 to�61 bp) in the presence or
absence of specific competitors (unlabeled probe) and anti-Sp1 antibody.
B: ChIP assay of Sp1 bound to rat ucp2 promoter. Liver pieces from control
rats and rats with NASH were cross-linked in 1% formaldehyde. Chromatin was
extracted and fragmentized with sonication to an average size of 200–600 bp.
15 mg of chromatin was immunoprecipitated with UCP2 antibody. The pre-
cipitation was amplified by PCR for 25 cycles using specific primers, as indicated
in Table I, and the products were run on a 2.0% agarose gel with ethidium
bromide. An irrelevant antibody (IgG) was added as input control. Beta-actin
promoter was included as a negative control (lower panel). C,D: Real-time PCR of
ChIPed DNA in samples of NASH and control livers. The relative differences
between the input sample and Sp1 were determined using the DCT method (see
Materials and Methods Section). These values were presented as percentage
inputs in which the DNA reverse-cross-linked input sample was taken as 100%.
Data were the mean� SD from triplicate samples of three independent experi-
ments. �P< 0.01, compared with control group. [Color figure can be viewed in
the online issue, which is available at www.interscience.wiley.com.]
286 REGULATION OF UCP2 IN NASH JOURNAL OF CELLULAR BIOCHEMISTRY

deletion of the fragment from �264 to �60 bp led to a significant
and consistent decrease in promoter activities in both cells,
indicating that there exists a functionally regulatory cis-acting
element in this region. It is well known that Sp1 can regulate the
expression of many genes associated with fatty acid metabolism. We
next investigated whether the enhancement of ucp2 promoter
activity is attributable to removal of the Sp1-containing fragment
(from�264 to�60 bp). We found that a putative Sp1-binding site (a
GC-rich element with a core sequence of CCCGCC �83 to �78 nt)
might be crucial for basal promoter activity (Fig. 3A). Subsequently,
we used ChIP assay, which is a more reliable strategy than other in
vitro methods such as EMSA, and obtained a supporting data to
further confirm the interactive ability of transcriptional factor Sp1
to bind ucp2 promoter (Fig. 3B). Increasing the exogenous cellular
Sp1 content by introducing an Sp1-expressing vector confirmed the
ability of Sp1 to bind to its motif (�83 to �78 nt) in the ucp2
promoter of H4IIE cells, thereby increasing promoter activity
(Fig. 2B).
Sp1 is a member of a family of zinc-finger transcription factors
that includes at least four Sp proteins [Black et al., 1999, 2001;
Suske, 1999]. These transcription factors have important roles in
many physiological processes, including cell-cycle regulation,
hormonal activation, apoptosis and angiogenesis. Sp proteins share
several well-conserved functional domains such as the N-terminal
transcription activation domain and the C-terminal zinc-finger
DNA-binding domain [Kadonaga et al., 1987, 1988; Courey and
Tjian, 1988; Courey et al., 1989]. It has been reported that Sp1, even
bound to the distal promoter, strongly influence other transcription
factor bound to proximal elements of the promoter. For example, Spl
bound 1,700 nucleotides downstream of the RNA start site of the
herpes simplex virus thymidine kinase gene can act synergistically
with the factor bound at the normal upstream position at �100
[Courey et al., 1989]. Using electronic microscope Mastrangelo et al.
[1991] conclude this phenomenon as direct consequence of
interactions between remote and local Sp1, the remote Spl
translocated to the promoter by a DNA loop. Sp1 has an important
role in the transcriptional activation of many genes, including those
essential to fatty acid metabolism such as the gene encoding the
insulin receptor [Fukuda et al., 2001] and those encoding rate-
limiting enzymes in the biosynthesis of fatty acids (e.g., low-density
lipoprotein receptor, acetyl-CoA carboxylase and fatty acid
syntheses [Fukuda et al., 1997; Ikeda et al., 2001]). Sp1 is widely
expressed in various tissues and binds to GC-box motifs in
promoters. It is considered to be an essential element in the sterol
regulation of the rat fatty acid synthase gene [Wolf et al., 2001].
Prior to binding to the corresponding motif, Sp1 must be post-
translationally modified by glycosylation [Roos et al., 1997] and
phosphorylation [Black et al., 1999].
In rats, ucp2 is mapped on chromosome 1, and abnormal UCP2
expression was found in rats with glucose intolerance and adiposity
in type II diabetes [Fleury et al., 1997; Chan et al., 1999; Zhang et al.,
2001]. Many situations or factors such as a hyperlipidemic diet,
starvation, obesity, free fatty acids, leptin, thiazolidinediones,
thyroid hormones, endotoxin and phorbol ester also modulate ucp2
transcription or expression in various tissues or cell types [Krauss
et al., 2005]. However, to our knowledge, ours is the first attempt to
examine the effect of Sp1 on rat liver ucp2 expression in animals
with NASH.
In this study, the liver histopathology of rats fed a high-fat diet
ad libitum showed typical hepatic lesion associated with NASH:
steatosis, inflammation and early fibrosis. Chronically, because
excessive fat accumulation in the liver may be a predisposing
condition for hepatic inflammation, steatohepatitis and liver
cirrhosis (which leads to death [Matteoni et al., 1999]), efforts are
required to prevent fatty liver damage. In our investigation of
UCP2 expression and its possible relationship with Sp1 during the
accumulation of fat in liver, we observed a 3.5-fold increase in the
expression of ucp2 mRNA in the livers of rats with NASH
compared with rats without NASH (Fig. 5). Furthermore, we
showed that the expression of Sp1 and its increased binding
capacity have an important role in the pathogenesis of NASH in
rats. A recent study reported that Sp1 was hyperphosphorylated at
serine residues in the livers of MAT1A-knockout mice [Rubio
et al., 2007]. The authors reported that the level of Sp1
phosphorylation on serine but not threonine residues was
markedly increased in MAT1A-KO livers, whereas the total
hepatic Sp1 content remained unchanged. Moreover, Sp1
phosphorylation on serine residues was slightly increased in
liver samples from patients with NASH and steatosis compared
with subjects with normal hepatic function, suggesting that
activation of Sp1 may have a role in pathogenesis of steatosis and
NASH. The finding that Sp1 is hyperphosphorylated in both
steatosis and NASH could strongly support our present study.
In conclusion, the present study addresses the important role of
Sp1 regulation on ucp2 transcription in rat hepatic cells and in the
livers of rats with NASH. In this article, we have presented the first
evidence that Sp1 is directly involved in the transcription of rat ucp2
in H4IIE cells. The livers of rats with NASH expressed higher levels of
UCP2 than did the livers of rats without NASH, which we attribute to
the regulation of Sp1 bound to the ucp2 promoter.
ACKNOWLEDGMENTS
This work was supported by the National Natural ScienceFoundation of China (No. 30470643), the National ‘‘863’’ Project(2006AA02A410) and Beijing Municipal Commission of Education.We are grateful to Ms. Zeng XB and Sun HM for their preparationof histological slides. We also thank Mr. Guo D for his assistance offigure preparation.
REFERENCES
Baffy G. 2005. Uncoupling protein-2 and non-alcoholic fatty liver disease.Front Biosci 10:2082–2096.
Black AR, Jensen D, Lin SY, Azizkhan JC. 1999. Growth/cell cycle regulationof Sp1 phosphorylation. J Biol Chem 274:1207–1215.
Black AR, Black JD, Zizkhan-Clifford J. 2001. Sp1 and kruppel-like factorfamily of transcription factors in cell growth regulation and cancer. J CellPhysiol 188:143–160.
Brunt EM, Janney CG, Di Bisceglie AM, Neuschwander-Tetri BA, Bacon BR.1999. Nonalcoholic steatohepatitis: A proposal for grading and staging thehistological lesions. Am J Gastroenterol 94:2467–2474.
JOURNAL OF CELLULAR BIOCHEMISTRY REGULATION OF UCP2 IN NASH 287

Caldwell SH, Oelsner DH, Iezzoni JC, Hespenheide EE, Battle EH, Driscoll CJ.1999. Cryptogenic cirrhosis: Clinical characterization and risk factors forunderlying disease. Hepatology 29:664–669.
Chakravarty K, Wu SY, Chiang CM, Samols D, Hanson RW. 2004. SREBP-1cand Sp1 Interact to regulate transcription of the gene for phosphoenolpyr-uvate carboxykinase (GTP) in the liver. J Biol Chem 279:15385–15395.
Chan CB, MacDonald PE, Saleh MC. 1999. Overexpression of uncouplingprotein 2 inhibits glucose-stimulated insulin secretion from rat islets. Dia-betes 48:1482–1486.
Clark JM, Brancati FL, Diehl AM. 2002. Nonalcoholic fatty liver disease.Gastroenterology 122:1649–1657.
Cortez-Pinto H, Yang SQ, Lin HZ, Costa S, Hwang CS, Lane MD, Bagby G,Diehl AM. 1998. Bacterial lipopolysaccharide induces uncoupling protein-2expression in hepatocytes by a tumor necrosis factor-alpha-dependentmechanism. Biochem Biophys Res Commun 251:313–319.
Courey AJ, Tjian R. 1988. Analysis of Sp1 in vivo reveals multiple transcrip-tional domains including a novel glutamine-rich activation motif. Cell55:887–898.
Courey AJ, Holtzman DA, Jackson SP, Tjian R. 1989. Synergistic activationby the glutamine-rich domains of human transcription factor Sp1. Cell59:827–836.
Day CP. 2002. Non-alcoholic steatohepatitis (NASH): Where are we now andwhere are we going? Gut 50:585–588.
Farrell GC, Chitturi S, Lau GKK, Sollano JD. 2007. Guidelines for theassessment and management of non-alcoholic fatty liver disease in theAsia-Pacific region: Executive summary. J Gastroen Hepatol 22:775–777.
Fleury C, Neverova M, Collins S, Raimbault S, Champigny O, LeviMeyrueis C,Bouillaud F, Seldin MF, Surwit RS, Ricquier D, Warden CH. 1997. Uncouplingprotein-2: A novel gene linked to obesity and hyperinsulinemia. Nat Genet15:269–272.
Fromenty B, Robin MA, Igoudjil A, Mansouri A, Pessayre D. 2004. The insand outs of mitochondrial dysfunction in NASH. Diabetes Metab 30:121–138.
Fukuda H, Iritani N, Noguchi T. 1997. Transcriptional regulatory regionsfor expression of the rat fatty acid synthase. FEBS Lett 406:243–248.
Fukuda H, Noguchi T, Iritani N. 2001. Transcriptional regulation of insulinreceptor gene promoter in rat hepatocytes. Biochem Biophys Res Commun280:1274–1278.
GummowBM,Winnay JN, Hammer GD. 2003. Convergence ofWnt signalingand steroidogenic factor-1 (SF-1) on transcription of the rat inhibin alphagene. J Biol Chem 278:26572–26579.
Hidaka S, Kakuma T, Yoshimatsu H, Yasunaga S, Kurokawa M, Sakata T.1998. Molecular cloning of rat uncoupling protein 2 cDNA and its expressionin genetically obese Zucker fatty (fa/fa) rats. Biochim Biophys Acta1389:178–186.
Ikeda Y, Yamamoto J, Okamura M, Fujino T, Takahashi S, Takeuchi K,Osborne TF, Yamamoto TT, Ito S, Sakai J. 2001. Transcriptional regulationof the murine acetyl-CoA synthetase 1 gene through multiple clusteredbinding sites for sterol regulatory element-binding proteins and a singleneighboring site for Sp1. J Biol Chem 276:34259–34269.
Kadonaga JT, Carner KR, Masiarz FR, Tjian R. 1987. Isolation of cDNAencoding transcription factor Sp1 and functional analysis of the DNAbinding domain. Cell 51:1079–1090.
Kadonaga JT, Courey AJ, Ladika J, Tjian R. 1988. Distinct regions of Sp1modulate DNA binding and transcriptional activation. Science 242:1566–1570.
Kaisaki PJ, Woon PY, Wallis RH, Monaco AP, Lathrop M, Gauguier D. 1998.Localization of tub and uncoupling proteins (Ucp) 2 and 3 to a region of ratchromosome 1 linked to glucose intolerance and adiposity in the Goto-Kakizaki (GK) type 2 diabetic rats. Mamm Genome 9:910–912.
Krauss S, Zhang CY, Lowell BB. 2005. The mitochondrial uncoupling-proteinhomologues. Nat Rev Mol Cell Biol 6:248–261.
Lagor WR, de Groh ED, Ness GC. 2005. Diabetes alters the occupancy of thehepatic 3-hydroxy-3-methylglutaryl-CoA reductase promoter. J Biol Chem280:36601–36608.
Larrouy D, Laharrague P, Carrera G, ViguerieBascands N, LeviMeyrueis C,Fleury C, Pecqueur C, Nibbelink M, Andre M, Casteilla L, Ricquier D. 1997.Kupffer cells are a dominant site of uncoupling protein 2 expression in ratliver. Biochem Biophys Res Commun 235:760–764.
Lowry O, Rosebrough NJ, Farr AL, Randal RJ. 1951. Protein measurementswith the Folin phenol reagent. J Biol Chem 193:265–275.
Ludwig J, Viggiano TR, McGill DB, Oh BJ. 1980. Nonalcoholic steatohepa-titis: Mayo clinic experiences with a hitherto unnamed disease. Mayo ClinProc 55:434–438.
Mastrangelo IA, Courey AJ, Wall JS, Jackson SP, Hough P. 1991. DNAlooping and SpI multimer links: A mechanism for transcriptional synergismand enhancement. Proc Natl Acad Sci 88:5670–5674.
Matsuda J, Hosoda K, Itoh H, Son C, Doi K, Tanaka T, Fukunaga Y, Inoue G,Nishimura H, Yoshimasa Y, Yamori Y, Nakao K. 1997. Cloning of ratuncoupling protein-3 and uncoupling protein-2 cDNAs: Their gene expres-sion in rats fed high-fat diet. FEBS Lett 418:200–204.
Matteoni CA, Younossi ZM, Gramlich T, Boparai N, Liu YC, McCullough AJ.1999. Nonalcoholic fatty liver disease: A spectrum of clinical and patholo-gical severity. Gastroenterology 116:1413–1419.
Medvedev AV, Snedden SK, Raimbault S, Ricquier D, Collins S. 2001.Transcriptional regulation of the mouse uncoupling protein-2 gene.Double E-box motif is required for peroxisome proliferator-activatedreceptor-gamma-dependent activation. J Biol Chem 276:10817–10823.
Medvedev AV, Robidoux J, Bai X, Cao WH, Floering LM, Daniel KW, CollinsS. 2002. Regulation of the uncoupling protein-2 gene in INS-1 beta-cells byoleic acid. J Biol Chem 277:42639–42644.
Neuschwander-Tetri BA, Caldwell SH. 2003. Nonalcoholic steatohepatitis:Summary of an AASLD Single Topic Conference. Hepatology 37:1202–1219.
Ou XM, Chen K, Shih JC. 2004. Dual functions of transcription factors,transforming growth factor b-inducible early gene (TIEG)2 and Sp3, aremediated by CACCC element and Sp1 sites of human monoamine oxidase(MAO) B gene. J Biol Chem 279:21021–21028.
Pecqueur C, Cassard-Doulcier AM, Raimbault S, Miroux B, Fleury C, Gelly C,Bouillaud F, Ricquier D. 1999. Functional organization of the humanuncoupling protein-2 gene, and juxtaposition to the uncoupling protein-3gene. Biochem Biophys Res Commun 255:40–46.
Pecqueur C, ves-Guerra MC, Gelly C, Levi-Meyrueis C, Couplan E, Collins S,Ricquier D, Bouillaud F, Miroux B. 2001. Uncoupling protein 2, in vivodistribution, induction upon oxidative stress, and evidence for translationalregulation. J Biol Chem 276:8705–8712.
Pessayre D, Fromenty B. 2005. NASH: A mitochondrial disease. J Hepatol42:928–940.
Ricquier D, Bouillaud F. 1997. The mitochondrial uncoupling protein:Structural and genetic studies. Prog Nucleic Acid Res Mol Biol 56:83–108.
Roos MD, Su KH, Baker JR, Kudlow JE. 1997. O glycosylation of a Sp1-derived peptide blocks known Sp1 protein interactions. Mol Cell Biol17:6472–6480.
Rubio A, Guruceaga E, Vazquez-Chantada M, Sandoval J, Martinez-Cruz LA,Segura V, Sevilla JL, Podhorski A, Corrales FJ, Torres L, RodriguezM, Aillet F,Ariz U, Arrieta FM, Caballeria J, Martin-Duce A, Lu SC, Martinez-ChantarML, Mato JM. 2007. Identification of a gene-pathway associated with non-alcoholic steatohepatitis. J Hepatol 46:708–718.
Samaras SE, Cissell MA, Gerrish K, Wright CVE, Gannon M, Stein R. 2002.Conserved sequences in a tissue-specific regulatory region of the pdx-1 gene
288 REGULATION OF UCP2 IN NASH JOURNAL OF CELLULAR BIOCHEMISTRY

mediate transcription in pancreatic cells: Role for hepatocyte nuclear factor 3and Pax6. Mol Cell Biol 22:4702–4713.
Sauzeau V, Rolli-Derkinderen M, Marionneau C, Loirand G, Pacaud P. 2003.RhoA expression is controlled by nitric oxide through cGMP-dependentprotein kinase activation. J Biol Chem 278:9472–9480.
Schmittgen TD, Zakrajsek BA, Mills AG, Gorn V, Singer MJ, Reed MW. 2000.Quantitative reverse transcription-polymerase chain reaction to study mRNAdecay: Comparison of endpoint and real-time methods. Anal Biochem285:194–204.
Suske G. 1999. The Sp-family of transcription factors. Gene 238:291–300.
Tu N, Chen H, Winnikes U, Reinert I, Marmann G, Pirke KM, Lentes KU. 1998.Structural organization and mutational analysis of the human uncouplingprotein-2 (hUCP2) gene. Life Sci 64:PL41–PL50.
Wolf SS, Roder K, Schweizer M. 2001. Role of Sp1 and Sp3 in the transcrip-tional regulation of the rat fatty acid synthase gene. Arch Biochem Biophys385:259–266.
Yamada M, Hashida T, Shibusawa N, Iwasaki T, Murakami M, Monden T,Satoh T, Mori M. 1998. Genomic organization and promoter function of themouse uncoupling protein 2 (UCP2) gene. FEBS Lett 432:65–69.
Yoshitomi H, Yamazaki K, Tanaka I. 1999. Mechanism of ubiquitous expres-sion of mouse uncoupling protein 2 mRNA control by cis-acting DNAelement in 5(-flanking region. Biochem J 340:397–404.
Zhang CY, Baffy G, Perret P, Krauss S, Peroni O, Grujic D, Hagen T, Vidal-Puig AJ, Boss O, Kim YB, Zheng XX, Wheeler MB, Shulman GI, Chan CB,Lowell BB. 2001. Uncoupling protein-2 negatively regulates insulin secretionand is amajor link between obesity, cell dysfunction, and type 2 diabetes. Cell105:745–755.
JOURNAL OF CELLULAR BIOCHEMISTRY REGULATION OF UCP2 IN NASH 289