Incorporating RV-PCR Measurements into Characterization ...
1
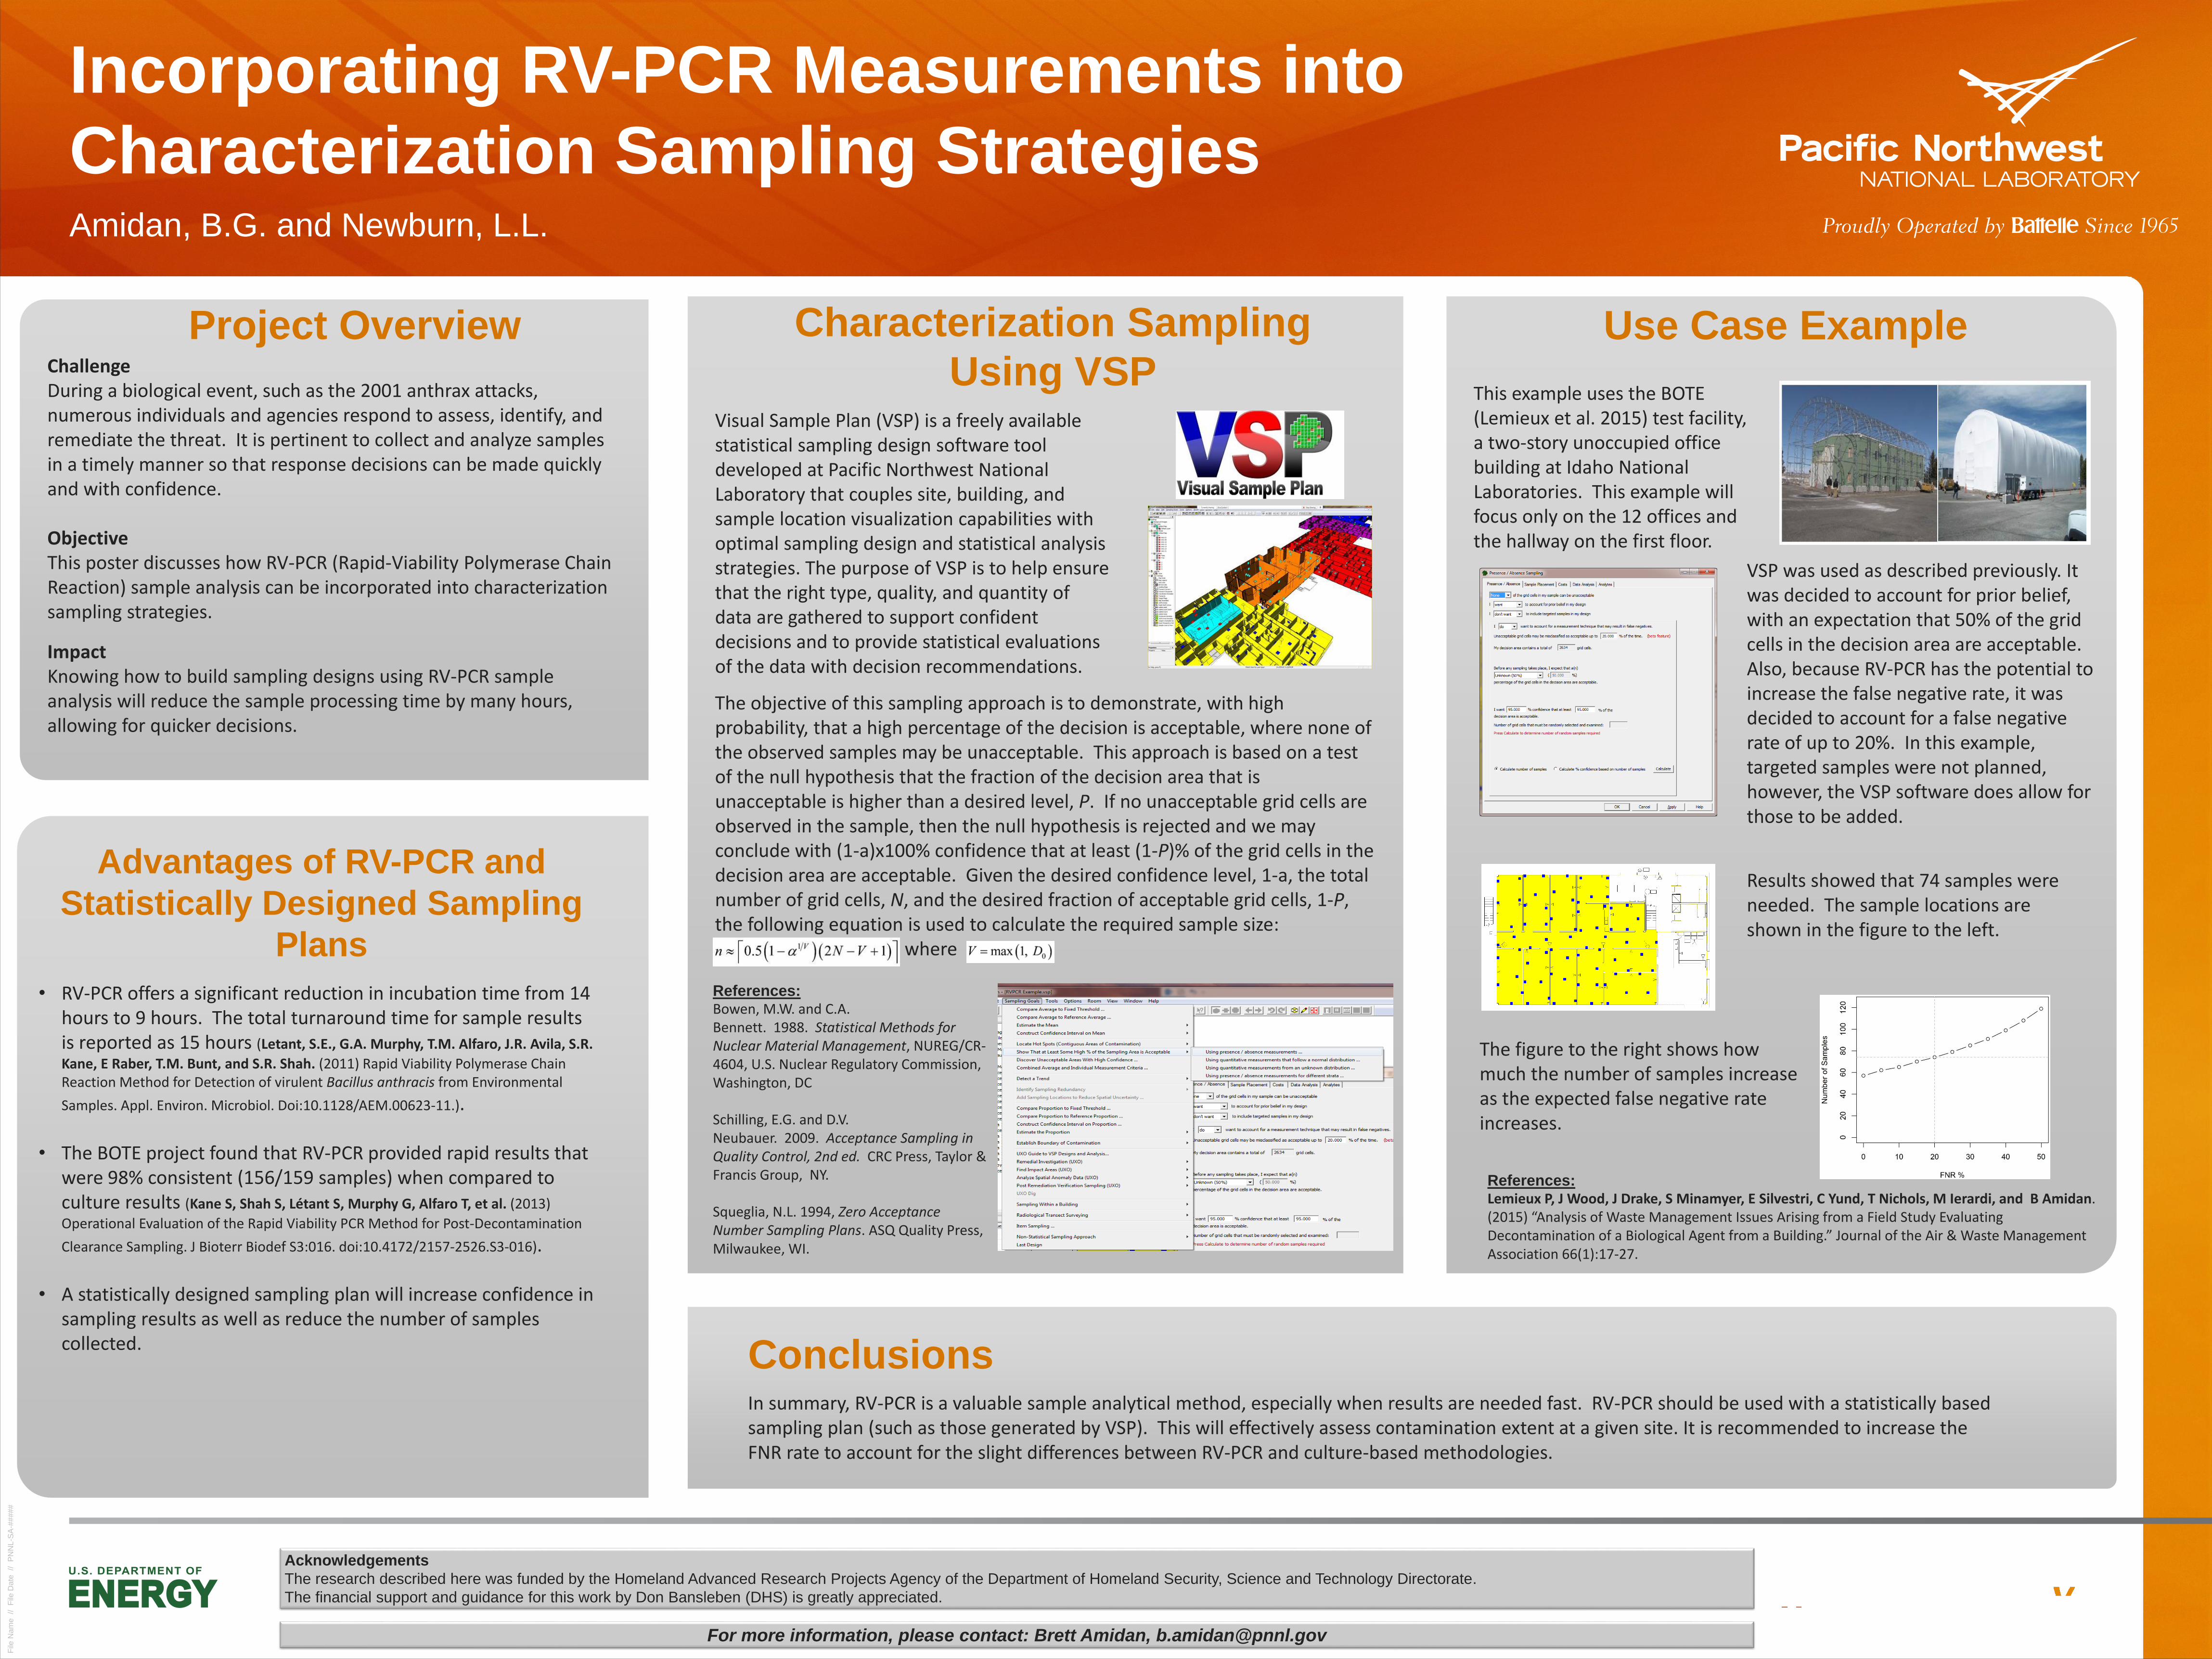
Incorporating RV-PCR Measurements into Characterization Sampling Strategies Amidan, B.G. and Newburn, L.L. File Name // File Date // PNNL-SA-##### Use Case Example Characterization Sampling Using VSP Project Overview Challenge During a biological event, such as the 2001 anthrax attacks, numerous individuals and agencies respond to assess, identify, and remediate the threat. It is pertinent to collect and analyze samples in a timely manner so that response decisions can be made quickly and with confidence. Objective This poster discusses how RV-PCR (Rapid-Viability Polymerase Chain Reaction) sample analysis can be incorporated into characterization sampling strategies. Impact Knowing how to build sampling designs using RV-PCR sample analysis will reduce the sample processing time by many hours, allowing for quicker decisions. Advantages of RV-PCR and Statistically Designed Sampling Plans Conclusions For more information, please contact: Brett Amidan, [email protected] Acknowledgements The research described here was funded by the Homeland Advanced Research Projects Agency of the Department of Homeland Security, Science and Technology Directorate. The financial support and guidance for this work by Don Bansleben (DHS) is greatly appreciated. In summary, RV-PCR is a valuable sample analytical method, especially when results are needed fast. RV-PCR should be used with a statistically based sampling plan (such as those generated by VSP). This will effectively assess contamination extent at a given site. It is recommended to increase the FNR rate to account for the slight differences between RV-PCR and culture-based methodologies. • RV-PCR offers a significant reduction in incubation time from 14 hours to 9 hours. The total turnaround time for sample results is reported as 15 hours (Letant, S.E., G.A. Murphy, T.M. Alfaro, J.R. Avila, S.R. Kane, E Raber, T.M. Bunt, and S.R. Shah. (2011) Rapid Viability Polymerase Chain Reaction Method for Detection of virulent Bacillus anthracis from Environmental Samples. Appl. Environ. Microbiol. Doi:10.1128/AEM.00623-11.). • The BOTE project found that RV-PCR provided rapid results that were 98% consistent (156/159 samples) when compared to culture results (Kane S, Shah S, Létant S, Murphy G, Alfaro T, et al. (2013) Operational Evaluation of the Rapid Viability PCR Method for Post-Decontamination Clearance Sampling. J Bioterr Biodef S3:016. doi:10.4172/2157-2526.S3-016). • A statistically designed sampling plan will increase confidence in sampling results as well as reduce the number of samples collected. Visual Sample Plan (VSP) is a freely available statistical sampling design software tool developed at Pacific Northwest National Laboratory that couples site, building, and sample location visualization capabilities with optimal sampling design and statistical analysis strategies. The purpose of VSP is to help ensure that the right type, quality, and quantity of data are gathered to support confident decisions and to provide statistical evaluations of the data with decision recommendations. The objective of this sampling approach is to demonstrate, with high probability, that a high percentage of the decision is acceptable, where none of the observed samples may be unacceptable. This approach is based on a test of the null hypothesis that the fraction of the decision area that is unacceptable is higher than a desired level, P. If no unacceptable grid cells are observed in the sample, then the null hypothesis is rejected and we may conclude with (1-a)x100% confidence that at least (1-P)% of the grid cells in the decision area are acceptable. Given the desired confidence level, 1-a, the total number of grid cells, N, and the desired fraction of acceptable grid cells, 1-P, the following equation is used to calculate the required sample size: where References: Bowen, M.W. and C.A. Bennett. 1988. Statistical Methods for Nuclear Material Management, NUREG/CR- 4604, U.S. Nuclear Regulatory Commission, Washington, DC Schilling, E.G. and D.V. Neubauer. 2009. Acceptance Sampling in Quality Control, 2nd ed. CRC Press, Taylor & Francis Group, NY. Squeglia, N.L. 1994, Zero Acceptance Number Sampling Plans. ASQ Quality Press, Milwaukee, WI. This example uses the BOTE (Lemieux et al. 2015) test facility, a two-story unoccupied office building at Idaho National Laboratories. This example will focus only on the 12 offices and the hallway on the first floor. VSP was used as described previously. It was decided to account for prior belief, with an expectation that 50% of the grid cells in the decision area are acceptable. Also, because RV-PCR has the potential to increase the false negative rate, it was decided to account for a false negative rate of up to 20%. In this example, targeted samples were not planned, however, the VSP software does allow for those to be added. Results showed that 74 samples were needed. The sample locations are shown in the figure to the left. The figure to the right shows how much the number of samples increase as the expected false negative rate increases. References: Lemieux P, J Wood, J Drake, S Minamyer, E Silvestri, C Yund, T Nichols, M Ierardi, and B Amidan. (2015) “Analysis of Waste Management Issues Arising from a Field Study Evaluating Decontamination of a Biological Agent from a Building.” Journal of the Air & Waste Management Association 66(1):17-27.
Transcript of Incorporating RV-PCR Measurements into Characterization ...
Incorporating RV-PCR Measurements into
Characterization Sampling StrategiesAmidan, B.G. and Newburn, L.L.
File
Na
me
//F
ile D
ate
//
P
NN
L-S
A-#
####
Use Case ExampleCharacterization Sampling
Using VSPProject Overview
Challenge During a biological event, such as the 2001 anthrax attacks, numerous individuals and agencies respond to assess, identify, and remediate the threat. It is pertinent to collect and analyze samples in a timely manner so that response decisions can be made quickly and with confidence.
Objective This poster discusses how RV-PCR (Rapid-Viability Polymerase Chain Reaction) sample analysis can be incorporated into characterization sampling strategies.
ImpactKnowing how to build sampling designs using RV-PCR sample analysis will reduce the sample processing time by many hours, allowing for quicker decisions.
Advantages of RV-PCR and
Statistically Designed Sampling
Plans
Conclusions
For more information, please contact: Brett Amidan, [email protected]
Acknowledgements
The research described here was funded by the Homeland Advanced Research Projects Agency of the Department of Homeland Security, Science and Technology Directorate.
The financial support and guidance for this work by Don Bansleben (DHS) is greatly appreciated.
In summary, RV-PCR is a valuable sample analytical method, especially when results are needed fast. RV-PCR should be used with a statistically based sampling plan (such as those generated by VSP). This will effectively assess contamination extent at a given site. It is recommended to increase the FNR rate to account for the slight differences between RV-PCR and culture-based methodologies.
• RV-PCR offers a significant reduction in incubation time from 14 hours to 9 hours. The total turnaround time for sample results is reported as 15 hours (Letant, S.E., G.A. Murphy, T.M. Alfaro, J.R. Avila, S.R.
Kane, E Raber, T.M. Bunt, and S.R. Shah. (2011) Rapid Viability Polymerase Chain Reaction Method for Detection of virulent Bacillus anthracis from Environmental
Samples. Appl. Environ. Microbiol. Doi:10.1128/AEM.00623-11.).
• The BOTE project found that RV-PCR provided rapid results that were 98% consistent (156/159 samples) when compared to culture results (Kane S, Shah S, Létant S, Murphy G, Alfaro T, et al. (2013)
Operational Evaluation of the Rapid Viability PCR Method for Post-Decontamination
Clearance Sampling. J Bioterr Biodef S3:016. doi:10.4172/2157-2526.S3-016).
• A statistically designed sampling plan will increase confidence in sampling results as well as reduce the number of samples collected.
Visual Sample Plan (VSP) is a freely available statistical sampling design software tool developed at Pacific Northwest National Laboratory that couples site, building, and sample location visualization capabilities with optimal sampling design and statistical analysis strategies. The purpose of VSP is to help ensure that the right type, quality, and quantity of data are gathered to support confident decisions and to provide statistical evaluations of the data with decision recommendations.
The objective of this sampling approach is to demonstrate, with high probability, that a high percentage of the decision is acceptable, where none of the observed samples may be unacceptable. This approach is based on a test of the null hypothesis that the fraction of the decision area that is unacceptable is higher than a desired level, P. If no unacceptable grid cells are observed in the sample, then the null hypothesis is rejected and we may conclude with (1-a)x100% confidence that at least (1-P)% of the grid cells in the decision area are acceptable. Given the desired confidence level, 1-a, the total number of grid cells, N, and the desired fraction of acceptable grid cells, 1-P, the following equation is used to calculate the required sample size:
where
References:Bowen, M.W. and C.A. Bennett. 1988. Statistical Methods for Nuclear Material Management, NUREG/CR-4604, U.S. Nuclear Regulatory Commission, Washington, DC
Schilling, E.G. and D.V. Neubauer. 2009. Acceptance Sampling in Quality Control, 2nd ed. CRC Press, Taylor & Francis Group, NY.
Squeglia, N.L. 1994, Zero Acceptance Number Sampling Plans. ASQ Quality Press, Milwaukee, WI.
This example uses the BOTE (Lemieux et al. 2015) test facility, a two-story unoccupied office building at Idaho National Laboratories. This example will focus only on the 12 offices and the hallway on the first floor.
VSP was used as described previously. It was decided to account for prior belief, with an expectation that 50% of the grid cells in the decision area are acceptable. Also, because RV-PCR has the potential to increase the false negative rate, it was decided to account for a false negative rate of up to 20%. In this example, targeted samples were not planned, however, the VSP software does allow for those to be added.
Results showed that 74 samples were needed. The sample locations are shown in the figure to the left.
The figure to the right shows how much the number of samples increase as the expected false negative rate increases.
References:Lemieux P, J Wood, J Drake, S Minamyer, E Silvestri, C Yund, T Nichols, M Ierardi, and B Amidan. (2015) “Analysis of Waste Management Issues Arising from a Field Study Evaluating Decontamination of a Biological Agent from a Building.” Journal of the Air & Waste Management Association 66(1):17-27.