
INCLUSION NUCLEATION, GROWTH, AND MIXING DURING STEEL DEOXIDATION...
33
Zhang, Thomas, and Pluschkell, will be submitted to Steel Research International, 1 INCLUSION NUCLEATION, GROWTH, AND MIXING DURING STEEL DEOXIDATION IN LADLE REFINING Prof. Lifeng ZHANG (Correspondence author) Department of Materials Science & Engineering, Norwegian University of Science & Technology (NTNU), Alfred Getz vei 2, N-7491 Trondheim, Norway, Tel: ++47--73594123 Fax: ++47— 73550203, Email: [email protected] Prof. Brian G. Thomas Department of Mechanical Engineering, University of Illinois at Urbana-Champaign, 356 Mechanical Engineering Building, 1206 W. Green St., Urbana, IL 61801, USA, Tel: 217-333-6919 Fax: 217-244-6534, Email: [email protected] Prof. Wolfgang Pluschkell Institut für Metallurgie, Technical University of Clausthal, Robert-Koch-Str.42, D-38679, Clausthal- Zellerfeld, Germany ABSTRACT A computational model based on classic homogenous nucleation theory, thermodynamic analysis and size-grouping collision simulation, has been developed to study steel deoxidation by aluminum in a low-carbon aluminum-killed steel ladle. The model calculates the nucleation and evolution of the alumina inclusion size distribution due to Ostwald ripening, Brownian collision and turbulent collision. Starting from rapid supersaturation with Al 2 O 3 “pseudo-molecules”, homogeneous nucleation is very fast, occurring mainly between 1μs and 10μs. The resulting stable inclusion nuclei are predicted to be only about 10-20 Å in diameter. Inclusions smaller than 1μm in radius, grow mainly by diffusion of pseudo-molecules and Brownian collision, and tend to be spherical. Inclusions larger than 2μm grow mainly by turbulent collisions, and tend to form clusters which retain features with minimum sizes of 1~2μm. The inclusion size distribution can reach 0.1~1μm by 6s and 0.1~36μm by 100s. Stirring power greatly affects the inclusion size distribution. It is recommended to first stir vigorously to encourage the collision of small inclusions into large ones, followed by a “final stir” that slowly recirculates the steel to facilitate their removal into the slag, while minimizing the generation of more large inclusions via collisions. KEY WORDS: Alumina inclusions, Steel deoxidation, Nucleation, Collision, Growth, Removal, Bubble Flotation, Stirring Power, Ladle refining
Transcript of INCLUSION NUCLEATION, GROWTH, AND MIXING DURING STEEL DEOXIDATION...

Zhang, Thomas, and Pluschkell, will be submitted to Steel Research International,
1
INCLUSION NUCLEATION, GROWTH, AND MIXING DURING STEEL DEOXIDATION IN LADLE REFINING
Prof. Lifeng ZHANG (Correspondence author)
Department of Materials Science & Engineering, Norwegian University of Science & Technology (NTNU), Alfred Getz vei 2, N-7491 Trondheim, Norway, Tel: ++47--73594123 Fax: ++47—73550203, Email: [email protected]
Prof. Brian G. Thomas
Department of Mechanical Engineering, University of Illinois at Urbana-Champaign, 356 Mechanical Engineering Building, 1206 W. Green St., Urbana, IL 61801, USA, Tel: 217-333-6919 Fax: 217-244-6534, Email: [email protected]
Prof. Wolfgang Pluschkell
Institut für Metallurgie, Technical University of Clausthal, Robert-Koch-Str.42, D-38679, Clausthal-Zellerfeld, Germany
ABSTRACT A computational model based on classic homogenous nucleation theory, thermodynamic analysis and size-grouping collision simulation, has been developed to study steel deoxidation by aluminum in a low-carbon aluminum-killed steel ladle. The model calculates the nucleation and evolution of the alumina inclusion size distribution due to Ostwald ripening, Brownian collision and turbulent collision. Starting from rapid supersaturation with Al2O3 “pseudo-molecules”, homogeneous nucleation is very fast, occurring mainly between 1μs and 10μs. The resulting stable inclusion nuclei are predicted to be only about 10-20 Å in diameter. Inclusions smaller than 1μm in radius, grow mainly by diffusion of pseudo-molecules and Brownian collision, and tend to be spherical. Inclusions larger than 2μm grow mainly by turbulent collisions, and tend to form clusters which retain features with minimum sizes of 1~2μm. The inclusion size distribution can reach 0.1~1μm by 6s and 0.1~36μm by 100s. Stirring power greatly affects the inclusion size distribution. It is recommended to first stir vigorously to encourage the collision of small inclusions into large ones, followed by a “final stir” that slowly recirculates the steel to facilitate their removal into the slag, while minimizing the generation of more large inclusions via collisions. KEY WORDS: Alumina inclusions, Steel deoxidation, Nucleation, Collision, Growth, Removal, Bubble Flotation, Stirring Power, Ladle refining

Zhang, Thomas, and Pluschkell, will be submitted to Steel Research International,
1
INTRODUCTION The demand for cleaner steel increases every year. Steel cleanliness depends on the amount, morphology and size distribution of the non-metallic inclusions it contains. There is a growing need to understand and predict the fundamental mechanisms of the formation and removal of inclusion particles from steel during deoxidation and refining operations in ladles and other metallurgical vessels. Inclusions arise from many sources, including deoxidation, reoxidation, slag entrapment, chemical reactions, and exogenous sources. [1-8] Their origin can be identified from their composition and shape in the final product, which ranges from dendritic alumina (Fig. 1a [9]), formed during deoxidation with a high oxygen content, coral structures formed by Ostwald ripening of dendritic inclusions (Fig. 1b [10]), clusters of particles, formed by collisions of small alumina spheres (Fig. 1c [11]), and large spheres of complex oxides, from liquid slag entrainment (Fig. 1d [8]). The size of the central globule, secondary dendrite arms, or the individual spherical inclusions in an inclusion cluster of indigenous alumina inclusions in Low Carbon Al-Killed (LCAK) steel [9-22] is consistently 1~4 µm (Fig. 2). Inclusion evolution and removal is affected by many complex phenomena, including the amount, morphology, density, composition, and delivery method of the deoxidant, steel composition, vessel geometry, transport by turbulent flow, interfacial tension, diffusion coefficient, the initial oxygen content, collisions with both bubbles and other particles, reoxidation, temperature, and the properties of the slag layer and vessel walls where inclusions may be removed or generated. Shortly after adding the deoxidizer, the inclusion particles nucleate and quickly grow. Inclusion growth can be controlled by diffusion of the deoxidization elements and oxygen [12, 23-27], “Ostwald-ripening”[12, 23,
27-29], Brownian collisions [12, 23-25, 27], turbulent collision [12, 23, 24, 28] and / or Stokes collision [23, 25, 27-
29]. With improved computer power, better computational models of these phenomena are being developed. This paper presents recent work to simulate the nucleation, growth, transport, and removal of alumina particles during steel deoxidation. Specifically, the evolution of the number and size distribution of alumina clusters are computed during steel deoxidation in a typical ladle refining operation. The contribution of different growth mechanisms to inclusion growth and the start and evolution of inclusion size distribution are investigated. Finally, the implications on operations such as stirring and refining are discussed.
NUCLEATION AND GROWTH MODELS The current computational model simulates the nucleation and growth of alumina inclusions during steel deoxidation, starting with a solute of “pseudo-molecules” of Al2O3. The assumed time-dependent concentration of pseudo-molecules evolves into a size distribution of molecular groups via diffusion and dissolution. If enough pseudo-molecules gather to form a stable nucleus, then nucleation (precipitation) occurs, meaning that the particle is stable. The stable inclusions can grow both by continued diffusion of pseudo-molecules, and by collision with other nucleated inclusions, via both Brownian and turbulent motion. The following assumptions are included in the model.
The Gibbs-Thomson equation [30] holds for all size particles; [31] The basic unit of the model is the “pseudo-molecule”. Ostwald-Ripening is considered, as both diffusion and dissolution of pseudo-molecules are
calculated throughout the process. The system is isothermal; The pseudo-molecules and clusters (inclusions) are spherical; The interfacial tension is independent of particle size.

Zhang, Thomas, and Pluschkell, will be submitted to Steel Research International,
2
Expressing particle size by the number of Al2O3 molecules in the particle, i, the evolution of the number of pseudo-molecules / particles of each size, Ni, is governed by the following population balance relations:
Cii <≤2 (before nucleation)
iiiiiiiD
iD
iii NANANNNN
dtdN
ααββ −++−= +++− 111111 (1)
Cii ≥ (after formation of stable inclusion particles)
( ) ( )( )1
1 1
1 1 1 1 1 1 1
1 12
iB T B Ti
i ij ij j ij j ,i j j ,i j j i jj j
D Di i i i i i i i i i
dN N N N Ndt
Collision of particles causing loss and generation of size i N N N N A N A N
φ β β φ δ β β
β β α α
∞ −
− − −= =
− − + + +
= − + + + +
− + + −
∑ ∑
Diffusion of Molecules to i and dissolution of molecules from i
(2)
There are serious computational issues involved in solving Eqs. (1) and (2), including both computation time and memory storage. Because the model is designed to simulate particle interactions from nucleation (concerned with individual molecules with sizes on the order of nanometers) up to the collision of real inclusion particles (on the order of microns), the particle size range varies over three orders of magnitude, containing from 1 to ~1013 molecules per particle. Solving Eqs. 1 and 2 with a simple linear scale is prohibitive for this real system. To render this challenging problem feasible to solve, a formulation is employed that can accurately handle such wide size ranges: the Size Grouping Model.
SIZE GROUPING MODEL FORMULATION The concept of this model is shown schematically in figure 3. In this model, the inclusions are divided into groups (group number k ) with average particle volumes related by the following ratio:
Vk
k RVV
=−1
(3)
where 2<RV<3 with a typical value of 2.5. Other choices of RV require slight changes to the following equations. With the current assumption, the radius and the volume of each group are
11VRV j
Vj−= (4)
13)1( rRr j
Vj−= (5)
where r1 is the radius of a pseudo-molecule. According to Mukai et al, Vm=3.433×10⁻⁵ m3/mol, so r1=2.39×10⁻¹⁰ m. [32] The typical radius of particles between groups j-1 and j is rj-1,j, which is the mean of rj-1 and rj, i.e.,
13
13
21
,1 21
2rRR
rrr
j
V
j
Vjj
jj ⎟⎟⎠
⎞⎜⎜⎝
⎛+=
+=
−−−
− (6)
1
3
31
32
,1 21 VRRV
j
V
j
Vjj⎥⎥⎦
⎤
⎢⎢⎣
⎡⎟⎟⎠
⎞⎜⎜⎝
⎛+=
−−
− (7)
Population Balance Equations The population balance of inclusions in size group j is affected by the following collisions, shown in
Zhang, Thomas, and Pluschkell, will be submitted to Steel Research International,
3
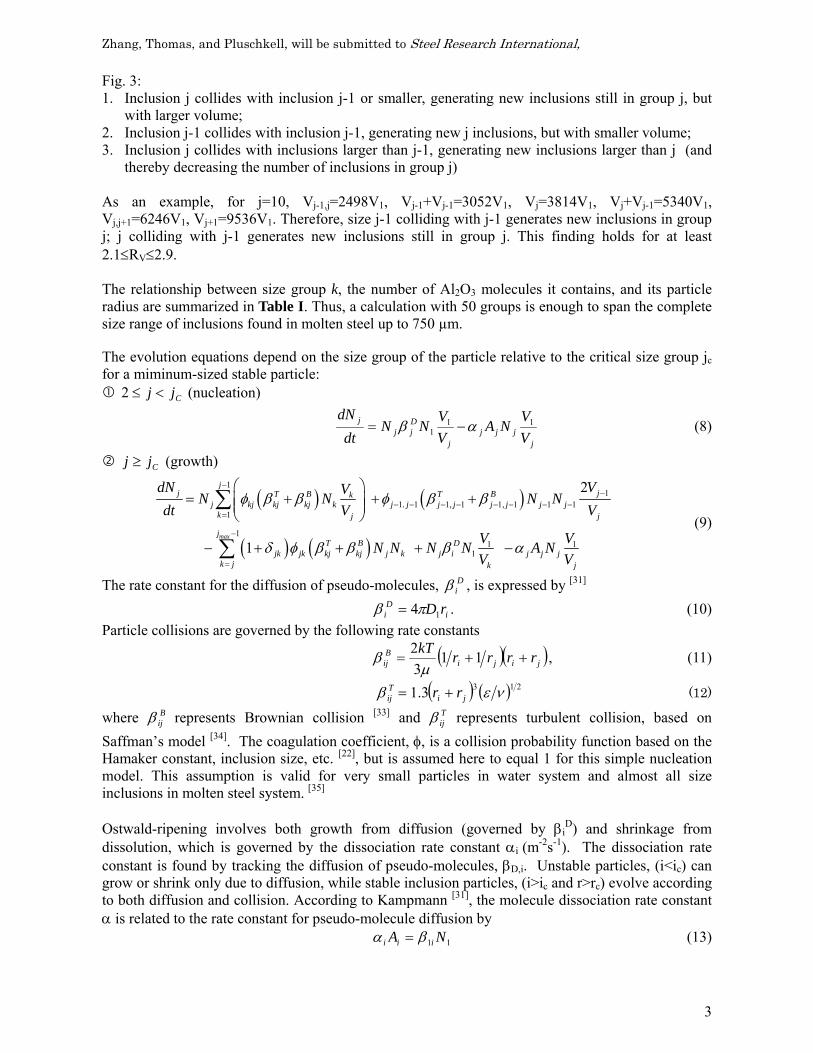
Fig. 3: 1. Inclusion j collides with inclusion j-1 or smaller, generating new inclusions still in group j, but
with larger volume; 2. Inclusion j-1 collides with inclusion j-1, generating new j inclusions, but with smaller volume; 3. Inclusion j collides with inclusions larger than j-1, generating new inclusions larger than j (and
thereby decreasing the number of inclusions in group j) As an example, for j=10, Vj-1,j=2498V1, Vj-1+Vj-1=3052V1, Vj=3814V1, Vj+Vj-1=5340V1, Vj,j+1=6246V1, Vj+1=9536V1. Therefore, size j-1 colliding with j-1 generates new inclusions in group j; j colliding with j-1 generates new inclusions still in group j. This finding holds for at least 2.1≤RV≤2.9. The relationship between size group k, the number of Al2O3 molecules it contains, and its particle radius are summarized in Table I. Thus, a calculation with 50 groups is enough to span the complete size range of inclusions found in molten steel up to 750 µm. The evolution equations depend on the size group of the particle relative to the critical size group jc for a miminum-sized stable particle:
Cjj <≤2 (nucleation)
jjjj
j
Djj
j
VV
NAVV
NNdt
dN 111 αβ −= (8)
Cjj ≥ (growth)
( ) ( )
( ) ( )
11
1 1 1 1 1 1 1 11
11 1
1
2
1max
jj jT B T Bk
j kj kj kj k j . j j , j j , j j jk j j
jT B D
jk jk kj kj j k j i j j jk j k j
dN VVN N N N dt V V
V V N N N N A N V V
φ β β φ β β
δ φ β β β α
−−
− − − − − − − −=
−
=
⎛ ⎞= + + +⎜ ⎟⎜ ⎟
⎝ ⎠
− + + + −
∑
∑ (9)
The rate constant for the diffusion of pseudo-molecules, Diβ , is expressed by [31]
iD
i rD14πβ = . (10) Particle collisions are governed by the following rate constants
( )( )jijiB
ij rrrrkT++= 11
32μ
β , (11)
( ) ( ) 2133.1 νεβ jiTij rr += (12)
where Bijβ represents Brownian collision [33] and T
ijβ represents turbulent collision, based on Saffman’s model [34]. The coagulation coefficient, φ, is a collision probability function based on the Hamaker constant, inclusion size, etc. [22], but is assumed here to equal 1 for this simple nucleation model. This assumption is valid for very small particles in water system and almost all size inclusions in molten steel system. [35] Ostwald-ripening involves both growth from diffusion (governed by βi
D) and shrinkage from dissolution, which is governed by the dissociation rate constant αi (m-2s-1). The dissociation rate constant is found by tracking the diffusion of pseudo-molecules, βD,i. Unstable particles, (i<ic) can grow or shrink only due to diffusion, while stable inclusion particles, (i>ic and r>rc) evolve according to both diffusion and collision. According to Kampmann [31], the molecule dissociation rate constant α is related to the rate constant for pseudo-molecule diffusion by
11 NA iii βα = (13)

Zhang, Thomas, and Pluschkell, will be submitted to Steel Research International,
4
The Gibbs-Thomson equation reads in the present notation [36]
( ) ⎟⎟
⎠
⎞
⎜⎜
⎝
⎛=⎟⎟
⎠
⎞⎜⎜⎝
⎛=
− 3111,1
1 12exp12
expiV
m
i
m
eq RrRTV
rRTV
NN σσ
. (14)
Thus
⎟⎟⎠
⎞⎜⎜⎝
⎛⋅==
−3
1
,11 expi
VeqD
iD
iii RBNNA ββα (15)
If fractal theory is included in the model to consider the effect of alumina cluster morphology, the radius of an alumina cluster can be given by [37]
11Cluster rMr fD
i = , (16) where M is the number of separate particles in the cluster ⎯ alumina molecules for the current investigation. For the current study, 1−= i
VRM , which yields
1
1Cluster rRr fD
i
Vi
−
= , (17) where Df is the fractal dimension. The value of Df is 1.3-1.8 [38] for microstructural features observed in two dimensions, but is actually 2.0-2.5 [39] for three dimensional observations. Df is assumed to be 3 in this work, and in this work rj refers to the equivalent radius sphere, so that its density is that of alumina. The effect of the radius and density of alumina clusters has been studied by Miki and Thomas [37], and will be investigated further in future work. Dimensionless versions of Eq.(8) and (9) can be obtained by making the following substitutions:
eq
ii N
NN
,1
* =
⎟⎟⎠
⎞⎜⎜⎝
⎛
⋅=
eqD N
tt,11
* 1β
DDi
Di 1
* βββ = (18) DB
ijB
ij 1*
βββ = DT
ijTij 1
* βββ =
⎟⎟⎠
⎞⎜⎜⎝
⎛ ⋅=
i
eqD
ii AN ,11* β
αα
According to classical homogenous nucleation theory, the critical radius of nucleus Cr is [12]
Π≡
ln2
RTVr m
Cσ . (19)
If Crr > , nucleation occurs, and stable particles precipitate and start to grow. According to Eq. (19), the critical size of nucleus decreases with increasing supersaturaion Π and decreasing surface tension, σ. If jc is the critical group number, beyond which nucleation occurs, the number of molecules in jc inclusions is:
1
1
11
1
−−
== CC
C jV
jvj RV
VRVV
. (20)
On the other hand, Eq.(19) also yields that the number of molecules in jc inclusions is:

Zhang, Thomas, and Pluschkell, will be submitted to Steel Research International,
5
3
1
3
1 ln12
⎟⎟⎠
⎞⎜⎜⎝
⎛Π
=⎟⎟⎠
⎞⎜⎜⎝
⎛RTr
Vrr mC σ
. (21)
Eq.(20) should equal to Eq.(21), which gives
⎟⎟⎠
⎞⎜⎜⎝
⎛Π
+=ln
12ln
ln31
1RTrV
Rj m
vc
σ (22)
For alumina inclusions, σ=0.5N/m, Rv=0.5, and Π=40 yield 2σVm/(RTr1)=9.22 and jc=4, which means that the critical size for nucleation is in group 4, including Rv4-1=64 alumina molecules. Supersaturation Model The supersaturation of free Al2O3 molecules, Π, in Eq.(19) is represented by
eqNN
,1
1≡Π , (23)
where N1,eq=2.634×10²³ m–3 corresponds to 3ppm dissolved oxygen in steel at equilibrium. According to a mass balance, the supersaturation can be expressed by
( ) ∑∞
=
=⋅−=Π2
1
,1,1 i
iv
eq
i
eq
S RNN
NtN
. (24)
where NS is the total number of Al2O3 molecules including those in nucleated inclusions, which is expressed as a function of dimensionless time by Eq.(25) [31]. This equation defines how fast the Al2O3 molecules appear and disperse in the liquid steel after the deoxidizer-Al is added.
⎥⎦
⎤⎢⎣
⎡−−= )exp(0.1)(
**,
**
τtNtN eqsS , (25)
where NS,eq is the equilibrium total number of Al2O3 molecules that form in the liquid steel, corresponding to the initial oxygen content before deoxidation. A time constant τ is introduced to account for the time needed for a lump of aluminum alloy added to the ladle to dissolve into aluminum atoms, after it is released from the steel shell that solidifies around it and later melts. [40] This constant defines the initial pseudo-molecular alumina concentration, due to reaction and diffusion of the deoxidant. The value of τ depends on the dissolution and diffusion of aluminum into molten steel, which requires consideration of the flow conditions.
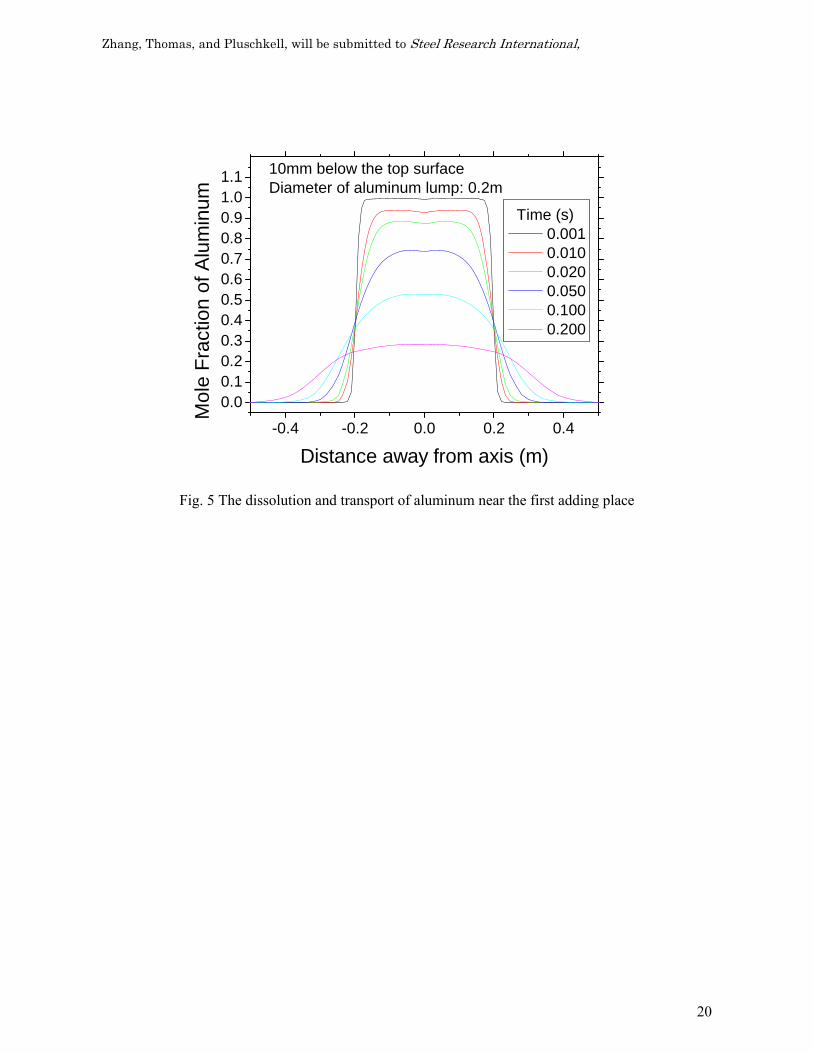
A three-dimensional multiphase fluid-flow computation was performed to investigate flow and aluminum dissolution in a typical 300tonne argon-stirred ladle (argon flow rate is 0.5 Nm3/min, ladle height is 4.5m). A finite-difference model based on FLUENT [41] is used to solve two sets of Navier-Stokes equations for coupled transport of liquid and argon gas with the standard k-ε model to account for turbulence in the liquid phase [42, 43]. The steel flow pattern is shown in Figure 4a). The dissolution of an aluminum lump at the ladle center is computed using a species diffusion - transport model for Al concentration, with the effective diffusion coefficient based on the standard k-ε model with Schmidt number of 0.9 [42, 43]. Results are shown in figure 4b). Figure 5 shows that the aluminum mole fraction distribution near the surface of the aluminum lump increases very rapidly as the lump dissolves into the surrounding molten steel. The dissolution occurs so quickly that the details of of the full-scale flow pattern and location of the alloy are secondary effects. Figure 6 shows that the volume of dissolved aluminum increases with time according to:
7.085.0 DD tV ⋅= (26)
Zhang, Thomas, and Pluschkell, will be submitted to Steel Research International,
6
Eqs.(8)-(9) are solved using the Runge-Kutta method. The following material properties are chosen to model steel deoxidation at 1823K: D1=2.5×10 – 9 m2/s (diffusion coefficient of oxygen in liquid steel, ( )TD 314.881900exp1059.5 7
1 −×= − ) [44], ρL=7000 kg/m3, ρp =2700 kg/m3, μL=0.0067 kg.m –
1s –1. The surface tension between Al2O3 particles and liquid steel is 0.5 N/m [45]. For N1,eq=2.634×10²³ m – 3 corresponding to the 3ppm dissolved oxygen in steel and D
1β =7.50×10⁻¹⁸ m3/s,
t*=1.98×10⁶t (27) Eq.(25) therefore can be rewritten into
⎟⎟⎠
⎞⎜⎜⎝
⎛−=
−
τ
*
*,
***, exp
)( tN
tNN
eqs
Seqs (28)
Now we assume
*,
***, )(
eqs
Seqs
NtNN −
=0.001, (29)
Substituting Eq(26), (27), and (29) into Eq.(28) gives Dt51087.2 ×=τ (30)
RESULTS
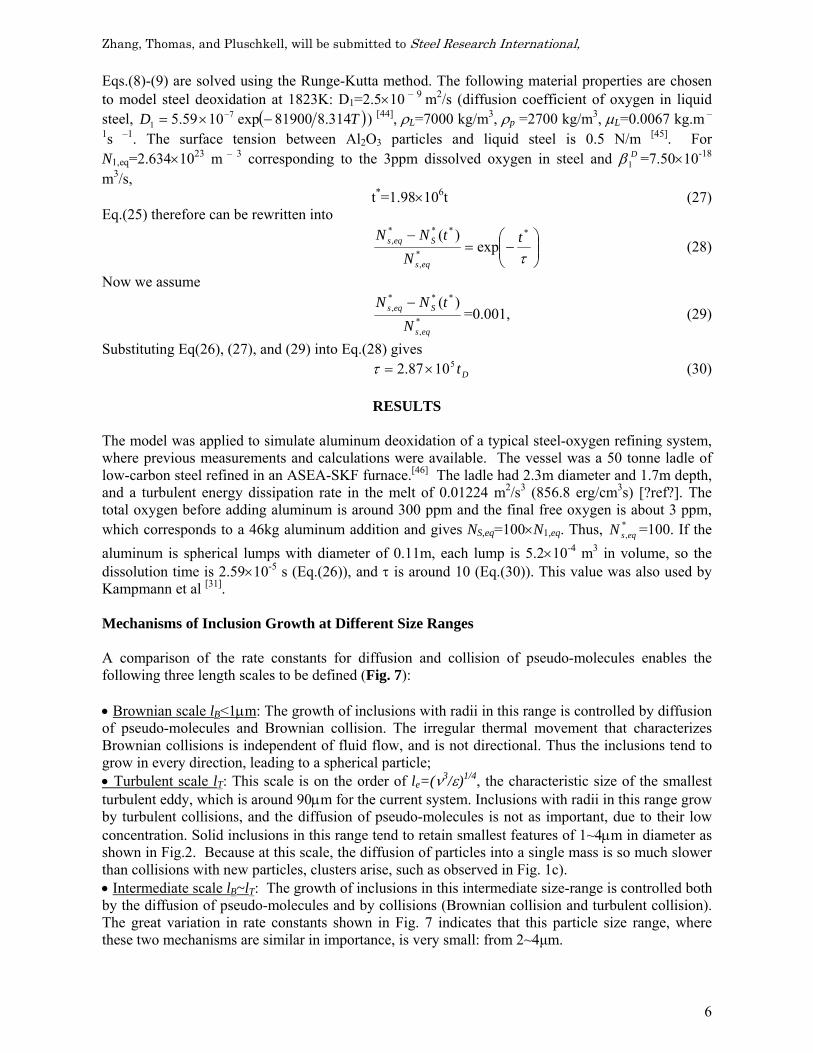
The model was applied to simulate aluminum deoxidation of a typical steel-oxygen refining system, where previous measurements and calculations were available. The vessel was a 50 tonne ladle of low-carbon steel refined in an ASEA-SKF furnace.[46] The ladle had 2.3m diameter and 1.7m depth, and a turbulent energy dissipation rate in the melt of 0.01224 m2/s3 (856.8 erg/cm3s) [?ref?]. The total oxygen before adding aluminum is around 300 ppm and the final free oxygen is about 3 ppm, which corresponds to a 46kg aluminum addition and gives NS,eq=100×N1,eq. Thus, *
,eqsN =100. If the aluminum is spherical lumps with diameter of 0.11m, each lump is 5.2×10⁻⁴ m3 in volume, so the dissolution time is 2.59×10⁻⁵ s (Eq.(26)), and τ is around 10 (Eq.(30)). This value was also used by Kampmann et al [31]. Mechanisms of Inclusion Growth at Different Size Ranges A comparison of the rate constants for diffusion and collision of pseudo-molecules enables the following three length scales to be defined (Fig. 7): • Brownian scale lB<1μm: The growth of inclusions with radii in this range is controlled by diffusion of pseudo-molecules and Brownian collision. The irregular thermal movement that characterizes Brownian collisions is independent of fluid flow, and is not directional. Thus the inclusions tend to grow in every direction, leading to a spherical particle; • Turbulent scale lT: This scale is on the order of le=(ν3/ε)1/4, the characteristic size of the smallest turbulent eddy, which is around 90μm for the current system. Inclusions with radii in this range grow by turbulent collisions, and the diffusion of pseudo-molecules is not as important, due to their low concentration. Solid inclusions in this range tend to retain smallest features of 1~4μm in diameter as shown in Fig.2. Because at this scale, the diffusion of particles into a single mass is so much slower than collisions with new particles, clusters arise, such as observed in Fig. 1c). • Intermediate scale lB~lT: The growth of inclusions in this intermediate size-range is controlled both by the diffusion of pseudo-molecules and by collisions (Brownian collision and turbulent collision). The great variation in rate constants shown in Fig. 7 indicates that this particle size range, where these two mechanisms are similar in importance, is very small: from 2~4μm.

Zhang, Thomas, and Pluschkell, will be submitted to Steel Research International,
7
The development of inclusion morphology is therefore summarized as follows: Initial inclusions grow spherically to 1 to 2 μm in radii due to diffusion and Brownian collision after nucleation. When there is a shortage of nuclei, single particles can grow into large dendritic structures due to unstable growth into high concentrations of diffusing pseudo-molecules. Otherwise, clusters of particles will form due to turbulent collisions resulting from flowing liquid steel. With time, the surface contours of all particles become progressively smoother due to the diffusion process called “Ostwald ripening”. These phenomena are investigated in more detail in the next section. Incubation, Nucleation and Growth of Inclusions Figure 8 tracks the supersaturation Π , the number of particles ζ and the critical size of nucleus ic as a function of time. After aluminum addition, the aluminum and oxygen react to form pseudo-molecules. Groups of pseudo-molecules are generated from diffusion. With the further addition and dispersion of aluminum, the concentration of pseudo-molecules continues to increase. At time t=t2, the radii of some groups of pseudo-molecules reach rc, so nucleation begins. Particles precipitate and start to grow. The calculations indicate that this incubation period, from 0~t2 is very short, only 0.53μs. At t=t2, the first particle appearing in the melt has ic=42 (r=8.3 Å). Thus i=42 is the largest group of pseudo-molecules; all larger groups nucleate to become particles. After time t2, smaller inclusions can precipitate and grow by diffusion of pseudo-molecules, and may collide with other inclusions. This starts a size distribution range. The supersaturation Π gradually increases from zero to its maximum (46.7) at time t*
3 =8.07 (t3=3.40μs). This corresponds to the decrease in critical nucleus size to its smallest-sized stable nucleus (rc =5.15Å, containing i=10 pseudo-molecules) at time t3. Groups containing less than 10 pseudo-molecules are not stable particles. Nucleation is possible only during the time period t*
2~t*5 (0.53~6.58μs), when the critical nucleus size is smaller
than the largest sized group of pseudo-molecules (forming by random diffusion). Figure 9 shows a histogram of the inclusion size distribution at different times, assuming that all inclusions with radii larger than 36μm are instantly removed to the top slag. With increasing time, the size distribution range grows, reaching 0.1~1μm at 6s and 0.1~36μm at 100s. When t=6s, the largest inclusion is around 2 μm diameter, which agrees roughly with the industrial measurements [47]. It takes about 100sec for the inclusions to grow to several tens of microns, which agrees well with the study of Kawawa et al [25]. Figure 10 indicates that with increasing time, the number of smaller inclusions drops, and more new larger inclusions are generated, mainly by collision. The inclusion concentration evolves with time. Each cluster size increases to a maximum value and then slowly decreases. After 720 seconds, the total oxygen concentration in the liquid steel is predicted to decrease to ~ 20 ppm, which agrees with the measurements of Nakanishi (figure 11). [46] The implications of these findings on operation of refining vessels are investigated in the next section. Effect of Stirring Power on Inclusion Growth and Removal Stirring power is an important parameter controlling the steel refining process. Strong mixing is required to encourage favorable metallurgical reactions, to bring the metal and slag into contact at their interface (e.g. desulphurisation, dephosphorisation, deoxidation, and inclusion removal). Less mixing is required, however, to avoid detrimental phenomena, such as maintenance of an unbroken slag layer, and avoiding erosion of the vessel refractories. The effect of stirring power on the oxygen removal rate constant is shown in Fig. 12 [48, 49]. Excessively strong stirring is detrimental as the upward circulation of steel onto the slag layer may expose an “eye” region of the steel surface to reoxidation and the lining may be seriously eroded. Table II gives the specific stirring powers for different refining process, based on analysis of literature data. Natural convection in the ladle and
Zhang, Thomas, and Pluschkell, will be submitted to Steel Research International,
8
flow through the tundish produces the lowest mixing power, while vigorous stirring in NK-PERM vessels has the largest. Argon gas bubbling, DH, and steel tapping are intermediate. The SEN delivering steel into the mold has a similar stirring power to the most vigorous refining processes, although the time is very short. The calculated effect of stirring power on inclusion size distribution is shown in Fig. 13, which indicates that increasing stirring power generates more large inclusions in the bulk. If these inclusions can be removed into the slag, this improves cleanliness. This is bad for steel cleanliness, however, if the stirring power is high at the end of refining, when the new large inclusions have no time to be removed. Therefore, the recommended practice is to first stir vigorously, to encourage the collision of small inclusions into large ones, followed by a final stir or “rinse” that slowly recirculates the steel to facilitate their removal into the slag while minimizing the generation of more large inclusions via collisions.
Ladle Mixing Times The constant τ in Eq. (25) quantifies the time for aluminum dissolution. Solid aluminum is added into the molten steel, where it eventually melts and is released to dissolve into free aluminum atoms. These aluminum atoms react with the free oxygen in the molten steel to generate alumina pseudo-molecules which evolve into inclusions. The calculated nucleation time is in the order of only 1μs, which is very fast compared with the mixing of aluminum atoms in the molten steel. Figure 14 shows the aluminum dispersion in an argon stirred ladle of molten steel continued from Fig.4, which indicates that the mixing process is ~ 8 orders of magnitude slower than the nucleation process. The aluminum mass fraction changes with time at different points as shown in Figure 15. The mixing time is defined as the time at which the mass fraction reaches 95% of the infinite average fraction. The calculated mixing times vary greatly at different points in the ladle, as shown in Figures 16 and 17. Within this uncertainty, the computations in Fig. 17 agree with previous measurements. [50] Inclusion trajectories in this argon-stirred ladle are shown in Fig.16, which indicates a long moving path length before inclusions reach the top surface to be removed. Increasing stirring power naturally decreases the mixing time, as shown in Fig. 17.
FUTURE WORK Fluid flow, mixing and inclusion motion at the scale of the refining vessel all should be fully incorporated in further simulations of inclusion nucleation, growth, transport, and removal. To do this, the turbulent multiphase Navier-Stokes equations should be solved together with the following transport equations for each inclusion size group:
( ) ( )[ ] ji
jeff
ijiTi
ij S
xN
Dx
NVux
Nt
=⎟⎟⎠
⎞⎜⎜⎝
⎛∂
∂
∂∂
−+∂∂
+∂∂
, (32)
where Nj is the concentration of inclusions (with radius rj) in number per m3 of molten steel. Transport depends on the molten steel velocities, ui and the terminal rising velocity of the inclusions, VT. For small particles, Stokes flow can be assumed, so VT is defined as follows (gravitational force is downward in z direction):
( ) 220 0
9p i
T ,i
grV , ,
ρ ρμ
⎛ ⎞−⎜ ⎟=⎜ ⎟⎝ ⎠
(33)
The effective diffusion coefficient, Deff, depends on the local effective viscosity, μeff, which is obtained from the turbulence model.

Zhang, Thomas, and Pluschkell, will be submitted to Steel Research International,
9
tp
effeff Sc
DDρμ
+= 1 (34)
where D1 is the laminar (molecular) diffusivity, m2/s; Sct is the turbulent Schmidt number. The source term at RHS of Eq.(32) should be represented by
Cjj <≤2 (nucleation)
jjjj
j
Djjj V
VNAVVNNS 11
1 αβ −= (35)
Cjj ≥ (growth)
( ) ( )
( )
2
111
1
1111,11,11.1
1
1
max
jjjj
k
Dij
j
jkkj
Bkj
Tkjjk
j
jjj
Bjj
Tjjjj
j
k j
kk
Bkj
Tkjkjjj
VV
NAVV
NNNN
VV
NNVV
NNS
αβββφ
ββφββφ
−++−
++⎟⎟⎠
⎞⎜⎜⎝
⎛+=
∑
∑−
=
−−−−−−−−−
−
= (36)
Eqs. (35) and (36) are from Eqs.(8) and (9).
CONCLUSIONS
1. A computational model based on classic homogenous nucleation theory, thermodynamic analysis and population balance equations, has been developed to study steel deoxidation by aluminum in a low carbon aluminum-killed steel ladle. The model calculates the nucleation and time evolution of the alumina inclusion size distribution due to Ostwald ripening (diffusion), Brownian collision and turbulent collision.
2. For the given conditions, the nucleation is very fast, occurring mainly between 1μs and 10μs. The stable inclusion nuclei are predicted to be only about 10-20 Å in diameter (containing on the order of 10-100 pseudo-molecules of alumina). After this time, the size distribution of the stable inclusion particles grows by the diffusion / dissolution of pseudo-molecules and by collisions. The inclusion size distribution grows from 0.1~1μm radius particles at 6s to 0.1~36μm at 100s. .
3. The growth of inclusions smaller than 1μm, is mainly controlled by diffusion of pseudo-molecules and Brownian collision. Inclusions in this range tend to be spherical, due to the rapid Ostwald ripening. The growth of inclusions larger than 2μm is mainly controlled by turbulent collisions. Inclusions in this range tend to form clusters which retain minimum feature sizes of 1~2μm.
4. Computations of the inclusion size range in a ladle roughly agree with experimental measurements.
5. The inclusion size distribution evolves to form larger inclusions with increasing stirring power. Actual steel refining processes have a range of different stirring powers.
6. For optimal inclusion removal, it is recommended to first stir vigorously, to encourage the collision of small inclusions into large ones. This should be followed by a final stir that slowly recirculates the steel to facilitate their removal into the slag while minimizing the generation of more large inclusions via collisions.
7. Mixing simulations reveal that mixing requires several hundred seconds, depending on location in the ladle and stirring power. This is 8 orders of magnitude slower than nucleation phenomena.
8. Further studies should be coupled with fluid flow and include the effects of deoxidant composition (Si and Al), deoxidant flow transport, interfacial tension, diffusion coefficient,
Zhang, Thomas, and Pluschkell, will be submitted to Steel Research International,
10
the initial oxygen content, and temperature on inclusion nucleation and growth. In addition, the phenomena of bubble-related collisions, cluster morphology, reoxidation, realistic inclusion transport and collision in the turbulent flowing liquid, and removal at the top slag layer and walls on inclusion evolution also need investigation before steel deoxidation and inclusion phenomena can be fully understood.
NOMENCLATURE
Ai The surface area of particle i, m2
D1 the diffusion coefficient of the pseudo-molecules in liquid , m2s – 1
Df Fractal dimension i, j The particle size, namely, this particle is comprised of i pseudo-molecules or j
pseudo-molecules ic the critical size for nucleus, m k The Boltzmann constant, J.K – 1
le The size of the smallest eddy in turbulence flow, m lB,lI,lT Brownian scale, Intermediate scale, and turbulence scale respectively, m M The number of separate particles in a cluster NA The Avogadro number, mol –1
N1 The concentration of the dissolved pseudo-molecules, m – 3 N1,eq The concentration of the dissolved pseudo-molecules at equilibrium, m – 3
Ni The average concentration of the particle i , m – 3
NS(t) The total number of molecules including those in particles in the molten steel, m-3
NS,eq The total number of molecules including those in particles in the molten steel at the equilibrium state, m-3
R Gas constant, 8.314 J.k-1mol-1
Rv The ratio of volume of inclusions in two neighboring groups r The particle radius, m rc The critical radius for nucleation, m
Clusterir Radius of aluminum cluster, m
ri The radii of the particle i , m r1 the radius of the pseudo-molecule, m T The absolute temperature, K t Time, s t2 Time for the beginning of nucleation, s t3 Time at Π=Πmax, s t5 Time for the ending of nucleation period, s tD Dissolution time of aluminum in molten steel, s t* The dimensionless time Vi The typical volume of inclusions in group I, m3 VD Dissolution volume of aluminum in molten steel, m3
Vm Molecular volume of alumina inclusions, m3/mol αi The number of pseudo-molecules which dissociate per unit time from unit area of a
particle of size group i , m – 2s – 1 βD
i The diffusion rate constant of the molecules m3 s –1
βBij, βT
ij Brownian and turbulent collision rate constant, m3 s –1 δij The Kronecker’s delta function (δij=1 for i=j, and (δij=1 for i≠j ) ε The turbulent energy dissipation rate, m2s –3

Zhang, Thomas, and Pluschkell, will be submitted to Steel Research International,
11
Π The supersaturation of the parents phase, or the dimensionless concentration of pseudo-molecules
μ The viscosity of the liquid, kg.m –1 s –1
φij The coagulation coefficient of inclusions i and j[22] ρL The density of liquid, kg.m – 3
ρp The density of particles, kg.m – 3
σ The interfacial tension between alumina and liquid steel, N.m –1
τ Dimensionless time constant for aluminum dissolution and diffusion ζ The total dimensionless number density of growing particles ν The viscosity of the liquid, m2s –1
Superscripts * Dimensionless value
ACKNOWLEDGEMENTS The authors would like to thank the National Science Foundation (NSF-Grant # DMI-01-15486) and the Continuous Casting Consortium (CCC) at the University of Illinois at Urbana-Champaign (UIUC) for their support of this research. This investigation was also funded by the Deutsche Forschungsgemeinschaft (Contract PL70/10-1), and the authors Lifeng Zhang and Wolfgang Pluschkell greatly appreciate this support.
REFERENCES 1. S. Chakraborty and W. Hill, "Reduction of Aluminum Slivers at Great Lakes No.2 CC," 77th
Steelmaking Conf. Proc., ISS, Warrendale, PA, Vol. 77, 1994, 389-395. 2. S. Chakraborty and W. Hill, "Improvement in Steel Cleanliness at Great Lakes No.2
Continuous Caster," 78th Steelmaking Conf. Proc., ISS, Warrendale, PA, Vol. 78, 1995, 401-413.
3. F.L. Kemeny, "Tundish Nozzle Clogging - Measurement and Prevention," in McLean Symposium Proceedings, ISS, Warrendale, PA, 1998, 103-110.
4. B.G. Thomas and H. Bai, "Tundish Nozzle Clogging ?Application of Computational Models," 78th Steelmaking Conf. Proc., Iron and Steel Society, Warrendale, PA, 2001, 895-912.
5. M. Byrne, T.W. Fenicle and A.W. Cramb, "The Sources of Exogenous Inclusions in Continuous Cast, Aluminum-Killed Steels," ISS Trans., Vol. 10, 1989, 51-60.
6. E.S. Szekeres, "Review of Strand Casting Factors Affecting Steel Product Cleanliness," 4th International Conference on Clean Steel,, (Balatonszeplak, Hungary), The Institute of Materials, London, UK, 1992, 756-776.
7. L. Ferro, J. Petroni, D. Dalmaso, J. Madias, C. Cicutti, "Steel Cleanliness in Continuous Casting Slabs," Steelmaking Conference Proceeding, (Warrendale, PA), ISS, Vol. 79, 1996, 497-502.
8. L. Zhang, B.G. Thomas, X. Wang, K. Cai, "Evaluation and Control of Steel Cleanliness - Review," in 85Steelmaking Conference Proceedings, Vol. 85, ISS, Warrandale, PA, 2002, 431-452.
9. R.A. Rege, E.S. Szekeres and W.D. Forgeng, "Three-Dimensional View of Alumina Clusters in Aluminum-Killed Low-Carbon Steel," Met. Trans. AIME, Vol. 1 (9), 1970, 2652.

Zhang, Thomas, and Pluschkell, will be submitted to Steel Research International,
12
10. R. Rastogi and A.W. Cramb, "Inclusion Formation and Agglomeration in Aluminum-killed Steels," in 2001 Steelmaking Conference Proceedings, Vol. 84, ISS, Warrendale, (Baltimore, Maryland, USA), 2001, 789-829.
11. T.B. Braun, J.F. Elliott and M.C. Flemings, "The Clustering of Alumina Inclusions," Metal. Trans. B, Vol. 10B (6), 1979, 171-184.
12. E.T. Turkdogan, "Deoxidation of Steel," JISI, 1972, 21-36. 13. K. Okohira, N. Sato and H. Mori, "Observation of Three-Dimensional Shapes of Inclusions
in Low-Carbon Aluminum-Killed Steel by Scanning Electron Microscope," Trans. ISIJ, Vol. 14, 1974, 103-109.
14. M. Olette, "Institut de Recherches de La Siderurgie Francaise," Report, IRSIO, 1972. 15. K. Asano and T. Nakano, "Deoxidation of Molten Steel with Deoxidizer," Trans. ISIJ, Vol.
12, 1972, 343-349. 16. H. Ooi, T. Sekine and G. Kasai, "On the Mechanisms of Alunima Cluster Formation in
Molten Iron," Trans. ISIJ, Vol. 15, 1975, 371-379. 17. N. Aritomi and K. Gunji, "Morphology and Formation Mechanism of Dendritic Inclusions in
Iron and Iron-Nickel Alloys Deoxidized with Silicon and Solidified Unidirectionally," Trans. ISIJ, Vol. 19, 1979, 152-161.
18. N. Aritomi and K. Gunji, "On the Formation of Dendritic Inclusion from a Spherical Primary Silica in Iron-10% Nickel Alloy Deoxidized with Silicon," Trans. ISIJ, Vol. 20, 1980, 26-32.
19. Y. Miki, H. Kitaoka, T. Sakuraya, T. Fujii, "Mechanism for Separating Inclusions from Molten Steel Stirred with a Rotating Electro-Magnetic Field," ISIJ Inter., Vol. 32 (1), 1992, 142-149.
20. W.K. Tiekink, A. Pieters and J. Hekkema, "Al2O3 in Steel: Morphology Dependent on Treatment," I & Smaker, Vol. 21 (7), 1994, 39-41.
21. T. Murai, H. Matsuno, E. Sakurai, H. Kawashima, "Separation Mechanism of Inclusion from Molten Steel during RH Treatment," Tetsu-to-Hagane, Vol. 84 (1), 1998, 13-18.
22. L. Zhang and S. Taniguchi, "Fluid Flow and Inclusion Removal in Continuous Casting Tundish," Metal. & Material Trans. B., Vol. 31B (2), 2000, 253-266.
23. Y. Miyashita and K. Nishikawa, "Measurement of Size Distribution of Nonmetallic Inclusions in Steel," Trans. ISIJ, Vol. 8, 1968, 181-185.
24. S. Linder, "Hydrodynamics and Collisions of Small Particles in a Turbulence Metallic Melt with Special Reference to Deoxidation of Steel," Scand. J. Metallurgy, Vol. 3, 1974, 137-150.
25. T. Kawawa and M. Ohkubo, "A Kinetics on Deoxidation of Steel," Trans. ISIJ, Vol. 8, 1968, 203-219.
26. E.T. Turkdogan, "Nucleation, Growth, and Flotation of Oxide Inclusions in Liquid Steel," JISI, 1966, 914-919.
27. M. Suzuki, R. Yamaguchi, K. Murakami, M. Nakada, "Inclusion Particle Growth during Solidification of Stainless Steel," ISIJ Inter., Vol. 41 (3), 2001, 247-256.
28. U. Lindborg and K. Torssell, "A Collision Model for the Growth and Separation of Deoxidation Products," Trans. ASME, Vol. 242, 1968, 94-102.
29. K. Nogi, "Wetting Phenomena in Materials Processing," Tetsu-to-Hagane, Vol. 84 (1), 1998, 1-6.
30. J. Miyake and M.E. Fine, "Electrical Resistivity and the Gibbs-Thomson Equations," Scripta Metallurgica et Materialia, Vol. 25, 1991, 191-194.
31. L. Kampmann and M. Kahlweit, "On the Theory of Precipitations II," Berichte der Bunsen-Gesellschaft physikalische Chemie, Vol. 74 (5), 1970, 456-462.
32. K. Mukai, H. Sakao and K. Sano, "Non-metallic Inclusions Formed by Deoxidation Reaction in the Deoxidation Process- Deoxidation Reaction Zone," Trans. ISIJ, Vol. 9, 1969, 196-203.
33. S. Taniguchi and A. Kikuchi, "Mechanisms of Collision and Coagulation between Fine Particles in Fluid," Tetsu-to-Hagane, Vol. 78 (4), 1992, 527-535.

Zhang, Thomas, and Pluschkell, will be submitted to Steel Research International,
13
34. P.G. Saffman and J. S. Turner, "On the Collision of Drops in Turbulent Clouds," J. Fluid Mech., Vol. 1, 1956, 16-30.
35. L. Zhang, "Discussion of coagulation coefficient of particles in water and in molten steel," Metal. & Material Trans., 2006, Under preparation.
36. J.M. B. Krishnamachari, B. Cooper, J. Stehna, "Gibbs-Thomson Formula for Small Island Sizes: Corrections for High Vapor Densities," Physical Review B, Vol. 54 (12), 1996, 8899-8907.
37. Y. Miki and B.G. Thomas, "Modeling of Inclusion Removal in a Tundish," Metall. Mater. Trans. B, Vol. 30B (4), 1999, 639-654.
38. J.L. LaRosa and J.D. Cawley, "Fractal Dimension of Alumina Aggregates Grown in Two Dimensions," J. Am. Ceram. Soc., Vol. 75 (1), 1992, 1981-1984.
39. D. Romeu, A. Gomez, J.G.Perez-Ramirez, R. Silva, O.L. Peres, A.E. Gonzalez, M. Jose-Yacaman, "Surface Fractal of Small Metallic Particles," Physical Review Letters, Vol. 57 (20), 1986, 2552-2556.
40. J. Aoki, B.G. Thomas, J. Peter, K.D. Peaslee, "Experimental and Theoretical Investigation of Mixing in a Bottom Gas-Stirred Ladle," in AISTech2004, ISS, Warrandale, PA, 2004, 1045-1056.
41. FLUENT6.1-Mannual, Report, Fluent Inc., Lebanon, New Hampshire, 2003. 42. L. Zhang, B.G. Thomas, K. Cai, L. Zhu, J. Cui, "Inclusion Investigation during Clean Steel
Production at Baosteel," in ISSTech2003, ISS, Warrandale, PA, 2003, 141-156. 43. J. Aoki, L. Zhang and B.G. Thomas, "Modeling of inclusion removal in ladle refining," in
ICS 2005 - The 3rd International Congress on the Science and Technology of Steelmaking, AIST, Warrandale, PA, (May 9-12, 2005, Charlotte, NC), 2005, 319-322.
44. K. Mori and K. Suzuki, "Diffusion of Oxygen in Liquid Iron," Trans. ISIJ, Vol. 12, 1972, 464-471.
45. K. Wasai and K. Mukai, "Thermodynamics of Nucleation and Supersaturation for the Aluminum-Deoxidation Reaction in Liquid Iron," Metal. & Material Trans. B., Vol. 30B (6), 1999, 1065-1074.
46. K. Nakanishi and J. Szekely, "Deoxidation Kinetics in a Turbulent Flow Field," Trans. ISIJ, Vol. 15, 1975, 522-530.
47. F. Oeters, Metallurgy of Steelmaking, Verlag Stahleisen mbH, 1994, 347. 48. K. Ogawa, "Slag Refining for Production of Clean Steel," in Nishiyama Memorial Seminar,
Vol. 143/144, Iron and Steel Institute of Japan, (ISS, Tokyo), 1992, 137-166. 49. M. Matsuno, Y. Kikuchi, M. Komatsu, M. Arai, K. Watanabe, H. Nakashima, "Development
of New Deoxidation Technique for RH Degassers," I & Smaker, Vol. 20 (7), 1993, 35-38. 50. J. Szekely, C.W. Chang and T. Lehner, "Flow Phenomena, Mixing and Mass Transfer in
Argon-Stirred Ladles," Ironmaking & Steelmakaing, Vol. 6, 1979, 285.

Zhang, Thomas, and Pluschkell, will be submitted to Steel Research International,
14
Table I The group number and its radius in size group model
Group No. ( k ) Monomers contained kr (μm)
1 2.50=1 2.39×10 – 4
2 2.51=2.5 3.24×10 – 4 3 2.52=6.25 4.40×10 – 4 10 2.59=3.8×10³ 3.73×10 – 3 20 2.519=3.6×10⁷ 7.91×10 – 2 30 2.529=3.5×10¹¹ 1.68 40 2.539=3.3×10¹⁵ 35.61 50 2.549=3.2×10¹⁹ 755.24

Zhang, Thomas, and Pluschkell, will be submitted to Steel Research International,
15
Table II Stirring powers for different processes and regimes
Stirring pattern Power (Watt/ton) Argon gas bubbling [43, 45] 2-130 [43], 43-214 [45] Tapping steel [45] 17-286 DH [45] 72-100 ASEA-SKF [43, 45, 46] 7-29 [45], 10-250 [43], 200-600 [46] PM (Pulsation Mixing) [45] 10 RH [44, 45] 86-114 [45], 200-400 (conventional) [44], 500-
3000 (NK-PERM) [44] VOD [44] 10-400 (conventional), 100-800 (NK-PERM) Outlet of SEN in continuous casting mold [46] 470-800 Tundish inlet zone [46] 10-50 60 ton ladle [46] 1-50

Zhang, Thomas, and Pluschkell, will be submitted to Steel Research International,
16
Fig. 1 Alumina inclusion morphologies: a) dendritic cluster [9], b) coral structure [10] c) alumina cluster [11], and d) slag inclusions [8]
10μm
a
c
10μm
b
400μm
d

Zhang, Thomas, and Pluschkell, will be submitted to Steel Research International,
17
0 1 2 3 4 5 6 7 8 90
10
20
30
40
50
Fre
quen
cy (%
)
Diameter of first arm, second arm or separate particles in cluster ( μm )
Fig. 2 The smallest size feature of inclusions as shown in Fig.1 a), b) and c).

Zhang, Thomas, and Pluschkell, will be submitted to Steel Research International,
18
Fig.3 Schematic of inclusion population balance for the group j
+
Collision related to group j:
+ k<j-1
k j j
+ j-1 j-1 j
j m n
m≥j n= j+1 if m=j n=m if m>j
Num
ber d
ensi
ty o
f
rj
rj+1
rj-1
Group radius, r
Group j-1 Group jGroup j+1
rj,j+1
rj-1,j

Zhang, Thomas, and Pluschkell, will be submitted to Steel Research International,
19
Fig.4 Fluid flow and aluminum dissolution in a 300 argon-stirred steel ladle
t=0s t=0.05s
Zhang, Thomas, and Pluschkell, will be submitted to Steel Research International,
20
-0.4 -0.2 0.0 0.2 0.4
0.00.10.20.30.40.50.60.70.80.91.01.1
Mol
e Fr
actio
n of
Alu
min
um
Distance away from axis (m)
Time (s) 0.001 0.010 0.020 0.050 0.100 0.200
10mm below the top surfaceDiameter of aluminum lump: 0.2m
Fig. 5 The dissolution and transport of aluminum near the first adding place

Zhang, Thomas, and Pluschkell, will be submitted to Steel Research International,
21
0.000 0.002 0.004 0.006 0.008
0.000
0.005
0.010
0.015
0.020
0.025
0.030
Dis
solu
tion
Vol
ume,
VD(m
3 )
Dissolution Time, tD (s)
VD=0.85t0.7D
Fig. 6 The dissolved volume of aluminum as a function of time

Zhang, Thomas, and Pluschkell, will be submitted to Steel Research International,
22
10-4 10-3 10-2 10-1 10010-20
10-19
10-18
10-17
10-16
10-15
10-14
10-13
βD i, β
B ij, β
T ij
(m3 /s
) Diffusion
Turbulent collision
Brownian collision
rj= 0.5μmrj= 0.01μm
ri (μm)
1 1010-17
10-16
10-15
10-14
10-13
10-12
10-11
Brownian collision βD
,i, βB,
ij, βT,
ij (m3 /s
)
Diffusion
rj= 10μmrj= 0.5μm
Turbulent collision
ri (μm)
10210-18
10-16
10-14
10-12
10-10
10-8
βD
,i, βB
,ij, β
T,ij (m
3 /s)
Diffusion
rj= 100μmrj= 10μm
Turbulent collision
Brownian collision
ri (μm)10
Fig. 7 Comparison of pseudo-molecule diffusion rate constant and collision rate constants

Zhang, Thomas, and Pluschkell, will be submitted to Steel Research International,
23
Π.max
0.01 0.1 1 10 1000
102030405060708090
100110
Π
Π=1
Maximum fluctuation
t*1 t*
3
0.01 0.1 1 10 100100
101
102
103
104
105
106
t*5t*2
i c
t*
iC,min
0.01 0.1 1 10 100
0.00
0.01
0.02
0.03
0.04
0.05
0.06
0.07
Stages:I : Incubation Period (0<t*<t*2, 0<t*<1.25)II : Nucleation Period (t*2<t*<t*5, 1.25<t*<15.6) III: Growth Period (t*>t*2, t*>1.25)
ζ
I II III
N*S
ζ
Π
iC
Fig. 8 Calculated ζ, Π, ic versus time

Zhang, Thomas, and Pluschkell, will be submitted to Steel Research International,
24
0.1 1 10100
103
106
109
1012
1015
1018 N
i (m
-3)
40
Ni (m-3)
t (s) 1 6 100
ri (μm)
Fig. 9 Inclusion size distribution as a function of time

Zhang, Thomas, and Pluschkell, will be submitted to Steel Research International,
25
10 100 1000100
103
106
109
1012
1015
i=40ri=35.6μm
i=37ri=14.2μm
i=34ri=5.7μm
i=31ri=2.3μm
i=28ri=0.91μm
i=25ri=0.36μm
Ni
(m-3)
t (s)
Fig.10 Inclusion concentration versus time

Zhang, Thomas, and Pluschkell, will be submitted to Steel Research International,
26
0 200 400 600 800 100010
100
Calculation Experiment
400
T.O
. (pp
m)
t (s)
Fig.11 Comparison of total oxygen between calculation and experiment

Zhang, Thomas, and Pluschkell, will be submitted to Steel Research International,
27
100 101 102 103 10410-3
10-2
10-1
100
d[O]/dt=Ko [O]
[O]: ppm; t: min; KO: min - 1
KO (
min
- 1 )
Ar gas bubbling ASEA-SKF (I) ASEA-SKF (II) VOD (NK-PERM) VOD (Convent.) RH (NK-PERM) RH (Convent.)
Stirring power (Watt/ton)
Fig. 12 Effect of stirring power on deoxidation rate constant

Zhang, Thomas, and Pluschkell, will be submitted to Steel Research International,
28
0.1 1 10 100 1000100
103
106
109
1012
1015
t=150s
Stirring power (Watt/ton) 1 10 100 1000
Ni (
m-3)
ri (μm)
Fig. 13 Effect of stirring power on inclusion size distribution

Zhang, Thomas, and Pluschkell, will be submitted to Steel Research International,
29
Fig.14 Aluminum mass fraction distribution in ladle at different time
t=50s t=100s

Zhang, Thomas, and Pluschkell, will be submitted to Steel Research International,
30
0 50 100 150 200 250 300 350 400
0.0002
0.0004
0.0006
0.0008
0.0010
0.0012
0.0014
point 1 point 2 point 3 point 4 point 5 point 6 point 7
Al m
ass
fract
ion
in m
olte
n st
eel
Time (s)
Fig.15 Al dispersion in molten steel of a gas-stirred ladle

Zhang, Thomas, and Pluschkell, will be submitted to Steel Research International,
31
0.0
0.5
1.0
1.5
2.0
2.5
3.0
3.5
4.0
4.5
-1.5 -1.0 -0.5 0.0 0.5 1.0 1.5
1
2
3
4
5
6
7
Calculated gas column shape (0.001 isoline of the gas volume fraction)
50μm 100μm 300μm
(m)
Fig.16 Inclusion trajectories in argon stirred ladle

Zhang, Thomas, and Pluschkell, will be submitted to Steel Research International,
32
0.1 1 10 100 100010
100
1000
123456
50t ASEA-SKF 50t Ar-stirred 58.9t Ar-stirred 6t Ar-stirred 200RH 65kg Water model
mixing time=523ε - 0.4
Current 300tonne Ar-stirred ladle
Mix
ing
time
(s)
Stirring power, ε (Watt/ton)
Fig.17 Mixing time deceasing stirring power


![Interactive Sound May 31, 2006 - University of Chicagomps.uchicago.edu/docs/reports06/VR_Sound.pdf · The GeoWall is a low-cost PC-based 3D stereoscopic projection system [1]. A user](https://static.fdocuments.net/doc/165x107/5fa422b43e41de292213303f/interactive-sound-may-31-2006-university-of-the-geowall-is-a-low-cost-pc-based.jpg)