In the Name of Allah, the Most Beneficent and Merciful!
135
1 In the Name of Allah, the Most Beneficent and Merciful!
Transcript of In the Name of Allah, the Most Beneficent and Merciful!

1
In the Name of Allah, the Most Beneficent and Merciful!
2
AGRICULTURAL TRADE BETWEEN PAKISTAN AND
UNITED ARAB EMIRATES: PERFORMANCE,
COMPETITIVENESS AND DETERMINANTS
By
Iqbal Javed
2003-ag-1630
MBA Marketing and Agribusiness
A Thesis Submitted in Partial Fulfilment for the Degree of
3
DOCTOR OF PHILOSOPHY
IN
AGRICULTURAL ECONOMICS
INSTITUTE OF AGRICULTURAL & RESOURCE ECONOMICS,
FACULTY OF SOCIAL SCIENCES,
UNIVERSITY OF AGRICULTURE, FAISALABAD
PAKISTAN
2015
DECLARATION
I hereby declare that the contents of the thesis “Agricultural Trade between Pakistan
and United Arab Emirates: Performance, Competitiveness and Determinants” are product of
my own research and no part has been copied from any publication source (except the
4
references, standard mathematical or genetic models/ equations/protocols etc.). I further
declare that this work has not been submitted for award of any other diploma/degree. The
University may take action if the information provided us found inaccurate at any stage. (In
case of any default the scholar will be proceeded against as per HEC plagiarism policy).
______________________________
SIGNATURE OF THE STUDENT
Name: Iqbal Javed
Regd. No. 2003-ag-1630
To
The Controller of Examinations,
University of Agriculture, Faisalabad,
Pakistan.
We, the Supervisory Committee, certify that the contents and form of thesis
submitted by Mr. Iqbal Javed (Regd. No. 2003-ag-1630) have been found satisfactory and
recommend that it be processed for evaluation by the External Examiner(s) for the award of
the degree.
SUPERVISORY COMMITTEE:

5
Chairman (Prof. Dr. Muhammad Ashfaq)
Member (Prof Dr. Sultan Ali Adil)
Member (Dr. Khuda Bakhsh)
6
I Dedicate, This Humble Effort to Allah Almighty and Holy
Prophet Hazrat Muhammad (Peace Be Upon Him).
And I also dedicate the Fruits of My Thoughts and Study to
My Sweet Parents, lovely Supervisor,
And
The Ever-praying Caring affectionate Brothers
Chapter CONTENTS Page
No. No. Chapter 1 Introduction 1
1.1 Trade relation of Pakistan with United Arab Emirates 2
1.2 Exports of Pakistan to United Arab Emirates 3
1.3 Imports of Pakistan from United Arab Emirates 3
1.4 Need of the study 4 1.5 Objectives of the study 5 Chapter 2
Review of Literature 7
2.1 Findings of Major Studies-Pakistan 7
2.2 Findings of Major Studies-Other Countries 14
2.3 Summary 23
Chapter 3 Materials and Methods 24 3.1 Data Collection and Sources 24
7
3.2 Variables of the Models for Trade Determinants 24
3.3 Exports of Major Agricultural Products of Pakistan to United Arab
26 Emirates
3.4 Imports of Major Agricultural Products of Pakistan from United Arab
26 Emirates
3.5 Testing for Panel Unit Root 26
3.6 Gravity Model of Trade 27
3.7 Panel Data Models 31
3.7.1 Fixed Effects Model 32
3.7.2 Random Effects Model 33
3.8 Selection of Appropriate Model for Panel Analysis 34
3.8.1 Hausman Specification Test (Random Effects or Fixed Effects)
35
3.8.2 F-Test (Fixed Effects Model or Pooled OLS) 36
3.8.3 Breusch-Pagan LM Test (Pooed OLS or Random Effects) 36
3.9 Nominal Protection Coefficient (NPC) 36
3.10 Revealed Comparative Advantage 37
Chapter 4 Results and Discussion 40
Agricultural Trade Performance between Pakistan and United 40
Part 1
Arab Emirates
4.1 Trade between Pakistan and United Arab Emirates 40
4.2 Major agricultural exports to United Arab Emirates 42 4.2.1 Exports of
Basmati Rice from Pakistan to United Arab Emirates 42
4.2.2 Exports of Meat (Beef & Mutton) from Pakistan to United Arab
44 Emirates
4.2.3 Cotton Exports from Pakistan 47
4.3 Major Imports of agricultural Products from United Arab Emirates 48
4.3.1 Sugar Imports from United Arab Emirates 49
4.3.2 Milk Imports from United Arab Emirates 50
8
4.3.3 Imports of Dried Vegetables from United Arab Emirates 50 Part 2
Determinants of Agricultural Trade between Pakistan and United 52 Arab Emirates
4.4 Variables Used in the Gravity Models of Trade 52
4.4.1 Bilateral Trade between Pakistan and United Arab Emirates 52
4.4.2 GDP of Pakistan 53
4.4.3 GDP of United Arab Emirates 54
4.4.4 Population of Pakistan 55
4.4.5 Population of United Arab Emirates 56
4.4.6 Distance between Trading Partners 57
4.4.7 Border ( Dummy Variable) 57
4.4.8 Culture Similarities ( Dummy Variable) 58
4.5 Stationarity Tests 58
4.6 Determinants of Agricultural Trade by Using the Gravity Model 60
4.7 Selection of model 62
4.8 Estimation of Gravity Equation by Fixed Effects Model 63
4.9 Estimation of Gravity Equation by Random Effects Model 67
4.10 Consistency of Results with Prior expectations 69
Part 3 Competitiveness of Agricultural Products of Trade between
71 Pakistan And UAE
4.11 Competitiveness of Pakistan’s Major Agricultural Exports to United 73
Arab Emirates
4.11.1 Basmati Rice 74
4.11.2 Meat (Beef and Mutton) 75
4.11.3 Cotton Yarn 76
4.12 Competitiveness of Pakistan’s Major Agricultural Imports from UAE 77
4.12.1 Milk 78
4.12.2 Sugar 79
4.12.3 Dried Vegetable 79
4.13 Comparative Advantage of Major Agricultural Exports 82
4.13.1 Exports of Rice 82
4.13.2 Exports of Meat 84
9
4.13.3 Cotton Exports 86 Chapter 5 Summary 89
5.1 Summary 89
5.2 Conclusions and Recommendations 100
5.3 Global Impact of the Study 103 5.4 Limitations of the Study 104 5.5 Area
for Future Research 105
Literature Cited 106
Appendix 117
10
ABSTRACT
Major trading partners of Pakistan are China, United Arab Emirates, Saudi Arabia and
Unites States of America. United Arab Emirate is the trading partner of Pakistan with 10.9
percent share of total trade. Export share of Pakistan to United Arab Emirates is 8.5 percent
of its total exports. Import share of Pakistan from United Arab Emirates is about 12 percent
of its total imports. Major agricultural export products of Pakistan to UAE are rice, meat and
cotton yarn. Major imports of agricultural products include dried vegetables, sugar and dairy
products. Objective of the study was to elaborate the trade of major agricultural products
between Pakistan and United Arab Emirates, with a focus on analysis of major factors
affecting the agricultural trade, competitiveness and comparative advantage of major
agricultural products traded between Pakistan and United Arab Emirates. Impact of different
variable was determined by the application of gravity model by using the panel data
methods. Variables that were used are total trade, population, GDP, distance between trading
partners, and dummies for border and cultural similarities. Competitiveness in agricultural
trade was estimated by nominal protection coefficient (NPC). To estimate the comparative
advantage of Pakistan for specific products, approaches of revealed comparative advantage
(RCA) and revealed systematic comparative advantage (RSCA) were used. For this purpose
data for analysis were obtained from suitable sources. According to the results of gravity
model of trade GDP of Pakistan has a positive and significant impact on agricultural trade
with United Arab Emirates. GDP of United Arab Emirates has a positive and significant
impact on agricultural trade between Pakistan and United Arab Emirates. Population of
United Arab Emirates has positive and significant Impact on agricultural trade. Increasing
Population of Pakistan has a negative and significant impact on agricultural trade with
United Arab
Emirates. It implies that population variable has the trade inhibiting affect. It implies that a larger
population size may be treated as large resource endowments and thus an indication of
selfsufficiency and thereby less reliance on international trade. Dummy variable of cultural
similarities has a significant and positive impact on agricultural trade and the joint border
has negative and significant impact on trade of Pakistan. Distance between trading partners
has a negative impact on agricultural trade but this was not significant. The value of NPC
11
shows that Pakistan is losing its competitiveness in basmati exports. So there was need to
find other markets where its competitiveness is more as compared to United Arab Emirates.
Furthermore the basmati growers should be given proper subsidies and the policies should
be made to keep the domestic prices of basmati low, to make Pakistani basmati rice more
competitive in international markets as compared to its main competitors. Increasing values
of RCA index of basmati rice shows that Instead of losing competitiveness of basmati rice
Pakistan has comparative advantage in basmati rice. There is need to maintain both the
competitiveness and comparative advantage at the same time and for this purpose the
government should play its role by changing the existing price policies. NPC of beef
remained less as compared to Mutton that means Pakistani beef is more competitive as
compared to mutton. It was concluded that Pakistan should focus more on beef for its exports
growth as compared to mutton. The analysis increasing trend of RCA indices for the
previous 10 years of both mutton and beef shows that the Pakistani beef has more
comparative advantage as compared to mutton. Pakistani beef is more competitive having
more comparative advantage showing that there are some issues in the mutton exports as
compared to beef. Pakistan should try to find other markets for its mutton. Pakistan should
focus on the both the mutton and beef to enlarge in export value. Pakistan has
competitiveness in the cotton yarn but it is not a strong competitiveness. Pakistan has
comparative advantage in export of cotton yarn. Pakistan can produce milk at low cost and
can export to get high margin but due to the domestic demand it is not possible. Pakistan has
strong competitiveness in milk but still is not able to export the milk to the other countries.
There is need to make more growth in dairy sector and government should give more
attention toward this sector. Value of NPC of sugar more than unity was showing that
international prices were less than the domestic prices and Pakistan has no competitiveness
in the sugar. Pakistan is an exporter of fresh vegetables but at the same time Pakistan is also
importer of the dried vegetables. There is lack of value addition in vegetables. There is need
of value addition in the sector of vegetable as there is demand of dried vegetables in Pakistan
but there is lack of supply of the dried vegetables to fulfill its demand. Dried vegetables are
imported and the Pakistani consumers pay more for these products. There is also lack of
adoption of value addition in this sector.

12
CHAPTER 1
INTRODUCTION
Agriculture has a very important role in the economy of Pakistan with a share of about 21.1
percent to GDP. It provides 43.7 percent employment to the total labor force of the country
(GOP, 2014). About 60 percent rural populations depend on agriculture (GOP, 2012).
Pakistan’s export value was US$ 20,997 million for ten months from July to April during
the fiscal year 2013-14 (GOP, 2014). The imports of Pakistan amounted to about US$
43,775 million during 2013-14 (ITC, 2014). Pakistan always has a negative trade balance.
Major trading partners of Pakistan are China, Saudi Arabia, United Arab Emirates, United
States, European Union Kuwait, India and Malaysia. Pakistan has about 17 percent of total
trade with China. Trade share of Pakistan with United Arab Emirates was about 11 percent
of its total trade with an export share of 8.5 percent and import share of 12.3 percent.
Pakistan has a trade share of 9 percent with Saudi Arabia. Trade share of Pakistan with
European Union is 13.0 percent. Trade flow between Pakistan and United States has been
decreasing since the last few years and in 2012-13 it was only 6.7 percent with exports (13.3
percent) exceeding the imports (3.2 percent). The other countries like Kuwait, India and
Malaysia have a minor trade share with Pakistan which is 4.4, 3.2 and 2.9 percent,
respectively (ITC, 2014).
Major agricultural export items of Pakistan are rice, sugar, fruits, fish, fish preparations,
vegetables, oilseeds, wheat, meat, cotton yarn, and raw cotton. Export value of rice was
about US$ 2111 million during the fiscal year 2013-14 (ITC, 2014). Export value of fruits
and vegetables were US$ 341.2 million and US$ 214.4 million respectively for a period of
ten months during the fiscal year 2012-13. Pakistan has exported meat and meat preparations
of about US$ 178.3 million in the same period. Export values of raw cotton and cotton yarn
were US$ 138.1 million and US$ 1851.7 million respectively for ten month of the fiscal
year 2012-13. Pakistan’s major agricultural imports include milk, edible oil, tea, sugar,
pulses, fertilizers, insecticides, raw cotton, and silk yarn. Edible oil imports in
13
July-April, 2012-13 was US$ 1759.1 million. Import value of tea and pulses was US$ 323
million and US$ 282.8 million respectively. Import value of raw cotton and fertilizers was
US$ 752.6 million and US$ 498.6 million respectively for the ten month period during the
fiscal year of 2012-13 (GOP, 2013).
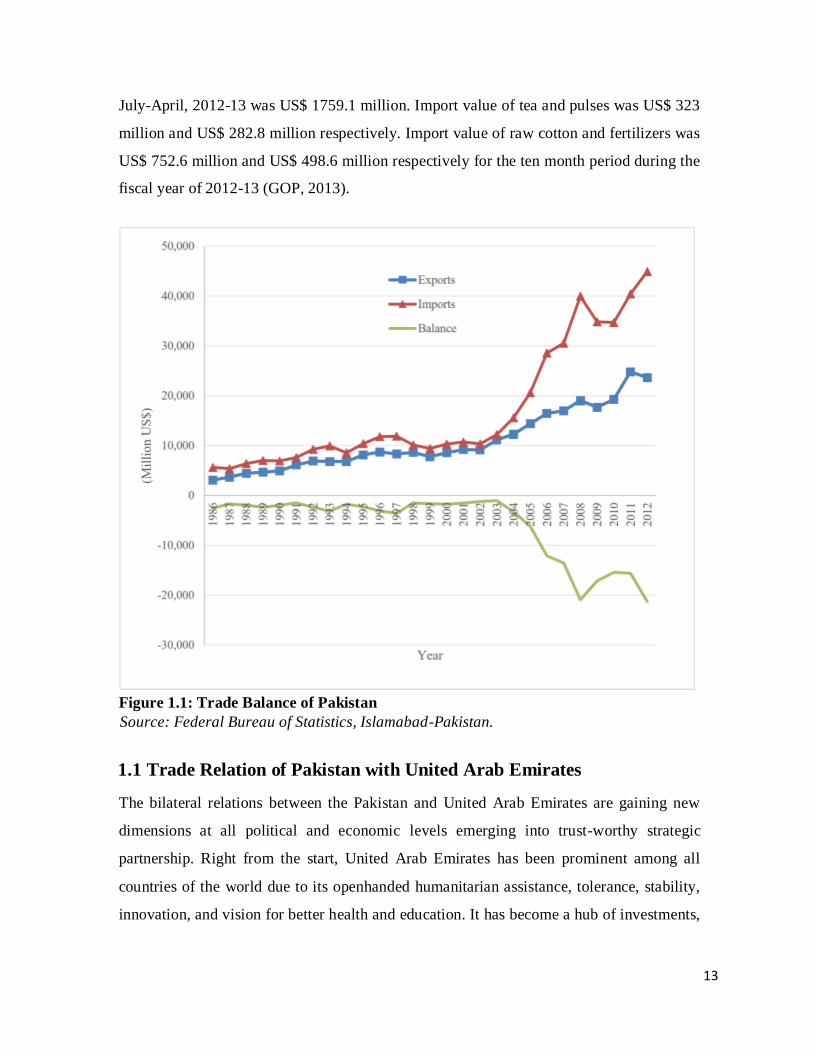
Figure 1.1: Trade Balance of Pakistan
Source: Federal Bureau of Statistics, Islamabad-Pakistan.
1.1 Trade Relation of Pakistan with United Arab Emirates
The bilateral relations between the Pakistan and United Arab Emirates are gaining new
dimensions at all political and economic levels emerging into trust-worthy strategic
partnership. Right from the start, United Arab Emirates has been prominent among all
countries of the world due to its openhanded humanitarian assistance, tolerance, stability,
innovation, and vision for better health and education. It has become a hub of investments,
14
re-exports and technologies. In Pakistan, it encouraged the calls for greater trade and
commerce activities. United Arab Emirates is one of the biggest investors in the country and
bilateral trade has been steadily growing over the years. Both countries have a strong
commitment to further strengthen the bonds of friendship and want to expand the horizon
of bilateral cooperation in diverse fields. About 1.4 million Pakistani expatriates are working
in United Arab Emirates. Pakistan was the first country to recognize United Arab Emirates
on its freedom. Ever since Pakistan and United Arab Emirates started to build bilateral
relationships with each other. United Arab Emirates has now become the 2nd major trading
partner of Pakistan.
1.2 Exports of Pakistan to United Arab Emirates
Pakistan’s major export Items to United Arab Emirates include, clothing of textile fabrics,
hosiery, rice, cotton fabrics, cotton yarn, sports goods, fruits, vegetables, and footwear.
Major agricultural export items of Pakistan to United Arab Emirates are rice, meat, and
cotton yarn. For the year of 2013-14, about 23 percent basmati rice export is only to United
Arab Emirates and remaining 77 percent to other countries of the world. Second export item
of Pakistan to United Arab Emirates is meat. Fresh and chilled meat of bovine animals is
major export form of meat and its 37 percent export is only to United Arab Emirates. Frozen
meat of bovine animal was exported to United Arab Emirates with 8.5 percent of its total
export. Total 13 percent meat of sheep and goat were exported to United Arab Emirates in
the year of 2013-14. Cotton yarn is also a major export item of Pakistan but its export share
to United Arab Emirates is less as compared to other markets. Its export share to United
Arab Emirates is only about 2.3 percent (ITC, 2014).
1.3 Imports of Pakistan from United Arab Emirates
Major imports of Pakistan from United Arab Emirates are petroleum products, precious
stones, metals, plastic products, iron, steel, machinery, organic chemicals, and electrical
equipment. Major Agricultural imports of Pakistan from United Arab Emirates include dried
vegetables, sugar and milk. Import amount of dried vegetables was US$ 1,160 thousand in
2013-14. Sugar imports were made of about US$ 1,179 thousand from United Arab Emirates
15
against the total imports of US$ 6,627 thousand for 2012-13 constituting 17.7 percent. Milk
and cream import value was US$ 980 thousand from United Arab Emirates in 2012-13 (TM,
2014).
1.4 Need of the Study
The world economic situation is set for revolution under free trade regime, growing
competition and relative competitiveness of different economies. The study of
competitiveness and comparative advantage is important to know the extent and potential
of trade of agricultural commodities. This study plan is aimed at analysis of the changing
competitiveness and comparative advantage of agricultural products over time and its
implications for trade growth. The analysis highlighted opportunities in bilateral trade with
United Arab Emirates. The approach carried out analyses of major imports and exports of
agricultural products of Pakistan to United Arab Emirates. Another purpose of study was to
explore the comparative advantage and competitiveness of Pakistan in agricultural trade
which has effective role in efficiency of agricultural exports and imports form United Arab
Emirates.
Many agricultural economists in Pakistan believed that the country is punching below its
weight as far as performance of agricultural trade is concerned. In previous recent years, an
extravagant importance was given to earnings of Pakistani exports but this strategy failed
and the import bill reached up to twice the export earnings a year. So there was special need
to focus on analyses of imports of Pakistan by comparative advantages and critically analyze
the domestic growth facilities by making useful policies to reduce the burden of imports.
After reviewing the literature on trade, competitiveness and comparative advantage, it was
revealed that most of the work on trade export was general in nature and a few studies were
found which were focused on a special target market to be lineate effect of major variables
affecting export from Pakistan. However literature of competiveness and comparative
advantages of Pakistani exports of agricultural products highlighted some quantitative
efforts to capture the comparative advantages of major agricultural products of Pakistan
generally for international markets by using a common international price. No such a
16
detailed study was found for a special market that has a large share in Pakistani agricultural
trade that’s why the present study was planned to analyze the impact of major variables on
trade and to make analysis of competitiveness and comparative advantages of major
agricultural products of trade for a single market of United Arab Emirates as a trading
partners.
It was necessary to calculate the nominal protection coefficient (NPC) of separate
agricultural products by taking a single destination, not to make the analysis overall for the
world to make policy suggestions for a single target country. Most of the studies on
competitiveness of Pakistani agricultural products have been completed but there was no
study made by taking the only one target market for the better analysis of the products
exported. That’s why this topic “Agricultural trade between Pakistan and United Arab
Emirates: performance, competitiveness and determinants” is important because United
Arab Emirates is the 2nd largest trading partner of Pakistan and this market was considered
to be first for analysis. United Arab Emirates is not an agricultural country and the products
which are imported into Pakistan are re-exports of United Arab Emirates. After the study of
comparative advantage and competitiveness of major agricultural products for United Arab
Emirates as a trading partner, we will be able to make policies about the preferences of
markets for our agricultural exports. After conducting the research by focusing the market
of United Arab Emirates there will be need to make such research on agricultural trade with
other international markets individually.
Due to not having sustained and consistent policies, prices of agriculture commodities are
increasing that have a negative effect on trade of agricultural products. There was a research
gap and an effort was made regarding the competitiveness and comparative advantage of
agricultural products in existing circumstances to make policy suggestions about each major
agricultural product being exported and imported. 1.5 Objectives of the Study
Following are the specific objectives of the study:
1. To elaborate past trend and current status of agricultural trade between United Arab
Emirates and Pakistan
2. To analyze the determinants of agricultural trade between the two countries

17
3. To determine the competitiveness of major agricultural products of trade
4. To suggest policy measures for promotion of agricultural trade between the countries
under consideration
18
CHAPTER 2
REVIEW OF LITERATURE
Review of literature means to “look again” or “re-view” at the available literature in the
related areas of the study. It highlights the findings of related studies and eliminate the
possibilities of unnecessary duplication of efforts. It involved locating, reading and
evaluating research reports, reports of causal observations and opinions that were related to
research projects. It provides an opportunity to the researcher to know what has been done
previously. Until it was learned what others have done and what remains still to be done in
particular areas, it was difficult to plan a useful study. Thus, the review of literature forms
the foundation upon which all future research work must be built. This chapter is organized
as follow, section I presents findings of major studies conducted in Pakistan, section II
reviews studies from other countries where as section III concludes.
2.1 Findings of Major Studies-Pakistan
Chen et al. (2002) described in his study about the competitive markets in rice trade that
Pakistan had a very limited role in the imperfection condition of world rice market. In the
study, general imperfect competition spatial equilibrium model was used. Model structure
allowed the option for a market which is imperfect competitive to exit on both export and
import side without supposing any market structure. The results of the research showed that
Thailand, Vietnam and United States of America had a strong role in the imperfection of
world rice market. The Japan, Philippine, Europe, and former USSR had a high degree of
impact on the imperfection of world rice market. The empirical results expressed that when
all trading nations comply with free trade agreement there was a welfare gain of $1,492
million.
Anjum (2003) revealed in study "Export Supply Function for Rice and Cotton" that both
price and non-price factors had significant role in the export of rice. Co-integration with time
series data were used in study. Furthermore export price elasticity was measured as 0.66.
Domestic price in the export supply function affected more than export price in the analyses
of rice and cotton. Non-price factors such as exchange rates and domestic production also
19
had positive impact on export supply of rice from Pakistan. An inconsistency of a proper
export policy was found as central problem in case of rice export.
Mahmood (2004) analyzed export competiveness and comparative advantage of
nonagricultural products of Pakistan’s by using Balassa RCA index. He divided these
commodities in four categories, competitive positioned products, threatened positioned
products, emerging product and weakly positioned products on the basis of findings of RCA
index. He found that agricultural sector of Pakistan witnessed a competitive position in some
sectors but these competitive trends were not uniform through all sectors. Secondly Pakistan
had failed to have a movement from low value- added unskilled labor to high- value added
technology-intensive manufacturing.
Khan and Ashiq (2004) formulated a solid national comparative advantage regarding seed
cotton production. This research also indicated the Sindh dominance over Punjab in seed
cotton production from 1997 to onwards. This was basically historical restoration of Sindh
dominance over Punjab in production of seed cotton. According to nominal protection
coefficient (NPC), heavy weight tax was imposed upon seed cotton production in Pakistan.
The study also formulated some suggestions to enhance the performance of the pointed
sector as far as production and procession of seed cotton was concerned, for achieving local
needs and to earn foreign remittances.
Anwar et al. (2005) conducted a research to determine the comparative advantage and
competitiveness at the same time for wheat crop.. They collected data from agricultural price
commission, regarding the cost of production of wheat for the period of three years
(20012003). Two main provinces were selected where the wheat production was more i.e.
Sindh and Punjab. Then the data were averaged to make estimation about the national
scenario. The budget about the crops were prepared at start in financial terms and after that
economic prices were used to make evaluation about competitiveness and comparative
advantage of wheat crop. They used Policy Analysis Matrix as an analytical framework for
the policy analysis. They measured policy distortions by the use of Nominal Protection
Coefficient and Effective Protection Coefficients. In the study they also used the Domestic
Resource Cost ratio (DRC) for measuring the comparative advantage. The analysis about
wheat was conducted for two different price regimes i.e. export parity prices and import
20
parity prices. Obtained results of the analysis presented that Pakistan at import parity price,
had a comparative advantage only in production of wheat as an import substitution crop.
They also found that, Pakistan was not competitive at export parity price in the world
markets of wheat and had no comparative advantage in its production.
Ilyas et al. (2006) endorsed some features of globalization to minimize the trade obstacles
and promote the export competitiveness among traders. In the study they also mentioned
that many rice exporters dealt their business in Asia favorably and food crisis separated Asia
into two groups, one group belonged to those countries producing rice and other belonged
to those countries not producing rice. For maintaining and acquiring international
competitiveness in rice export, the research used two indices i.e. Balassa and White for
revealed comparative advantage and revealed competitive advantage respectively. They also
concluded in the study that Pakistan was one of the most competitive country as for as rice
trade was concern. They also determined that Pakistan got first rank in total merchandise
exports as well as in trade agricultural products.
Akhtar et al. (2007) used the PAM methodology in their study for determination of the level
of economic efficiency to know the facts about competitiveness in the rice production in
Punjab, Pakistan. The results showed that the increase in the production of basmati was
cause to increase the exports. Due to the lack of economic efficiency the production of coarse
rice in the Punjab was the inefficient use of the resources in its production. According to
their analysis both basmati and irri rice production in the Punjab demonstrated that at the
farm level these had lack of competitiveness throughout the whole period under the study.
They found that the structure of prevailing incentive had affected farmers negatively. They
concluded that the negative divergence between the social and the private profits denoted
that the intervention policy of net effect was to lower the profitability at the farm level in
rice production systems in Punjab. The estimated results emphasized the severe need to
eliminate distortions in existing policy to improve the structure of economic incentives for
improvement in economic efficiency and for achieving the farm-level competitiveness in
production of rice.
Ghani et al. (2008) measured the revealed comparative advantage for footwear industry by
the application of Balassa RCA in Pakistan. They designed the analysis into two
21
classification; 2-digit and 4-digit HS classification. They selected the time span from 1996
– 2006 for the analysis. Finally they carried out a comparison of footwear industry of
Pakistan with same industry of China and India. The two- digit level footwear industry of
Pakistan shifted into comparative advantage since 2003 as Reveled Comparative Advantage
index has been growing constantly over the years. The comparative advantage as far as
China and India was concerned, being decreased from 2001 to onwards. While at the level
of 4-digit, Pakistan showed heavy growth in 3 products at disaggregated level.
Akhtar et al. (2009) conducted a research about the global competitiveness about the exports
of fruit from Pakistan (dates and oranges), by using revealed comparative advantage (RCA)
approach. They analyzed and described the trends of domestic consumption among certain
fruits grown by major exporters. According to their results Pakistan had comparative
advantages in exports of fruits. They made a comparison about the movement in comparative
advantage indices from Pakistan with its major competitors and found that Pakistan had
comparatively high competitive and comparative advantages in date and mango production.
The increasing competitiveness trend in Pakistan showed that there was more potential for
growth; given that fruit exports were sources of greater exports earnings. They
recommended that there was a need to strengthen competitiveness in that sector.
Shahbaz and Leitao (2010) carried out an economic analysis about Pakistan's intraindustry
trade for the period 1980 to 2006. They used country specific characters as the variables
were helpful for the study. On the basis of the study their results indicated that Intra Industry
Trade was a negative function of difference in GDP per capita taken for Pakistan and its
partners. They found strong statistical confirmation about the effect of same demand on
trade. They introduced an economic dimension in their research as a proxy and found the
positive impact on Intra Industry Trade (IIT). Their results revealed a great significance of
economies of scales and a variety of all differentiated products. After getting the estimated
results they confirmed hypothesis of the study i.e. the trade increase due to reduction in
transportation cost.
Quddus and Mustafa (2011) conducted a study to determine the comparative advantage of
wheat, sugarcane, rice and cotton in international trade. They used data from 2000 to 2005
for their study. Comparative advantage was estimated by the economic profitability and the
22
domestic resource cost ratio. They calculated the nominal protection coefficient (NPC) for
Irri rice and found the value more than 1. They also estimated the effective protection
coefficient and Domestic resource cost for Irri rice. The given relationship of input and
output and the export prices do not provide Irri a comparative advantage in production in
Punjab for exports. They expressed that Sugarcane growers were not receiving economic
prices during 2001-2002 and 2002-2003 in importing situation, whereas NPC in 2003-04,
was 1.02, indicated positive support to the sugarcane growers. The calculated NPCs for an
exporting position range from 1.33 to 1.99, that indicated the prices received by the growers,
were more as compared to the export parity/economic prices. That was a sign of cultivation
of sugarcane for exporting was not viable in terms of economical values. The NPCs of cotton
for an importing condition was less than 1 and under an exporting condition were either
more than or close to 1, indicating a growth in cotton production as imports had been more
costly as compared to domestic production.
Zada et al. (2011) examined the determinants of exports from Pakistan. For the study they
used the time series data between the time duration of 1975-2008. Simultaneous equation
model was used to find the supply and demand. Both equations were used by using the major
suitable variables. They carried out country-wise disaggregated examination of Pakistan
with its other major trading partners. After knowing the results they concluded that Pakistani
exports were sensitively affected by the international prices and demand. They recognized
the importance of factors of demand side, as world GDP, world prices and Real exchange
rate which determine the exports of Pakistan to those countries. On supply side they found
that the price and income were the main determinants. The results showed the demand for
exports was more for the countries like Middle East, NAFTA and European Union. The
study recommended additional focus and detailed study on the trade partners for these
regions to enhance the export from the Pakistan.
Gul and Yaseen (2011) estimated trade potential of Pakistan by using the gravity model of
trade. Panel data for period 1981-2005 for 42 countries were used in the analysis. The
coefficients obtained by the model were used to predict the trade potential of country
worldwide as well as in specific trading regions. Results revealed that Pakistan’s trade
23
potential was more with countries in the Asia-Pacific region (ASEAN), European Union
(EU), Latin
America, Middle East, and North America. Particularly, the maximum potential exists for
Japan, Sri Lanka, Philippines, Bangladesh, Malaysia, New Zealand, Norway, Italy, Sweden,
and Denmark. For that reason, Pakistan should explore means and ways to further improve
its trade relationship with the countries concerned, and also focus on ASEAN, the EU, and
the Middle East to increase its market share. The trade volume between Pakistan and other
members of SAARC and ECO was very low, in spite of the existence of considerable
potential. The major obstacles to this end were the social and political tensions among
neighboring countries, mainly between India and Pakistan, which were the major players of
SAARC. The same obstacles were present in case of the NAFTA and EU, where Pakistani
exports were badly affected by political considerations.
Haider et al. (2011) estimated the elastisities of exports and imports of Pakistan with
traditional trade partners and some Asian countries to know the trade dynamics of Pakistan
from 1973 to 2008. They used the OLS for the analysis and results suggested that income
was the principal factor of exports and imports. They found that the exports of Pakistan were
cointegrated with USA and Japan whereas the imports of Pakistan were co-integrated with
USA and United Arab Emirates. Imports and exports of Pakistan were found co-integrated
with Sri Lanka and Bangladesh but not with China and India. They found that income and
exchange rates were important determinants of international trade. To continue its trade with
traditional partners and to make an effort for larger market access to USA and EU, Pakistan
should make efforts to enlarge its trade with Asian countries especially with India and China
because both countries are fast rising economies and have giant market.
Suvankulov and Ali (2012) conducted a research on ‘Recent Trends and Prospects of
Bilateral
Trade between Pakistan and Turkey: A Gravity Model Approach’ and they described that
economic ties of Pakistan with Turkey had been improved during the last few years. A newly
stated pledge to make free trade agreement between Turkey and Pakistan was likely to start
a more growth in economic integration. The paper was started by reviewing trends since
1996. Then they estimated a gravity model to project trade potential of Pakistan with Turkey
24
and compared the potential with actual trade flow between 1996 to 2009.They found that
exports of Pakistan to Turkey had grown since surpassing both the exports of Turkey to
Pakistan and the projections made by gravity model. The success of exports of Pakistan was
due to the extra ordinary performance of textile industry of Pakistan. Exports of Turkey to
Pakistan were good with great value addition even though still remained significantly below
the predictions of the model. The analysis of trade complementarity indicated that the overall
exports of Turkey matched better with import structure of Pakistan than exports of Pakistan
with import structure of Turkey. The results showed that during 1996 to 2009, Pakistan
registered export growth to Turkey beyond the prediction by the gravity model. Despite of
more potential exports of Turkey were significantly less than the predictions made by gravity
mode. For the year of 2009 model predictions about exports of Turkey were US$ 749.2
million and for that period the actual exports to Pakistan were US$ 163.1 million. The
exports structure was in favor of Turkey. About 80 percent exports of Pakistan to Turkey
were related to the textile and cereals and the both had limited potentials in growth due to
the water and land constraints. Exports structure of Turkey to Pakistan was well diversified.
The trade turnover increased when the goods produced by members were demanded for the
consumption by other members of free trade agreement. This confirmed their findings from
gravity model that Turkey had benefit to a larger extent from the proposed free trade
agreement.
Ghafoor et al. (2013) conducted export margin analysis of Pakistani mango and estimated
impact of major variables on export of mango from Pakistan to the market of United Arab
Emirates. Data were collected from a representative sample of forty mango exporters
selected randomly for this purpose using pre-tested questionnaire containing both structured
and unstructured questions employing personal interview method. Data (average purchase
prices, different elements of marketing cost and sale prices) were analyzed to estimate
margins in export of mango to UAE market. The impact of major variables (experience and
education of exporters, average purchase price, average marketing cost, average sale price,
ISO certificate, and government policy) on mango export was quantified employing double
log form of regression analysis. According to findings, gross margin was calculated as
Rs.31333/ton, whereas percent and net export margins were found 52.3 percent and
25
Rs.11228/ton respectively. The estimated regression model revealed that education,
professional experience of mango exporters, average marketing cost and ISO certificate
were the significant determinants of mango exports. It may be suggested that marketing cost
of exporting mango from Pakistan should be economized and quality improved to fetch
premium prices in UAE market.
Akhtar et al. (2013) examined Pakistan's competitiveness in export of selected horticultural
commodities by employing set of revealed comparative advantage (RCA) and revealed
competitive advantage indices with respect to global trade. Results demonstrated that
Pakistan had comparative and competitive advantage over the period under analysis and
indicated a transition from comparative and competitive disadvantage to comparative and
competitive advantage during the period under analysis. Tangerines and mandarins had
maintained relatively higher revealed comparative advantage as compared to other
categories for the whole period under analysis. Onion export had revealed comparative
advantage with some fluctuations over time. The research indicated that Pakistan's
comparative and competitive advantages had been increasing in all the selected commodities
during period under analysis which indicated the potential of horticultural exports for foreign
exchange earnings. There was need to strengthen comparative and competitive advantage in
horticulture sector by policy support and facilitating role by all stakeholders.
2.2 Findings of Major Studies-Other Countries
Tweeten (1986) conducted a research study and explained about the comparative advantage
in production of grains and soybean in the southern United States. That comparative
advantage was based on output and input prices, and demand/supply under the normal
circumstances with open markets. His findings of comparative advantage concluded that the
southern US did not has comparative advantage in production of wool, sugar, and
manufactured products of milk. On the basis of the analysis of comparative advantages of
major products he suggested that these commodities, along with other additional
commodities i.e.; cotton, tobacco, fruit, and vegetables, would have to be imported in the
lack of price supports and trade limitations. Poultry, red meat, eggs, and milk for fluid
consumption had the distinctiveness of non-traded goods. He concluded and suggested also
26
that in an open world market, the US would import or export only modest amounts of those
commodities.
Richardson and Zhang (1999) measured trade performance of USA in 1980 and 1995 by
using Balassa RCA index with 38 of its large trading partners including EU, NAFTA, China
and Japan. They included broad commodity classification under SITC from SITC 1 of
primary products to SITC 8 of finished manufactures. They found that US comparative
advantage did not change much between 1980 and 1995 when measured worldwide on single
digit product classification. When those worldwide patterns were broken to calculate RCA
across regional trading partners, the aggregates were not homogenous. The results indicated
different trade patterns across different parts of the world, over time and for different levels
of aggregates.
Prasad (2000) identified some major determinants of exports in Fiji. He developed a single
equation model for exports in which trading partner’s income and relative prices played a
central role. The basic conceptual framework was an imperfect substitution model; in that
model the key assumption was that in importing countries its exports were not perfect
substitutes for domestic goods. A unique feature of the analysis was the incorporation of the
belongings of agricultural supply-side shocks in the export equation. The results indicated
that in the long run the income of trading partner mainly derived from the movements in
Fiji’s exports. For the short run, Fiji exports were mainly affected by changing the factors
which affected the production capacity of agriculture output, such as industrial disputes,
weather conditions, relative prices and change in foreign demand.
Gbetnkom and Khan (2002) examined the determinants of agricultural exports from
Cameroon between 1971/72 and 1995/1996. They specified export supply functions and
estimated for three export crops which were: cocoa, coffee and banana. They found
Quantitative estimates by using ordinary least squares (OLS) procedure and indicated that
the response of export supply of these crops to relative price change was positive, and fairly
significant. Export supply of cocoa, coffee and banana was positively affected by Changes
in the nature of the road network. There was a positive and significant influence of more
credit to crop exporters on the export supply of all that crops. Equally, rainfall’s influence
on the growth of cocoa and coffee were significant only. Structural adjustment of dummies
27
showed a positive effect on the supply of export of crops for policies implemented. Results
showed two conclusions. First was the marginal sensitivity of crops to relative price change,
means that price incentives were not adequate to generate most wanted export supply of
agricultural commodities in the Cameroon. Second, to enhance the supply of exports of
agricultural crops in Cameroon due to significant sensitivity of crops for the availability of
credit to the exporters, improved road networks, and the particular policy changes.
Rahman et al. (2006) investigated the trade creation and trade diversion impacts of a number
of RTAs (Regional Trade Arrangements) especially with a focus on SAFTA (South Asian
Free Trade Area). They used the gravity model of trade for their analysis. They used many
other variables instead of only gravity variables that were bilateral exchange rate and
bilateral free trade agreements. They had introduced dummy variables to check the
individual country effect for overall RTA. They used panel data set for the gravity model for
country specific and year specific fixed effects. They used two stage estimation techniques.
First stage was estimated by using tobit model and for second estimation technique they used
OLS. They found significant intra-bloc export creation for SAPTA (SAARC Preferential
Trading Arrangement). However, there was evidence of net export diversion in SAPTA at
the same time. India, Bangladesh, and Pakistan were projected to gain from joining RTA,
Sri Lanka, and Nepal were negatively affected. Other RTAs covered in the study, SADC,
NAFTA, MERCOSUR, AFTA, EAC and CAN, were related with net export diversion and
intra-bloc export creation. BIMSTEC was found to be intra-bloc export diverting but with
no evidence of net export creation. Bangkok EU agreement (APTA) were found to be intra-
bloc export diverting.
Donnet et al. (2007) indicated that despite of frequent shortages, the competitive position of
basmati rice among other varieties was not be too much affected. That change might
strengthen the basmati market by traders, as “Punjab” benefited from good unaided recall
among consumers. They concluded that further research work might explore the key
production in India. They concluded another issue about marketing of basmati and its
operations with different protection schemes such as seed vs GI, and value addition might
emerge among the basmati rice chain with e-auction system. It was newly demonstrated that
28
the competition-auction system created value addition for growers of specialty coffee that
will be similar for rice especially basmati.
Kumar and Mathura (2007) studied the performance and competitiveness of export of
tomato and its products from India. They studied about the production and export
performance of tomatoes in India. They also determined the impact of trade liberalization
on export of tomato and its products. They conducted research by focusing on the major
destinations of tomato and tomato products of India. Finally they identified and analyzed the
determinants of tomato export from India. They used export performance ratio (EPR) to
check the export competitiveness of India for tomato and products of tomato. They
calculated the Annual rate of compound growth and coefficient of variation in two periods,
before and after the commencement of WTO had been determined to know the effect of
trade liberalization for the performance of Indian exports in tomato and its other products.
Export demand function was estimated by the use of OLS technique after identification of
the factors affecting the export of Indian tomato and its products. After getting the results of
the study they had suggested that the high instability in export of tomato and its products
required urgent attention of policymakers to maintain hold on the international market.
Aujla et al. (2007) described that there were several constraints hindering the real potential
of production and exports of fruits of Pakistan. In this study they examined the trends of
production, consumption and trade of the fruits. They also described the marketing system
of fruits to promote the exports and to improve international competitiveness. Information
about markets received by producers was permanently partial and sketchy. Poor farmers
making investment in farming for inputs like pesticides and fertilizers lead to low yields and
products of poor quality. They stated that Advance sales were also a major reason of
financial constraints for farmers. Lack of storage and transportation facilities resulted in 25-
40 % postharvest losses that caused shrinks in supply and pressure on prices. The elimination
of that losses would further expand exportable surplus and international competitiveness.
Farmers only received one-fourth of consumers’ price, while lion’s share went to other
market traders.
In order to reduce the shares of middlemen in the consumer’s rupee, access for credit and
market information, regulate the output losses, enlargements in market infrastructure and
29
cheaper and easy accessibility of transport and packing material was needed. They pointed
out that fruit markets were not competitive perfectly. There was need a to enhance efficiency
and effectiveness to stimulate export of fruits. Product-specific market growth strategy was
a need to be originated with the energetic participation in the production and marketing
systems.
Kishore (2009) explained in his research that India was a major producer and exporter of
rice that was a staple commodity vital to the food security. Since the India consumed 95%
of its rice production, prices of rice were an integral part of country’s welfare for both
consumers and producers. Protectionist trade policy actions in the year of 2008 resulting by
the shortage of food concerned effectively appeared to grow the national welfare and limit
the transmission of increased world prices to Indian consumers. Whereas, greater use of
Indian export restrictions vs export tariffs and the power of monopoly in rice production
limited the full effects of the decrease in prices. The trade restrictions had decreased the
overall economic welfare even though the consumers benefited by forcing to sell products
strictly in the domestic Indian markets. The paper evaluated the economic effects of trade
policies in context of comparative static model that explained costs and benefits related to
tariffs and subsidies.
Kang et al. (2009) analyzed the relations between rice exports and growth of economics for
the world’s top four exporting countries of rice (Thailand, Vietnam, India, and the U.S) and
had determined how much market power affected the economic growth of a country. The
major objectives of the paper were determination the extent of economic growth impacts on
country’s rice exports and also Foreign Direct Investment (FDI) impact on an ability of a
country to export rice. The analysis also determined the effect of market power on the
economic growth. After getting the results, they observed the market power that existed in
the international rice markets because of supply of rice. Additionally, they proposed, that
there was a bidirectional causality in the international rice trade and economic development
of major rice exporting economies.
Camarero et al. (2010) carried out a study of ‘Evidence of the Euro effect on trade estimating
gravity equations with panel co-integration techniques’ and presented new evidence on the
effect of Euro on trade. They used a data set containing all bilateral combinations in a panel
30
of 26 countries covering the period 1967-2008. They considered two sets of variables: a
standard one and a second one was built according to criticisms of Baldwin and Taglioni
(2006). They implemented a new tests that allowed to solve the problems derived from the
non-stationary nature of the data usually presented in the macroeconomic variables used in
gravitational equations. They used panel tests that accounted for the presence of cross-
section dependence as well as discontinuities in the non-stationary panel data series. They
tested for co-integration between the variables using panel co-integration tests, especially
the ones proposed by Banerjee and Carrión-i-Silvestre (2004). They also estimated the long-
run relationship by using the CUP-BC and CUP-FM estimators proposed in Bai et al. (2009).
The results obtained confirmed a smaller Euro effect than in previous research.
Hatab et al. (2010) used a gravity model approach to analyze the major factors influencing
Egypt’s agricultural exports to its main trading partners for the period 1994 to 2008. Their
found that one percent boost in Egypt’s GDP resulted in approximately 5.42 percent increase
in agricultural export flows of Egypt. In distinction, the increase in GDP per capita of Egypt
caused exports to decrease, that was attributed to increase in economic growth, in addition
the increasing population and raised demand per capita for all normal goods. Therefore,
domestic growth per se had condensed exports. The exchange instability had a significant
positive coefficient, showing that depreciation in Egyptian Pound against the currencies of
its associates stimulated agricultural exports. Costs of transportation and the proxy for
distance had a negative effect on agricultural exports. These results were significant for trade
policy formulation to encourage Egyptian agricultural exports to the world markets.
Kumar (2010) conducted a study about the change in the composition of livestock exports.
He analyzed about the competitiveness of exports of livestock products by using the NPC
indices. He also analyzed the factors that had impact on improvement and growth of exports
of livestock products. After the analysis he found that exports of livestock products had
increased in 1991 after trade liberalization policy. According to his findings India had
competitiveness in meat exports except poultry. Export of meat of buffalo was increasing
and it had a low domestic demand. The increased production, productivity and domestic
policy initiatives were the main factors which were increasing the export of the livestock
31
items. The main finding of the study was that the increase in export supply capacity could
be the main cause of export growth.
Tesfaye (2011) assessed empirically the supply and demand side factors affecting export of
agriculture of Sub-Saharan Africa (SSA) countries. The study focused on examining the
relative importance of two major factors in determining the agricultural export performance
of countries. Panel data set with the fixed effects estimation procedure was used to solve the
question. This data set covered 47 SSA countries for the periods 2000-2008. The estimation
result revealed that on the supply side, factors as real GDP, real GDP (lagged) of exporting
country and lagged agriculture input used positively and significantly effected agricultural
export of the SSA countries. He also indicated that on demand side the effect of per capita
GDP of US, the chief trading partner of SSA countries, was significant and positive.
Furthermore, the effect of US import tariff forced on agricultural products by SSA countries
was negative and significant. Hence, the overall result reiterated that both demand side and
supply side factors were equally essential in determining the export performance of
agriculture of SSA countries.
Bano and Scrimgeour (2011) estimated the successful enlargement of New Zealand kiwifruit
exports. They analyzed the exports for the period 1984 -2009. They explored the status of
the kiwifruit exports during that time. They analyzed the data for future prospects and
described the challenges for industry. They prepared statistical analysis of the consumption
as well as the production of kiwifruit in New Zealand and also in other countries. They
conducted their study with a particular focus on Asia. They used Revealed comparative
advantage to determine and check the comparative advantage of New Zealand for kiwifruit.
The results showed that the main factor of kiwifruit export were the domestic and partner’s
income, market size and the distance.
Coleman et al. (2011) analyzed trade prospects for new members of European Union (EU)
and the EU associated partner countries. An out of sample approach was used to project the
trade volumes for twenty selected countries by using the equation of gravity model for a
panel data set of bilateral exports from twelve EU economies to twenty OECD (Organization
for Economic Co-operation and Development) trading partners for time period of 1992-
32
2003. By the gravity model of new trade theory (NTT) determinants, they calculated the
potential of trade volumes. The prospects of the selected twenty countries for further trade
integration visà-vis the EU could be gauged by describing the trade volume projections as
the ratio of actual trade volumes for each pair of the economies. The ratio of projected trade
for the ten new member states was found to be multiples of actual levels of 2003, indicated
trade growth. The values near the unity were more frequent among the Mediterranean
economies, indicated fewer opportunities in the further integration of trade with the EU.
Emam and Salih (2011) conducted a study to measure the competitiveness of exports of the
Sudanese sheep export from 2002 to 2007. They used the primary data for the study which
were collected by appropriate questionnaire. They also used secondary data which was
collected from suitable sources. They used Policy Analysis Matrix Technique for analysis.
The estimated results exhibited that there was a competitiveness of Sudanese sheep, on the
other hand the economic profitability was larger than the financial one. That mean the direct
and indirect taxes were enforced on sheep. They concluded about the study and stated that
Sudanese sheep appeared to be more profitable and competitive but at the same time it was
suffered from large amount of taxes imposed by the Sudanese Government.
Kuncic (2012) examined determinants of bilateral trade with special focus on issues of
institutional endogeneity and institutional measures. He put emphasis on institutional
distance that could be a relevant determinant of trade than institutional quality. He found
that not all institutions matter for trade. The consistent effect was that of the quality of origin
and destination country’s legal institutions, which both increase trade. More importantly, he
highlighted the importance of institutional distance on trade, showed that economic distance
affected trade significantly and negatively. His conclusion in the research was that countries
which were more similar in terms of economic institutions, trade more with each other, and
the quality of legal institutions was always conducive to general trade, but surprisingly did
not determine trade partners.
Roy and Rayhan (2012) conducted a study about ‘Import Flows of Bangladesh: Gravity
Model Approach under Panel Data Methodology’ and they described that counterpoint to
export growth, Bangladesh import growth remained less strong, despite impressive progress
33
in import liberalization. The estimated results of basic gravity models of Bangladesh’s
import concluded that if the Bangladesh’s (importer) GDP and country J’s GDP was
increased by 1percent, import demand of Bangladesh and export supply of foreign country
increase by 2.30 and 0.73 percent (ceteris paribus).The coefficient of log (distance) which
reflects the trade cost, showed the estimated value -0.61 percent as a result of 1 percent
increase in bilateral distance between these two countries. The results showed that with 1%
increase of GDP, import demand of Bangladesh had increased by 0.95% and export supply
of country J increased by 1.61%.
Meijers (2012) concluded a positive impact of use of internet on economic development and
international trade. The study challenged that internet use did not clarify economic
development directly. Specific variables of openness to international trade were highly
correlated with the internet use. The outcomes in the literature that internet use had caused
trade was confirmed in the study, which suggested that internet use had a positive impact on
trade and the trade had a positive impacts on economic growth. The model of simultaneous
equations had confirmed the positive and significant role of using internet to trade openness
to the economic growth. The impact of internet use on international trade was shown more
in non-high income countries as compared to high income countries. Whereas the impact of
trade on the economic growth was same in non-high income and high income countries.
Shahraki et al. (2012) determined the priorities of target export market and measured
comparative advantage and competitiveness of the export of dried fruits for Iran from 2004
to 2009. The result of trade comparative advantage (RTA) and Revealed Comparative
Advantage (RCA) indices indicated that there was a satisfactory comparative advantage in
the export of pistachio and palm between 2004 and 2009. Using Constant Market Share
(CMS) index, the competitiveness of the export of pistachio and palm were negative in the
majority of countries. Moreover, an inappropriate export rate of agricultural crops was
distinguished by Michaely and chi-square particularly in pistachio and palm; meanwhile, it
determined a lackluster business expertise. There was a competitive advantage of pistachio
export in the entire period in France and Spain markets but, in the export of palm Britain
had a competitive advantage. According to the results, priorities in the export of the target
markets of pistachio were Hong Kong, Germany, Spain, India, Italy and France. The export
34
priorities of palm were India, Indonesia, Russia, Bangladesh, Malaysia, Canada and England
as well.
Dianniar (2013) described that since the end of 2nd World War, regional trade agreements
had proliferated across the world. As agreements of bilateral and regional trade were
becoming more prominent, it was important to discover the implications for world trade. In
the previous two decades, Asian countries had been involved in many FTAs like ASEAN
Free Trade Area (AFTA) and the ASEAN-China Free Trade Area (ACFTA). Indonesia,
which was the member of ASEAN, had been actively participated in those cooperation. The
purpose of paper was to analyze impacts of the free trade agreements on the agricultural
trade of Indonesia and to investigate the reality of Linder effect on bilateral trade of
Indonesia where trade would be more when the income per capita of trading economies were
also more. It was focused on agricultural sector because most of the ASEAN countries,
including the Indonesia, depended on that sector as a main source of GDP. Thus the gravity
model was chased to examine the determinants of agricultural trade flows of Indonesia, from
exports and imports side. With that objective this paper constructed basic, augmented and
gravity models with the linder effects and perform cross sectional and panel data
approximations. It was found that the fixed effect model was preferred than the gravity
model of random effects. The results showed that the AFTA and ACFTA membership did
not bring significant impact on agricultural trade of Indonesia.
Iqbal (2014) found that the European Union was the most important destination of exports
of Bangladesh, which was likely to face a great challenge to grow more exports for the
market of the EU in recent years. The ban on the imports of fishery products, supplier
performance, limiting infrastructure, well design and less diversified exportable goods,
economy instability, and non-tariff barriers were major factors which created the difficulty
to grow the trading performance of Bangladesh with the EU. The paper carried out the panel
data set which covered the annual exports, imports, real exchange rates, and the distance
from the years of 1980 to 2010 with balance panel data to make empirically supported
calculations, explored the determinants for free trade between Bangladesh and European
Union to recommend an approach to enhance exports capacity of Bangladesh with EU.
According to results of the study, GDP of Bangladesh was positively correlated with trade
35
but the GDP of European Union and bilateral real exchange rate had a negative impact on
trade. Both Bangladesh and the EU gained benefits by trading with each other. Low real
exchange rate and introduction of cost effective, well-designed and diversified products
could improve the exports capacity of Bangladesh with the European Union.
2.3 Summary
Reviewing available literature on trade, competitiveness and comparative advantage
revealed that most of the work on trade was general in nature and a few studies were found
which were focused on a special target market to lineate effects of major variables affecting
the trade of Pakistan. However literature of competiveness and comparative advantages of
Pakistani exports of agricultural products highlighted some quantitative efforts to capture
the comparative advantages of major agricultural products of Pakistan generally for
international markets for a single international price. Not a single detailed study was found
for a special market that has a large share in Pakistani agricultural trade except Turkey, hence
the present study was planned to analyze impact of major variables on trade of Pakistan and
making analysis of competitiveness and comparative advantages of major agricultural
products for a single market of United Arab Emirates as a trading partners. Many studies on
Pakistani agricultural products have been completed for the exports of agricultural products.
There was no research carried out by taking the single market as a destination of trade in
Pakistani products.
36
CHAPTER 3
MATERIALS AND METHODS
Materials and methods includes the tools and techniques of collection and analysis
of data; this is applied particularly for testing the hypothesis. Methodology is defined as the
logic of scientific procedure. For the successful completion of research study suitable
methodology is very necessary. Research methodology includes each and every step from
data collection to policy suggestions. It consists of selection of variables, collection of their
data from valid sources, correct model specification and application of appropriate analytical
techniques over the data to find the results.
The aim of current research was to explore the determinants of agricultural trade
between Pakistan and United Arab Emirates. Competitiveness and comparative advantages
of major agricultural products traded between Pakistan and United Arab Emirates were
estimated by using different methods. It is imperative to define the variables to make the
study more scientific. Different data collection sources and estimation techniques were used
and described in this portion of the study to make the research more clear and scientific.
3.1 Data Collection and Sources
For the determinants of agricultural trade between Pakistan and United Arab
Emirates, different variables were selected and panel data were used in analysis for the
duration of 1975 to 2012. The data about these indicators were taken from the World Bank,
Federal Bureau of Statistics Islamabad Pakistan, Pakistan Economic Survey, International
Financial Statistics and International Monetary Fund. Time series data about prices of
agricultural products were taken from Statistical Year Books of Pakistan, International
Trade Center, and Agricultural Price Institution, Islamabad, Pakistan.
3.2 Variables of the Models for Trade Determinants
For the analysis time series data were used for the trade estimation. Variables
included were GDP of Pakistan, GDP of major trading partners of Pakistan, population of
37
Pakistan, population of major trading partners of Pakistan and distance between Pakistan
and its major trading partners. Two dummy variables were used in the analysis. i.e., joint
border and cultural similarities. To determine the impacts of different variables on
agricultural trade of Pakistan with United Arab Emirates as a major trading partner the total
volume of bilateral trade was used as a dependent variable in the model as a proxy, because
the time series data of bilateral agricultural trade were not available. Pakistan’s major
portion of the trade is agricultural, and the factors which determine the overall trade also
affect the agricultural trade. The percentage of agricultural trade in total trade for the
duration of 2003-2013 is given in the appendix 39, to justify the use of total trade as a proxy
to agricultural trade as a dependent variable. Another justification of using the data of total
trade in the analysis was that because researcher used the gravity model of international
trade and for the gravity model all the variables included in the gravity equation affect the
trade of both agriculture and non-agriculture in a same pattern. It is the advantage of the
gravity model, that the use of this proxy is more suitable as compared to any other model of
the trade. Panel data of bilateral trade was taken in US$ million for the time period of 1975
– 2012. Panel data of GDP of Pakistan were taken in US$ Billion for the time period of 1975
– 2012. Data about the values of GDP of United Arab Emirates and other major trading
partners of Pakistan were taken in US$ Billion, which were obtained from the World Bank
database for the time period of 1975-2012. GDP is assumed to have a positive impact on
trade. Data about the Population of Pakistan was found from the Statistical Year Book of
Pakistan.
Data about the population of United Arab Emirates and other major trading partners
of Pakistan, were taken from the World Bank database. The variable of population is
assumed to have a positive impact on trade. So distance between two countries naturally
determine the volume of trade between them. A dummy variable of joint Border of both the
trading partners was taken for analysis to check the impact of joint border in bilateral trade.
The value of dummy variables were 0 and one, zero for the trading partners that have no
joint border and the value of one for those trading partners that have the joint border. Joint
border is assumed to have a positive impact on bilateral trade of two trading partners. So the
dummy variable of same border was used for determining the impacts on trade between
38
Pakistan and its main trading partner (United Arab Emirates). Another dummy variable of
cultural similarities was used for the trade analysis between the trading partners. The value
of dummy variable was taken one for those trading partners which have the same culture as
Pakistan and the value of zero was taken for those trading partners that have entirely
different culture as compared to Pakistan. The trading partners with similar cultures assumed
to have a positive impact on bilateral trade.
3.3 Exports of Major Agricultural Products of Pakistan to United Arab Emirates
On the basis of values of previous 10 years three major export products of agriculture
were selected that were exported to United Arab Emirates. These agricultural products were
basmati rice, meat (mutton and beef) and cotton yarn. Analyses of these three major
agricultural export products were conducted to check out the competitiveness and
comparative advantage.
3.4 Imports of Major Agricultural Products of Pakistan from United Arab Emirates
On the basis of data of flow of agricultural products from United Arab Emirates to
Pakistan, major three agricultural products with respect to value were selected for the
analysis to check out the competitiveness. These three agricultural products were milk, sugar
and dried vegetables.
3.5 Testing for Panel Unit Root
When dealing with the time series data for analysis, the econometric issues can affect
the estimations of parameters when using the OLS. Regressing a time series variables for an
analysis by using the Ordinary Least Squares (OLS) estimation can result a very high R2,
even when there is no meaningful relation in the variables. This situation cause a problem
that is called spurious regression between entirely unrelated variables made by a
nonstationary process.
All the econometrics techniques were based on the assumption that time series data
is stationary. But the recent studies have shown that most of the time series data available
now is non- stationary. We cannot use the statistical tools to analyze the data if the time
39
series were non-stationary as the results then are not appropriate. Most of the economic time
series showed trend over the period of time. When such non-stationary data is used for
analyses, the results produce then are although significant having high R-square value but
they are spurious (Granger and Newbold, 1974). Also the tests of significance applied on
trended variables become inappropriate. As the data used in the study under consideration
was also of time series so it would face the problem of non-stationarity.
To check the existence of unit root in panel data different tests were used. These tests
for unit root of panel data were Levin, Lin & Chu (LLC), I P, Shin W-stat, ADF - Fisher
Chisquare and PP - Fisher Chi-square. If hypothesis of unit root is not rejected, then first
difference is tested for presence of unit root and so on. This procedure continues until the
null hypothesis of unit root is rejected.
3.6 Gravity Model of Trade
Gravity model for trade analysis is very popular which is based on the Newton’s law
of gravitational force. Gravity model explains the trade quantity and capital flows between
two countries. The theory of gravity was first originated in studies of physics, referring to
Newton’s law of gravity (Kristjánsdóttir, 2005). Gravity model was derived from the Law
of Universal Gravitation which describes the force of attraction between two objects. This
law is used for the attraction of two countries with respect to mutual trade and also brief
about the barriers in the attraction of both countries for expansion of mutual trade which is
affected also by the trade agreements between them. When gravity model is applied in the
international trade, imports and exports are considered as gravity force and economic
masses are determinants of international trade. Model helps in identifying the driving forces
of trade. Poyhonen (1963) and Tinbergen (1962) were the pioneer of gravity model who
used the design of gravity model for trade flow. Its standard empirical framework is used to
predict how the economies match up in international trade (Eichengreen and Irwin, 1997;
Rauch, 1999). Many studies revealed that gravity equation is persistent with more standard
models of trade and it can be transformed in gravity like equations under some assumptions
(Beghin and Bureau, 2001). Standard gravity model has upgraded with many variables to
check whether these variables were good and significant in explaining international trade or
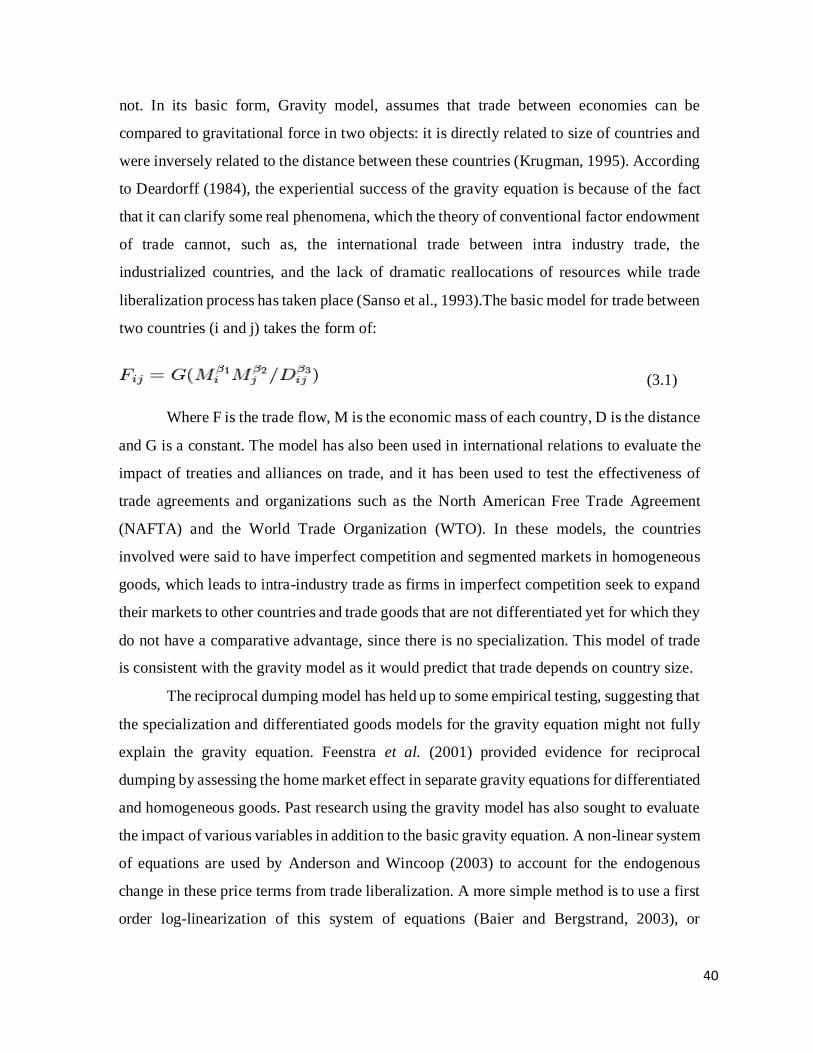
40
not. In its basic form, Gravity model, assumes that trade between economies can be
compared to gravitational force in two objects: it is directly related to size of countries and
were inversely related to the distance between these countries (Krugman, 1995). According
to Deardorff (1984), the experiential success of the gravity equation is because of the fact
that it can clarify some real phenomena, which the theory of conventional factor endowment
of trade cannot, such as, the international trade between intra industry trade, the
industrialized countries, and the lack of dramatic reallocations of resources while trade
liberalization process has taken place (Sanso et al., 1993).The basic model for trade between
two countries (i and j) takes the form of:
(3.1)
Where F is the trade flow, M is the economic mass of each country, D is the distance
and G is a constant. The model has also been used in international relations to evaluate the
impact of treaties and alliances on trade, and it has been used to test the effectiveness of
trade agreements and organizations such as the North American Free Trade Agreement
(NAFTA) and the World Trade Organization (WTO). In these models, the countries
involved were said to have imperfect competition and segmented markets in homogeneous
goods, which leads to intra-industry trade as firms in imperfect competition seek to expand
their markets to other countries and trade goods that are not differentiated yet for which they
do not have a comparative advantage, since there is no specialization. This model of trade
is consistent with the gravity model as it would predict that trade depends on country size.
The reciprocal dumping model has held up to some empirical testing, suggesting that
the specialization and differentiated goods models for the gravity equation might not fully
explain the gravity equation. Feenstra et al. (2001) provided evidence for reciprocal
dumping by assessing the home market effect in separate gravity equations for differentiated
and homogeneous goods. Past research using the gravity model has also sought to evaluate
the impact of various variables in addition to the basic gravity equation. A non-linear system
of equations are used by Anderson and Wincoop (2003) to account for the endogenous
change in these price terms from trade liberalization. A more simple method is to use a first
order log-linearization of this system of equations (Baier and Bergstrand, 2003), or
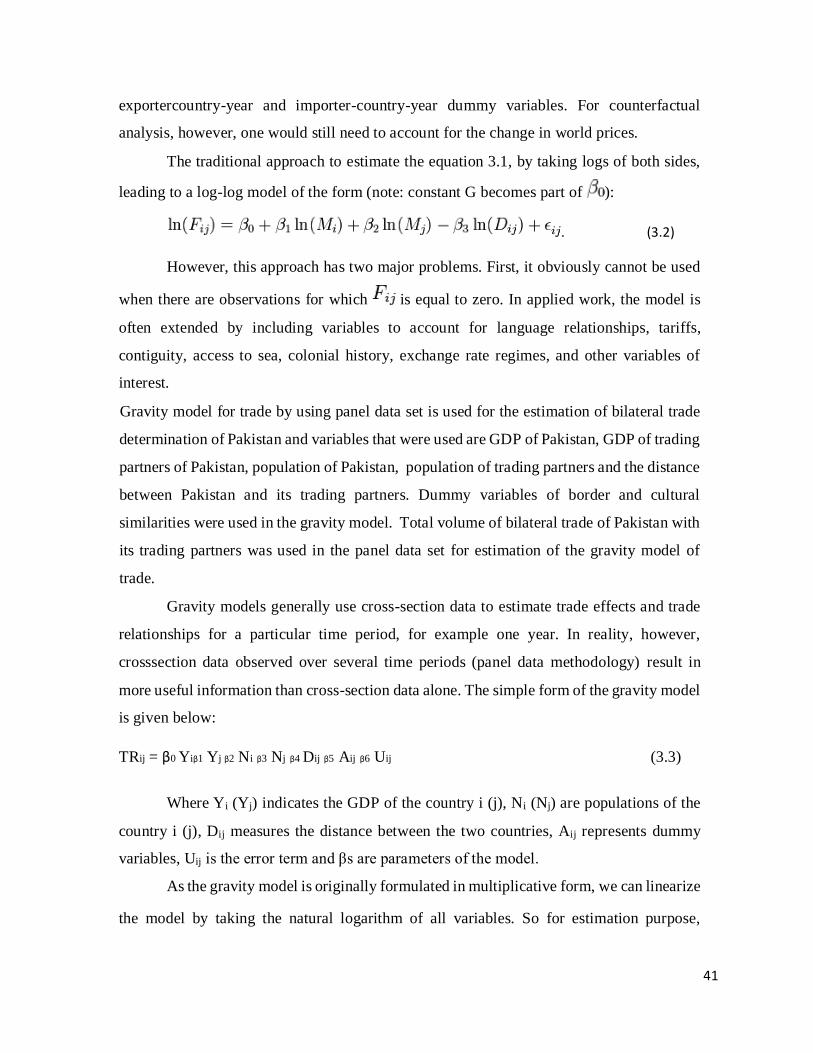
41
exportercountry-year and importer-country-year dummy variables. For counterfactual
analysis, however, one would still need to account for the change in world prices.
The traditional approach to estimate the equation 3.1, by taking logs of both sides,
leading to a log-log model of the form (note: constant G becomes part of ):
. (3.2)
However, this approach has two major problems. First, it obviously cannot be used
when there are observations for which is equal to zero. In applied work, the model is
often extended by including variables to account for language relationships, tariffs,
contiguity, access to sea, colonial history, exchange rate regimes, and other variables of
interest.
Gravity model for trade by using panel data set is used for the estimation of bilateral trade
determination of Pakistan and variables that were used are GDP of Pakistan, GDP of trading
partners of Pakistan, population of Pakistan, population of trading partners and the distance
between Pakistan and its trading partners. Dummy variables of border and cultural
similarities were used in the gravity model. Total volume of bilateral trade of Pakistan with
its trading partners was used in the panel data set for estimation of the gravity model of
trade.
Gravity models generally use cross-section data to estimate trade effects and trade
relationships for a particular time period, for example one year. In reality, however,
crosssection data observed over several time periods (panel data methodology) result in
more useful information than cross-section data alone. The simple form of the gravity model
is given below:
TRij = β0 Yiβ1 Yj β2 Ni β3 Nj β4 Dij β5 Aij β6 Uij (3.3)
Where Yi (Yj) indicates the GDP of the country i (j), Ni (Nj) are populations of the
country i (j), Dij measures the distance between the two countries, Aij represents dummy
variables, Uij is the error term and βs are parameters of the model.
As the gravity model is originally formulated in multiplicative form, we can linearize
the model by taking the natural logarithm of all variables. So for estimation purpose,
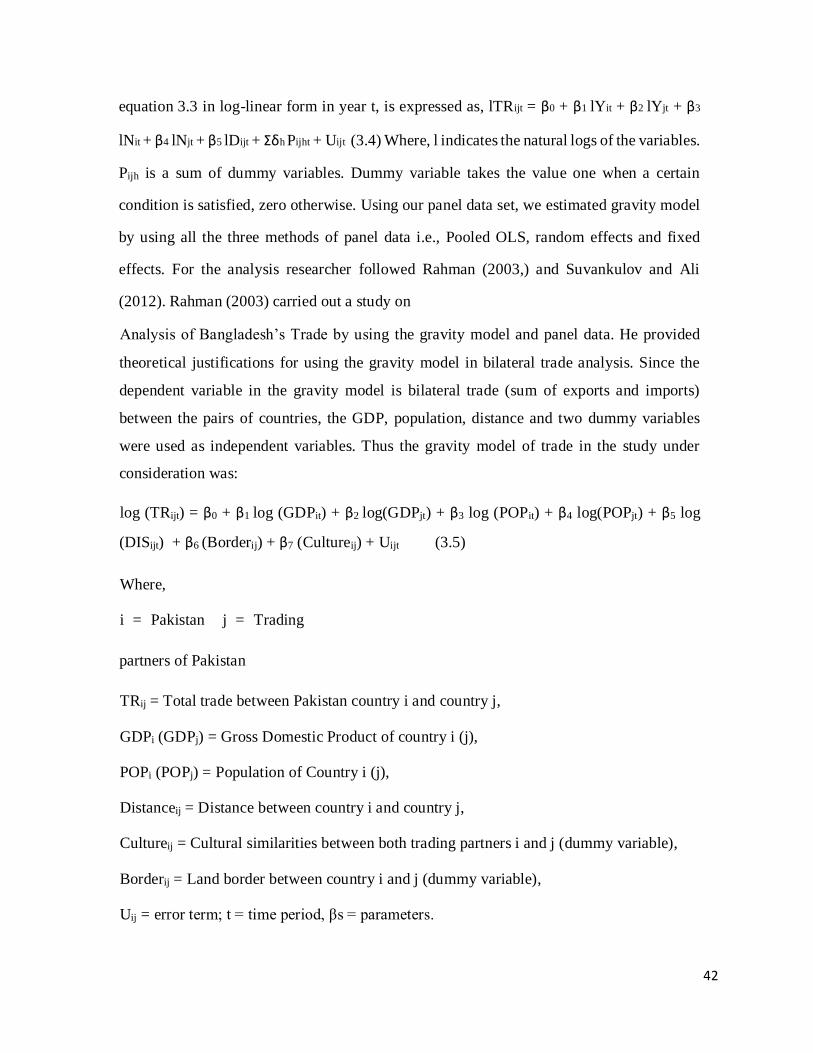
42
equation 3.3 in log-linear form in year t, is expressed as, lTRijt = β0 + β1 lYit + β2 lYjt + β3
lNit + β4 lNjt + β5 lDijt + Σδh Pijht + Uijt (3.4) Where, l indicates the natural logs of the variables.
Pijh is a sum of dummy variables. Dummy variable takes the value one when a certain
condition is satisfied, zero otherwise. Using our panel data set, we estimated gravity model
by using all the three methods of panel data i.e., Pooled OLS, random effects and fixed
effects. For the analysis researcher followed Rahman (2003,) and Suvankulov and Ali
(2012). Rahman (2003) carried out a study on
Analysis of Bangladesh’s Trade by using the gravity model and panel data. He provided
theoretical justifications for using the gravity model in bilateral trade analysis. Since the
dependent variable in the gravity model is bilateral trade (sum of exports and imports)
between the pairs of countries, the GDP, population, distance and two dummy variables
were used as independent variables. Thus the gravity model of trade in the study under
consideration was:
log (TRijt) = β0 + β1 log (GDPit) + β2 log(GDPjt) + β3 log (POPit) + β4 log(POPjt) + β5 log
(DISijt) + β6 (Borderij) + β7 (Cultureij) + Uijt (3.5)
Where,
i = Pakistan j = Trading
partners of Pakistan
TRij = Total trade between Pakistan country i and country j,
GDPi (GDPj) = Gross Domestic Product of country i (j),
POPi (POPj) = Population of Country i (j),
Distanceij = Distance between country i and country j,
Cultureij = Cultural similarities between both trading partners i and j (dummy variable),
Borderij = Land border between country i and j (dummy variable),
Uij = error term; t = time period, βs = parameters.
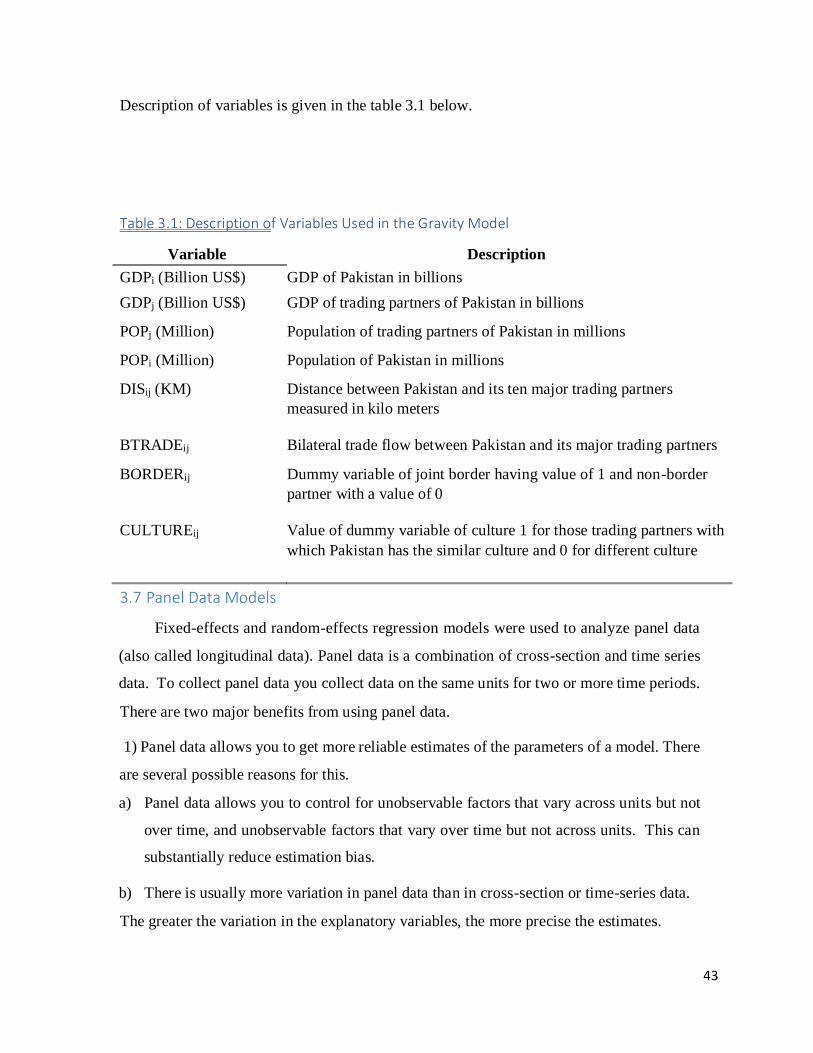
43
Description of variables is given in the table 3.1 below.
Table 3.1: Description of Variables Used in the Gravity Model
Variable Description
GDPi (Billion US$) GDP of Pakistan in billions
GDPj (Billion US$) GDP of trading partners of Pakistan in billions
POPj (Million) Population of trading partners of Pakistan in millions
POPi (Million) Population of Pakistan in millions
DISij (KM) Distance between Pakistan and its ten major trading partners
measured in kilo meters
BTRADEij Bilateral trade flow between Pakistan and its major trading partners
BORDERij Dummy variable of joint border having value of 1 and non-border
partner with a value of 0
CULTUREij Value of dummy variable of culture 1 for those trading partners with
which Pakistan has the similar culture and 0 for different culture
3.7 Panel Data Models
Fixed-effects and random-effects regression models were used to analyze panel data
(also called longitudinal data). Panel data is a combination of cross-section and time series
data. To collect panel data you collect data on the same units for two or more time periods.
There are two major benefits from using panel data.
1) Panel data allows you to get more reliable estimates of the parameters of a model. There
are several possible reasons for this.
a) Panel data allows you to control for unobservable factors that vary across units but not
over time, and unobservable factors that vary over time but not across units. This can
substantially reduce estimation bias.
b) There is usually more variation in panel data than in cross-section or time-series data.
The greater the variation in the explanatory variables, the more precise the estimates.
44
c) There is usually less multicollinearity among explanatory variables when using panel
data than time-series or cross-section data alone. This also results in more precise
parameter estimates.
2) Panel data allows you to identify and measure effects that cannot be identified and
measured using cross-sectional data or time-series data.
For example, suppose that your objective is to estimate a production function to
obtain separate estimates of economies of scale and technological change for a particular
industry. If you have cross-section data, you can obtain an estimate of economies of scale,
but you can’t obtain an estimate of technological change. If you have time-series data you
cannot separate economies of scale from technological change. To attempt to separate
economies of scale from technological change, past time-series studies have assumed
constant returns to scale; however, this is a very dubious procedure. If you have panel data,
you can identify and measure both economies of scale and technological change.
3.7.1 Fixed-Effects Model
One way to take into account the “individuality” of each country or each
crosssectional unit is to let the intercept vary for each country but still assume that the slope
coefficients are constant across firms. To see this, we write model as:
Yit = β0i + β1 X1it + β2 X2it + β3 X3it + β4 X4it + uit (3.6)
Notice that we have put the subscript i on the intercept term to suggest that the
intercepts of the ten countries may be different; the differences may be due to special
features of each country, such as managerial style or managerial philosophy.
In the literature, model (3.6) is known as the fixed effects (regression) model (FEM).
The term “fixed effects” is due to the fact that, although the intercept may differ across
individuals (here the ten countries), each individual’s intercept does not vary over time; that
is, it is time invariant. Notice that if we were to write the intercept as β0it, it will suggest
that the intercept of each country or individual is time variant. It may be noted that the FEM
45
given in (3.6) assumes that the (slope) coefficients of the regressors do not vary across
individuals or over time.
3.7.2 Random Effects Model
If the dummy variables do in fact represent a lack of knowledge about the (true)
model, why not express this ignorance through the disturbance term uit? This is precisely
the approach suggested by the proponents of the so called error components model (ECM)
or random effects model (REM).
The basic idea is to start with (3.6):
Yit = β0i + β1 X1it + β2 X2it + β3 X3it + β4 X4it + β5 X5it + β6 D1it+ β7 D2it + uit (3.7)
Instead of treating β0i as fixed, we assume that it is a random variable with a mean
value of β0 (no subscript i here). And the intercept value for an individual company can be
expressed as
Β0i = βo + εi i = 1, 2, . . . , N (3.8)
Where εi is a random error term with a mean value of zero and variance of σ2ε. What we are
essentially saying is that the four firms included in our sample are a drawing from a much
larger universe of such individuals and that they have a common mean value for the intercept
( = β0) and the individual differences in the intercept values of each company are reflected
in the error term εi .
Substituting (3.8) into (3.7), we obtain:
Yit = β0 + β1 X1it + β2 X2it +………+ εi + uit
= β0 + β1 X1it + β2 X2it +…………. + wit (3.9)
Where
46
wit = εi + uit (3.10)
The composite error term which consists of two components, εi, which is the
crosssection, or individual-specific, error component, and uit , which is the combined time
series and cross-section error component. The term error components model derives its
name because the composite error term wit consists of two (or more) error components.
3.8 Selection of Appropriate Model for Panel Analysis
When analyzing panel data, which model is most appropriate: the fixed-effects model,
or the random effects model? To decide which model is most appropriate, many economists
use the following criterion.
If the unit dependent unobserved effects (vi) are correlated with one or more of the
explanatory variables, then the correct model is the fixed effects model. If the unit dependent
unobserved effects (vi) are not correlated with one or more of the explanatory variables, and
if they can be viewed as outcomes of a random variable, then the correct model is the random
effects model. The random-effects model assumes that the unit dependent unobserved
effects are not correlated with the explanatory variables. If this assumption is violated, then
the random-effects estimator will yield biased and inconsistent estimates. The fixed-effects
estimator will yield unbiased and consistent estimates.
It is worth noting that the fixed effects approach does not allow for estimating
coefficients on time invariant variables such as distance, common border or language
dummies. We have paid particular attention to the fact that gravity model not only contain
time varying variables such as GDPs, exchange rate but also includes time invariant
variables namely distance and border. It is worth noting that FEM does not allow for
estimating time invariant variables because successful transformation wipes out such
variables (Rahman, 2003). However, the pooled OLS and random effects treatment does
allow the model to contain observed time invariant characteristics.
47
3.8.1 Hausman Specification Test ( Random Effects or Fixed Effects)
A central assumption in random effects estimation is the assumption that the random
effects are uncorrelated with the explanatory variables. One common method for testing this
assumption is to employ a Hausman (1978) test to compare the fixed and random effects
estimates of coefficients (Wooldridge, 2002 and Baltagi, 2005).
In many situations, you may be uncertain whether the unit dependent unobserved
effects (vi) are correlated with one or more of the explanatory variables, and therefore
uncertain whether the fixed-effects model or random-effects model is most appropriate. In
these situations, you can use a Hausman test to test whether the unit dependent unobserved
effects (vi) are correlated with the explanatory variables. For the Hausman test, the null and
alternative hypotheses are as follows.
H0: vi is not correlated with Xit (random-effects model appropriate)
H1: vi is correlated with Xit (fixed-effects model is appropriate)
To test the null hypothesis, you compare the estimates from the random-effects
estimator and the fixed- effects estimator. The random-effects estimator is consistent under
the null hypothesis, but inconsistent under the alternative hypothesis. The fixed-effects
estimator is consistent under both the null and alternative hypotheses. If the estimates for
the random-effects estimator are not significantly different from the estimates for the
fixedeffects estimator, then we accept the null hypothesis and conclude that vi is not
correlated with Xit, and therefore the random-effects model is the appropriate model. If the
estimates for the random-effects estimator are significantly different from the estimates for
the fixed- effects estimator, then we reject the null and conclude that v i is correlated with
Xit, and therefore the fixed- effects model is the appropriate model. The Hausman test
statistic has an approximate chi-square distribution with k degrees of freedom, where k is
the number of slope parameters in the model.
Small p-value, by Hausman test shows that coefficient estimated by random effects
model and fixed effects model were not same. The decision of rejecting the null hypothesis
was made on the basis of p-value.
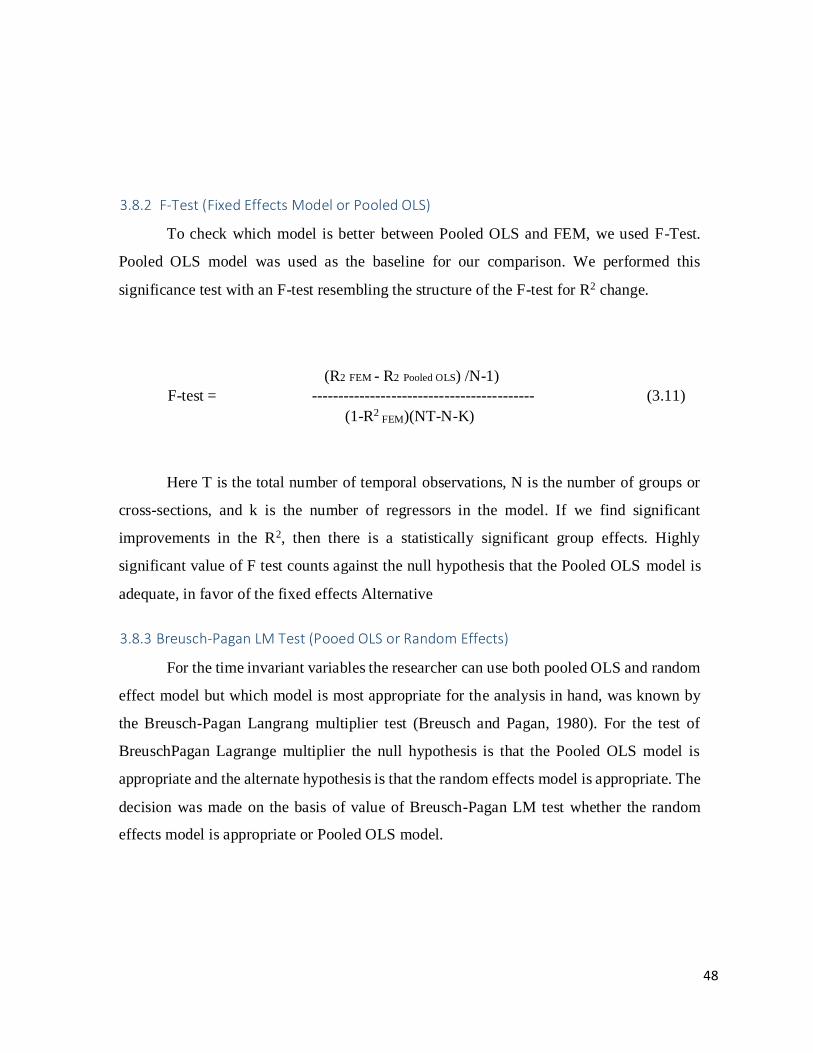
48
3.8.2 F-Test (Fixed Effects Model or Pooled OLS)
To check which model is better between Pooled OLS and FEM, we used F-Test.
Pooled OLS model was used as the baseline for our comparison. We performed this
significance test with an F-test resembling the structure of the F-test for R2 change.
(R2 FEM - R2 Pooled OLS) /N-1)
F-test = ------------------------------------------ (3.11)
(1-R2 FEM)(NT-N-K)
Here T is the total number of temporal observations, N is the number of groups or
cross-sections, and k is the number of regressors in the model. If we find significant
improvements in the R2, then there is a statistically significant group effects. Highly
significant value of F test counts against the null hypothesis that the Pooled OLS model is
adequate, in favor of the fixed effects Alternative
3.8.3 Breusch-Pagan LM Test (Pooed OLS or Random Effects)
For the time invariant variables the researcher can use both pooled OLS and random
effect model but which model is most appropriate for the analysis in hand, was known by
the Breusch-Pagan Langrang multiplier test (Breusch and Pagan, 1980). For the test of
BreuschPagan Lagrange multiplier the null hypothesis is that the Pooled OLS model is
appropriate and the alternate hypothesis is that the random effects model is appropriate. The
decision was made on the basis of value of Breusch-Pagan LM test whether the random
effects model is appropriate or Pooled OLS model.
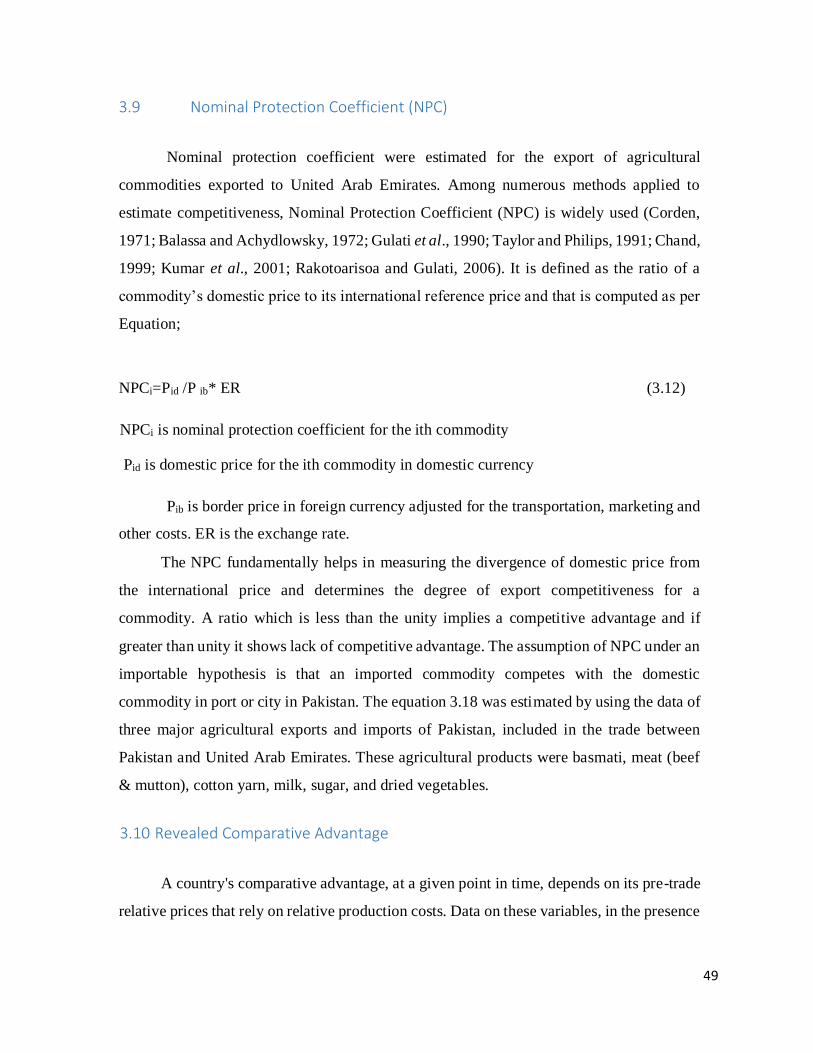
49
3.9 Nominal Protection Coefficient (NPC)
Nominal protection coefficient were estimated for the export of agricultural
commodities exported to United Arab Emirates. Among numerous methods applied to
estimate competitiveness, Nominal Protection Coefficient (NPC) is widely used (Corden,
1971; Balassa and Achydlowsky, 1972; Gulati et al., 1990; Taylor and Philips, 1991; Chand,
1999; Kumar et al., 2001; Rakotoarisoa and Gulati, 2006). It is defined as the ratio of a
commodity’s domestic price to its international reference price and that is computed as per
Equation;
NPCi=Pid /P ib* ER (3.12)
NPCi is nominal protection coefficient for the ith commodity
Pid is domestic price for the ith commodity in domestic currency
Pib is border price in foreign currency adjusted for the transportation, marketing and
other costs. ER is the exchange rate.
The NPC fundamentally helps in measuring the divergence of domestic price from
the international price and determines the degree of export competitiveness for a
commodity. A ratio which is less than the unity implies a competitive advantage and if
greater than unity it shows lack of competitive advantage. The assumption of NPC under an
importable hypothesis is that an imported commodity competes with the domestic
commodity in port or city in Pakistan. The equation 3.18 was estimated by using the data of
three major agricultural exports and imports of Pakistan, included in the trade between
Pakistan and United Arab Emirates. These agricultural products were basmati, meat (beef
& mutton), cotton yarn, milk, sugar, and dried vegetables.
3.10 Revealed Comparative Advantage
A country's comparative advantage, at a given point in time, depends on its pre-trade
relative prices that rely on relative production costs. Data on these variables, in the presence
50
of factor and product market distortions, are difficult to generate. However, the comparative
advantage concept can be approximated in an indirect way, by using post- trade data that
manifests post-trade relative prices, prevailing factors, and product market distortions. The
revealed comparative advantage approach is one of the few formal methodologies to
measure a country’s intensity of comparative advantage and disadvantage in a particular
industry.
Competitiveness of the country was assessed using the Revealed Comparative Advantage
(RCA) and Revealed Symmetric Comparative Advantage (RSCA) measures of
competitiveness. These measures were estimated for the periods 2003 -2012.
Revealed comparative advantage is usually used to investigate shifts over time in
comparative advantage of industries. This approach, however, is not meant to capture the
potential future comparative advantage of a country, as RCA indices are based on actual
trade data. However, RCA indices estimated across time can point to the general direction
in which the pattern of comparative advantage is moving. The RCA index compares a
country's world export share of a commodity, with the country's total export share in total
world exports. If a country's share of world exports of a particular commodity is greater than
its share of world exports of all commodities, RCA will be greater than one. A country
therefore has a revealed comparative advantage only in those products for which its market
share of world exports is above its average share of world exports. In other words, the
country is a relatively heavy exporter of a product under consideration and possesses a
revealed comparative advantage in that product line.
RCA approach is used to estimate the Comparative advantage of a country for a
specific commodity. The idea to determine a country’s strong sectors by investigating the
actual export flow was pioneered by Liesner (1958). Since this procedure was polished and
popularized by Balassa (1965, 1989). It is commonly known as Balassa Index. Alternatively,
the actual export flows ‘reveal’ the country’s powerful sectors. So it is known as Revealed
Comparative Advantage. Before describing the Balassa (1965), it is very important to note
that before Balassa introduced this famous RCA index in 1965, Liesner (1958) had already
contributed to the empirical work of RCA. To this end, Liesner (1958) can be argued to be
first empirical study in the field of RCA. Following Leisner’s work, a complete or advanced
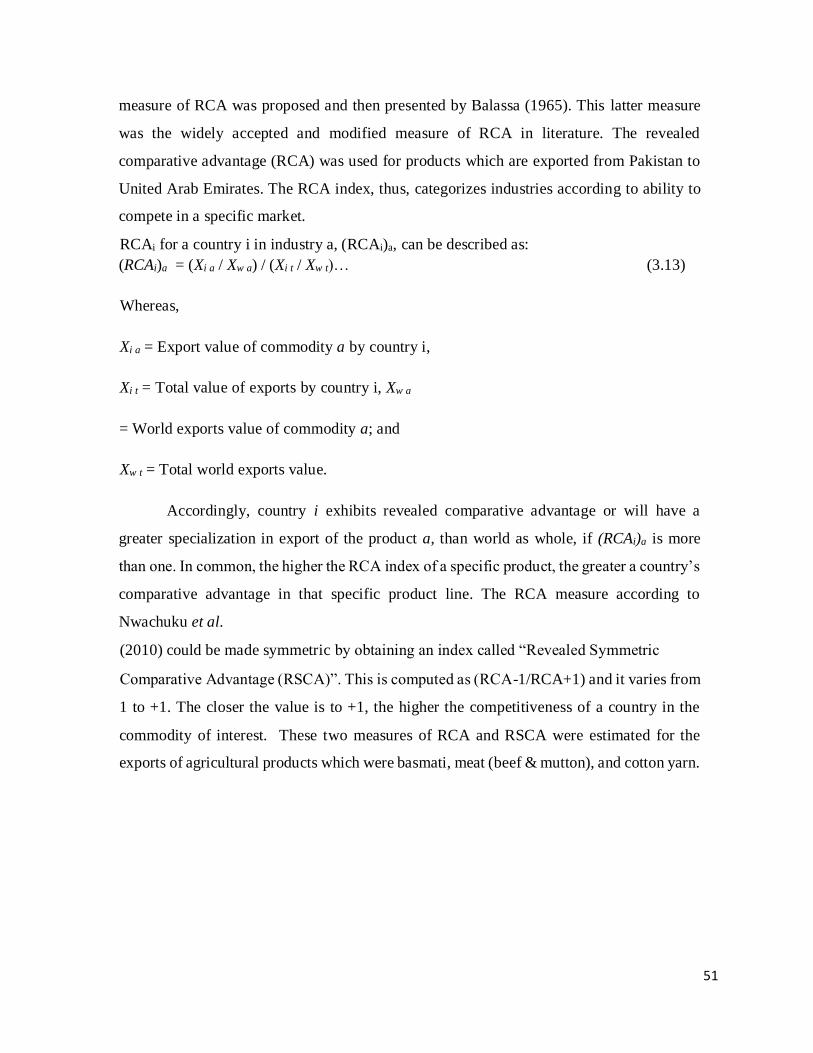
51
measure of RCA was proposed and then presented by Balassa (1965). This latter measure
was the widely accepted and modified measure of RCA in literature. The revealed
comparative advantage (RCA) was used for products which are exported from Pakistan to
United Arab Emirates. The RCA index, thus, categorizes industries according to ability to
compete in a specific market.
RCAi for a country i in industry a, (RCAi)a, can be described as:
(RCAi)a = (Xi a / Xw a) / (Xi t / Xw t)… (3.13)
Whereas,
Xi a = Export value of commodity a by country i,
Xi t = Total value of exports by country i, Xw a
= World exports value of commodity a; and
Xw t = Total world exports value.
Accordingly, country i exhibits revealed comparative advantage or will have a
greater specialization in export of the product a, than world as whole, if (RCAi)a is more
than one. In common, the higher the RCA index of a specific product, the greater a country’s
comparative advantage in that specific product line. The RCA measure according to
Nwachuku et al.
(2010) could be made symmetric by obtaining an index called “Revealed Symmetric
Comparative Advantage (RSCA)”. This is computed as (RCA-1/RCA+1) and it varies from
1 to +1. The closer the value is to +1, the higher the competitiveness of a country in the
commodity of interest. These two measures of RCA and RSCA were estimated for the
exports of agricultural products which were basmati, meat (beef & mutton), and cotton yarn.
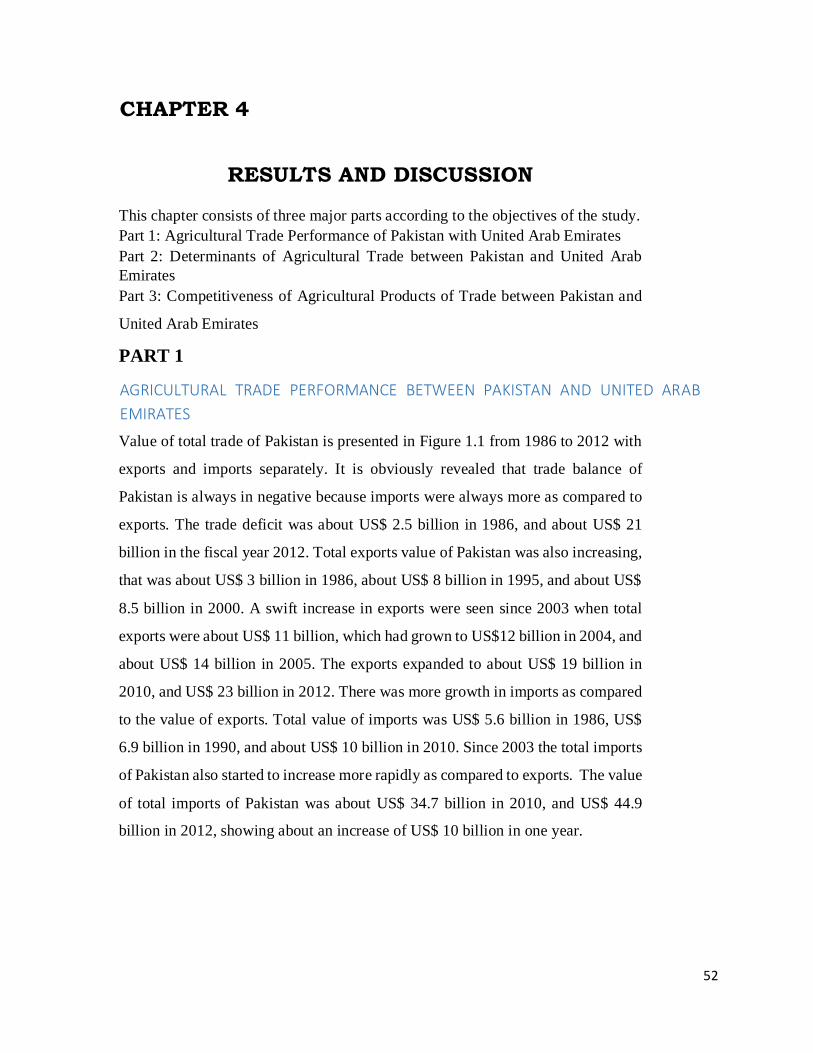
52
CHAPTER 4
RESULTS AND DISCUSSION
This chapter consists of three major parts according to the objectives of the study.
Part 1: Agricultural Trade Performance of Pakistan with United Arab Emirates
Part 2: Determinants of Agricultural Trade between Pakistan and United Arab
Emirates
Part 3: Competitiveness of Agricultural Products of Trade between Pakistan and
United Arab Emirates
PART 1
AGRICULTURAL TRADE PERFORMANCE BETWEEN PAKISTAN AND UNITED ARAB
EMIRATES
Value of total trade of Pakistan is presented in Figure 1.1 from 1986 to 2012 with
exports and imports separately. It is obviously revealed that trade balance of
Pakistan is always in negative because imports were always more as compared to
exports. The trade deficit was about US$ 2.5 billion in 1986, and about US$ 21
billion in the fiscal year 2012. Total exports value of Pakistan was also increasing,
that was about US$ 3 billion in 1986, about US$ 8 billion in 1995, and about US$
8.5 billion in 2000. A swift increase in exports were seen since 2003 when total
exports were about US$ 11 billion, which had grown to US$12 billion in 2004, and
about US$ 14 billion in 2005. The exports expanded to about US$ 19 billion in
2010, and US$ 23 billion in 2012. There was more growth in imports as compared
to the value of exports. Total value of imports was US$ 5.6 billion in 1986, US$
6.9 billion in 1990, and about US$ 10 billion in 2010. Since 2003 the total imports
of Pakistan also started to increase more rapidly as compared to exports. The value
of total imports of Pakistan was about US$ 34.7 billion in 2010, and US$ 44.9
billion in 2012, showing about an increase of US$ 10 billion in one year.
53
4.1 Trade between Pakistan and United Arab Emirates
The value of trade flow between Pakistan and United Arab Emirates is presented
in Figure 4.1 for the duration 1980-2012. The value of exports from Pakistan to
United Arab Emirates was US$ 184 million in 1980 whereas value of imports was
US$ 373 million. The value of imports was almost double of the exports at that
time. The values of exports from Pakistan exceeded the values of imports by US$
17 million in 1987. The imports took over exports again in 1990 and caused a
negative trade balance that was about US$ 39 million. But after two years the
exports were again more than imports and ever since the trade balance between
Pakistan and United Arab Emirates is negative. The major gap between the exports
and imports was perceived in 1995 when value of total imports was about US$ 700
million whereas the value of exports was only about US$ 373 million. This gap
exists with small fluctuations but unexpectedly in 2000 the imports of Pakistan
from United Arab Emirates jumped to about US$ 1338 million that was more than
double the value of exports. Since 2000, imports of Pakistan from United Arab
Emirates, increased rapidly as compared to export growth and reached at the value
of US$ 6882 million in 2011, that was three times more than exports of Pakistan
to the United Arab Emirates. This speedy growth in import value continued and
reached at US$ 7987 million in 2012 against exports of about US$ 2872 million in
the same year (GOP, 2013).
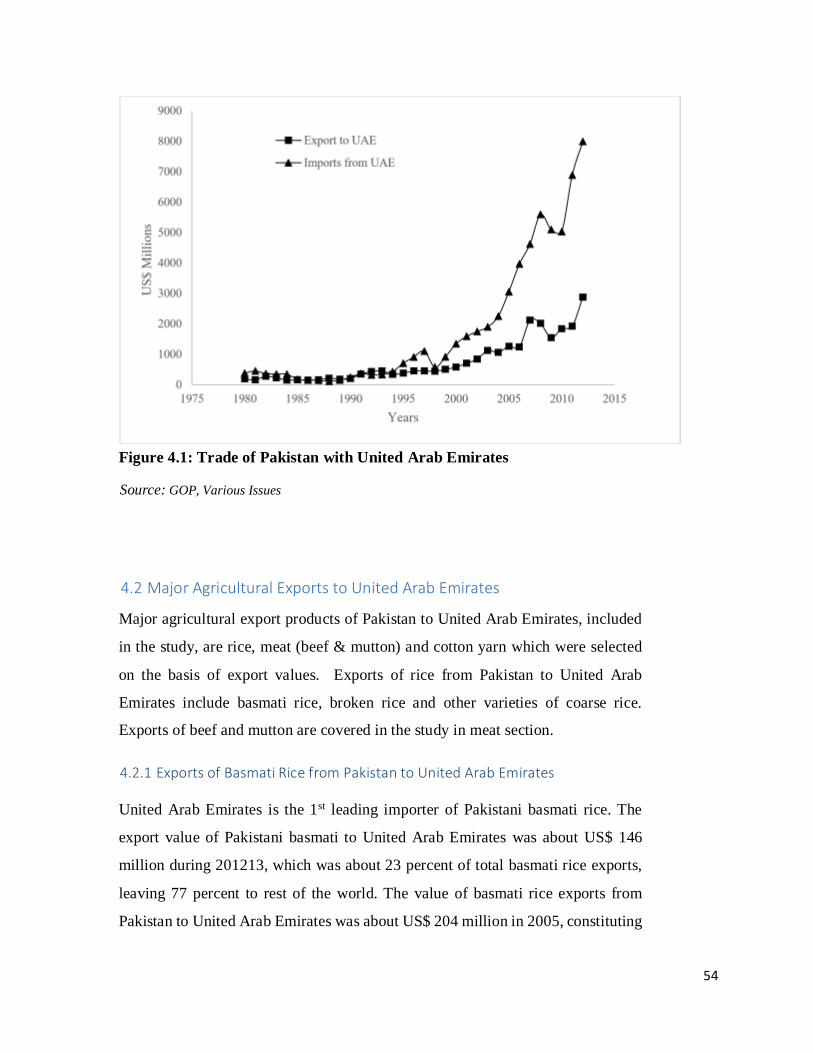
54
Figure 4.1: Trade of Pakistan with United Arab Emirates
Source: GOP, Various Issues
4.2 Major Agricultural Exports to United Arab Emirates
Major agricultural export products of Pakistan to United Arab Emirates, included
in the study, are rice, meat (beef & mutton) and cotton yarn which were selected
on the basis of export values. Exports of rice from Pakistan to United Arab
Emirates include basmati rice, broken rice and other varieties of coarse rice.
Exports of beef and mutton are covered in the study in meat section.
4.2.1 Exports of Basmati Rice from Pakistan to United Arab Emirates
United Arab Emirates is the 1st leading importer of Pakistani basmati rice. The
export value of Pakistani basmati to United Arab Emirates was about US$ 146
million during 201213, which was about 23 percent of total basmati rice exports,
leaving 77 percent to rest of the world. The value of basmati rice exports from
Pakistan to United Arab Emirates was about US$ 204 million in 2005, constituting
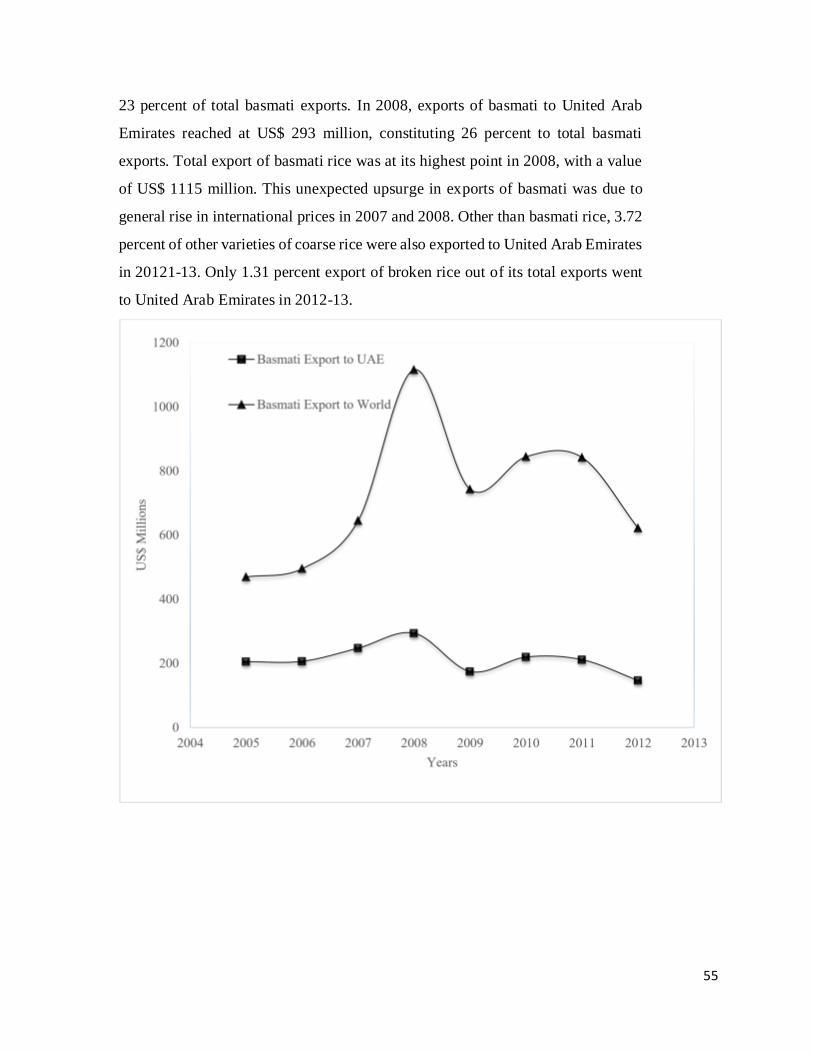
55
23 percent of total basmati exports. In 2008, exports of basmati to United Arab
Emirates reached at US$ 293 million, constituting 26 percent to total basmati
exports. Total export of basmati rice was at its highest point in 2008, with a value
of US$ 1115 million. This unexpected upsurge in exports of basmati was due to
general rise in international prices in 2007 and 2008. Other than basmati rice, 3.72
percent of other varieties of coarse rice were also exported to United Arab Emirates
in 20121-13. Only 1.31 percent export of broken rice out of its total exports went
to United Arab Emirates in 2012-13.
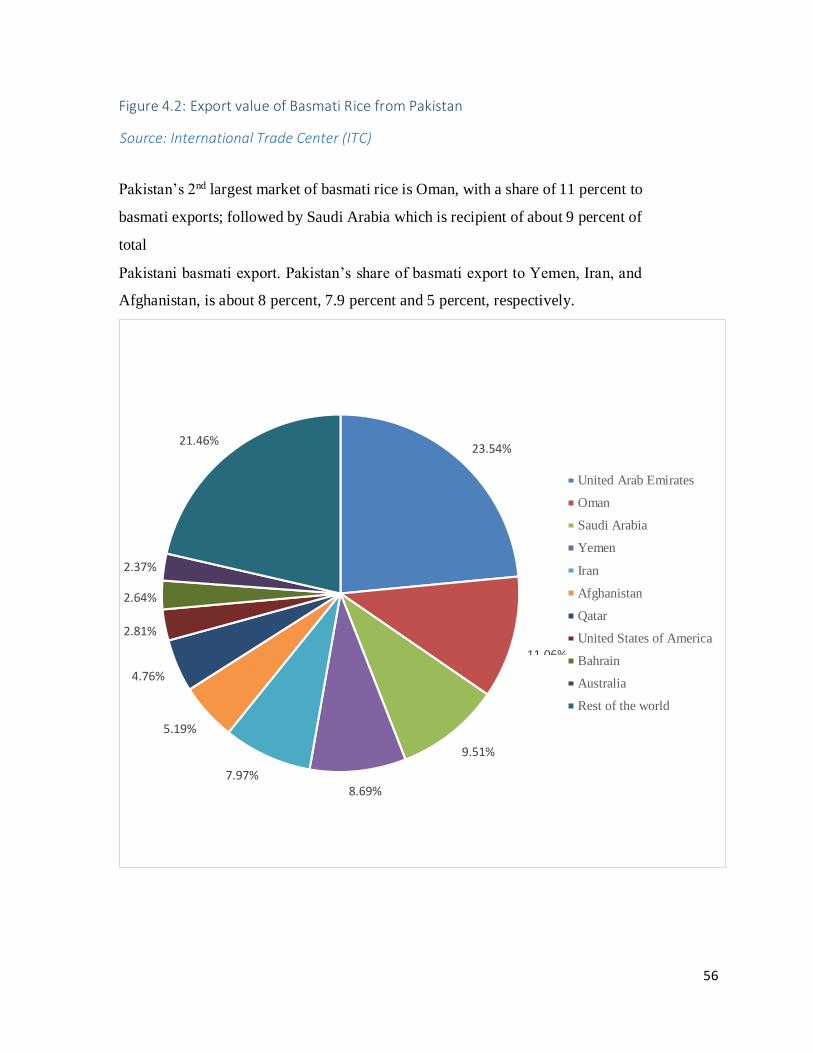
56
Figure 4.2: Export value of Basmati Rice from Pakistan
Source: International Trade Center (ITC)
Pakistan’s 2nd largest market of basmati rice is Oman, with a share of 11 percent to
basmati exports; followed by Saudi Arabia which is recipient of about 9 percent of
total
Pakistani basmati export. Pakistan’s share of basmati export to Yemen, Iran, and
Afghanistan, is about 8 percent, 7.9 percent and 5 percent, respectively.
23.54 %
% 11.06
% 9.51
% 8.69 % 7.97
% 5.19
% 4.76
2.81 %
% 2.64
2.37 %
% 21.46
United Arab Emirates
Oman
Saudi Arabia
Yemen
Iran
Afghanistan
Qatar
United States of America
Bahrain
Australia
Rest of the world
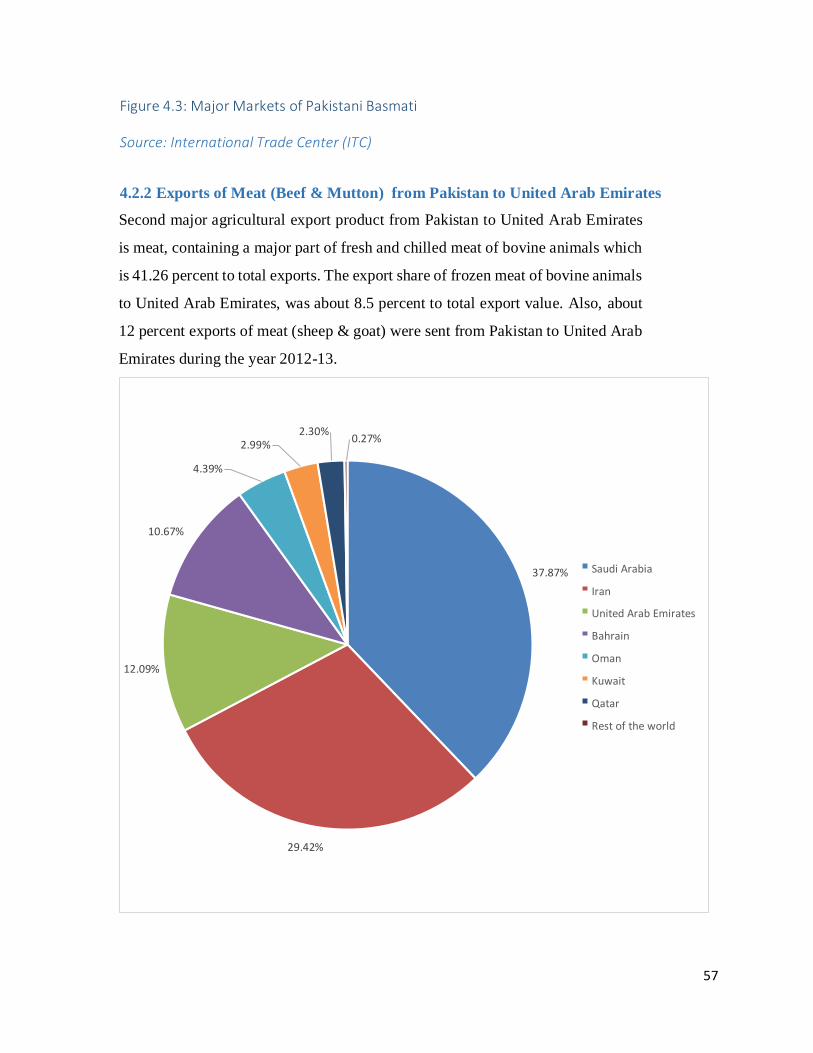
57
Figure 4.3: Major Markets of Pakistani Basmati
Source: International Trade Center (ITC)
4.2.2 Exports of Meat (Beef & Mutton) from Pakistan to United Arab Emirates
Second major agricultural export product from Pakistan to United Arab Emirates
is meat, containing a major part of fresh and chilled meat of bovine animals which
is 41.26 percent to total exports. The export share of frozen meat of bovine animals
to United Arab Emirates, was about 8.5 percent to total export value. Also, about
12 percent exports of meat (sheep & goat) were sent from Pakistan to United Arab
Emirates during the year 2012-13.
37.87 %
29.42 %
12.09 %
% 10.67
% 4.39
% 2.99 % 2.30
% 0.27
Saudi Arabia
Iran
United Arab Emirates
Bahrain
Oman
Kuwait
Qatar
Rest of the world
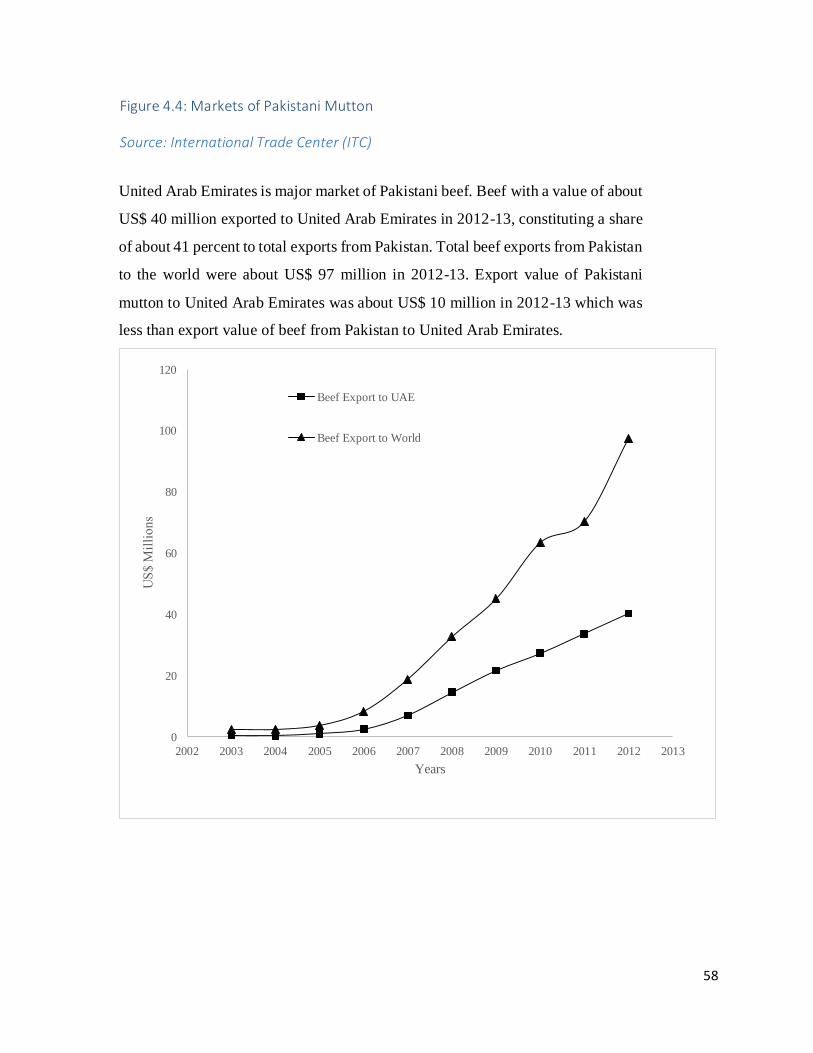
58
Figure 4.4: Markets of Pakistani Mutton
Source: International Trade Center (ITC)
United Arab Emirates is major market of Pakistani beef. Beef with a value of about
US$ 40 million exported to United Arab Emirates in 2012-13, constituting a share
of about 41 percent to total exports from Pakistan. Total beef exports from Pakistan
to the world were about US$ 97 million in 2012-13. Export value of Pakistani
mutton to United Arab Emirates was about US$ 10 million in 2012-13 which was
less than export value of beef from Pakistan to United Arab Emirates.
0
20
40
60
80
100
120
2002 2003 2004 2005 2006 2007 2008 2009 2010 2011 2012 2013
Years
Beef Export to UAE
Beef Export to World
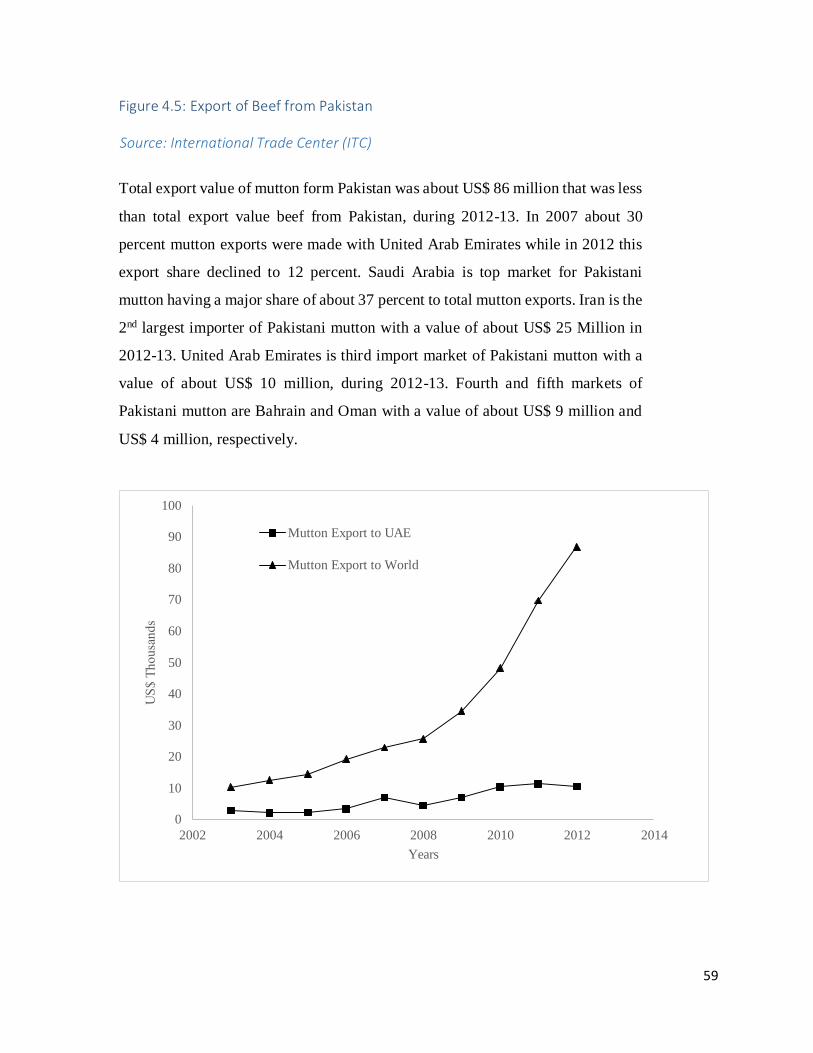
59
Figure 4.5: Export of Beef from Pakistan
Source: International Trade Center (ITC)
Total export value of mutton form Pakistan was about US$ 86 million that was less
than total export value beef from Pakistan, during 2012-13. In 2007 about 30
percent mutton exports were made with United Arab Emirates while in 2012 this
export share declined to 12 percent. Saudi Arabia is top market for Pakistani
mutton having a major share of about 37 percent to total mutton exports. Iran is the
2nd largest importer of Pakistani mutton with a value of about US$ 25 Million in
2012-13. United Arab Emirates is third import market of Pakistani mutton with a
value of about US$ 10 million, during 2012-13. Fourth and fifth markets of
Pakistani mutton are Bahrain and Oman with a value of about US$ 9 million and
US$ 4 million, respectively.
0
10
20
30
40
50
60
70
80
90
100
2002 2004 2006 2008 2010 2012 2014
Years
Mutton Export to UAE
Mutton Export to World
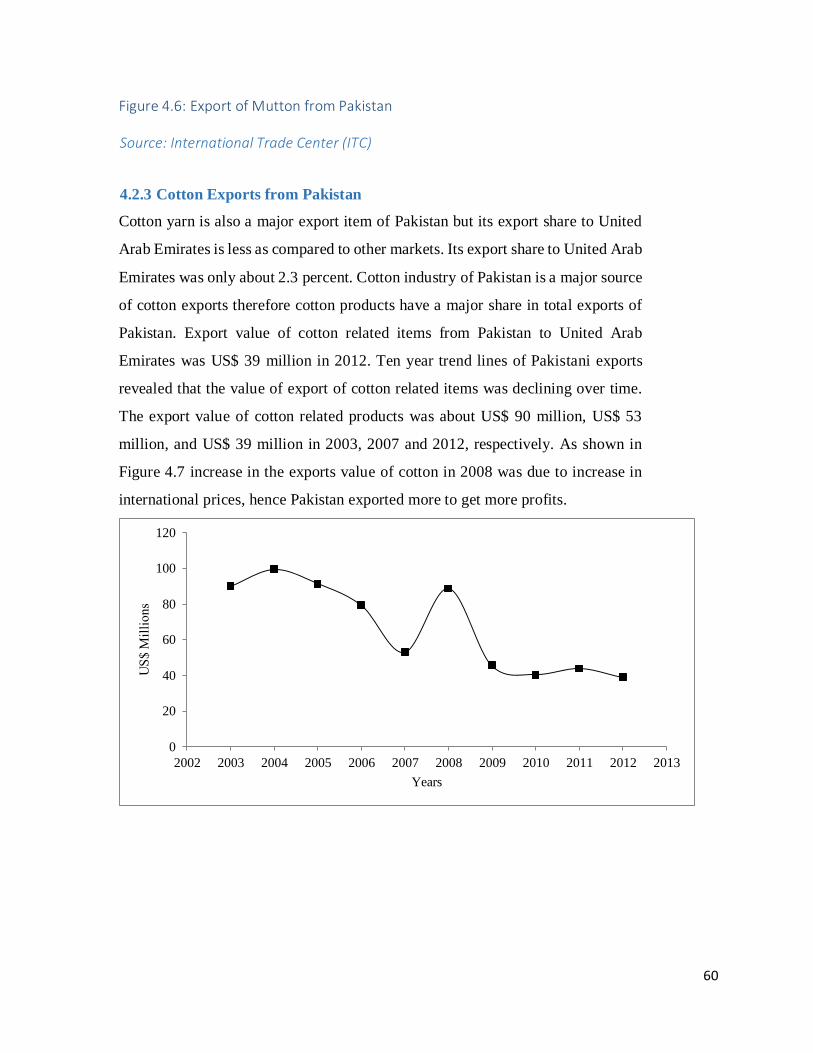
60
Figure 4.6: Export of Mutton from Pakistan
Source: International Trade Center (ITC)
4.2.3 Cotton Exports from Pakistan
Cotton yarn is also a major export item of Pakistan but its export share to United
Arab Emirates is less as compared to other markets. Its export share to United Arab
Emirates was only about 2.3 percent. Cotton industry of Pakistan is a major source
of cotton exports therefore cotton products have a major share in total exports of
Pakistan. Export value of cotton related items from Pakistan to United Arab
Emirates was US$ 39 million in 2012. Ten year trend lines of Pakistani exports
revealed that the value of export of cotton related items was declining over time.
The export value of cotton related products was about US$ 90 million, US$ 53
million, and US$ 39 million in 2003, 2007 and 2012, respectively. As shown in
Figure 4.7 increase in the exports value of cotton in 2008 was due to increase in
international prices, hence Pakistan exported more to get more profits.
0
20
40
60
80
100
120
2002 2003 2004 2005 2006 2007 2008 2009 2010 2011 2012 2013
Years
61
Figure 4.7: Cotton Exports from Pakistan
Source: International Trade Center (ITC)
Major market of Pakistani cotton was china with a value of about US$ 1833 million
in 2012, constituting 35 percent share in total cotton exports from Pakistan.
Bangladesh is the 2nd largest market of Pakistani cotton with a value of about US$
579 million in 2012. Hong Kong is 3rd largest market of Pakistani cotton with
value of about US$ 229 million. Pakistan exported cotton to Turkey, Italy and
Korea with a value of about US$ 185 million, US$ 150 million and US$ 144
million, respectively in 2012. Total export value of cotton yarn from Pakistan was
about US$ 2102 million in 2012 and about 67 percent of this value was exported
to China. Hong Kong was the 2nd largest market of Pakistani cotton yarn with a
value of about US$ 191 million in 2012. Bangladesh was 3 rd largest importer of
Pakistani cotton yarn. Pakistan exported about US$ 5 million value of cotton yarn
to United Arab Emirates during 2012-13 (ITC, 2013).
4.3 Major Imports of Agricultural Products from United Arab Emirates
Major agricultural imports of Pakistan from United Arab Emirates are dried
vegetables, sugar and milk. These three products were selected on the basis of value
of imports.
4.3.1 Sugar Imports from United Arab Emirates
Sugar imports from United Arab Emirates amounted to US$ 1,179 thousand
against total sugar imports of US$ 6,627 thousand in 2012 constituting 17.7 percent
of total sugar imports. During previous last 10 years, sugar imports from United
Arab Emirates was very high in the years of 2005, 2006, 2009, and 2010 with a
value of about US$ 121 million, US$ 160 million, US$ 141 million and US$ 200
million, respectively. In 2008 about 52 percent of sugar of its total sugar imports
was imported from United Arab Emirates and about 75 percent of imports of sugar
were made from United Arab Emirates in 2009. The share of total imports of sugar

62
from United Arab Emirates was low after 2009 that was about 25 percent in 2010,
18 percent in 2011 and 17 percent in 2012. As shown in Figure 4.8, Pakistan could
not import sugar in 2007 and 2008, when international prices went up.
Due to domestic production, domestic demand and forecasted domestic
consumption, there were great fluctuations in the value of sugar imports by
Pakistan in previous years.
Figure 4.8: Value of Sugar Imports
Source: International Trade Center (ITC)
4.3.2 Milk Imports from United Arab Emirates
Total Value of milk and cream imports of Pakistan was US$ 102 million in 2012-
13 whereas, in 2003, it was only about US$ 7 million. In 2003 the value of imports
of milk and cream from United Arab Emirates was only 61 thousands that stretched
to US$ 143 thousands in 2005. It decreased to US$ 32 thousands only in 2009 and
again it started to increase, showing the value of US$ 360 thousands in 2010, 739
thousand in 2011, and 823 thousands in 2012.
-100
0
100
200
300
400
500
600
700
800
900
2002 2004 2006 2008 2010 2012 2014
Years
Sugar Imports from UAE
Sugar Imports from World
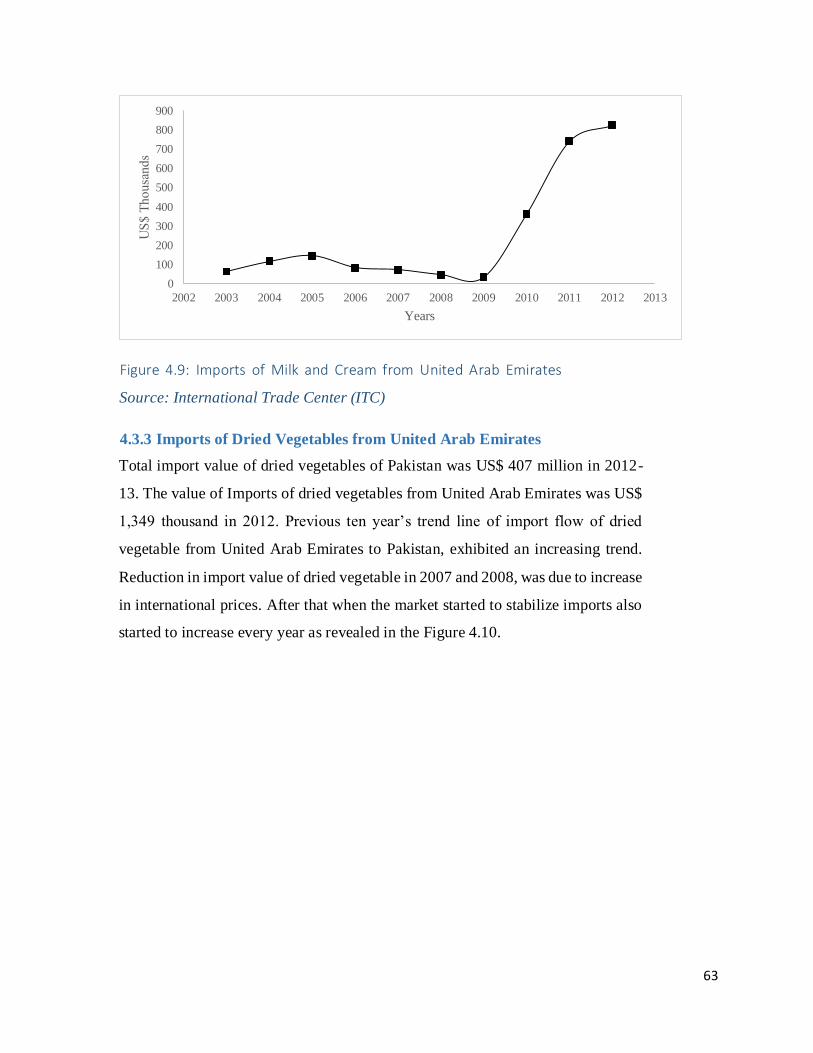
63
Figure 4.9: Imports of Milk and Cream from United Arab Emirates
Source: International Trade Center (ITC)
4.3.3 Imports of Dried Vegetables from United Arab Emirates
Total import value of dried vegetables of Pakistan was US$ 407 million in 2012-
13. The value of Imports of dried vegetables from United Arab Emirates was US$
1,349 thousand in 2012. Previous ten year’s trend line of import flow of dried
vegetable from United Arab Emirates to Pakistan, exhibited an increasing trend.
Reduction in import value of dried vegetable in 2007 and 2008, was due to increase
in international prices. After that when the market started to stabilize imports also
started to increase every year as revealed in the Figure 4.10.
0
100
200
300
400
500
600
700
800
900
2002 2003 2004 2005 2006 2007 2008 2009 2010 2011 2012 2013
Years
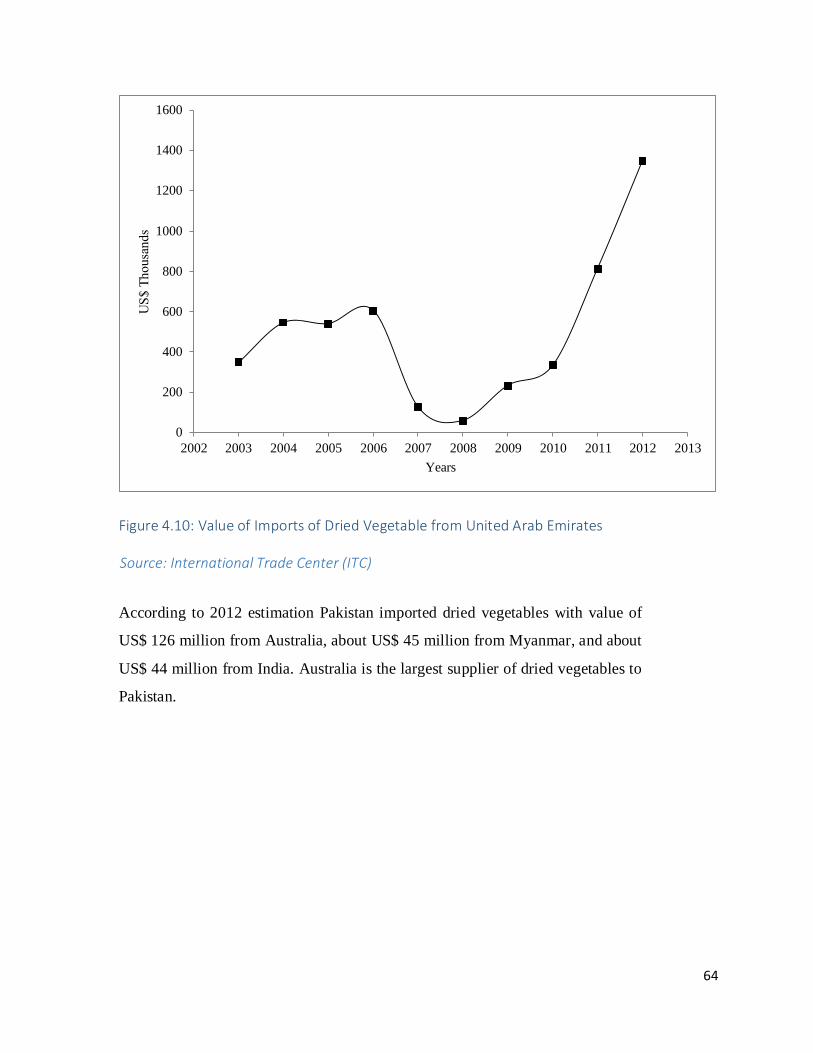
64
Figure 4.10: Value of Imports of Dried Vegetable from United Arab Emirates
Source: International Trade Center (ITC)
According to 2012 estimation Pakistan imported dried vegetables with value of
US$ 126 million from Australia, about US$ 45 million from Myanmar, and about
US$ 44 million from India. Australia is the largest supplier of dried vegetables to
Pakistan.
0
200
400
600
800
1000
1200
1400
1600
2002 2003 2004 2005 2006 2007 2008 2009 2010 2011 2012 2013
Years
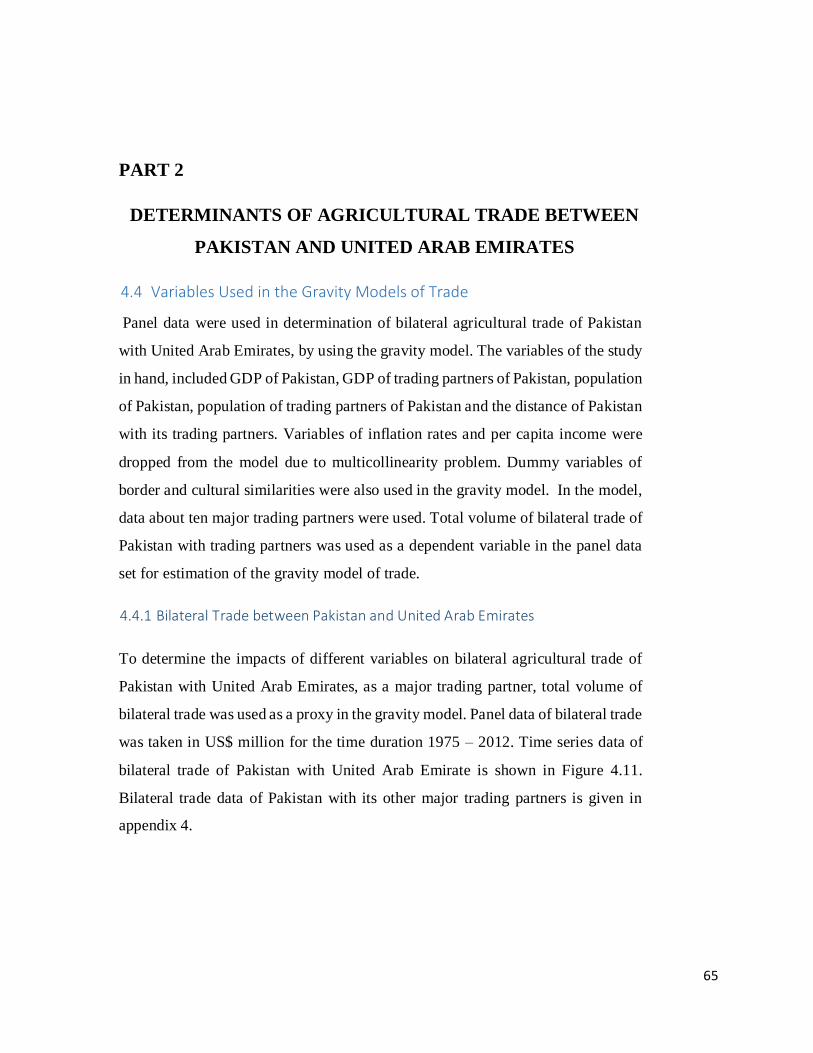
65
PART 2
DETERMINANTS OF AGRICULTURAL TRADE BETWEEN
PAKISTAN AND UNITED ARAB EMIRATES
4.4 Variables Used in the Gravity Models of Trade
Panel data were used in determination of bilateral agricultural trade of Pakistan
with United Arab Emirates, by using the gravity model. The variables of the study
in hand, included GDP of Pakistan, GDP of trading partners of Pakistan, population
of Pakistan, population of trading partners of Pakistan and the distance of Pakistan
with its trading partners. Variables of inflation rates and per capita income were
dropped from the model due to multicollinearity problem. Dummy variables of
border and cultural similarities were also used in the gravity model. In the model,
data about ten major trading partners were used. Total volume of bilateral trade of
Pakistan with trading partners was used as a dependent variable in the panel data
set for estimation of the gravity model of trade.
4.4.1 Bilateral Trade between Pakistan and United Arab Emirates
To determine the impacts of different variables on bilateral agricultural trade of
Pakistan with United Arab Emirates, as a major trading partner, total volume of
bilateral trade was used as a proxy in the gravity model. Panel data of bilateral trade
was taken in US$ million for the time duration 1975 – 2012. Time series data of
bilateral trade of Pakistan with United Arab Emirate is shown in Figure 4.11.
Bilateral trade data of Pakistan with its other major trading partners is given in
appendix 4.
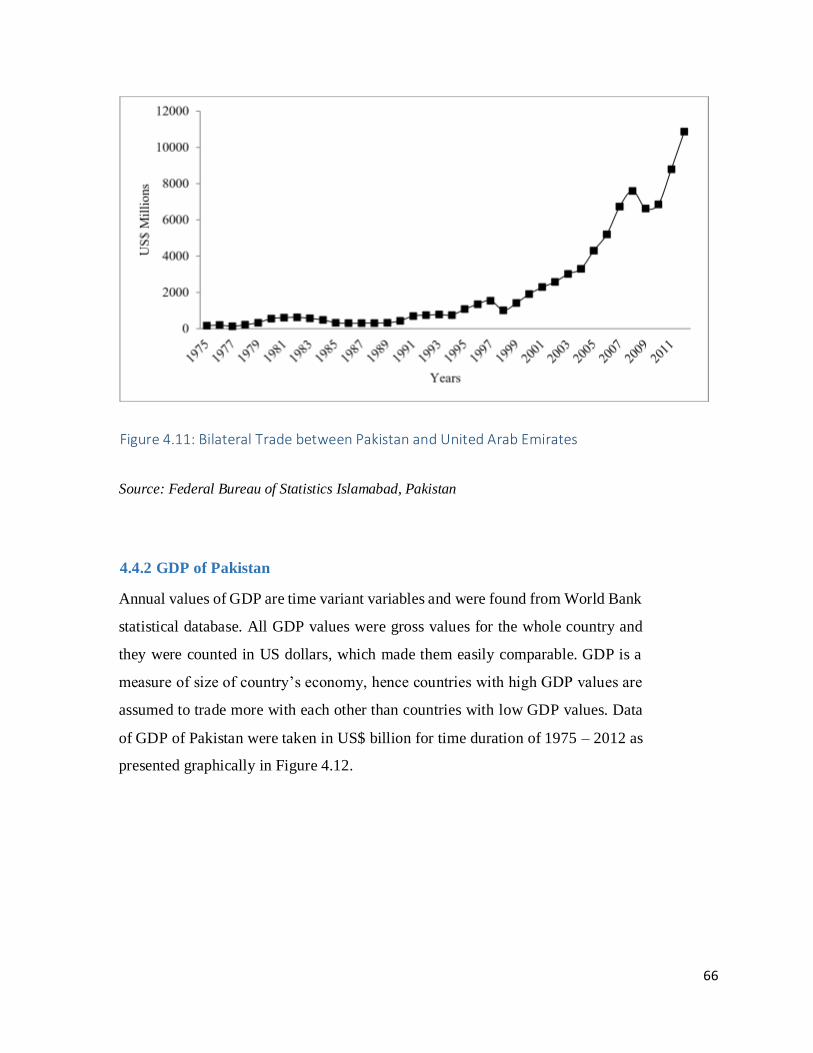
66
Figure 4.11: Bilateral Trade between Pakistan and United Arab Emirates
Source: Federal Bureau of Statistics Islamabad, Pakistan
4.4.2 GDP of Pakistan
Annual values of GDP are time variant variables and were found from World Bank
statistical database. All GDP values were gross values for the whole country and
they were counted in US dollars, which made them easily comparable. GDP is a
measure of size of country’s economy, hence countries with high GDP values are
assumed to trade more with each other than countries with low GDP values. Data
of GDP of Pakistan were taken in US$ billion for time duration of 1975 – 2012 as
presented graphically in Figure 4.12.
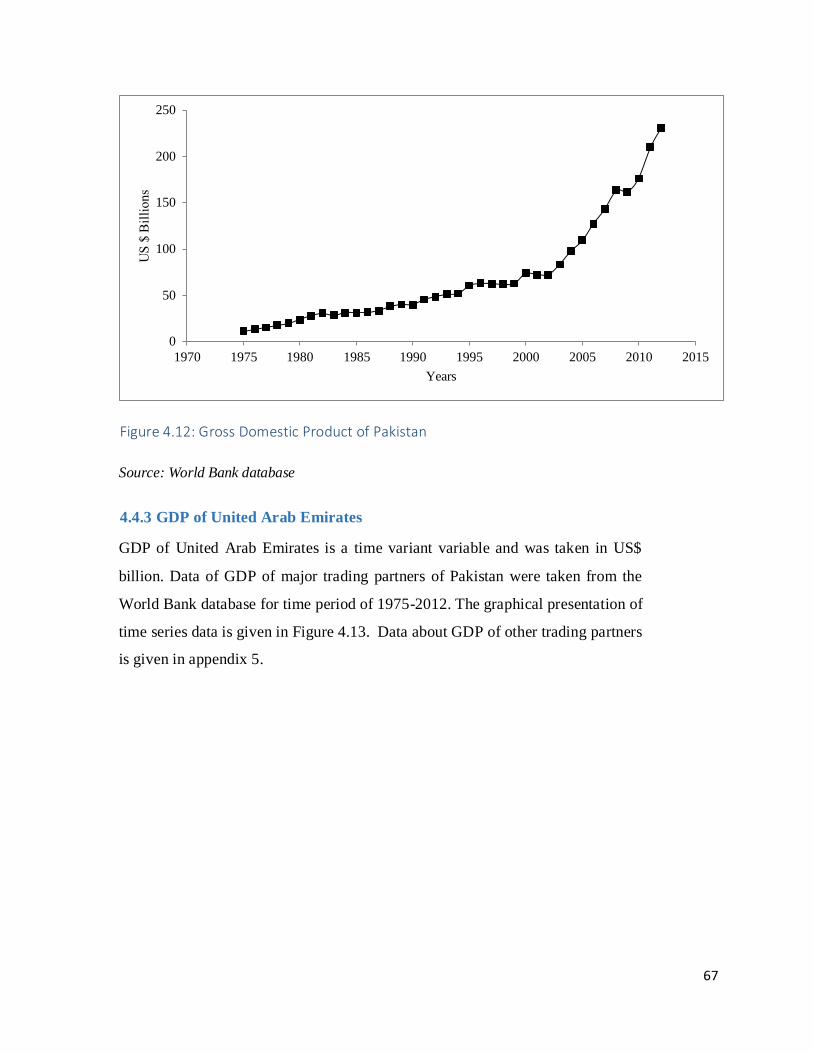
67
Figure 4.12: Gross Domestic Product of Pakistan
Source: World Bank database
4.4.3 GDP of United Arab Emirates
GDP of United Arab Emirates is a time variant variable and was taken in US$
billion. Data of GDP of major trading partners of Pakistan were taken from the
World Bank database for time period of 1975-2012. The graphical presentation of
time series data is given in Figure 4.13. Data about GDP of other trading partners
is given in appendix 5.
0
50
100
150
200
250
1970 1975 1980 1985 1990 1995 2000 2005 2010 2015
Years
68
Figure 4.13: Gross Domestic Product of United Arab Emirates
Source: The World Bank
4.4.4 Population of Pakistan
Data of about Population of Pakistan were taken from the World Bank. Population
is another time variant variable that should be positively correlated with trade as
larger markets should develop larger trade flows with each other. On the other
hand, a large economy is able to produce a wider variety of goods, so in a simplistic
world, such a nation should have less need for foreign imports. The graphical
presentation of time series data for duration of 19752012 is presented in Figure
4.14.
0
50
100
150
200
250
300
350
400
1970 1975 1980 1985 1990 1995 2000 2005 2010 2015
Years
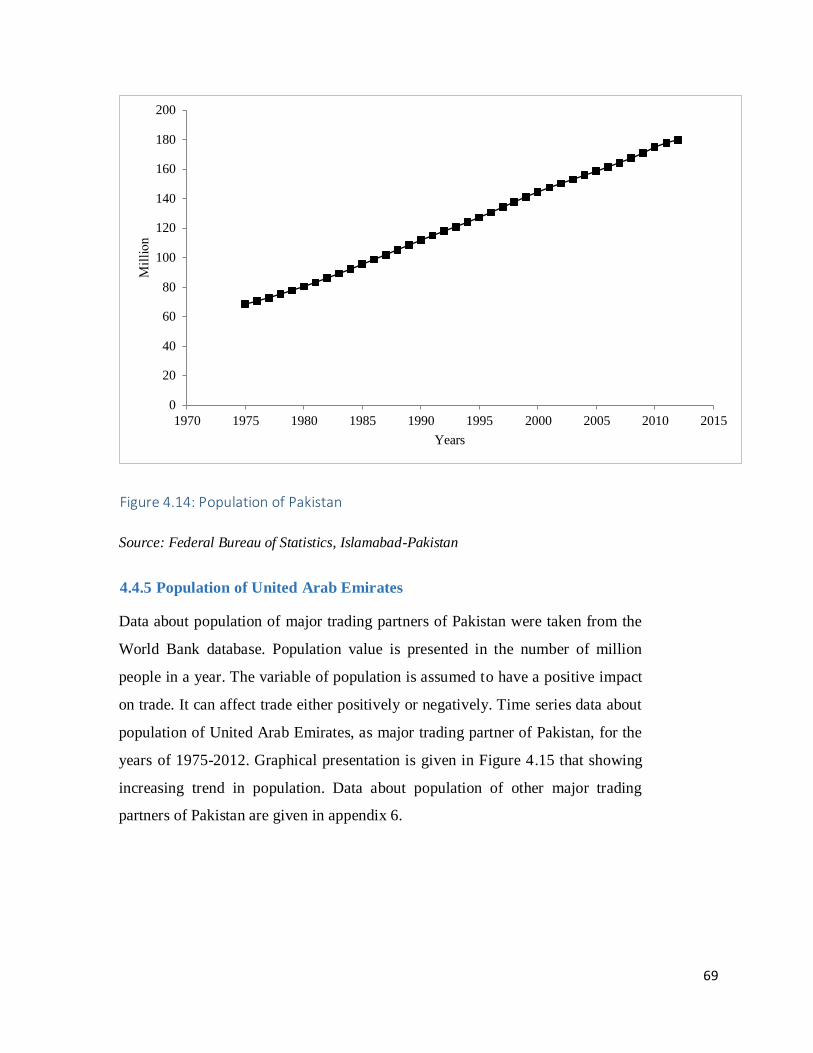
69
Figure 4.14: Population of Pakistan
Source: Federal Bureau of Statistics, Islamabad-Pakistan
4.4.5 Population of United Arab Emirates
Data about population of major trading partners of Pakistan were taken from the
World Bank database. Population value is presented in the number of million
people in a year. The variable of population is assumed to have a positive impact
on trade. It can affect trade either positively or negatively. Time series data about
population of United Arab Emirates, as major trading partner of Pakistan, for the
years of 1975-2012. Graphical presentation is given in Figure 4.15 that showing
increasing trend in population. Data about population of other major trading
partners of Pakistan are given in appendix 6.
0
20
40
60
80
100
120
140
160
180
200
1970 1975 1980 1985 1990 1995 2000 2005 2010 2015
Years
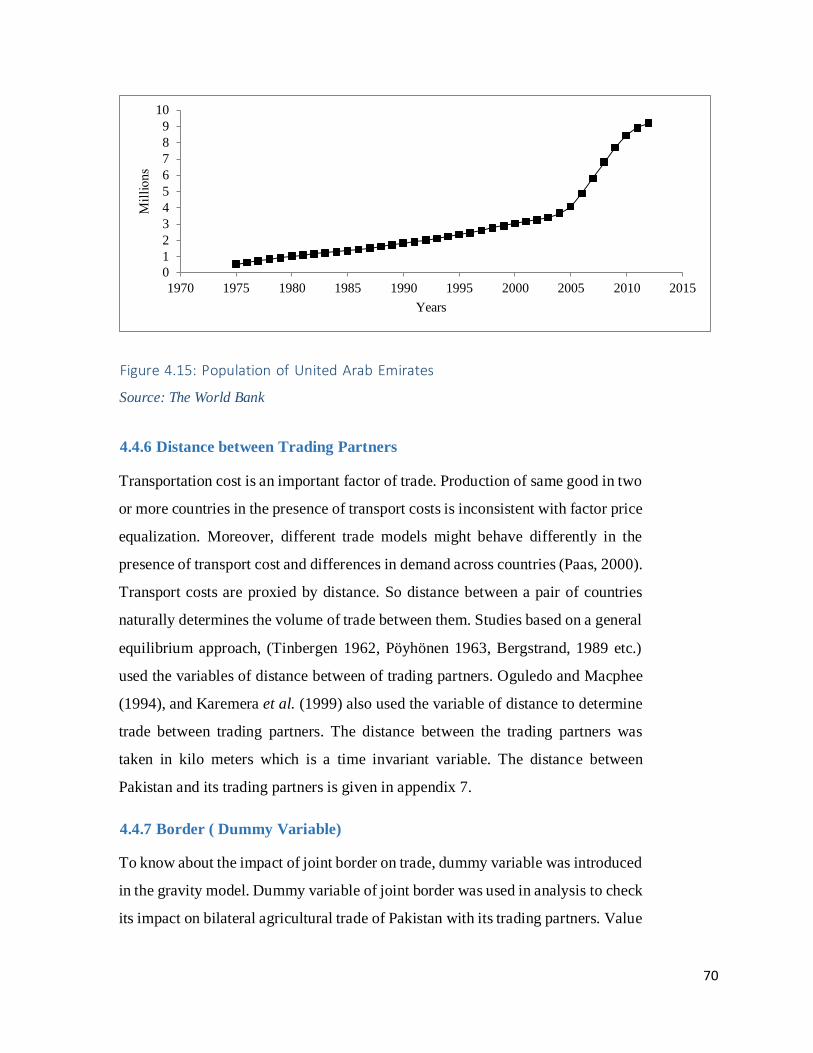
70
Figure 4.15: Population of United Arab Emirates
Source: The World Bank
4.4.6 Distance between Trading Partners
Transportation cost is an important factor of trade. Production of same good in two
or more countries in the presence of transport costs is inconsistent with factor price
equalization. Moreover, different trade models might behave differently in the
presence of transport cost and differences in demand across countries (Paas, 2000).
Transport costs are proxied by distance. So distance between a pair of countries
naturally determines the volume of trade between them. Studies based on a general
equilibrium approach, (Tinbergen 1962, Pöyhönen 1963, Bergstrand, 1989 etc.)
used the variables of distance between of trading partners. Oguledo and Macphee
(1994), and Karemera et al. (1999) also used the variable of distance to determine
trade between trading partners. The distance between the trading partners was
taken in kilo meters which is a time invariant variable. The distance between
Pakistan and its trading partners is given in appendix 7.
4.4.7 Border ( Dummy Variable)
To know about the impact of joint border on trade, dummy variable was introduced
in the gravity model. Dummy variable of joint border was used in analysis to check
its impact on bilateral agricultural trade of Pakistan with its trading partners. Value
0 1 2 3 4 5 6 7 8 9
10
1970 1975 1980 1985 1990 1995 2000 2005 2010 2015
Years
71
of dummy variables are 0 and one, zero for the trading partners that have no joint
border and the value of one for those trading partners which have the joint border.
Joint border assumed to have a positive impact on bilateral trade between two
trading partners. Consequently the dummy variable of same border was used for
determining its impact on agricultural trade between Pakistan and its main trading
partners including United Arab Emirates.
4.4.8 Culture Similarities ( Dummy Variable)
A dummy variable of cultural similarities in trading partners was used in the
analysis. Some trading partners of Pakistan are Muslim countries and other has the
same traditions like Pakistan. Muslim countries have some common traditions and
the country like India have same culture as Pakistan because Pakistan and India
were together before 1947, and most of the traditions are common in both
countries. The value of dummy variable was taken one for those trading partners
which have same culture as in Pakistan and the value of zero was taken for those
trading partners which have entirely different culture as compared to Pakistani
culture. The trading partners with similar cultures assumed to have a positive
impact on bilateral trade.
4.5 Stationarity Tests
Panel data about different variables were used in the study under consideration for
duration of 1975-2012. Existence of a common trend between any two data series
does not always imply that there is a meaningful economic relationship between
them. If the series are not stationary (i.e. their means, variance and auto-
covariances are not independent of time), the regressions involving these series can
falsely imply the existence of a relationship. This is called as spurious regression
by Granger and Newbold (1974). Ignoring this fact and estimating a regression
model containing non-stationary variables might lead to wrong results. To check
the existence of unit root in panel data different tests were used. These tests for unit
root of panel data are Levin Lin & Chu, I P Shin W-stat, ADF - Fisher Chi-square
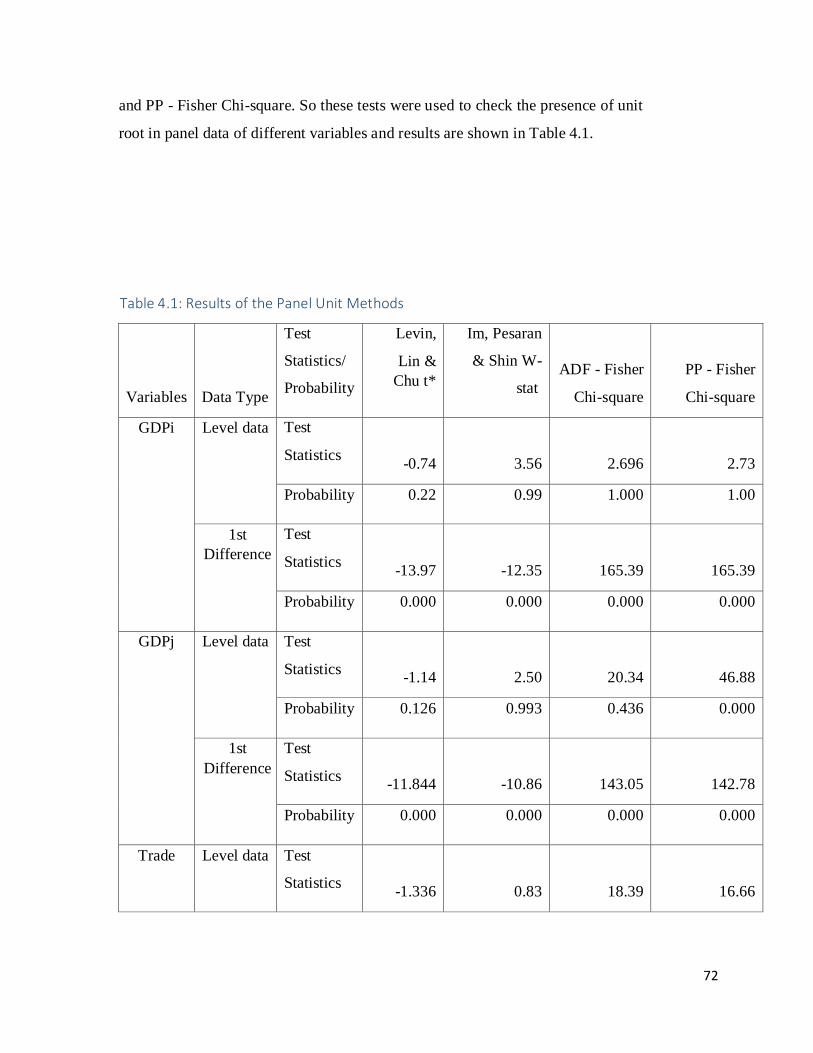
72
and PP - Fisher Chi-square. So these tests were used to check the presence of unit
root in panel data of different variables and results are shown in Table 4.1.
Table 4.1: Results of the Panel Unit Methods
Variables Data Type
Test
Statistics/
Probability
Levin,
Lin &
Chu t*
Im, Pesaran
& Shin W-
stat
ADF - Fisher
Chi-square
PP - Fisher
Chi-square
GDPi Level data Test
Statistics -0.74 3.56 2.696 2.73
Probability 0.22 0.99 1.000 1.00
1st
Difference
Test
Statistics -13.97 -12.35 165.39 165.39
Probability 0.000 0.000 0.000 0.000
GDPj Level data Test
Statistics -1.14 2.50 20.34 46.88
Probability 0.126 0.993 0.436 0.000
1st
Difference
Test
Statistics -11.844 -10.86 143.05 142.78
Probability 0.000 0.000 0.000 0.000
Trade Level data Test
Statistics -1.336 0.83 18.39 16.66
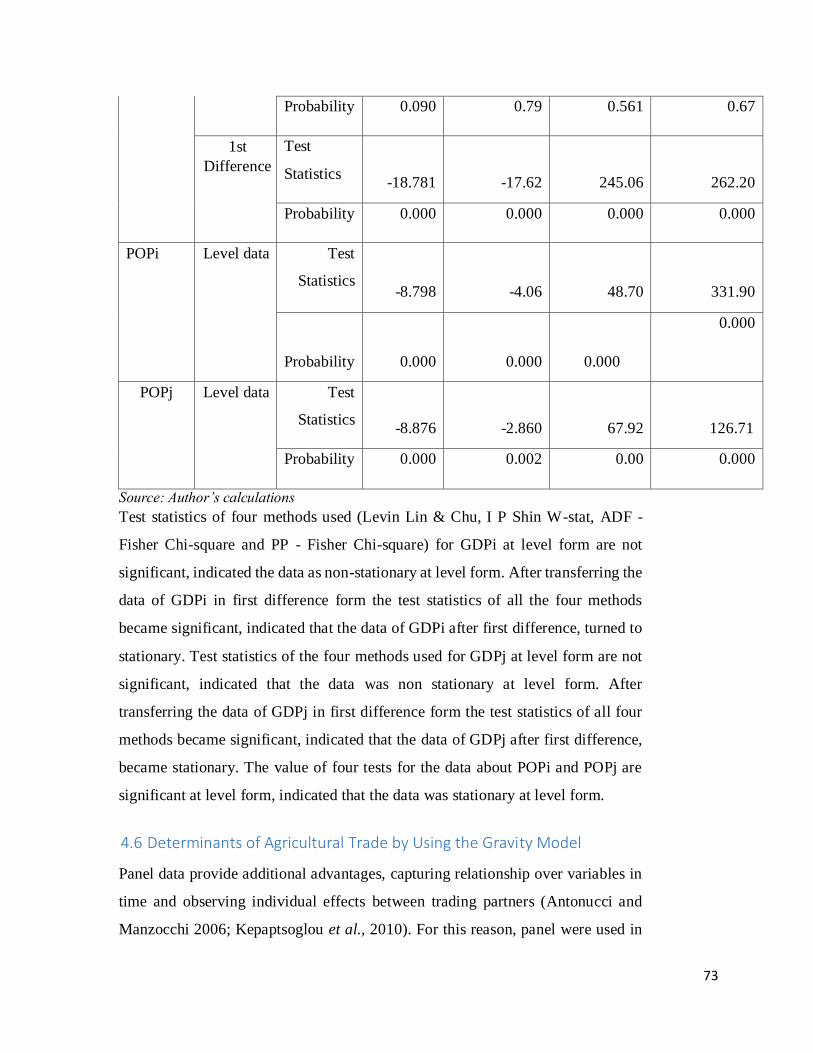
73
Probability 0.090 0.79 0.561 0.67
1st
Difference
Test
Statistics -18.781 -17.62 245.06 262.20
Probability 0.000 0.000 0.000 0.000
POPi Level data Test
Statistics -8.798 -4.06 48.70 331.90
Probability 0.000 0.000 0.000
0.000
POPj Level data Test
Statistics -8.876 -2.860 67.92 126.71
Probability 0.000 0.002 0.00 0.000
Source: Author’s calculations
Test statistics of four methods used (Levin Lin & Chu, I P Shin W-stat, ADF -
Fisher Chi-square and PP - Fisher Chi-square) for GDPi at level form are not
significant, indicated the data as non-stationary at level form. After transferring the
data of GDPi in first difference form the test statistics of all the four methods
became significant, indicated that the data of GDPi after first difference, turned to
stationary. Test statistics of the four methods used for GDPj at level form are not
significant, indicated that the data was non stationary at level form. After
transferring the data of GDPj in first difference form the test statistics of all four
methods became significant, indicated that the data of GDPj after first difference,
became stationary. The value of four tests for the data about POPi and POPj are
significant at level form, indicated that the data was stationary at level form.
4.6 Determinants of Agricultural Trade by Using the Gravity Model
Panel data provide additional advantages, capturing relationship over variables in
time and observing individual effects between trading partners (Antonucci and
Manzocchi 2006; Kepaptsoglou et al., 2010). For this reason, panel were used in
74
the current study. According to Egger (2000), random effects model (REM) would
be more appropriate when estimating trade flows between randomly drawn
samples of trading partners from a larger population. While, fixed effects model
(FEM) would be a better choice than REM when one is interested in estimating
trade flows between a predetermined selections of nations. Since the sample
includes trade exchanges between Pakistan and its trading partners, FEM might be
the most appropriate estimation.
The problem faced by FEM was that it cannot directly estimate variables, which
do not change over time, such as distance, common language, contiguous and
colonial link, because the inherent transformation tends to wipe out such variables
(Zarzoso, 2003). By using panel data set, the researcher estimated gravity model
with all three methods. The current analysis of gravity model was carried out by
following Rahman (2003) and Suvankulov and Ali (2012). There were many
variables that could affect trade but it was necessary to quantify the effect of those
variables, which had direct and indirect effect on bilateral trade. In that context, an
effort was made to quantify impact of major determinants on trade of Pakistan with
United Arab Emirates as a major trading partner. For this purpose; secondary panel
data were collected about the variables of Pakistani bilateral trade, GDP of
Pakistan, GDP of trading partners, Population of Pakistan, Population of major
trading partners and distance between Pakistan and its major trading partners.
Although in social science it was impossible to capture the effect of all possible
independent variables, yet an effort was made to estimate all related major
determinants of trade from Pakistan to United Arab Emirates as a major trading
partner.
Gravity model of trade in Double log form with 1st differences was used to find
the impact of various factors on trade between Pakistan and United Arab Emirates.
Panel data of variables were taken for the duration of 1975 to 2012, and were used
for analyzing the impact of these variables on trade. Two dummy variables were
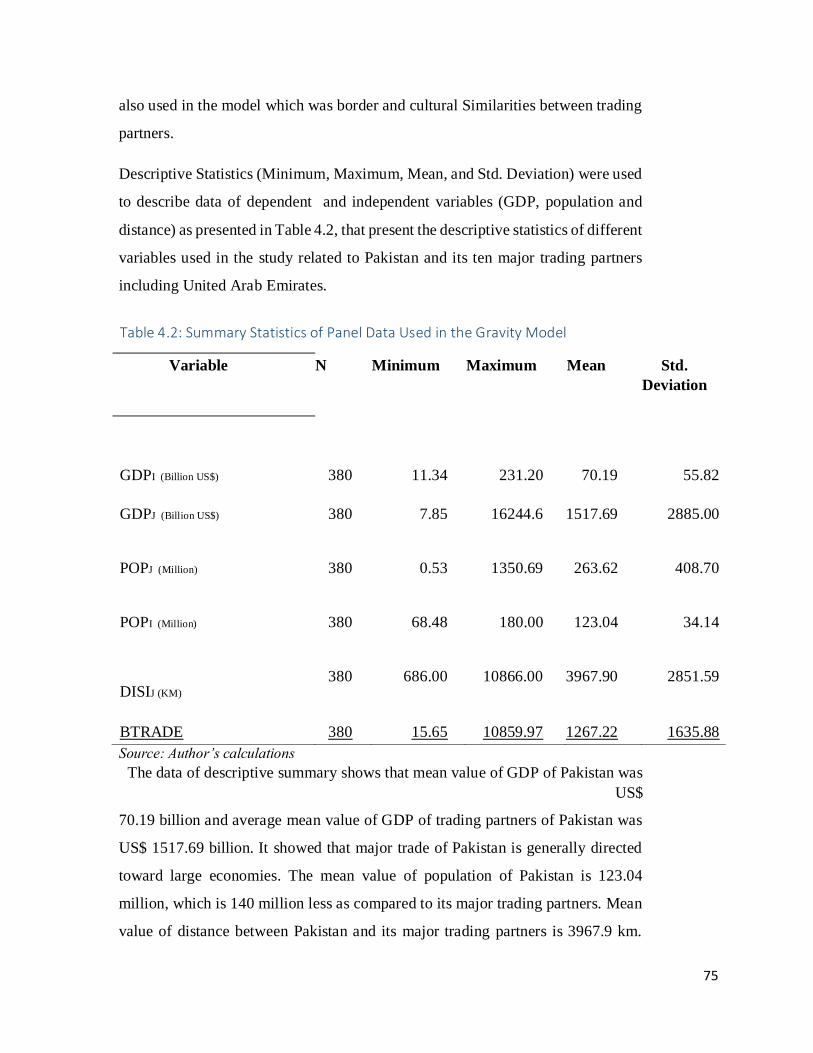
75
also used in the model which was border and cultural Similarities between trading
partners.
Descriptive Statistics (Minimum, Maximum, Mean, and Std. Deviation) were used
to describe data of dependent and independent variables (GDP, population and
distance) as presented in Table 4.2, that present the descriptive statistics of different
variables used in the study related to Pakistan and its ten major trading partners
including United Arab Emirates.
Table 4.2: Summary Statistics of Panel Data Used in the Gravity Model
Variable N Minimum Maximum Mean Std.
Deviation
GDPI (Billion US$) 380 11.34 231.20 70.19 55.82
GDPJ (Billion US$) 380 7.85 16244.6 1517.69 2885.00
POPJ (Million) 380 0.53 1350.69 263.62 408.70
POPI (Million) 380 68.48 180.00 123.04 34.14
DISIJ (KM) 380 686.00 10866.00 3967.90 2851.59
BTRADE 380 15.65 10859.97 1267.22 1635.88
Source: Author’s calculations
The data of descriptive summary shows that mean value of GDP of Pakistan was
US$
70.19 billion and average mean value of GDP of trading partners of Pakistan was
US$ 1517.69 billion. It showed that major trade of Pakistan is generally directed
toward large economies. The mean value of population of Pakistan is 123.04
million, which is 140 million less as compared to its major trading partners. Mean
value of distance between Pakistan and its major trading partners is 3967.9 km.
76
The nearest trading partner is situated 686 km away from Pakistan and maximum
distance of trading partner is 10866 km.
4.7 Selection of Model
The researcher have paid particular attention to the fact that gravity model not only
contain time varying variables such as GDPs and population but also includes time
invariant variables namely distance, border and culture similarities. Fixed effects
model does not allow for estimating time invariant variables (Rahman, 2003).
However, Pooled OLS and random effects treatment does allow the model to
contain observed time invariant characteristics.
Hausman specification test was used to check whether fixed effect or random effect
model was appropriate. F-test was used to choose the best model between fixed
effects or Pooled OLS. Breusch-Pagan LM test was used for selection of
appropriate model between Pooled OLS and random effect model. To choose FEM
or REM, Hausman test was used, having an asymptotic chi-square distribution.
H = 61.412759
P-value = prob (chi-square(4) >61.412759) = 0.0000
Small p-value, by Hausman test showed that coefficient estimated by random
effects model and fixed effects model were not same. The significant P-value was
in favor of fixed effects. When fixed effect model was found appropriate, after that
F-test was applied to know whether the fixed effects model was still appropriate
than Pooled OLS. The F-test had the values of required parameters. i.e.
Where, N= 10, T= 380, K=8, R2FEM=0.903, R2
Pooled OLS=0.797
By putting the values in equation 3.11, the value of F-test was found as 43.95.
Highly significant value of F test counts against the null hypothesis that Pooled
OLS model was adequate, in favor of the fixed effects alternative.
After application of F-test and Hausman specification test, FEM was appropriate
instead of pooled OLS and Random effects model for time variant variables. For
time invariant variables one could use both Pooled OLS and random effect model
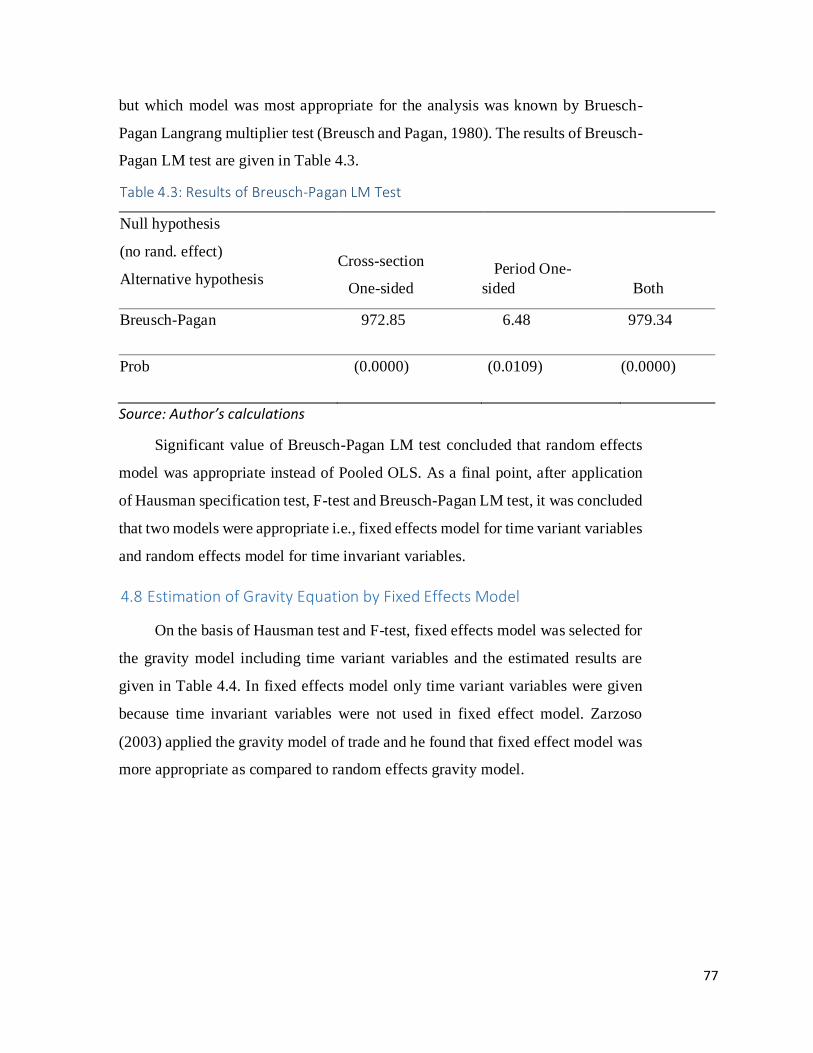
77
but which model was most appropriate for the analysis was known by Bruesch-
Pagan Langrang multiplier test (Breusch and Pagan, 1980). The results of Breusch-
Pagan LM test are given in Table 4.3.
Table 4.3: Results of Breusch-Pagan LM Test
Null hypothesis
(no rand. effect)
Alternative hypothesis
Cross-section
One-sided
Period One-
sided Both
Breusch-Pagan 972.85 6.48 979.34
Prob (0.0000) (0.0109) (0.0000)
Source: Author’s calculations
Significant value of Breusch-Pagan LM test concluded that random effects
model was appropriate instead of Pooled OLS. As a final point, after application
of Hausman specification test, F-test and Breusch-Pagan LM test, it was concluded
that two models were appropriate i.e., fixed effects model for time variant variables
and random effects model for time invariant variables.
4.8 Estimation of Gravity Equation by Fixed Effects Model
On the basis of Hausman test and F-test, fixed effects model was selected for
the gravity model including time variant variables and the estimated results are
given in Table 4.4. In fixed effects model only time variant variables were given
because time invariant variables were not used in fixed effect model. Zarzoso
(2003) applied the gravity model of trade and he found that fixed effect model was
more appropriate as compared to random effects gravity model.
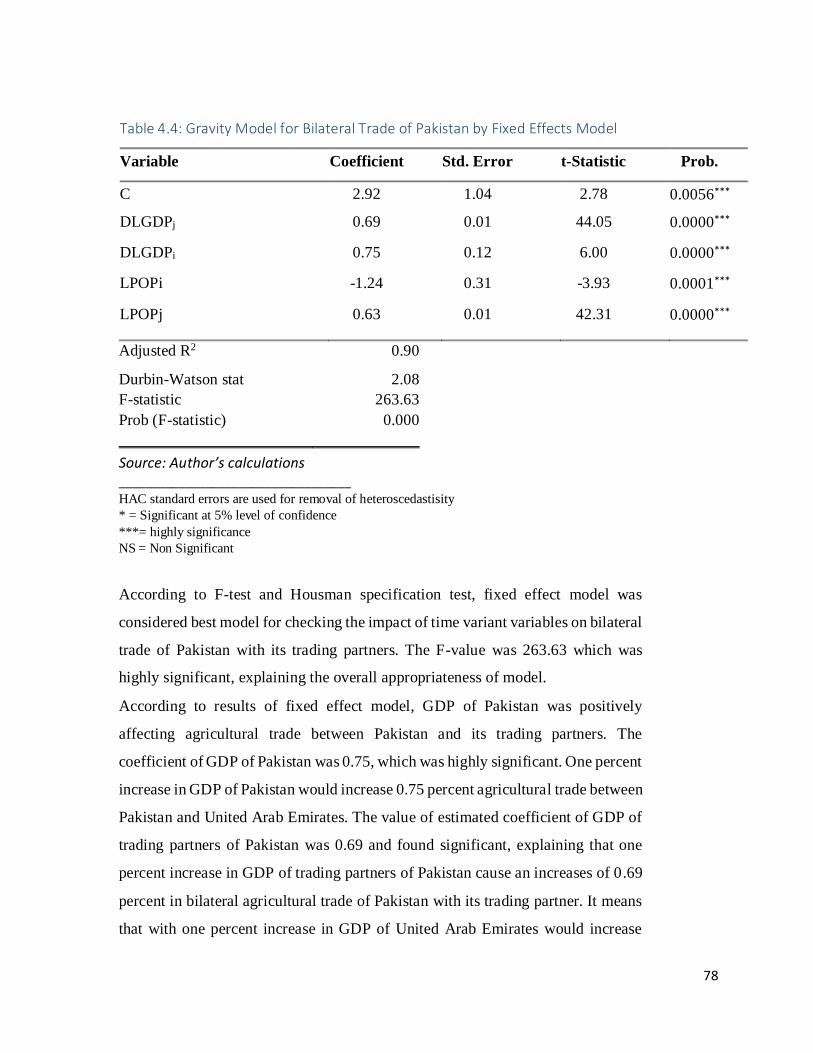
78
Table 4.4: Gravity Model for Bilateral Trade of Pakistan by Fixed Effects Model
Variable Coefficient Std. Error t-Statistic Prob.
C 2.92 1.04 2.78 0.0056***
DLGDPj 0.69 0.01 44.05 0.0000***
DLGDPi 0.75 0.12 6.00 0.0000***
LPOPi -1.24 0.31 -3.93 0.0001***
LPOPj 0.63 0.01 42.31 0.0000***
Adjusted R2 0.90
Durbin-Watson stat 2.08
F-statistic 263.63
Prob (F-statistic) 0.000
Source: Author’s calculations ___________________________________ HAC standard errors are used for removal of heteroscedastisity * = Significant at 5% level of confidence ***= highly significance NS = Non Significant
According to F-test and Housman specification test, fixed effect model was
considered best model for checking the impact of time variant variables on bilateral
trade of Pakistan with its trading partners. The F-value was 263.63 which was
highly significant, explaining the overall appropriateness of model.
According to results of fixed effect model, GDP of Pakistan was positively
affecting agricultural trade between Pakistan and its trading partners. The
coefficient of GDP of Pakistan was 0.75, which was highly significant. One percent
increase in GDP of Pakistan would increase 0.75 percent agricultural trade between
Pakistan and United Arab Emirates. The value of estimated coefficient of GDP of
trading partners of Pakistan was 0.69 and found significant, explaining that one
percent increase in GDP of trading partners of Pakistan cause an increases of 0.69
percent in bilateral agricultural trade of Pakistan with its trading partner. It means
that with one percent increase in GDP of United Arab Emirates would increase
79
0.69 percent in agricultural trade of Pakistan with United Arab Emirates.
According to Mohmand and Wang (2013) the coefficient of GDP in the gravity
model of agricultural trade was also positive and highly significant, which implies
more trade of Pakistan with larger economies.
Khan and Saqib (1993) also concluded positive and significant relationship
between GDP and exports. Afzal (2004) concluded that Export contribution to
GDP growth was positive and significant. Zarzoso (2003) found that the income of
exporters and the importers had a positive impact on bilateral trade. Roy and
Rayhan (2012) concluded that estimated coefficients on the levels of GDPs had
shown highly significant at 1 percent level with expected sign. Fixed effect model
was significant and estimated results concluded that with 1% increase of GDP,
import demand of Bangladesh increased by 0.95% and export supply of trading
partners increased by 1.61%. According to Iqbal (2014), GDP of Bangladesh was
positively correlated with trade but GDP of European Union and bilateral real
exchange rate had a negative impact on trade.
Population of Pakistan was negatively affecting agricultural trade of Pakistan with
its trading partners. The estimated value of coefficient of population of Pakistan
was -1.24 by fixed effect model, which was highly significant and it indicated that
one percent increase in population of Pakistan would decrease 1.24 percent
agricultural trade of Pakistan with United Arab Emirates. Zarzoso (2003) found
that the Population of exporting country had negative impact on exports showing
a positive absorption effect, while population of importer had a positive effect on
exports, indicating that bigger economies import more than small economies. The
population of Pakistan carried negative sign. It implies that population variable had
trade inhibiting affect. It implies that a larger population size may be treated as
large resource endowments and thus an indication of self-sufficiency and thereby
less reliance on international trade. Lubinga and Kiiza (2013) found a negative
impact of population of trading partners on bilateral trade flow.
Population of trading partners of Pakistan positively affected agricultural trade of
Pakistan with its major trading partners. This impact was highly significant and
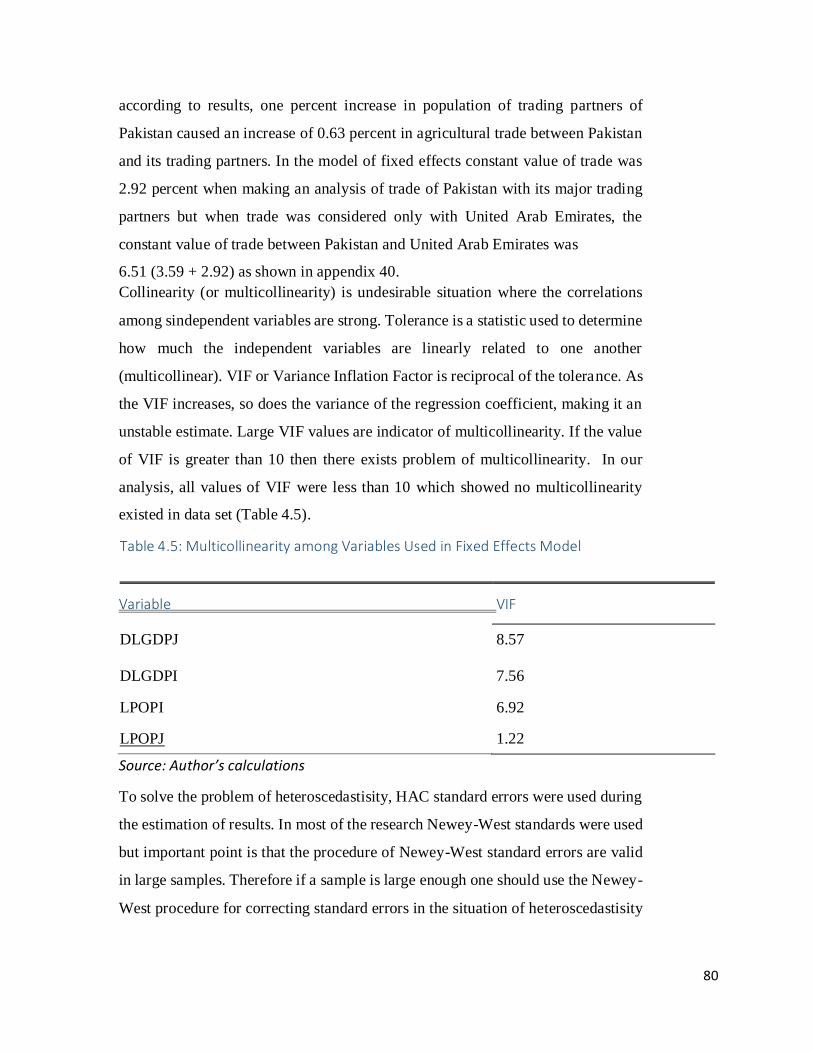
80
according to results, one percent increase in population of trading partners of
Pakistan caused an increase of 0.63 percent in agricultural trade between Pakistan
and its trading partners. In the model of fixed effects constant value of trade was
2.92 percent when making an analysis of trade of Pakistan with its major trading
partners but when trade was considered only with United Arab Emirates, the
constant value of trade between Pakistan and United Arab Emirates was
6.51 (3.59 + 2.92) as shown in appendix 40.
Collinearity (or multicollinearity) is undesirable situation where the correlations
among sindependent variables are strong. Tolerance is a statistic used to determine
how much the independent variables are linearly related to one another
(multicollinear). VIF or Variance Inflation Factor is reciprocal of the tolerance. As
the VIF increases, so does the variance of the regression coefficient, making it an
unstable estimate. Large VIF values are indicator of multicollinearity. If the value
of VIF is greater than 10 then there exists problem of multicollinearity. In our
analysis, all values of VIF were less than 10 which showed no multicollinearity
existed in data set (Table 4.5).
Table 4.5: Multicollinearity among Variables Used in Fixed Effects Model
Variable VIF
DLGDPJ 8.57
DLGDPI 7.56
LPOPI 6.92
LPOPJ 1.22
Source: Author’s calculations
To solve the problem of heteroscedastisity, HAC standard errors were used during
the estimation of results. In most of the research Newey-West standards were used
but important point is that the procedure of Newey-West standard errors are valid
in large samples. Therefore if a sample is large enough one should use the Newey-
West procedure for correcting standard errors in the situation of heteroscedastisity
81
and also in case of autocorrelation. So the HAC method can handle both, unlike
White method, which was designed specifically for heteroscedasticity. By doing
so the problem of hetreroscedastisity was removed and there is no need to worry
about the heteroscedastisity in estimated model by fixed effects.
Autocorrelation was analyzed by the value of Durban Watson test for the estimated
model. The value close to 2 was the sign of no autocorrelation in the model. If the
value be less than two, means positive autocorrelation and the value more than 2
indicates the negative autocorrelation in the model. So by the value given in the
model of fixed effect shows that there was no problem of autocorrelation in the
estimated model.
F test and Hausman specification tests were in favor of fixed effect model that’s
why
this model was considered best for time variant variables. For the time invariant
variables by using the Breusch-Pagan LM test, the random effects model was
considered best to analyze the impact of all variables under consideration on trade
between Pakistan and United Arab Emirates.
4.9 Estimation of Gravity Equation by Random Effects Model
Particular attention was given to the fact that gravity model not only contain
time varying variables such as GDPs and population but also time invariant
variables namely distance, culture and border. FEM does not allow for estimating
time invariant variables (Rahman, 2003). However, the random effects treatment
does allow the model to contain observed time invariant characteristics (Greene,
1997). Roy and Rayhan (2012) had used random effect model to estimate the
impact of time invariant variables in panel data analysis by using gravity model.
Multicolinearity in random effect model is shown by the value of VIF in Table 4.
6.
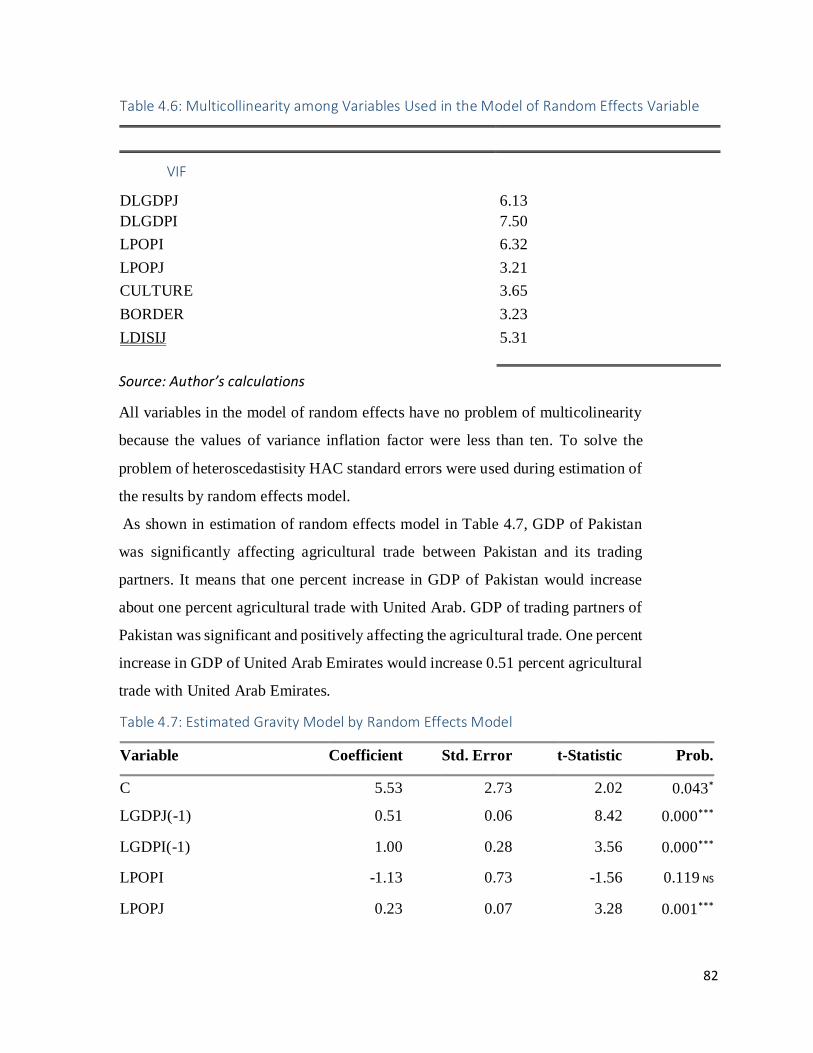
82
Table 4.6: Multicollinearity among Variables Used in the Model of Random Effects Variable
VIF
DLGDPJ 6.13
DLGDPI 7.50
LPOPI 6.32
LPOPJ 3.21
CULTURE 3.65
BORDER 3.23
LDISIJ 5.31
Source: Author’s calculations
All variables in the model of random effects have no problem of multicolinearity
because the values of variance inflation factor were less than ten. To solve the
problem of heteroscedastisity HAC standard errors were used during estimation of
the results by random effects model.
As shown in estimation of random effects model in Table 4.7, GDP of Pakistan
was significantly affecting agricultural trade between Pakistan and its trading
partners. It means that one percent increase in GDP of Pakistan would increase
about one percent agricultural trade with United Arab. GDP of trading partners of
Pakistan was significant and positively affecting the agricultural trade. One percent
increase in GDP of United Arab Emirates would increase 0.51 percent agricultural
trade with United Arab Emirates.
Table 4.7: Estimated Gravity Model by Random Effects Model
Variable Coefficient Std. Error t-Statistic Prob.
C 5.53 2.73 2.02 0.043*
LGDPJ(-1) 0.51 0.06 8.42 0.000***
LGDPI(-1) 1.00 0.28 3.56 0.000***
LPOPI -1.13 0.73 -1.56 0.119 NS
LPOPJ 0.23 0.07 3.28 0.001***
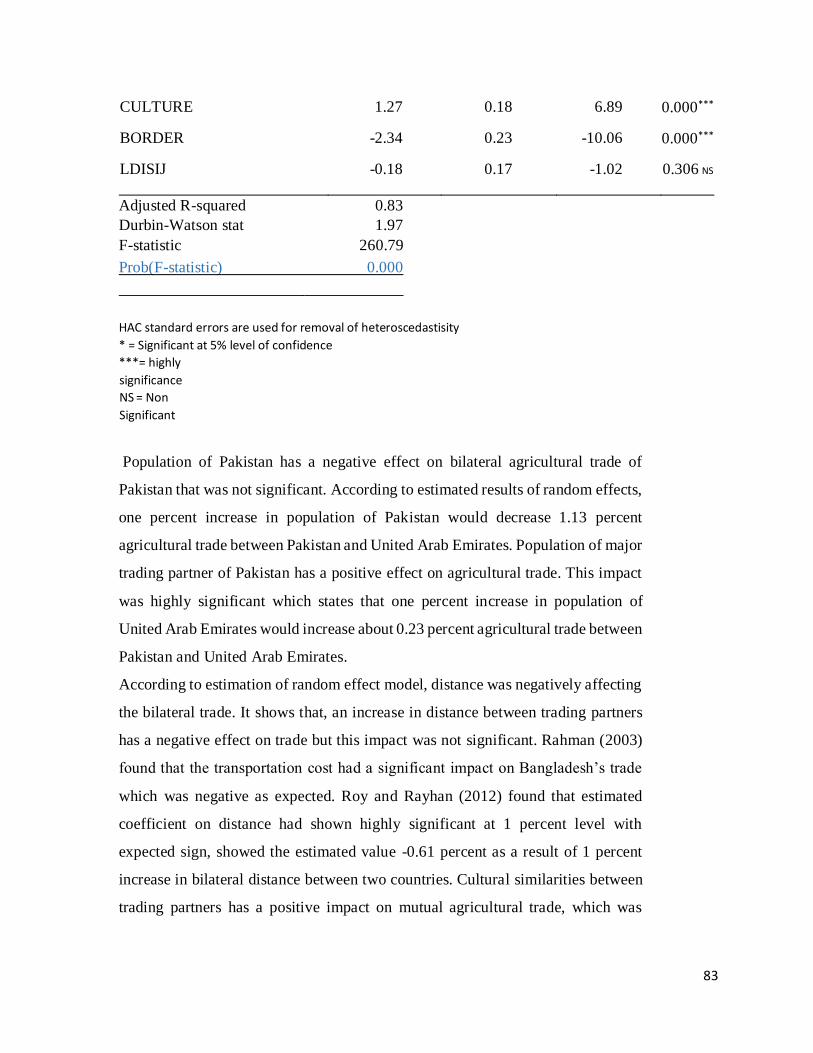
83
CULTURE 1.27 0.18 6.89 0.000***
BORDER -2.34 0.23 -10.06 0.000***
LDISIJ -0.18 0.17 -1.02 0.306 NS
Adjusted R-squared 0.83
Durbin-Watson stat 1.97
F-statistic 260.79
Prob(F-statistic) 0.000
HAC standard errors are used for removal of heteroscedastisity * = Significant at 5% level of confidence ***= highly
significance
NS = Non
Significant
Population of Pakistan has a negative effect on bilateral agricultural trade of
Pakistan that was not significant. According to estimated results of random effects,
one percent increase in population of Pakistan would decrease 1.13 percent
agricultural trade between Pakistan and United Arab Emirates. Population of major
trading partner of Pakistan has a positive effect on agricultural trade. This impact
was highly significant which states that one percent increase in population of
United Arab Emirates would increase about 0.23 percent agricultural trade between
Pakistan and United Arab Emirates.
According to estimation of random effect model, distance was negatively affecting
the bilateral trade. It shows that, an increase in distance between trading partners
has a negative effect on trade but this impact was not significant. Rahman (2003)
found that the transportation cost had a significant impact on Bangladesh’s trade
which was negative as expected. Roy and Rayhan (2012) found that estimated
coefficient on distance had shown highly significant at 1 percent level with
expected sign, showed the estimated value -0.61 percent as a result of 1 percent
increase in bilateral distance between two countries. Cultural similarities between
trading partners has a positive impact on mutual agricultural trade, which was
84
highly significant relationship. The similar culture of Pakistan with its major
trading partners have 1.27 percent more trade as compared to trading partners
which have no cultural similarities with Pakistan.
Joint border was assumed to have a positive impact on bilateral trade but in case of
Pakistan it was negative, with the fact that Pakistan have not good relations with
the countries which have joint border with Pakistan, so that the impact was negative
and highly significant as shown by the estimation of random effect model. The
joint border countries of Pakistan have 2.3 percent less trade as compared to the
countries which has no joint border. Mohmand and Wang (2013) used the gravity
model and according to his results, the nonsignificance value of the common border
variable was showing less trade between the nations of close proximity to Pakistan,
like India, Iran, and Bangladesh etc. Pakistan needs to build decent relationship
with its neighbors to gain maximum benefits by trade, being a neighbor. So it was
concluded that if United Arab Emirates has the joint border with Pakistan, There
was threat to trade flow between these trading partners.
According to random effects model, constant value of trade with its major top ten
trading partners was 5.53 percent. But considering the trade of Pakistan with
United Arab Emirates, the constant value becomes 6.15 percent of trade value as
shown in appendix 41. When considering estimates of time invariant variables
there may be two models for analysis. One was random effects and second was
Pooled OLS model. According to Breusch and Pagan Lagrange Multiplier test for
model specification, Random effect model was selected as a best model against the
Pooled OLS model for the analysis by considering time invariant variables in the
model.
4.10 Consistency of Results with Prior expectations
According to results of fixed effect model, GDP of Pakistan was positively
affecting agricultural trade between Pakistan and its trading partners that was
consistent with the prior expectations. The value of estimated coefficient of GDP
of trading partners of Pakistan was found significant and consistent with prior
expectations. Population of Pakistan was negatively affecting agricultural trade of
85
Pakistan with its trading partners. The estimated value of coefficient of population
of Pakistan was -1.24 by fixed effect model, which was highly significant and
consistent with the prior expectations. The population of Pakistan carried negative
sign. It implies that population variable had trade inhibiting affect. It implies that a
larger population size may be treated as large resource endowments and thus an
indication of self-sufficiency and thereby less reliance on international trade.
Population of trading partners of Pakistan positively affected agricultural trade of
Pakistan with its major trading partners. This impact was highly significant and
consistent with the prior expectations. According to estimation of random effect
model, distance was negatively affecting the bilateral trade which was consistent
with the prior expectations. Cultural similarities between trading partners has a
positive impact on mutual agricultural trade, which was highly significant and
consistent with prior expectations. Joint border was assumed to have a positive
impact on bilateral trade but in case of Pakistan it was negative, with the fact that
Pakistan have not good relations with the countries which have joint border with
Pakistan, so that the impact was negative and highly significant. This result was
inconsistent with the prior expectations but was consistent with Mohmand and
Wang (2013) who used the gravity model and according to his results; the non-
significance value of the common border variable was showing less trade between
the nations of close proximity to Pakistan, like India, Iran, and Bangladesh etc.
Pakistan needs to build decent relationship with its neighbors to gain maximum
benefits by trade, being a neighbor.
86
PART 3
COMPETITIVENESS OF AGRICULTURAL PRODUCTS OF TRADE BETWEEN
PAKISTAN AND UNITED ARAB EMIRATES
Conceptually, competitiveness is defined as the ability of a country to offer
products and services that meet local and international quality standards, worth
domestic and global market prices, and provide adequate returns on the resources
used in producing them. Competitiveness can also be defined as the ability to face
and to be successful when facing competition (Latruffe, 2010). By the definition
offered by Latruffe (2010), competitiveness is the ability to sell products that meet
demand requirements (price, quality, quantity) and at the same time, ensure profits
over time. Several measures of competitiveness suggested in trade theory have
been applied in various research works carried out in Europe, Asia, USA, and
Africa. These measures are the real exchange rate and purchasing power parities
(Brinkman, 1987), revealed comparative advantage and derived indicators
(Balassa, 1965; Vollrath, 1991), The net export index (NEI) (Banterle and
Carraressi, 2007), Grubel-Lloyd measure (Banterle and Carraresi, 2007) and the
revealed symmetric comparative advantage (Nwachuku et al, 2010).
In most of the developing countries, social or economic profitability deviates from
private profitability because of distortions in factor and output markets,
externalities and government policy interventions, that tend to distort relative
prices. It is, therefore, necessary to assess the comparative advantage of the
production of major crops in Pakistan. The analysis of comparative advantage can
help in deriving meaningful policy conclusions on how to transform the farming
system towards more efficient crops activities under Global price fluctuating
situation (Mustafa and Quddus, 2012). The downward trend of real food prices for
the past 25 years came to an end when world prices started to rise in 2006 and
escalated into a surge of price inflation in 2007 and 2008. Projections suggest that
they would likely to remain relatively high in next few years, although at a lower
level (FAO, 2008). All these have profound impact on developing countries
including Pakistan under international rules and regulations. Pakistan, as a member
87
of WTO, is committed to rules and regulations that the Uruguay Round (UR)
applied to agriculture. However, eventually, whether or not a country can take
advantage of the new trading opportunities would depend upon its comparative
advantage, without subsidies or with limited subsidies that are permitted for all
trade. As agriculture is a dominant sector of Pakistan, government policies that
promote agricultural production in general or affect relative incentives within
agriculture can have substantial economy- wide effects (Krueger et al., 1988).
Agricultural trade between Pakistan and United Arab Emirates is under
consideration to make analysis to give the policy recommendations. An effort is
made by calculating the approaches of nominal protection coefficient, revealed
comparative advantage, and revealed systematic comparative advantage. Major
agricultural exports products of Pakistan to United Arab Emirates are rice, meat,
and cotton yarn while major agricultural import products are dried vegetable, milk,
and sugar. These import products are re-exports of United Arab Emirates because
these are not directly produced in United Arab Emirates. These products are
included in the analysis to make an estimation about prevailing conditions and to
make assessment about competitiveness and comparative advantages of these
agricultural products.
Mahmood (2004) analyzed comparative advantage for Pakistan’s non-agricultural
sector. Hanif and Jafri (2008) studied RCA for Pakistan textile sector, and
Mehmood et al. (2012) focused on chemicals sector. Only a few studies have
attempted to analyze actual comparative advantage for Pakistan’s agricultural
exports. For example, Akhtar et al. (2009) constructed RCA index for Pakistan’s
fruit exports. Samaratunga et al. (2007) and CARIS (2008) considered the
country’s revealed comparative advantage for a few broad categories of
agricultural products. Riaz (2009) estimated RCA indices for a fairly wide range
of agricultural products, using world market for each product as reference market.
However, to better understand the factors that limit Pakistan’s agricultural trade
potential with its individual trading partner, there was need to identify specific
markets and products where the country enjoys demonstrated comparative
88
advantage. Sharif et al. (2007) calculated export margins of kinnow for the markets
of Middle East, Far East, Europe and Russia. Quddus and Usman (2011) calculated
nominal protection coefficient (NPC) of major crops including basmati, paddy, irri,
sugarcane and cotton for the period of 2001-2005. They did not calculate nominal
protection coefficient (NPC) for a specific targeted market. Mustafa and Quddus
(2012) calculated nominal protection coefficient (NPC) of agricultural products for
a period of 2001 -2009. Khalid and Jansen (2012) analyzed revealed comparative
advantages of
Pakistan’s agricultural exports with regions of SARC, ASEAN, GCC, sub Saharan
Africa and North Africa. They calculated RCA of Dairy products, cereals,
vegetables and fruits. They also calculated RCA of these products with individual
neighbor countries. They calculated RCA for exports during 1999-2008. Akhtar et
al. (2013) calculated RCA of combined group of fruit and vegetables as a single
commodity. They used data for the duration 1990 to 2009. There was no study
made by keeping only one market for better analysis of the products exported to
that particular country.
United Arab Emirates is not an agricultural country and these products are its
reexports. United Arab Emirates is major market with a large number of middle
men. From that market the products are supplied to different markets of other
countries. The export prices in United Arab Emirates is less and import prices is
more when make a comparison with other countries of the world that’s why after
the study of comparative advantage and competitiveness with United Arab
Emirates as a trading partner we will be able to change the direction of our
agricultural exports to high valued markets and import products from that markets
or regions where the prices are low. There is need to check the competitiveness and
comparative advantage of agricultural products in existing circumstances to make
policy suggestions regarding each major export and import of agricultural
products.

89
4.11 Competitiveness of Pakistan’s Major Agricultural Exports to United Arab
Emirates
Pakistan is blessed with diverse agro-climatic conditions, which are conducive for
growing various crops around the year with one of the best irrigation systems in
the world (Akhter, 1998). Rapidly changing international trade scenario led by
WTO rules and regulations, competition in international market is getting more
intensified specially with the emergence of new foreign trade players. As Mustafa
(2003) has pointed out that, the ability of the country to maintain or expand its
world market share depends upon its ability to meet the demands of the world
trading system, not only in terms of competitive price but also quality of exportable
products and their safety standards. Being the signatory of WTO, Agreement on
Agriculture, Pakistan has to restructure its foreign trade policies. Pakistani exports
of major Agricultural products to United Arab Emirates, are basmati rice, mutton,
beef and cotton yarn. By keeping in mind the United Arab Emirates as a trading
partner the competitiveness of these export products were estimated by using the
nominal protection coefficient (NPC) approach.
4.11.1 Basmati Rice
The NPC values of basmati rice were calculated for the years of 2003-2012 to
check the competitiveness trend of Pakistani basmati rice as shown in Table 4.8.
The value close to zero shows more competitiveness while the values close to unity
shows less competitiveness. In 2003, the value of NPC was 0.57 that was less
competitive as compared to 2004 and 2005 (NPC= 0.40). Throughout time period
under consideration, basmati remained more competitive in 2007 as shown by the
value of its NPC that is 0.26. In 2008, NPC value became 0.38 which exhibited
more competitiveness in 2007 as compared to 2008. Afterwards, in 2009 NPC
value was 0.37 in 2009 and 0.36 in 2010 that was again getting competitiveness in
basmati rice but unfortunately the value of NPC in the year of 2011 became 0.89
that showed that basmati rice was losing its competitiveness. The value of NPC in
2012 was 0.91 which is showing that Pakistan have little competitiveness in
90
basmati exports. Basmati rice of Pakistan has competitiveness in international
markets whereas before a decade it had more competitiveness.
Throughout the duration under the consideration, basmati was less competitive in
2012 as shown by the value of NPC which is 0.91. It was due to the reason that
Pakistani basmati exports were suffering problems and exporters worried about
that situation when domestic prices increased but there was no increase in the
international prices of basmati, hence Pakistan was not performing well as
compared to its other competitors especially India. Because the United Arab
Emirates exports the basmati at high prices in international markets so that’s why
Pakistan is losing its competitiveness in United Arab Emirates. Pakistan should try
to search other markets to sell its basmati where the prices are more as compared
to United Arab Emirates. Pakistan should not concentrate on only the market of
United Arab Emirates, because throughout time under consideration, NPC value
showed that basmati is losing its competitiveness in United Arab Emirates.
Table 4.8: Nominal Protection Coefficient (NPC) of Pakistani Basmati Rice
Year Nominal Protection Coefficient
(NPC)
2003 0.57
2004 0.40
2005 0.40
2006 0.34
2007 0.26
2008 0.38
2009 0.37
2010 0.36
91
2011 0.89
2012 0.91
2013 0.76
Source: Author’s calculations
4.11.2 Meat (Beef & Mutton)
Pakistan has competitiveness in both beef and mutton for the time under
consideration for 2003-2012. In 2003 NPC of Pakistani beef was 0.56 that was
showing more competitiveness as compared to the years of 2004, 2005 and 2006.
Again in 2008 the NPC value decreased to 0.51 showing more competitiveness. In
2012 beef became less competitive with a NPC value of 0.87 as shown in Table
4.9.
Table 4.9: Nominal Protection Coefficient (NPC) of Meat (Beef & Mutton)
Year NPC of Beef NPC of Mutton
2003 0.56 0.79
2004 0.70 0.87
2005 0.86 0.98
2006 0.74 0.97
2007 0.67 0.87
2008 0.51 0.60
2009 0.64 0.82
2010 0.59 0.72
2011 0.67 0.89
2012 0.87 0.95
92
Source: Author’s calculations
NPC of beef of Pakistan remained less as compared to mutton showing that
Pakistani Beef is more competitive as compared to mutton. The comparison of both
NPCs of mutton and beef for the period of 2003-2012, indicated that Pakistani beef
is more competitive as compared to mutton because its NPC value is less than
mutton. Pakistan should try to focus more on beef as compared to mutton because
the NPC values shows that the Pakistani beef is more competitive as compared to
mutton. For mutton Pakistan should try to find other markets of the world where
the NPC values are less as compared to the United Arab Emirates.
4.11.3 Cotton Yarn
Throughout the duration under study for the period of 2003-2012, Pakistan has
competitiveness in cotton yarn as shown in the Table 4.10. Pakistan has value of
NPC less than 0.5 for the year 2008, while for all other years under the study the
values of NPC were more than the 0.5. For the year 2011 and 2012, NPC values
were 0.98 and 0.90, respectively, showing less competitiveness. It means Pakistan
has competitiveness in the cotton yarn but it is not strong competitiveness which
indicated presence of potential in this sector. Pakistani cotton industry is emerging
with time, since the exports of value added products of cotton has been increasing
and it is more profitable as compared to exports raw products.
Table 4.10: Nominal Protection Coefficient (NPC) of Cotton Yarn
Year (NPC)
2003 0.60
2004 0.61
2005 0.58
2006 0.51
2007 0.52
2008 0.40
93
2009 0.51
2010 0.65
2011 0.98
2012 0.90
Source: Author’s calculations
Since 2011 Pakistan is not performing well in the exports of cotton yarn to United
Arab Emirates, which is shown from the estimated values of NPC indices. There
is need to shift toward the value addition in this sector. If Pakistan lose its
competitiveness in cotton yarn than it should no need to worry about it and should
try to find the other markets where it can enjoy its competitiveness.
4.12 Competitiveness of Pakistan’s Major Agricultural Imports from United Arab
Emirates
Agricultural products which are the major imports of Pakistan from United Arab
Emirates, included in the study were milk, sugar and dried vegetables. These
agricultural products were selected for the study on the basic of import values.
Being a country of agriculture, why Pakistan is importing these agricultural
products from United Arab Emirates which is not directly producer of these
products? That’s why there is need to explore this area and to make analysis about
these products of agriculture that are being imported by Pakistan from United Arab
Emirates.
4.12.1 Milk
Pakistan has strong competitiveness in milk as exhibited by the values of NPC of
milk for the years 2003-2012. For the year 2004 and 2005 the competitiveness was
more as shown by the NPC value that is less than the 0.20 as compared to the years
2009-2012 (NPC > 0.30). Pakistan is a larger producer of milk but due to high
consumption in Pakistan milk is not being exported by Pakistan. Due to high
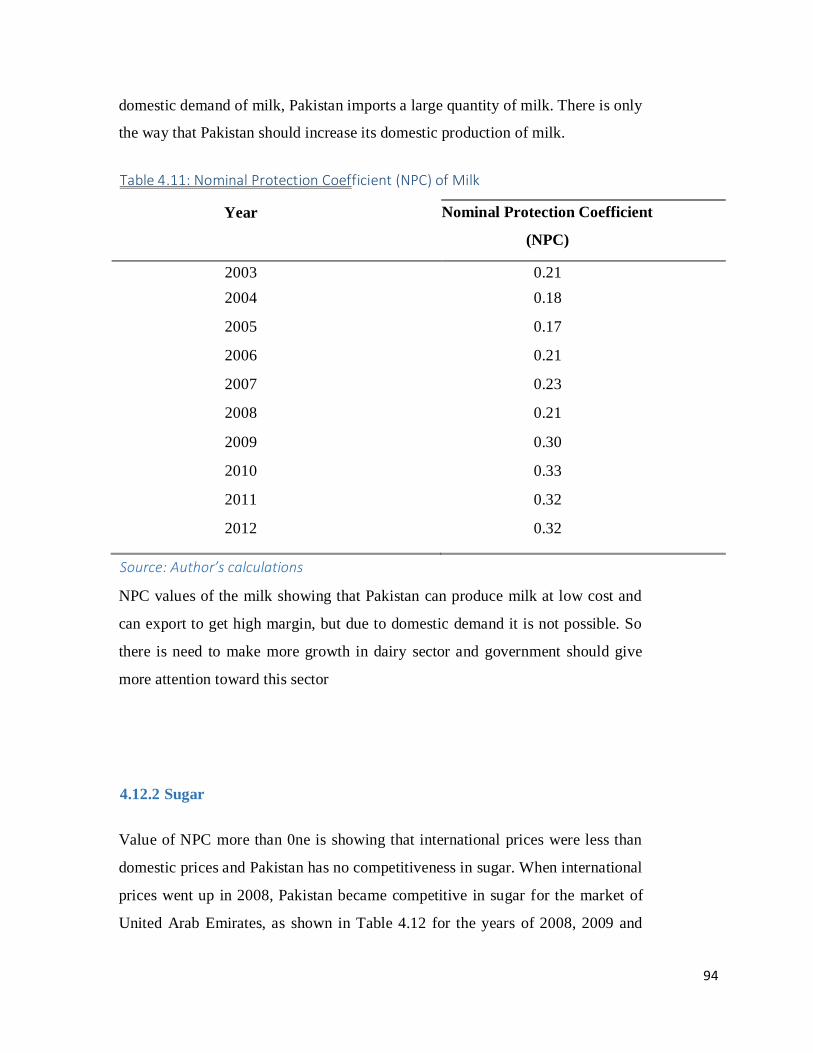
94
domestic demand of milk, Pakistan imports a large quantity of milk. There is only
the way that Pakistan should increase its domestic production of milk.
Table 4.11: Nominal Protection Coefficient (NPC) of Milk
Year Nominal Protection Coefficient
(NPC)
2003 0.21
2004 0.18
2005 0.17
2006 0.21
2007 0.23
2008 0.21
2009 0.30
2010 0.33
2011 0.32
2012 0.32
Source: Author’s calculations
NPC values of the milk showing that Pakistan can produce milk at low cost and
can export to get high margin, but due to domestic demand it is not possible. So
there is need to make more growth in dairy sector and government should give
more attention toward this sector
4.12.2 Sugar
Value of NPC more than 0ne is showing that international prices were less than
domestic prices and Pakistan has no competitiveness in sugar. When international
prices went up in 2008, Pakistan became competitive in sugar for the market of
United Arab Emirates, as shown in Table 4.12 for the years of 2008, 2009 and
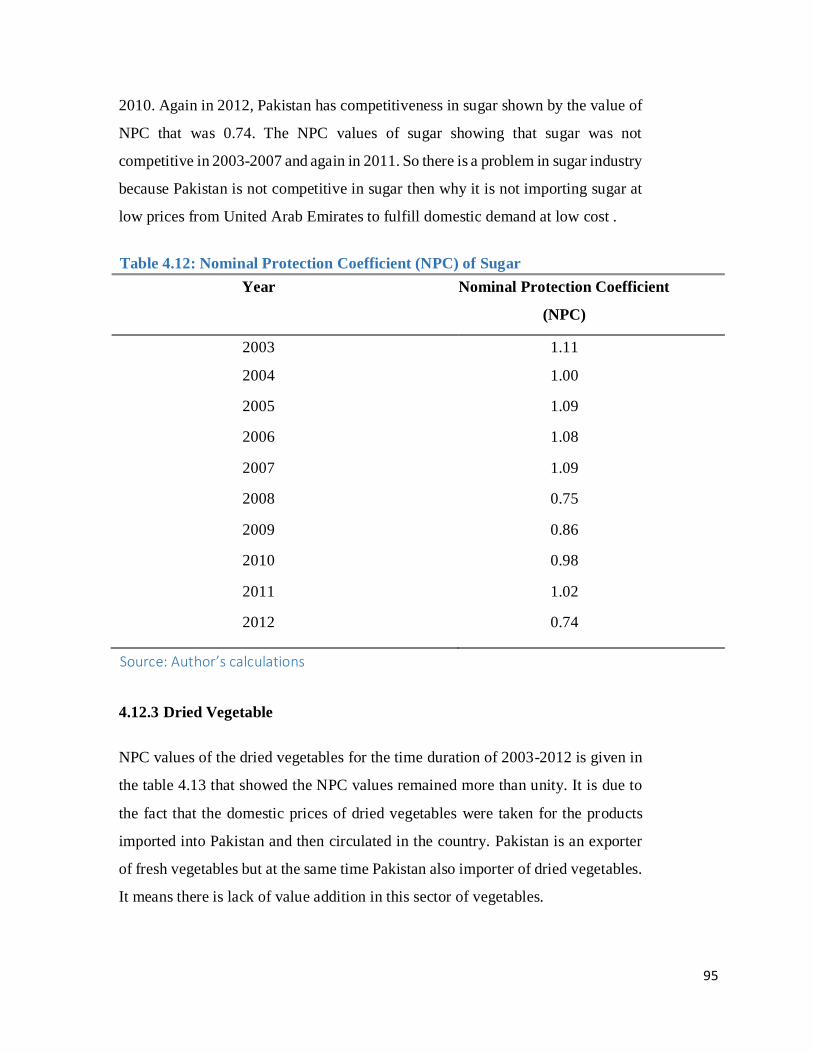
95
2010. Again in 2012, Pakistan has competitiveness in sugar shown by the value of
NPC that was 0.74. The NPC values of sugar showing that sugar was not
competitive in 2003-2007 and again in 2011. So there is a problem in sugar industry
because Pakistan is not competitive in sugar then why it is not importing sugar at
low prices from United Arab Emirates to fulfill domestic demand at low cost .
Table 4.12: Nominal Protection Coefficient (NPC) of Sugar
Year Nominal Protection Coefficient
(NPC)
2003 1.11
2004 1.00
2005 1.09
2006 1.08
2007 1.09
2008 0.75
2009 0.86
2010 0.98
2011 1.02
2012 0.74
Source: Author’s calculations
4.12.3 Dried Vegetable
NPC values of the dried vegetables for the time duration of 2003-2012 is given in
the table 4.13 that showed the NPC values remained more than unity. It is due to
the fact that the domestic prices of dried vegetables were taken for the products
imported into Pakistan and then circulated in the country. Pakistan is an exporter
of fresh vegetables but at the same time Pakistan also importer of dried vegetables.
It means there is lack of value addition in this sector of vegetables.
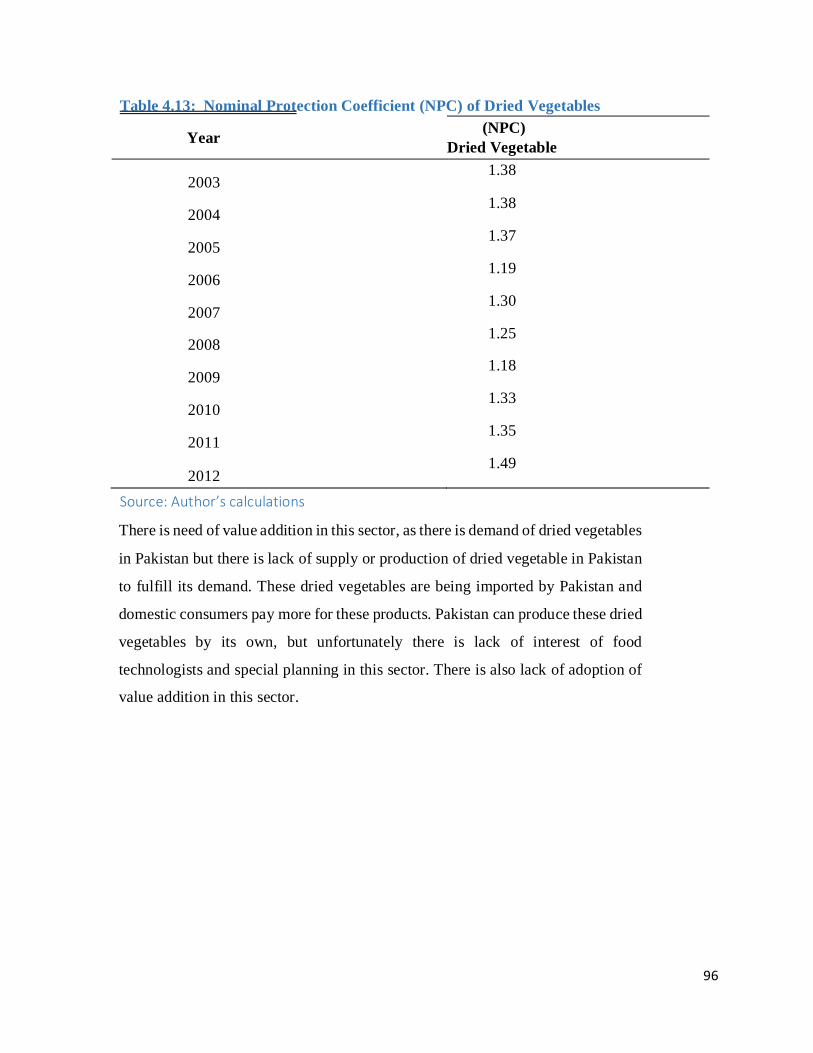
96
Table 4.13: Nominal Protection Coefficient (NPC) of Dried Vegetables
Year (NPC)
Dried Vegetable
2003 1.38
2004 1.38
2005 1.37
2006 1.19
2007 1.30
2008 1.25
2009 1.18
2010 1.33
2011 1.35
2012 1.49
Source: Author’s calculations
There is need of value addition in this sector, as there is demand of dried vegetables
in Pakistan but there is lack of supply or production of dried vegetable in Pakistan
to fulfill its demand. These dried vegetables are being imported by Pakistan and
domestic consumers pay more for these products. Pakistan can produce these dried
vegetables by its own, but unfortunately there is lack of interest of food
technologists and special planning in this sector. There is also lack of adoption of
value addition in this sector.
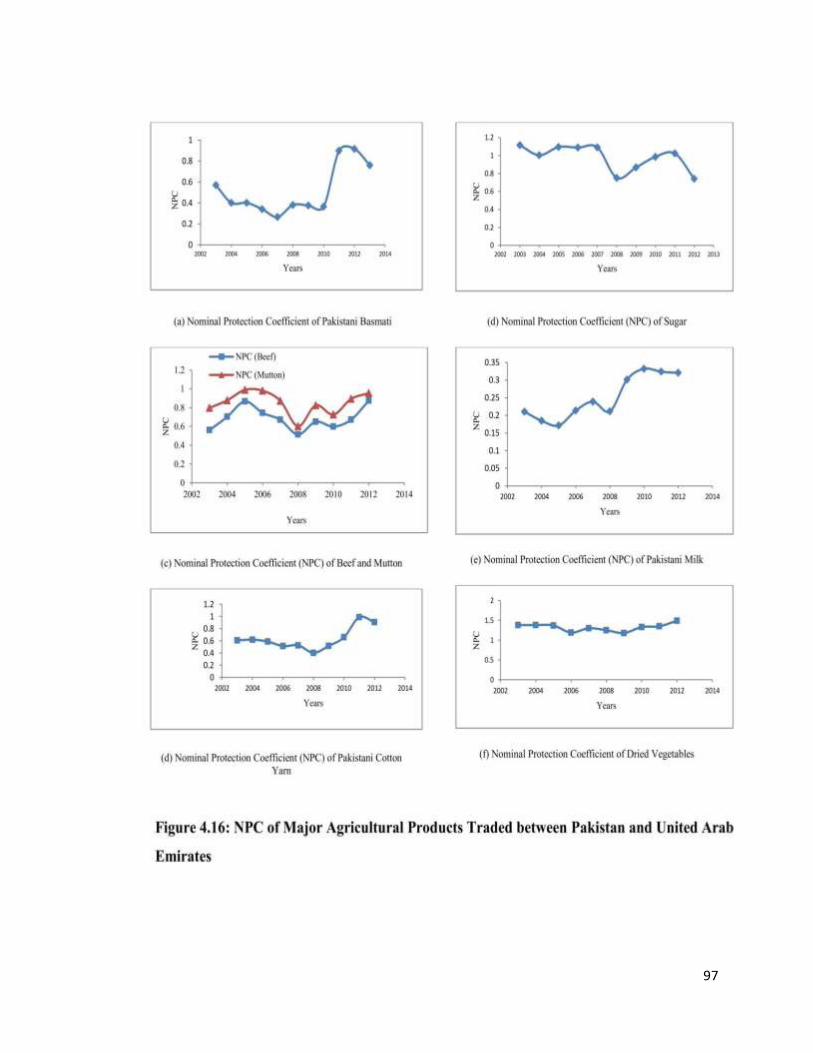
97
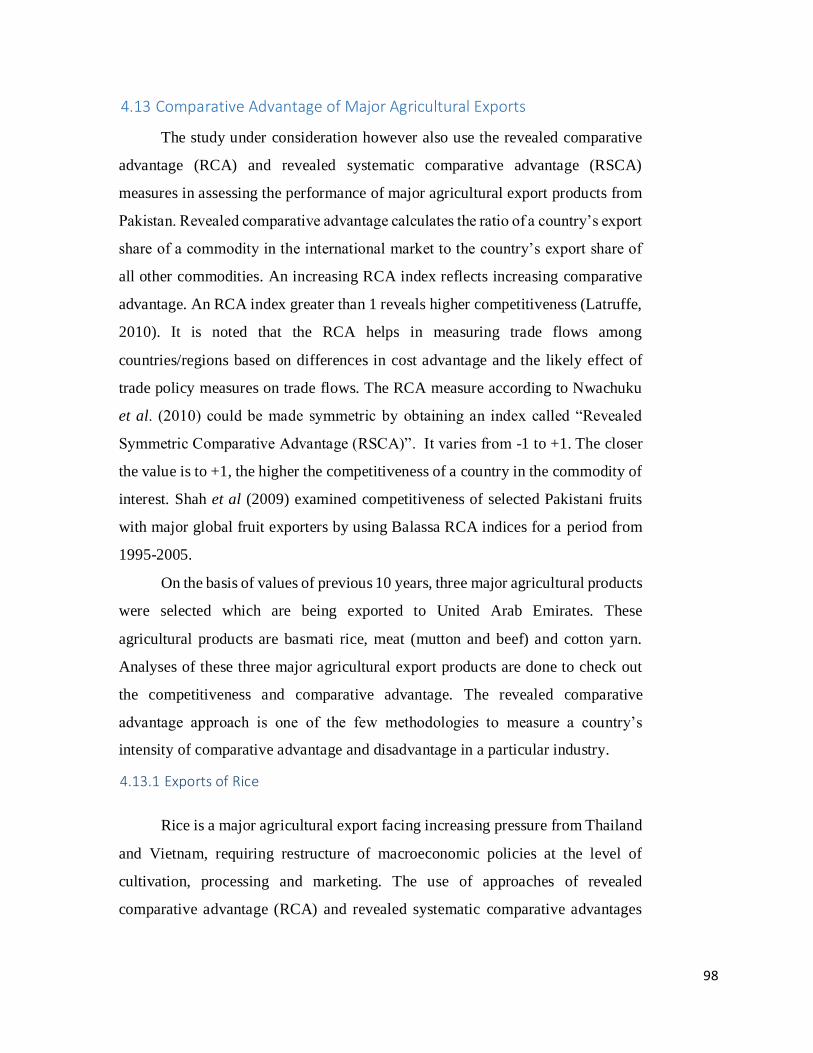
98
4.13 Comparative Advantage of Major Agricultural Exports
The study under consideration however also use the revealed comparative
advantage (RCA) and revealed systematic comparative advantage (RSCA)
measures in assessing the performance of major agricultural export products from
Pakistan. Revealed comparative advantage calculates the ratio of a country’s export
share of a commodity in the international market to the country’s export share of
all other commodities. An increasing RCA index reflects increasing comparative
advantage. An RCA index greater than 1 reveals higher competitiveness (Latruffe,
2010). It is noted that the RCA helps in measuring trade flows among
countries/regions based on differences in cost advantage and the likely effect of
trade policy measures on trade flows. The RCA measure according to Nwachuku
et al. (2010) could be made symmetric by obtaining an index called “Revealed
Symmetric Comparative Advantage (RSCA)”. It varies from -1 to +1. The closer
the value is to +1, the higher the competitiveness of a country in the commodity of
interest. Shah et al (2009) examined competitiveness of selected Pakistani fruits
with major global fruit exporters by using Balassa RCA indices for a period from
1995-2005.
On the basis of values of previous 10 years, three major agricultural products
were selected which are being exported to United Arab Emirates. These
agricultural products are basmati rice, meat (mutton and beef) and cotton yarn.
Analyses of these three major agricultural export products are done to check out
the competitiveness and comparative advantage. The revealed comparative
advantage approach is one of the few methodologies to measure a country’s
intensity of comparative advantage and disadvantage in a particular industry.
4.13.1 Exports of Rice
Rice is a major agricultural export facing increasing pressure from Thailand
and Vietnam, requiring restructure of macroeconomic policies at the level of
cultivation, processing and marketing. The use of approaches of revealed
comparative advantage (RCA) and revealed systematic comparative advantages
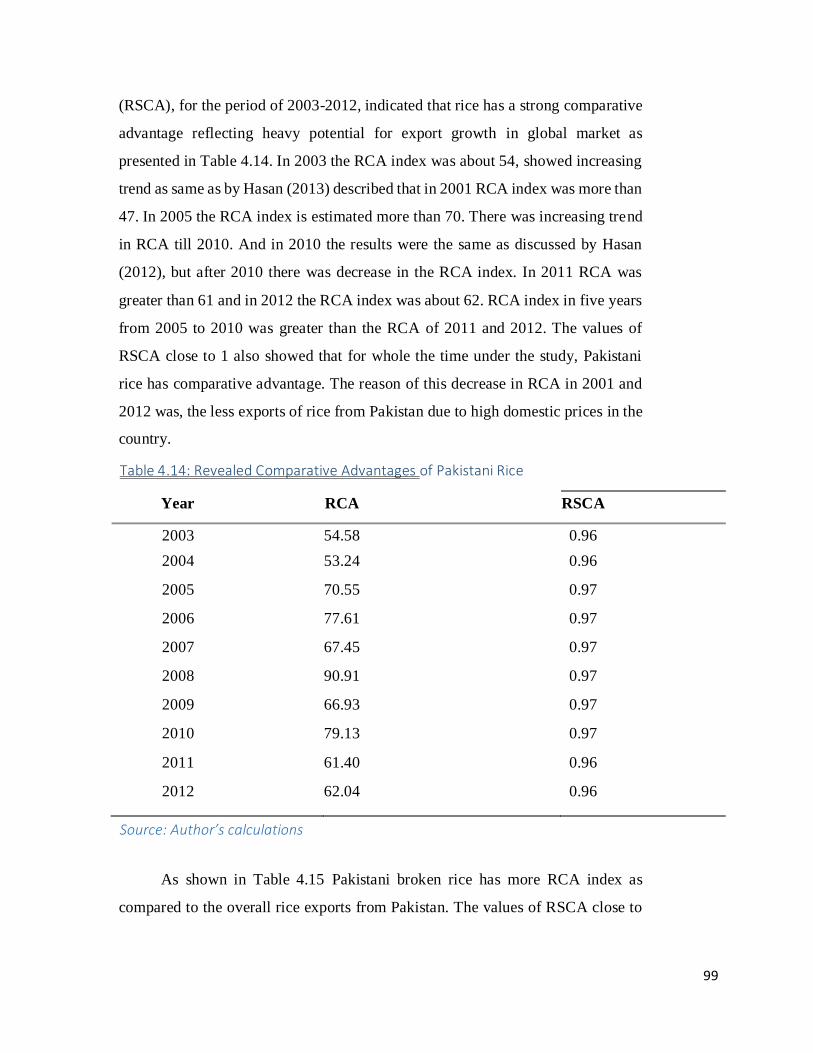
99
(RSCA), for the period of 2003-2012, indicated that rice has a strong comparative
advantage reflecting heavy potential for export growth in global market as
presented in Table 4.14. In 2003 the RCA index was about 54, showed increasing
trend as same as by Hasan (2013) described that in 2001 RCA index was more than
47. In 2005 the RCA index is estimated more than 70. There was increasing trend
in RCA till 2010. And in 2010 the results were the same as discussed by Hasan
(2012), but after 2010 there was decrease in the RCA index. In 2011 RCA was
greater than 61 and in 2012 the RCA index was about 62. RCA index in five years
from 2005 to 2010 was greater than the RCA of 2011 and 2012. The values of
RSCA close to 1 also showed that for whole the time under the study, Pakistani
rice has comparative advantage. The reason of this decrease in RCA in 2001 and
2012 was, the less exports of rice from Pakistan due to high domestic prices in the
country.
Table 4.14: Revealed Comparative Advantages of Pakistani Rice
Year RCA RSCA
2003 54.58 0.96
2004 53.24 0.96
2005 70.55 0.97
2006 77.61 0.97
2007 67.45 0.97
2008 90.91 0.97
2009 66.93 0.97
2010 79.13 0.97
2011 61.40 0.96
2012 62.04 0.96
Source: Author’s calculations
As shown in Table 4.15 Pakistani broken rice has more RCA index as
compared to the overall rice exports from Pakistan. The values of RSCA close to
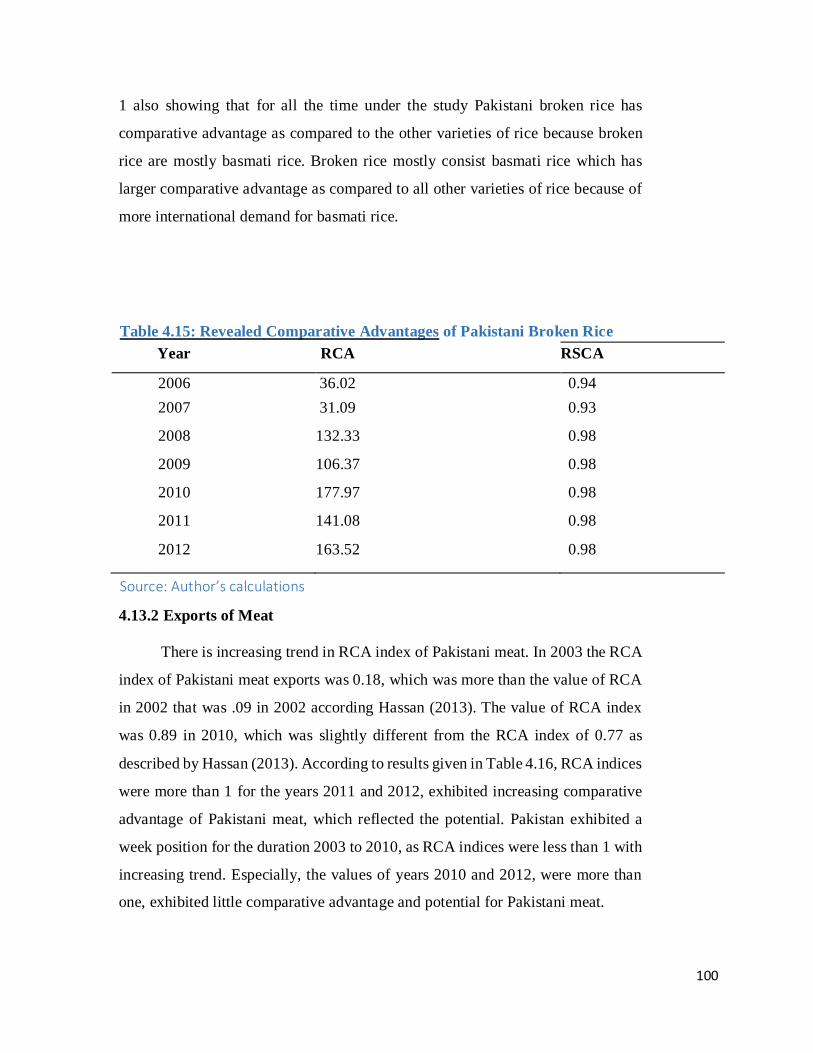
100
1 also showing that for all the time under the study Pakistani broken rice has
comparative advantage as compared to the other varieties of rice because broken
rice are mostly basmati rice. Broken rice mostly consist basmati rice which has
larger comparative advantage as compared to all other varieties of rice because of
more international demand for basmati rice.
Table 4.15: Revealed Comparative Advantages of Pakistani Broken Rice
Year RCA RSCA
2006 36.02 0.94
2007 31.09 0.93
2008 132.33 0.98
2009 106.37 0.98
2010 177.97 0.98
2011 141.08 0.98
2012 163.52 0.98
Source: Author’s calculations
4.13.2 Exports of Meat
There is increasing trend in RCA index of Pakistani meat. In 2003 the RCA
index of Pakistani meat exports was 0.18, which was more than the value of RCA
in 2002 that was .09 in 2002 according Hassan (2013). The value of RCA index
was 0.89 in 2010, which was slightly different from the RCA index of 0.77 as
described by Hassan (2013). According to results given in Table 4.16, RCA indices
were more than 1 for the years 2011 and 2012, exhibited increasing comparative
advantage of Pakistani meat, which reflected the potential. Pakistan exhibited a
week position for the duration 2003 to 2010, as RCA indices were less than 1 with
increasing trend. Especially, the values of years 2010 and 2012, were more than
one, exhibited little comparative advantage and potential for Pakistani meat.
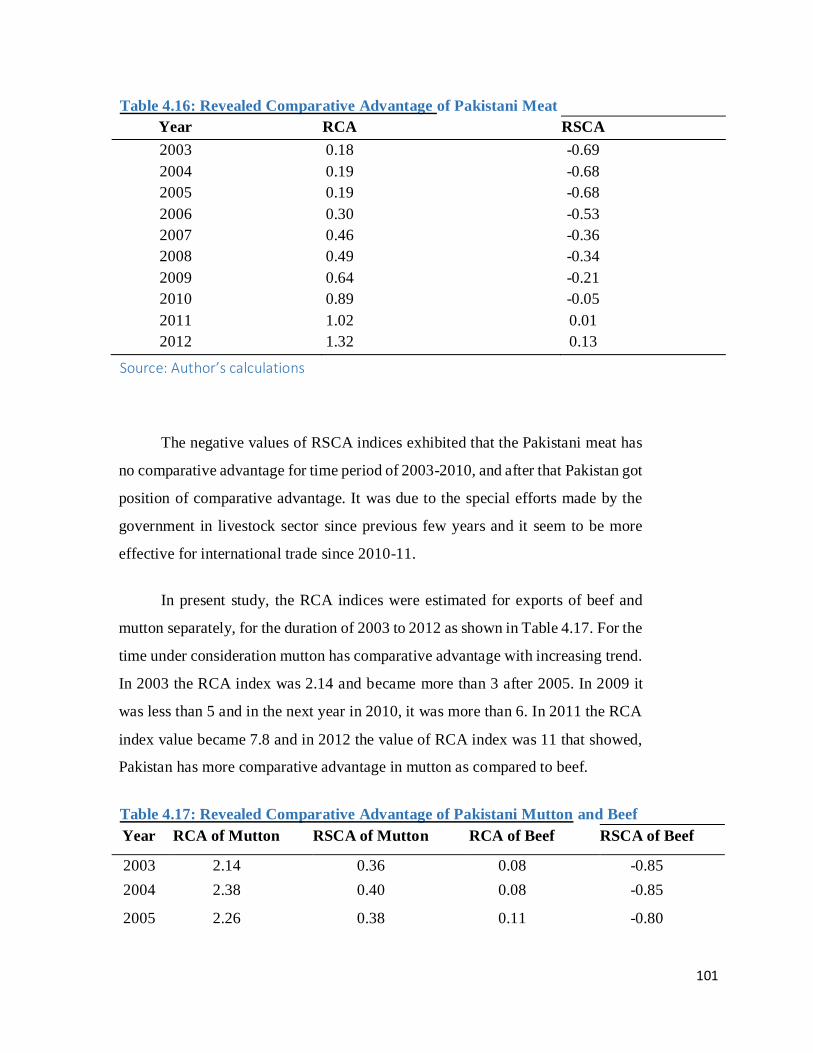
101
Table 4.16: Revealed Comparative Advantage of Pakistani Meat
Year RCA RSCA
2003 0.18 -0.69
2004 0.19 -0.68
2005 0.19 -0.68
2006 0.30 -0.53
2007 0.46 -0.36
2008 0.49 -0.34
2009 0.64 -0.21
2010 0.89 -0.05
2011 1.02 0.01
2012 1.32 0.13
Source: Author’s calculations
The negative values of RSCA indices exhibited that the Pakistani meat has
no comparative advantage for time period of 2003-2010, and after that Pakistan got
position of comparative advantage. It was due to the special efforts made by the
government in livestock sector since previous few years and it seem to be more
effective for international trade since 2010-11.
In present study, the RCA indices were estimated for exports of beef and
mutton separately, for the duration of 2003 to 2012 as shown in Table 4.17. For the
time under consideration mutton has comparative advantage with increasing trend.
In 2003 the RCA index was 2.14 and became more than 3 after 2005. In 2009 it
was less than 5 and in the next year in 2010, it was more than 6. In 2011 the RCA
index value became 7.8 and in 2012 the value of RCA index was 11 that showed,
Pakistan has more comparative advantage in mutton as compared to beef.
Table 4.17: Revealed Comparative Advantage of Pakistani Mutton and Beef
Year RCA of Mutton RSCA of Mutton RCA of Beef RSCA of Beef
2003 2.14 0.36 0.08 -0.85
2004 2.38 0.40 0.08 -0.85
2005 2.26 0.38 0.11 -0.80
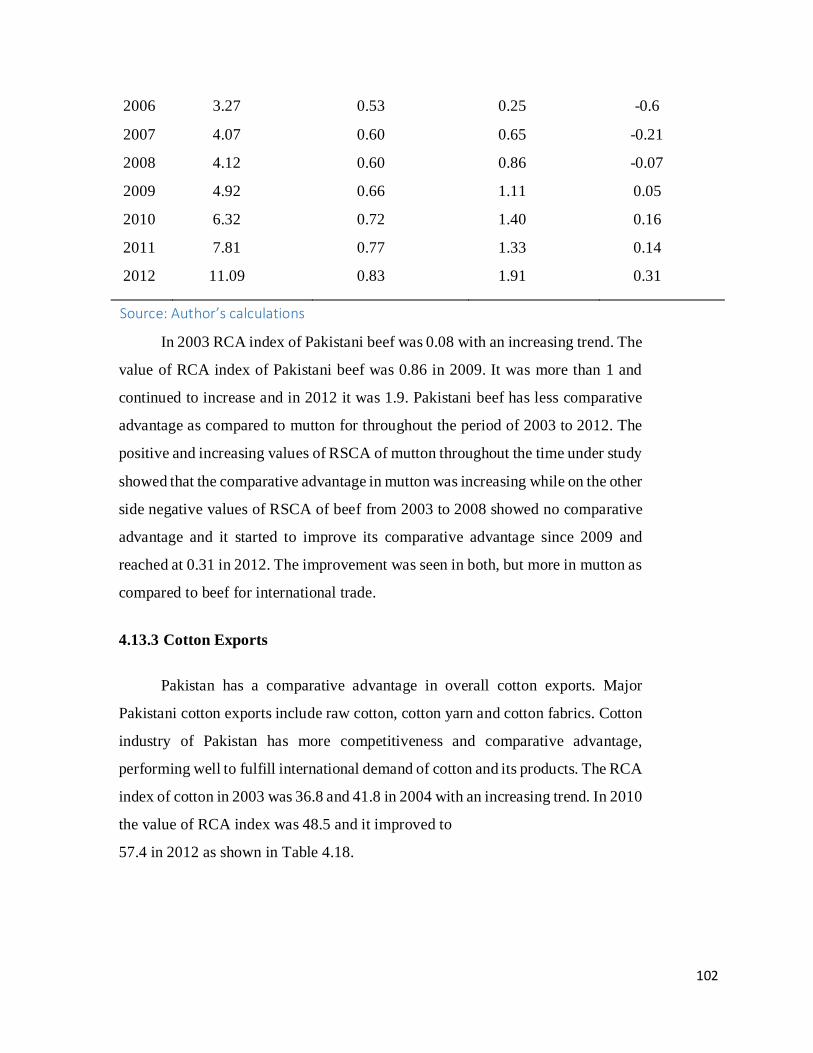
102
2006 3.27 0.53 0.25 -0.6
2007 4.07 0.60 0.65 -0.21
2008 4.12 0.60 0.86 -0.07
2009 4.92 0.66 1.11 0.05
2010 6.32 0.72 1.40 0.16
2011 7.81 0.77 1.33 0.14
2012 11.09 0.83 1.91 0.31
Source: Author’s calculations
In 2003 RCA index of Pakistani beef was 0.08 with an increasing trend. The
value of RCA index of Pakistani beef was 0.86 in 2009. It was more than 1 and
continued to increase and in 2012 it was 1.9. Pakistani beef has less comparative
advantage as compared to mutton for throughout the period of 2003 to 2012. The
positive and increasing values of RSCA of mutton throughout the time under study
showed that the comparative advantage in mutton was increasing while on the other
side negative values of RSCA of beef from 2003 to 2008 showed no comparative
advantage and it started to improve its comparative advantage since 2009 and
reached at 0.31 in 2012. The improvement was seen in both, but more in mutton as
compared to beef for international trade.
4.13.3 Cotton Exports
Pakistan has a comparative advantage in overall cotton exports. Major
Pakistani cotton exports include raw cotton, cotton yarn and cotton fabrics. Cotton
industry of Pakistan has more competitiveness and comparative advantage,
performing well to fulfill international demand of cotton and its products. The RCA
index of cotton in 2003 was 36.8 and 41.8 in 2004 with an increasing trend. In 2010
the value of RCA index was 48.5 and it improved to
57.4 in 2012 as shown in Table 4.18.
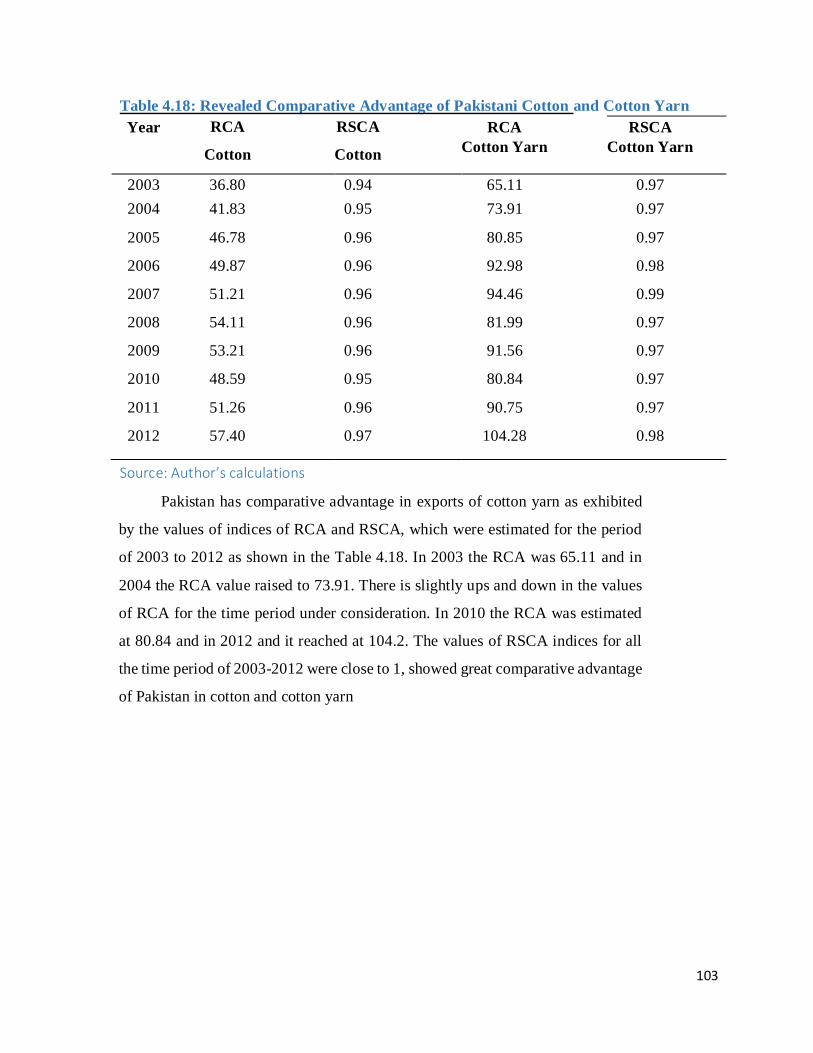
103
Table 4.18: Revealed Comparative Advantage of Pakistani Cotton and Cotton Yarn
Year RCA
Cotton
RSCA
Cotton
RCA
Cotton Yarn
RSCA
Cotton Yarn
2003 36.80 0.94 65.11 0.97
2004 41.83 0.95 73.91 0.97
2005 46.78 0.96 80.85 0.97
2006 49.87 0.96 92.98 0.98
2007 51.21 0.96 94.46 0.99
2008 54.11 0.96 81.99 0.97
2009 53.21 0.96 91.56 0.97
2010 48.59 0.95 80.84 0.97
2011 51.26 0.96 90.75 0.97
2012 57.40 0.97 104.28 0.98
Source: Author’s calculations
Pakistan has comparative advantage in exports of cotton yarn as exhibited
by the values of indices of RCA and RSCA, which were estimated for the period
of 2003 to 2012 as shown in the Table 4.18. In 2003 the RCA was 65.11 and in
2004 the RCA value raised to 73.91. There is slightly ups and down in the values
of RCA for the time period under consideration. In 2010 the RCA was estimated
at 80.84 and in 2012 and it reached at 104.2. The values of RSCA indices for all
the time period of 2003-2012 were close to 1, showed great comparative advantage
of Pakistan in cotton and cotton yarn

104
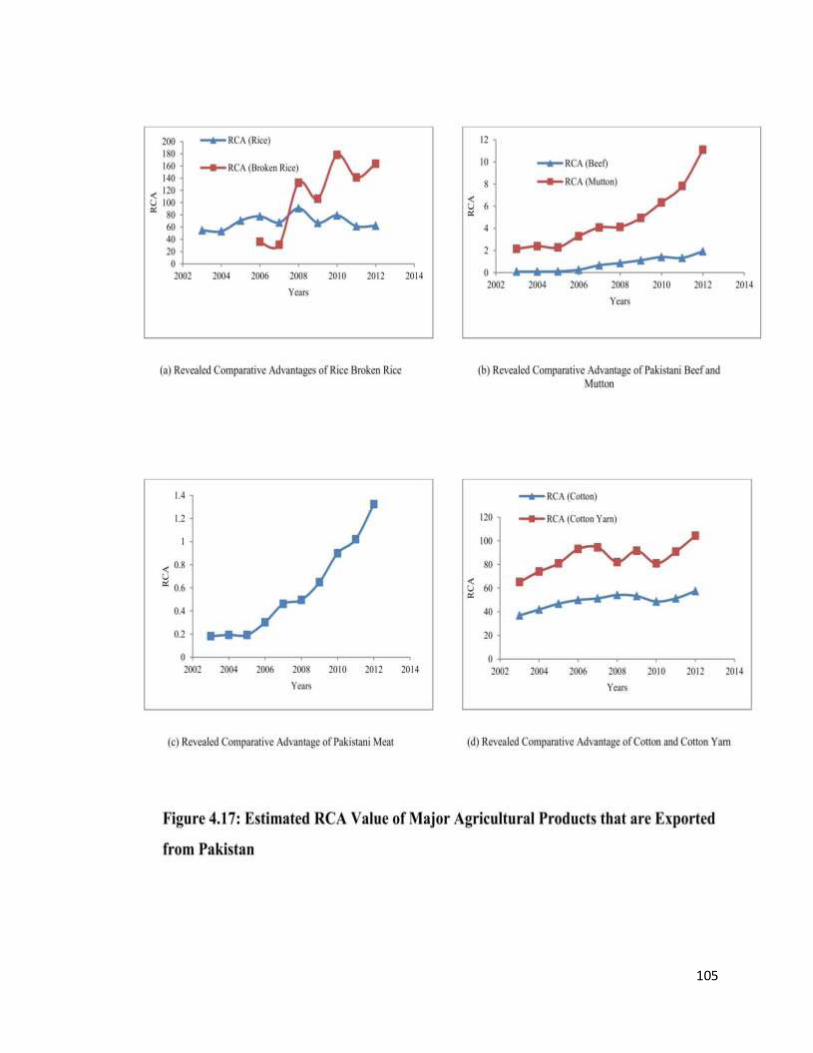
105
106
CHAPTER 5
SUMMARY
This chapter counts of two parts, one is the summary of the thesis in hand and the second
part comprised of conclusion and recommendations.
5.1 Summary
Pakistan’s export value was US$ 23,624 million in fiscal year 2013-14. The imports of
Pakistan amounted to about US$ 43,775 million during 2013-14. Pakistan always has a
negative trade balance. Trade share of Pakistan with United Arab Emirates was about 11
percent of its total trade with an export share of 8.5 percent and import share of 12.3 percent.
Major agricultural export items of Pakistan are rice, sugar, fruits, fish, fish preparations,
vegetables, oilseeds, wheat, meat, cotton yarn, and raw cotton. Export value of rice was
about
US$ 2111 million during the fiscal year 2013-14. Pakistan’s major agricultural imports
include milk, edible oil, tea, sugar, pulses, fertilizers, insecticides, raw cotton, and silk yarn.
Pakistan’s major export Items to United Arab Emirates include, clothing of textile fabrics,
hosiery, rice, fabrics, cotton yarn, sports goods, fruits, vegetables, and footwear. Major
agriculture export items of Pakistan to United Arab Emirates are rice, meat, and cotton yarn.
Major imports of Pakistan from United Arab Emirates are petroleum products, precious
stones, metals, plastic products, iron, steel, machinery, organic chemicals, and electrical
equipment. Major Agricultural imports of Pakistan from United Arab Emirates include dried
vegetables, sugar and milk. This study was aimed at analysis of the changing
competitiveness and comparative advantage of these agricultural products over time and its
implications for trade growth. The approach carried out analyses of major imports and
exports of agricultural products of Pakistan to United Arab Emirates. No such detailed study
was found for a special market that has a large share in Pakistani agricultural trade, so that
the present study was planned to analyze the impact of major variables on trade and to make
analysis of competitiveness and comparative advantages of major agricultural products
traded between Pakistan and United Arab Emirates.
107
To determine the impacts of different variables on agricultural trade of Pakistan with United
Arab Emirates as a major trading partner, the proxy of total volume of bilateral trade was
used as a dependent variable in the model because time series data of bilateral agricultural
trade were not available. Panel data of bilateral trade was taken in US$ million for time
period of 1975 – 2012. Panel data of GDP of Pakistan and GDP of major trading partners,
were taken in US$ Billion for time duration of 1975 – 2012. Panel data of GDP of United
Arab Emirates as major trading partners of Pakistan were taken from the World Bank for
time duration of 1975-2012. Data of about Population of Pakistan were found from the
statistical year book of Pakistan. Data about population of major trading partners of Pakistan
were taken from the World Bank. A dummy variable of joint border of both the trading
partners was taken for analysis to check the impact of joint border in bilateral trade. Another
dummy variable of cultural similarities was used for trade analysis between the trading
partners. The value of dummy variable was taken one for those trading partners which have
same culture as Pakistan and the value of zero was taken for those trading partners that have
entirely different culture as compared to Pakistan.
United Arab Emirates is 1st leading importer of Pakistani basmati rice. The export value of
Pakistani basmati to United Arab Emirates was about US$ 146 million during 201213,
constituting about 23 percent of total basmati rice exports, leaving 77 percent for rest of the
world. Total exports of basmati rice were at its highest point in 2008, with a value of US$
1115 million. This unexpected upsurge in exports of basmati was due to general rise in
international prices in 2007 and 2008. Other than basmati rice, 3.72 percent of other varieties
of coarse rice were also exported to United Arab Emirates in 20121-13. Only 1.31 percent
export of broken rice out of its total exports went to United Arab Emirates in 2012-13.
Pakistan’s 2nd largest market of basmati rice is Oman, with a share of 11 percent of its
basmati exports; followed by Saudi Arabia which is recipient of about 9 percent of total
Pakistani basmati exports.
Second major agricultural export product from Pakistan to United Arab Emirates is meat,
containing a major part of fresh and chilled meat of bovine animals which is 41.26 percent
of its total exports. The export share of frozen meat of bovine animals to United Arab
Emirates, was about 8.5 percent of its total export value. Also, about 12 percent exports of
108
meat of sheep and goat were made from Pakistan to United Arab Emirates during year 2012-
13. United Arab Emirates is major market of Pakistani beef. Beef with a value of about US$
40 million exported to United Arab Emirates in 2012-13, constituting a share of about 41
percent of its total exports from Pakistan. Total beef exports from Pakistan to the world were
about US$ 97 million in 2012-13. Export value of Pakistani mutton to United Arab Emirates
was about US$ 10 million in 2012-13 which was less than export value of beef from Pakistan
to United Arab Emirates. Total export value of mutton form Pakistan was about US$ 86
million that was less than the total export value beef from Pakistan, during 2012-13. In 2007
about 30 percent mutton exports were made with United Arab Emirates while in 2012 this
export share declined to 12 percent. Saudi Arabia is top market for Pakistani mutton having
a major share of about 37 percent of its total mutton exports. Iran is 2nd largest importer of
Pakistani mutton with a value of about US$ 25 Million in 2012-13. United Arab Emirates is
third import market of Pakistani mutton with a value of about US$ 10 million, during
201213. Fourth and fifth markets of Pakistani mutton are Bahrain and Oman with a value of
about US$ 9 million and US$ 4 million, respectively.
Cotton yarn is also a major export item of Pakistan but its export share to United Arab
Emirates is less as compared to other markets. Its export share to United Arab Emirates was
only about 2.3 percent. Cotton industry of Pakistan is a major source of cotton exports
therefore cotton products have a major share in total exports of Pakistan. Export value of
cotton related items from Pakistan to United Arab Emirates was US$ 39 million in 2012.
Ten year trend lines of Pakistani exports revealed that the value of exports of cotton related
items were declining over time. Major market of Pakistani cotton was china with a value of
about US$ 1833 million in 2012, constituting 35 percent share in total cotton exports from
Pakistan. Bangladesh is 2nd largest market of Pakistani cotton with a value of about US$ 579
million in 2012. Hong Kong is 3 rd largest market of Pakistani cotton with value of about
US$ 229 million. Pakistan exported cotton to Turkey, Italy and Korea with a value of about
US$ 185 million, US$ 150 million and US$ 144 million, respectively in 2012. Total export
value of cotton yarn from Pakistan was about US$ 2102 million in 2012 and about 67 percent
of this value was exported to China. Hong Kong was 2nd largest market of Pakistani cotton
yarn with a value of about US$ 191 million in 2012. Bangladesh was 3 rd largest importer of
109
Pakistani cotton yarn. Pakistan exported about US$ 5 million value of cotton yarn to United
Arab Emirates during 2012-13.
Sugar imports from United Arab Emirates amounted to US$ 1,179 thousand against total
sugar imports of US$ 6,627 thousand in 2012 constituting 17.7 percent of total sugar
imports. During previous last 10 years sugar imports from United Arab Emirates was very
high in the years 2006, 2009, and 2010 with a value of about US$ 160 million, US$ 141
million and US$ 200 million, respectively. In 2008 about 52 percent of sugar of its total
sugar imports was imported from United Arab Emirates and about 75 percent of imports of
sugar were made from United Arab Emirates in 2009. The share of total imports of sugar
from United Arab Emirates was low after 2009 that was about 25 percent in 2010, 18 percent
in 2011 and 17 percent in 2012. Pakistan could not import sugar in 2007 and 2008, when
international prices went up. Due to domestic production, domestic demand and forecasted
domestic consumption, there were great fluctuations in the value of sugar imports by
Pakistan in previous years.
Total Value of milk and cream imports of Pakistan was US$ 102 million in 2012-13 whereas,
in 2003, it was only about US$ 7 million. In 2003 the value of imports of milk and cream
from United Arab Emirates was only 61 thousands that stretched to US$ 143 thousands in
2005. It decreased to US$ 32 thousands only in 2009 and again it started to increase, showing
the value of US$ 360 thousands in 2010, 739 thousand in 2011, and 823 thousands in 2012.
Total import value of dried vegetables of Pakistan was US$ 407 million in 2012-13. The
value of Imports of dried vegetables from United Arab Emirates was US$ 1,349 thousand
in 2012. Previous ten year’s trend line of import flow of dried vegetable from United Arab
Emirates to Pakistan, exhibited an increasing trend. Reduction in the import value of dried
vegetable in 2007 and 2008, was due to increase in international prices. According to 2012
estimation Pakistan imported dried vegetables with value of US$ 126 million from Australia,
about US$ 45 million from Myanmar, and about US$ 44 million from India. Australia is
largest supplier of dried vegetables to Pakistan.
Panel data about the different variables were used in the study under consideration for the
duration of 1975-2012.Test statistics of four methods used (Levin Lin & Chu, I P Shin W-
stat, ADF - Fisher Chi-square and PP - Fisher Chi-square) for GDPi at level form are not
110
significant, indicated the data as non-stationary at level form. After transferring the data of
GDPi in first difference form the test statistics of all the four methods became significant,
indicated that the data of GDPi after first difference, turned to stationary. Test statistics of
the four methods used for GDPj at level form are not significant, indicated that the data was
non stationary at level form. After transferring the data of GDPj in first difference form the
test statistics of all the four methods became significant, indicated that the data of GDPj after
first difference, became stationary. The value of four tests for the data about POPi and POPj
are significant at level form, indicated that the data was stationary at level form.
Gravity model of trade in Double log form with 1st differences was used to find the impact
of various factors on trade between Pakistan and United Arab Emirates. The descriptive
statistics of different variables was used in the study related to Pakistan and its ten major
trading partners including United Arab Emirates. The data of descriptive summary
presented that mean value of GDP of Pakistan was US$ 70.19 billion and the average mean
value of GDP of trading partners of Pakistan was US$ 1517.69 billion. It showed that the
major trade of Pakistan is generally directed toward the large economies. The mean value of
population of Pakistan is 123.04 million, which is 140 million less as compared to its major
trading partners. Mean value of distance between Pakistan and its major trading partners is
3967.9 km. The nearest trading partner is situated 686 km away from Pakistan and maximum
distance of trading partner is 10866 km.
Hausman specification test was used to check whether fixed effect or random effect model
was appropriate. F-test was used to choose best model between the fixed effects or Pooled
OLS. Breusch-Pagan LM test was used for selection of appropriate model between Pooled
OLS and random effect model. For time invariant variables between Pooled OLS and
random effect model, most appropriate model for the analysis was known by Bruesch-Pagan
langrang multiplier test. Significant value of Breusch-Pagan LM test concluded that random
effects model was appropriate instead of Pooled OLS. As a final point, after application of
Hausman specification test, F-test and Breusch-Pagan LM test, it was concluded that two
models were appropriate i.e., fixed effects model for time variant variables and random
effects model for time invariant variables.
111
By using F-test and Housman specification test, fixed effect model was considered best
model for checking the impact of time variant variables on bilateral trade of Pakistan with
its trading partners. According to the results of fixed effect model, GDP of Pakistan was
positively affecting agricultural trade between Pakistan and its trading partners. The
coefficient of GDP of Pakistan was 0.75, which was highly significant. One percent increase
in GDP of Pakistan would increase 0.75 percent agricultural trade between Pakistan and
United Arab Emirates. The value of estimated coefficient of GDP of trading partners of
Pakistan was 0.69 and found significant, explaining that one percent increase in GDP of
trading partners of Pakistan cause an increases of 0.69 percent in bilateral agricultural trade
of Pakistan with its trading partner. It means that with one percent increase in GDP of United
Arab Emirates would increase 0.69 percent in agricultural trade of Pakistan with United
Arab Emirates.
Population of Pakistan was negatively affecting agricultural trade of Pakistan with its trading
partners. Estimated value of coefficient of population of Pakistan was -1.24 by the fixed
effect model, which was highly significant and it indicated that one percent increase in
population of Pakistan would decrease 1.24 percent agricultural trade of Pakistan with
United Arab Emirates. The population of Pakistan carried negative sign. It implies that
population variable had the trade inhibiting affect. It implies that a larger population size
may be treated as large resource endowments and thus an indication of self-sufficiency and
thereby less reliance on international trade. Population of trading partners of Pakistan
positively affected agricultural trade of Pakistan with its major trading partners. This impact
was highly significant and according to results a percent increase in population of trading
partners of Pakistan caused an increase of 0.63 percent in agricultural trade between Pakistan
and its trading partners. In the model of fixed effects constant value of trade was 2.92 percent
when making an analysis of trade of Pakistan with its major trading partners but when trade
was considered only with United Arab Emirates, constant value of trade between Pakistan
and United Arab Emirates was 6.51. In the analysis, all values of VIF were less than 10,
which showed no multicollinearity existed in the data set. To solve the problem of
heteroscedastisity, HAC standard errors were used during estimation of the results.
112
All variables in the model of random effects have no problem of multicolinearity because
the values of variance inflation factor were less than ten. To solve the problem of
heteroscedastisity HAC standard errors were used during estimation of the results by random
effects model. GDP of Pakistan was significantly affecting agricultural trade between
Pakistan and its trading partners. It means that one percent increase in GDP of Pakistan
would increase about one percent agricultural trade with United Arab. GDP of trading
partners of Pakistan significant and positively affecting agricultural trade. One percent
increase in GDP of United Arab Emirates would increase 0.51 percent agricultural trade
with United Arab Emirates. Population of Pakistan has a negative effect on bilateral
agricultural trade of Pakistan that was not significant. According to estimated results of
random effects, one percent increase in population of Pakistan would decrease 1.13 percent
agricultural trade between Pakistan and United Arab Emirates. Population of major trading
partner of Pakistan has a positive effect on agricultural trade. This impact was highly
significant which states that one percent increase in population of United Arab Emirates
would increase about 0.23 percent agricultural trade between Pakistan and United Arab
Emirates.
According to the estimation of random effect model, distance was negatively affecting
bilateral trade. It shows that, an increase in distance between trading partners has a negative
effect on trade but this impact was not significant. Cultural similarities between trading
partners has a positive impact on mutual agricultural trade, which was highly significant
relationship. The similar culture of Pakistan with its major trading partners have 1.27 percent
more trade as compared to the trading partners which have no cultural similarities with
Pakistan. Joint border was assumed to have a positive impact on bilateral trade but in case
of Pakistani trade the fact was that Pakistan have not good relations with the countries which
have joint border with Pakistan, that’s why this impact was negative and highly significant
as shown by the estimation of random effect model. The joint border countries of Pakistan
have 2.3 percent less trade as compared to the countries which has no joint border. According
to the random effects model, constant value of trade with its major top ten trading partners
was 5.53 percent. But considering trade of Pakistan with United Arab Emirates, constant
value becomes 6.15 percent of trade value.
113
The NPC values of basmati rice was 0.57 in 2003, which was less competitive as compared
to 2004 and 2005. Throughout time period under consideration, basmati remained more
competitive in 2007, value of its NPC was 0.26. In 2008 NPC value became 0.38 which
exhibited more competitiveness in 2007 as compared to 2008. Afterwards, in 2009, NPC
value was 0.37 in 2009 and 0.36 in 2010 that was again getting competitiveness in basmati
rice but unfortunately the value of NPC in year of 2011 became 0.89 that showed that
basmati rice was losing its competitiveness. The value of NPC in 2012 was 0.91 which is
showing that Pakistan have little competitiveness in basmati exports. Basmati rice of
Pakistan has competitiveness in international markets whereas before a decade it had more
competitiveness. Throughout periods under consideration, basmati was less competitive in
2012, the value of NPC was 0.91. It was due to reason that Pakistani basmati exports were
suffering problems and exporters worried about that situation when domestic prices
increased but there was no increase in international prices of basmati, hence Pakistan was
not performing well as compared to its other competitors especially India. Because United
Arab
Emirates exports basmati at high prices in international markets so that’s why Pakistan is
losing its competitiveness in United Arab Emirates. Pakistan should try to search other
markets to sell its basmati where prices are more as compared to United Arab Emirates.
Pakistan should not concentrate on only the market of United Arab Emirates, because
throughout time under consideration NPC value showed that basmati is losing its
competitiveness in United Arab Emirates.
Rice is a major agricultural export facing increasing pressure from Thailand and Vietnam,
requiring restructure of macroeconomic policies at the level of cultivation, processing and
marketing. The use of approaches of revealed comparative advantage (RCA) and revealed
systematic comparative advantages (RSCA), for period of 2003-2012, indicated that rice has
a strong comparative advantage reflecting heavy potential for export growth in global
market. In 2005 RCA index was estimated more than 70. There was increasing trend in RCA
till 2010. In 2011 RCA was greater than 61 and in 2012 RCA index was about 62. RCA
index in five years from 2005 to 2010 was greater than RCA of 2011 and 2012. The values
of RSCA close to 1 also showed that for whole the time under the study, Pakistani rice has
114
comparative advantage. The reason of this decrease in RCA in 2001 and 2012 was, the less
exports of rice from Pakistan due to high domestic prices in the country. Pakistani broken
rice has more RCA index as compared to the overall rice exports from Pakistan. The values
of RSCA close to 1 also showing that for all the time under the study Pakistani broken rice
has comparative advantage as compared to other varieties of rice because broken rice are
mostly basmati rice. Broken rice mostly consist basmati rice which has larger comparative
advantage as compared to all other varieties of rice because of more international demand
for basmati rice.
Pakistan has competitiveness in both beef and mutton for the time under consideration for
2003-2012. In 2003 NPC of Pakistani beef was 0.56 that was showing more competitiveness
as compared to the years of 2004, 2005 and 2006. Again in 2008, NPC value decreased to
0.51 showing more competitiveness. NPC of beef of Pakistan remained less as compared to
mutton showing that Pakistani Beef is more competitive as compared to mutton. The
comparison of both NPCs of mutton and beef for the period of 2003-2012, indicated that
Pakistani beef is more competitive as compared to mutton because its NPC value was less
than mutton. Pakistan should try to focus more on beef as compared to mutton because NPC
values shows that Pakistani beef is more competitive as compared to mutton. For mutton
Pakistan should try to find other markets of the world where NPC values are less as
compared to United Arab Emirates.
There is increasing trend in RCA index of Pakistani meat. In 2003, RCA index of Pakistani
meat exports was 0.18. RCA indices were more than 1 for the years 2011 and 2012, exhibited
the increasing comparative advantage of Pakistani meat, which reflected the potential.
Pakistan exhibited a week position for the duration 2003 to 2010, as RCA indices were less
than 1 with increasing trend. Especially, the values of years 2010 and 2012, were more than
one, exhibited little comparative advantage and potential for Pakistani meat. The negative
values of RSCA indices exhibited that Pakistani meat has no comparative advantage for the
time period of 2003-2010, and after that Pakistan got position of comparative advantage. It
was due to special efforts made by the government in livestock sector since previous few
years and it seem to be more effective for international trade since 2010-11. For the time
under consideration mutton has comparative advantage with increasing trend. In 2003 RCA
115
index was 2.14 and became more than 3 after 2005. In 2009 it was less than 5 and in the
next year in 2010, it was more than 6. In 2011, RCA index value became 7.8 and in 2012,
value of RCA index was 11 that showed, Pakistan has more comparative advantage in
mutton as compared to beef. In 2003 RCA index of Pakistani beef was 0.08 with an
increasing trend. The value of RCA index of Pakistani beef was 0.86 in 2009. It was more
than 1 and continued to increase and in 2012 it was 1.9. Pakistani beef has less comparative
advantage as compared to mutton for throughout the period of 2003 to 2012. The positive
and increasing values of RSCA of mutton throughout the time under the study showed that
the comparative advantage in mutton was increasing while on the other side negative values
of RSCA of beef from 2003 to 2008 showed no comparative advantage and it started to
improve its comparative advantage since 2009 and reached at 0.31 in 2012. The
improvement was seen in both, but more in mutton as compared to beef for international
trade.
Throughout the duration under study for the period of 2003-2012, Pakistan has
competitiveness in cotton yarn. Pakistan has value of NPC less than 0.5 for the year 2008,
while for all other years under the study the values of NPC were more than 0.5. For the year
2011 and 2012, NPC values were 0.98 and 0.90, respectively, showing less competitiveness.
It means Pakistan has competitiveness in the cotton yarn but it is not strong competitiveness
which indicated presence of potential in this sector. Pakistani cotton industry is emerging
with time since the exports of value added products of cotton has been increasing and more
profitable as compared to of exports raw products. Since 2011 Pakistan is not performing
well in exports of cotton yarn to United Arab Emirates, which is shown by estimated values
of NPC indices. There is need to shift toward the value addition in this sector. If Pakistan
lose its competitiveness in cotton yarn than it should no need to worry about it and should
try to find other markets where it can enjoy its competitiveness. Pakistan has a comparative
advantage in overall cotton exports. Major Pakistani cotton exports include raw cotton,
cotton yarn and cotton fabrics. Cotton industry of Pakistan has more competitiveness and
comparative advantage, performing well to fulfill international demand of cotton and its
products. The RCA index of cotton in 2003 was 36.8 and 41.8 in 2004 with an increasing
trend. In 2010, value of RCA index was 48.5 and it improved to 57.4 in 2012. Pakistan has
116
comparative advantage in exports of cotton yarn as exhibited by the values of indices of
RCA and RSCA, which were estimated for the time period of 2003 to 2012. In 2003, RCA
was 65.11 and in 2004, RCA value raised to 73.91. There is slightly ups and down in the
values of RCA for the time period under consideration. In 2010, RCA was estimated at 80.84
and in 2012 and it reached at 104.2. The values of RSCA indices for all the time period of
20032012 were close to 1, showed great comparative advantage of Pakistan in cotton and
cotton yarn
Pakistan has strong competitiveness in milk as exhibited by the values of NPC of milk for
the years 2003-2012. For the year 2004 and 2005, competitiveness was more as shown by
the NPC value that is less than 0.20 as compared to the years 2009-2012 (NPC > 0.30).
Pakistan is a larger producer of milk but due to high consumption in Pakistan milk is not
being exported by Pakistan. Due to high domestic demand of milk, Pakistan imports a large
quantity of milk. There is only the way that Pakistan should increase its domestic production
of milk. NPC values of milk showing that Pakistan can produce milk at low cost and can
export to get high margin, but due to domestic demand it is not possible. So there is need to
make more growth in dairy sector and government should give more attention toward this
sector
Value of NPC more than 0ne is showing that international prices were less than the domestic
prices and Pakistan has no competitiveness in sugar. When international prices went up in
2008, Pakistan became competitive in sugar for market of United Arab Emirates, for the
years of 2008, 2009 and 2010. Again in 2012, Pakistan has competitiveness in sugar shown
by the value of NPC that was 0.74. The NPC values of sugar showing that sugar was not
competitive in 2003-2007 and again in 2011. So there is a problem in sugar industry because
Pakistan is not competitive in sugar than why not importing sugar at low cost from United
Arab Emirates market for fulfilling domestic demand at low prices. .
NPC values for the time duration of 2003-2012, that presented the NPC values for dried
vegetables remained more than unity. It is due to the fact that the domestic prices of dried
vegetables were taken for the products which were imported into Pakistan and then
circulated in the country. Pakistan is an exporter of fresh vegetables but at the same time
also an importer of dried vegetables. It means there is lack of value addition in this sector of
117
vegetables. There is need of value addition in this sector, as there is demand of dried
vegetables in Pakistan but there is lack of supply or production of dried vegetable in Pakistan
to fulfill its demand. These dried vegetables are being imported by Pakistan and domestic
consumers pay more for these products. Pakistan can produce these dried vegetables by its
own, but unfortunately there is lack of interest of food technologists and special planning in
this sector. There is also lack of adoption of value addition in this sector.
5.2 Conclusions and Recommendations
GDP of Pakistan has a positive and significant impact on agricultural trade with United Arab
Emirates. Pakistan need to find large economies for trade of agricultural products. GDP of
United Arab Emirates has a positive and significant impact on agricultural trade between
Pakistan and United Arab Emirates. Population of United Arab Emirates has positive Impact
on agricultural trade. It is recommended that Pakistan should try to focus more on economies
having large population as a trading partner for agricultural products. Negative impact of
Increasing Population of Pakistan on agricultural trade suggests that Pakistan should try to
improve labor qualities and skills that may be favorable in agricultural trade growth as well
as development of economy. The negative impact of Distance and joint border between
trading partners, on agricultural trade suggest that Pakistan should try to improve trade
environment with the countries that are close to Pakistan and also with its neighbors. After
the Positive and significant impact of cultural similarities on agricultural trade, it is
recommended that Pakistan should try to concentrate on that countries whose culture is
similar with Pakistani culture, i.e. Saudi Arabia, India and Iran.
Pakistan has a comparative advantage in production of basmati rice because the it is very
popular all over the world and Pakistani land has the ability to grow basmati rice with aroma
smell that’s why the export values of basmati rice from Pakistan is more as compared to the
other agricultural crops. United Arab Emirates is major market of Pakistani rice and since
2008, exports of basmati rice were decreasing. In 2007 NPC value of basmati rice was
0.26 and in 2008 NPC value became 0.38 which shows more competitiveness in 2007 as
compared to the 2008. After that in 2009 NPC value was 0.37 and NPC value of 0.36 in
2010 that was showing again getting competitiveness in basmati rice but unfortunately the
118
value of NPC in the year of 2011 became 0.89 that showed that the basmati rice was losing
its competitiveness. And the value of NPC in 2012 was 0.91 which was showing that
Pakistan have little competitiveness in basmati exports. Values of NPC indices shows that
Pakistan is losing its competitiveness in United Arab Emirates. So Pakistan should find more
markets to reduce its dependence on United Arab Emirates for basmati, because the major
share of basmati is only going to this markets. United Arab Emirates is a market acting as
an intermediate channel that re- exports these products to the other markets of the world. So
Pakistan should try to find other markets where the NPC values should be less as compared
to United Arab Emirates. Decrease in the Competitiveness of Pakistani basmati as compared
to its main competitors is due to the main cause of increase in domestic prices of basmati
rice in Pakistan. Increasing inflation is the main cause of this increase in basmati rice. There
is need of involvement of government strong price polices to control the increase in domestic
prices of basmati to make basmati rice again more competitive in world market. Basmati
growers should be given proper subsidies and the policies should be made to keep the prices
of basmati low to make Pakistani basmati rice more competitive in international markets as
compared to its main competitors. In the study RCA index of Pakistani rice including all
varieties was 90.91 in 2008 and 62.02 in 2012 shows that Pakistani rice is also losing its
comparative advantage since 2008. Broken rice exports from Pakistan that consists of
basmati rice has a RCA value of 132 in 2008 and 163 in 2012 is showing an increase in the
comparative advantage for basmati rice. Increasing values of RCA indices of basmati rice
shows that Instead of losing competitiveness of basmati rice in the world markets Pakistan
still have comparative advantage in basmati rice .so there is need to maintain both the
competitiveness and comparative advantage at the same time and for this government should
play its role by changing the existing price policies.
By reviewing the trends of meat exports for 10 years from Pakistan, it was seen that value
of beef was more than mutton. The value of beef exported to United Arab Emirates, was
also more than mutton. It means that the demand of beef is more in United Arad Emirates
as compared mutton. It does not mean that Pakistan should concentrate more on beef to
increase export value to United Arab Emirates. That’s why the analysis of NPC was
necessary to know the sector to which more emphasis is needed. For this purpose, NPC
119
analysis for previous 10 years expressed that NPC of Pakistani beef remained less as
compared to mutton, indicating more competitiveness of Pakistani beef as compared to
mutton. It is concluded that Pakistan should focus more on beef for its exports growth as
compared to mutton. Pakistan should focus more on beef for the market of United Arab
Emirates while in case of mutton it should try to find the other markets, with the less values
of NPC indices of mutton, as compared to United Arab Emirates. The analysis of increasing
trend of RCA and RSCA indices for previous 10 years, for both mutton and beef, showed
that Pakistani mutton has more comparative advantage as compared to beef. Pakistani
mutton is less competitive instead of having more comparative advantage, it pointed out that
there are some quality issues in Pakistani mutton for international markets. After conclusion
of the study about mutton and beef it is suggested and recommended that Pakistan should
focus on the both mutton and beef to expand exports. At the same time a special effort is
required to solve the quality issues in mutton especially as compared to beef to increase
mutton exports.
Performance of Pakistan in exports of cotton yarn to United Arad Emirates, was good before
2011. Pakistan was competitive since 2011 in exports of cotton yarn to the market of United
Arad Emirates. For the short period of time, Pakistan should not worry about its less
competitiveness because in this sector the value addition is growing more and it is more
profitable because of high demand in all over the world. Estimation of NPC indices of cotton
yarn throughout duration of time under consideration, shows that Pakistan has
competitiveness in cotton yarn but it is not a strong competitiveness. There is no more
potential in exports of cotton yarn in this market. Pakistani cotton industry is developing
more as time passes, that’s why exports of value added products of cotton is increasing and
have strong competitiveness as compared to raw products of cotton. So there is need to
concentrate more on value addition in this sector. After the study of estimated value of RCA
of cotton yarn, it is concluded that Pakistan has comparative advantage in export of cotton
yarn. There is need to have more competitiveness and comparative advantage at the same
time. However the other value added product seems to be more competitive and comparative
advantage as compared to cotton yarn that’s why there is no need to worry about the low
120
competitiveness of Pakistani cotton yarn because it is used in other products of cotton that
have more competitiveness.
The estimation of NPC indices of milk for the period under consideration concludes that
Pakistan can produce milk at low cost and can export to get high margin but due to domestic
demand, it is not possible. Pakistan is a larger producer of milk but due to high consumption
in Pakistan milk is not exported from Pakistan. Pakistan has strong competitiveness in milk
but still is not able to export milk to other countries. Due to high domestic demand of milk
Pakistan imports a large quantity of milk. NPC values of milk showing that Pakistan can
produce milk at low cost and can export to get high margin but due to domestic demand, it
is not possible. So there is need to make more growth in dairy sector and government should
give more attention toward this sector.
Value of NPC of sugar more than unity was showing that international prices were less than
domestic prices and Pakistan has no competitiveness in sugar. When international prices go
up in 2008 Pakistan becomes competitive in sugar in international markets. There is a
problem in sugar industry because Pakistan is not competitive in sugar than why not
importing sugar at low cost from international market to fulfill domestic demand at low
prices.
Pakistan is an exporter of fresh vegetables but at the same time Pakistan also importer of
dried vegetables. It means there is lack of value addition in this sector of vegetables. There
is need of value addition in the sector of vegetable as there is demand of dried vegetables in
Pakistan but no supply or production of dried vegetable in Pakistan to fulfill its demand.
Because these dried vegetables are imported and Pakistani consumers pay more for these
products. Pakistan can produce these dried vegetables by its own but unfortunately there is
lack of interest of food technologists and special planning in this sector. There is also lack
of adoption of value added technologies in this sector.
5.3 Global Impact of the Study
By this research the impact of different important factors was showed which are very
important for the bilateral trade between any two economies and their consideration is much
essential for increasing the bilateral trade with any trading partner. It is suggested that
121
Pakistan should try to find large economies of the world for the trade of agricultural
products. It is recommended that Pakistan should try to focus more on the economies having
large population as a trading partner for agricultural products. By doing this the trade of the
other nations of the world will also increase. The negative impact of Distance and joint
border between trading partners, on agricultural trade suggest that Pakistan should try to
improve the trade environment with the countries that are close to Pakistan and also with its
neighbors. After the Positive and significant impact of cultural similarities on agricultural
trade, it is recommended that Pakistan should try to concentrate on that countries also whose
culture is similar with Pakistani culture. According to the findings of the study, increasing
values of RCA index of basmati rice showed that Pakistan has comparative advantage in
basmati Rice and 23 percent of basmati rice is being exported to the country of united Arab
emirates who is not directly consuming it rather is re- exported to the other nations of the
world. Other countries of the world should directly import the rice from Pakistan. Increasing
trend of RCA indices for the previous 10 years of both mutton and beef is the proof of having
comparative advantage. United Arab Emirates is major market of Pakistani beef constituting
a share of about 41 percent to total exports from Pakistan and about 30 percent mutton
exports were made with United Arab Emirates. United Arab Emirates re-exports the basmati
rice, mutton and beef to the other countries of the worlds that are unable to directly import
from such a country that has comparative advantage. After this study the other countries of
the world would be able to know about the comparative advantages of the agricultural
products of Pakistan. On the other side Pakistan is also unable to find the countries or to
attract the countries who are importing these products from United Arab Emirates. Each
country of the world should try to make trade on the basis of comparative advantage. It will
decrease the transportation costs, transaction costs, and will be more beneficial for importers
and exporters as well.
5.4 Limitations of the Study
Non availability of the related data of some important factors was a limitation of the study
to make the study more comprehensive. Time constraints and non availability of funds for
studies of social science was also a major constraint for conducting this research. Major
agriculture export items of Pakistan to United Arab Emirates are rice, meat, and cotton yarn.
122
Major Agricultural imports of Pakistan from United Arab Emirates include dried vegetables,
sugar and milk. There was unavailability of time series data of these particular agricultural
products more than ten years. This study was aimed at analysis of the changing
competitiveness and comparative advantage of these agricultural products over time and the
analysis was carried out only for short time period due to the unavailability of the time series
data for long time.
To determine the impacts of different variables on agricultural trade of Pakistan with United
Arab Emirates as a major trading partner, the proxy of total volume of bilateral trade was
used as a dependent variable in the model because time series data of bilateral agricultural
trade were not available. Due to the multicolinearity some important variables were omitted
from the models. The gravity model has a major problem that it cannot be used when there
are observations for which total trade is equal to zero. Second, it has been argued by Santos
Silva and Tenreyro (2006) that estimating the log-linearized equation by least squares (OLS)
can lead to significant biases.
5.5 Area for Future Research
After this study of agricultural trade analysis with United Arab Emirates there is need to
conduct such research on the other markets where Pakistani trade share is more. United Arab
Emirates is the 2nd largest trade partner of Pakistan with a trade share of about 11 percent.
After conducting the research on topic of competitiveness and comparative advantages of
major agricultural products of trade with United Arab Emirates there is need to conduct such
research on the comparative advantage and competitiveness of major agricultural products
of trade with other countries that are high valued markets to find out the other markets from
where Pakistan can get products on low prices and can sell agricultural product to get high
price. The future research may be based on the other trading partners like China, Saudi
Arabia, United States and the other countries of European Union. There should be separate
analyses of each product of exports and imports by estimating the competitiveness and
comparative advantage and finally be able to decide which product should be exported to
which market and which product should be imported from which market.
123
LITERATURE CITED
Afzal, M., 2004. “Exports-Economic Growth Nexus: Pakistan’s Experience. Indian
Journal of Business and Economics. 3(2): 315-40.
Akbar. A., M. Imdadullah, M. Amanullah and M. Aslam. 2011. Determinants of
Economic Growth in Asian Countries: A Panel Data Perspective. Pakistan Journal
of Social Sciences (PJSS). 31 (1): 145-157.
Akhtar, W., M. Sharif, and H. Shah. 2009. Competitiveness of Pakistani Fruits in the
World Market. The Lahore Journal of Economics. 14 (2): 125-133.
Akhtar, W., M. Sharif, and N. Akmal. 2007. Analysis of Economic Efficiency and
Competitiveness of the Rice Production Systems of Pakistan’s Punjab. Lahore
Journal of Economics. 12(1): 141-153.
Akhtar, W., N. Akmal, H. Shah, M. A. Niazi and A. Tahir. 2013. Export
Competitiveness of Pakistani Horticultural Products. Pakistan J. Agric. Res. 26 (2):
87-96.
Akhter, M. R. 1998. Effects of Trade Liberalization on Agriculture in Pakistan:
Institutional and Structural Aspects. Working Paper 33/1998, the CGPRT Centre,
Bogor,
Indonesia.
Anderson, J. E. and E. V. Wincoop. 2003. Gravity with Gravitas: A Solution to the
Border Puzzle. The American Economic Review. 93 (1): 170-92.
Anjum, W. 2003. Export Supply Function of Rice and Cotton. M.sc Thesis,
Department of Agriculture Economics, University of Agriculture, Faisalabad.
Antonucci, D. and S. Manzocchi. 2006. Does Turkey have a Special Trade Relation
with The EU: A Gravity Model Approach? Economic Systems, 30(2): 157-169.
Anwar, S., Z. Hussain, and M. S. Javed. 2005. Comparative Advantage and
Competitiveness of Wheat Crop in Pakistan. The Lahore Journal of Economics, 10 (2):
101-110.
Aujla, K. M., M. Abbas, K. Mahmood, and S. Saadullah. 2007. Marketing System
of Fruits, Margins and Export Potential in Pakistan. Pak. J. Life Soc. Sci, 5(1-2): 34-
39.
124
Bai, J., C. Kao and S. Ng. 2009. Panel Cointegration with Global Stochastic Trends.
Journal of Econometrics. 149: 82-99.
Baier, S. L and J. H. Bergstrand. 2003. Endogenous Free Trade Agreements and the
Gravity Equation. Paper presented at Georgia Institute of Technology, April 10,
2003. North Avenue, Atlanta, GA 30332, USA.
Balassa B (1965). Trade Liberalization and Revealed Comparative Advantage. The
Manchester School Econ. Soc. Stud., 33 (1):99-123.
Balassa, B. 1989. Revealed Comparative Advantage Revisited In: B. Balassa (ed.),
Comparative Advantage, Trade Policy and Economic Development. : 63–79. New
York University Press, New York.
Balassa, B. and D.M. Achydlowsky. 1972. Domestic Resource Costs and Effective
Protection Once Again. Journal of Political Economy. 80: 63-69.
Baldwin, R. and D. Taglioni. 2007. ‘Trade Effects of the Euro: A Comparison of
Estimators’. Journal of Economic Integration. 22 (4): 780-818.
Baltagi, B. H. 2005. Econometric Analysis of Panel Data. 3rd Ed. Cambridge
University Press, New York.
Banerjee, A. and J. L. Carrion-i-Silvestre. 2004. Breaking Panel Data Cointegration.
Working Paper presented at the “Common Features in London”. Cass Business
School, 106 Bunhill Row, London EC1Y 8TZ, United Kingdom
Bano, S. and F. Scrimgeour. 2011. New Zealand Kiwifruit Export Performance:
Market Analysis and Revealed Comparative Advantage. Department of Economics.
Working Paper Series, Number 08/11. University of Waikato, Hamilton, New
Zealand.
Banterle, A. and L. Carraresi. 2007. Competitive Performance Analysis and
European Union Trade: The Case of the Prepared Swine Meat Sector. Food Econ.
Acta Agricult Scand. C. 4 (3): 159-172.
Batra, A and Z. Khan. 2005. Revealed Comparative Advantage: An Analysis for
India and China. ICRIER Working Paper No 168.2005, New Delhi.
125
Beghin, J. and J. C. Bureau. 2001. Quantification of Sanitary, Phytosanitary, and
Technical Barriers to Trade for Trade Policy Analysis. Center for Agricultural and
Rural Development. Working Paper 01-WP-291. Iowa State University, USA.
Bergstrand, J. H. 1989. The Generalized Gravity Equation, Monopolistic
Competition and the Factor-Proportions Theory in International Trade. Review of
Economics and Statistics, 71: 143-153.
Breusch, T. S. and A.R. Pagan. 1980. The Lagrange Multiplier Test and Its
Applications to Model Specification in Econometrics. Review of Economic Studies.
47(1): 239-253.
Brinkman, G .L. 1987. The Competitive Position of Canadian Agriculture. Canadian
Journal of Agricultural Economics. 35: 263-88.
Camarero, M., E. Gómez, and C. Tamarit. 2010. Evidence of the Euro Effect on
Trade Estimating Gravity Equations with Panel Cointegration Techniques.
Departamento de Economía Aplicada. Instituto Valenciano de Investigaciones
Económicas (IVIE), the Spanish Ministerio de Ciencia e Innovación (MICINN):
project ECO2008-05908C02-02/ECON.
CARIS. 2008. The Impact of Trade Policies on Pakistan’s Preferential Access to the
European Union. Report TRADE08/C3/C18 Prepared in Association with Chishti,
A., M. Zulfiqar and Z. Naqvi at Centre for the Analysis of Regional Integration at
Sussex, Department of Economics, University of Sussex, United Kingdom.
Chand, R. 1999. Are Disparities in Indian Agriculture Growing?, Policy Brief 8,
National Centre for Agricultural Economics and Policy Research (NCAP), New
Delhi, India.
Chen, C. B., A. McCarl, C. C. Change and S. Hsu. 2002. Spatial Equilibrium
Modeling With Imperfectly Competitive Market: An Application to Rice Trade.
Paper Presented at AAEA annual meeting long beach. California, USA.
Coleman, S., M. Stack, and D. Wheatley. 2011. A Gravity Model Approach To
Estimating Prospective Trade Gains in the EU Accession and Associated Countries
126
Marie Stack And Eric Pentecost. Division of Economics, Nottingham Trent
University Burton Street, Nottingham. United Kingdom.
Corden, W. M. 1971. The Theory of Protection. Oxford University Press, London.
Davis, D. and D. Weinstein. 1996. Does Economic Geography Matter for
International Specialisation? NBER Working Paper, No. 5706, Cambridge Mass:
National Bureau of Economic Research.
Deardorff, A. V. 1984. Testing Trade Theories and Predicting Trade Flows.
Handbook of International Economics, Amsterdam, North-Holland.
Dianniar, U. 2014. The Impact of Free Trade Agreements on Indonesia’s
Agricultural Trade Flows: An Application of the Gravity Model Approach. A
research paper presented at international institute of social scieces (ISS). The Hague,
Netherland.
Donnet, A, S. Noi. And S. Mehta. 2007. Impact of Trade Liberalization on Export
Demand in Pakistan. A Panel Data Analysis for Commodity Groups. (Online
available at: http://ssrm.com?abstract=845372.)
Egger, P. 2002. An Econometric View on Estimation of Gravity Models and the
Calculation of Trade Potentials. World Economy. 25 (2): 297-312.
Eichengreen, B. and D. Irwin. 1997. The Role of History in Bilateral Trade Flows.
Working Paper No. 5565, NBER, Cambridge.
Emam, A. A., and M. H. Salih. 2011. Measuring of Competitiveness of Sudanese
Sheep Export. American Journal of Experimental Agriculture. 1(3): 69-78.
Feenstra, R. C., J. A. Markusen and A. K. Rose. 2001. Using the Gravity Equation
to Differentiate Among Alternative Theories of Trade. Canadian Journal of
Economics. 34(2): 430-447.
Gbetnkom, D. and S. A. Khan. 2002. ‘Determinants of Agricultural exports: The
case of Cameroon’. African Economic Research Consortium (AERC), Nairobi.
Research paper, 120: 1-41.
Ghafoor, A., K. Mustafa, I. Zafar, K. Mushtaq and M. Hussain. 2013. Determinants and
127
Margins of Exporting Mango from Pakistan to UAE Market. Sarhad J. Agric 29(3):
477-484.
Ghani, E., N. Zakir and N. Akhter. 2008. Changing Revealed Comparative
Advantage: A case study of Foot Wear Industry in Pakistan. Pakistan Development
Review. 47(4): 695-709.
Gonzales, L.A., F. Kasryno, N. D. Perez, and M. W. Rosegrant. (1994). Economic
Incentives and Comparative Advantage in Indonesian Food Crop Production.
Research Report 93. International Food Policy Research Institute. Washington, DC,
USA.
Government of Pakistan (GOP). 2012. Economic Survey of Pakistan (2011-12).
Economic Advisor’s Wing, Finance Division, Government of Pakistan, Islamabad
Pakistan.
Government of Pakistan (GOP). 2013. Economic Survey of Pakistan (2012-13).
Economic Advisor’s Wing, Finance Division, Government of Pakistan, Islamabad
Pakistan.
Government of Pakistan (GOP). 2014. Economic Survey of Pakistan (2013-14).
Economic Advisor’s Wing, Finance Division, Government of Pakistan, Islamabad
Pakistan.
Granger, C.W.J. and P. Newbold. 1974. Spurious Regressions in Econometrics. J.
Econ. 2: 11–20.
Greene, W. 1997. Econometric Analysis, 5th Edition. Upper Saddle River, N.J: Prentice-
Hall. Gujarati, D. 2003. Basic Econometrics. 4th Ed. New York: McGraw Hill. 638-640.
Gul, N. and M. Yaseen. 2011. The Trade Potential of Pakistan: An Application of
the Gravity Model. The Lahore Journal of Economics. 16 (1): 23-62.
Gulati, A., J. Hanson, and G. Pursell. 1990. Effective Incentives in India’s
Agriculture Cotton Groundnuts, Wheat and Rice. Policy, Planning and Research
Working Paper No. WPS 332. World Bank.
Haider, J., M. Afzal, and F. Riaz. 2011. Estimation of Import and Export Demand
Functions Using Bilateral Trade Data: The Case of Pakistan. BEH - Business and
Economic Horizons. 6 (3): 40-53.
128
Hanif, M. N. and S. K. Jafri .2008. Financial Development and Textile Sector
Competitiveness: A Case Study of Pakistan. South Asia Economic Journal. 9(1):
141158.
Haq, Z. U., M. Gheblawi, S. Muhammad. 2011. The Role of Global Economic
Growth in Pakistani Agri-Food Exports. The Pakistan Development Review. 50 (3):
245–256.
Hassan, M. R. 2013. An Analysis of Competitiveness of Pakistan’s Agricultural Export
Commodities. IOSR Journal of Business and Management (IOSR-JBM). 11(5): 29-34.
Hatab, A. A., E. Romstad and X. Huo. 2010. Determinants of Egyptian Agricultural
Exports: A Gravity Model Approach. Modern Economy. 1: 134-143.
Hausman, J. A. (1978). “Specification Tests in Econometrics,” Econometrica. 46:
1251– 1272.
Ilyas, M, M. Tahir, and T. Tariq. 2006. Competitiveness among Asian Exporters in
the World Rice Market. Department of Economics, Quaid-i-Azam University,
Islamabad, Pakistan.
İnsel, A and M. Tekçe. 2010. Bilateral Trade Flows of the Gulf Cooperation Council
Countries: A New Approach to Gravity Model. Turkish Economic Association.
Discussion paper 2010/2. Department of Economics, Marmara University, Goztepe
Campus, Kadikoy 34722, Istanbul, Turkey. This Version is available at:
http://hdl.handle.net/10419/81722.
International Trade Center (ITC). 2013. Trade Maps: Trade Statistics for
International Business Development. International Trade Center, Geneva,
Switzerland.
International Trade Center (ITC). 2014. Trade Maps: Trade Statistics for
International Business Development. International Trade Center, Geneva,
Switzerland.
Iqbal, M. H. 2014. Determinants of Bilateral Trade between Bangladesh and the
European Union: Approach of Gravity Model under the Panel Data. Issues in
Business Management and Economics. 2 (5): O87-093.
129
Kang, H. P., L. Kenned and B. Hilbun. 2009. The Relationships of Trade, Economic
Growth and Market Power: The Case of Rice Exporting Countries. Paper prepared
for presentation at the Southern Agricultural Economics Association Annual
Meeting, Atlanta, Georgia.
Kang, H. P., L. Kennedy and B. Hilbun. 2009. An Empirical Estimation of the Import
Demand Model and Welfare Effects: The Case of Rice Importing Countries. Paper
prepared for presentation at the Southern Agricultural Economics Association
annual meeting, Atlanta, Georgia.
Karemera, D., W. I. Smith, K. Ojah, and J. A. Cole. 1999. A Gravity Model Analysis of the
Benefits of Economic Integration in the Pacific Rim, Journal of Economic
Integration. 14 (3): 347-367.
Kepaptsoglou, K., M. G. Karlaftis and D. Tsamboulas. 2010. The Gravity Model
Specification for Modeling International Trade Flows and Free Trade Agreements
Effects. The Open Economics Journal. 3: 1-13.
Ketenci, N. 2014. The Effect of the European Union Customs Union on the Balance
of Trade in Turkey. Yeditepe University, Istanbul. Online at
http://mpra.ub.unimuenchen.de/54662/ MPRA Paper No. 54662, posted 26. March
2014 09:55 UTC
Khan, A. and N. Saqib. 1993. ‘Exports and Economic Growth: The Pakistan
experience’. International Economic Journal. 7(3): 53-64.
Khan, M. Z. S. 2010. ‘A Model of Bilateral Trade Balance: Extensions and Empirical
Tests’. Economic Analysis & Policy, 40 (3):377-391.
Khan, P. N. and R. M. Ashiq. 2004. Production in Pakistan. Pakistan Journal of
Agricultural Economics. 5 (1):1-16.
Kishore, H. 2009. Effects of India’s Trade Policy on Rice Production and Exports.
Korbel School of International Studies, University of Denver, 2201 South Gaylord
Street, Denver, CO 80209, USA.
Kristjánsdóttir, H. 2005. A Gravity Model for Exports from Iceland. University of
Iceland and CAM. September 2005. Centre for Applied Microeconometrics.
130
Department of Economics, University of Copenhagen.
http://www.econ.ku.dk/CAM/Files/ workingpapers/2005/2005-14.pdf.
Krueger, A.O., M. Schiff, and A. Valdes. 1988. ‘Agricultural Incentives in
Developing Countries: Measuring the Effect of Sectoral and Economy Wide
Policies’. World Bank Economic Review. 2 (3): 733-738.
Krugman, P. 1995. Growing World Trade: Causes and Consequences. Brookings
Papers on Economic Activity: 1, Brookings Institution: 327–362.
Kumar, A. 2010. ‘Exports of Livestock Products from India: Performance,
Competitiveness and Determinants’. Agricultural Economics Research Review. 23:
57-67.
Kumar, A., A. Jabir and S. Harbir. 2001. ‘Trade in Livestock Products in India: Trends,
Performance and Competitiveness’. Indian Journal of Agricultural Economics.
56(4): 653 -667.
Kumar, N. R and R. Mathura. 2007. Performance, Competitiveness and
Determinants of Tomato Export from India. Journal of Agricultural Economics,
Research Review. 20 (Conference Issue): 551-562.
Kuncic, A. 2012. ‘Institutional Determinants of Bilateral Trade: Taking Another Look’.
Advanced Studies in International Economic Policy Research Kiel Institute for the
World Economy Hindenburgufer-66. Working Paper No. 462.D-24105. Kiel,
Germany
Latruffe, L. 2010. Competitiveness, Productivity and Efficiency in the Agricultural
and AgriFood Sectors. OECD Food, Agriculture and Fisheries Papers, No. 30,
OECD Publishing.
Liesner, H. H. 1958. The European Common Market and British Industry. Economic
Journal. 68: 302–16.
Lubinga, M. H. and B. Kiiza. 2013. ‘Exchange Rate Uncertainty and Bilateral Trade
Flows: Insights from Uganda’. Business and Economic Research. 3 (1): 227-239.
Mahmood, A. 2004. ‘Export Competitiveness and Agricultural Comparative
Production Sector: Trends Advantage and of Analysis’. Pakistan Development
Review, Part II. 43(4): 541-561.
131
Martin, W., and C. Pham. 2008. Estimating the Gravity Model when Zero Trade Flows are
Frequant. Retrieved from http://sites.google.com/
site/wmartinweb/gravity_feb_08.pdf
Mehmood, S., M. A. I. Ahmad, Z. Ahmad, and I. H. Bokhari. 2012. ‘Patterns of
comparative Advantage in Chemicals Sectors: A Study on Trade Potential with
Major SAARC Countries’. Interdisciplinary Journal of Contemporary Research in
Business. 4(2): 91-101.
Meijers, H. 2012. ‘Does The Internet Generate Economic Growth, International
Trade, or Both? Maastricht Economic and Social Research Institute on Innovation
and
Technology (UNU MERIT). UNU-MERIT Working Papers. ISSN 1871-9872.
Keizer Karelplein 19, 6211 TC Maastricht, Netherlands. Website:
http://www.merit.unu.edu.
Mohmand, Y. T. and A. Wang. 2013. The Gravity of Pakistan’s Export Performance
in Stratified Sampling. Pak. J. Statist. 29(2): 203-216.
Mohmand, Y. T. and A. Wang. 2013. The Gravity of Pakistan’s Export Performance
in Stratified Sampling. Pak. J. Statist. 29(2): 203-216.
Mustafa, K. 2003. ‘BarriersAgainst Agricultural Export from Pakistan: The Role of WTO
Sanitary and Phytosanitary Agreement’. Pakistan Development Review, 42 (4): part
II.
Mustafa, U. and M. A. Quddus. 2012. ‘Evaluating Global Commodity Price
Fluctuation and Its Implication for Pakistan Agriculture: An Application of Policy
Analysis Matrix’. SANEI Working Paper Series No. 12-09, South Asia Network of
Economic Research Institutes, Dhaka.
Negasi, M. Y. 2009. ‘Trade Effects of Regional Economic Integration in Africa: The
Case of SADC (Evidence from Gravity Modeling Using Disaggregated Data)’.
Services Sector Development and Impact on Poverty Thematic Working Group.
Final version. Department of Economics, Debre Birhan University, Ethiopia.
132
Nwachuku, N., N. Agwu, J. Nwaru, and G. Imonikhe. 2010. Competitiveness and
Determinants of Cocoa Export from Nigeria. Report and Opinon. 2(7):51-54.
Oguledo, V. I. and C. R. Macphee. 1994. ‘Gravity Models: A Reformulation and an
Application to Discriminatory Trade Arrangements’. Applied Economics. 26:
107120.
Paas, T. 2000. Gravity Approach for Modeling Trade Flows between Estonia and
the Main Trading Partners. Working Paper, No. 721, Tartu University Press, Tartu.
Poyhonen, P. 1963. A Tentative Model for the Volume of Trade between Countries.
Weltwertschaftliches Archive. 90: 93-100.
Pöyhönen, P. 1963. Toward A General Theory of International Trade. Ekonomiska
mfundets Tidskrift, Tredje serien, Argang. 16: 69-77.
Prasad, S. 2000. Determinants of Exports in Fiji. Working Paper 2000/04.
Economics Department Reserve Bank of Fiji, Suva, Fiji.
Quddus, M. A. and U. Mustafa. 2011. ‘Comparative Advantage of Major Crops
Production in Punjab: An Application of Policy Analysis Matrix’. The Lahore
Journal of Economics. 16 (1): 63-94.
Rahman, M. 2003. ‘A Panel Data Analysis of Bangladesh’s Trade: The Gravity Model
Approach’. Available at: http://www.etsg.org/ETSG2003/papers/rahman.pdf,
accessed on March 26, 2012
Rahman, M., W. B. Shadat, and N. C. Das. 2006. ‘Trade Potential in Safta: An
Application of Augmented Gravity Model’. Occasional Paper Series 61. Centre for
Policy Dialogue (CPD), House No 40/c, Road No 11 (New), Dhanmondi r/a, Dhaka-
1209. ISSN 1818-1570.
Rakotoarisoa, M. and Gulati, A. 2006.Competitiveness and Trade Potential of India's
Dairy Industry. Food Policy. 31(3): 216-227.
Rauch, J. 1999. Networks versus Markets in International Trade. Journal of
International Economics. 48: 7-35.
133
Riaz, K. 2009. Revealed Comparative Advantage Analysis of Pakistan’s
Agricultural Exports. Pakistan Journal of Applied Economics. 19 (2): 103-127.
Riaz, K. and H. G. P. Jansen. 2012. Spatial Patterns of Revealed Comparative
Advantage of Pakistan’s Agricultural Exports. Pakistan Economic and Social
Review. 50 (2): 120
Richardson D. J., & Zhang, C. 1999. Revealing Comparative Advantage: Chaotic or
Coherent Pattern across Time and Sector and the US Trading Partner? National
Bureau of Economic Research, Working Paper 7212. Trade statistics. From
www.trademap.org (Retrieved April 1, 2013)
Roy, M. and M. I. Rayhan. 2012. ‘Import Flows of Bangladesh: Gravity Model
Approach under Panel Data Methodology’. Dhaka Univ. J. Sci. 60(2): 153-157.
Ruiz, J. M. and J. M. Vilarrubia. 2007. The Wise Use of Dummies in Gravity
Models: Export Potentials in the Euromed Region. Banco De España. Banco De
España, Departamento de Economía Relaciones Internacionales (ERI), Alcalá 48.
Website: http://www.bde.es.
Samaratunga, P., K. Karunagoda and M. Thibbotuwawa. 2007. Mapping and
Analysis of South Asian Agricultural Trade Liberalization Efforts. Chapter II, in
Agricultural
Trade: Planting the seeds of regional liberalization in Asia. A study of Asia-Pacific
Research and Training Network on Trade, UN/ESCAP Studies in Trade and
Investment.
Sanso, M., R. Cuairan and F. Sanz. 1993. Bilateral Trade Flows, the Gravity
Equation, and Functional Form. The Review of Economics and Statistics. 75 (2): 266-
275.
Santos, S. J. M. C. and S. Tenreyro. 2006 .The Log of Gravity. Review of Economics
and Statistics. 88(4): 641-658.
Serlenga, L. and Y. Shin. 2013. ‘The Euro Effect on Intra-EU Trade: Evidence from
the Cross Sectionally Dependent Panel Gravity Models.’ Unpublished mimeo.
Shahbaz, M and N. C. Leitao. 2010. Intra-Industry Trade: The Pakistan Experience.
MPRA Paper No. 28665, posted 06. February 2011 / 07:25.
134
Shahraki. J., M. Sheykhtabar, M. Yaghoubi and A. Sardar. 2012. Determining the
Priority of Target Export Markets, Comparative Advantage and Competitiveness of
Dried Fruit Crops for Iran. International Journal of Agriculture Research and
Review. 2: 10141024.
Sharif, M., U. Mustafa and U. Farooq. 2007. Managing Fresh Fruits Trade under
WTO Scenario: A Case Study of Citrus Export from Pakistan. Pakistan Agricultural
Research Council, Islamabad, Pakistan.
Sikdar, C., T. T. Raa, P. Mohnen, and D. Chakraborty. 2005. India-Bangladesh
Bilateral Trade in the Context of Globalization- A General Equilibrium Approach.
Abstract Submitted for the Fifteenth International Input-Output Conference to be
Held at the Renmin University in Beijing, China.
Suvankulov, F. and W. Ali. 2012. Recent Trends and Prospects of Bilateral Trade
between Pakistan and Turkey: A Gravity Model Approach. Journal of International
and Global Economic Studies. 5(1): 5772
Taylor, D. S. and P. T. Philips. 1991. Food-pricing Policy in Developing Countries:
Further Evidence on Cereal Producer Prices. American Journal of Agricultural
Economics. 73: 1036-1043.
Tesfaye, E. 2011. Determinants of Agricultural Export in Sub-Saharan Africa:
Evidence from Panel Study. A Project Submitted to the School of Economics of
Addis Ababa University in Partial Fulfillment of the Requirements of the Degree of
Master of Arts in Economics, Addis Ababa, Ethiopia.
Tinbergen, J. 1962. Shaping the World Economy: Suggestions for an International
Economic Policy. The Twentieth Century Fund. World Trade Organization. New
York. Website: www.wto.org
Trade Map (TM). 2013. Trade Data Taken from the Webpage: www.trademap.org.
Retrieved on March, 20, 2013
Tweeten, L. 1986. Impact of Domesti Agriculture in the South. MICS, Southern
Journal.18: 67-74.
135
Vollrath, T. L. 1991. A Theoretical Evaluation of Alternative Trade Intensity
Measures of Revealed Comparative Advantage. Weltwirtschaftliches Archiv,
127(2):265-280.
Wooldridge, J. M. 2002. Econometrics Analysis of Cross Section and Panel Data.
288291.The Press Cambridge, Massachusetts, London.
Zada. N., M. Muhammad and K. Bahadar. 2011. Determinants of Exports of Pakistaxn: A
Country-wise Disaggregated Analysis. The Pakistan Development Review. 50(4):
715-732.
Zarzoso, I. M. 2003. ‘Augmented Gravity Model: An Empirical Application to
MercosurEuropean Union Trade Flows’. Journal of Applied Economics. 6 (2): 291-
316.