In due time: Why maternal age matters (PDF document), - …€¦ · pre-existing health conditions...
22
Supporting Factors Influencing Health www.cihi.ca Federal Identity Program Production of this report is made possible by financial contributions from Health Canada and provincial and territorial governments. The views expressed herein do not necessarily represent the views of Health Canada or any provincial or territorial government. September 2011 In Due Time: Why Maternal Age Matters Mothers and newborns in Canada are supported by programs that address their needs from pre-conception to the perinatal period and beyond. Often, these programs target one or more at-risk groups of mothers: those with pre-existing health conditions such as diabetes, hypertension or mental health concerns; women with unhealthy pre-pregnancy weights; Aboriginal women; or women of an age outside the typical child-bearing years (both very young mothers and those delaying childbirth to age 35 and over). Focusing on the group of mothers age 35 and over, this new Canadian Institute for Health Information (CIHI) analysis provides comprehensive Canadian information both on mothers’ and newborns’ health outcomes that are associated with mothers’ age and on the cost drivers of in-hospital care. Pooling three years of hospital data from 2006–2007 through 2008–2009, linking birth records and mothers’ hospital records for all live births, the report explores how age is associated with the following: risks of pregnancy and labour complications; medical or surgical assistance during labour to ensure a safe delivery; and adverse birth outcomes and birth defects. Where data is available, these outcomes are examined for singleton births based on whether it was a women’s first or subsequent live birth. The report adds the age dimension to existing Canadian perinatal surveillance and reporting, which has included reports by the Canadian Perinatal Surveillance System (CPSS), Statistics Canada and CIHI, among others. In addition, it brings to light new information on the hospital costs associated with the delayed reproduction. The study found that, compared with the younger cohort of mothers age 20 to 34, those age 35 and over have higher risks—for both mothers and babies—and that the risks increase with age. The differences between these groups are significant and they drive higher hospital costs. In this analysis, the greatest risks associated with age (for mothers with live births) were among mothers age 40 and over. For first-time mothers age 40 and over, these risks are even more significant.
Transcript of In due time: Why maternal age matters (PDF document), - …€¦ · pre-existing health conditions...

Supporting Factors Influencing Health
www.cihi.ca
Federal Identity Program Production of this report is made possible by financial contributions from Health Canada and provincial and territorial governments. The views expressed herein do not necessarily represent the views of Health Canada or any provincial or territorial government.
September 2011
In Due Time: Why Maternal Age Matters Mothers and newborns in Canada are supported by programs that address their needs from pre-conception to the perinatal period and beyond. Often, these programs target one or more at-risk groups of mothers: those with pre-existing health conditions such as diabetes, hypertension or mental health concerns; women with unhealthy pre-pregnancy weights; Aboriginal women; or women of an age outside the typical child-bearing years (both very young mothers and those delaying childbirth to age 35 and over).
Focusing on the group of mothers age 35 and over, this new Canadian Institute for Health Information (CIHI) analysis provides comprehensive Canadian information both on mothers’ and newborns’ health outcomes that are associated with mothers’ age and on the cost drivers of in-hospital care. Pooling three years of hospital data from 2006–2007 through 2008–2009, linking birth records and mothers’ hospital records for all live births, the report explores how age is associated with the following: risks of pregnancy and labour complications; medical or surgical assistance during labour to ensure a safe delivery; and adverse birth outcomes and birth defects. Where data is available, these outcomes are examined for singleton births based on whether it was a women’s first or subsequent live birth.
The report adds the age dimension to existing Canadian perinatal surveillance and reporting, which has included reports by the Canadian Perinatal Surveillance System (CPSS), Statistics Canada and CIHI, among others. In addition, it brings to light new information on the hospital costs associated with the delayed reproduction.
The study found that, compared with the younger cohort of mothers age 20 to 34, those age 35 and over have higher risks—for both mothers and babies—and that the risks increase with age. The differences between these groups are significant and they drive higher hospital costs. In this analysis, the greatest risks associated with age (for mothers with live births) were among mothers age 40 and over. For first-time mothers age 40 and over, these risks are even more significant.

2 In Due Time: Why Maternal Age Matters
Why Focus on Mothers 35 and Over? Almost one of every five live births in Canada is to a woman age 35 or over.1 This proportion has increased from 15% in 1998 to nearly 18% in 2007, and it is projected to continue to rise. During that same time period, the rate of live births for every 1,000 women increased by 47% for those age 35 to 39 (from 32.9 to 48.5 per 1,000) and by 48% for those age 40 and over (from 2.9 to 4.3 per 1,000). The rate decreased by 29% in women age 15 to 19 and it was relatively stable in the 20 to 34 age group (a 4% increase).2, 3
Equally important, almost one in every three first-time mothers is age 35 or over.
Figure 1: Rate of Live Births per 1,000 Women by Age Group, Canada, 1998 to 2007
Note The rate was age-standardized to the 2001 Canadian female population. Sources Report on the Demographic Situation in Canada 2005 and 2006 and Age-Specific Fertility Rates (Number of Live Births per 1,000 Females in Each Age Group), Canada, Provinces and Territories, Annual (CANSIM Table 102-4505), Statistics Canada.
Literature Findings This CIHI analysis compares four age groups of mothers, based on comparisons made and results found in previous work. The outcomes explored are driven by the significant findings in the peer-reviewed literature. Although international literature exists describing the impact of advanced maternal age on maternal and fetal outcomes,7 most of the work is not Canadian, not all is recent and, in some cases, the data is conflicting. An overview of the findings is presented below.
What are the risks for the mothers? Compared with women under the age of 35, those giving birth at 35 and over are more likely to have pre-existing hypertension and to develop hypertension and pre-eclampsia, a serious pregnancy condition in which high blood pressure and protein in the urine develop after the 20th week of pregnancy.8 They are also more likely to develop diabetes during their pregnancy,9 to experience placenta previa—a complication in which the placenta is located low in the uterus and may block the cervix7, 10—and to
The Demographic Shift Unlike the situation with previous generations, there are powerful economic incentives for today’s young women and men to delay starting a family.4 Women now are continuing their education longer, embarking on and committing to a career, and marrying later. Many couples delay starting a family until they attain a certain level of financial stability (or at least pay off a large part of their student loans).5, 6 With the development of new reproductive technologies and fertility treatments, women are now, more than ever before, able to get pregnant and have children well into their 30s and 40s and sometimes into their 50s.
In Due Time: Why Maternal Age Matters 3
have a Caesarean delivery.11, 12 The literature on placental abruption, a complication in which the placenta prematurely separates from the uterus, is mixed; some researchers found that only women age 40 and over were at an increased risk compared with women under 35.7 Other studies have found that women between 35 and 39, but not those 40 and over, were at an increased risk when compared with women between ages 20 and 24.11
What are the risks for the babies? Studies that have looked at the link between adverse birth outcomes and mothers’ age have shown that women 35 and over face an increased risk of delivering preterm (less than 37 weeks), low birth weight or small-for-gestational-age babies.7, 10 A recent Canadian study found that first-time mothers age 35 and over were at increased risk of preterm births.13 Others have reported that babies born to those at an advanced age are at increased risk of non-chromosomal abnormality,14 chromosomal abnormality and congenital anomaly.7 One study argues that the widespread screening for fetal defects in pregnant women age 35 and over has resulted in fewer live births of infants with congenital anomalies.15
Key Findings Many women have successful, uncomplicated pregnancies and deliveries at age 35 and over. This analysis of live births from 2006–2007 through 2008–2009 revealed that the following risks—grouped here by risks to mothers and risks to newborns—increased with maternal age:
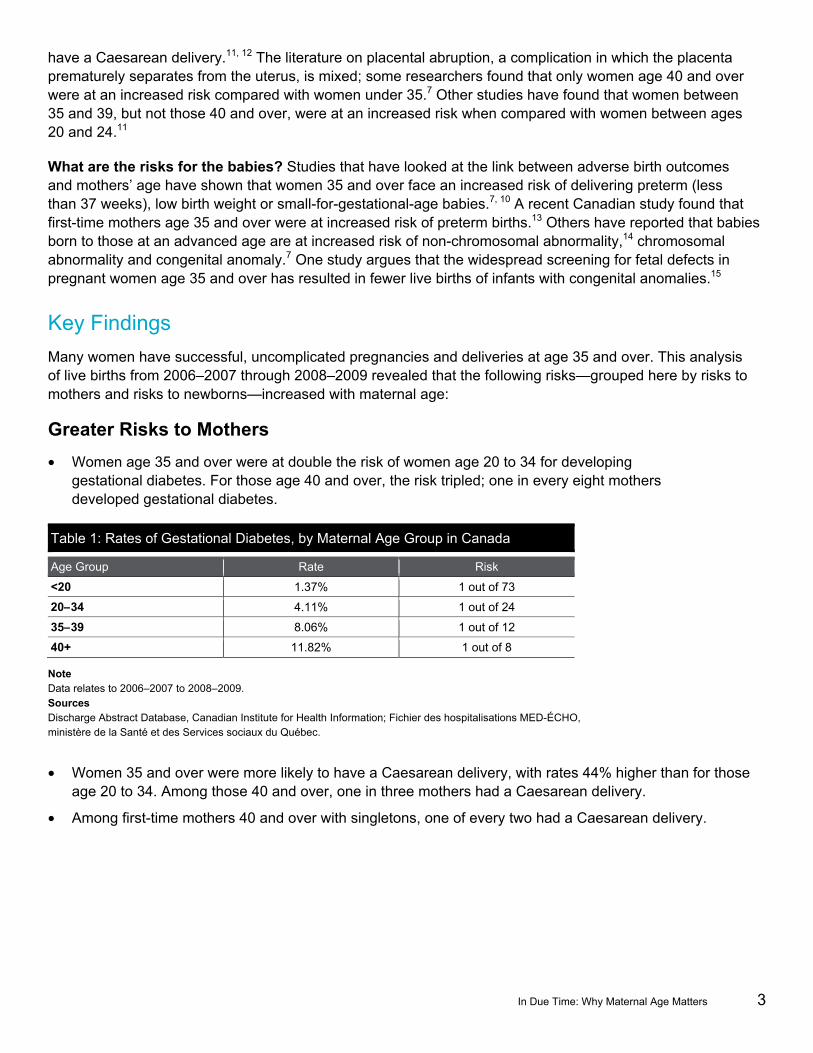
Greater Risks to Mothers • Women age 35 and over were at double the risk of women age 20 to 34 for developing
gestational diabetes. For those age 40 and over, the risk tripled; one in every eight mothers developed gestational diabetes.
Table 1: Rates of Gestational Diabetes, by Maternal Age Group in Canada
Age Group Rate Risk
<20 1.37% 1 out of 73
20–34 4.11% 1 out of 24
35–39 8.06% 1 out of 12
40+ 11.82% 1 out of 8
Note Data relates to 2006–2007 to 2008–2009. Sources Discharge Abstract Database, Canadian Institute for Health Information; Fichier des hospitalisations MED-ÉCHO, ministère de la Santé et des Services sociaux du Québec.
• Women 35 and over were more likely to have a Caesarean delivery, with rates 44% higher than for those age 20 to 34. Among those 40 and over, one in three mothers had a Caesarean delivery.
• Among first-time mothers 40 and over with singletons, one of every two had a Caesarean delivery.

4 In Due Time: Why Maternal Age Matters
Canadian Perinatal Surveillance System The Canadian Perinatal Surveillance System (CPSS) of the Public Health Agency of Canada monitors and reports on key indicators of perinatal health through an ongoing cycle of data collection, expert analysis and interpretation to inform public health action and response. The CPSS’s most recent report, titled What Mothers Say: The Canadian Maternity Experiences Survey, can be downloaded from www.phac-aspc.gc.ca/ rhs-ssg/survey-eng.php.
• Women 35 and over were at double the risk of those 20 to 34 for placenta previa. Among those age 40 and over, placenta previa rates were three times higher than for those age 20 to 34 and more than 10 times higher than for mothers under the age of 20.
Table 2: Rates of Placenta Previa, by Maternal Age Group in Canada
Age Group Rate Risk
<20 0.12% 1 out of 833
20–34 0.48% 1 out of 208
35–39 1.03% 1 out of 97
40+ 1.55% 1 out of 65
Note Data relates to 2006–2007 to 2008–2009. Sources Discharge Abstract Database, Canadian Institute for Health Information; Fichier des hospitalisations MED-ÉCHO, ministère de la Santé et des Services sociaux du Québec.
• First-time mothers 35 and over had the highest rates for many labour complications and interventions. For singleton deliveries, assisted vaginal delivery (by means of forceps or/and vacuum extraction) rates were 28% higher than those for first-time mothers age 20 to 34, and rates of premature separation of the placenta from the uterus were 36% higher; rates for placental abruption were 60% higher among first-time mothers age 40 and over.
Figure 2: Rates of Assisted Vaginal Delivery, by Age Group and Maternal Child-Bearing History in Singleton Births
Notes * Significantly different from the reference group of women age 20 to 34 (p<0.05). Data represents only residents of Ontario, Manitoba, Saskatchewan, Alberta and the territories, as maternal child-bearing history information from other provinces was unavailable. Data relates to 2006–2007 to 2008–2009. Source Discharge Abstract Database, Canadian Institute for Health Information.

In Due Time: Why Maternal Age Matters 5
Increased Risks to Newborns Maternal age also impacts adverse birth outcomes and birth defects.
• Women age 35 and over were at increased risk of preterm births, with rates more than 20% higher than for those age 20 to 34.
Figure 3: Rates of Preterm Births, by Maternal Age Group, Canada
Notes * Significantly different from the reference group of women age 20 to 34 (p<0.05). This analysis excluded live births without known gestational age (0.05%). Data relates to 2006–2007 to 2008–2009. Sources Discharge Abstract Database, Canadian Institute for Health Information; Fichier des hospitalisations MED-ÉCHO, ministère de la Santé et des Services sociaux du Québec.
• First-time mothers 35 and over (7% higher), and particularly those 40 and over (21% higher), were at increased risk of delivering small-for-gestational-age babies compared with their younger counterparts, those age 20 to 34.
• For women 35 and over, the risk of delivering babies with chromosomal defects was fourfold that among younger mothers.
Table 3: Rates of Chromosomal Defect, by Maternal Age Group in Canada
Age Group Rate Risk
<20 0.10% 1 out of 1,000 20–34 0.10% 1 out of 1,000
35–39 0.27% 1 out of 370 40+ 0.79% 1 out of 127
Note Data relates to 2006–2007 to 2008–2009. Sources Discharge Abstract Database, Canadian Institute for Health Information; Fichier des hospitalisations MED-ÉCHO, ministère de la Santé et des Services sociaux du Québec.

6 In Due Time: Why Maternal Age Matters
Regional Variation in Outcomes for Mothers and Babies Across Canada, rates of pregnancy complications, labour complications and the frequency of labour and delivery interventions associated with maternal age varied, as did outcomes for the babies. To improve jurisdiction comparability, the regional analyses focused on singleton births.
• Gestational diabetes rates among women age 35 to 39 were highest in British Columbia (11.0%) and Quebec (9.7%) and lowest in Prince Edward Island (3.5%).
• Compared with the Canadian average of one in eight women age 40 and over developing gestational diabetes, Quebec (one in seven) and British Columbia (closer to one in every six women) had higher rates.
Figure 4: Percentage of Women With Singletons Who Had Gestational Diabetes, by Jurisdiction and Maternal Age, Canada
Notes Rates are significantly higher among mothers age 35 to 39 and 40+ than among mothers age 20 to 34. Data for the three territories was suppressed due to limited sample size. Data relates to 2006–2007 to 2008–2009. Sources Discharge Abstract Database, Canadian Institute for Health Information; Fichier des hospitalisations MED-ÉCHO, ministère de la Santé et des Services sociaux du Québec.

In Due Time: Why Maternal Age Matters 7
• Caesarean delivery rates for women 40 and over were highest in Newfoundland and Labrador (47.9%) and British Columbia (45.6%) and lowest in Manitoba (34.1%). This pattern is consistent with the Caesarean delivery rate variation in other CIHI analyses (see, for example, Health Care in Canada 2010).
Figure 5: Percentage of Women That Delivered Singletons via Caesarean Delivery, by Jurisdiction and Maternal Age, Canada
Notes All rates are significantly higher among mothers age 35 to 39 and 40 and over than among mothers age 20 to 34. Data for the three territories was suppressed due to limited sample size. Data relates to 2006–2007 to 2008–2009. Sources Discharge Abstract Database, Canadian Institute for Health Information; Fichier des hospitalisations MED-ÉCHO, ministère de la Santé et des Services sociaux du Québec.
• Preterm births among mothers 35 and over were highest in Manitoba (8.7%) and Alberta (8.0%) and lowest in Prince Edward Island (5.7%).
• Due to low rates of individual defects, a cumulative measure of any defect was included in the analysis. It includes nervous system, circulatory, respiratory, digestive, urogenital, musculoskeletal and chromosomal defects and others. The rate of any birth defect for newborns of women 35 and over ranged from 8.8% in Quebec to 3.8% in Nova Scotia.
Hospital Costs Associated With Maternal Age • Maternal hospital costs (both mean and median) were higher for both the youngest and the oldest mothers.
The average hospital cost associated with singleton births was $3,185 for mothers age 40 and over, $3,006 for mothers 35 to 39, and $2,870 for mothers 20 to 34.
• The association between maternal hospital cost and age was similar in singleton and multiple births; however, the cost was much higher for multiple births. The average cost for mothers age 40 and over with multiple births was $5,519, compared with $3,185 for mothers with singleton births.

8 In Due Time: Why Maternal Age Matters
• Cost drivers of maternal care included pregnancy and labour complications, Caesarean delivery, labour interventions, preterm delivery and length of hospital stay. The increased rates of these factors for mothers age 35 and over drove the higher costs.
Table 4: Average Maternal Hospital Costs, by Complications and Interventions for Singleton Births Among Women Age 35 and Over, Canada*
Complications and Interventions Average Maternal Care Costs ($)
With Pregnancy Complications 3,687
Without Pregnancy Complications 2,922 With Labour Complications 3,329
Without Labour Complications 2,992 Preterm Labour 4,531
Term Labour 2,938 Caesarean Delivery 3,954
Assisted Vaginal Delivery 3,045 Vaginal Delivery Without Intervention 2,439
Notes * This analysis did not include Quebec. Delivery with pregnancy complication was defined as delivery with any of pre-existing hypertension, gestational hypertension, pre-eclampsia, eclampsia, pre-existing diabetes, gestational diabetes or placenta previa. Delivery with labour complication was defined as labour with either premature rupture of the membrane or placental abruption. Data relates to 2006–2007 to 2007–2008. Sources Discharge Abstract Database and Canadian MIS Database, Canadian Institute for Health Information.
• The average hospital costs for the babies of mothers 35 and over were higher ($1,591 for 35 to 39, $1,838 for 40 and over) than those of mothers 20 to 34 ($1,483).
• Cost drivers for neonatal care that were found to be associated with mother’s age included birth defects, preterm births and small-for-gestational-age births.
• Based on this costing method, the total additional cost to the system associated with in-hospital births among mothers age 35 and over was approximately $61.1 million ($32.2 million for maternal care, $28.9 million for neonatal care) for the three-year period 2006–2007 through 2008–2009.
• Maternal and neonatal hospital costs based on mother’s place of residence varied across Canadian jurisdictions. Maternal care cost for mothers 35 and over ranged from a high of $3,991 in Nova Scotia to $2,818 in Manitoba. The cost of neonatal care for babies born to mothers age 35 and over in Nova Scotia was 76% higher than for those in New Brunswick ($2,652 and $1,503, respectively).

In Due Time: Why Maternal Age Matters 9
Figure 6: Average Maternal and Neonatal Care Costs in Women Age 35 and Over, Singleton Births, by Jurisdiction, Canada*
Notes * This analysis did not include Quebec due to differences in data collection. Data for the three territories was suppressed due to limited sample size. Data relates to 2006–2007 to 2007–2008. Sources Discharge Abstract Database and Canadian MIS Database, Canadian Institute for Health Information.
Implications for Policy, Planning and Provision of Care Information in this study will be of interest to maternal and perinatal health program planners and managers making decisions about program priorities, and to those making decisions at the system level about system priorities. It will also be of interest to those advising and caring for women from pre-conception through the perinatal period. Women considering postponing starting a family, or contemplating pregnancy at 35 or over, may also find the information of interest. Finally, the trend of older first-time mothers and delayed reproduction resulting in smaller families (and sub-replacement fertility rates) in Canada may be of interest to the larger group of policy-makers in the social and economic policy arenas.
Awareness of Risks. Providing women and their partners with factual information on the various risk factors that affect pregnancy, including age, may influence decisions about when to start a family. Patient education, testing and counselling for those considering starting or growing their family that begins in pre-conception and continues through the prenatal period can support women in the decisions they make. Information from this analysis may inform women and help physicians and other care providers talk with women, before and during pregnancy, about the age-associated risks that they will face, and that their babies will also face, during pregnancy and labour.
Hospital Resource Planning. More women are having babies later in life, and hospital costs associated with maternal and neonatal care are higher for mothers age 35 and over. The highest costs are associated with those 40 and over—especially women having multiples. The information in this report may inform resource allocation at the regional and facility levels.

10 In Due Time: Why Maternal Age Matters
Health System Planning. Rates of preterm births, small-for-gestational age births, birth defects and chromosomal abnormalities are higher among the newborns of mothers age 35 and over and especially among newborns of mothers age 40 and over, compared with the newborns of younger mothers. Researchers who have looked at the longer-term outcomes for premature newborns have found both increased risk of mortality throughout childhood16 and increased disability in adulthood.17 The Royal College of Obstetricians and Gynaecologists (RCOG) study group on reproductive aging in 2009 recommended that because of the health risks, governments should “alert society to the public health implications so that incentive and barriers to earlier reproduction are examined.”18
Tools and Guidelines. Care maps, checklists and practice guidelines are available to providers of maternal care. Some address considerations for women of advanced maternal age, such as recommending additional screening and monitoring. The Society of Obstetricians and Gynaecologists of Canada (SOGC) does not have specific guidelines targeted to older mothers; however, the book it developed, Healthy Beginnings: Giving Your Baby the Best Start From Preconception to Birth does address postponed pregnancy.19 The RCOG recommends that interventions in pregnant women age 40 or over be based on evidence of known risks and proven benefits and recommends that a guideline on the management of pregnancy in women age 40 or over could serve to inform women and practitioners of the evidence and guide practice.18 The information in the present report, available at the pan-Canadian level, can inform these tools.
Outcomes and Health System Performance. Maternal and newborn complications, interventions and outcomes associated with mother’s age vary across Canadian jurisdictions. This comparable data establishes a pan-Canadian baseline and may provide valuable information for performance benchmarking and program planning in addition to targeting those most at need.
Better Data. Considerable investment is being made in e-health strategies, in particular in electronic patient record systems. These new systems may provide an opportunity for the systematic collection of information on factors known to increase the risks for both the mother and child. Information on behaviours such as smoking and drinking, pre-pregnancy weight, and nutritional habits would enhance the ability of future studies of risks in all maternal age groups and provide additional information for targeted patient education at the point of care. The systematic gathering of information about the prenatal care and screening received by women through their pregnancies could further understanding of the variability in outcomes across Canada.
Conclusion Maternal age has an impact on the health of mothers, their babies, health system use and costs. Increasing birth rates among women who are in their 30s and 40s are expected to continue and, as a result, costs for maternal and newborn care driven by higher rates of complications and interventions in this age cohort also are expected to continue to rise. Together, these trends may have implications for care provision, system management and broader social policy.
Selected outcomes at the provincial and regional health authority levels for mothers and newborn are available at www.cihi.ca.

In Due Time: Why Maternal Age Matters 11
Data Tables
Table 5: Percentage of Live Births, by Maternal Age Group and Jurisdiction, Canada
Jurisdiction Number of Live Births
Age Distribution (%)
<20 20–34 35–39 40+
British Columbia 127,540 3.5 74.2 18.4 3.9
Alberta 144,187 5.0 79.7 12.9 2.4
Saskatchewan 39,389 10.0 79.8 8.7 1.5
Manitoba 44,875 9.0 77.6 11.3 2.1
Ontario 411,094 3.7 75.3 17.4 3.6
Quebec 249,204 2.8 82.0 12.8 2.4
New Brunswick 21,610 6.5 81.7 10.3 1.5
Nova Scotia 26,362 6.0 78.4 13.4 2.2
Prince Edward Island 4,253 5.2 78.7 14.0 2.1
Newfoundland and Labrador 13,738 5.9 79.9 12.5 1.7
Yukon 1,061 6.2 75.5 15.0 3.3
Northwest Territories 2,143 9.5 75.9 12.1 2.5
Nunavut 2,301 23.5 69.9 5.6 1.1
Canada 1,087,757 4.3 77.8 15.0 2.9
Note Data relates to 2006–2007 to 2008–2009. Sources Discharge Abstract Database, Canadian Institute for Health Information; Fichier des hospitalisations MED-ÉCHO, ministère de la Santé et des Services sociaux du Québec.
Table 6: Rates of Pregnancy Complications, Labour Complications and Interventions, by Maternal Age Group, Canada
Complications and Interventions
Rate and 95% Confidence Intervals, by Age Group (per 100 Live Births)
<20 20–34 35–39 40+
Gestational Hypertension 3.5 (3.4–3.7) 3.9 (3.8–3.9) 4.2 (4.1–4.3) 5.6 (5.4–5.9)
Pre-Eclampsia/Eclampsia 1.8 (1.7–1.9) 1.2 (1.1–1.2) 1.2 (1.2–1.3) 1.6 (1.5–1.8)
Gestational Diabetes 1.4 (1.3–1.5) 4.1 (4.1–4.2) 8.1 (7.9–8.2) 11.8 (11.5–12.2)
Placenta Previa 0.1 (0.1–0.2) 0.5 (0.5–0.5) 1.0 (1.0–1.1) 1.6 (1.4–1.7)
Placental Abruption 1.1 (1.0–1.2) 1.3 (1.3–1.3) 1.5 (1.4–1.6) 1.9 (1.7–2.0)
Caesarean Delivery 16.1 (15.7–16.4) 25.2 (25.1–25.3) 35.3 (35.0–35.5) 41.4 (40.9–42.0)
Assisted Vaginal Delivery 14.9 (14.6–15.3) 14.5 (14.4–14.5) 13.9 (13.7–14.1) 14.3 (13.8–14.8)
Note Data relates to 2006–2007 to 2008–2009. Sources Discharge Abstract Database, Canadian Institute for Health Information; Fichier des hospitalisations MED-ÉCHO, ministère de la Santé et des Services sociaux du Québec.

12 In Due Time: Why Maternal Age Matters
Table 7: Rates of Pregnancy Complications, Labour Complications and Interventions, by Mother’s Child-Bearing History in Singleton Births
Complications and Interventions Rate and 95% Confidence Intervals, by Age Group (per 100 Live Births)
<20 20–34 35–39 40+
First-Time Mother
Gestational Hypertension 4.0 (3.8–4.3) 5.7 (5.6–5.8) 7.0 (6.7–7.4) 8.6 (7.8–9.4)
Pre-Eclampsia/Eclampsia 1.9 (1.7–2.1) 1.6 (1.5–1.6) 2.0 (1.8–2.2) 2.6 (2.2–3.1)
Gestational Diabetes 1.2 (1.1–1.3) 3.4 (3.4–3.5) 6.9 (6.6–7.2) 9.4 (8.6–10.3)
Placenta Previa 0.1 (0.1–0.2) 0.4 (0.4–0.5) 1.2 (1.1–1.3) 2.0 (1.7–2.5)
Placental Abruption 1.0 (0.9–1.1) 1.0 (1.0–1.0) 1.3 (1.2–1.4) 1.6 (1.3–2.0)
Caesarean Delivery 16.1 (15.6–16.5) 27.1 (26.9–27.3) 41.3 (40.7–41.9) 52.9 (51.5–54.3)
Assisted Vaginal Delivery 17.4 (16.9–17.9) 25.3 (25.0–25.5) 32.1 (31.4–32.9) 34.0 (32.1–36.0)
Women With Previous Live Birth Gestational Hypertension 1.4 (1.1–1.7) 2.7 (2.6–2.7) 3.5 (3.4–3.6) 4.8 (4.4–5.2)
Pre-Eclampsia/Eclampsia 0.3 (0.2–0.5) 0.5 (0.5–0.6) 0.7 (0.6–0.8) 1.1 (0.9–1.3)
Gestational Diabetes 1.3 (1.0–1.6) 3.7 (3.6–3.8) 7.0 (6.9–7.2) 10.4 (9.9–10.9)
Placenta Previa 0.2 (0.1–0.3) 0.5 (0.5–0.5) 1.0 (0.9–1.0) 1.4 (1.2–1.6)
Placental Abruption 1.5 (1.1–1.8) 1.1 (1.1–1.1) 1.1 (1.1–1.2) 1.4 (1.3–1.7)
Caesarean Delivery 13.5 (12.5–14.5) 23.1 (22.9–23.2) 32.4 (32.1–32.8) 36.7 (35.9–37.5)
Assisted Vaginal Delivery 4.1 (3.5–4.7) 6.4 (6.3–6.5) 8.2 (8.0–8.5) 9.7 (9.1–10.3)
Notes Data represents only residents of Ontario, Manitoba, Saskatchewan, Alberta and the territories, as maternal child-bearing history information from other provinces was unavailable. Data relates to 2006–2007 to 2008–2009. Source Discharge Abstract Database, Canadian Institute for Health Information.
Table 8: Rates of Adverse Birth Outcomes and Birth Defects, by Maternal Age Group, Canada
Birth Defects Rate and 95% Confidence Intervals, by Age Group (per 100 Live Births)
<20 20–34 35–39 40+
Preterm Birth 8.1(7.9–8.4) 7.7(7.6–7.7) 9.0 (8.9–9.2) 11.0 (10.6–11.3)
Small-for-Gestational-Age Birth* 11.9 (11.6–12.2) 10.0 (9.9–10.1) 9.1 (8.9–9.2) 10.5 (10.2–10.9)
Overall: Any Defect 5.7 (5.5–5.9) 6.0 (5.9–6.0) 6.0 (5.9–6.1) 6.7 (6.4–6.9)
Nervous System Defects 0.2 (0.2–0.3) 0.1 (0.1–0.2) 0.2 (0.1–0.2) 0.2 (0.2–0.3)
Circulatory and Respiratory Defects 1.3 (1.2–1.4) 1.2 (1.2–1.2) 1.3 (1.3–1.4) 1.8 (1.6–1.9)
Digestive Defects 1.1 (1.0–1.2) 1.2 (1.1–1.2) 1.2 (1.1–1.2) 1.1 (1.0–1.3)
Urogenital Defects 1.0 (1.0–1.1) 1.2 (1.2–1.3) 1.3 (1.3–1.4) 1.4 (1.3–1.5)
Musculoskeletal Defects 1.6 (1.5–1.7) 1.6 (1.6–1.6) 1.3 (1.3–1.4) 1.4 (1.2–1.5)
Chromosomal Defects 0.1 (0.1–0.1) 0.1 (0.1–0.1) 0.3 (0.3–0.3) 0.8 (0.7–0.9)
Notes * Small-for-gestational-age birth was restricted to live singleton and twin births. Data relates to 2006–2007 to 2008–2009. Sources Discharge Abstract Database, Canadian Institute for Health Information; Fichier des hospitalisations MED-ÉCHO, ministère de la Santé et des Services sociaux du Québec.

In Due Time: Why Maternal Age Matters 13
Table 9: Rates of Adverse Birth Outcomes and Birth Defects by Age Group and Maternal Child-Bearing History in Singleton Births
1
Birth Defects Rate and 95% Confidence Intervals, by Age Group (per 100 Live Births)
<20 20–34 35–39 40+
First Live Birth
Preterm Birth 7.0 (6.7–7.3) 7.0 (6.9–7.1) 8.9 (8.6–9.3) 10.8 (9.9–11.7)
Small-for-Gestational-Age Birth* 12.5 (12.1–12.9) 12.7 (12.5–12.8) 13.3 (12.9–13.7) 15.4 (14.4–16.5)
Overall: Any Defect 5.5 (5.2–5.8) 5.5 (5.4–5.6) 6.1 (5.8–6.4) 7.3 (6.5–8.0)
Nervous System Defects 0.2 (0.2–0.3) 0.1 (0.1–0.2) 0.1(0.1–0.2) 0.3 (0.1–0.5)
Circulatory and Respiratory Defects 1.2 (1.0–1.3) 1.2 (1.1–1.2) 1.3 (1.2–1.5) 1.9 (1.5–2.3)
Digestive Defects 1.2 (1.1–1.4) 1.4 (1.4–1.5) 1.6 (1.5–1.8) 1.6 (1.3–2.0)
Urogenital Defects 1.0 (0.8–1.1) 1.1 (1.1–1.2) 1.4 (1.2–1.5) 1.5 (1.2–1.9)
Musculoskeletal Defects 1.5 (1.3–1.6) 1.3 (1.2–1.3) 1.2 (1.1–1.3) 1.5 (1.2–1.9)
Chromosomal Defects 0.1 (0.1–0.2) 0.1 (0.1–0.1) 0.3 (0.2–0.3) 0.7 (0.5–0.9)
Subsequent Live Birth
Preterm Birth 8.5 (7.7–9.3) 5.8 (5.7–5.9) 6.7 (6.5–6.8) 8.3 (7.8–8.7)
Small-for-Gestational-Age Birth* 7.7 (6.9–8.5) 8.3 (8.2–8.4) 7.8 (7.6–8.0) 9.3 (8.8–9.8)
Overall: Any Defect 4.5 (4.0–5.1) 4.5 (4.4–4.6) 4.8 (4.6–5.0) 5.6 (5.3–6.0)
Nervous System Defects 0.2 (0.1–0.4) 0.1 (0.1–0.1) 0.1 (0.1–0.2) 0.2 (0.1–0.3)
Circulatory and Respiratory Defects 1.2 (0.9–1.5) 1.0 (1.0–1.1) 1.1 (1.1–1.2) 1.7 (1.5–1.9)
Digestive Defects 0.8 (0.6–1.1) 1.1 (1.0–1.1) 1.1 (1.1–1.2) 1.1 (1.0–1.3)
Urogenital Defects 0.7 (0.5–0.9) 0.9 (0.9–1.0) 1.0 (0.9–1.1) 1.0 (0.8–1.1)
Musculoskeletal Defects 1.1 (0.8–1.4) 0.9 (0.8–0.9) 0.8 (0.7–0.9) 1.0 (0.8–1.2)
Chromosomal Defects 0.04 (0.0–0.2) 0.1 (0.1–0.1) 0.3 (0.2–0.3) 1.0 (0.8–1.1)
Notes * Small-for-gestational-age birth was restricted to live singleton and twin births. Data represents only residents of Ontario, Manitoba, Saskatchewan, Alberta and the territories, as maternal child-bearing history information from other provinces was unavailable. Data relates to 2006–2007 to 2008–2009. Source Discharge Abstract Database, Canadian Institute for Health Information.

14 In Due Time: Why Maternal Age Matters
Notes * Small-for-gestational-age birth was restricted to live singleton and twin births. NS: not significant. Data relates to 2006–2007 to 2008–2009. Sources Discharge Abstract Database, Canadian Institute for Health Information; Fichier des hospitalisations MED-ÉCHO, ministère de la Santé et des Services sociaux du Québec.
Table 10: Odds Ratios and 95% Confidence Intervals for Outcomes Associated With Maternal Age, Income Quintile and Residence in Singletons, Canada
Outcome
Maternal Age Groups
(Years, Versus 20–34 Age Group)
Neighbourhood Income Quintile Least Affluent
(Versus Most Affluent)
Rural Residents (Versus
Urban Residents) <20 35–39 40+
Pregnancy Complications Gestational Hypertension 0.91 (0.86–0.96) 1.10 (1.07–1.13) 1.46 (1.38–1.53) NS 1.12 (1.09–1.15)
Pre-Eclampsia/Eclampsia 1.57 (1.46–1.69) 1.06 (1.01–1.11) 1.43 (1.30–1.58) 1.20 (1.13–1.28) 1.26 (1.21–1.32)
Gestational Diabetes 0.32 (0.29–0.35) 2.19 (2.14–2.25) 3.32 (3.19–3.46) 2.06 (1.99–2.14) 0.66 (0.64–0.69)
Placenta Previa 0.26 (0.20–0.34) 2.14 (2.01–2.27) 3.23 (2.93–3.56) NS 0.88 (0.82–0.95)
Labour Complications and Interventions Placental Abruption 0.84 (0.76–0.92) 1.17 (1.12–1.23) 1.43 (1.31–1.56) 1.16 (1.10–1.23) 0.92 (0.88–0.96)
Caesarean Delivery 0.58 (0.56–0.59) 1.61 (1.59–1.62) 2.08 (2.04–2.13) NS 0.94 (0.93–0.95)
Assisted Vaginal Delivery 1.23 (1.19–1.27) 0.80 (0.78–0.82) 0.74 (0.71–0.77) 0.96 (0.94–0.98) 0.80 (0.79–0.82)
Adverse Birth Outcomes Preterm Birth 1.15 (1.11–1.20) 1.15 (1.12–1.17) 1.42 (1.36–1.48) 1.29 (1.26–1.32) NS
Small-for-Gestational-Age Birth* 1.16 (1.13–1.20) 0.91 (0.89–0.92) 1.05 (1.01–1.09) 1.36 (1.33–1.39) 0.83 (0.82–0.85)
Birth Defects Overall: Any Defect NS NS 1.11 (1.05–1.16) NS NS
Nervous System Defects 1.50 (1.22–1.86) 1.17 (1.02–1.35) 1.66 (1.29–2.14) 1.34 (1.14–1.58) NS
Circulatory or Respiratory Defects NS 1.12 (1.07–1.18) 1.48 (1.35–1.62) 1.26 (1.19–1.34) 1.07 (1.02–1.12)
Digestive Defects NS NS NS 0.87 (0.82–0.93) NS
Urogenital Defects 0.85 (0.78–0.94) NS NS NS 0.89 (0.84–0.93)
Musculoskeletal Defects NS 0.83 (0.79–0.87) 0.82 (0.74–0.90) NS 1.06 (1.02–1.10)
Chromosomal Defects NS 2.83 (2.51–3.20) 8.46 (7.32–9.79) 1.38 (1.16–1.62) 1.15 (1.01–1.32)

In Due Time: Why Maternal Age Matters 15
Notes * Small-for-gestational-age birth was restricted to live singleton and twin births. NS: not significant. This analysis includes data only for residents of Ontario, Manitoba, Saskatchewan, Alberta and the territories, as maternal child-bearing history information from other provinces was unavailable. Analyses were adjusted for neighbourhood income quintile, and rural/urban residence. Data relates to 2006–2007 to 2008–2009. Sources Discharge Abstract Database, Canadian Institute for Health Information; Fichier des hospitalisations MED-ÉCHO, ministère de la Santé et des Services sociaux du Québec.
Table 11: Odd Ratios and 95% Confidence Intervals for Outcomes Associated With Maternal Age in Singletons, Stratified by Maternal Child-Bearing History
Outcome
Maternal Age Groups (Years, Versus 20–34 Age Group)
First-Time Mothers Women With Previous Live Birth
<20 35–39 40+ <20 35–39 40+
Pregnancy Complications Gestational Hypertension 0.67 (0.63–0.72) 1.27 (1.21–1.34) 1.56 (1.40–1.73) 0.47 (0.37–0.61) 1.36 (1.29–1.42) 1.87 (1.73–2.03)
Pre-Eclampsia/Eclampsia 1.11 (1.01–1.22) 1.36 (1.24–1.50) 1.82 (1.52–2.18) 0.58 (0.35–0.95) 1.42 (1.28–1.58) 2.20 (1.86–2.61)
Gestational Diabetes 0.32 (0.29–0.36) 2.13 (2.02–2.25) 2.98 (2.70–3.30) 0.30 (0.23–0.39) 2.07 (2.00–2.15) 3.13 (2.95–3.32)
Placenta Previa 0.25 (0.17–0.37) 2.62 (2.30–2.99) 4.67 (3.78–5.77) 0.33 (0.16–0.66) 1.93 (1.76–2.13) 2.86 (2.46–3.33)
Labour Complications and Interventions Placental Abruption NS 1.33 (1.18–1.49) 1.68 (1.34–2.11) NS NS 1.32 (1.14–1.53)
Caesarean Delivery 0.51 (0.49–0.53) 1.90 (1.85–1.95) 3.03 (2.86–3.21) 0.54 (0.50–0.59) 1.57 (1.55–1.60) 1.91 (1.84–1.98)
Assisted Vaginal Delivery 0.77 (0.75–0.80) NS 0.84 (0.77–0.90) 0.73 (0.62–0.85) 1.12 (1.08–1.16) 1.24 (1.16–1.33)
Adverse Birth Outcomes Preterm Birth NS 1.31 (1.25–1.37) 1.61 (1.47–1.77) 1.37 (1.24–1.52) 1.19 (1.15–1.24) 1.49 (1.40–1.59)
Small-for-Gestational- Age Birth* NS NS 1.22 (1.12–1.33) 0.87 (0.78–0.97) NS 1.12 (1.05–1.19)
Birth Defects Overall: Any Defect NS 1.12 (1.06–1.18) 1.35 (1.20–1.50) NS 1.09 (1.05–1.13) 1.29 (1.20–1.39)
Nervous System Defects 1.58 (1.19–2.11) NS 2.16 (1.24–3.78) NS 1.41 (1.12–1.78) 1.95 (1.32–2.88)
Circulatory or Respiratory Defects NS 1.15 (1.03–1.29) 1.69 (1.37–2.09) NS 1.16 (1.07–1.26) 1.67 (1.46–1.92)
Digestive Defects NS 1.16 (1.04–1.28) NS NS NS NS
Urogenital Defects 0.85 (0.74–0.97) 1.25 (1.12–1.40) 1.31 (1.03–1.66) NS 1.11 (1.02–1.21) NS
Musculoskeletal Defects NS NS NS NS NS NS
Chromosomal Defects NS 2.47 (1.89–3.24) 6.23 (4.30–9.03) NS 2.94 (2.44–3.55) 10.14 (8.23–12.50)

16 In Due Time: Why Maternal Age Matters
Table 12: Maternal and Neonatal Care Costs ($) and Length of Stay for Singleton Birth, Canada
Maternal Age Group (Years) Total Volume Percentage of Typical Cases
LOS and Cost for Typical Cases
Average LOS (Days) Mean Cost ($) Median Cost ($)
Maternal Care <20 25,813 94.35 2.48 2,936 2,645
20–34 411,405 96.75 2.27 2,870 2,532
35–39 82,205 96.73 2.35 3,006 2,697
40+ 15,989 95.92 2.53 3,185 2,857
Neonatal Care <20 25,816 95.52 2.69 1,656 772
20–34 411,419 97.07 2.41 1,483 795
35–39 82,220 96.83 2.54 1,591 909
40+ 15,996 95.91 2.88 1,838 1,046
Notes This analysis did not include Quebec due to differences in data collection. It was limited to deliveries that led to live births and discharges to home from an acute care facility. Only typical cases were included for LOS and cost analysis. The calculated cost does not include fee-for-service physician compensation through the provincial/territorial ministry of health; however, it includes physician compensation paid by the hospital. Data relates to 2006–2007 to 2007–2008. Sources Discharge Abstract Database and Canadian MIS Database, Canadian Institute for Health Information.

In Due Time: Why Maternal Age Matters 17
Essential Information About This Study Data Sources Two databases were used in the analysis: CIHI’s Discharge Abstract Database (DAD) and the Fichier des hospitalisations MED-ÉCHO, from the ministère de la Santé et des Services sociaux du Québec. MED-ÉCHO contains demographic, administrative and clinical data for all the inpatient acute care hospital discharges in Quebec. Currently, there are more than 650,000 records submitted annually. The DAD includes all hospital discharges from Canadian jurisdictions outside of Quebec and day surgery in selected jurisdictions. Currently, more than 3 million records are submitted to the DAD annually. Each patient-level record captures standard clinical, demographic and administrative data.
Study Methodology Both DAD and MED-ÉCHO records were selected based on newborns’ discharge dates in fiscal years 2006–2007 through 2008–2009 and were linked to their mothers’ discharge abstracts. In the event a mother was discharged before her baby (for example, baby was discharged from hospital in 2006–2007 but mother was discharged in 2005–2006), records for mothers from the 2005–2006 DAD and MED-ÉCHO were included in the linkage.
A total of 1,070,338 deliveries with live birth(s) were included in this study. The average maternal age was 29 years. To facilitate comparison with other studies and to explore the risks associated with advanced maternal age (AMA), maternal age was stratified into four categories: younger than 20 years (4.3% of the study population); 20 to 34 years (77.8%); 35 to 39 years (15.0%); and 40 years of age and over (2.9%).
Information is presented based on mother’s place of residence, which may differ from place of hospitalization. The Postal Code Conversion File (PCCF) from Statistics Canada was used to assign urban/rural residence and neighbourhood income quintile information using the 2001 census. Alternative methods were used to assign patients with a retired or incomplete postal code.
Seven jurisdictions (Ontario, Manitoba, Saskatchewan, Alberta, the Yukon, the Northwest Territories and Nunavut) report previous live births, previous term delivery and previous preterm delivery to CIHI’s DAD, which was used to define the child-bearing history of women. The analysis of singletons stratified by maternal child-bearing history was restricted to these seven jurisdictions.
In the study, small-for-gestational-age birth was defined using birth weight percentile by gestational age and sex in all Canadian live births delivered in hospitals between 2006–2007 and 2008–2009 based on DAD and MED-ÉCHO data (data available upon request). The rates were limited to singleton births of known birth weight and sex with a gestational age between 22 and 42 weeks, and to twin births of known birth weight and sex with gestational age between 22 and 40 weeks.
In this study, we present the crude rates for selected outcomes by maternal age group for the jurisdictional comparisons. Among the age group 35 and over, 83.7% are between 35 and 39, 15.6% between 40 and 44, and 0.7% 45 and above. Although there was some variation in age distribution for women 35 and over among the provinces and territories, standardization had little effect on the rates.
Socio-economic status may affect the observed association between advanced maternal age and perinatal outcomes. Given that neighbourhood income quintiles and place of residence (urban or rural) may be linked to these maternal complications and interventions and birth outcomes, odds ratios and corresponding 95% confidence intervals associated with maternal age 35 and over were calculated controlling for these two variables.

18 In Due Time: Why Maternal Age Matters
Limitations The use of assisted reproductive technology may be a potential confounder in the observed association between advanced maternal age and perinatal outcomes. Information on this technology is not available in CIHI’s databases for the entire study period. Likewise, CIHI’s databases do not have information on personal behaviours, such as smoking, alcohol consumption and access to prenatal care. As a result, we were not able to control for them. Additionally, women with advanced maternal age may be more likely to be monitored closely, therefore detecting more medical conditions and complications and adverse birth outcomes. This study was restricted to live births that took place in a hospital. Some pregnancies might be terminated due to maternal and newborn health problems. The rate of some outcomes, such as birth defects, may therefore be underestimated.
Cost Analysis Case Mix Methodology
Hospital costs for labour and delivery and neonatal care were calculated using CIHI’s relative resource intensity weights (RIWs), which are based on CIHI’s Case Mix methodology, CMG+. CMG+ aggregates acute care in-patients with similar clinical and resource utilization characteristics into Case Mix Groups. These groups are then used to measure RIWs.
RIWs are a relative cost weight value, calculated and updated annually. Quebec is excluded from the calculations because its estimated RIW values are not comparable with those for the rest of Canada due to differences in data collection.
Cost per weighted case (CPWC) provides a measure of the relative cost of providing acute inpatient care. This indicator compares a hospital’s total acute inpatient care expenses with the number of acute inpatient weighted cases related to the inpatients for which it provided care. In this report, the hospital-specific CPWC was linked with each related discharge. CPWC for 2008–2009 was not available at the time of the analysis; therefore, the cost analysis in this report was based on data from 2006–2007 to 2007–2008 in all jurisdictions except Quebec.
The costs include portions of hospital overhead costs, nursing care, other personnel salaries, drug costs, diagnostic and laboratory costs, medical supplies and equipment costs. They do not include fee-for-service physician compensation, readmission costs and out-of-pocket expenses for non-insured care, outpatient care and home care expenses.
Estimate of Total Cost = CPWC x Total Weight Cases
In this study, we also estimated the total additional maternal and neonatal cost to the health care system associated with in-hospital deliveries to mothers age 35 and over. The additional cost was calculated based on average maternal and neonatal cost differences between women 35 and over and those 20 to 24 and the total number of women age 35 and over in this study across Canada.
Focus on Typical Cases
The cost analysis in this report was restricted to typical cases. Patients who died (deaths), those who were transferred to and/or from other acute care institutions (transfers), those whose total length of stay exceeded the trim point (long-stay), and those who signed out before completing their recommended course of care (sign-outs) are considered atypical cases and excluded from the cost analysis.

In Due Time: Why Maternal Age Matters 19
Beyond Typical Cases
Because the methodology of cost analysis was based on typical cases, the cost analysis presented tells only part of the story. Fewer than 5% of mothers and babies were atypical cases in singleton delivery, whereas atypical cases accounted for 13% to 19% in mothers and 18% to 25% in babies across different age groups in multiple births. The average RIWs for atypical cases were significantly higher than those for typical cases. For example, in singleton births, the average RIWs in atypical cases were 2.4 times as high as those in typical cases for labour and delivery (1.36 versus 0.57) and 7.1 times for neonatal care (2.13 versus 0.30).
Most atypical maternal cases were classified as such due to a long stay and transfer to and/or from other acute care institutions.
Most atypical newborn cases were transfers to and/or from another acute care institution and had long stays. More than 12% of multiple births were flagged as atypical cases due to a transfer between institutions, which is a much higher proportion than for singleton births.
Acknowledgements CIHI would like to acknowledge and thank the individuals and organizations that contributed to the development of this report, in particular the external experts who provided feedback and advice on the report and analysis:
Dr. Juan Andrés León, Chief, Maternal and Infant Health Section, Public Health Agency of Canada
Dr. Michael Kramer, Professor, Department of Epidemiology, Biostatistics and Occupational Health, McGill University Faculty of Medicine
Dr. Reg S. Sauve, Chair, Canadian Perinatal Surveillance System (CPSS); Professor, Paediatrics and Community Health Sciences, University of Calgary
Dr. Mark Walker, Senior Scientist, Ottawa Hospital Research Institute; Associate Professor, Department of Obstetrics and Gynecology, Division of Maternal and Fetal Medicine, University of Ottawa
CIHI team members that contributed to this report include Xi-Kuan (Sean) Chen, Colleen Dwyer, Joanne Hader, Jacqueline Kurji, Carrie Lee, Derek Lefebvre, Isac Lima, Megan Mueller, Ashoke Roy and Razia Sultana.

20 In Due Time: Why Maternal Age Matters
Glossary20, 21 assisted vaginal delivery: Vaginal deliveries assisted by means of forceps or/and vacuum extraction.
eclampsia: Seizures (convulsions) in a pregnant woman not related to a pre-existing brain condition. Eclampsia follows pre-eclampsia, a serious complication of pregnancy that includes high blood pressure, excess and rapid weight gain, and excess protein in the urine (proteinuria) as a result of kidney problems.
gestational diabetes: Diabetes that develops or is first diagnosed during pregnancy when the body is not able to make enough insulin. The lack of insulin causes the blood glucose level to become higher than normal. Gestational diabetes is managed by controlling blood sugar levels.
gestational hypertension: High blood pressure in the absence of excess protein in the urine, at or after 20 weeks’ gestation in a woman who previously did not have high blood pressure. High blood pressure can cause low birth weight and early delivery.
placenta previa: A complication of pregnancy in which the placenta remains in the lowest part of the womb (uterus) and covers all or part of the opening of the cervix. Bleeding is the main complication. The placenta often moves away from the cervical opening before delivery, though many deliver by Caesarean section.
placental abruption (also known as abruptio placenta): The separation of the placenta (the organ that nourishes the fetus) from its attachment to the uterus wall before the baby is delivered. Risk factors include diabetes, high blood pressure and previous history of placental abruption.
preterm births: Newborns with gestational age at birth of less than 37 weeks.
small-for-gestational-age (SGA) births: SGA means that the fetus or newborn is smaller in size than normal for the baby’s gender and gestational age, measured as newborns with birth weight less than the 10th percentile cut-off specific to that gestational age and gender. Different birth weight percentile charts for gestational age and gender are generally used for singletons, twins and higher-order multiple births.

In Due Time: Why Maternal Age Matters 21
References 1. Statistics Canada, Live Births, by Age of Mother, Canada, Provinces and Territories, Annual (CANSIM
Table 102-4503), last modified 2009, accessed on February 2, 2010, from<http://cansim2.statcan.gc.ca/ cgi-win/cnsmcgi.exe?Lang=E&CNSM-Fi=CII/CII_1-eng.htm>.
2. Statistics Canada, Crude Birth Rate, Age-Specific and Total Fertility Rates (Live Births), Canada, Provinces and Territories, Annual (CANSIM Table 102-4505), last modified 2009, accessed on March 16, 2010, from <http://cansim2.statcan.gc.ca/cgi-win/cnsmcgi.exe?Lang=E&CNSM-Fi=CII/CII_1-eng.htm>.
3. Statistics Canada, Report on the Demographic Situation in Canada 2005 and 2006 (Ottawa, Ont.: Statistics Canada, 2006), pp. 16–19, accessed on March 16, 2010, from <http://www.statcan.gc.ca/ cgi-bin/af-fdr.cgi?l=eng&loc=http://www.statcan.gc.ca/pub/91-209-x/91-209-x1995000-eng.pdf&t= %20(Report%20on%20the%20Demographic%20Situation%20in%20Canada)>.
4. Health Canada, Changing Fertility Patterns: Trends and Implications, last modified September 8, 2005, accessed on March 9, 2010, from <http://www.hc-sc.gc.ca/sr-sr/pubs/hpr-rpms/bull/2005-10-chang-fertilit/ intro-eng.php>.
5. K. Hammarberg and V. E. Clarke, “Reasons for Delaying Childbearing—A Survey of Women Aged Over 35 Years Seeking Assisted Reproductive Technology,” Australian Family Physician 34, 3 (2005): pp. 187–188.
6. K. M. Benzies, “Advanced Maternal Age: Are Decisions About the Timing of Child-Bearing a Failure to Understand the Risks?” Canadian Medical Association Journal 178, 2 (2008): pp. 183–184.
7. J. Cleary-Goldman et al., “Impact of Maternal Age on Obstetric Outcome,” Obstetrics and Gynecology 105, 5 Pt 1 (2005): pp. 983–990.
8. V. C. Katwijk and L. L. Peeters, “Clinical Aspects of Pregnancy After the Age of 35 Years: A Review of the Literature,” Human Reproduction Update 4, 2 (1998): pp. 185–194.
9. I. M. Usta and A. H. Nassar, “Advanced Maternal Age. Part I: Obstetric Complications,” American Journal of Perinatology 25, 8 (2008): pp. 521–534.
10. B. Jacobsson et al., “Advanced Maternal Age and Adverse Perinatal Outcome,” Obstetrics and Gynecology 104, 4 (2004): pp. 727–733.
11. K. S. Joseph et al., “The Perinatal Effects of Delayed Childbearing,” Obstetrics and Gynecology 105, 6 (2005): pp. 1410–1418.
12. N. S. Fox et al., “Outcomes of Multiple Gestations With Advanced Maternal Age,” Journal of Maternal–Fetal and Neonatal Medicine 22, 7 (2009): pp. 593–596.
13. S. Lisonkova et al., “The Effect of Maternal Age on Adverse Birth Outcomes: Does Parity Matter?” Journal of Obstetrics and Gynecology Canada 32, 6 (2010): pp. 541–548.
14. L. M. Hollier et al., “Maternal Age and Malformations in Singleton Births,” Obstetrics and Gynecology 96, 5 Pt 1 (2000): pp. 701–706.
15. F. G. Cunningham and K. J. Leveno, “Childbearing Among Older Women—The Message Is Cautiously Optimistic,” The New England Journal of Medicine 333, 15 (1995): pp. 1002–1004.
16. G. K. Swamy et al., “Association of Preterm Birth With Long-Term Survival, Reproduction, and Next-Generation Preterm Birth,” Journal of the American Medical Association 299, 12 (2008): pp. 1429–1436.
17. D. Moster et al., “Long-Term Medical and Social Consequences of Preterm Birth,” The New England Journal of Medicine 359, 3 (2008): pp. 262–273.

22 In Due Time: Why Maternal Age Matters
18. S. Bewley, W. Ledger and D. Nikolaou, Consensus Views Arising From the 56th Study Group: Reproductive Ageing (London, U.K.: Royal College of Obstetricians and Gynaecologists, 2009), pp. 353–356.
19. N. Schuurmans et al., Healthy Beginnings: Giving Your Baby the Best Start From Preconception to Birth, 4th Edition (Mississauga, Ont.: Wiley, 2009).
20. National Center for Biotechnology Information, Diseases and Conditions, last modified July 20, 2010, accessed on July 20, 2011, from <http://www.ncbi.nlm.nih.gov/pubmedhealth/s/ diseases_and_conditions/a/;>.
21. National Heart Lung and Blood Institute, High Blood Pressure in Pregnancy, last modified July 20, 2011, accessed on July 25, 2011, from <http://www.nhlbi.nih.gov/health/public/heart/hbp/hbp_preg.htm>.