Improving Safety of the Surface Transportation System by ...
170
® The contents of this report reflect the views of the authors, who are responsible for the facts and the accuracy of the information presented herein. This document is disseminated under the sponsorship of the Department of Transportation University Transportation Centers Program, in the interest of information exchange. The U.S. Government assumes no liability for the contents or use thereof. Improving Safety of the Surface Transportation System by Addressing the Issues of Vulnerable Road Users: Case of the Motorcyclists Report # MATC-KSU: 253 Final Report Sunanda Dissanayake Associate Professor Department of Civil Engineering Kansas State University Mohammad Saad B. Shaheed Graduate Research Assistant Department of Civil Engineering Kansas State University 2012 A Cooperative Research Project sponsored by the U.S. Department of Transportation Research and Innovative Technology Administration
Transcript of Improving Safety of the Surface Transportation System by ...

®
The contents of this report reflect the views of the authors, who are responsible for the facts and the accuracy of the information presented herein. This document is disseminated under the sponsorship of the Department of Transportation
University Transportation Centers Program, in the interest of information exchange. The U.S. Government assumes no liability for the contents or use thereof.
Improving Safety of the Surface Transportation System by Addressing the Issues of Vulnerable Road Users: Case of the Motorcyclists
Report # MATC-KSU: 253 Final Report
Sunanda DissanayakeAssociate ProfessorDepartment of Civil EngineeringKansas State University
Mohammad Saad B. ShaheedGraduate Research Assistant Department of Civil EngineeringKansas State University
2012
A Cooperative Research Project sponsored by the U.S. Department of Transportation Research and Innovative Technology Administration

Improving Safety of the Surface Transportation System by Addressing the Issues
of Vulnerable Road Users: Case of the Motorcyclists
Sunanda Dissanayake, Ph.D., P.E. Mohammad Saad B. Shaheed
Associate Professor Graduate Research Assistant
Department of Civil Engineering Department of Civil Engineering
Kansas State University Kansas State University
A Report on Research Sponsored by
Mid-America Transportation Center
University of Nebraska-Lincoln
July 2012

ii
Technical Report Documentation Page
1. Report No.
25-1121-0001-253
2. Government Accession No.
3. Recipient's Catalog No.
4. Title and Subtitle
Improving Safety of the Surface Transportation System by Addressing the
Issues of Vulnerable Road Users: Case of the Motorcyclists
5. Report Date
July 2012
6. Performing Organization Code
7. Author(s)
Sunanda Dissanayake, Mohammad Saad B. Shaheed
8. Performing Organization Report No.
25-1121-0001-253
9. Performing Organization Name and Address
Mid-America Transportation Center
2200 Vine St.
PO Box 830851
Lincoln, NE 68583-0851
10. Work Unit No. (TRAIS)
11. Contract or Grant No.
12. Sponsoring Agency Name and Address
Research and Innovative Technology Administration
1200 New Jersey Ave., SE
Washington, D.C. 20590
13. Type of Report and Period Covered
Final Report
January 2010-June 2011
14. Sponsoring Agency Code
MATC TRB RiP No. 18459
15. Supplementary Notes
16. Abstract Over the past few years, motorcycle fatalities have increased at an alarming rate in the United States. Motorcycle safety issues in Kansas
are no different from the national scenario. Accordingly, this study examines motorcycle crashes in Kansas in order to identify and
evaluate critical crash-related factors and subsequent impacts on motorcycle crash injury outcomes. State-level motorcycle rider fatality
rates were investigated while considering various factors including helmet laws, using generalized least-squares regression modeling. A
detailed characteristic analysis was carried out for motorcycle crashes, using Kansas crash data. Comparisons were made between
several aspects of motorcycle crashes and other vehicle crashes. Logistic regression analyses were performed on Kansas motorcycle
crash data to identify factors affecting fatal motorcycle crashes. In addition, a survey was administered to motorcyclists in order to
gather information on rider behaviors and helmet usage patterns, as well as their perceptions regarding helmet laws in Kansas, potential
problems associated with the law, crash-related factors, and the level of difficulty in executing various motorcycle maneuvers. Ordered
probit modeling was used to identify factors contributing to the increased severity of injuries sustained by motorcycle riders involved in
crashes. Results from state-based modeling showed statistically significant relations between motorcycle fatality rates in a given state
and crash-related factors such as weather-related conditions, helmet laws, per capita income, highway mileage of rural roads, population
density, education, demographic distributions, and motorcycle registrations in the state. States with mandatory helmet laws had 5.6%
fewer motorcycle fatalities per 10,000 motorcycle registrations and 7.85% fewer motorcycle fatalities for every 100,000 in a given
population. Characteristic analysis of motorcycle crashes in Kansas revealed that motorcycle maneuvers such as overtaking,
motorcyclists being older than 40 years, not using motorcycle helmets, daytime riding, crashes occurring on roadside shoulders, and
influence of alcohol among the riders during crashes increased the risk of crash fatalities. Survey results showed that 71% of
motorcyclist respondents perceived drivers of other vehicles as the single biggest threat to their own safety. Moreover, 64% opposed
legislation that would require motorcycle riders and passengers in Kansas to wear helmets. The ordered probit model results indicate that
overturned and fixed-object motorcycle crashes, not wearing a helmet, being younger in age, speeding, good weather, as well as being
under the influence of alcohol significantly contributed to increased severity of motorcyclist crash-related injuries in Kansas.
17. Key Words
Motorcycle crashes, helmet law, motorcycle safety,
motorcycle crash severity
18. Distribution Statement
19. Security Classif. (of this report)
Unclassified
20. Security Classif. (of this page)
Unclassified
21. No. of Pages
157
22. Price

iii
Table of Contents
Acknowledgments........................................................................................................................... x
Abstract .......................................................................................................................................... xi
Chapter 1 Introduction .................................................................................................................... 1
1.1 Background ........................................................................................................................... 1
1.2 Problem Statement ................................................................................................................ 5
1.3 Objectives ............................................................................................................................. 6
1.4 Outline of the Report ............................................................................................................ 7
Chapter 2 Literature Review ........................................................................................................... 8
2.1 Helmet Use, Helmet-Use Laws and Their Effectiveness ..................................................... 8
2.2 Other Factors Related to Motorcycle Fatalities .................................................................. 14
2.3 Motorcycle Crash Types and Trends .................................................................................. 16
2.4 Statistical Methodologies .................................................................................................... 17
Chapter 3 Methodology ................................................................................................................ 19
3.1 State-Level Modeling of Motorcycle Fatalities Considering All States ............................. 19
3.1.1 Generalized Least-squares Regression......................................................................... 19
3.1.2 Data for State-Level Generalized Least-squares Regression Modeling ...................... 22
3.2 Characteristic Analysis of Motorcycle Crashes in Kansas ................................................. 23
3.2.1 Contingency Table Analysis ........................................................................................ 24
3.3 Motorcycle Safety Survey .................................................................................................. 30
3.4 Factors Contributing to Motorcycle-Rider Injury Severity ................................................ 32
3.4.1 Ordered Probit Modeling ............................................................................................. 32
3.4.1.1 Goodness-of-Fit Measure...................................................................................... 35
3.4.2 Crash Data for Ordered Probit Modeling ..................................................................... 36
Chapter 4 Results and Discussions ............................................................................................... 37
4.1 State-Level Modeling of Motorcycle Fatality Rates ........................................................... 37
4.1.1 Predictor Variables Selection for Statistical Modeling of Motorcycle Fatalities ........ 37
4.1.2 Generalized Least-squares Regression for Motorcyclist Fatalities per 10,000
Motorcycle Registrations ...................................................................................................... 40
4.1.2.1 Helmet Law ........................................................................................................... 42
4.1.2.2 Weather Conditions .............................................................................................. 43
4.1.2.3 Per Capita Income ................................................................................................. 43
4.1.2.4 Demographic Distribution .................................................................................... 43
4.1.2.5 Highway Mileage of Rural Roads......................................................................... 44
4.1.3 Generalized Least-squares Regression for Motorcyclist Fatalities per 100,000
Population ............................................................................................................................. 44
4.1.3.1 Helmet Law ........................................................................................................... 46
4.1.3.2 Population Density ................................................................................................ 47
4.1.3.3 Motorcycle Registrations ...................................................................................... 47
4.1.3.4 Weather Conditions .............................................................................................. 47
4.1.3.5 Education .............................................................................................................. 48
4.1.3.6 Demographic Distribution .................................................................................... 48
4.1.3.7 Highway Mileage of Rural Roads......................................................................... 48
4.1.4 Checking for Homoscedastic Disturbances ................................................................. 49
4.2 Characteristics of Motorcycle Crashes in Kansas ............................................................... 50
4.2.1 General Characteristics of Motorcycle Crashes in Kansas .......................................... 51

iv
4.2.2 Contingency Table Analysis ........................................................................................ 54
4.2.3 Comparison of Characteristics between Motorcycle Crashes and Other Vehicle
Crashes .................................................................................................................................. 59
4.2.4 Univariate Logistic Regression .................................................................................... 75
4.2.4.1 Motorcycle Maneuvers ......................................................................................... 75
4.2.4.2 Gender ................................................................................................................... 78
4.2.4.3 Age Group ............................................................................................................. 78
4.2.4.4 Types of Safety Equipment Used ......................................................................... 79
4.2.4.5 Light Conditions ................................................................................................... 79
4.2.4.6 Time of Crashes .................................................................................................... 80
4.2.4.7 On-Road Surface Characteristics .......................................................................... 80
4.2.4.8 Weather Conditions .............................................................................................. 81
4.2.4.9 Crash Locations .................................................................................................... 81
4.2.4.10 Crash Classes ...................................................................................................... 81
4.2.4.11 Day of the Week for Crashes .............................................................................. 81
4.2.4.12 Contributing Circumstances................................................................................ 82
4.2.4.13 Substance Abuse ................................................................................................. 82
4.3 Motorcycle Safety Survey .................................................................................................. 82
4.3.1 Survey Responses ........................................................................................................ 82
4.3.2 Differences Based on Age of Respondents .................................................................. 96
4.3.3 Crashes and Contributing Factors .............................................................................. 103
4.4 Analysis Using Ordered Probit Modeling ........................................................................ 107
4.4.1 Motorcycle Rider-Related Factors ............................................................................. 111
4.4.2 Motorcycle-Crash Related Factors ............................................................................ 112
4.4.3 Roadway-Related Factors .......................................................................................... 113
4.4.4 Environment-Related Factors .................................................................................. 1144
4.5 Kansas Motorcycle Crash Reports in Newspapers ........................................................... 114
Chapter 5 Summary, Conclusions, and Recommendations ........................................................ 116
5.1 Summary and Conclusions ............................................................................................... 116
5.2 Recommendations ............................................................................................................. 122
5.2.1 Possible Countermeasures.......................................................................................... 122
References ................................................................................................................................... 126
Appendix A Motorcycle Fatalities and Injuries in U.S., 1997-2008 .......................................... 132
Appendix B Percentage Comparison between Motorcycle and Other Vehicle Crashes in Kansas,
1999-2008 ............................................................................................................................ 135
Appendix C Survey Form ........................................................................................................... 144
Appendix D Newspaper Clips of Motorcycle Crashes in Kansas .............................................. 147

v
List of Figures
Figure 1.1 Trend in Motorcycle Fatalities in the U.S., 1997-2007 ................................................. 2
Figure 1.2 Trend in Other Vehicle Fatalities in the U.S., 1997-2007 ............................................. 2
Figure 1.3 Trend of Motorcycle Fatal and Injury Crashes in Kansas, 1997-2008.......................... 3
Figure 1.4 Kansas Motorcycle Rider Fatalities (Helmeted and Unhelmeted), 1997-2008 ............. 4
Figure 1.5 Kansas Motorcycle Rider Injuries (Helmeted and Unhelmeted), 1997-2008 ............... 5
Figure 4.1 Standardized Residual Plots for the Model with MC Fatalities per 10,000 MC
Registrations ..................................................................................................................... 50
Figure 4.2 Average Percentage Comparison between MC and Other Vehicle Crashes for Vehicle
Maneuvers ......................................................................................................................... 60
Figure 4.3 Trend of Crashes Involving Motorcycles and Other Vehicles Based on Vehicle
Maneuvers ......................................................................................................................... 61
Figure 4.4 Average Percentage Comparison between Motorcycle and Other Vehicle Crashes for
Driver Age ........................................................................................................................ 62
Figure 4.5 Trend of Crashes Involving Motorcycles and Other Vehicles Based on Age of the
Drivers............................................................................................................................... 63
Figure 4.6 Average Percentage Comparison between Motorcycle and Other Vehicle Crashes for
Light Conditions ............................................................................................................... 64
Figure 4.7 Trends of Crashes Involving Motorcycles and Other Vehicles Based on Light
Conditions ......................................................................................................................... 65
Figure 4.8 Average Percentage Comparison between Motorcycle and Other Vehicle Crashes for
Crash Classes .................................................................................................................... 66
Figure 4.9 Trend of Crashes Involving Motorcycles and Other Vehicles Based on Crash Classes
........................................................................................................................................... 67
Figure 4.10 Average Percentage Comparison between Motorcycle and Other Vehicle Crashes by
Day of the Crashes ............................................................................................................ 68
Figure 4.11 Trend of Crashes Involving Motorcycles and Other Vehicles Based on Day of the
Crashes .............................................................................................................................. 68
Figure 4.12 Average Percentage Comparison between Motorcycle and Other Vehicle Crashes in
Kansas for Time of the Crashes, 1999-2008 ..................................................................... 69
Figure 4.13 Crashes Involving Motorcycles and Other Vehicles Based on Time of the Crashes 69
Figure 4.14 Average Percentage Comparison between Motorcycle and Other Vehicle Crashes for
Contributing Factors ......................................................................................................... 70
Figure 4.15 Trends of Crashes Involving Motorcycles and Other Vehicles Based on Contributing
Factors ............................................................................................................................... 71
Figure 4.16 Average Percentage Comparison between Motorcycle and Other Vehicle Crashes for
Driver Contributory Factors .............................................................................................. 72
Figure 4.17 Average Percentage Comparison between Motorcycle and Other Vehicle Crashes for
On-Road Surface Characteristics ...................................................................................... 73
Figure 4.18 Trend of Crashes Involving Motorcycles and Other Vehicles Based on On-Road
Surface Characteristics...................................................................................................... 73
Figure 4.19 Average Percentage Comparison between Motorcycle and Other Vehicle Crashes for
Crash Location .................................................................................................................. 74
Figure 4.20 Crashes Involving Motorcycles and Other Vehicles Based on Crash Location ........ 74
Figure 4.21 Responses by Motorcycle Riders Based on Different Age Groups for Motorcycle
Characteristics (Motorcycle Engine Size) ........................................................................ 97

vi
Figure 4.22 Responses by Motorcycle Riders Based on Different Age Groups for Motorcycle
Characteristics (Motorcycle Types) .................................................................................. 98
Figure 4.23 Responses by Motorcycle Riders Based on Different Age Groups for Motorcycle
Riding Exposure (Types of Roadways) ............................................................................ 99
Figure 4.24 Responses by Motorcycle Riders Based on Different Age Groups for Motorcycle
Riding Experience ............................................................................................................. 99
Figure 4.25 Responses by Motorcycle Riders Based on Different Age Groups for Helmet Use 100
Figure 4.26 Responses by Motorcycle Riders Based on Different Age Groups for Helmet Law
Opinion ........................................................................................................................... 101
Figure 4.27 Responses by Motorcycle Riders Based on Different Age Groups for Most Difficult
Maneuver to Execute ...................................................................................................... 102
Figure 4.28 Responses by Motorcycle Riders Based on Different Age Groups for Crash
Experience....................................................................................................................... 103
Figure D.1 Manhattan Mercury News Clip for Motorcycle Crash Caused by Collision with
Minivan ........................................................................................................................... 147
Figure D.2 Wichita Eagle News Clip for Motorcycle Crash Caused by Collision with Guard Rail
......................................................................................................................................... 147
Figure D.3 Wichita Eagle News Clip for Motorcycle Crash Caused by Collision with a Car ... 148
Figure D.4 Wichita Eagle News Clip for Motorcycle Crash Caused by Collision with Motorcycle
......................................................................................................................................... 148
Figure D.5 Wichita Eagle News Clip for Motorcycle Crash Caused by Collision with a Deer . 149
Figure D.6 LJWorld.com News Clip for Motorcycle Crash Caused by Hitting the Median Curb
......................................................................................................................................... 149
Figure D.7 Wichita Eagle News Clip for Motorcycle Clip Caused by Losing Control on a Curve
......................................................................................................................................... 150
Figure D.8 KMBC.com News Clip for Motorcycle Fatal Crash Victim Identification ............. 151
Figure D.9 Wichita Eagle News Clip for Motorcycle Crash Caused by Collision in Intersection
......................................................................................................................................... 152
Figure D.10 Wichita Eagle News Clip for Motorcycle Crash Caused by Rear Collision with a
Minivan ........................................................................................................................... 153
Figure D.11 Wichita Eagle News Clip for Motorcycle Crash Caused by Collision with a Truck
......................................................................................................................................... 153
Figure D.12 Topeka Capital-Journal News Clip for Motorcycle Fatality Trend ........................ 154
Figure D.13 KMBC.com News Clip for Motorcycle Crash ....................................................... 155
Figure D.14 Wichita Eagle News Clip for Motorcycle Death .................................................... 155
Figure D.15 Fwix.com News Clip for Motorcycle Fatal Crash Caused by Failure to Yield ...... 156
Figure D.16 KearneyHub.com News Clip for Motorcycle Fatal Crash by Overturning ........... 156
Figure D.17 Hometowndailynews.com News Clip for Motorcycle Fatal Crash by Overturning
......................................................................................................................................... 157
Figure D.18 Fox Kansas News Clip for Motorcycle Fatal Crash Caused by Crashing into a Truck
......................................................................................................................................... 157

vii
List of Tables
Table 1.1 Motorcycle Crash Scenario in Kansas, 2000-2008 ......................................................... 3
Table 3.1 Cross Classification Table for Crash Class and Motorcycle Crash Severity ................ 24
Table 3.2 Cross-Classification of Data on Light Conditions and Motorcycle Crash Severity in
Kansas, 2004-2008 ............................................................................................................ 28
Table 3.3 Specifications of Design Variables for Light Conditions Using Daylight as the
Reference Group ............................................................................................................... 29
Table 4.1 Predictor Variables Selected for Motorcycle Fatality Rate Modeling .......................... 40
Table 4.2 Results of Generalized Least-squares Regression for Log of Motorcycle Fatalities per
10,000 Motorcycle Registrations ...................................................................................... 41
Table 4.3 Results of Generalized Least-squares Regression for Log of Motorcycle Fatalities per
100,000 Population ........................................................................................................... 45
Table 4.4 Percentages of Different Crash Severities for Different Factors for Motorcycles in
Kansas, 2004-2008 ............................................................................................................ 52
Table 4.5 Contingency Table Analysis for Motorcycle Crash Severity and Various Factors in
Kansas, 2004-2008 ............................................................................................................ 56
Table 4.6 Results of Univariate Logistic Regression of Motorcycle Fatal Crashes in Kansas .... 77
Table 4.7 Frequencies and Percentage of Responses to General Survey Questions by Motorcycle
Riders ................................................................................................................................ 84
Table 4.8 Frequencies and Percentage of Responses to General Survey Questions by Motorcycle
Riders ................................................................................................................................ 85
Table 4.9 Frequencies and Percentage of Responses to Demographic, Socio-Economic, and
Economic Background-Related Questions by Motorcycle Riders ................................... 87
Table 4.10 Frequencies and Percentage of Responses to Helmet and Helmet Law-Related
Questions by Motorcycle Riders ....................................................................................... 88
Table 4.11 Frequencies and Percentage of Responses to Helmet and Helmet Law-Related
Questions by Motorcycle Riders in Kansas (Continued) .................................................. 89
Table 4.12 Responses to Safety Gears Crash Experience-Related Questions by Motorcycle
Riders ................................................................................................................................ 91
Table 4.13 Responses by Motorcycle Riders for Crash Contributing Factors ............................. 94
Table 4.14 Responses by Motorcycle Riders for Crash Contributing Factors (continued) .......... 95
Table 4.15 Responses by Motorcycle Riders for Crash Contributing Factors (Continued) ......... 96
Table 4.16 Crude Odds Ratio and 95% Confidence Intervals for Crash Involvement ............... 105
Table 4.17 Crude Odds Ratio and 95% Confidence Intervals for Crash Involvement Based on
Difficulty Levels of Motorcycle Maneuvers................................................................... 107
Table 4.18 Description of Variables Considered for Ordered Probit Modeling ........................ 109
Table 4.19 Results of Ordered Probit Modeling for Motorcycle Rider Injury Severity ............. 110
Table A.1 Motorcycle Fatalities in the United States, 1997-2007 .............................................. 132
Table A.2 Other Vehicle Fatalities (Except Motorcycle) in the United States, 1997-2007 ....... 132
Table A.3 Motorcycle Fatal and Injury Crashes in Kansas, 1997-2008 ..................................... 133
Table A.4 Kansas Motorcycle Rider Fatalities (Helmeted and Unhelmeted), 1997-2008 ......... 133
Table A.5 Kansas Motorcycle Rider Injuries (Helmeted and Unhelmeted), 1997-2008 ............ 134
Table B.1 Vehicle Maneuver: Percentage Comparison between MC and Other Vehicle Crashes,
1999-2008 ....................................................................................................................... 135
Table B.2 Age Distribution: Percentage Comparison between MC and Other Vehicle Crashes,
1999-2008 ....................................................................................................................... 136

viii
Table B.3 Light Conditions: Percentage Comparison between MC and Other Vehicle Crashes,
1999-2008 ....................................................................................................................... 137
Table B.4 Crash Classes: Percent Comparison between MC and Other Vehicle Crashes, 1999-
2008................................................................................................................................. 138
Table B.5 Day of Crashes: Percent Comparison between MC and Other Vehicle Crashes, 1999-
2008................................................................................................................................. 139
Table B.6 Time of Crashes: Percent Comparison between MC and Other Vehicle Crashes, 1999-
2008................................................................................................................................. 140
Table B.7 Contributing Factors: Percent Comparison between MC and Other Vehicle Crashes,
1999-2008 ....................................................................................................................... 141
Table B.8 On-Road Surface Characteristics: Percent Comparison between MC and Other Vehicle
Crashes, 1999-2008......................................................................................................... 142
Table B.9 Crash Locations: Percent Comparison between MC and Other Vehicle Crashes, 1999-
2008................................................................................................................................. 143

ix
List of Abbreviations
National Highway Traffic Safety Administration (NHTSA) Fatality Analysis Reporting System (FARS)
Federal Highway Administration (FHWA)
National Institute of Health (NIH)
National Climatic Data center (NCDC)
Blood Alcohol Concentration (BAC)

x
Acknowledgments
The authors would like to thank Mid-America Transportation Center for funding this project
and providing all the help necessary by remaining true to their theme of “improving safety and
minimizing risk associated with increasing multi-modal freight movement on the U.S. surface
transportation system.” Authors would also like to thank the Kansas Department of Transportation
(KDOT) for providing matching funds to complete all tasks that were originally intended in this
project. Many thanks to the National Highway Traffic Safety Administration (NHTSA) for providing
the Fatality Analysis Reporting System (FARS) data, and KDOT for providing the Kansas
Accidents Records System (KARS) data which has been crucial to conducting this study. Special
thanks also go to Mr. Peter Bodyk (KDOT) who served as the Project Monitor.

xi
Abstract
Over the past few years, motorcycle fatalities have increased at an alarming rate in the
United States. Motorcycle safety issues in Kansas are no different from the national scenario.
Accordingly, this study examines motorcycle crashes in Kansas in order to identify and evaluate
critical crash-related factors and subsequent impacts on motorcycle crash injury outcomes.
State-level motorcycle rider fatality rates were investigated while considering various
factors including helmet laws, using generalized least-squares regression modeling. A detailed
characteristic analysis was carried out for motorcycle crashes, using Kansas crash data.
Comparisons were made between several aspects of motorcycle crashes and other vehicle
crashes. Logistic regression analyses were performed on Kansas motorcycle crash data to
identify factors affecting fatal motorcycle crashes. In addition, a survey was administered to
motorcyclists in order to gather information on rider behaviors and helmet usage patterns, as well
as their perceptions regarding helmet laws in Kansas, potential problems associated with the law,
crash-related factors, and the level of difficulty in executing various motorcycle maneuvers.
Ordered probit modeling was used to identify factors contributing to the increased severity of
injuries sustained by motorcycle riders involved in crashes.
Results from state-based modeling showed statistically significant relations between
motorcycle fatality rates in a given state and crash-related factors such as weather-related
conditions, helmet laws, per capita income, highway mileage of rural roads, population density,
education, demographic distributions, and motorcycle registrations in the state. States with
mandatory helmet laws had 5.6% fewer motorcycle fatalities per 10,000 motorcycle registrations
and 7.85% fewer motorcycle fatalities for every 100,000 in a given population. Characteristic
analysis of motorcycle crashes in Kansas revealed that motorcycle maneuvers such as
overtaking, motorcyclists being older than 40 years, not using motorcycle helmets, daytime

xii
riding, crashes occurring on roadside shoulders, and influence of alcohol among the riders during
crashes increased the risk of crash fatalities. Survey results showed that 71% of motorcyclist
respondents perceived drivers of other vehicles as the single biggest threat to their own safety.
Moreover, 64% opposed legislation that would require motorcycle riders and passengers in
Kansas to wear helmets. The ordered probit model results indicate that overturned and fixed-
object motorcycle crashes, not wearing a helmet, being younger in age, speeding, good weather,
as well as being under the influence of alcohol significantly contributed to increased severity of
motorcyclist crash-related injuries in Kansas.

1
Chapter 1 Introduction
1.1 Background
Since the enactment of the Highway and National Traffic and Motor Vehicle Safety Act
of 1966, an estimated 148,000 motorcyclists have died in traffic crashes, according to the
National Highway Traffic Safety Administration (1). The aim of this act was to reduce traffic
crashes as well as the number of fatalities and injuries to persons involved in traffic crashes by
empowering the federal government to set and administer safety standards. In 2008, motorcycles
made up of nearly 3 % of all registered vehicles in the United States and accounted for only 0.4 %
of all vehicles miles traveled (1). However, motorcycle fatalities in 2008 accounted for 14% of
total traffic fatalities in the United States compared to 5.92% in 1997, indicating the higher levels
of severity associated with motorcycle crashes. The number of motorcycle fatalities in the U. S.
increased 150% from 2,116 in 1997 to 5,290 in 2008 (1). During the same period, passenger car
and light truck fatality rates decreased by only 26.74% and 13.54% respectively showing the
unique nature of safety issues faced by the motorcyclists. Considering per vehicle miles traveled
in 2008, motorcyclists were 37 % more likely than drivers of passenger cars to die in a motor
vehicle crash and nine times more likely to be injured (1). Figures 1.1 and 1.2 show the trend in
motorcycle and non-motorcycle fatalities in the United States for the 10-year period from 1997 to
2007.

2
(Source: Traffic Safety Facts: 2008, NHTSA)
Figure 1.1 Trend in Motorcycle Fatalities in the U.S., 1997-2007
(Source: Traffic Safety Facts: 2008, NHTSA)
Figure 1.2 Trend in Other Vehicle Fatalities in the U.S., 1997-2007
Similar to national trends, the number and percentage of motorcycle fatalities in Kansas
have significantly increased despite highway safety improvements achieved in some categories.
For example, in 2008, the number of motorcycle crashes as a percentage of total crashes was only
about 1.7% but motorcycle crashes accounted for 12.6% of all fatal crashes, indicating
motorcycle riders are more vulnerable than other road users. Table 1.1 depicts the trend of
motorcycle crashes in Kansas from 2000 to 2008.
0
1,000
2,000
3,000
4,000
5,000
6,000
1997 1998 1999 2000 2001 2002 2003 2004 2005 2006 2007Mo
torc
ycle
fata
liti
es in
US
A
Years
28,000
29,000
30,000
31,000
32,000
33,000
34,000
35,000
1997 1998 1999 2000 2001 2002 2003 2004 2005 2006 2007Oth
er
veh
icle
s f
ata
liti
es
i
n U
SA
Years

3
Table 1.1 Motorcycle Crash Scenario in Kansas, 2000-2008
Year All Crashes All fatal Crashes All Motorcycle Crashes Fatal Motorcycle Crashes
Number Number Number % of all crashes Number % of all fatal crashes
2000 78,241 656 700 0.9 21 3.2
2001 78,856 643 762 1 27 4.2
2002 78,314 690 819 1 29 4.2
2003 75,009 604 857 1.1 32 5.3
2004 74,117 392 988 1.3 31 7.9
2005 68,740 384 1,041 1.5 33 8.6
2006 65,460 468 1,103 1.7 58 12.4
2007 70,589 379 1,110 1.6 47 12.4
2008 65,788 349 1,138 1.7 44 12.6
(Source: Kansas Traffic Crash Facts)
Figure 1.3 depicts the trend of motorcycle fatal crashes and injury crashes in Kansas from
1997 to 2008. Fatal motorcycle crashes peaked in 2006 before slightly decreasing in 2007.
However, motorcycle injury crashes increased almost consistently during the time period.
Figure 1.3 Trend of Motorcycle Fatal and Injury Crashes in Kansas, 1997-2008
0
200
400
600
800
1000
1200
1997 1998 1999 2000 2001 2002 2003 2004 2005 2006 2007 2008 2009
Nu
mb
er
of
Mo
torc
ycle
C
rash
es
Years
Fatal Motorcycle Crashes Injury Motorcycle Crashes

4
One area of immediate attention in terms of motorcycle safety is the use of helmets.
Motorcycle helmet laws significantly vary significantly across the United States. By the end of
2008, there were 20 states with mandatory helmet laws, 27 states with partial helmet laws and 3
states with no helmet laws at all (2). The helmet law in Kansas only stipulates that riders under 18
years to wear a helmet that complies with minimum federal safety standards. For example, in
2008, only 39% of Kansas motorcycle riders involved in crashes were wearing helmets, whereas
only 26% of all fatally injured motorcyclists wore helmets (2). Figures 1.4 and 1.5 depict the
Kansas motorcycle riders’ fatalities and injuries based on helmet use during motorcycle crashes
from 1997 to 2008.
Figure 1.4 Kansas Motorcycle Rider Fatalities (Helmeted and Unhelmeted), 1997-2008
0
5
10
15
20
25
30
35
40
45
50
1997 1998 1999 2000 2001 2002 2003 2004 2005 2006 2007 2008 2009
MC
rid
er
fata
liti
es
Years
Helmeted Unhelmeted

5
Figure 1.5 Kansas Motorcycle Rider Injuries (Helmeted and Unhelmeted), 1997-2008
As seen in Figures 1.4 and 1.5, unhelmeted motorcycle riders had more fatalities
compared to helmeted riders (see related data in Appendix A). However, opponents of mandatory
helmet laws have suggested that, despite demonstrated effectiveness in reducing injuries, helmets
may increase a rider’s risk of crashing by interfering with the ability to see and hear surrounding
traffic.
1.2 Problem Statement
In 1997, 3.85 million registrations increased by 75% to 6.7 million in 2006 (3). Sales of
new street-legal motorcycles also went up by 243% from 260,000 in 1997 to 892,000 in 2006),
slightly declining in 2007 to 885,000. Consequently, the number of motorcycle riders has
increased as well. As the roadways increasingly become safer for motorists operating other
vehicles, more attention should be focused on ensuring the safety of motorcyclists, one of the
more vulnerable groups of vehicle operators on the road. This is also true for Kansas, where the
number of fatal motorcycle crashes as a percentage of all fatal crashes remains high. It is
0
100
200
300
400
500
600
700
1997 1998 1999 2000 2001 2002 2003 2004 2005 2006 2007 2008 2009
MC
rid
er
inju
rie
s
Years
Helmeted Unhelmeted

6
important to combat preventable motorcycle fatalities and injuries in Kansas by identifying
causes of motorcycle crashes and providing motorcycle awareness information to both
motorcyclists and other motorists on state roadways.
In order for Kansas to continue reducing the total of fatalities and achieving the goals of
the Kansas Highway Safety Plan, it is crucial to examine motorcycle crashes and to identify the
characteristics of problem areas so that motorcycle safety can be improved. Accordingly, this
study investigated characteristics of motorcycle crashes in Kansas, with the intention of
identifying critical areas and issues. In addition, other critical matters, such as causes of
motorcycle crashes and comments and experiences of Kansas motorcycle riders, were sought.
The relationship between motorcycle injury outcome and helmet usage was also be examined in
this study using Kansas crash data.
1.3 Objectives
The main objectives of this study were to investigate characteristics of motorcycle crashes
in Kansas in order to identify critical factors and evaluate the impact of helmet use and other
factors on motorcycle crash injury outcomes. Statistical models were developed to predict state-
level motorcycle safety parameters and to account for other factors. Analyses of all motorcycle
crash data in Kansas were performed over a reasonable period of time (five years). Results
yielded significant relations between the outcome of Kansas motorcycle crashes and many other
contributory factors over recent years. A survey among Kansas motorcycle riders was conducted
to determine personal and other related factors associated with the decision to wear a helmet. This
project evaluates the overall safety of motorcyclists in Kansas by identifying factors that
contribute to increased severity of crashes as well as motorcyclist concerns about wearing
helmets.

7
1.4 Outline of the Report
This report is divided into five chapters. The first chapter covers a brief introduction about
the motorcycle safety situation and motorcycle crashes, problem statement, study objective, and
outline of the report. Chapter 2 reviews literature on helmet use and effectiveness, trends and
factors related to motorcycle fatality and crashes, and statistical methodologies. Chapter 3
describes the analysis methodologies as well as the data used for the current study. Chapter 4
presents results and discussions of analyses. Finally, chapter 5 presents the conclusions and
recommendations based on the present study.

8
Chapter 2 Literature Review
Previous studies on motorcycle safety have used various databases to explore factors,
issues, and outcomes related to helmet use. Examples include cross-state helmet law use, effects
of helmets on crash outcomes, as well as factors related to injuries and fatalities. Past researchers
have used various statistical modeling techniques to predict or explain the nature of motorcycle
crashes or injuries. Furthermore, different types of motorcycle crashes have been examined by
these studies, narrowing them down to identify more specific factors related to selected states. In
this chapter, an extensive discussion of past findings is presented under the following subsections:
helmet use, helmet-use laws and their effectiveness, factors related to motorcycle crashes, and
statistical methodologies.
2.1 Helmet Use, Helmet-Use Laws and Their Effectiveness
Branas and Knudson investigated motorcycle rider fatality rates between states with and
without mandatory motorcycle helmet laws (4). Bivariate and multivariate analyses explored the
impact of population density, weather conditions, alcohol consumption, maximum speed limit,
urban versus rural roads, motorcycle engine size, and motorcycle rider age on the fatality rates of
motorcyclists. Bivariate analyses suggested that states with motorcycle helmet laws have
significantly higher fatality rates per 10,000 registered motorcycles, compared to states without
helmet laws. After simultaneously adjusting for other factors using multivariate regression
models, fatality rates in states with mandatory motorcycle helmet laws were shown to be lower
than those of states without helmet laws.
Peek-Asa et al. examined the prevalence of non-standard helmet use among motorcycle
riders following introduction of a mandatory helmet law and the prevalence of head injuries
among a sample of non-standard helmet users involved in motorcycle crashes (5). Among the
injured riders examined in 1992, exactly one-third, whose crash reports indicated non-standard

9
helmet use, had 15.5% fatalities of non-helmeted riders compared to 13.6 % of helmeted riders.
Among the riders wearing non-standard helmets, 75% sustained head injuries of any severity
which was significantly greater than riders not wearing a helmet, where the corresponding
percentage was only 51.9% Average head injury severity for non-standard helmet-wearing riders
was 2.65, which was significantly higher than 1.56 for no-helmet riders and 0.96 for riders
wearing standard helmets.
Results of surveys conducted by Williams et al. in 1979 indicated when helmet use is
legally required of all motorcyclists, nearly 100% wear helmets (6). Helmet-use rates were
substantially lower when use is not required of any motorcyclists, or when helmet-use laws
amended to require only those under age of 18 years to wear helmets. Amending helmet-use laws
so that only young motorcyclists are required to wear helmets appears to have little impact on
user rates. The overall helmet-use rate (48%) in New Orleans, Phoenix, and within the state of
Texas was similar to the use rate (46%) in Los Angeles, California, where motorcyclists are not
required to use helmets.
An analysis by Mayrose showed that, from 1995-2003, total fatalities in mandatory helmet
law states increased by 22.3%, alongside a 3% increase in helmet use among fatally injured riders
(7). Partial-law states had a 32.9% increase in total motorcycle fatalities with a 1.2% increase in
helmet use. Conversely, the three other states with no helmets law at all had a 21.78% increase in
total motorcycle fatalities with only a 2% increase in helmet use. The increase in fatalities can be
attributed to a greater number of motorcyclists on the road. It was found that motorcyclists are
more likely to wear helmets in states with mandatory helmet laws than partial-helmet or no-
helmet.

10
Rutledge et al. studied the impact of helmet use on motorcycle crash outcomes,
controlling for severity of the crash as measured by a modified injury severity score that excluded
head injury (8). Risk of head injuries was found to be nearly twice as high in unhelmeted riders.
This study illustrated the increased likelihood of head injury when a helmet is not worn, but also
showed helmet use is not a significant factoring determining morbidity rates, hospital charges,
and length of stay. There were, however, some unanticipated findings in the study. There were no
significant differences in overall mortality, mean trauma scores, mean hospital stays, mean
hospital charges, or percentage of cases discharged to rehabilitation facilities between helmeted
and unhelmeted patients.
Wilson found that, although effectiveness of helmet use depends on many factors (e.g.
driver age, speed, crash direction), and the matched-pairs technique has limitations in assessing
effectiveness, motorcycle helmets are estimated to be 29% effective in preventing motorcycle
rider fatalities (9). Further, although motorcycle helmets saved an estimated 670 lives in 1987, an
additional 693 lives could have been saved if those motorcycle riders all had worn helmets. In
examining the data, it was evident there is a consistency in helmet usage patterns between the
rider and the passenger, such that when the rider is helmeted so tends to be the passenger. This is
also true when the rider is unhelmeted.
Houston examined the impact of helmet use on fatalities in a national sample of
motorcyclists aged 15 to 19 years from 1975-2004 (10). After controlling for state policy and
demographic variables, two-way, fixed-effects models were estimated using negative binomial
regression. Results suggest that mandatory helmet laws significantly reduce young motorcyclist
fatalities – in this sample, fatality rates were reduced by 31%. In contrast, partial-coverage
helmet laws are not statistically related to changes in fatalities and even partial-coverage laws that

11
require all motorcyclists 15-20 years of age to wear a helmet provide no apparent safety benefits
to this target population. Such findings suggest that not only are partial-coverage helmet laws
difficult to enforce but also reduce rider motivation to obey the law.
McKnight and McKnight studied the effects of motorcycle helmets on seeing and hearing.
Results indicated that wearing helmets did not restrict the ability to hear horn signals nor did it
have an appreciable effect upon likelihood of visually detecting a vehicle in an adjacent lane prior
to initiating a lane change (11). Because helmets were worn, there was an increase in head
rotation, which was not linked to increased time during which cyclist gaze was diverted from
facing straight ahead Differences in hearing thresholds across helmet conditions were both non-
significant and nonexistent. However, significant increases in the hearing threshold with
increased vehicle speed strongly suggest that the experimental procedure can detect true effects
given the rider’s ability to hear. While helmets did not appear to degrade hearing, neither did they
enhance it. The extent of head rotation seemed to be greatest among riders with the least
experience, those who thought helmets restricted vision, and those who believed the helmet was a
good thing.
Evans and Frick found that three factors (wearing a helmet, being a passenger, and being
male) were significantly associated with lower motorcyclist fatality risk. In all three cases, fatality
risk was reduced by 30% (12). These results depended on the assumption that helmet
effectiveness for drivers, accompanied by passengers, is sufficiently similar to helmet
effectiveness for drivers traveling alone. The study’s main finding reveals that helmet use for
motorcycle drivers and passengers reduced fatality risk by 28%, margin of error (+8). For
passengers, gender differences were also significant. Female passengers were 5.5% less likely to

12
be killed than male drivers, but were 33.3% more likely to be killed than similarly aged male
passengers.
Gilbert et al. conducted multiple logistic regression analyses to explore helmet use and
injury levels pre- and post-law changes (13). Two separate models were produced to show the
effect of helmet use and injury levels on the outcome of pre- and post-law status. These analyses
included the ability to account for, and mathematically remove, effects of other potentially
confounding variables. No significant effects for gender or race emerged in either model. The
logistic regression showed a strong positive effect of helmet use post-law reinstatement. Odds of
wearing a helmet in a crash post-law reinstatement were 11.7 times greater in comparison to
wearing a helmet during the pre-law time period (p < 0.001).
Using cross-sectional data for the 50 states and Washington, D.C., covering the period
1975-2004, Houston and Richardson estimated fixed-effects regression models examining the
effects of mandatory and partial helmet laws on three different motorcyclist fatality rates (14).
These fatality rates were fatalities per 10,000 registered motorcycles, fatalities per 100,000
population, and fatalities per 10 billion VMT. Regardless of what fatality rate measure was used,
mandatory helmet laws were correlated with a substantial reduction in motorcycle fatalities.
Partial-helmet laws also correlated with lower fatality rates, although these reductions were
modest in comparison to those associated with mandatory coverage. Again, other factors were
found to be correlated with the MC fatality rates. Fatality rates rose as the number of motorcycles
per capita, income per capita, and alcohol consumed per capita in a state rose. In contrast, higher
levels of advanced education and population density were significantly associated with lower
fatality rates. Motorcyclist fatality rates were higher in states with longer riding seasons.

13
A study conducted by Morris evaluated the association of mandatory helmet laws with
U.S motorcyclist fatality rates from 1993 to 2002, using climatic measures as statistical controls
for motorcycling activity via quasi-maximum likelihood generalized linear regression analyses
(15). Results revealed that motorcyclist fatalities and injuries were strongly associated with
normalized heating-degree days and precipitation inches. When these climate measures and their
interaction are statistically controlled, mandatory helmet laws were associated with lower
motorcycle fatality rates .However, an association of state helmet laws with reduced state fatality
rates was harder to detect statistically for several reasons.
Mandatory helmet laws have been effective in increasing helmet use in the United States
(16). For example, California’s helmet usage rate increased from 50% to 99% after implementing
the mandatory helmet law (17). In recent years, helmet use in states with mandatory helmet law
was found to be 73%, which was greater than the 50% usage of helmet in states without
mandatory coverage (18).
Conversely, other studies did not find any significant relations between mandatory helmet
laws and motorcycle fatality rates. Sosin and Sacks concluded that, while mandatory helmet laws
were associated with reductions in frequency of crash-related head injury, no difference in total
motorcycle fatality rates (based on helmet law status) existed (19). However, this study was
significantly limited because Sosin and Sacks other potentially influential factors. Similarly,
Stolzenberg and D’Alessio found that, after the repeal of mandatory coverage, no significant
change in Florida’s fatality rate emerged (20). However, the study controlled for the fatality rate
of young motorcyclists still covered by the law, assuming that behavior of the young
motorcyclists would not change after the repeal.

14
2.2 Other Factors Related to Motorcycle Fatalities
Numerous studies have demonstrated that a myriad of factors can contribute to motorcycle
fatalities. For example, based on studies related to seat belts, population density has been
hypothesized to specifically affect motorcycle rider fatalities, as well as highway mortality rates
(21, 22, 23, and 24). Higher population density is typically characterized by frequent stops,
whereas drivers in lower-population density areas can drive without much interruption. However,
in the case of motorcycle crashes, it was found that population density is positively related to
motorcycle fatalities (4). Motorcycle operators have the highest incidence of alcohol use among
all motor vehicle drivers (25). In addition, fatal motorcycle crashes are more likely to involve
alcohol than fatal automobile crashes (5, 25, and 26).
Meteorological factors have also been shown to be significantly related to motorcycle
fatalities. Previous studies found that temperature was positively correlated to motorcycle
fatalities, but annual precipitation was negatively correlated to motorcycle fatalities (4, 14).
However, Morris demonstrated that annual precipitation was positively correlated with
motorcycle fatalities but negatively correlated with the square of annual precipitation (15).
Normalized heating-degree days were also found to be positively correlated with motorcycle
fatalities. The study revealed n quadratic association of fatality rates with annual precipitation.
During the study period of 2001-2002 considered by Morris, the largest percentage of motorcycle
fatalities (13.5%) and injuries (13.1%) occurred during the month of August, which was
associated with the second smallest percentage of normalized heating-degree days (0.3%) and the
third largest percentage of precipitation inches (8.8%) (15).
Demographic factors, such as higher levels of education and income/socioeconomic status
of the drivers, have been considered as factors that promote healthy behavior (27). Healthy

15
behavior can include complying with existing motor vehicle safety laws and obeying traffic rules
and regulations. Studies have shown that higher education levels increase usage of seat belts. A
higher level of education is linked to increased seat belt use as well as lower motor vehicle
fatality rates (22, 28, and 29). Income is also related to lower traffic fatalities, e.g., higher SES
groups are generally more aware of rules and regulations, place a higher value on safety, and
possess the means to enhance it (30). In contrast, for motorcyclists, income had a different impact
on fatality rates. Houston and Richardson found that income per capita positively correlated with
motorcycle fatalities (14). According to Houston and Richardson (14), motorcycles, being
expensive and luxurious, are more often used as recreational vehicles rather than a primary mode
of transportation.
Paulozzi took the approach of calculating motorcycle mortality rates per 10,000
motorcycles sold (30). The study found that higher mortality rates had been consistently
associated with newer motorcycles. As newer motorcycles with higher mortality rates became a
larger share of the motorcycles on the road after 1997, overall motorcycle mortality rates rose.
Brisk sales of new motorcycles appeared to be driving the increase in motorcycle fatalities.
According to the study, two factors may explain for the inverse relation between motorcycle age
and mortality risk. First, motorcycles may be ridden less each year after their purchase. A second
possible explanation was driver inexperience. The recent increased popularity of motorcycling
may have caused some new drivers to purchase used motorcycles or caused drivers who had not
ridden for some time to resume riding previously purchased motorcycles. This might explain the
observed increase in fatality rates for motorcycles 4-6 and 7-11 years old after 1997.

16
2.3 Motorcycle Crash Types and Trends
Preusser carried out a study dealing with crash-type analysis of motorcycle crashes using
fatal crash data (31). Numerically coded information contained in the FARS database was used to
prepare a “crash report” for each crash event. That is, the process by which the narrative
information in police crash reports was converted to standardize numerical codes for data
processing was reversed. The distribution of motorcycle crash types by single-vehicle and
multiple-vehicle crashes were as follows: ran off road-41%, ran traffic control-18.1%, oncoming-
10.8%, left turn oncoming-8.5%, motorcycle down-7.3%, rundown-3.3%, stopped/stopping-3.2%,
road obstacle-2.5%, lane change-1.4%, cutoff-1.2%, and others/unknown-2.4%.
Kraus et al. carried out a study in which the crash data substantiated the high risk
associated with young operators of motorcycles (32). Older drivers represented survivors from the
younger ages that were at high risk, as driver age may be a factor in the amount of experience
acquired operating motor vehicles. Age-limited discriminant analysis identified prior motorcycle
crash injuries, prior motorcycle violations, and automobile driving experience as risk factors in
motorcycle crashes. Identification of motor vehicle violations and prior collisions as important
factors suggested some drivers were less mindful of customary courtesies and precautions in
motor vehicle operations, irrespective of whether they were driving automobiles or motorcycles.
Mannering and Grodsky found that most of motorcyclists were generally aware of factors
that contribute to crash risk (33). The survey on this study revealed that more than 70% of riders
reported driving the motorcycles above 100 mph, while more than 57% saying that they have
ridden within one hour of drinking alcohol.

17
Hurt et al. performed a study on factors causing motorcycle crashes and identification of
countermeasures (34). A high crash involvement was found in unlicensed and young riders.
Approximately half of those killed were legally drunk at the time of fatality.
2.4 Statistical Methodologies
Disaggregated analysis techniques, such as logistic regression, ordered logit and probit
models, and multinomial logit models, have been used in numerous studies to examine risk
factors that increase the probability of injury severity in crashes. However, not many studies have
focused on the totality of factors, which collectively affect the likelihood of a fatal motorcycle
crash. However, there have been some studies relating various factors to motorcycle crash
severity.
Shanker and Mannering performed a multinomial logit analysis of single-vehicle
motorcycle crash severity, demonstrating that the multinomial logit formulation is a promising
approach to evaluate the determinant of motorcycle crash severity (35). They found that no-
helmet use, being a fixed object crash, and alcohol-impaired riding increased the likelihood of a
disabling injury or fatality. In addition, alcohol use, speeding, and the presence of other
motorcyclists were associated with a higher likelihood of severe injury. Quddus et al. used the
ordered probit model, which models categorical dependent variables, to study how various factors
(e.g., specific characteristics of the roadway and riders) can lead to different levels of injury
severity and damage severity to the motorcycle (36). Factors related to greater probability of
severe injuries include increased engine capacity, headlights not turned on during daytime,
collision with pedestrians and stationary objects, driving during early morning hours, having a
pillion passenger, and when the motorcyclist is determined to be at fault for the crash. Using
multinomial logit and multinomial probit distribution models to analyze motorcycle crash injury

18
severities, Deo Chimba et al. found seven factors that significantly predicted probable severe
injury: increased number of lanes, substance use, higher posted speed limits, curved roadway
sections, turning movements, ramps, and driving with no adequate daylight (37).
Bedard also used multivariate logistic regression to determine the independent
contributions of several drivers, crash, and vehicle characteristics affecting the fatality risk of
drivers involved in crashes (38). Kockelman and Kweon used ordered probit models to examine
the risk of different injury levels across all crash types, two-vehicle crashes, and single vehicle
crashes (39). The researchers said they used the ordered probit model rather than multinomial
logit and probit models, which neglect the data’s ordinality, require estimation of more
parameters, and are associated with undesirable properties such as the independence of irrelevant
alternatives.
Yamamoto and Shankar conducted a bivariate ordered-response probit model of drivers’
and most severely injured passengers’ severity in collisions with fixed objects (40). A bivariate
ordered-response probit model is an extension of a univariate ordered-response probit model.
Elasticity and pseudo-elasticity of both continuous and dichotomous variables were also
calculated.
Three types of crashes were investigated by Riffat and Chin using an ordered response
probit model (41). In the proposed ordered probit model, the dependent variable used was crash
severity, which might take on one of three values based on the recorded degree of injury
involved. They also estimated the probability of injury severity for combined factors related to
two-vehicle, single-vehicle and pedestrian crashes.
19
Chapter 3 Methodology
This chapter describes the methodologies and data used for performing the analyses in this
study. State-level modeling of motorcycle fatality rates was performed using the generalized
least-squares regression method. Statistical tests of independence were conducted to investigate
the relation between crash severity and other factors in Kansas. Logistic regression was
performed to identify characteristics affecting fatal motorcycle crashes in Kansas. Finally,
ordered probit modeling of motorcycle rider injury severity was performed to examine the factors
linked to increased injury severity of motorcycle riders.
3.1 State-Level Modeling of Motorcycle Fatalities Considering All States
Generalized least-squares regression modeling was used to predict state-level motorcycle safety
parameters by establishing the relation between helmet laws and motorcycle fatality rates, using
crash data collected over a three-year period. Regression analyses controlled for other factors that
might be significantly related to motorcycle fatalities, such as demographic characteristics,
weather, highway mileage of rural roads, and motorcycle registration. Such additional factors
included weather-related factors, highway mileage of rural roads, motorcycle registration, and
demographic characteristics, such as education level, age, income etc.
3.1.1 Generalized Least-squares Regression
Linear regression is one of the most widely studied and applied statistical and econometric
techniques. Linear regression is used to model a linear relationship between a continuous
dependent variable and one or more independent variables. Most applications of regression seek
to identify a set of independent variables that are thought to covary with the dependent variable. It
is generally assumed that the response is continuous: in other words, it can take any value within
a specified range. The form of the regression model requires that the relationship between
variables be inherently linear. The simple linear regression is given by

20
iixY 110 (3.1)
where,
Y = the dependent variable;
β0 = a constant term (the point where the line crosses the Y axis);
β1 = a constant term;
x1 = independent variable x for observation 1;
ε = disturbance term; and
i = the subscript corresponds to the individual or observation, where i = 1, 2, 3… n.
In most applications, response variable Y is a function of many independent variables. In
these cases, it is more efficient to express the linear regression model in the matrix notation
111 nxpxnxpnx XY (3.2)
where,
X = an n x p matrix of the observations;
n = the number of observations; and
p = the number of variables measured on each observation.
The equation 3.2 is the regression model in the matrix terms, where the subscripts depict
the size of the matrices.
The objective of linear regression is to model the relationship between a dependent
variable Y with one or more independent variable X. The ability to say something about the way X
affects Y is through the parameters in the regression model, the betas. Regression seeks to provide

21
information and properties about the parameters in the population model by inspecting properties
of the sample-estimated betas, how they behave, and what they can tell us about the sample and
thus the population (42).
Least-squares estimation is a commonly employed estimation method for regression
applications. Often referred to as “ordinary least square” or OLS, it represents a method for
estimating regression model parameters using the sample data. In a simple regression case, the
expression Y = Xβ consists of the following matrices:
=
1 x1 1 1. .
0. .
. .
. .
. .
1 x
Y X βy
yn n
(3.3)
The generalized least-squares model is a flexible generalization of ordinary least-squares
regression. It generalizes linear regression by allowing the linear model to be related to the
response variable via a link function and by allowing the magnitude of the variance of each
measurement to be a function of its predicted value. The link function provides the relationship
between the linear predictor and the mean of the distribution function. There are many commonly
used link functions, and their choice can be somewhat arbitrary. The link function used for
generalized linear modeling in this study is
log( )X Y (3.4)

22
where,
X = predictor variables;
β = parameter estimates; and
Y = response variable.
As such, a generalized least-squares regression procedure was utilized, using statistical
analysis software SAS version 9.1, to identify different factors affecting response variables,
which were the logarithm of total number of motorcyclists killed per 10,000 motorcycle
registrations and motorcycle fatalities per 100,000 populations in this study (43).
3.1.2 Data for State-Level Generalized Least-squares Regression Modeling
The number of motorcycle rider fatalities for all 50 states and the District of Columbia
from 2005-2007 was obtained from the National Highway Traffic Safety Administration’s
(NHTSA) Fatality Analysis Reporting System (FARS) and were used in this analysis. Various
other factors that could be independent variables were chosen to perform the regression analysis.
Data for these variables were extracted from different sources. The Statistical Abstract of U.S.
Census Bureau website was used to obtain data for several factors such as population per square
mile, percentage of bachelor’s degree holders, property crime rate, total unemployment
percentage, per capita income, and national demographic distribution for all the states from 2005
to 2007 (44). The number of registered motorcycles, fuel tax, and highway mileage of rural roads
for each state were obtained from the Federal Highway Administration’s (FHWA) annual
highway statistics series website (45). The percentage of valid license holders for fatally injured
motorcyclists and helmet law information, as well as the number of fatally injured older
motorcycle riders for all states were obtained from the National Highway Traffic Safety
Administration (NHSTA) state data program website (46). Meteorological data were obtained

23
from the National Climatic Data Center (NCDC) website (47). The National Institute of Health
(NIH) website was used to obtain data for per capita alcohol consumption (gallons/year) for all
states (48).
3.2 Characteristic Analysis of Motorcycle Crashes in Kansas
When motorcycle safety is analyzed, it is also important to compare factors related to
motorcycle crashes and other vehicle crashes, because there might be common problems
pertaining to other vehicle crashes that may not be specific to motorcycle crashes. In that regard,
a comparison between motorcycle crashes and other vehicle crashes would be appropriate in
identifying problems and issues limited to motorcycle crashes, which was accomplished using
Kansas Accident Records System (KARS) data from 1999 to 2008. Trends of motorcycle crashes
and other vehicle crashes for the five-year period from 2004 to 2008 were also derived for several
factors as presented in Chapter 4.
In order to identify whether there is a significant relation between crash severity and
occupant, crash, and vehicle variables/factors, contingency table analyses was carried out, using
five years of data from 2004 to 2008.
It is also necessary to examine motorcycle crashes to identify fatality-related factors such
as crash characteristics, motorcycle occupants, vehicles, and contributing circumstances. Using
five years of KARS data from 2004 to 2008, logistic regression analyses were conducted, where
motorcycle crash fatality was a dichotomous dependent variable with fatality-related factors as
independent variables.

24
3.2.1 Contingency Table Analysis
Contingency table analysis is a method to test whether a relationship exists between two
independent variables which are discrete in nature. The contingency table analysis was performed
to examine any relationships exist between various factors and motorcycle crash severity in
Kansas (see Table 3.1). As the test of independence uses the contingency table format, it is
sometimes referred to as a contingency table test. An example can be illustrated showing the
contingency table analysis between two categorical variables denoted as x and y with x having i
number of levels and y having j number of levels. The ij possible combinations of outcomes can
be displayed in a rectangular table having i rows for the categories of x and j columns for
categories of y. In Table 3.1, the categorical variable x denotes crash classes of sample of crash
data, and y denotes crash severities.
Table 3.1 Cross Classification Table for Crash Class and Motorcycle Crash Severity
Variables (x) Crash Severity (y) Total
Crash Classes Fatal Injury No Injury Total
Collision w/ fixed object 48 699 76 823
Overturned 37 1,097 130 1,264
Collision w/ other MV 98 1,671 467 2,236
Collision w/ animal 17 229 65 311
Other non-collision 12 402 64 478
Total 212 4,098 802 5,112
The cells of the table represent ij possible outcomes. Since i = 5 and j = 3 in this case,
there are fifteen possible outcomes.
The test of independence addresses the question of whether the crash class is independent
of crash severity. The hypotheses for this test of independence are as follows:

25
H0: Crash class is independent from crash severity; and
H1: Crash class is not independent from crash severity
where,
H0 is the null hypothesis and Ha is the alternative hypothesis.
Expected frequencies for cells of the contingency table are calculated, assuming that the
null hypothesis is true. Let eij denotes the expected frequency for the contingency table category
in row i and column j.
Expected frequencies are calculated as
(row i total)×(column j total)
Sample Sizeije (3.5)
The expected number of observations for each cell can be calculated according to the null
hypothesis. For example, the expected number of observations for other non-collision fatal
crashes are (478*212)/5112 = 19.82. Similarly, expected observations for other cells can be
calculated in the same way. The test procedure for comparing observed frequencies and expected
frequencies uses the following formula and a chi-square value is calculated.
i j ije
ijeijn
estimated
2)(2
(3.6)
where,
χ2estimated = estimated Chi-Square value;
nij = real number of observations for ith
row and jth
column; and
eij = expected number of observations for ith
row and jth
column.

26
In this table, degree(s) of freedom is calculated by (r-1)*(c-1), where r = number of rows
and c = number of columns in the table, which is (5-1)*(3-1) = 8 in this case. The chi-square
value and tabular values can be compared at user-defined confidence levels.
For the example in Table 3.1, the value of the test statistic is χ2 = 125.8. At a 95%
confidence level, the value shown in the table for eight degrees of freedom is 15.51. Since the
calculated χ2 > the table value, the null hypothesis is rejected and it can be concluded that crash
class is not independent of crash severity.
Using this method, the contingency table analysis was performed for various crash-related
factors and motorcycle crash severity in Kansas using data collected from 2004 to 2008. In
section 4.2.2, results of calculated chi-square values for different categories, along with their
respective degrees of freedom, are presented.
3.2.2 Logistic Regression
The goal of a logistic regression analysis is to find the best fitting and most parsimonious
model to describe the relationship between an outcome and a set of independent variables. The
factor that distinguishes logistic regression from linear regression is that the outcome variable in
the logistic regression is categorical, and most likely takes the form of a binary or dichotomous
variable, whereas in linear regression it is continuous.
In any regression problem, the key quantity is the mean value of the outcome variable,
given the value of the independent variable. This quantity is called the conditional mean and is
expressed as E(Y/x), where Y denotes the outcome variable and x denotes a value of the
independent variable (49). In linear regression, it is assumed this mean may be expressed as an
equation linear in x, such as,
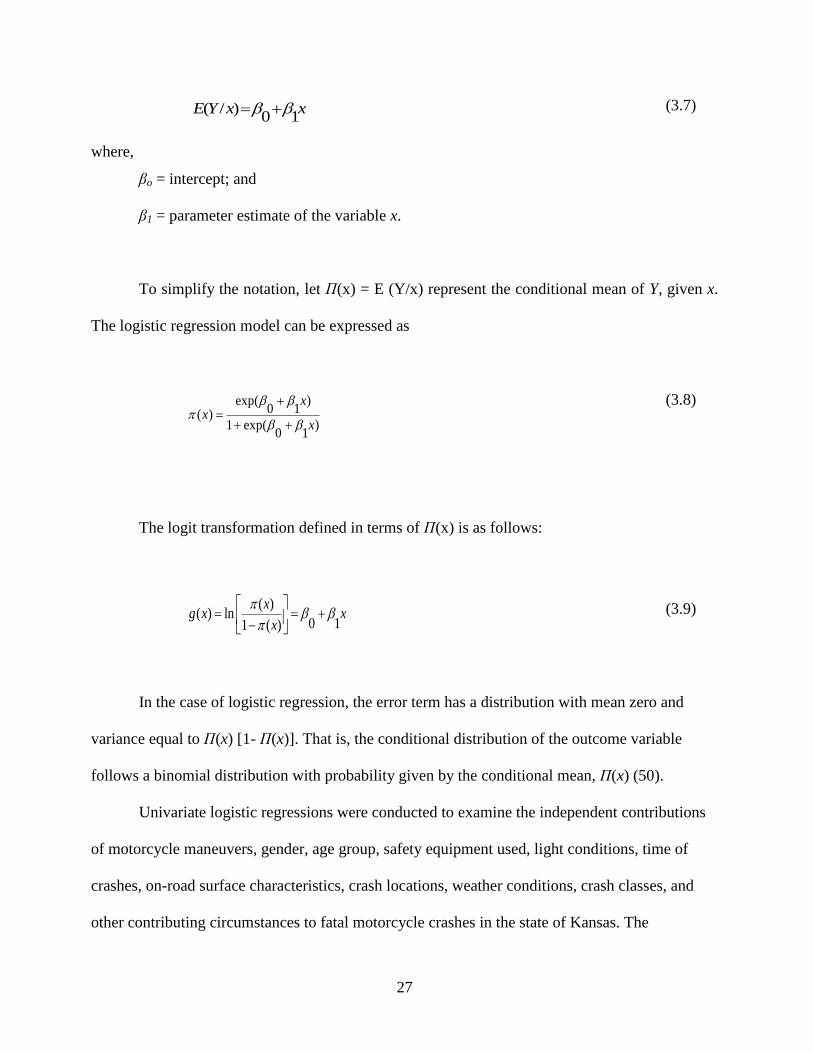
27
xxYE10
)/( (3.7)
where,
βo = intercept; and
β1 = parameter estimate of the variable x.
To simplify the notation, let Π(x) = E (Y/x) represent the conditional mean of Y, given x.
The logistic regression model can be expressed as
exp( )0 1( )
1 exp( )0 1
xx
x
(3.8)
The logit transformation defined in terms of Π(x) is as follows:
( )( ) ln
0 11 ( )
xg x x
x
(3.9)
In the case of logistic regression, the error term has a distribution with mean zero and
variance equal to Π(x) [1- Π(x)]. That is, the conditional distribution of the outcome variable
follows a binomial distribution with probability given by the conditional mean, Π(x) (50).
Univariate logistic regressions were conducted to examine the independent contributions
of motorcycle maneuvers, gender, age group, safety equipment used, light conditions, time of
crashes, on-road surface characteristics, crash locations, weather conditions, crash classes, and
other contributing circumstances to fatal motorcycle crashes in the state of Kansas. The

28
dependent variable for the logistic regression was a dichotomous variable indicating whether the
motorcycle crash was a fatal one or not. Motorcycle crashes considered from the KARS database
include both single-vehicle and multi- vehicle motorcycle crashes. To determine whether
different characteristics were associated with fatal motorcycle crashes, the odds ratio (OR) along
with a 95% confidence interval of a fatal motorcycle crash were calculated for each variable. The
reference group in each variable had the value of odds ratio equal to unity.
All independent variables considered for logistic regression were discrete variables and
had at least two categories. Some independent variables were polytomous, meaning that they
have. For example, there were variables that denoted different types of motorcycle maneuvers
under “motorcycle maneuver”, different age groups under “age”, as well as different types of
crashes under variable name crash classes, An example can illuminate the process of specifying
design variables for different subcategories of a variable: the variable “light condition” was coded
at four levels and the cross classification of light condition by crash severity in the state of Kansas
yielded the data presented in Table 3.2.
Table 3.2 Cross-Classification of Data on Light Conditions and Motorcycle Crash Severity in
Kansas, 2004-2008
Light Conditions Fatal Injury No injury Total
Daylight 197 4,934 1,033 6,164
Dawn and dusk 15 363 86 464
Dark-street light on 67 1,214 230 1,511
Dark-no street lights 64 598 124 786
Total 343 7,109 1,473 8,925
Estimates of the odds ratio were obtained from a logistic regression program with an
appropriate choice of design variables. The method for specifying design variables involves

29
setting all of them equal to zero for the reference group and then setting a single design variable
equal to one for each of the other groups (see Table 3.3).
Table 3.3 Specifications of Design Variables for Light Conditions Using Daylight as the
Reference Group
Variables Design Variables
Light Conditions D1 D2 D3
Daylight 0 0 0
Dawn and dusk 1 0 0
Dark-street light on 0 1 0
Dark-no street lights 0 0 1
The dependent variable has two possible outcomes, where a fatal crash outcome was
coded as 1 and a non-fatal crash outcome was coded as 0. Odds in favor of an event occurring is
defined as the probability the event will occur divided by the probability the event will not occur.
In logistic regression, the event of interest is always y = 1 given a particular set of values for the
independent variables, the odds in favor of y =1 can be calculated as follows:
p
p
xxxyP
xxxypodds
,........,0
).........,1
21
,21
(3.10)
where,
1 21 , ,..... np y x x x = probability of event occurring; and
0 , ,.....1 2
p y x x xn
= probability of event not occurring.
The odds ratio measures the impact on the odds of a one-unit increase in only one of the
independent variables. It also looks at the odds that y =1 given that one of the independent

30
variables is increased by one unit (odds1) divided by the odds that y = 1, given no change in the
value of the independent variables (odds0)
odds
1odds ratio = odds
0
(3.11)
Using SAS version 9.1, logistic regression analyses were conducted for different factors
considered as variables and crash severity to identify significant bivariate/multivariate relations
(43).
3.2.3 Crash Data for Characteristics Analysis of Motorcycle Crashes
Crash data obtained from the Kansas Accident Records System (KARS) were used for
characteristic analysis of motorcycle crashes and modeling injury severity of motorcycle riders in
Kansas. The KARS data set, maintained by the Kansas Department of Transportation, comprises
all police-reported crashes in the state of Kansas. However, not every crash meets police-report
requirements. Only crashes causing damages of $500 or more are reported by the police in
Kansas. Crash, driver, occupant, and vehicle-related data related to crashes in Kansas are
available in the KARS database. For the analysis in this study, crash data from years 1999 to 2008
were considered.
This part of the analysis focused mainly on identifying characteristics more common
among motorcycle crashes in Kansas, using crash data to explore occupant, crash, vehicle, and
environmental factors. All data for motorcycle crashes from 1999 to 2008 were used for
comparing motorcycle crashes and other vehicle crashes. There were total of 8,750 motorcycle
crashes in Kansas for this 10 year period, where 331 crashes were fatal, 6,960 were injury
crashes, and 1,359 were property damage only (PDO) crashes.

31
In the contingency table analysis and logistic regression, KARS data for the five-year
period from 2004 to 2008 were used.
3.3 Motorcycle Safety Survey
3.3.1 Survey Data
Analysis of motorcycle safety situations based solely on crash data may not be enough to
arrive at conclusions about motorcycle riders, since those characteristics are linked only with a
special segment of motorcyclists who have had a crash experience. In other words, there are many
motorcycle riders who have not met with crashes during the last few years, and their
representation is unobserved in such analysis. The characteristics of non-crash riders should be
considered together with those who have experienced crashes, to make fair conclusions about
motorcycle rider characteristics. In order to understand all motorcyclist behaviors and their
perceptions of Kansas helmet law, a self-report questionnaire was administered. Questions mainly
included items on demographics, helmet laws, crash-related factors, and difficult motorcycle
maneuvers.
Designing a survey on motorcycle safety poses multiple challenges. Because motorcycle
riders who are a special population group, their expected attitude regarding participating in a
motorcycle safety survey was quite uncertain. Ideally, a good study of this nature requires a
reasonable number of responses distributed throughout the state to account for bias, confounds,
and misrepresentations. After locating different motorcycle events or rallies in Kansas during the
motorcycle riding season, participants were requested to complete the questionnaire by verbally
talking to them. During conversations with motorcyclists about their perceptions of Kansas
helmet laws, many expressed skepticism about the law as well as anxiety about participating. The
current law in Kansas is a partial-helmet law, and many were fearful that their involvement in the

32
study would negatively affect it. Other recruitment spots included motorcycle parking spots at
Kansas State University and Wichita State University, and businesses that sell motorcycles, such
as Harley-Davidson, Free-State Cycles, and Indian Motorcycles.
Because participants were asked to return their completed survey forms using a provided
mail-back envelope, the initial response rate was low. In order to increase the number of
completed surveys, more participants were recruited at other motorcycle events or rallies, located
in fourteen cities across the state of Kansas: Manhattan, Lawrence, Wichita, Kansas City,
Cassidy, Winfield, Herrington, Topeka, Salina, Council Grove, Perry Lake, Lenexa, Junction
City, and Wamego.
3.4 Factors Contributing to Motorcycle-Rider Injury Severity
Ordered probit modeling was performed to investigate the effect of various factors on the
severity of personal injuries sustained by motorcycle riders in Kansas. Using ordered probit
modeling, the objective was to incorporate all variables into a single formula to explore multiple
or combined effects of such variables on injury severity of motorcycle riders.
3.4.1 Ordered Probit Modeling
Several econometric models have been used in the literature to isolate factors that affect
injury severities sustained by various road users. Long suggested that unordered multinomial or
nested logit or probit models, while accounting for the categorical nature of the dependent
variable, disregard the ordinal nature of injury severity levels and are associated with undesirable
properties, such as the independence of irrelevant alternatives (IIA) (50, 51). Several researchers
have proposed ordered-discrete choice models (e.g., the ordered probit/logit models: OP/OL) for
modeling injury severities, suggesting that an ordered-discrete choice model can account for

33
unequal between-category differences in the dependent variable, and can relax IIA restriction (36,
53).
The ordered probit model is usually in a latent (i.e. unobserved) variables framework and
the general specification is
y xi i i (3.12)
where,
*iy = the latent and continuous measure of injury severity faced by a crash victim i in a
crash;
' = the vector of estimated parameters;
xi= the (K x 1) vector of observed non-stochastic explanatory variable; and
i = normally distributed error term with zero mean and unit variance for the ordered
probit model, but logistically distributed for the ordered logit model.
Here, the error terms for different crash victims are assumed to be uncorrelated (i.e.,
disturbance term is assumed to be heteroskedastic, representing the variance of the disturbance
term can vary from one victim to another). Standard regression techniques cannot be applied to
calculate equation 3.12 because the dependent variable *iy is unobserved. Instead, the data used
in this study include observed dataiy , a coded discrete variable measuring the injury level
sustained by a crash victim i : iy =1 no injury;
iy = 2 for possible injury; iy = 3 for injury (non-
incapacitating); iy = 4 for injury (incapacitating); and
iy = 5 for fatal injury Thus the observed and
coded discrete injury severity, iy , can be determined from the following formulae:

34
1
1 2
2 3
3 4
4
1 if * (no injury)
2 if * (possible injury)
3 if * (injury-non incapacitating)
4 if * (injury- incapacitating)
5 if * (fatal injury)
i
i
i i
i
i
y
y
y y
y
y
(3.13)
where the threshold values μ1, μ2, μ3, and μ4 are unknown parameters to be estimated.
The predicted probabilities of the five coded injury severity levels by a victim i , for given ix are
1( 1 no injury crash) ( ' )i iP y x ; (3.14)
2 1( 2possible injury crash) ( ' ) ( ' )
i i iP y x x ; (3.15)
3 2( 3injury-non incapacitating injury crash) ( ' ) ( ' )
i i iP y x x ; (3.16)
4 3( 4injury-incapacitating injury crash) ( ' ) ( ' ) i i iP y x x ; and (3.17)
4( 5 fatal crash) 1 ( ' ) i iP y x (3.18)
where,
)(u = the cumulative density function of the random error term i evaluated at u .
The method of maximum likelihood is used for estimating parameters of the ordered
probit model. For the ordered probit model, i is normally distributed with mean 0 and variance 1
and the cumulative density function is
21( ) exp(- )dt
22
t
(3.19)

35
3.4.1.1 Goodness-of-Fit Measure
In linear regression models, goodness of fit is usually measured by the R2 value, whereas
there is no such straightforward measure to evaluate model fitness of ordered probit models.
McFadden suggested using a likelihood ratio index analogous to the R2 in the linear regression
model (54).
)ln (/)ln (1 0
2 LLb (3.20)
where,
)ln( bL = the maximized likelihood function; and
)ln( 0L = the likelihood assuming all model slope coefficients are equal to 0.
This measure is bounded by 0 and 1 and as it approaches 1, model fit improves. Similarly,
a few other values are given in the SAS output such as Estrella, Adjusted Estrella, Veal
Zimmermann, and Mckelvey-Zavoina, which can also be considered in evaluating a model’s
goodness-of-fit.
In regression modeling, significance of individual parameters toward the model is
important, and overall goodness-of-fit also plays a vital role in that aspect. SAS output for an
ordered probit model gives the number of goodness-of-fit measurements because, unlike other
regression modeling, no single value exists that can consistently determine the model fitness.
Consequently, various values given in terms of probabilities were considered when selecting
models, leading to the consideration of McFadden’s LRI. Similarly, the Estrella value is also
desirable in discrete modeling. Zimmermann values and Mckelvey-Zavoina values are also
reported for the ordered probit model in the results section.

36
3.4.2 Crash Data for Ordered Probit Modeling
For the ordered probit analysis, Kansas Accident Records System (KARS) was used
utilizing a five-year period of data from 2004 to 2008. A line of data for a variable was deleted
when data for that particular variable were missing. Among the data, 5,087 motorcycle-related
crashes on Kansas roadways remained for analysis.

37
Chapter 4 Results and Discussion
This chapter presents results and discussions of the analyses done in this study. This
includes state-level modeling of motorcycle fatality rates, comparisons of motorcycle crashes
with other vehicle crashes, contingency table analysis, univariate logistic regression, survey
responses, and ordered probit modeling of motorcycle rider injury severity.
4.1 State-Level Modeling of Motorcycle Fatality Rates
The main objective of this portion of the study was to evaluate the effect of helmet laws
and other factors on motorcycle fatality rates at the state level. Numbers of motorcycle rider
fatalities for all the 50 states and the District of Columbia were obtained for the years 2005, 2006,
and 2007, as mentioned in Chapter 3. A regression analysis was performed by considering factors
potentially related to motorcycle fatalities in a given state. Variables were chosen for regression
modeling after testing the inter-correlation. Dependent variables used for the modeling were the
motorcycle riders’ fatalities per 10,000 motorcycle registrations in a given state and motorcycle
riders’ fatalities per 100,000 populations in a given state for the three years of the study period
(2005 - 2007) in the present models.
Two models were developed in this study to compare motorcyclist fatality rates (log of
motorcyclist fatalities per 10,000 motorcycle registration and log of motorcyclist fatalities per
100,000 populations in all states) by treating helmet laws as a binary variable. The following
section discusses the potential effect of statistically significant factors on motorcycle fatality rates
in each model.
4.1.1 Predictor Variables Selection for Statistical Modeling of Motorcycle Fatalities
Once the candidate variables were selected for the state-level model, as mentioned in
Chapter 3, the first step in the model-building process was to develop and check the linear
38
correlation matrix. Correlation indicates an existing association between the predictor variables,
whereas the correlation coefficient describes the magnitude of this association. A high correlation
coefficient between the response variable and the predictor variable typically results in a better
prediction of the response variable (55). Conversely, high correlation between the predictor
variables implies there is some overlapping information, making it difficult to disentangle the
effects of one predictor variable from another. Moreover, the parameter estimates may highly
depend on which variables are used in the model. Should two independent variables produce a
correlation coefficient close to 1.0, it is impossible to separate their effects. For multiple
regressions, it is important that predictor variables are independent of each other so that the
analysis is not distorted. Hence, it is necessary to include only those predictor variables, which do
not have a high correlation among them. Spearman’s correlation coefficient was used to find
variables that were independent of each other. Using SAS software version 9.1, a correlation
matrix was developed for the variables selected. Independent variables with a correlation
coefficient higher than 0.5 (or 50% correlation) were considered for elimination from the variable
set considered for modeling with motorcycle fatalities per 10,000 motorcycle registrations. This
was executed by keeping one of the variables, which resulted in a better model, and removing the
variables linked to the weaker model. This prompted to ruling out demographic variables like
violent crime rate per 100,000 populations, female and male young drivers, middle-aged and
elderly drivers, population per square mile, and the percentage of bachelor’s degree holders. A
correlation coefficient of 0.65 was used for modeling motorcycle fatalities per 100,000
population, as motorcycle fatalities per motorcycle registrations is a more direct way to measure
risk exposure compared to fatalities per 100,000 populations. In order to accurately identify and
effectively address the growing problem of motorcycle fatalities, the United States Department of

39
Transportation re-base lined its motorcycle fatality rate measure for FY 2008 to reflect a change
of focus from fatalities per 100 million vehicle miles traveled (VMT) to fatalities per 100,000
registrations in a given state. To date, most states do not report motorcycle VMT as it is a difficult
exposure to measure. The accuracy of motorcycle VMT reported by a small number of states is
also quite speculative (3), which might justify the decision of setting a stricter threshold of
correlation coefficient for the model with motorcycle fatalities per 10,000 motorcycle
registrations in a given state. As such, variables with smaller correlation values will be included
in the model.
Variables were also checked for multicollinearity, which occurs when one predictor
correlates with more than one other predictor variable, explaining the same variability already
explained by other predictors. Consequently, some predictors may not provide any additional
information. Multicollinearity also results in significant changes in slope coefficients. As the
magnitude of correlation between predictors increases, standard error of regression coefficients
also increases (55). Multicollinearity can be measured by the variance inflation factor (VIF),
which measures the increase in variability of a coefficient due to collinearity. Here, variance is
referenced as the square of the standard error. The critical value used for the variation inflation
factor is generally 10, and variables having VIF above 10 are considered to be highly correlated
with other predictors. All variables with VIF above 10 were removed from the model.
After ruling out inappropriate predictor variables, an analysis was performed for the
competing influences of the following variables on the fatality rate of motorcyclists. Table 4.1
describes all variables along with their simple statistics and Variance Inflation Factor (VIFs) that
were taken into account for the two models after performing the collinearity tests. From the table

40
it is evident that none of the variables selected for modeling purposes had VIFs greater than 10,
satisfying the criteria of multicollinearity.
Table 4.4 Predictor Variables Selected for Motorcycle Fatality Rate Modeling
Variable Max Min Avg VIF
Population per square mile 9,581.30 1.2 374.7 3.61
Motorcycles registered per 1000 population 89.7 2.0 26.5 3.01
Per capita alcohol consumption (gallons/year) 4.2 1.3 2.4 1.98
Annual daily mean temperature (0Fahrenheit) 75.7 32.0 53.7 4.83
Annual precipitation (inches) 69.8 8.0 36.3 2.64
Helmet law (mandatory or not) 1 0 - 1.6
Percentage of bachelor degree holders or more 47.5 16.5 26.9 4.2
Property crime rate per 100,000 population 4,889.80 1,619.60 3,307.20 2.3
Unemployment percentage 7.8 2.5 4.6 2.09
Per capita income (in $ 1,000) 6,514.40 3,293.80 4,722.70 4.21
Percentage of African Americans 57.3 0.5 11.5 5.25
Percentage of Hispanics 44.4 0.9 9.3 3.84
Percentage of Whites 96.7 24.7 78.7 3.16
Fuel tax (in cents per gallon) 34 7.5 21.2 1.24
Percentage holding valid license for fatally injured
motorcyclists 100.0 25.0 75.3 1.61
Number of older motorcycle riders killed 330 0 62.28 2.16
Highway mileage of rural roads (in 1000 miles) 221.7 0 58.3 1.69
4.1.2 Generalized Least-squares Regression for Motorcyclist Fatalities per 10,000 Motorcycle
Registrations
While the number of motorcycle registrations for individual states is available, the number
of motorcycle miles travelled is not. The number of fatalities per vehicle miles traveled (VMT)
provides a direct means of normalizing for the amount of travel by all motor vehicles. Data for
motorcycles alone do not exist for any state. Numbers of motorcyclist fatalities per 10,000
motorcycle registrations and per 100,000 populations for all states were considered in the present

41
models as response variables representing motorcycle fatality rates from 2005 to 2007. The
logarithm of the motorcyclist fatalities per 10,000 registered motorcycles and per 100,000
populations for all the states was taken. Log of fatality rates were used to reduce concern about
the assumption of ordinary-least square regression. Using logged dependent variables has the
added benefit of resulting in coefficients, which can be interpreted as the approximate proportion
change in the dependent variable for a one-unit increase in a predictor variable (14). Table 4.2
summarizes results of the regression analysis of the model with motorcycle fatalities per 10,000
motorcycle registrations.
Table 4.5 Results of Generalized Least-squares Regression for Log of Motorcycle Fatalities per
10,000 Motorcycle Registrations
Variables Variable Label Parameter Estimate Pr>t
Intercept Intercept 0.19955 0.3624
Per Capita Alcohol Consumption ALCO -0.01937 0.5036
Annual Daily Mean Temperature (0F) ADMT 0.01468 <0.001
*
Annual Precipitation (inches) AP -0.00127 0.2378
Helmet Law HL -0.05492 0.0722*
Total Unemployed Percent UNEMPL 0.01975 0.1804
Per Capita Income (10,000) PCI -0.0674 0.0136*
Percentage of African Americans AFAM 0.0095 <0.001*
Fuel Tax (in cents per gallon) FT 0.0021 0.3787
Older Motorcyclists Killed OD -0.000085 0.7418
Highway Mileage of Rural Roads
(1000mile) HMRR -0.00074 0.0677*
Value of R2 0.61
Adjusted R2 0.58
*(Statistically Significant at 90% Confidence Level)
In the mathematical form, the model could be written as follows:
0.19955 0.01468 0.0722 0.0674 0.0095 0.0677Y ALCO HL PCI AFAM HMRR (4.21)

42
where,
Y = Log of motorcycle fatalities per 10,000 motorcycle registrations.
The significant factors identified through modeling are discussed in the following sections.
Goodness-of-fit measures in both models were considered as R2 and R
2adjusted, where the values
were 0.61 and 0.58, respectively. Considering the values of R2 and R
2adjusted from similar
regression models in other studies, values in the present models are considered to be reasonable
(56).
4.1.2.1 Helmet Law
In the model, mandatory helmet laws were associated with lower fatality rates. One thing
to note is that no-helmet law states were included in the analyses along with the partial-helmet
law states, because there were only three no-law states. The helmet law parameter estimate was
0.0722, p < 0.10. The exact change in the response variable for a 1-unit increase in the predictor
variable is computed, using the following equation:
Y = 100[exp (β) -1] (14) (4.22)
where,
Y = exact change in the response variable for a unit increase in the predictor variable; and
β = parameter estimate of the predictor variable.
The exact decrease that could be expected in motorcycle fatalities per 10,000 motorcycle
registrations by changing the helmet law was calculated by putting the value of β = 0.05492 for
helmet laws in the model. This resulted in a 5.6 percent decrease in motorcycle fatalities when a
mandatory helmet law was introduced in a state. Compared to states with partial-coverage or no-

43
helmet laws, states with mandatory helmet laws had 5.6% fewer motorcycle fatalities per 10,000
motorcycle registrations, based on the present model.
4.1.2.2 Weather Conditions
One of the weather considerations taken into account in this study was annual daily mean
temperature in 0F. The model showed a statistically significant positive correlation between
annual daily mean temperature and motorcyclist fatalities per 10,000 motorcycle registrations.
The p-value for the annual daily mean temperature is found to be <0.001, an expected finding.
Motorcycle activities increase during warm days, increasing the likelihood of more motorcycle
crashes and fatalities. However, the other weather condition, annual precipitation did not show
any statistically significant relation with the motorcycle fatality rate.
4.1.2.3 Per Capita Income
Each state’s average per capita income was negatively correlated with motorcyclist
fatalities per 10,000 motorcycle registrations, p = 0.0136. As discussed in section 2.2 of the
literature review, income has been found to be negatively correlated with traffic fatalities as
people with higher incomes tend to be more aware, place a higher value on safety, and possess the
means to enhance it. Similarly, results from this model shows that the higher per capita income in
a given state, the lower the motorcycle fatalities.
4.1.2.4 Demographic Distribution
Demographic distributions of African American, Hispanic, and White population
percentages were included in the model to test the effect of these groups of people on the
motorcycle fatality rate. Because the collinearity matrix yielded a high correlation between per
capita income and being younger in age for Hispanic and only the African American population
was included in the model, as the collinearity matrix showed a high correlation among the other

44
two population groups and other factors such as young drivers, and per capita income. The p-
value for the African American population percentage was found to be <0.0001. The percentage
of African Americans was found to be positively correlated with motorcyclist fatalities per 10,000
motorcycle registrations. According to the model results, if the percentage of African American
population is high in a given state, motorcycle fatalities per 10,000 motorcycle registrations is
also high.
4.1.2.5 Highway Mileage of Rural Roads
Highway mileage of rural roads in each state was considered as a predictor variable,
which was found to be negatively correlated with motorcyclist fatalities per 10,000 motorcycle
registrations with a p-value of 0.0677. This finding was not consistent with previous research
findings, which revealed that the percentage of urban roads per state is negatively correlated with
the motorcyclist fatality rate (4). Normally, motorcycles tend to be abundant in urban areas,
whereas few numbers of motorcycles are likely to be found in rural areas. So, motorcycle crashes
are likely to increase if there are more urban roads. However, the severities of crashes in rural
areas are typically more severe. Similarly, the model’s results showed that, as highway mileage of
rural roads increases, motorcycle fatalities per 10,000 motorcycle registrations increase as well.
4.1.3 Generalized Least-squares Regression for Motorcyclist Fatalities per 100,000 Population
Table 4.3 shows the other model in which motorcycle fatalities per population of 100,000
was used as a response variable.

45
Table 4.6 Results of Generalized Least-squares Regression for Log of Motorcycle Fatalities per
100,000 Population
Variables Variable Label Parameter Estimate Pr>t
Intercept Intercept -0.13264 0.6567
Population per 1000 square mile POPSQ -0.0378 0.0099*
Motorcycle registered per 1000 population MCR 0.005935 <.0001*
Per capita alcohol consumption(ethanol gallons) ALCO 0.03978 0.1438
Annual daily mean temperature(0F) ADMT 0.00814 0.0018
*
Annual precipitation (inches) AP 0.000022 0.9847
Helmet laws HL -0.07561 0.0043*
Percentage of bachelor’s degree holder or more BGRAD -0.0073 0.0610*
Property crime rate per 100,000 PRCRM 1.984 0.2975
Total unemployed percent UNEMPL -0.01539 0.2733
Per capita income ($1000) PCI -0.0055 0.1022
Percentage of African Americans AFAM 0.00366 0.0757*
Percentage of Hispanics HIS 0.0003 0.8868
Percentage of Whites WHT 0.00197 0.1102
Fuel tax (in cents per gallon) FT -0.0004 0.8461
Percentage of valid licenses for fatally injured MC
drivers
MCDF -0.00083 0.4069
Older motorcyclists killed OD -0.0003 0.1884
Highway mileage of rural roads (per 1000 miles) HMRR -0.00088 0.0073*
Value of R2 0.62
Adjusted R2 0.57
* (Statistically Significant at 90% Confidence Level)
In mathematical form, the model could be written as follows:
0.13264 0.0378 0.005935 0.00814
0.07561 0.0073 0.00366 0.00088
Y POPSQ MCR ADMT
HL BGRAD AFAM HMRR
(4.23)
where,
Y = log of motorcycle fatalities per 100,000 population.

46
Statistically significant factors affecting motorcyclist fatalities per 100,000 population are
discussed in this section. The goodness-of-fit values for R2 and R
2adjusted are 0.62 and 0.57,
respectively, in the current model.
4.1.3.1 Helmet Law
This model also showed that the mandatory helmet laws were associated with lower
fatality rates. The p-value for the helmet law parameter estimate is 0.0043. Helmet laws
negatively correlated with motorcycle fatalities per 100,000 population in the model. The exact
change in the response variable for a 1-unit increase in the predictor variable is computed using
the following equation:
Y = 100[exp (β) -1] (14) (4.24)
where,
Y = exact change in the response variable for a unit increase in the predictor variable; and
β = parameter estimate of the predictor variable.
The exact decrease in motorcycle fatalities per 100,000 population was calculated by
putting the value of β = 0.07561 for helmet laws in the model. The value of percent decrease was
7.85. Compared to states with either partial-coverage or no-helmet laws, states with mandatory
helmet laws had 7.85 percent fewer motorcycle fatalities per 100,000 population. Using the per
capita measure demonstrates the increased effectiveness of mandatory helmet laws. However,
motorcycle fatalities per 100,000 population is not a very good variable with which to measure
the exposure of motorcycle riding.

47
4.1.3.2 Population Density
Population per 1,000 square miles negatively correlated with motorcyclist fatalities per
100,000 population, p = 0.0099, at a 90% confidence level. As the population density increases, it
becomes more difficult for motorcycle riders to drive uninterruptedly at high speeds, lowering the
risk of getting involved in a fatal crash. Previous research has shown mixed results on this
variable. Branas and Knudson (4) previously found that population density (residents per 10
square mile) was positively related to percentage change in fatalities per 10,000 registered
motorcycles (natural log transformation). In another study, a statistically significant negative
relationship between population per square mile and motorcycle fatality rates was found (14).
4.1.3.3 Motorcycle Registrations
Motorcycle registrations per 1000 population were found to be positively correlated with
motorcyclist fatalities per 100,000 population. The relation between motorcycle registrations and
motorcycle fatalities per 100,000 population was significant, p < 0.0001. Increases in motorcycle
registration indicate subsequent increases in the number of motorcycles traveling on roads. In
turn, the number of crashes would rise, resulting in more motorcycle fatalities. Results from the
model also showed that, in a given state, higher numbers of motorcycle registrations are related to
higher per capita motorcycle fatalities.
Results from a previous study demonstrated that, from 1997 to 2003, the increase in
number of fatalities associated with motorcycles less than four years old accounted for 78.1% of
the total increase in motorcyclist fatalities (57).
4.1.3.4 Weather Conditions
The present model showed a statistically significant positive correlation between annual
daily mean temperatures and motorcyclist fatalities per 100,000 population, p = .0018. This is the

48
same finding as the previous model. The model implies that states with longer, warm and dry
seasons have more motorcycle fatalities per 100,000 population. This result can be explained by
the high dependency of motorcycle riding on weather conditions. Annual precipitation, the other
weather condition considered was not significantly related to per capita motorcycle fatalities.
4.1.3.5 Education
Percentage of bachelor’s degree holders for each state was considered as a predictor
variable, which was found to be negatively related to motorcycle fatalities, p = 0.0610. The model
proposes that a larger number of four-year college graduates is linked to fewer motorcycle
fatalities. Additional benefits include a higher likelihood for increased awareness about personal
safety and a sense of responsibility, as well as greater compliance with existing laws.
4.1.3.6 Demographic Distribution
The demographic distribution for African Americans positively correlated with per capita
motorcycle fatalities, p-value = 0.07575. This finding is the same as the previous modeling.
Results from the model results reveal that an increased percentage of African Americans is
associated with a greater number of motorcycle fatalities per 100,000 population.
4.1.3.7 Highway Mileage of Rural Roads
Consistent with the previous model, results from this model yielded a significant
negatively correlation between highway mileage of rural roads and motorcyclist fatalities per
100,000 population, p-value = 0.0073. When the highway mileage of rural roads increases in a
state, motorcycle fatalities per 100,000 population decrease. Typically, motorcycles are more
common in urban areas and roads, increasing the likelihood of motorcycle crashes on urban
roads.

49
4.1.4 Checking for Homoscedastic Disturbances
Constancy of disturbances is called homoscedasticity. When disturbances are not
homoscedastic, they are said to be heteroskedastic. This requirement is derived from the variance
term in the regression model, which is assumed to be constant over the entire regression. A
multiple linear regression model assumes that the error variance remains constant. Scatter plots
are used to assess homoscedasticity. A plot of model-fitted values versus residuals is typically
inspected first. If residuals are evenly distributed along the horizontal line (residual = 0), variance
can be assumed to be constant. The motorcycle fatality model with fatalities per 10,000
motorcycle registrations provided a reasonably good fit with an R2 value of 0.61. It was necessary
to check the homoscedasticity of the model by verifying the assumptions of constant variance of
disturbance. The assumption of constant variance was verified, using the standardized residual
plot in Figure 4.1, which did not show any pattern suggesting the presence of a non-constant
variance or non-linearity. In turn, the assumption of a constant error variance term is validated
from Figure 4.1 for the model. The motorcycle fatality model with fatalities per 10,000
registrations is homoscedastic.

50
Figure 4.1 Standardized Residual Plots for the Model with MC Fatalities per 10,000 MC
Registrations
4.2 Characteristics of Motorcycle Crashes in Kansas
One of the objectives in this study was to identify characteristics of motorcycle crashes in
Kansas from 2004 to 2008. Percentages of motorcycle crashes for different severity levels and
different factors in Kansas from 2004 to 2008 were calculated by extracting data from Kansas
Accident Records System Database (KARS). Comparisons between motorcycle crashes and other
vehicle crashes identified factors affecting motorcycle crashes. Relations between different crash
categories and several factors were also identified using the test of independence as explained in
the methodology section. The calculated chi-square, degree of freedom, and probability values are
presented in this section. Finally, an analysis was performed using univariate logistic regression

51
to identify fatal crash-related factors such as crash characteristics, motorcycle occupants,
vehicles, and contributing circumstances affecting fatal motorcycle crashes in Kansas.
4.2.1 General Characteristics of Motorcycle Crashes in Kansas
Table 4.4 shows the percentages of motorcycle crashes for different types of injury
severity and different crash-related factors in Kansas from 2004 to 2008. Among all motorcycle
maneuvers, fatal motorcycle crashes with overtaking had the highest percentage while fatal
motorcycle crashes with slowing or stopping had the lowest percentage. Motorcycle crashes
involving aggressive maneuvers had the highest share of injury crashes compared to other
maneuvers. Slowing or stopping maneuvers had the highest share of property-damage-only
crashes. Crashes involving right turns had the lowest percentage of fatal crashes. There were no
significant gender effects for motorcycle fatalities – crash percentages were almost the same for
both male and female motorcyclists. Conversely, significant effects were found for type and
frequency of safety equipment. When compared to other types of safety equipment, the highest
percentage of fatal crashes was linked to not using helmets. This was also true for property
damage-only crashes. However, crashes with helmet-wearing riders had a higher share of injury
crashes compared to crashes with riders using other safety equipment. No adverse weather
conditions had a higher percentage of fatal motorcycle crashes than rain, mist, drizzles, and wind
conditions. Among light conditions, motorcycle crashes with dark-no streetlights had the highest
percentage of fatal motorcycle crashes, and daylight crashes had the lowest percentage of fatal
motorcycle crashes. It was vice versa for injury crashes during the same time period. Among
crash classes, collision with fixed objects had the highest percentage of fatal motorcycle crashes.

52
Table 4.7 Percentages of Different Crash Severities for Different Factors for Motorcycles in
Kansas, 2004-2008
Motorcycle Crash Severity Fatal Injury PDO Total
MC Maneuvers
Straight following road 5.01 79.71 15.28 100
Left turn 4.31 79.28 16.41 100
Right turn 2.95 77.05 20.00 100
Overtaking 8.53 73.64 17.83 100
Chasing lanes 2.25 81.46 16.29 100
Aggressive maneuver 3.44 83.05 13.51 100
Slowing or stopping 2.09 75.46 22.45 100
Gender
Male 4.53 78.34 17.13 100
Female 4.86 76.73 18.40 100
Safety Equipment Used
MC helmet and eye protection 3.07 80.46 16.47 100
MC helmet 2.87 81.32 15.81 100
No use of MC helmet 4.60 76.72 18.68 100
Weather Conditions
No adverse conditions 4.16 80.14 15.70 100
Rain, mist, drizzle and winds 3.07 79.82 17.11 100
Light Conditions
Daylight 3.20 80.05 16.76 100
Dawn and dusk 3.23 78.23 18.53 100
Dark-street light on 4.43 80.34 15.22 100
Dark-no street lights 8.14 76.08 15.78 100
Crash Class
Other non-collision 2.51 84.10 13.39 100
Overturned 2.93 86.79 10.28 100
Collision w/ other MV 4.38 74.73 20.89 100
Collision w/ animal 5.47 73.63 20.90 100
Collision w/ fixed object 5.83 84.93 9.23 100
Day of the Week
Weekdays 3.80 79.77 16.43 100
Weekends 4.71 80.71 14.59 100
Substance Abuse
Alcohol contributing to crash 6.32 88.16 5.53 100
Riders under the influence of alcohol 11.40 85.11 3.55 100

53
Table 4.4 Percentages of Different Crash Severities for Different Factors for Motorcycles in
Kansas, 2004-2008. (Continued)
Motorcycle Crash Severity Fatal Injury PDO Total
Contributing Circumstances
Driver 5.45 81.62 12.93 100
Environment 4.95 78.07 16.98 100
Crash Location
Non-intersection-on roadway 3.98 81.77 14.25 100
Intersection-on roadway 4.23 80.45 15.33 100
Intersection-related-on roadway 3.04 75.64 21.31 100
Parking lot-driveway access-on roadway 3.07 78.26 18.67 100
Interchange area-on roadway 3.31 76.16 20.53 100
Roadside-including shoulder-off roadway 8.01 80.62 11.37 100
Surface Characteristics
Straight and Level 2.84 79.89 17.27 100
Straight and grade 6.17 78.33 15.50 100
Straight at hillcrest 9.78 73.91 16.30 100
Curve and level 5.55 84.08 10.38 100
Curve and grade 5.58 83.26 11.16 100
Overturned crashes had the highest share of injury crashes. Motorcycle crashes occurring during
weekends had higher likelihood of fatalities than those during weekdays. When motorcyclists
were under the influence of alcohol, the crashes are more likely to end-up as fatal crashes as
compared to PDO crashes. Motorcycle riders contributed more to fatal motorcycle crashes than
the environment. A similar finding was found for crashes where motorcyclists sustained injury
and survived. However, the contribution of environment to property damage crashes was higher
than that of riders. For example, roadside areas and shoulder-off roadways had the highest
percentage of crash fatalities. When surface characteristics were considered, the highest
percentage of fatal motorcycle crashes occurred on straight surfaces at hillcrests.

54
4.2.2 Contingency Table Analysis
Chi-Square test or contingency table analysis was performed to assess significant relations
between different factors and motorcycle crash severity. From results presented in Table 4.5, it
was evident that most of the factors were related to motorcycle crash severity. Only weather
conditions, day of the crashes, and on-road surface types did not have any effect on motorcycle
crash severity in Kansas. Gender and severity of the crash were significantly related only at the
p<0.1 level but all other factors and motorcycle crash severities were related at the p<0.01 or 99%
confidence level.
When motorcycle maneuvers were considered for fatal crashes, a majority of the
motorcycles were following the road straight and 13.29 % were making left turns at the time of
the crash. The χ2 value indicates a higher level of interdependency between crash severity and
motorcycle maneuvers.
The gender distribution showed that male riders were more likely to be involved across all
types of crashes than female riders. Riders in their twenties comprised 22.47% of motorcycle
fatalities, followed by riders in their forties (19.28%). A majority of motorcycle riders involved in
fatal crashes belonged to the 20-29 years age category with 22.47 %. Age groups of motorcycle
riders are also related to the motorcycle crash severity with high Chi-Square value.
Among the riders using safety equipment, only 9.23 % of motorcycle riders involved in
fatal motorcycle crashes were wearing helmets only at the time of the crashes, whereas the usage
percentages were higher for injury and no-injury crashes. When helmet usage was considered,
only 16.53% of the motorcycle riders involved in fatal crashes were wearing helmets. Higher
levels of interdependency were evident between different types of safety equipment used and

55
crash severity. The chi-square value also indicated interdependence between helmet usage and
motorcycle crash severity.

56
Table 4.8 Contingency Table Analysis for Motorcycle Crash Severity and Various Factors in
Kansas, 2004-2008
Description Fatal Injury Property Damage Only
Total Number % Number % Number %
Motorcycle maneuver
Straight following road 232 73.42 3,688 68.07 707 64.74 4,627
Left turn 42 13.29 773 14.27 160 14.65 975
Right turn 9 2.85 235 4.34 61 5.59 305
Overtaking 11 3.48 95 1.75 23 2.11 129
Aggressive maneuver 14 4.43 338 6.24 55 5.04 407
Slowing or stopping 8 2.53 289 5.33 86 7.88 383
Total 316 100.00 5,418 100.00 1092 100.00 6,826
Chi-Square value = 33.08 DF = 10 P = 0.0003
Gender
Male 328 72.4 5,420 73.5 1131 71.67 6,879
Female 125 27.59 1,954 26.49 447 28.32 2,526
Total 453 100.00 7,374 100.00 1578 100.00 9,405
Chi-Square value = 4.71 DF = 2 P = 0.095
Age (years)
16 to 19 years 115 15.29 1,742 14.27 396 14.92 2,253
20 to 29 years 169 22.47 3,223 26.41 736 27.73 4,128
30 to 39 years 119 15.82 2,236 18.32 476 17.94 2,831
40 to 49 years 145 19.28 2,401 19.67 494 18.61 3,040
50 to 59 years 109 14.49 1,618 13.26 354 13.34 2,081
60 to 69 years 63 8.38 577 4.73 114 4.3 754
70 and above years 32 4.26 407 3.33 84 3.17 523
Total 752 100.00 12,204 100.00 2654 100.00 15,610
Chi-Square value = 35.33 DF = 12 P = 0.0004
Type of Safety Equipment Used
MC helmet and eye protection 39 15 1,021 20.47 209 18.3 1,269
MC eye protection 88 33.85 1,347 27 229 20.05 1,664
MC helmet 24 9.23 679 13.61 132 11.56 835
Shoulder lap 109 41.92 1,942 38.93 572 50.09 2,623
Total 260 100.00 4,989 100.00 1142 100.00 6,391
Chi-Square value = 63.29 DF = 6 P<0.0001
Helmet Usage
Helmet used 39 16.53 1021 23.69 209 20.69 1,269
No use of helmet 197 83.47 3289 76.31 801 79.31 4,287
Total 236 100.00 4310 100.00 1010 100.00 5,556
Chi-Square value = 9.75 DF = 2 P = 0.004

57
Table 4.5 (Continued)
Description Fatal Injury Property Damage Only Total
Number % Number % Number %
Weather Conditions
No adverse conditions 207 96.73 3,991 95.64 782 95.25 4,980
Rain, mist, or drizzle 3 1.40 106 2.54 28 3.41 137
Strong winds 4 1.87 76 1.82 11 1.34 91
Total 214 100.00 4,173 100.00 821 100.00 5,208
Chi-Square value = 4.22 DF = 4 P = 0.6373
Light Conditions
Daylight 197 57.43 4,934 69.40 1033 70.13 6,164
Dawn n dusk 15 4.37 363 5.11 86 5.84 464
Dark-street light on 67 19.53 1,214 17.08 230 15.61 1,511
Dark-no street lights 64 18.66 598 8.41 124 8.42 786
Total 343 100.00 7,109 100.00 1473 100.00 8,925
Chi-Square value = 51.09 DF = 6 P<0.0001
Crash Class
Other non-collision 12 5.66 402 9.81 64 7.98 478
Overturned 37 17.45 1,097 26.77 130 16.21 1,264
Collision w/ other MV 98 46.23 1,671 40.78 467 58.23 2,236
Collision w/ animal 17 8.02 229 5.59 65 8.10 311
Collision w/ fixed object 48 22.64 699 17.06 76 9.48 823
Total 212 100.00 4,098 100.00 802 100.00 5,112
Chi-Square value = 261.57 DF = 8 P<0.0001
Day of the week
FR 26 11.98 663 15.77 141 17.07 830
SA 53 24.42 850 20.22 159 19.25 1,062
SU 39 17.97 727 17.3 126 15.25 892
MO 21 9.68 452 10.75 82 9.93 555
TU 22 10.14 470 11.18 97 11.74 589
WE 30 13.82 532 12.66 121 14.65 683
TH 26 11.98 509 12.11 100 12.11 635
Total 217 100.00 4,203 100.00 826 100.00 5,246
Chi-Square value = 10.21 DF = 12 P=0.5978
Times of Crashes (hours)
0000 to 0259 21 9.68 251 5.98 42 5.08 314
0300 to 0559 6 2.76 83 1.98 17 2.06 106
0600 to 0859 9 4.15 302 7.19 66 7.99 377
0900 to 1159 19 8.76 403 9.60 77 9.32 499
1200 to 1459 30 13.82 769 18.31 138 16.71 937
1500 to 1759 57 26.27 1,108 26.38 231 27.97 1,396
1800 to 2059 32 14.75 814 19.38 162 19.61 1,008
2100 to 2400 43 19.82 470 11.19 93 11.26 606
Total 217 100.00 4,200 100.00 826 100.00 5,246
Chi-Square value = 29.89 DF = 14 P=0.0079

58
Table 4.5 (Continued)
Description Fatal Injury Property Damage Only Total
Number % Number % Number %
Contributing Circumstances
Driver 312 93.69 4,671 93.38 740 91.13 5,723
Environment 21 6.31 331 6.62 72 8.87 424
Total 333 100.00 5,002 100.00 812 100.00 6,147
Chi-Square value = 5.69 DF = 2 P=0.0579
On-Road Surface Characteristics
Straight and level 94 45.63 2,641 63.59 571 70.41 3,306
Straight and grade 45 21.84 571 13.75 113 13.93 729
Straight at hillcrest 9 4.37 68 1.64 15 1.85 92
Curve and level 31 15.05 470 11.32 58 7.15 559
Curve and grade 27 13.11 403 9.70 54 6.66 484
Total 206 100.00 4,153 100.00 811 100.00 5,170
Chi-Square value = 57.96 DF = 8 P<0.0001
On-Road Surface Types
Concrete 51 23.83 1,070 26.28 222 28.28 1,343
Blacktop 163 76.17 3,001 73.72 563 71.72 3,727
Total 214 100.00 4,071 100.00 785 100.00 5,070
Chi-Square value = 2.16 DF = 2 P= 0.34
Crash Location 91 42.52 1,870 44.94 326 39.61 5,141
Non-intersection-on roadway 51 23.83 971 23.34 185 22.48 1,365
Intersection-on roadway 19 8.88 472 11.34 133 16.16 2,539
Intersection-related-on
roadway 12 5.61 306 7.35 73 8.87 175
Parking lot-driveway access-
on roadway 10 4.67 230 5.53 62 7.53 115
Interchange area-on roadway 31 14.49 312 7.50 44 5.35 206
Roadside-including shoulder-
off roadway 214 100.00 4,161 100.00 823 100.00 9,541
Total
Chi-Square value = 47.47 DF = 10 P<0.0001
When it came to the weather conditions, almost all fatal, injury, and no-injury, motorcycle
crashes occurred during non-adverse weather conditions. No interdependence was found from the
chi-square value between weather conditions and motorcycle crash severity. A majority of fatal
motorcycle crashes occurred in daylight. Light conditions during crashes were significantly

59
related to motorcycle crash severity. 46.23% of fatal motorcycle crashes involved in collisions
with other motor vehicles. A higher chi-Square value indicated strong interdependence between
crash classes and crash severity. Although Saturday was the day with the highest percentage of
fatal motorcycle crashes (24.42 %), no relation was found between day of the crashes and crash
severity. But high chi-Square value indicated strong dependence between times of crashes and
motorcycle crash severities. Drivers or motorcycle riders contributed to a majority of the fatal
motorcycle crashes (93.69 %), and contributory circumstances was found to be related to
motorcycle crash severity from the Chi-Square value. 46.53% of fatal motorcycle crashes
occurred on straight and level roads. On-road surface characteristics were strongly
interdependent with motorcycle crash severities. However, no interdependence was found
between on-road surface types and motorcycle crash severity. The highest percentage of fatal
motorcycle crashes occurred on non-intersection roadways (42.52%). Crashes with different
locations had a high chi-Square value, indicating a higher level of interdependency between crash
locations and motorcycle crash severities.
4.2.3 Comparison of Characteristics between Motorcycle Crashes and Other Vehicle Crashes
To better understand characteristics of motorcycle crashes in Kansas, several comparisons
were produced between motorcycle crashes and other vehicle crashes in Kansas from 1999 to
2008. The average percentage of motorcycle crashes and other vehicle crashes for several factors
were compared with the intention of identifying factors which were more common among
motorcycle crashes than other vehicle crashes. Trend comparisons were also made between
motorcycle crashes and other vehicle crashes from 2004 to 2008 (see Appendix B).
When considering vehicle maneuvers for the 10 year period from 1999 to 2008, a similar
distribution for different maneuvers was observed from Figure 4.2. Straight-following roads

60
involved the highest percentage of crashes for both motorcycles and other vehicles. Other
maneuvers also followed pretty much the same pattern for both motorcycle crashes and other
vehicle crashes.
Figure 4.2 Average Percentage Comparison between MC and Other Vehicle Crashes for Vehicle
Maneuvers
Figure 4.3 presents the trends for different types of maneuvers across motorcycle crashes
and those involving other vehicles crashes for the five-year period (2004-2008). The percentage
of crashes involving motorcycles was higher than that of other vehicles. In addition, slowing or
stopping maneuvers had an increasing trend for motorcycles. However, no trend was consistent
for any other maneuvers.
0.0
10.0
20.0
30.0
40.0
50.0
60.0
70.0
Straight-FollowingRoad
Left Turn Right Turn U Turn Overtaking AggressiveManeuver
Other
% o
f T
ota
l C
rash
es
Vehicle Maneuver
Motorcycle Other Vehicle

61
▬■▬ Other vehicles ▬♦▬ Motorcycles
Figure 4.3 Trend of Crashes Involving Motorcycles and Other Vehicles Based on Vehicle
Maneuvers
Age for both motorcycle and non-motorcycle drivers involved in crashes were examined
as an important factor. There were six categories for age (spanning driver ages from 16 to 70
years or older), which were synthesized into three larger groups: young (29 years old or younger),
middle-aged (30 to 59 years old), and older (at least 60 years old). The percentage of involvement
in non-motorcycle crashes was higher for younger and older drivers than for those involved in
motorcycle crashes (see Figure 4.4). However, middle-aged drivers had higher percentages of
involvement for motorcycle crashes.
Left Turn
0.0
2.0
4.0
6.0
8.0
10.0
12.0
14.0
2004 2005 2006 2007 2008
Year
% o
f to
tal
Cra
sh
es
Straight Following Road
50.0
52.0
54.0
56.0
58.0
60.0
62.0
2004 2005 2006 2007 2008
Year
% o
f T
ota
l C
ras
he
s
Aggressive Manever
0.0
1.0
2.0
3.0
4.0
5.0
6.0
2004 2005 2006 2007 2008
Year
% o
f T
ota
l C
rash
es
Slowing or Stopping
0.00
2.00
4.00
6.00
8.00
2004 2005 2006 2007 2008
Year
% o
f T
ota
l C
ras
he
s

62
Figure 4.4 Average Percentage Comparison between Motorcycle and Other Vehicle Crashes by
Driver Age
Figure 4.5 shows the trend for young, middle-aged, and older driver crashes for
motorcycles and other vehicles. The percentage of crash involvement for middle-aged motorcycle
riders was higher than other motor vehicle operators. Over the five-year period, crashes that
involve young and middle-aged motorcycle riders did not show any exact trend. However,
crashes involving older motorcycle riders yielded an increasing trend, compared to the fairly
constant trend of crashes involving older drivers operating other types of vehicles. This may be
explained by the significant change in demographic characteristics for motorcycle operators and
owners over the last ten years, shifting median age of motorcycle riders from 25 to 41 years old
(59). Other vehicle crashes involving young and middle aged-drivers showed a constant trend,
compared to the unpredictable trend of motorcycle riders involving those age groups.
0.0
5.0
10.0
15.0
20.0
25.0
30.0
16 to 19 20 to 29 30 to 39 40 to 49 50 to 59 60 to 69 70 and above
% o
f to
tal C
rash
es
Age (Years)
Motorcycle Other Vehicle

63
▬■▬ Other vehicles ▬♦▬ Motorcycles
Figure 4.5 Trend of Crashes Involving Motorcycles and Other Vehicles Based on Age of the
Drivers
Figure 4.6 shows the average percentage comparison between motorcycle crashes and
other vehicles crashes for different light conditions. The percentages of motorcycle crashes in
dark conditions with streetlights on were higher than those of other vehicle crashes. However,
daylight and dark conditions with no streetlights had lower percentages of motorcycle crashes.
Figure 4.7 shows the trend of motorcycle crashes and other vehicle crashes based on
different light conditions, which shows an increasing trend of motorcycle crashes in daylight
conditions. Conversely, the trend for other vehicle crashes was the opposite. Motorcycle crashes
with dark conditions (streetlights on) had a decreasing trend and for other vehicles it was an
increasing trend. Because motorcycle riding is a seasonal activity, motorcyclists typically prefer
Young Drivers
0.0
5.0
10.0
15.0
20.0
25.0
30.0
2004 2005 2006 2007 2008
Year
% o
f T
ota
l C
rash
es
Middle Aged Drivers
0.0
5.0
10.0
15.0
20.0
2004 2005 2006 2007 2008
year
% o
f T
ota
l C
rash
Older Drivers
0.0
2.0
4.0
6.0
8.0
2004 2005 2006 2007 2008
Year
% o
f to
tal C
rash
es

64
to ride during sunny and warm weather. Accordingly, the percentage of motorcycle crashes with
daylight conditions was the highest.
Figure 4.6 Average Percentage Comparison between Motorcycle and Other Vehicle Crashes
Under Different Light Conditions
0.0
10.0
20.0
30.0
40.0
50.0
60.0
70.0
80.0
Daylight Dawn Dusk Dark-Street Light On Dark-No Street Lights
% o
f to
tal
Cra
sh
es
Light Conditions
Motorcycle Other Vehicle

65
▬■▬ Other vehicles ▬♦▬ Motorcycles
Figure 4.7 Trends of Crashes Involving Motorcycles and Other Vehicles Based on Light
Conditions
Figure 4.8 shows the distribution of different crash classes for motorcycle and other
vehicle crashes in Kansas for data from 2004 to 2008. The percentage of overturned motorcycle
crashes was considerably higher than those of other vehicles. More crashes involving collisions
with fixed objects occurred for motorcyclists than for drivers operating other motor vehicles.
However, crashes resulting from motorcycle collisions with other motor vehicles had a lower
percentage than for vehicles colliding with other vehicles on the road. This finding can be
explained by the increased likelihood of motorcycles to be involved in fatal collisions with fixed
objects, compared to other vehicles (25). Trends of motorcycle crashes and other vehicle crashes
for these crash classes are represented in Figure 4.9. Trends of overturned motorcycle crashes and
Daylight
64.00
66.00
68.00
70.00
72.00
74.00
2004 2005 2006 2007 2008
Year
% o
f to
tal C
ras
he
s
Dark- streetlights on
12.00
13.00
14.00
15.00
16.00
17.00
18.00
2004 2005 2006 2007 2008
Year
% o
f T
ota
l C
ras
he
s
Dark-no streetlights
0.00
5.00
10.00
15.00
2004 2005 2006 2007 2008
Year
% o
f T
ota
l C
rash
es

66
collisions with other motor vehicles remained more or less constant over the time period.
However, an increasing trend can be noticed for motorcycle crashes involved in collisions with
fixed objects. This increasing trend was also true for other vehicle crashes involving fixed
objects.
Figure 4.8 Average Percentage Comparison between Motorcycle and Other Vehicle Crashes for
Crash Classes
0.0
10.0
20.0
30.0
40.0
50.0
60.0
70.0
80.0
Non-
Collision
Overturned Collision w/
Pedestrians
Collision w/
OtherVehicles
Collision w/
ParkedVehicles
Collision w/
Train
Collision w/
Pedacycle
Collision w/
Animal
Collision w
Fixed Object
% o
f to
tal C
rash
es
Crash Class
Motorcycle Other Vehicle

67
▬■▬ Other vehicles ▬♦▬ Motorcycles
Figure 4.9 Trend of Crashes Involving Motorcycles and Other Vehicles Based on Crash Classes
Figure 4.10 shows the distribution of motorcycle and other vehicle crashes occurring on
different days of the week. A higher percentage of motorcycle crashes occurred during weekends
than other vehicle crashes. The contingency table analysis did not find any significant dependence
between motorcycle crash severity and day of the crash. Trends in Figure 4.11 do not display any
exact patterns for motorcycle crashes occurring during weekdays or weekends from 2004 to 2008.
The percentage of motorcycle crashes remained steady for crashes occurring on weekdays. While
the percentage of weekend motorcycle crashes decreased intermediately, it was more or less the
same in 2004 and 2008.
Collision with other Motor Vehicles
0.00
10.00
20.00
30.00
40.00
50.00
60.00
70.00
80.00
2004 2005 2006 2007 2008
Year
% o
f T
ota
l C
rash
es
Collision with Fixed Object
0.00
5.00
10.00
15.00
20.00
2004 2005 2006 2007 2008
Year
% o
f T
ota
l C
rash
es
Overturned
0.00
5.00
10.00
15.00
20.00
25.00
30.00
2004 2005 2006 2007 2008
Year
% o
f T
ota
l C
rash
es

68
Figure 4.10 Average Percentage Comparison between Motorcycle and Other Vehicle Crashes by
Day of the Crashes
Figure 4.12 shows the distribution of motorcycle crashes and other vehicle crashes by the
time the crashes occurred, which was measured in 3-hour intervals. Motorcycle crashes
occurring from 6:00 p.m. to 9:00 p.m., from 9:00 p.m. to 12:00 a.m., and from 12:00 a.m. to 3:00
a.m. had higher incidence percentages compared to other vehicle crash percentages.
▬■▬ Other vehicles ▬♦▬ Motorcycles
Figure 4.11 Trend of Crashes Involving Motorcycles and Other Vehicles Based on Day of the
Crashes
0.0
5.0
10.0
15.0
20.0
25.0
FR SA SU MO TU WE TH
% o
f T
ota
l C
ras
he
s
Day of the Crash
Motorcycle Other Vehciles
Weekdays
0.00
20.00
40.00
60.00
80.00
100.00
2004 2005 2006 2007 2008
Year
% o
f to
tal C
rash
es
Weekends
0.00
10.00
20.00
30.00
40.00
2004 2005 2006 2007 2008
Year
% o
f T
ota
l C
rash
es

69
The trend for the time period from 9:00 p.m. to 12:00 a.m. showed a decreasing pattern over time,
compared to the steady pattern for other vehicle crashes (Figure 4.13). However, the time period
from 6:00 pm to 9:00 pm did not yield a consistent pattern.
Figure 4.12 Average Percentage Comparison between Motorcycle and Other Vehicle Crashes in
Kansas for Time of the Crashes, 1999-2008
▬■▬ Other vehicles ▬♦▬ Motorcycles
Figure 4.13 Crashes Involving Motorcycles and Other Vehicles Based on Time of the Crashes
0.0
5.0
10.0
15.0
20.0
25.0
30.0
0000 to 0259 0300 to 0559 0600 to 0859 0900 to 1159 1200 to 1459 1500 to 1759 1800 to 2059 2100 to 2400
% o
f T
ota
l C
rash
es
Time of the Day
Motorcycle Other Vehcile
time (1800 to 2059)
0.00
5.00
10.00
15.00
20.00
25.00
2004 2005 2006 2007 2008
Year
% o
f T
ota
l C
rash
es
Time (2100 to 2400)
0.00
2.00
4.00
6.00
8.00
10.00
12.00
14.00
2004 2005 2006 2007 2008
Year
% o
f T
ota
l C
rash
es

70
Figure 4.14 shows that the percentage of motorcycle crashes influenced by driver-related
factors was higher than other vehicle crashes. However, it is important to note that driver-related
factors predominantly contributed reason to both types of crashes. Environmental factors
contributed to a lower percentage of motorcycle crashes than other vehicle crashes. The
percentage of motorcycle crashes contributed by the environment did not show any trend (Figure
4.15). However, motorcyclist driver contributions to crashes displayed a decreasing trend from
2004 to 2008, potentially due to motorcycle riders becoming more careful and using various types
of safety gear.
Figure 4.14 Average Percentage Comparison between Motorcycle and Other Vehicle Crashes for
Contributing Factors
0.0
10.0
20.0
30.0
40.0
50.0
60.0
70.0
80.0
90.0
100.0
At Road Condition Driver Environment On Road Condition Pedestrian Vehicle
% o
f T
ota
l C
rash
es
Contributing Circumstances
Motorcycle Other Vehicles

71
▬■▬ Other vehicles ▬♦▬ Motorcycles
Figure 4.15 Trends of Crashes Involving Motorcycles and Other Vehicles Based on Contributing
Factors
Figure 4.16 shows all driver contributory factors where the percentage of motorcycle
crashes was higher than that of other vehicle crashes. Driver-related factors linked to this higher
percentage for motorcycle crashes included riding under the influence of alcohol, exceeding
speed limits, driving too fast for existing conditions, and using evasive actions.
Driver
76.078.080.082.084.086.088.090.092.0
2004 2005 2006 2007 2008
Year
% o
f T
ota
l C
ras
he
s
Environment
0.0
2.0
4.0
6.0
8.0
10.0
12.0
2004 2005 2006 2007 2008
Year
% o
f T
ota
l C
ras
he
s

72
Figure 4.16 Average Percentage Comparison between Motorcycle and Other Vehicle Crashes for
Driver Contributory Factors
Figure 4.17 shows the percentage of motorcycle and other vehicle crashes based on road
surface characteristics. The percentage of motorcycle crashes occurring on straight and level
roads was lower than for other vehicle crashes. Conversely, motorcycle crashes accounted for
higher percentages of crashes when roads were either curved and level or graded and curved.
Trends for motorcycle crashes occurring on curved and level or curved on grade roads did not
follow any pattern over the time period from 2004 to 2008 (Figure 4.18). The Chi-Square test
showed a higher level of interdependency between on-road surface characteristics and motorcycle
crash severity (Table 4.5).
Figure 4.19 shows that the percentage of non-intersection motorcycle crashes was higher
than other vehicle crashes. However, the percentage of motorcycle crashes at intersections was
lower, than those of other vehicle crashes, which may be due to the tendency of many
motorcyclists to ride at higher speeds on non-intersection roadways. A similar trend was shown
0.0
10.0
20.0
30.0
40.0
50.0
60.0
70.0
80.0
90.0
Under Influenceof Alcohol
ExceededPosted Speed
Limit
Too Fast forConditions
ImproperPassing
Non Compliancew/ LicenseRestriction
Avoidance orEvasive action
Aggressive /Antagonistic
driving
Reckless /Careless driving
Other
% o
f T
ota
l C
ras
he
s
Driver Contributory Factors
Motorcycle Other Vehicles

73
for both types of crashes over the five-year period in Figure 4.20. Also, the Chi-Square test
showed a higher level of interdependency between crash location and motorcycle crash severity.
Figure 4.17 Average Percentage Comparison between Motorcycle and Other Vehicle Crashes for
On-Road Surface Characteristics
▬■▬ Other vehicles ▬♦▬ Motorcycles
Figure 4.18 Trend of Crashes Involving Motorcycles and Other Vehicles Based on On-Road
Surface Characteristics
0.0
10.0
20.0
30.0
40.0
50.0
60.0
70.0
80.0
Straight and Level Straight on Grade Straight at Hillcrest Curved and Level Curved on Grade Curved at Hillcrest
% o
f T
ota
l C
rash
es
Surface Characteristics
Motorcycle Other Vehicles
Curved on grade
0.00
2.00
4.00
6.00
8.00
10.00
12.00
2004 2005 2006 2007 2008
Year
% o
f To
tal C
rash
es
Curved and level
0.0
5.0
10.0
15.0
2004 2005 2006 2007 2008
Year
% o
f T
ota
l Cra
sh
es

74
Figure 4.19 Average Percentage Comparison between Motorcycle and Other Vehicle Crashes for
Crash Location
▬■▬ Other vehicles ▬♦▬ Motorcycles
Figure 4.20 Crashes Involving Motorcycles and Other Vehicles Based on Crash Location
The influence of factors, such as time, vehicle maneuvers, and driver characteristics on the
outcomes of crashes involving motorcycles can significantly vary from that of crashes involving
0.0
5.0
10.0
15.0
20.0
25.0
30.0
35.0
40.0
45.0
50.0
Non-
Intersection-on
Roadway
Intersection-on
Roadway
Intrsection-
Related-on
Roadway
Pklot-Drvway
Access-on
Roadway
Interchange
Area-on
Roadway
On Crossover-
on Roadway
Roadside-Incl
Shldr-off
Rdwy
Median-off
Roadway
% o
f to
tal C
ras
he
s
Crash Location
Motorcycle Other Vehicles
Non Intersection
0.0
10.0
20.0
30.0
40.0
50.0
2004 2005 2006 2007 2008
Year
% o
f T
ota
l C
rash
es
Intersection
0.0
5.0
10.0
15.0
20.0
25.0
30.0
2004 2005 2006 2007 2008
Year
% o
f T
ota
l C
rash
es

75
other types of vehicles. For example, the percentage of motorcycle crashes was higher during the
weekends compared to other vehicles crashes. Similarly, certain vehicle maneuvers straight
following road, U turn, or overtaking) and most driver characteristics are also linked to a greater
percentage of motorcycle crashes.
4.2.4 Univariate Logistic Regression
Univariate logistic regressions were conducted to identify important characteristics
affecting fatal motorcycle crashes in Kansas. One subcategory for every factor was treated as a
reference group. Subcategory odds ratios were compared to the reference group odds ratios to
understand the relative effect of those factors on fatal motorcycle crashes in Kansas, p < .01 (see
Table 4.6). Odds ratio for a subcategory resulting in greater than unity, compared to the reference
group, indicates higher likelihood of that subcategory affecting motorcycle fatal crashes.
4.2.4.1 Motorcycle Maneuvers
The KARS database also includes information about different types of motorcycle
maneuvers, such as straight following road, left or right turn, overtaking, changing lanes,
aggressive maneuver, slowing, and stopping. All maneuver types were recorded by police officers
at the scene of the crashes from information gathered post-crash. Straight following road was
considered as the reference group in this case, and the odds ratio was 1. Results from the study
revealed that overhauling maneuvers significantly increased the risk of a fatal crash, with an odds
ratio of 1. Conversely, that risk significantly lessened for slowing or stopping maneuvers: odds
ratios were 1.766 and .404, respectively. When compared to the reference group, the odds of a
fatal motorcycle crash increased by approximately 77% for overtaking, whereas it decreased by
almost 60% for slowing or stopping maneuvers. These results are realistic as the overtaking is

76
likely to increase the chance of getting involved in a more severe crash. On the other hand,
slowing or stopping might potentially reduce the risk of motorcycle fatal crashes.

77
Table 4.9 Results of Univariate Logistic Regression of Motorcycle Fatal Crashes in Kansas
Factors and their sub-categories Odds Ratio Pr>Chisq 95% CI
MC MANEUVER (Reference group = Straight following road)
Left turn 0.853 0.3532 0.609 1.194
Right turn 0.576 0.1098 0.293 1.133
Overtaking 1.766 0.0776* 0.939 3.322
Chasing lanes 0.436 0.1033 0.16 1.184
Aggressive maneuver 0.675 0.1605 0.39 1.169
Slowing or stopping 0.404 0.0127* 0.198 0.824
GENDER (Reference group = male)
Female 1.04 0.715 0.842 1.285
AGE GROUP (Reference group = 30 to 39 years)
16 to 19 years 0.882 0.5383 0.591 1.1316
20 to 29 years 1.169 0.3403 0.848 1.612
40 to 49 years 1.362 0.0676* 0.978 1.896
50 to 59 years 1.318 0.1245 0.927 1.875
60 to 69 years 2.317 <0.0001* 1.551 3.461
70 years and above 1.592 0.0857* 0.937 2.704
TYPES OF SAFETY EQUIPMENTS USE (Reference group = No use of motorcycle helmet)
MC Helmet 0.614 0.0265* 0.4 0.945
MC Helmet and eye protection 0.658 0.019* 0.464 0.934
LIGHT CONDITIONS (Reference group = daylight)
Dawn and dusk 1.012 0.9654 0.593 1.725
Dark-street light on 1.405 0.0185* 1.059 1.865
Dark-no street lights 2.685 <0.0001* 2.004 3.597
TIME OF THE CRASHES (Reference group = 0300 to 0600 hours)
0000 to 0300 hours 1.195 0.7095 0.469 3.044
0600 to 0900 hours 0.408 0.0959* 0.142 1.172
0900 to 1200 hours 0.66 0.3872 0.257 1.694
1200 to 1500 hours 0.551 0.1949 0.224 1.357
1500 to 1800 hours 0.709 0.437 0.299 1.686
1800 to 2100 hours 0.546 0.1861 0.223 1.339
2100 to 2400 hours 1.273 0.5909 0.528 3.07
OR SURFACE CHARACTERISTICS (Reference group =straight and level)
Straight on grade 2.248 <0.0001* 1.561 3.238
Straight at hillcrest 3.705 0.0003* 1.808 7.595
Curved and level 2.006 0.001* 1.323 3.042
Curved on grade 2.019 0.0017* 1.301 3.132
CRASH LOCATION (Reference group = interchange are on roadway)
Non-intersection-on roadway 1.21 0.5738 0.623 2.351
Intersection-on roadway 1.288 0.4718 0.646 2.568
Intersection-related-on roadway 0.917 0.8273 0.421 1.997
Parking lot-driveway access-on roadway 0.925 0.8569 0.394 2.17
Roadside-including shoulder-off roadway 2.544 0.0121* 1.227 5.275
WEATHER CONDITIONS (Reference group = no adverse conditions)
Rain, mist, drizzle, and winds 0.731 0.4218 0.34 1.571

78
Table 4.6 (Continued)
Factors and their sub-categories Odds Ratio Pr>Chisq 95% CI
CRASH CLASS (Reference group= other non-collision)
Overturned 1.171 0.6391 0.605 2.265
Collision w/ other MV 1.78 0.063* 0.969 3.269
Collision w/ animal 2.245 0.0353* 1.057 4.769
Collision w/ fixed object 2.405 0.0075* 1.265 4.575
DAY OF THE WEEK FOR CRASHS (Reference group =Monday)
FR 0.822 0.5125 0.458 1.477
SA 1.336 0.2717 0.797 2.238
SU 1.163 0.5854 0.677 1.998
TH 1.086 0.7837 0.604 1.952
TU 0.987 0.9655 0.536 1.815
WE 1.168 0.5924 0.661 2.064
CONTRIBUTORY FACTORS (Reference group = driver)
Environment 0.904 0.6616 0.574 1.422
SUBTANCE ABUSE (Reference group = alcohol present among the riders)
Alcohol contributing to motorcycle crash 0.527 0.0586* 0.271 1.024
CI = Confidence Interval
* (statistically significant at 90% confidence level)
4.2.4.2 Gender
This study found that the odds ratio of female motorcycle occupants, including riders and
passengers was slightly higher than male motorcycle occupants in Kansas. Previous studies have
shown that women have a higher probability of more severe injuries, compared to men (38).
However, this study found that, when compared to male occupants, the odds of a fatal motorcycle
crash for women occupants increased only by 4%, which was not statistically significant.
4.2.4.3 Age Group
Age for motorcyclists was divided into several sub-groups. Previously, Mannering and
Grodsky found that being 26 to 39 years old were positively associated with medium-risk
categories of injury (33). In light of this, the reference age group for this study was those between
30 to 39 years. Results showed that motorcyclists aged 40-49 years, 60-69 years as well as those
over 70 years old had considerably higher odds of being in a fatal crash. When compared to the

79
reference group, those aged 60-69 years were over 200 % more likely to be involved in a fatal
crash, p < 0.1. Similarly, others also found that older motorcyclists had an increased likelihood of
fatalities and disabling injuries (36). Although older motorcyclists are less likely to crash or to
speed, they tend to sustain more severe injuries, should a crash occur. Demographics for
motorcycle buyers and operators may also account for the increased number of severe crashes in
older age groups. According to, motorcycles are more likely to be purchased by those over 35
years old. Moreover, the rate of fatalities for riders 40 years old and older has risen from 14% in
1990 to 45% in 2003 (59).
4.2.4.4 Types of Safety Equipment Used
This factor was subcategorized into motorcycle helmet and eye protection, motorcycle
helmet only, and no use of motorcycle helmet, which were the safety equipment typically used by
motorcyclists in Kansas. The reference group was chosen as the “no use of motorcycle helmet” to
examine the effect of helmet use and non-use. The requirements for the no-helmet condition
included simultaneous shoulder and lap belt use and only using the lap belt, as well as only using
eye protection or deployed airbags. Results showed that helmet use, either alone or with eye
protection, significantly lowered the risk of motorcycle fatal crashes. When compared to the no-
helmet condition, the odds ratio for helmet use (0.614) indicated that wearing a helmet
significantly decreased the risk of fatal crashes by almost 40%, p < 0.10. Similarly, the odds ratio
for simultaneous helmet and eye protection use (0.658), showed a significant decrease in risk of
almost 35%, p < 0.10).
4.2.4.5 Light Conditions
Light conditions during the time of the crashes were also considered to conduct logistic
regression relating to crash fatalities. Light conditions were divided into four subcategories as
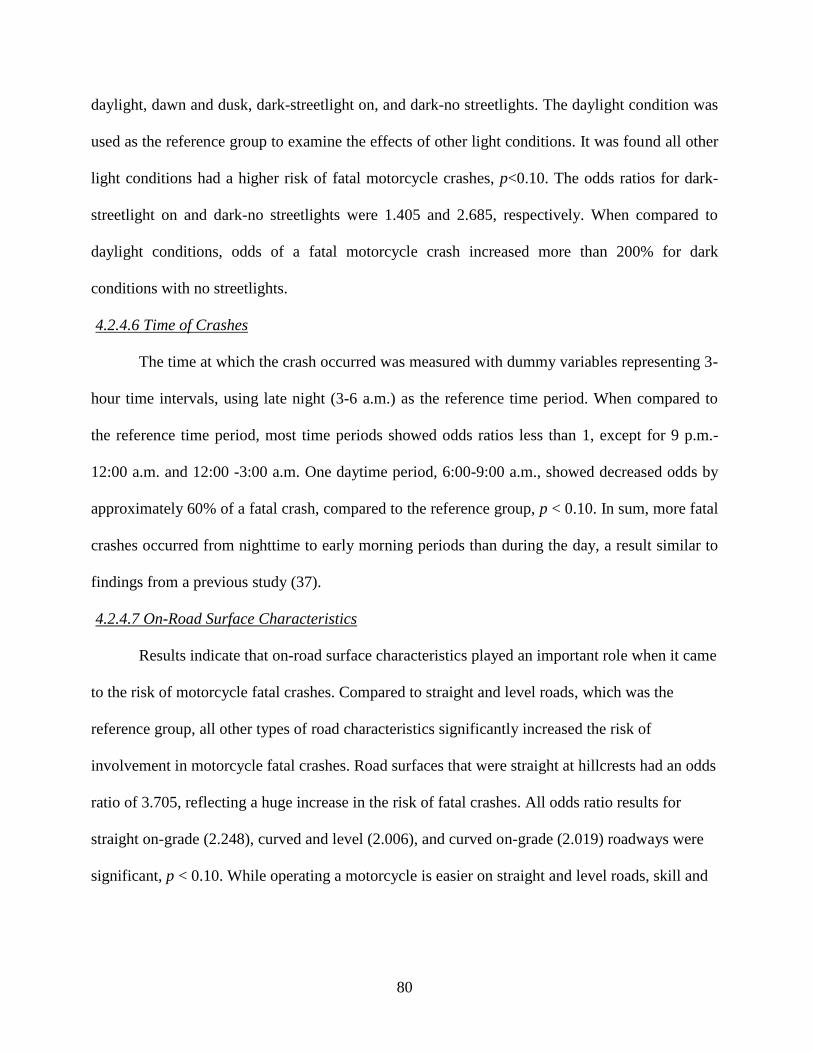
80
daylight, dawn and dusk, dark-streetlight on, and dark-no streetlights. The daylight condition was
used as the reference group to examine the effects of other light conditions. It was found all other
light conditions had a higher risk of fatal motorcycle crashes, p<0.10. The odds ratios for dark-
streetlight on and dark-no streetlights were 1.405 and 2.685, respectively. When compared to
daylight conditions, odds of a fatal motorcycle crash increased more than 200% for dark
conditions with no streetlights.
4.2.4.6 Time of Crashes
The time at which the crash occurred was measured with dummy variables representing 3-
hour time intervals, using late night (3-6 a.m.) as the reference time period. When compared to
the reference time period, most time periods showed odds ratios less than 1, except for 9 p.m.-
12:00 a.m. and 12:00 -3:00 a.m. One daytime period, 6:00-9:00 a.m., showed decreased odds by
approximately 60% of a fatal crash, compared to the reference group, p < 0.10. In sum, more fatal
crashes occurred from nighttime to early morning periods than during the day, a result similar to
findings from a previous study (37).
4.2.4.7 On-Road Surface Characteristics
Results indicate that on-road surface characteristics played an important role when it came
to the risk of motorcycle fatal crashes. Compared to straight and level roads, which was the
reference group, all other types of road characteristics significantly increased the risk of
involvement in motorcycle fatal crashes. Road surfaces that were straight at hillcrests had an odds
ratio of 3.705, reflecting a huge increase in the risk of fatal crashes. All odds ratio results for
straight on-grade (2.248), curved and level (2.006), and curved on-grade (2.019) roadways were
significant, p < 0.10. While operating a motorcycle is easier on straight and level roads, skill and

81
experience are required to maneuver roads at hillcrests or curved on-grades, which are
characteristics associated with increased risk of fatal motorcycle crashes.
4.2.4.8 Weather Conditions
This analysis accounted for two types of weather conditions: no adverse conditions
(reference group) and adverse conditions (e.g., rain, mist, drizzle and winds). The odds ratio for
adverse weather conditions was less than 1, which was not statistically significant. This result
reflects the tendency of riders to operate motorcycles when the weather is good, clear, and sunny.
4.2.4.9 Crash Locations
The reference group considered in the crash locations factor was “interchange present on
roadway” when the crash took place. The odds of a motorcycle fatal crash increased more than
250% for “roadsides including shoulder” compared to the reference group. This result was
statistically significant at a level of p<0.1.
4.2.4.10 Crash Classes
Crash class was important to understand the characteristics of motorcycle crashes in
Kansas. The reference group in this case was non-collision motorcycle crashes. Results
demonstrate that, compared to non-collision crashes, all other crash classes had higher risks of
motorcycle fatal crashes. Collisions with animals (p = 0.0353) and fixed objects (p = .0075) had
odds ratios of more than 200% for a motorcycle fatal crash. The odds ratio for collisions with
other motor vehicles was 1.78, p = 0.063.
4.2.4.11 Day of the Week for Crashes
All days in a week were considered for motorcycle fatal crashes occurring in Kansas,
where Monday was the reference day. No significant effect of days of the week on fatal

82
motorcycle crashes in Kansas. Though results showed the odds ratio was higher for Wednesday,
Thursday, Saturday, and Sunday, but there was no statistical significance.
4.2.4.12 Contributing Circumstances
Only two categories were considered for contributing causes as driver and environment,
even though there were other categories like pedestrians, vehicles, at-road conditions, on-road
conditions, etc. When compared to driver characteristics, the odds ratio for the environment was
lower at 0.904, but not statistically significant.
4.2.4.13 Substance Abuse
The KARS database contains six categories which cover the contributions of alcohol,
illegal drugs, and medications to motorcycle crashes. Frequencies for illegal drugs and
medications were too low to consider for logistic regression. Consequently, the only two
categories considered in this case were the alcohol contributing to the crashes and alcohol present
in the blood of riders at the time of crashes. Alcohol present during the crashes was considered as
the reference group to examine the effect of alcohol contributing to fatal motorcycle crashes.
Alcohol’s presence during the crashes refers to those crashes where motorcycle riders were under
the influence of alcohol. Results revealed the odds ratio for alcohol contributing to motorcycle
fatal crashes was lower than the presence of alcohol during the crash, p < 0.10.
4.3 Motorcycle Safety Survey
4.3.1 Survey Responses
Analysis and results based on the motorcycle riders’ survey are discussed in this section
whereas the survey form is provided in Appendix C. As the first step, simple percentages were
calculated for the survey questions to understand the overall situation. 98% of the respondents
were registered motorcycle owners in Kansas (see Tables 4.7 and 4.8). The majority of the

83
respondents owned Harley-Davidsons (42%), followed by Honda owners (42%) and Kawasaki
owners (12%). Seventy-one percent of the respondents owned a motorcycle with model year
between 2000 -2010. Thirty-five percent of the respondents owned a motorcycle with a 1001-
1500cc sized engine, whereas 30% of respondents owned motorcycles with an engine size greater
than 1500cc. Among respondents who were Kansas motorcycle riders, both touring and cruiser
type of motorcycle riding was dominant with 32% each. Data from the motorcycle riding
experience questions revealed that 46% of the respondents had been riding motorcycles for over
20 years, followed by those with five years or less (27%) and between five to 10 years (17%).
When it came to motorcycle riding exposure, 24% of the motorcycle riders were riding between
5,000 to 7,999 miles per year, the highest percentage. Respondents riding between 3,000 to 4,999
miles per year closely followed with 21%. Thirty-two percent of the respondents commonly
travel on two-lane, out-of- town roadways, whereas 30% of the respondents commonly travel on
city/town roads. When it came to the primary reason for riding motorcycles, a majority of the
respondents (55%) were riding for recreational purposes.

84
Table 4.10 Frequencies and Percentage of Responses to General Survey Questions by Motorcycle
Riders
Question Frequency Percentage
Are you a registered motorcycle owner?
Yes
No
267
5
98%
2%
What is the brand of your current motorcycle?
Honda
Yamaha
Harley Davidson
Suzuki
Kawasaki
BMW
Others
47
28
115
25
32
6
19
17%
10%
42%
9%
12%
3%
7%
What is your motorcycle model year?
Before 1980
1980-1984
1985-1989
1990-1994
1995-1999
2000-2010
10
8
11
13
37
191
4%
3%
4%
5%
13%
71%
What is the engine size of your motorcycle?
500cc or less
501-1000cc
1001-1500cc
More than 1500c
18
71
92
83
7%
27%
35%
31%
Which of the following types of motorcycles do you ride most frequently?
Touring
Sport
Standard
Cruisers
Dual
Others
87
50
27
86
8
10
32%
19%
10%
32%
3%
4%
How long have you been riding motorcycles?
0-5 years
5-10 years
10-15 years
15-20 years
more than 20 years
65
42
10
16
112
27%
17%
4%
6%
46%

85
Table 4.11 Frequencies and Percentage of Responses to General Survey Questions by Motorcycle
Riders
Question Frequency Percentage
Approximately How many miles did you ride in the past year?
1,000 or less
1,000-2,999
3,000-4,999
5,000-7,999
8,000-10,000
above 10,000
36
46
52
59
26
27
15%
19%
21%
24%
11%
10%
What type of roadway do you commonly travel by motorcycle?
City/Town Roads
Two-Lane Out of Town
Interstate/Divided Highway
Rural Road
190
202
162
87
30%
32%
24%
14%
What is the primary reason for riding a motorcycle?
To make task related trips
Recreational purposes
To get good mileage
As it is fast and maneuverable
For its easiness of parking
40
193
68
25
28
11%
55%
19%
7%
8%
How frequently do you ride motorcycles?
Everyday
During weekend only
1-3 days a week
4-6 days a week
46
24
97
81
18%
10%
39%
33%
What type of weather do you most prefer while riding motorcycle?
Hot and Sunny
Rainy
Cold
Humid
Mild
100
3
7
7
174
35%
1%
2%
2%
60%
Most motorcyclists reported riding at least 2-3 days a week, whereas only 18% rode every
day. Also of note, the percentage of weekend-only riders was significantly lower (10%) than the
percentage of motorcycle crashes occurring over the weekend (33%) in Kansas during 2004-

86
2008. Sixty percent of the respondents rode motorcycles in mild weather with only 35% riding in
hot and sunny weather. When considering motorcycle crashes under different weather conditions
in Kansas, it also showed a similar trend where almost 96% of crashes occurred during no adverse
weather conditions.
Table 4.9 shows the frequencies and relevant percentages pertaining to demographic,
social-economic, and educational background-related questions. Of motorcyclist respondents,
91% were male. The age distribution for this sample shows that at least two-thirds of respondents
were at least 43 years old or older. Of respondents, 12% were between the ages of 34 and 42
years, 8% between the ages of 25 and 33 years, and 16% between the ages of 16 and 25 years.
The age distribution across motorcyclist crashes in Kansas (2004-2008) reveals that 40% of
victims were over 40 years old. In addition, although only around 22 % of respondents were 40
years old or younger, this group accounted for approximately 60% of crash fatalities.
The survey also asked questions about respondents’ educational, marital, and occupational
experiences. All respondents had at least been to high school and there were no respondents
without any formal schooling. Forty-four percent of the respondents reported some college
education while 20% had graduate college experience. As for the marital status of the
respondents, 62% were married, with 20% single and 15% separated or divorced or widowed.
Seventy percent of the respondents work full time while 15% were students. Most of the
motorcycle riders’ annual household income was greater than $19,999 (86%), and a majority of
the respondents (58%) had a household income of $60,000 or greater.

87
Table 4.12 Frequencies and Percentage of Responses to Demographic, Socio-Economic, and
Economic Background-Related Questions by Motorcycle Riders
Question Frequency Percentage
Your gender?
Male
Female
224
23
91%
9%
Your age (in years)?
16-24
25-33
34-42
43-51
52 and above
38
20
29
64
94
16%
8%
12%
26%
38%
Marital status?
Single (never married)
Married/living with partner
Separated/divorced/widowed
54
148
36
23%
62%
15%
Your educational qualifications?
No formal schooling
High school
Some college
Four year college
Graduate college
0
35
105
50
48
0%
15%
44%
21%
20%
Present job situation?
Full-time work
Part-time work
Student
Home maker
Pension or unemployed
Other (please specify)
169
18
37
2
13
3
70%
7%
15%
1%
5%
1%
How much is your household income?
$0 to 19,999
$20,000 to 39,999
$40,000 to 59,999
$60,000 or above
32
30
32
132
14%
13%
14%
58%

88
Table 4.13 Frequencies and Percentage of Responses to Helmet and Helmet Law-Related
Questions by Motorcycle Riders
Question Frequency Percentage
Did you wear a helmet riding a motorcycle on public roadway last time?
Yes 105 68%
No 50 32%
How often do you wear a helmet while riding a motorcycle?
Always 118 48%
Sometimes 72 29%
Seldom 30 12%
Never 27 11%
If you don't always wear a helmet, what are the reasons?
I'm not worried about having a crash 17 6%
Freedom of choice 108 36%
I don't believe a helmet makes me safer 21 7%
It is too hot 47 16%
It creates problem with my hearing 35 12%
It creates problem with my vision 36 12%
Weather conditions making riding more hazardous 6 2%
Laziness/Forgetfulness 18 6%
Other, specify 14 5%
Do you know what type of helmet law Kansas currently has?
Mandatory helmet law 4 2%
No law 96 39%
Partial helmet law 134 54%
Don't know 12 5%
What is the main reason you oppose the mandatory helmet law for?
Helmets are uncomfortable 17 7%
Helmets are not effective in preventing motorcycle crashes 31 12%
Helmets are not safe 5 2%
Waste of government time and resources 34 14%
Personal freedom 146 58%
It creates hearing problem 18 7%

89
Table 4.14 Frequencies and Percentage of Responses to Helmet and Helmet Law-Related
Questions by Motorcycle Riders in Kansas (Continued)
What kind of impact would a mandatory helmet law have on
your riding? Frequency Percentage
Significantly decrease 24 10%
Somewhat decrease 36 15%
Will have no effect 181 74%
Somewhat increase 3 1%
Significantly Increase 0 0%
Would you support or oppose a law requiring MC riders and passengers to wear
helmets?
Support 88 36%
Oppose 156 64%
Table 4.10 shows helmet and helmet law-related questions and their response frequencies
and percentages by the respondents. Sixty-eight percent of respondents said they wore a helmet
the last time they were riding before responding to the survey question. 48% said they always
wear helmets. However, Kansas crash data from 2004-2008 show that only 32% of motorcyclists
involved in crashes were wearing helmets at the time of the crash. Twenty-nine percent reported
sometimes wearing helmets, followed by those who seldom wear helmets (12%) and never-
wearing helmets (11%).
Respondents were also asked to share the reasons they do not always wear a helmet while
riding motorcycles. Of respondents, 36% reported that freedom of choice was the primary reason
for not always wearing. Other respondents cited concerns about individual comfort levels – 16%
felt too hot to wear a helmet, 12% wanted to avoid potential hearing issues, and 12% believed that
wearing a helmet would cause conspicuity problems. When asked about the status of current
helmet laws in Kansas, 54% responded correctly, saying Kansas had a partial helmet law in
effect. However, 39% of respondents said Kansas did not have any laws about wearing a helmet,

90
and only 2% thought Kansas had a mandatory helmet law. Respondents also reported their
opinions about potential measures to enforce a mandatory helmet law for motorcyclists. 58% of
respondents cited personal freedom as the reason for their opposition to a mandatory helmet law
in Kansas. Others indicated that such enforcement would waste government time and resources
(14%) and that wearing a helmet was not effective in preventing a crash (12%). However, 74%
of the respondents believed that enforcing a mandatory helmet law would not affect the amount of
their motorcycle riding.
The survey included questions regarding the conspicuity of other drivers on roadways,
safety gears motorcyclists used, and crash experience (see Table 4.12). Twenty percent of the
respondents said they would make sure all lights were working properly to ensure other
motorists’ visibility. Nineteen percent of respondents said they would use blinkers, and an
additional 19% said that they would stay out of motorists’ blind spots. Eleven percent used their
horns to ensure other motorists’ visibility. Non-helmet safety gear questions revealed that gloves
were primarily preferred (33%), followed by special shoes (24%), goggles (16%), and bright-
colored or reflective jackets (13%). Only 37% reported having a previous crash experience while
riding a motorcycle, whereas 63% said that they had not experienced any motorcycle-related
crashes. A similar trend was found for the severity of crash-related injuries – 22% indicated a
crash-related fatality, and 46% said no one had been injured.

91
Table 4.15 Responses to Safety Gears and Crash Experience-Related Questions by Motorcycle
Riders
Question Frequency Percentage
What special effort do you make while riding to ensure other motorists can see you?
Make sure all lights are working 230 20%
Use blinkers 221 19%
Wear bright-colored or reflective clothing 104 9%
Stay out of motorists’ blind spots 220 19%
Use horn 122 11%
Increase engine noise 94 8%
Hand signal 96 8%
Other (specify)…. 50 4%
What other safety gear do you use than a helmet while riding motorcycles?
Bright-colored or reflective jackets 76 13%
Gloves 196 33%
Goggles 94 16%
Flashing lights 16 3%
Special shoes 143 24%
Others 46 8%
None 15 3%
Have you ever had a crash while riding on a public roadway?
Yes 90 37%
No 155 63%
What was the worst level of injury sustained by you or someone else involved in a MC crash?
Someone was killed 39 22%
Treated at scene 31 17%
Someone else was treated at scene 28 16%
No one else was injured 82 46%
What do you feel is the single biggest threat to your own safety while riding a motorcycle?
Drivers of other vehicles 230 71%
Not wearing a helmet while riding 6 2%
Weather 11 3%
Lack of personal experience 19 6%
Road surface conditions 34 10%
Lack of adequate training 13 4%
Other (specify)…. 13 4%

92
The survey also asked about the perceived safety threats of motorcyclists. Seventy one percent of
the respondents thought drivers of other vehicles were the biggest threat to their own safety while
riding a motorcycle on a public roadway. Road surface conditions were considered a potential
threat to 10% of the respondents.
Respondents were also asked to rate the likelihood of various factors to contribute to
crashes. Unlike quantitative type questions, qualitative questions are more difficult to compare.
Thus, a common methodology which has been extensively used in the past was used here to
evaluate the answers. This method assigns different weights to each factor with selected weights
ranging from 0 to 100. Next, an average weighted value was calculated for each factor, which will
represent the standpoint of the respondents in a quantitative manner. This number also describes
the likelihood of occurrence as a probability. In the last columns of Tables 4.13-15, each
question’s calculated value for each question is headed as “likelihood of occurrence,” indicating
the chance of a randomly selected person being in compliance with a particular event. The
assigned weights are as below:
Least - 0
Not significant - 25
Average - 50
Significant - 75
Most - 100
Accordingly, 30% of the respondents said they considered tipping over as a contributing
factor in a motorcycle crash. If randomly selected, a motorcycle rider has a 30 % chance of
indicating that tip over contributes to motorcycle crashes. Conflicts with cars were rated the
93
highest likelihood of occurrence, whereas tip over was the least likely to contribute. The speed at
which motorcyclists drive was also considered to be a significant contributor to crashes. Speeding
(69%) and going too fast on a curve (72%) was considered to be significant contributors to
crashes. Conflict with cars was a contributory factor for 88% of respondents. Weather was also a
contributing factor to crashes – 65% of the respondents reported that they thought bad weather
could cause a crash. In addition, 51% of the respondents said not being able to see far enough
could cause a motorcycle crash on roadways.
Alcohol or drugs was considered as a significant contributing factor by 74% of
respondents. Road surface features like pavement markings were considered as a contributory
factor to cause motorcycle crashes by 47% of the respondents. Fifty-eight percent of respondents
considered both the maintenance issue and misjudged speed of other vehicles as contributory
factors to cause a motorcycle crash. Fatigue was considered as a significant contributor to crashes
by 55% of respondents. Sixty-three percent of respondents considered distraction as a
contributory factor to a motorcycle crash. One important point was that only 32% of respondents
thought that not using a helmet would significantly cause motorcycle crashes to occur. 69%
considered lack of training as a significant motorcycle crash factor, with, 48% of respondents
indicating that overtaking could be the reason for motorcycle crashes. Finally, 63% of
respondents considered traffic hazards as a potential factor to cause motorcycle crashes.

94
Table 4.16 Responses by Motorcycle Riders for Crash Contributing Factors
Contributory Factors Frequency Percentage
Likelihood of
Occurrence
Tip over
Most
Significant
Average
Not significant
Least
10
26
45
70
81
4%
11%
19%
30%
35%
30
Too fast in curve
Most
Significant
Average
Not significant
Least
58
118
46
12
4
24%
50%
19%
5%
2%
72
Conflicts with cars
Most
Significant
Average
Not significant
Least
154
57
27
3
0
64%
24%
11%
1%
0%
88
Poor road surfaces
Most
Significant
Average
Not significant
Least
56
112
64
3
5
23%
47%
27%
1%
2%
72
Bad weather
Most
Significant
Average
Not significant
Least
42
94
73
24
4
18%
39%
31%
10%
2%
65
Speed
Most
Significant
Average
Not significant
Least
68
79
69
20
5
28%
33%
29%
8%
2%
69
Couldn't see far enough
Most
Significant
Average
Not significant
Least
10
67
96
46
14
4%
29%
41%
20%
6%
51

95
Table 4.17 Responses by Motorcycle Riders for Crash Contributing Factors (continued)
Contributory Factors Frequency Percentage
Likelihood of
Occurrence
Alcohol or drugs
Most
Significant
Average
Not significant
Least
101
70
42
16
13
42%
29%
17%
7%
5%
74
Road surface features
Most
Significant
Average
Not significant
Least
11
50
102
53
23
5%
21%
43%
22%
10%
47
Worn tires or maintenance issue
Most
Significant
Average
Not significant
Least
25
82
89
26
16
11%
34%
37%
11%
7%
58
Misjudged speed of other vehicles
Most
Significant
Average
Not significant
Least
19
92
88
28
12
8%
38%
37%
12%
5%
58
Fatigue
Most
Significant
Average
Not significant
Least
26
70
91
36
17
11%
29%
38%
15%
7%
55
Distraction
Most
Significant
Average
Not significant
Least
42
83
83
22
9
18%
35%
35%
9%
4%
63
96
Table 4.18 Responses by Motorcycle Riders for Crash Contributing Factors (Continued)
Contributory Factors Frequency Percentage
Likelihood of
Occurrence
Not using a helmet
Most
Significant
Average
Not significant
Least
23
25
42
56
92
10%
11%
18%
24%
39%
32
Lack of adequate training
Most
Significant
Average
Not significant
Least
55
102
61
12
9
23%
43%
26%
5%
4%
69
Overtaking
Most
Significant
Average
Not significant
Least
14
43
108
50
21
6%
18%
46%
21%
9%
48
Traffic hazard
Most
Significant
Average
Not significant
Least
33
82
102
15
6
14%
34%
43%
6%
3%
63
4.3.2 Differences Based on Age of Respondents
From the survey responses, several factors associated with age of respondents were looked
into. When looking at the motorcycle engine size based on age group of the respondents from
Figure 4.21, a tendency among younger riders (16-24 years) and older riders (52 years and above)
to own high-powered bikes with engine size ranging from 1001cc to 1500cc (cubic centimeters of

97
displacement) was observed. Riders aged 25 to 33 years owned more bikes with engine size
greater than 1500cc (50%) than any other engine size. Younger riders owned lower-powered
bikes (10%) more than the riders aging between 25 to 33 years (5%) and 34 to 42 years (6.3%).
However, there was no correlation between age of motorcycle riders and motorcycle engine size,
(χ2 = 0.36, p = 0.17).
Figure 4.21 Responses by Motorcycle Riders Based on Different Age Groups for Motorcycle
Characteristics (Motorcycle Engine Size)
Results from the survey revealed variation across all age groups for the type of motorcycle
operated (see Figure 4.22). Compared to older respondents, those aged 16 to 24 years were more
likely to own sport bikes (63.2%) and less likely to own touring and cruiser bikes. However, only
10% of touring bikes were owned by riders between 25 to 33 years, compared to the other older
groups. Motorcyclists in their 40s were more likely to own cruisers (40%) and touring bikes
(23.3%) than sports bikes (20%). A similar distribution was also found for those in their 50s and
60s. In addition, a high co-relation existed between motorcycle types and rider age (χ2 = 68.91, p
0.00
10.00
20.00
30.00
40.00
50.00
60.00
16-24 25-33 34-42 43-51 52 and above
% o
f R
es
po
nd
en
ts
Age Group (years)
500cc or less 501-1500cc 1001-1500cc >1500cc

98
<0.001). Increased age was positively related to greater utility of touring and cruiser types of
bikes. This is understandable, as young riders are more inclined towards sports bikes and older
riders choose to ride on touring and cruiser types of motorcycles (3).
Figure 4.22 Responses by Motorcycle Riders Based on Different Age Groups for Motorcycle
Characteristics (Motorcycle Types)
A similar tendency was observed among rider groups between 34 to 42 years, 43 to 51
years, and 52 years and above, when it came to riding exposure (Figure 4.23). The younger rider
groups from 16 to 33 years preferred to ride on city or town roads. Riders who traveled on two-
lane, out-of-town roads most frequently were those aged 34 to 42 years (30.4%), 43 to 51 years
(31.8%), and 52 years and older (32.1). However, there was no correlation between type of
roadways travelled and motorcyclist age (χ2 = 7.91, p = 0.39). When it came to riding experience
based on age, it was clear that older riders would have more riding experience than younger
riders, as indicated by Figure 4.24. For example, older riders (42 to 51 years and 52 years and
0.00
10.00
20.00
30.00
40.00
50.00
60.00
70.00
16-24 25-33 34-42 43-51 52 and above
% o
f R
esp
on
den
ts
Age Group (years)
touring sport standard cruiser

99
above) had riding experience of more than 20 years with percentages of 68.9% and 66.7%,
respectively. Further, there was a high correlation between riding experience and age of the
motorcycle riders (χ2
= 49.63, p<0.001).
Figure 4.23 Responses by Motorcycle Riders Based on Different Age Groups for Motorcycle
Riding Exposure (Types of Roadways)
Figure 4.24 Responses by Motorcycle Riders Based on Different Age Groups for Motorcycle
Riding Experience
0.00
5.00
10.00
15.00
20.00
25.00
30.00
35.00
40.00
45.00
16-24 25-33 34-42 43-51 52 and above
% o
f R
es
po
nd
en
ts
Age Group (years)
City/town Roads Two-lane out of town Interstate/Divided Highway Rural road
0.00
10.00
20.00
30.00
40.00
50.00
60.00
70.00
80.00
less than 34 34-42 43-51 52 and above
% o
f re
sp
on
den
ts
Age Group (years)
0-5 years 5-10 years 10-20 years >20 years
100
Figure 4.25 presents the percentage likelihood of motorcyclists wearing helmets based on
respondent age. The oldest group of riders had the highest percentage of always wearing a helmet
(57.9%), whereas those ranging in age from 34 to 42 years old had the highest percentage of not
wearing a helmet (17.2%). Across all age groups, 47.8% of respondents reported constant helmet
use, whereas only 11% indicated that they never wore a helmet. No significant co-relations were
found between helmet usage and the age of the motorcycle riders (χ2
= 6.55, p = 0.34).
Figure 4.25 Responses by Motorcycle Riders Based on Different Age Groups for Helmet Use
Figure 4.26 shows all age groups had a higher percentage of opposing the mandatory
helmet law when compared with supporting the mandatory helmet law. The highest percentage of
anti-helmet law riders was comprised of those aged between 34 and 42 years old. Overall, 64.1%
of all respondents opposed mandatory helmet legislation in Kansas, compared to 35.9% in
support. The rider age group from 34 to 42 years had the highest percentage (78.6%) opposing the
mandatory helmet law in Kansas. One point to note is that the percentage (37.8%) supporting the
0.00
10.00
20.00
30.00
40.00
50.00
60.00
70.00
16-24 25-33 34-42 43-51 52 and above
% o
f re
sp
od
en
ts
Age Group (years)
Always wearing a helmet Sometimes wearing a helmet Seldom wearing a helmet Never wearing a helmet

101
mandatory helmet law among the youngest rider group, from 16 years to 24 years was higher than
riders between 25 to 33 years (20%) and 34 to 42 years (21.4%). There was also no co-
relationships between perception of helmet law and age of motorcycle riders (χ2 = 7.28, p = 0.47).
A similar pattern is shown in Figure 4.27 for difficulty executing motorcycle maneuvers across all
age groups. 35% of all respondents reported that operating a motorcycle during a thunderstorm
was the most difficult maneuver, whereas only 9.2% indicated that low-speed parking maneuvers
were most difficult.
Figure 4.26 Responses by Motorcycle Riders Based on Different Age Groups for Helmet Law
Opinion
0.00
10.00
20.00
30.00
40.00
50.00
60.00
70.00
80.00
90.00
16-24 25-33 34-42 43-51 52 and above
% o
f re
sp
on
den
ts
Age Group (years)
Support mandatory helmet law Oppose mandatory helmet law

102
Figure 4.27 Responses by Motorcycle Riders Based on Different Age Groups for Most Difficult
Maneuver to Execute
Figure 4.28 represents crash experience based on rider age group for the respondents.
Crash experience was measured in two ways: experiencing a crash at any period versus
experiencing a crash in the last twelve month period. Overall, 36.33% of the respondents
indicated that they had ever crashed or fallen off while the motorcycle was moving. The youngest
rider group had a relatively higher percentage (33.3%) of crash experience compared to all other
age groups in the past twelve months. In addition, 5.74 % of all respondents reported being
involved in a crash within the previous 12-month period.
0.00
5.00
10.00
15.00
20.00
25.00
30.00
35.00
40.00
45.00
50.00
16-24 25-33 34-42 43-51 52 and above
% o
f re
sp
on
den
ts
Age Group (years)
fast swerve Low speed parking manuever Emergency stopping Avoid others in way Riding in thunderstorm

103
Figure 4.28 Responses by Motorcycle Riders Based on Different Age Groups for Crash
Experience
4.3.3 Crashes and Contributing Factors
Crude odds ratios were calculated and presented in Table 4.16 for some selected variables
from the survey questionnaire. The methodology is explained in detail in section 3.2.3. Questions
were selected from sections containing items measuring demographic information, general
details, exposure, crash-related factors, as well as difficulty to execute maneuvers. Even though
answers for the crash-related factors questions were in ordinal format, it can be considered that
either the factors had no/least contribution to the crashes or had contributions in some degree to
the crashes and therefore were reclassified as a binary (“yes” or “no”) variable. In the marital
status situation, it was considered as married vs. single (including divorce, separated, and
widowed). For questions with ordinal responses, the first option was selected as the reference
group and odds were calculated for others relative to the first.
Odds ratio values are based on respondents who had met with crashes at least once while
riding motorcycles on a public roadway and the “respondents” will refer to the same definition
hereafter in this discussion. Several crash-related factors had odds ratios greater than 1. The
0.00
20.00
40.00
60.00
80.00
100.00
120.00
16-24 25-33 34-42 43-51 52 and above
% o
f re
so
nd
en
ts
Age group (years)
Ever crashed Crashed past 12 months

104
contribution of poor road surfaces such as potholes or loose gravel to crashes was 2.31 times
higher among respondents who thought of it as a contributory factor compared to the others.
Speeding was also 2.3 times higher among respondents, compared to those who didn’t consider it
as a crash contributory factor. Conspicuity problem (couldn’t see far enough) as a crash
contributory factor was 1.025 times higher among respondents who did consider it as a crash
contributory factor compared to the others. Road surface features (e.g., pavement markings) as a
crash contributory factor were only 7.3% higher among respondents compared to others who did
not judge it as a contributory factor. Odds of worn tires or maintenance issues as contributory
factors among the respondents thinking of them as contributory factors were 2.6 times those of
respondents not considering these as contributory factors. Distraction and lack of adequate
training contributed more than 1.4 times higher among respondents who considered those as crash
contributory factors compared to those who did not. When it came to non-use of a helmet while
riding as a crash contributory factor, numbers were only 10% higher among the respondents
believing it as a contributory factor compared to others who did not think so. Some odds ratios
were calculated based on a few demographic questions in order to see how they were related to
crash involvement of motorcycle riders in Kansas. When considering motorcycle rider groups
based on age, the 16 to 24 years age group was considered the reference group, and odds ratios
have revealed that other riders older than the 16 to 24 years group were overly involved in
crashes, compared to the reference group.

105
Table 4.19 Crude Odds Ratio and 95% Confidence Intervals for Crash Involvement
Variable Odds Ratio
95% Confidence
Interval
Tip over 0.87 0.50 1.53
Poor road surfaces 2.31 0.25 20.98
Speed 2.31 0.25 20.99
Couldn’t see far enough 1.02 0.33 3.16
Alcohol or drugs 0.91 0.29 2.86
Road surface features 1.07 0.44 2.64
Worn tires or maintenance issue 2.6 0.72 9.39
Misjudged speed of other
vehicles 0.79 0.24 2.56
Fatigue 0.8 0.29 2.18
Distraction 1.14 0.28 4.69
Not using a helmet 1.10 0.64 1.91
Lack of adequate training 1.14 0.28 4.69
Overtaking 0.92 0.36 2.31
Traffic 0.37 0.06 2.26
Married 1.39 0.80 2.42
Age 16-24 years Reference
25-33 years 1.84 0.61 5.60
34-42 years 1.18 0.43 3.28
43-51 years 1.35 0.58 3.15
52 years and above 1.42 0.64 3.16
Income $0-19,999 Reference
$20,000-$39,999 1.91 0.69 5.25
$40,000-$59,999 1.47 0.54 3.99
$60,000 and above 0.75 0.32 1.68
Education High school
Some college 0.35 0.16 0.76
Four year college 0.29 0.12 0.73
Graduate college 0.34 0.14 0.85
Frequency Everyday Reference
Weekends only 0.71 0.23 2.16
1-3 days a week 1.23 0.59 2.59
4-6 days a week 1.48 0.68 3.10
Exposure 1000 miles or less Reference
1,000 to 2,999 miles 0.75 0.304 1.83
3,000 to 4,999 miles 0.95 0.40 2.25
5,000 to 7,999 miles 0.67 0.28 1.57
8,000 to 10,000 miles 1.2 0.43 3.32
above 10,000 miles 0.82 0.30 2.29

106
Furthermore, it is important to highlight that riders aged 25 to 33 years old were 1.84
times higher involvement rate compared to the reference group. A similar pattern can be observed
with respect to income levels except those earning $60,000 or above yearly, who were less likely
to be involved in a crash. This might be because higher income people tend to value safety more
and take the precautions necessary to avoid crashes by equipping themselves and their bikes with
safety gear. Respondents with higher levels of education were less likely to be involved in
crashes. Compared to daily riders, weekend-only motorcyclists are also less likely to be in a
crash. However, those who rode one to three days per week as well as those who rode three to six
days per week had higher involvement rates than daily riders. As the number of miles increased,
the likelihood of being involved in a crash lowered, except for those with annual mileages
ranging from 8,000 to 10,000 miles. Typically, the lower odds ratio compared to the reference
group of 1,000 miles or less was due to the increased number of miles per year increasing their
experience.
Respondents were also asked to choose which maneuver was most difficult to execute
while operating a motorcycle (see question 31, Appendix C) Table 4.17 shows odds ratios for
different motorcycle maneuver difficulties to be executed by the respondents.

107
Table 4.20 Crude Odds Ratio and 95% Confidence Intervals for Crash Involvement Based on
Difficulty Levels of Motorcycle Maneuvers
Variable Odds Ratio
95% Confidence
Interval
Left turn 1.61 0.80 3.23
Change a lane 0.41 0.05 3.70
Make an exit on freeway 0.27 0.03 2.26
Merge from an exit 0.53 0.17 1.70
Fast swerve 0.93 0.54 1.62
Low-speed parking maneuver 1.34 0.67 2.68
Emergency stopping 1.06 0.63 1.83
Negotiate a curve 0.74 0.25 2.20
Slow down suddenly 1.40 0.64 3.06
Avoid others in way 0.71 0.38 1.33
Riding in thunderstorm 1.01 0.60 1.71
Table 4.17 shows the variations across difficulty levels for motorcycle maneuvers. The
odds of rider-perceived difficulties in turning left in front of on-coming traffic were 1.61 times
higher compared to those who did not report any difficulty. Similarly, the odds of difficulties
associated with low-speed parking maneuvers were 1.34 times higher. Suddenly slowing down
was associated with a 40% increased odds ratio for respondents who reported difficulty.
Calculated odds ratios for emergency stopping and riding in thunderstorm were 1.06 and 1.01,
respectively. Even though the margins were less than five percent for emergency stopping and
riding in thunderstorms, it may not be advisable to disregard these completely.
4.4 Analysis Using Ordered Probit Modeling
The ordered probit modeling technique was used to identify factors related to motorcycle
rider injury severity. The model was developed to assess motorcycle rider injury severity in
Kansas by considering approximately 35 explanatory variables using statistical modeling

108
software, SAS version 9.2. Table 4.18 shows names, descriptions, and corresponding mean values
and standard deviations for all variables.
A 95% confidence level was used for most of the variables to be included in the model in
which the probability should be less than 0.05. A 10% confidence level was also used rarely in
which the probability level should be less than 0.1. Co-linearity of variables was also checked
before considering variables to the model. If a relationship existed, the mean value criterion was
used to discard one of the two correlated variables was discarded.
Model results are given in Table 4.19 for motorcycle crashes from 2004 to 2008.
Coefficients were estimated using the maximum likelihood method as explained in section 3.2.4.
Likelihood Ratio Indexes (LRI) are presented, along with Estrella values, Veal-Zimmermann
values, and Mckelvey-Zavoina values. The likelihood ratio index value for the injury severity
model is 0.0347. Past studies based on ordered probit modeling involving crash data demonstrate
that the goodness-of-fit value, which indicates the degree to which the model explains (or fits) the
data, is typically low. For example, the goodness-of-fit value for Quddus and colleagues’
motorcycle injury severity model (36) was approximately 0.05, whereas the vehicle crash models
developed by Kockelman and Kweon (39) yielded the highest LRI value at approximately 0.08.
Therefore, the reliability of the overall model in this study may be considered to be empirically
acceptable.

109
Table 4.21 Description of Variables Considered for Ordered Probit Modeling
Explanatory
Variable
Categories of Each Variable Description Mean Standard
Deviation
Crash class 1. Overturned if yes=1, otherwise=0 0.24 0.43
2. Collision w/ other vehicles if yes=1, otherwise=0 0.44 0.0.50
3. Collision w/ fixed object if yes=1, otherwise=0 0.15 0.36
4. other non-collision Reference case
Crash location 1. Intersection or related on
roadway
if yes=1, otherwise=0 0.35 0.48
2. No intersection on
roadway
if yes=1, otherwise=0 0.43 0.50
3. Parking lot access if yes=1, otherwise=0 0.07 0.26
4. Others Reference case
Age of rider
(years)
1. Up to 19 years if yes=1, otherwise=0 0.07 0.26
2. 20 to 29 years Reference case
3. 30 to 39 years if yes=1, otherwise=0 0.18 0.39
4. 40 to 49 years if yes=1, otherwise=0 0.22 0.41
5. 50 to 59 years if yes=1, otherwise=0 0.18 0.39
6. 60 years and above if yes=1, otherwise=0 0.10 0.31
Alcohol flag 1. Alcohol flag if yes=1, otherwise=0 0.09 0.28
Day of the
crashes
1. Weekday (Monday to
Friday)
if yes=1, otherwise=0 0.37 0.48
Safety equipment
used
1. Helmet used if yes=1, otherwise=0 0.20 0.40
Light conditions 1. Dark during the crash if yes=1, otherwise=0 0.21 0.41
MC maneuvers 1. Straight-following road if yes=1, otherwise=0 0.75 0.43
Crashes 1. Multi-vehicle Crashes if yes=1, otherwise=0 0.43 0.50
On road surface
characteristics
1. Straight if yes=1, otherwise=0 0.80 0.40
2. Curved Reference case
On road surface
condition
1. Concrete if yes=1, otherwise=0 0.26 0.44
Speed Speed Continuous 42.89 13.61
Crash time
(hours)
1. 0000-0359 hours if yes=1, otherwise=0 0.07 0.25
2. 0400-0759 hours if yes=1, otherwise=0 0.06 0.24
3. 0800-1159 hours Reference case
4.1200-1559 hours if yes=1, otherwise=0 0.27 0.44
5. 1600-1959 hours if yes=1, otherwise=0 0.32 0.47
6. 2000-2359 hours if yes=1, otherwise=0 0.17 0.38
Weather
conditions
1. No adverse conditions if yes=1, otherwise=0 0.95 0.21
Gender 1. Male if yes=1, otherwise=0 0.94 0.22

110
Table 4.22 Results of Ordered Probit Modeling for Motorcycle Rider Injury Severity
Categories of Each Variable Variable name Estimate t value Approx Pr>t
Overturned OT 0.1378 2.82 0.0048
Collision w/ other vehicles CWV -0.0362 -0.44 0.6596
Collision w/ fixed object CWF 0.2897 5.18 <0.0001
Intersection or related on roadway IORR 0.0194 0.36 0.7188
No intersection on roadway NOR 0.0339 0.69 0.4929
Parking lot access PLA 0.0332 0.45 0.6531
Up to 19 years AGE1 0.3327 5.26 <0.0001
30 to 39 years AGE2 -0.0133 -0.28 0.7762
40 to 49 years AGE3 0.0483 1.08 0.2787
50 to 59 years AGE4 -0.1179 -2.52 0.0117
60 and above years AGE5 -0.2311 -4.05 <0.0001
Alcohol flag ALCO 0.5949 10.58 <0.0001
Weekday (Monday to Friday) WEEKDAY 0.0388 1.22 0.2226
Helmet used HU -0.0697 -0.57 0.0364
Dark during the crash DARK -0.0383 -0.9 0.3675
Straight following road STRMAN -0.1598 -4.49 <0.0001
Multi-vehicle crash MULTIVEH -0.0559 -0.72 0.4702
Straight STRAIGHT -0.0899 -2.18 0.0295
Concrete CONCRETE -0.0177 -0.51 0.6106
Speed SPEED 0.01148 10.3 <0.0001
0000-0359 hours TIME1 -0.0848 -1.12 0.2648
0400-0759 hours TIME2 -0.0718 -0.96 0.3389
1200-1559 hours TIME3 -0.0573 -1.09 0.277
1600-1959 hours TIME4 -0.0884 -1.72 0.0863
2000-2359 hours TIME5 0.0579 0.95 0.342
No adverse conditions NACWEA 0.2290 3.2 0.0014
Male MALE -0.0008 -0.01 0.9899
_limit2 0.5238 29.73 <0.0001
_limit3 1.8901 70.08 <0.0001
_limit3 2.8963 74.93 <0.0001
Estrella 0.0918
Adjusted Estrella 0.0803
McFadden's LRI 0.035
Veall-Zimmermann 0.1181
Mckelvey-Zavoina 0.1024
(Bold numbers indicate statistical significance)

111
Because the variables analyzed in the study represent motorcyclist-, crash-, roadway-, or
environment-related characteristics, the model will also be discussed within those four sections
for better understanding.
4.4.1 Motorcycle Rider-Related Factors
Motorcyclist-related factors in this model include age and gender, riding under the
influence of alcohol during the crashes, and motorcyclist helmet use. Model estimates for age
varied – those 19 years old or younger had a significantly positive estimate, whereas riders in
both the 40-49 year old and 60 years and older groups had negative estimates, p < .05.
Differences for crash likelihood and injury severity across age groups were also found.
Concurrent with other findings, the youngest group of riders aging up to 19 years has a positive
estimate and motorcycle rider groups from 40 to 49 years and 60 years and above have negative
estimates with statistical significance at a 95% confidence level. Younger motorcycle riders up to
19 years are found to be more prone to be severely injured compared to motorcycle riders from 50
to 59 years and 60 years and above. Younger riders usually have an increased probability of
being involved in crashes, which is also the case in the current model (36). Those aged 50 years
or older tend to be more experienced motorcyclists and have better skills in motorcycle riding
compared to younger riders. Also, older riders may tend to ride at more reasonable speeds and are
less likely to be involved in crashes. These might be the reasons for them to be less likely to be
severely injured in motorcycle crashes. However, the model did not yield a significant estimate
for gender, indicating that motorcyclist gender does not impact on injury severity.
The model also yielded a significantly positive estimate for the alcohol flag variable, such
that motorcyclists under the influence of alcohol had higher levels of injury severity when
involved in motorcycle crashes. This finding is consistent with a previous study’s results, which

112
showed a significantly strong association between alcohol consumption and increased traumatic
injuries sustained from motorcycle crashes (35).
This model yields a significant negative estimate for helmet use, such that riders who do
not wear helmets are at greater risk of severe injury. Not only do helmets lower the likelihood of
sustaining a head injury in a motorcycle crash, they also lessen the severity of a head injury.
It is also widely believed that helmets are most effective in reducing fatalities when head injuries
are the primary cause of death.
4.4.2 Motorcycle-Crash Related Factors
In this model, crash-related variables included crash classes, motorcycle maneuvers
during crashes, multi-vehicle crashes, and time at which the crash occurred. Regarding crash
class, the model yielded significant positive estimates for crashes characterized by an overturned
vehicle as well as a collision with a fixed object, implying that motorcyclists involved in these
types of crashes tend to have higher injury severity. Injury severity is greatest for motorcyclists
when colliding with a fixed object. This finding is consistent with a previous study (35).
Motorcyclists in Kansas also have increased injury severity when they are involved in overturned
crashes. In 2008, 47% of all motorcycles involved in fatal crashes collided with other vehicles,
and motorcycles were more likely to be involved in fatal collisions with a fixed object than other
types of vehicles (58).
The model did not yield a significant estimate for time at which the crash occurred. In this
study, time was defined as the time during the week at which the crash occurred, e.g., days during
the week versus during the weekend. It is normally expected that days the crashes occurred is not
supposed to have any effect on injury severity of the motorcyclists involved in crashes.
Multivehicle crashes also do not have any effect on injury severity of motorcyclists in Kansas.

113
The model also yielded a significant negative estimate for motorcycle maneuvers,
specifically straight following road maneuvers, implying that. From this finding, we can conclude
that a simple motorcycle maneuver, such as a straight following maneuver, may be linked to
reduced injury severity, when compared to other, more complex maneuvers.
Time of day effects in the model are measured with dummy variables for 4-h time
intervals, with the reference group as 8.00 a.m. to noon. Only time of crashes between 4.00 p.m.
to 8.00 p.m. shows statistical significance at the 90% confidence level with a negative estimate.
This implies less severe injuries among motorcyclists during this later part of the day compared to
the reference group.
4.4.3 Roadway-Related Factors
The four roadway-related variables considered in this modeling are crash locations (e.g.,
intersections or parking-lot accesses), on-road surface characteristics, on-road surface conditions,
and posted speed limits on the roads where crashes occurred. The model did not yield a
significant positive estimate for crash locations. A significant negative estimate for straight
roadways was found, when compared to curved roadways, p < .05. This may be partially due to
the lower degree of injury severity sustained by motorcyclists involved in straight-roadway
crashes than those involved in curved-roadway crashes, which may result in motorcyclists leaving
travel lanes and overturning, or striking an off-road object. This finding is also consistent with a
previous study (60). However, the model did not yield a significant estimate for concrete
roadways.
This model also yielded a significant positive estimate for the posted speed limit variable.
When speed limits increase, the level of injury severity also increases. This may be explained by

114
the fact that an increased speed limit may cause the rider to increase speed, resulting in a more
severe collision. This finding is also consistent with a previous study (35).
4.4.4 Environment-Related Factors
The current model suggests that operating a motorcycle in good weather may result in
more severe injuries for riders. Because bad weather conditions can motivate riders to institute
safer driving practices, motorcyclists riding in good weather may not be diligent, increasing the
likelihood of sustaining a severe injury. However, this explanation requires further investigation.
4.5 Kansas Motorcycle Crash Reports in Newspapers
Data was also collected from motorcycle crash reports in daily newspapers circulating
across Kansas for the last two years from 2009 to 2010 (see Appendix D for clips). The clips are
arranged in chronological order. In 2009, Kansas had 41 motorcycle fatalities and 20 in 2010 at
the time of this report. In order to show a reasonable representation of fatal motorcycle crashes,
this study included a sample of 18 newspaper clips, which accounts for approximately 31% of all
fatal crashes occurring in Kansas over the last two years.. Of note, age and different types of
collisions influenced the likelihood of a crash-related fatality. A majority of motorcyclists injured
or killed were over 40 years old, often colliding with cars or minivans. Collisions with deer and
fixed objects were also reported. In the first news clip, the motorcycle rider collided with a
minivan while turning left in Manhattan, Kansas. Another incident reported the fatal injury of a
54-year-old motorcyclist who collided with a guardrail in south Wichita. The Wichita Eagle
reported two more crashes caused by collisions with other motorcycles and vehicles, one of which
resulted in a fatality. A Wichita man was reported to have been fatally injured after swerving to
avoid a collision with a deer on the road. After hitting a median curb in Lawrence, a 20-year old
man was fatally injured. Losing control on a curved road in Emporia resulted in a college

115
student’s death. A 56-year-old man was reportedly dead and another injured in a crash where the
riders were not wearing helmets. A collision with a car turning left at a Seneca intersection killed
a motorcyclist, who was also not wearing a helmet. Lack of visibility on the part of the
motorcyclist was cited as a potential reason for this crash. Motorcyclist judgment was also
reported in the Wichita Eagle as a significant contributor to the fatality resulting from a
motorcycle’s collision with the rear end of a minivan. Misjudged speed of the minivan by the
motorcyclist was the main reason of the collision. Failure to strap on his helmet correctly resulted
in a fatal injury for a 23-year-old motorcyclist when his helmet came off after being struck by a
truck.
Trends for the 154 crash fatalities that occurred in Kansas from 2006 to 2008 were
discussed in a clip from the Topeka Capital Journal (see Appendix D). 111 were not wearing
helmets during the crashes. Fatal crash reports included that of a 63 year old motorcyclist from
Cassidy, who lost control on a curve and dying instantly. His passenger sustained a disabling
injury. One man from Wichita also died on the spot, after being thrown off of his motorcycle
when he hit a guard rail due to a wobbly front wheel. An unhelmeted 62 year old man died from
fatal injuries after crashing into a curb at low speed. A car that failed to yield fatally struck a 60
year old motorcycle. A 53-years-old rider was fatally injured after his motorcycle overturned and
left the roadway.
116
Chapter 5 Summary, Conclusions, and Recommendations
5.1 Summary and Conclusions
The contributions of helmet laws and other crash-related factors to state-level
motorcyclist fatality rates were explored, using generalized least-squares regression modeling to
analyze national data, covering the period 2005-2007. The goal was to develop statistical models
to predict state-level motorcycle safety parameters while taking various factors into account.
Crash data from the Kansas Department of Transportation from 2004 to 2008 were analyzed with
the intention of identifying characteristics and contributory factors related to motorcycle crashes
in Kansas. Detailed characteristic and statistical analyses were carried out for motorcycle crashes
in Kansas under a number of categories. Comparisons were made between motorcycle crashes
and other vehicle crashes in Kansas to identify circumstances or situations more common among
motorcycle crashes.
GLS modeling revealed a statistically significant relation between helmet laws and
motorcyclist fatalities per 10,000 registered motorcycles and per 100,000 populations in a state.
Motorcycle fatalities also rose with an increase in annual daily mean temperature, as well as
decreased with an increased highway mileage of rural roads in a state. In addition, demographic
factors associated with motorcycle fatalities were also significant. Higher per capita income was
linked to reduced motorcycle fatalities, whereas higher number of African Americans in a state
was associated with increased number of motorcycle fatalities. Motorcycle fatalities per 100,000
populations decreased with an increase in population density. They also rose with an increase in
motorcycle registrations per capita.
Results presented in contingency tables followed by the chi-square tests revealed
significant relationships between motorcycle crash severity and several factors. Weather
conditions, day of the crashes, on-road surface types were not significantly related. Though on-

117
road surface characteristics were related to motorcycle crash severity, on-road surface types were
not related to motorcycle crashes. Motorcycle maneuvers were significantly related to motorcycle
crash severity, with a majority of crashes occurring when riders followed straight roads or turned
left.
The number of male motorcyclists in crashes was much higher than the number of female
motorcyclists. Gender was only significantly related to motorcycle crash severity at a 90%
confidence level. In addition, motorcyclist age was significantly related to motorcycle crash
severity, with the majority of crashes involving riders aged between 20 to 29 years old as well as
40 to 49 years.
Despite only 9.23% of fatal crash victims wearing helmets, the type of safety equipment
used by motorcycle riders was also related to motorcycle crash severity. Helmet usage was also
significantly related to motorcycle crash severity. Light conditions during the crashes affected
motorcycle crash severity – most crashes occurred during daylight hours.
A majority of motorcycle crashes were involved in collisions with other vehicles, and a
significant portion resulted from collisions with fixed objects or overturning. Moreover, these
types of crash classes were related to crash severity, which was also influenced by time, on-road
surface characteristics, and location. Time of the crashes also affected motorcycle crash severity,
with more than 60% of motorcycle crashes occurring at or after 3.00 p.m. A majority of the
crashes occurred on straight and level roads, followed by straight-on-grade, curve-and-level, and
curve-on-grade roadways. Crash location also affected motorcycle crash severity with a higher
number of crashes occurring on non-intersection locations followed by intersections and
intersection- related locations.

118
A comparison of several factors to better understand characteristics of motorcycle crashes
in Kansas was generated between motorcycle crashes and other vehicle crashes for a 10-year
period from 1999 to 2008. Vehicle maneuvers showed a similar distribution for both motorcycle
crashes and other vehicle crashes, with most motorcycles and other vehicles following straight
roads during crashes. When it came to age distribution of motorcycle riders and drivers of other
vehicles, middle-age motorcycle riders from 30 to 59 years had a higher percentage of crash
involvement compared to drivers of other vehicles. But the case was reversed for teenage
motorcycle riders and older motorcycle riders.
Different types of light conditions did not show much difference between the distribution
of motorcycle crashes and other vehicle crashes. However, the percentage of motorcycle crashes
in dark conditions was slightly higher, compared to that of other vehicles. Motorcycle crashes
caused by collisions with other vehicles had a lower percentage compared to other vehicle
crashes. The percentage of motorcycles was also higher than other vehicles involved in crashes
caused by fixed-object collisions or overturning.
Across numerous crash-related factors, the percentage of crashes involving motorcycles
was consistently higher than other vehicles. This study explored crash characteristics related to
time, location, driver demographics and behaviors, driving maneuvers, and weather. Time was
explored by day of the week and time of day – motorcycle crashes were more likely to occur on
Saturday and Sunday, as well as from 6 pm – 3 am. The percentage of driver-contributed
motorcycle crashes was higher compared to other vehicle crashes. However, crashes linked to
environmental factors or road conditions were associated with a lower percentage of motorcycle
crashes. In addition, motorcycle crashes occurring on straight and level roads had a lower
percentage compared to crashes of other vehicles, but motorcycle crashes occurring on curve-and-

119
level and curve-on-grade roadways had a higher percent of crashes. However, motorcycle crashes
occurring on non-intersected roadways had a slightly higher percentage, when compared to other
vehicle crashes at the same crash location.
The univariate logistic regression was used to identify characteristics of the crashes,
motorcyclists, other vehicles involved, and other contributing factors to fatal motorcycle crashes
in Kansas. Results revealed that motorcycle maneuvers, such as overtaking, increased the
likelihood of a fatal crash, whereas slowing or stopping lowered that risk. Age for motorcyclists
was also significant – those older than 40 years were more likely to end up in a fatal crash. Using
a helmet alone or with eye protection lessened the risk of crash fatalities. There was more risk of
a fatality in a motorcycle crash when the crash occurred in dark conditions. Daytime riding was
safer than nighttime, considering the risk of motorcycle fatal crashes. Except for straight and level
roads, all other types of roads (on-grade, curved, at hillcrest) had significant amounts of risk to be
involved in motorcycle fatal crashes. Roadside areas including shoulders, was a significant crash
location for motorcycle fatal crashes in Kansas. Weather conditions had no effect on motorcycle
fatal crashes. Collisions with other motor vehicles, animals, and fixed objects had higher amounts
of risk to be involved in motorcycle fatal crashes when compared to non-collision motorcycle
crashes. Alcohol present during the crash also contributed to an increased risk of fatalities in
motorcycle crashes.
A survey was conducted to identify and analyze significant factors associated with
motorcyclist decisions to use helmets. In addition, the survey explored respondent opinions
regarding crash-related causes and issues. From the initial percentage calculations, it can be
concluded that most motorcycle riders ride touring and cruiser types of motorcycles. About half
of the respondents had riding experience of at least 20 years. A majority of the motorcycle riders

120
rode motorcycles one to three days a week, and most of them rode motorcycles in sunny weather.
Most motorcycle riders were male. Helmet usage was reported to be high among motorcyclists,
with almost half of respondents saying they always wear helmets while riding. Riders reported
that freedom of choice was the main reason for not wearing a helmet, followed by hearing and
conspicuity problems. On questions targeting motorcyclists’ familiarity with the current helmet
laws in Kansas, approximately half responded correctly. Many opposed the enforcement of a
mandatory helmet law. Most of the motorcycle riders had not been involved in a crash while
riding motorcycles on public roadways. About half of the motorcycle riders involved in crashes
had not sustained any injury. A high percentage of the motorcycle riders thought drivers of other
vehicles were the biggest threat to their own safety while riding a motorcycle.
Respondents also completed questions on what they considered to be significant
contributors to motorcycle crashes. Significant factors included conflict with other vehicles, going
too fast into a curve, poor road surfaces, alcohol or drug impairment, in adequate training, and
distractions. However, not wearing a helmet was not considered to be a very significant
contributor to crashes.
Age differences were also observed across all respondents for motorcycle ownership and
operation. There was a tendency to own high-powered bikes among younger and older
motorcycle riders. Sport motorcycles were particularly popular among young motorcyclists aged
16 to 24. Respondent age was significantly associated with the type of motorcycle and the amount
of riding experience. As expected motorcycle riders above 40 years had high usage of helmets
while riding motorcycles.
Based on respondents who had met with at least “a crash anytime while riding a
motorcycle on a public roadway”, some interesting facts were found. Poor road surfaces (e.g.,

121
potholes, loose gravel), speeding, conspicuity problems, and road surface features (like pavement
markings) were highly crash-contributory factors among riders who considered those as crash-
contributory factors. Other crash contributory factors among the respondents involved in
motorcycle crashes were distractions, non-use of helmets, and lack of adequate training. Further,
statistics showed motorcycle riders older than 24 years were highly involved in crashes and those
with elevated income levels had higher involvement in crashes. Motorcycle riders with higher
levels of education had lower involvement in crashes; however, when number of miles ridden
increased, chances of being involved in crashes decreased. Respondents also reported higher
levels of difficulties, especially in association with making left turns in front of oncoming traffic,
slowing down suddenly, low-speed parking maneuvers, emergency stopping, and riding in a
thunderstorm.
Ordered probit modeling was used to determine the combined effect of variables
contributing to higher injury severity. Variables under driver-related, crash-related, roadway-
related, and environment-related were considered. Younger motorcycle riders up to19 years were
at a higher risk of more severe crashes compared to older age categories. Motorcycle riders under
the influence of alcohol during crashes had a higher risk of severe injury. Helmeted motorcycle
riders were at a lower risk to be severely injured. Motorcycle riders using helmets were less likely
to be involved in severe crashes. Motorcycle crashes involving collisions with fixed objects had a
higher risk of severe injury among motorcycle riders. Motorcycle riders involved in overturned-
type crashes also had a higher risk of severe injury. Motorcycle riders going straight following the
road during the crashes were less likely to be involved in more severe crashes. Motorcycle
crashes occurring from 4:00 p.m. to 8:00 p.m. had lower risk for motorcycle riders to be involved
in more severe crashes. Motorcycle riders having crashes on straight roadways had lower injury

122
severity compared to riders on curved roads. Also, motorcycle riders having crashes on higher-
posted-speed-limit roads had higher injury severity. Motorcycle riders riding under good weather
conditions showed a higher risk of more severe injury.
5.2 Recommendations
Future research can be directed to analyze different types of motorcycle crashes (e.g.,
single-vehicle crashes, multi-vehicles crashes, or fixed-object crashes) with the intention of
finding significant characteristics affecting these motorcycle crashes. Collection and use of more
exposure data related to motorcycle travel would lead to identifying more behavioral factors,
which would also help improve the safety of motorcycle riders. However, prior to 2007, state
reporting of motorcycle vehicle miles traveled (VMT) to the Federal Highway Administration
(FHWA) was optional. Even for those states that reported motorcycle VMT, it was often only
measured as a standard proportion of total VMT, rather than being collected directly through
surveys of roadside counters. Accurate collection of motorcycle VMT and use of this exposure
data would help to initiate further useful research in identifying critical factors affecting
motorcycle safety in Kansas.
5.2.1 Possible Countermeasures
Based on the results from this study, a number of countermeasures can be suggested to
improve the safety of motorcycle riders in Kansas. Implementing these countermeasures is a
lengthy process which will definitely require funding, and each improvement will be associated
with a certain amount of cost plus benefits. However, this study does not have the scope to assess
all these cost-associated issues. In addition, suggested countermeasures are exclusively based on
the approach of improving motorcyclist safety, which may have different implications towards
other driver groups, road users, or other related parties. Thus, careful consideration of state and

123
federal policies, and future plans, at every stage of design and development of the suggested
countermeasures is increasingly/extremely necessary for successful implementation.
The study revealed that motorcyclists older than 40 years were more vulnerable to fatal
motorcycle crashes in Kansas, and younger motorcycle riders up to 19 years were at a higher risk
of more severe crashes. This gives the impression that current rider training programs for younger
or older riders do not appear to reduce crash risk. Therefore, it might be necessary to introduce
standards for entry-level motorcycle rider training that will set the baseline for novice or young
motorcycle rider training programs in Kansas. At the same time, it might be useful to develop and
promote motorcycle safety educational materials to encourage older motorcyclists to take novice
and experienced rider training and get properly licensed. Learning or education programs would
help to improve the safety of older motorcycle riders to a great extent. Currently, Kansas waives
the skill test and issues a license to a rider after completing an approved basic motorcycle rider
safety course. This course includes classroom instructions as well as driver training in a
controlled, off-street environment. Kansas should also be updated with the release of motorcycle
operator licensing guidelines from USDOT (Department of Transportation) to maintain state
motorcycle licensing systems and integrate rider-training programs with motorcycle-operator
licensing.
The study also revealed that using motorcycle helmets (either with or without eye
protection) simultaneously reduced the risk of fatal motorcycle crashes. Helmeted motorcycle
riders were less likely to be severely injured. Survey results also showed that motorcycle riders do
not want a mandatory helmet law to be enforced on them. However, motorcyclists report wearing
helmets most of the time while riding. Therefore, conducting and evaluating a statewide

124
demonstration project to increase helmet use through education and communication programs
might be useful.
Similarly, introduction of best practices through various sources will improve the safety of
motorcycle riders as well as others. Using helmets compliant with federal standards, reducing the
number of left turns and the tendency of overtaking, avoiding riding in other demanding
conditions or under the influence of substances, and adhering to speed limits are some of the best
practices that can be encouraged. For example, a demonstration program that combines high-
visibility enforcement and enhanced media can be developed and implemented to test its
effectiveness in reducing alcohol-related motorcycle crashes. A training program can be
specifically designed to educate police on motorcycle safety. Moreover, police officers can also
be introduced to enforcement efforts that they could employ to reduce motorcycle crashes. Lastly,
developing an employer-based motorcycle safety program for employees who ride motorcycles
on or off the job in Kansas could be an especially effective preventative measure.
A significant amount of opportunity exists to improve roadways and to increase
motorcycle rider safety. Our study demonstrates that, excluding straight and level roads, all other
road types host a significant amount of risk of fatal crashes for motorcyclists. As such, reducing
major vertical differences and increasing the radius of curvatures are appropriate steps to enhance
motorcyclist safety. For example, roadside areas are a significant crash location for fatal
motorcycle crashes in Kansas. As a result, motorcyclists are highly likely to sustain severe
injuries from overturned crashes and collisions with fixed objects. Not only is the need for more
clear zones evident, but these clear zones also need lesser slopes to prevent overturns. Other
needed prevention measures include guard rails and rumble strips to prevent run-off-the-road
crashes, and the elimination of fixed objects near roads to reduce crash severity. We also posit

125
that increasing the number of road signs can help mitigate driver-related errors (e.g., failure to
yield) that contribute to crashes. This study has also shown that daylight hours are a safer time of
day for motorcyclists than during night-time hours. Consequently, better street light facilities will
improve nocturnal visibility, and better road or pavement markings will reduce motorcycle
maneuver-related conflicts and misjudgments.

126
References
1. National Highway Traffic Safety Administration’s National Center for Statistics and
Analysis, Traffic Safety Facts: Motorcycles, 2008. Publication DOT-HS-811-159,
Washington, DC.
2. National Highway Traffic Safety Administration. Traffic Safety Facts: 2008. http://www-
nrd.nhtsa.dot.gov/pubs/811159.pdf. Accessed Oct. 10, 2010.
3. Morris, C. C., Motorcycle Trends in the United States. 2009. Bureau of Transportation
Statistics, Special Report, SR-014. May 2009.
4. Branas, C. C. and M. M. Knudson. 2001. Helmet Laws and Motorcycle Rider Fatality
Rates. Crash Analysis and Prevention, Vol. 33, No. 5, pp. 641-648.
5. Peek-Asa, C., D. L. McArthur, and J. F. Kraus. 1999. The Prevalence of Non-Standard
Helmet Use and Head Injuries among Motorcycle Riders. Crash Analysis and
Prevention, Vol. 31, No. 3, May 1999, pp. 229-233.
6. Williams, A. F., M. J. Ginsburg, and P. F. Burchman. 1979. Motorcycle Helmet Use in
Relation to Legal Requirements. Crash Analysis and Prevention, Vol. 11, No. 4,
December 1979, pp. 271-273.
7. Mayrose, J. 2008. The Effects of a Mandatory Motorcycle Helmet Law on Helmet Use
and Injury Patterns among Motorcyclist Fatalities. Journal of Safety Research, Vol. 39,
No. 4, 2008, pp. 429-432.
8. Rutledge, R., and J. Stutts. 1993. The Association of Helmet Use with the Outcome of
Motorcycle Crash Injury when Controlling for Crash/Injury Severity. Crash Analysis and
Prevention. Vol. 25, No. 3, pp. 347-343.
9. Wilson, D. C. 1990. The Effectiveness of Motorcycle Helmets in Preventing Fatalities.
Mathematical Analysis Division, NRD-31, March 1989. Journal of Safety Research, Vol.
21, No. 1, Spring 1990, page 42.
10. Houston, D. J. 2007. Are Helmet Laws Protecting Young Motorcyclists? Journal of
Safety Research, Vol. 38, No. 3, pp. 329-336.
11. McKnight, A. J., and A. S. McKnight. 1995. The Effects of Motorcycle Helmets upon
Seeing and Hearing. Crash Analysis and Prevention, Volume 27, No. 4, August 1995,
pp. 493-501.
12. Evans, L., and M. C. Frick. 1989. Helmet Effectiveness in Preventing Motorcycle Driver
and Passenger Fatalities. Journal of Safety Research, Vol. 20, No. 2, pp. 85-86.

127
13. Chaudhary, G. H., K. Neil, M. G. Solomon, D. F. Preusser, and L. A. Cosgrove. 2008.
Evaluation of the Reinstatement of the Helmet Law in Louisiana. National Highway
Traffic Safety Administration.
14. Houston, D. J., and L. E. Richardson. 2008. Motorcyclist Fatality Rates and Mandatory
Helmet-Use Laws. Crash Analysis and Prevention, Vol. 40, No. 1, pp. 200-208.
15. Morris, C. C. 2006. Generalized Linear Regression Analysis of Association of Universal
Helmet Laws with Motorcycle Fatality Rates. Crash Analysis and Prevention, Vol. 38,
No. 1, pp. 142-147.
16. U.S. Department of Transportation. 2008. An Analysis of Motorcycle Helmet Use in
Fatal Crashes. Publication DOT HS 811 011. NCSA, Washington DC.
17. Kraus, J. F., C. Peek, and A. Williams. 1995. Compliance with the 1992 California
Motorcycle Helmet Use Law. American Journal of Public Health, Vol. 85, pp. 96-99.
18. U.S. Department of Transportation. 2006. Motorcycle Helmet Use in 2006-Overall
Results. Publication DOT-HS-810 678, Washington, DC.
19. Sosin, D. M., and J. J. Sacks. 1992. Motorcycle Helmet-Use Laws and Head Injury
Prevention. Journal of American Medical Association, Vol. 267, pp. 1649-1651.
20. Stolzenberg, L., and S. J. D’Alessio. 2003. Born to be Wild: The Effect of the Repeal of
Florida’s Mandatory Motorcycle Helmet-Use Law on Serious Injury and Fatality Rates.
Evaluation Review, Vol. 27, pp. 131-150.
21. Keeler, T. E. 1994. Highway Safety, Economic Behavior, and Driving Environment.
American Economic Review, Vol. 84, pp. 684-693.
22. Calkins, L.N., and T. J. Zlatoper. 2001. The Effects of Mandatory Seat Belt Laws on
Motor Vehicle Fatalities in the United States. Social Science Quarterly, Vol. 82, pp. 133-
139.
23. Cohen, A., and L. Einav. 2003. The Effects of Mandatory Seat Belt Laws on Driving
Behavior and Traffic Fatalities. The Review of Economics and Statistics, Vol. 85, pp.
828-843.

128
24. Farmer, C. M., and A. F. Williams. 2005. Effect on Fatality Risk of Changing from
Secondary to Primary Seat Belt Enforcement. Journal of Safety Research, Vol. 36, pp.
189-194.
25. National Highway Traffic Safety Administration’s National Center for Statistics and
Analysis. Traffic Safety Facts: Motorcycles, 2008. Publication DOT-HS-811-59,
Washington, DC.
26. Soderstorm, C. A., P. S. Dischinger, S. M. Ho, and M. T. Soderstorm. 1993. Alcohol
Use, Driving Records, and Crash Culpability among Injured Motorcycle Drivers. Crash
Analysis and Prevention, Vol. 25, pp. 711-716.
27. Grossman, M. 1975. The Correlation between Health and Schooling. In: Terleckyz, N.E.
(Ed), Household Protection and Consumption. Columbia University, New York, pp. 147-
211.
28. Braver, E. R. R. 2003. Hispanic Origin and Socioeconomic Status in Relation to Motor
Vehicle Occupant Fatality Rates and Risk Factors among Adults. Crash Analysis and
Prevention, Vol. 35, pp. 295-309.
29. Muelleman, R. L., E. J. Mlinek, and P. E. Collicott. 1992. Motorcycle Crash Injuries and
Costs: Effect of a Re-enacted Comprehensive Helmet-Use Law. Annals of Emergency
Medicine, Vol. 21, pp. 266-272.
30. Paulozzi, L. J. 2005. The Role of Sales of New Motorcycles in a Recent Increase in
Motorcycle Mortality Rates. Journal of Safety Research, Vol. 36, No. 4, pp. 361-364.
31. Preusser, D. F., A. F. Williams and R.G. Ulmer. 1995. Analysis of Fatal Motorcycle
Crashes: Crash Typing. Crash Analysis and Prevention, Vol. 27, No. 6, pp. 845-851.
32. Kraus, J. F., C. E. Franti, S. L, Johnson, and R. S. Riggins. 1976. Trends in Fatalities due
to Motorcycle Crashes and Risk Factors in Injury Collisions. Crash Analysis &
Prevention, Vol. 8, No. 4, pp. 247-255.
33. Mannering, F. L., and L. L. Grodsky. 1995. Statistical Analysis of Motorcyclists’
Perceived Crash Risk. Crash Analysis and Prevention, Vol. 27, 1995, pp. 21-31.
34. Hurt, H. H., J. V. Ouellet, and D. R. Thom. 1981. Motorcycle Crash Cause Factors and
Identification of Countermeasures. Final report no. DOT-HS-5-01160, Vol. 1, University
of Southern California, Los Angeles.

129
35. Shankar, V. N., and F. Mannering. 1996. An Explanatory Multinomial Logit Analysis of
Single-Vehicle Motorcycle Crash Severity. Journal of Safety Research, Vol. 27, pp. 183-
194.
36. Quddus, M. A., R. B. Noland, and H. C. Chin. 2002. An Analysis of Motorcycle Injury
and Vehicle Damage Severity Using Ordered Probit Models. Journal of Safety research,
Vol. 33, pp. 445-462.
37. Chimba, D., C. J. Lan, and J. Li. 2006. Statistical Evaluation of Motorcycle Crash Injury
Severities by Using Multinomial Models. CD-ROM. Transportation Research Board of
the National Academies, Washington, D.C.
38. Bedard, M., G. H. Guyatt, and M. J. Stones. 2002. The Independent Contribution of
Driver, Crash, and Vehicle Characteristics to Driver Fatalities. Crash Analysis and
Prevention, Vol. 34, No. 6, pp. 717-727.
39. Kockelman, K., and Y. Kweon. 2002. Driver Injury Severity: An Application of Ordered
Probit Models. Crash analysis and Prevention, Vol. 34, No. 3, pp. 313-321.
40. Yamamoto, T., and N. Shankar. 2004. Bivariate Ordered-Response Probit Model of
Driver’s and Passenger’s Injury Severities in Collisions with Fixed Objects. Crash
Analysis and Prevention, Vol. 36, pp. 869-876.
41. Rifaat, S. M., and H. C. Chin. 2007. Crash Severity Analysis Using Ordered Probit
Model. Journal of Advanced Transportation, Vol. 41, No. 3, pp. 91-114.
42. Washington, S., M. G. Karlaftis, and F. L. Mannering. 2003. Statistical and Econometric
Methods for Transportation Data Analysis. Chapman and Hall/CRC.
43. SAS for Windows, Release 9.1, SAS Institute Inc., Cary, NC. 2003.
44. U.S. Census Bureau, The 2009 Statistical Abstract. www.census.gov /compendia/statb/.
Accessed April 5, 2009.
45. U.S. Department of Transportation, Federal Highway Administration, Highway Statistics
Series. http://www.fhwa.dot.gov/policy/ohpi/hss/index.cfm. Accessed April 5, 2009.
46. National Highway Traffic Safety Administration,
www.nhsta.gov/Data/State+Data+Program+and+CODES, Accessed April 6, 2009.

130
47. National Climatic Data Center, http://www1.ncdc.noaa.gov/pub/data/ccd-data/.
Accessed May 10, 2009.
48. National Institute of Health,
www.niaa.nih.gov/RESOURCES/GRAPHICSGALLERY/Pages/consfigs4text.aspx.
Accessed May 10, 2009.
49. Hosmer, D., and S. Lemeshow. 2000. Applied Logistic Regression. 2nd
Ed. Wiley-
Interscience Publication, NY.
50. Long, J. S. 1997. Regression Models for Categorical and Limited Dependent Variables.
Thousand Oaks, CA: Sage Publications.
51. Ben-Akiva, M., and S. R. Lerman. 1985. Discrete Choice Analysis. MIT Press,
Cambridge, MA,
52. Greene, W.H. 1999. Econometric Analysis. 4th
ed. Prentice hall, Engle. Cliffs, NJ.
53. Duncan, C. S., A. J. Khattak, and F. M. Council. 1998. Applying the Ordered Probit
Model to Injury Severity in Truck-Passenger Car Rear-End Collisions. Transportation
Research Record, Vol. 1635, pp. 63-71.
54. McFadden, D. 1973. Conditional Logit Analysis of Qualitative Choice Behavior. In P.
Zarembka, Frontiers in Econometrics. New York: Academic Press.
55. Longnecker, M., and R. Ott. 2008. Introduction to Statistical Methods and Data analysis.
6th
ed. Carnage Learning (Thompson), Pittsburgh, PA, 2008.
56. Dissanayake, S., and A. Parikh. 2007. Exploring the Methods to Increase Seat Belt Usage
in Kansas. Report No. K-TRAN: KSU-05-2, Kansas Department of Transportation,
September 2007.
57. Paulozzi, L. J. 2005. The Role of Sales of New Motorcycles in a Recent Increase in
Motorcycle Mortality Rates. Journal of Safety Research, Vol. 36, No. 4, pp. 361-364.
58. National Highway Traffic Safety Administration’s National Center for Statistics and
Analysis, Traffic Safety Facts: Motorcycles, 2008. Publication DOT HS 811 159,
Washington, DC, 2007.
59. Evans, L. 2004. Traffic Safety. Science Serving Society, Bloomfield Hills, MI.

131
60. Pai, C. W., and W. Saleh. 2008. Modeling Motorcyclist Injury Severity under Various
Traffic Control Measures at T-junctions in the UK. Transport Research Institute, Napier
University.

132
Appendix A Motorcycle Fatalities and Injuries in U.S., 1997-2008
Table A.1 Motorcycle Fatalities in the United States, 1997-2007
Year Motorcycle fatalities
1997 2,116
1998 2,294
1999 2,483
2000 2,897
2001 3,197
2002 3,270
2003 3,714
2004 4,028
2005 4,576
2006 4,837
2007 5,154
Table A.2 Other Vehicle Fatalities (Except Motorcycle) in the United States, 1997-2007
Year Other vehicle fatalities
1997 33,609
1998 33,088
1999 33,392
2000 33,451
2001 33,243
2002 34,105
2003 33,627
2004 33,276
2005 33,070
2006 32,119
2007 30,401
133
Table A.3 Motorcycle Fatal and Injury Crashes in Kansas, 1997-2008
Year MC fatal crashes MC injury crashes
1997 17 611
1998 19 568
1999 16 661
2000 24 667
2001 24 672
2002 31 716
2003 31 720
2004 30 844
2005 35 888
2006 64 928
2007 47 1,033
2008 45 1,085
Table A.4 Kansas Motorcycle Rider Fatalities (Helmeted and Unhelmeted), 1997-2008
Year
MC riders fatalities
using helmet Unhelmeted
1997 3 14
1998 6 13
1999 3 12
2000 3 18
2001 6 17
2002 6 25
2003 10 21
2004 8 20
2005 7 28
2006 18 46
2007 14 32
2008 11 33

134
Table A.5 Kansas Motorcycle Rider Injuries (Helmeted and Unhelmeted), 1997-2008
Year MC riders injured using helmets Injured unhelmeted
1997 120 455
1998 117 429
1999 148 473
2000 163 465
2001 155 472
2002 159 515
2003 198 483
2004 249 546
2005 268 579
2006 293 596
2007 368 619
2008 385 642

135
Appendix B Percentage Comparison between Motorcycle and Other Vehicle Crashes in Kansas,
1999-2008
Table B.1 Vehicle Maneuver: Percentage Comparison between MC and Other Vehicle Crashes,
1999-2008
Year Vehicle
Straight-following
road Left turn
Right
turn
U
turn Overtaking
Aggressiv
e
maneuver Other
1999
MC 58.2 13.7 3.6 0.8 2.3 5.9 21.4
OV 53.6 10.1 3.1 0.4 1.1 2.7 31.7
2000
MC 57.7 15.1 3.8 0.5 2.7 6.0 20.2
OV 53.2 10.1 3.3 0.3 1.1 2.7 32
2001
MC 57.7 14.7 3.8 0.6 2.5 4.9 20.7
OV 53.5 10.2 3.2 0.4 1.1 2.6 31.6
2002
MC 57.2 13.7 5.2 0.8 2.3 5.7 20.8
OV 53.6 10.0 3.2 0.3 1.1 2.4 31.8
2003
MC 58.9 11.7 4.4 0.6 1.8 6.0 22.6
OV 54.1 9.8 3.2 0.3 1.0 2.5 31.6
2004
MC 60.2 12.7 3.3 0.6 1.4 5.1 21.8
OV 54.1 9.4 3.1 0.3 1.0 2.4 32.1
2005
MC 59.3 12.7 4.3 0.5 1.3 5.7 21.9
OV 54.6 9.6 3.1 0.3 1.0 2.4 31.4
2006
MC 60.1 12.8 3.9 0.2 1.4 4.7 21.6
OV 54.4 9.5 3.0 0.3 0.8 2.4 32
2007
MC 60.4 13.1 3.7 0.4 1.8 5.0 20.6
OV 55.4 9.1 3.0 0.3 0.8 2.6 31.4
2008
MC 58.3 11.6 4.4 1.2 2.3 5.7 22.2
OV 55.2 9.2 3.0 0.4 0.9 2.5 31.3
Average
MC 58.8 13.2 4.0 0.6 2.0 5.5 21.4
OV 54.2 9.7 3.1 0.3 1.0 2.5 31.7

136
Table B.2 Age Distribution: Percentage Comparison between MC and Other Vehicle Crashes,
1999-2008
Age Group (years)
Year Vehicle 10 to 19 20 to 29 30 to 39 40 to 49 50 to 59 60 to 69 70 and above
1999
MC 16.5 30.4 19.3 18.1 10.1 2.6 3.0
OV 26.8 22.9 16.6 13.9 8.6 5.2 5.9
2000
MC 16.4 27.9 21.3 18.5 9.2 3.8 2.8
OV 26.2 23.7 16.4 14.2 8.8 4.9 5.7
2001
MC 15.1 28.9 18.2 20.2 11.2 3.6 2.7
OV 26.1 23.6 16.0 14.6 9.0 5.0 5.7
2002
MC 14.8 25.2 19.9 20.1 12.4 4.0 3.6
OV 25.3 24.1 15.6 14.7 9.5 5.1 5.7
2003
MC 14.9 24.7 19.2 20.1 12.5 4.7 3.9
OV 25.2 23.9 15.4 14.7 9.7 5.3 5.8
2004
MC 15.8 28.3 14.3 20.6 13.4 4.2 3.4
OV 24.5 24.0 14.9 15.0 10.4 5.4 5.8
2005
MC 13.2 25.1 19.4 18.8 14.4 5.2 4.0
OV 23.5 24.3 15.1 15.2 10.8 5.6 5.5
2006
MC 13.0 23.1 18.4 20.4 16.7 4.9 3.4
OV 23.5 24.5 14.8 14.6 11.1 5.8 5.7
2007
MC 14.0 27.9 15.9 17.8 14.8 6.2 3.4
OV 22.5 24.7 15.0 14.5 11.6 6.2 5.4
2008
MC 11.3 25.7 18.0 19.4 15.2 7.2 3.1
OV 22.5 24.8 14.9 14.1 11.6 6.5 5.6
Average
MC 14.9 26.8 18.4 19.4 12.8 4.4 3.4
OV 24.6 24.1 15.5 14.6 10.1 5.5 5.7

137
Table B.3 Light Conditions: Percentage Comparison between MC and Other Vehicle Crashes,
1999-2008
Year Vehicle Daylight Dawn Dusk Dark-streetlight on Dark-no streetlights
1999
MC 64.4 1.0 4.0 19.4 10.8
OV 70.8 2.1 2.7 13.3 10.4
2000
MC 67.7 1.5 3.9 18.3 7.9
OV 70.4 1.9 2.8 13.9 10.2
2001
MC 68.6 1.1 2.8 18.9 8.0
OV 69.9 2.1 2.8 14.2 10.3
2002
MC 66.6 1.1 3.6 19.3 9.4
OV 69.9 1.9 2.9 14.4 10.2
2003
MC 68.0 1.2 3.4 18.5 8.6
OV 70.6 1.9 2.7 14.0 10.2
2004
MC 68.5 0.9 4.6 15.2 10.3
OV 69.9 2.1 2.8 14.1 10.7
2005
MC 67.7 1.1 4.7 16.8 9.5
OV 70.2 2.2 2.5 14.3 10.5
2006
MC 69.0 1.4 5.1 16.7 7.7
OV 69.8 2.3 2.3 14.2 11.0
2007
MC 70.8 1.4 3.7 14.8 8.9
OV 69.8 2.3 2.4 14.1 10.9
2008
MC 73.5 1.9 2.8 14.1 7.4
OV 68.1 2.4 2.7 14.9 11.3
Average
MC 68.5 1.3 3.9 17.2 8.8
OV 69.9 2.1 2.7 14.1 10.6

138
Table B.4 Crash Classes: Percent Comparison between MC and Other Vehicle Crashes, 1999-
2008
Year
Vehicle No
collision
Over
turn
Collision
with
pedestrian
Collision
with
other motor
vehicle
Collision
with
parked
motor
vehicle
Collision
with
rail train
Collision
with
pedacycle
Collision
with
animal
Collision
with
fixed
object
1999
MC 6.1 23.8 0.6 43.2 1.8 0.0 0.1 5.8 17.3
OV 0.9 1.3 0.4 74.0 4.2 0.1 0.3 8.7 9.6
2000
MC 10.9 19.5 0.1 43.5 1.7 0.1 0.0 4.5 17.9
OV 0.8 1.5 0.4 73.7 4.6 0.1 0.3 8.2 10.0
2001
MC 8.1 21.2 0.7 48.0 1.2 0.0 0.3 4.5 14.6
OV 0.8 1.4 0.4 72.8 4.8 0.1 0.3 8.7 10.1
2002
MC 8.3 23.3 0.3 44.2 2.1 0.0 0.3 4.9 15.5
OV 0.9 2.7 0.4 73.0 4.8 0.1 0.3 8.1 9.2
2003
MC 8.9 21.9 0.4 44.4 2.3 0.0 0.2 6.3 14.3
OV 0.9 2.4 0.4 72.4 4.8 0.1 0.3 8.4 9.7
2004
MC 8.9 23.9 0.3 42.4 1.1 0.0 0.1 7.4 14.8
OV 0.9 2.3 0.4 72.2 4.7 0.1 0.3 9.0 9.5
2005
MC 11.0 23.5 0.1 42.0 1.0 0.0 0.2 5.7 14.8
OV 1.0 2.6 0.4 72.0 4.3 0.1 0.3 8.7 10.0
2006
MC 6.5 27.5 0.1 41.4 1.2 0.0 0.2 5.3 16.8
OV 0.7 2.4 0.4 71.9 4.2 0.1 0.3 9.6 9.9
2007
MC 9.2 22.7 0.2 43.9 1.2 0.0 0.1 6.2 15.7
OV 0.8 2.1 0.4 70.3 4.4 0.1 0.3 9.2 12.0
2008
MC 9.9 23.1 0.3 43.2 1.0 0.0 0.2 5.2 16.2
OV 0.9 1.9 0.4 70.1 4.7 0.1 0.3 9.8 11.4
Average
MC 8.8 23.0 0.3 43.6 1.5 0.0 0.2 5.6 15.8
OV 0.9 2.1 0.4 72.2 4.6 0.1 0.3 8.8 10.1

139
Table B.5 Day of Crashes: Percent Comparison between MC and Other Vehicle Crashes, 1999-
2008
Year Vehicle FR SA SU MO TU TH WE
1999
MC 15.8 18.5 17.6 12.9 9.1 13.2 12.9
OV 18.3 12.9 9.1 15.3 14.6 15 14.8
2000
MC 14.7 19 16.3 9.2 12.8 14.7 13.3
OV 17.6 12.8 9.6 14.8 14.3 15.3 15.6
2001
MC 17.8 21.8 15.4 9.7 11.6 12.8 10.8
OV 18.2 13.2 8.9 14 15 15.4 15.3
2002
MC 15.9 17.9 19.1 11.4 10.4 13.4 11.9
OV 17.8 13.5 8.9 14.9 14.2 15.2 15.4
2003
MC 14.6 19.1 21.6 12.8 9.7 11.6 10.6
OV 17.3 12.8 9.7 14.5 14.9 15.2 15.5
2004
MC 15.7 19.8 18.5 9.6 11.5 11.5 13.4
OV 17.5 12.6 9.7 14.5 14.8 15.5 15.4
2005
MC 16 20.8 17 13.6 10.5 12.7 9.4
OV 17.9 13.2 9 14.4 15.3 15 15.3
2006
MC 15.8 20.2 16.2 9.9 11.6 11.9 14.4
OV 17.4 12.9 9.5 14.3 15.3 15.6 15.1
2007
MC 16 20.3 16.8 9.6 10.7 12.6 14
OV 17.9 14.2 9.1 13.8 14.7 15.1 15.4
2008
MC 15.4 20.2 16.8 10.6 11.8 11.7 13.5
OV 16.9 12.3 8.8 13.6 16.6 15.4 16.3
Average
MC 15.8 19.7 17.5 10.9 11 12.6 12.4
OV 17.7 13 9.2 14.4 15 15.3 15.4

140
Table B.6 Time of Crashes: Percent Comparison between MC and Other Vehicle Crashes, 1999-
2008
Year Vehicle 0 to 3 3 to 6 6 to 9 9 to 12 12 to 15 15 to 18 18 to 21 21 to 24
1999
MC 7.2 2.4 5.1 8.2 14.6 28.4 19.1 14.9
OV 3.9 2.4 13.0 12.7 18.7 27.2 14.1 8.1
2000
MC 6.9 2.0 5.4 9.0 15.5 27.0 21.9 12.4
OV 4.2 2.4 12.9 12.7 18.2 27.4 14.1 8.1
2001
MC 6.8 2.3 6.9 9.7 17.4 23.0 19.7 14.2
OV 4.2 2.6 13.0 12.2 18.1 27.3 14.5 8.2
2002
MC 8.4 1.1 5.6 9.9 16.0 26.8 19.3 12.8
OV 4.2 2.4 12.2 12.4 18.4 27.7 14.6 8.1
2003
MC 6.6 2.2 6.2 8.7 17.8 25.2 20.0 13.2
OV 4.0 2.4 12.9 12.9 18.7 26.9 14.1 8.1
2004
MC 5.7 1.6 5.1 9.4 15.9 29.6 19.9 12.7
OV 4.2 2.6 13.2 13.0 18.1 27.1 13.9 7.9
2005
MC 6.8 2.2 8.4 10.2 16.4 24.8 18.6 12.6
OV 4.1 2.8 13.7 12.5 17.9 27.2 14.0 7.8
2006
MC 6.0 2.7 7.2 9.0 18.1 26.6 18.7 11.6
OV 4.5 2.8 13.5 12.0 17.8 27.1 14.2 8.1
2007
MC 6.5 1.9 7.8 9.4 19.0 25.5 19.0 10.7
OV 4.2 2.9 14.1 12.9 17.6 26.7 13.6 7.9
2008
MC 5.0 1.6 7.3 9.6 19.2 26.9 19.8 10.6
OV 4.4 3.0 14.2 12.5 17.2 26.3 14.3 8.1
Average
MC 6.6 2.0 6.5 9.3 17.0 26.4 19.6 12.6
OV 4.2 2.6 13.3 12.6 18.1 27.1 14.1 8.0

141
Table B.7 Contributing Factors: Percent Comparison between MC and Other Vehicle Crashes,
1999-2008
Year Vehicle At Road Driver Environment On road Pedestrian Vehicle
1999
MC 0.1 88.1 5.7 3.7 0.3 2.1
OV 0.2 85.5 8.2 3.8 0.4 1.9
2000
MC 0.0 87.9 6.1 2.3 0.4 3.2
OV 0.3 85.1 7.8 4.6 0.4 1.8
2001
MC 0.0 88.9 5.4 2.8 0.1 2.8
OV 0.3 85.6 8.0 4.0 0.4 1.7
2002
MC 0.0 89.6 5.9 2.6 0.6 1.3
OV 0.2 85.8 8.0 3.9 0.3 1.7
2003
MC 0.4 88.0 5.1 3.3 0.4 2.8
OV 0.6 84.3 8.9 4.2 0.4 1.6
2004
MC 0.3 87.9 7.2 3.2 0.0 1.5
OV 0.6 84.3 8.9 4.2 0.3 1.6
2005
MC 0.5 89.6 5.5 2.9 0.1 1.5
OV 0.6 83.1 9.4 5.0 0.3 1.5
2006
MC 0.1 88.1 6.7 3.2 0.0 2.0
OV 0.4 85.8 8.9 2.9 0.4 1.5
2007
MC 0.1 88.0 6.6 3.1 0.0 2.1
OV 0.8 80.8 10.4 6.4 0.3 1.4
2008
MC 0.4 86.0 6.7 4.3 0.2 2.4
OV 0.6 81.9 10.0 5.8 0.3 1.4
Average
MC 0.2 88.2 6.1 3.1 0.2 2.2
OV 0.5 84.2 8.9 4.5 0.4 1.6

142
Table B.8 On-Road Surface Characteristics: Percent Comparison between MC and Other Vehicle
Crashes, 1999-2008
Year Vehicle
Straight
and level
Straight
on grade
Straight
at hillcrest
Curved and
level
Curved on
grade
Curved
at
hillcrest
1999
MC 61.9 14.1 0.7 11.4 10.2 0.7
OV 72.3 18.1 1.9 3.5 2.9 0.1
2000
MC 60.8 14.6 1.3 11.9 10.0 0.0
OV 72.1 18.5 1.8 3.4 2.9 0.2
2001
MC 64.3 14.2 1.8 9.2 9.2 0.4
OV 73.4 17.6 1.7 3.4 2.8 0.2
2002
MC 62.2 13.6 1.9 11.4 9.9 0.5
OV 73.6 17.2 1.8 3.4 2.9 0.2
2003
MC 66.1 12.2 1.5 9.6 9.8 0.2
OV 73.1 17.6 1.8 3.6 3.0 0.1
2004
MC 62.7 14.1 2.2 9.9 10.6 0.1
OV 73.1 17.9 1.6 3.5 3.0 0.1
2005
MC 61.8 14.2 1.4 12.1 8.7 0.5
OV 72.4 18.1 1.8 3.6 3.2 0.2
2006
MC 61.0 14.1 2.4 12.7 8.2 1.0
OV 73.5 17.4 1.6 3.6 3.0 0.2
2007
MC 66.0 12.8 1.2 9.1 9.6 0.7
OV 72.9 17.5 1.7 3.7 3.3 0.2
2008
MC 63.2 14.5 1.7 10.2 9.1 0.2
OV 73.6 17.0 1.7 3.6 3.1 0.2
Average
MC 63.0 13.8 1.6 10.7 9.5 0.4
OV 73.0 17.7 1.7 3.5 3.0 0.2

143
Table B.9 Crash Locations: Percent Comparison between MC and Other Vehicle Crashes, 1999-
2008
Year
Vehicle Non
intersection
on roadway
Intersection
on roadway
Intersection
related on
roadway
Parking
lot,
driveway
on
roadway
Intersection
area on
roadway
On
crossover
on
roadway
Roadside
including
shoulder
off
roadway
Median
off
roadway
1999
MC 41.1 25.0 12.3 9.4 4.2 0.0 7.5 0.6
OV 40.9 28.1 14.9 8.7 4.6 0.1 2.4 0.2
2000
MC 43.2 27.7 10.8 7.1 6.3 0.0 4.4 0.6
OV 42.2 27.7 15.8 6.9 4.6 0.1 2.4 0.3
2001
MC 42.7 27.4 13.4 7.4 4.9 0.3 3.4 0.4
OV 41.6 26.5 16.4 7.9 4.4 0.1 2.5 0.4
2002
MC 44.3 23.8 12.4 8.0 6.9 0.0 4.5 0.0
OV 41.2 26.6 16.1 8.2 4.8 0.1 2.7 0.3
2003
MC 46.1 25.5 10.7 7.7 4.1 0.0 5.4 0.5
OV 40.7 27.0 15.5 8.1 4.8 0.0 3.2 0.4
2004
MC 42.6 22.9 13.3 7.8 6.5 0.1 6.0 0.8
OV 40.2 25.6 16.5 8.6 4.9 0.1 3.6 0.5
2005
MC 45.3 19.7 12.8 8.2 6.1 0.0 6.9 0.9
OV 40.8 25.4 16.4 7.4 5.6 0.0 3.7 0.5
2006
MC 46.3 24.4 11.2 6.1 6.5 0.0 4.8 0.6
OV 43.0 26.1 15.3 6.8 4.8 0.0 3.5 0.4
2007
MC 45.5 23.9 10.4 7.6 4.8 0.0 6.9 0.7
OV 43.1 24.6 15.1 6.8 4.7 0.1 4.9 0.6
2008
MC 38.8 23.8 12.0 7.6 5.2 0.2 11.5 0.9
OV 37.9 24.8 14.5 7.7 5.2 0.0 8.7 1.0
Averag
e
MC 43.6 24.4 11.9 7.7 5.5 0.1 6.1 0.6
OV 41.1 26.2 15.7 7.7 4.8 0.1 3.8 0.5

144
Appendix C Survey Form
This survey is being conducted with the intention of improving MC safety. Information collected will be used for research purposes only. The participation in the survey is completely voluntary and you may quit anytime. For any question feel free to contact Dr. Sunanda Dissanayake, 2118 Fiedler Hall, KSU, Manhattan, KS 66506, Tel: 785-532-1440. Please check the appropriate response (s)
1. Are you a registered motorcycle owner? ○ Yes ○ No
2. What is the brand of your current motorcycle? ○ Honda ○ Yamaha ○ Harley Davidson ○ Suzuki ○ Kawasaki ○ BMW ○Others
3. What is your MC model year? ○ Before1980 ○ 1980-1984 ○ 1985-1989 ○ 1990-1994 ○ 1995-1999 ○ 2000-2010
4. What is the engine size of your motorcycle? ○ 500cc or less ○ 501-1000 cc ○ 1001-1500cc ○ More than 1500cc
5. Which one of the following types of motorcycles do you ride most frequently? ○Touring ○ Sport ○Standard ○ Cruisers ○ Dual ○ Others
6. How long have you been riding motorcycles? ○ 0-5 yrs ○ 5-10 yrs ○ 10-15 yrs ○ 15-20 years ○ more than 20 yrs
7. How many miles did you approximately ride in the past year? ○ 1000 or less ○ 1000-2999 ○ 3000-4999 ○ 5000-7999 ○ 8000-10,000 ○ above 10,000
8. What type of roadway do you commonly travel by motorcycle? If you use more than one type of road (check all that apply). ○ City/Town roads ○ Two-lane out of-town ○ Interstate/Divided Highways ○ Rural road 9. What is the primary reason for riding motorcycle?
○ To make task related trips ○ Recreational purposes ○ To get good mileage ○ As it is fast and maneuverable ○ For its easiness of parking 10. How frequently do you ride motorcycles? ○ Everyday ○ during weekend only ○ 1-3 days a week ○ 4-6 days a week 11. What type of weather you prefer most while riding motorcycle? ○ Hot and sunny ○ Rainy ○ Cold ○ Humid ○ Mild 12. Thinking back the last time you rode a motorcycle on a public roadway, did you wear a helmet? ○ Yes ○ No ○ Don‘t remember 13. How often do you wear a helmet while riding a motorcycle? ○ Always ○ Sometimes ○ Seldom ○ Never 14. If you don’t always wear a helmet, what are the reasons? (Check all that apply) ○ I’m not worried about having accident ○ Freedom of choice ○ I don’t believe a helmet makes me safer ○ It is too hot. ○ It creates problem with my hearing ○ It creates problem with my vision ○ Weather conditions making riding more hazardous ○ Laziness/Forgetfulness ○ Other specify_________ 15. Do you know what type of helmet law Kansas currently has? ○ Mandatory helmet law○ No law ○ Partial helmet law ○ Don’t know 16. If you oppose mandatory helmet law, what is the main reason you would not support it? ○ Helmets are uncomfortable ○ Helmets are not effective in preventing motorcycle accidents ○ Helmets are not safe

145
○ Waste of government time and resources ○ Personal freedom ○It creates hearing problem 17. What kind of impact would a mandatory helmet law have on the amount you ride a motorcycle? ○ Significantly decrease ○ Somewhat decrease ○ Have had no effect ○ Somewhat increase ○ Significantly increase 18. Would you support or oppose about a law requiring motorcycle riders and their passengers to wear a helmet while riding? ○ Support ○ Oppose 19. What special effort do you make while riding to ensure other motorists can see you? Check all that apply ○ Make sure all lights are working ○ Use blinkers ○ Wear bright-colored or reflective clothing ○ Stay out of motorist blind spots ○ Use your horn ○Increase engine noise ○ Hand signal ○ Other specify_______________ 20. What other safety gears do you use than helmet while riding motorcycles? ○ Bright colored or reflective jacket ○ Gloves ○ Goggles ○ Flashing lights ○ Special shoes ○ Others ○ None 21. Have you ever had an accident while riding your motorcycle on a public roadway? ○ Yes ○ No 22. Have you had an accident while riding motorcycle over the last 12 months? ○ Yes ○ No 23. What was the worst level of injury sustained by you or someone else involved in a motorcycle accident? ○ Someone was killed ○ You were treated at scene ○ Someone else was treated at scene ○ No-one else was injured 24. What do you feel is the single biggest threat to your own safety while riding a motorcycle? ○ Drivers of other vehicles
○ Not wearing a helmet while riding ○ Weather ○ Lack of personal experience ○ Road surface conditions ○ Lack of adequate training ○ Other specify________ 25. Your gender? ○ Male ○ Female 26. Your age (in years)? ○ below 18 ○18-24 ○25-33 ○ 34-42 ○ 43-51 ○52 and above 27. Marital status? ○ Single (never married) ○ Married/living with partner ○ Separated/divorced/widowed 28. Your educational qualification? ○ No formal schooling ○ Some High school ○ Some College ○ Four Year College ○ Graduate College 29. Present Job Situation? ○ Full-Time Work ○ Part-Time Work ○ Student ○ Home Maker ○ Pension or Unemployed ○ Other (please specify) _ 30. Which category does your household’s total annual income fall into? ○ $ 0 to $ 19,999 ○ $20,000-39,999 ○ $40,000 -$59,999 ○ 60,000 or above 31. What do you think is the most difficult maneuver to execute while riding a motorcycle? (Check all that apply) ○ To make a left turn in front of oncoming traffic ○ To change a lane ○ To make an exit on the freeway ○ To merge from an exit ○ Fast swerve ○ Low speed parking maneuver ○ Emergency stopping ○ Keep straight ○ Negotiate a curve ○ Slow down suddenly ○ Avoid others in way ○ Riding in thunderstorm 32. Do you prefer riding motorcycle in groups?

146
○ Yes ○ No
33. Rate the following factors according to their contributions to cause an accident from most contributive to the least. Most Significant Average Not significant Least
Tip over ○ ○ ○ ○ ○
Too fast in curve ○ ○ ○ ○ ○
Conflicts with cars ○ ○ ○ ○ ○
Poor road surfaces (potholes,
Loose gravel, oil etc.) ○ ○ ○ ○ ○
Bad weather (rain, wind etc.) ○ ○ ○ ○ ○
Speed (Exceeding speed limit) ○ ○ ○ ○ ○
Couldn’t see far enough ○ ○ ○ ○ ○
Alcohol or drugs ○ ○ ○ ○ ○
Road surface features (like
Pavement markings) ○ ○ ○ ○ ○
Worn tires ○ ○ ○ ○ ○
Misjudged speed of
other vehicles ○ ○ ○ ○ ○
Fatigue ○ ○ ○ ○ ○
Distraction ○ ○ ○ ○ ○
Not using a helmet ○ ○ ○ ○ ○
Lack of adequate training ○ ○ ○ ○ ○
Over taking ○ ○ ○ ○ ○
Traffic hazard ○ ○ ○ ○ ○

147
Appendix D Newspaper Clips of Motorcycle Crashes in Kansas
Figure D.1 Manhattan Mercury News Clip for Motorcycle Crash Caused by Collision with
Minivan
Figure D.2 Wichita Eagle News Clip for Motorcycle Crash Caused by Collision with Guard Rail

148
Figure D.3 Wichita Eagle News Clip for Motorcycle Crash Caused by Collision with a Car
Figure D.4 Wichita Eagle News Clip for Motorcycle Crash Caused by Collision with
Motorcycle

149
Figure D.5 Wichita Eagle News Clip for Motorcycle Crash Caused by Collision with a Deer
Figure D.6 LJWorld.com News Clip for Motorcycle Crash Caused by Hitting the Median Curb

150
Figure D.7 Wichita Eagle News Clip for Motorcycle Clip Caused by Losing Control on a Curve

151
Figure D.8 KMBC.com News Clip for Motorcycle Fatal Crash Victim Identification

152
Figure D.9 Wichita Eagle News Clip for Motorcycle Crash Caused by Collision in Intersection

153
Figure D.10 Wichita Eagle News Clip for Motorcycle Crash Caused by Rear Collision with a
Minivan
Figure D.11 Wichita Eagle News Clip for Motorcycle Crash Caused by Collision with a Truck

154
Figure D.12 Topeka Capital-Journal News Clip for Motorcycle Fatality Trend

155
Figure D.13 KMBC.com News Clip for Motorcycle Crash
Figure D.14 Wichita Eagle News Clip for Motorcycle Death

156
Figure D.15 Fwix.com News Clip for Motorcycle Fatal Crash Caused by Failure to Yield
Figure D.16 KearneyHub.com News Clip for Motorcycle Fatal Crash by Overturning

157
Figure D.17 Hometowndailynews.com News Clip for Motorcycle Fatal Crash by Overturning
Figure D.18 Fox Kansas News Clip for Motorcycle Fatal Crash Caused by Crashing into a
Truck