IMPROVEMENT OF EEG SIGNAL RECORDING ITH NON CONTACT ...
13
International journal of Biomedical Engineering and Science (IJBES), Vol. 1, No. 3, October 2014 1 IMPROVEMENT OF EEG SIGNAL RECORDING WITH NON-CONTACT ELECTRODES IN AN HEADSET SYSTEM Vangu Kitoko Faculty of Engineering and Information Technologies, University of Technology Sydney, NSW, Australia ABSTRACT This paper presents methods in recording satisfactory EEG signals using non-contact capacitive EPIC electrodes in a headset system. The method involves incorporating only a single pair (two) of non-contact capacitive electrodes, positioned at targeted site of the scalp. The second important aspect is the consideration of the headset systems for maintaining stable position and contact at the interface between headset-based non-contact EPIC electrodes system and the targeted sites of scalp skin. The critical aspect is the optimization evaluation of contact pressure at the interface between headset-based non-contact EPIC electrode and scalp to minimising movement of the electrode with respect to the skin, and this will directly affect the optimal quality of the recording EEG signals. Thus, the classification performance of the recorded EEG signals can be optimised with maximum of subject comfort. KEYWORDS EEG recording method, Non-contact electrode, Headset system, Optimization, EEG classification. 1. INTRODUCTION Although basics of the brain electrical scalp recordings of human have been the same since it was first performed by Hans Berger in 1929[1], the technological developments give the opportunity to build much more sophisticated acquisition systems regarding clinical needs and scientific research communities. The human brain generates cortical electrical signals called EEG signals which are roughly in very low amplitude range (typically 1-100 μV) and very low frequency behaviour (less than 100Hz) related to body functions, and acquired by electrodes non-invasively placed on the scalp of the head. This paper is about their recording. The main problem in EEG recording is that these signals are generally obscured by transient signal noises and large-amplitude artefacts which can also produce power increases at specific frequencies and affect their classification accuracy of EEG signals, and then usability. In that sense, method to record good EEG signals should be considered. This paper presents method for recording EEG signals using non-contact capacitive EPIC electrodes in a headset system. The method involves incorporating only three non-contact capacitive EPIC electrodes, positioned at targeted site of the scalp. The second important aspect is the consideration of the headset systems for maintaining stable position and contact at the interface between headset-based non-contact EPIC electrodes system and the targeted sites of scalp skin. The critical aspect is the optimization evaluation of contact pressure at the interface between headset-based non-contact EPIC electrode and scalp to minimising movement of the electrode with respect to the skin, and this will directly affect the optimal quality of the recording
Transcript of IMPROVEMENT OF EEG SIGNAL RECORDING ITH NON CONTACT ...
International journal of Biomedical Engineering and Science (IJBES), Vol. 1, No. 3, October 2014
1
IMPROVEMENT OF EEG SIGNAL RECORDING WITH
NON-CONTACT ELECTRODES IN AN HEADSET SYSTEM
Vangu Kitoko
Faculty of Engineering and Information Technologies, University of Technology Sydney,
NSW, Australia
ABSTRACT
This paper presents methods in recording satisfactory EEG signals using non-contact capacitive EPIC
electrodes in a headset system. The method involves incorporating only a single pair (two) of non-contact
capacitive electrodes, positioned at targeted site of the scalp. The second important aspect is the
consideration of the headset systems for maintaining stable position and contact at the interface between
headset-based non-contact EPIC electrodes system and the targeted sites of scalp skin. The critical aspect
is the optimization evaluation of contact pressure at the interface between headset-based non-contact EPIC
electrode and scalp to minimising movement of the electrode with respect to the skin, and this will directly
affect the optimal quality of the recording EEG signals. Thus, the classification performance of the
recorded EEG signals can be optimised with maximum of subject comfort.
KEYWORDS
EEG recording method, Non-contact electrode, Headset system, Optimization, EEG classification.
1. INTRODUCTION
Although basics of the brain electrical scalp recordings of human have been the same since it was
first performed by Hans Berger in 1929[1], the technological developments give the opportunity
to build much more sophisticated acquisition systems regarding clinical needs and scientific
research communities. The human brain generates cortical electrical signals called EEG signals
which are roughly in very low amplitude range (typically 1-100 µV) and very low frequency
behaviour (less than 100Hz) related to body functions, and acquired by electrodes non-invasively
placed on the scalp of the head. This paper is about their recording.
The main problem in EEG recording is that these signals are generally obscured by transient
signal noises and large-amplitude artefacts which can also produce power increases at specific
frequencies and affect their classification accuracy of EEG signals, and then usability. In that
sense, method to record good EEG signals should be considered.
This paper presents method for recording EEG signals using non-contact capacitive EPIC
electrodes in a headset system. The method involves incorporating only three non-contact
capacitive EPIC electrodes, positioned at targeted site of the scalp. The second important aspect is
the consideration of the headset systems for maintaining stable position and contact at the
interface between headset-based non-contact EPIC electrodes system and the targeted sites of
scalp skin. The critical aspect is the optimization evaluation of contact pressure at the interface
between headset-based non-contact EPIC electrode and scalp to minimising movement of the
electrode with respect to the skin, and this will directly affect the optimal quality of the recording
International journal of Biomedical Engineering and Science (IJBES), Vol. 1, No. 3, October 2014
2
EEG signals. Thus, the classification performance of the recorded EEG signals can be optimised
with maximum of subject comfort.
We will thus record EEG simultaneously with non-contact EPIC electrode and wet contact
electrodes.
2. METHODS
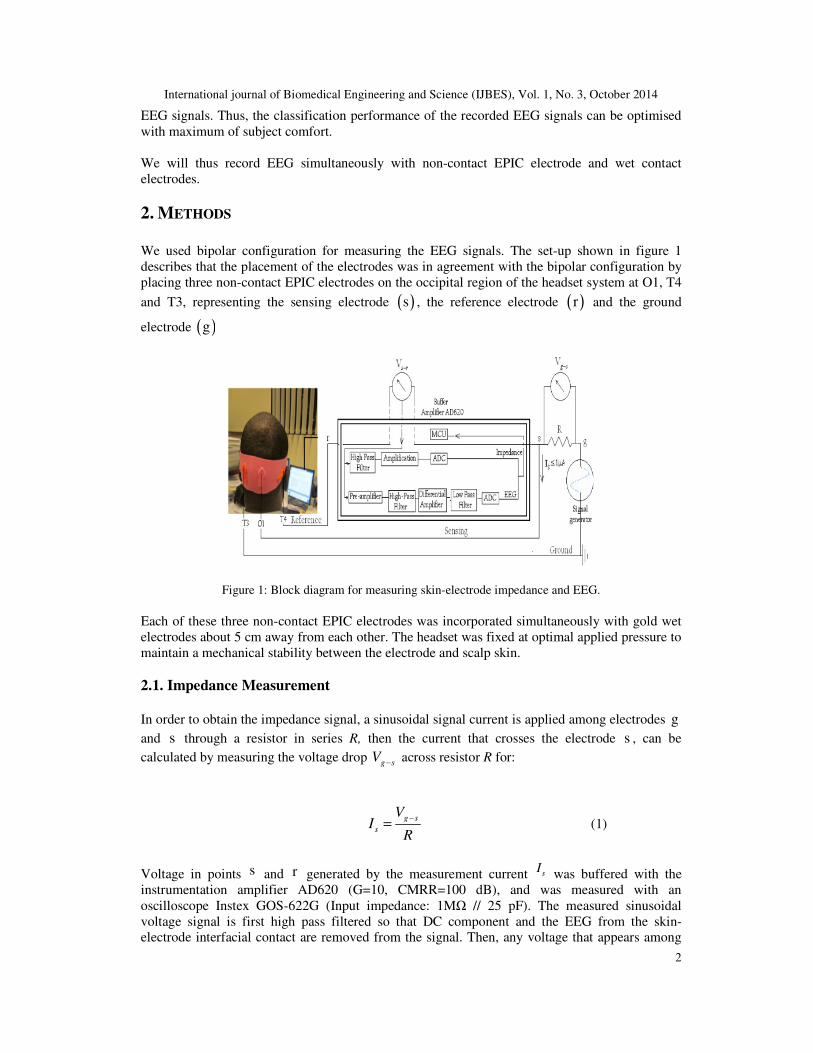
We used bipolar configuration for measuring the EEG signals. The set-up shown in figure 1
describes that the placement of the electrodes was in agreement with the bipolar configuration by
placing three non-contact EPIC electrodes on the occipital region of the headset system at O1, T4
and T3, representing the sensing electrode ( )s , the reference electrode ( )r and the ground
electrode ( )g
Figure 1: Block diagram for measuring skin-electrode impedance and EEG.
Each of these three non-contact EPIC electrodes was incorporated simultaneously with gold wet
electrodes about 5 cm away from each other. The headset was fixed at optimal applied pressure to
maintain a mechanical stability between the electrode and scalp skin.
2.1. Impedance Measurement
In order to obtain the impedance signal, a sinusoidal signal current is applied among electrodes g
and s through a resistor in series R, then the current that crosses the electrode s , can be
calculated by measuring the voltage drop g sV − across resistor R for:
g s
s
VI
R
−= (1)
Voltage in points s and r generated by the measurement current sI was buffered with the
instrumentation amplifier AD620 (G=10, CMRR=100 dB), and was measured with an
oscilloscope Instex GOS-622G (Input impedance: 1MΩ // 25 pF). The measured sinusoidal
voltage signal is first high pass filtered so that DC component and the EEG from the skin-
electrode interfacial contact are removed from the signal. Then, any voltage that appears among

International journal of Biomedical Engineering and Science (IJBES), Vol. 1, No. 3, October 2014
3
the electrodes s and r is due to the impedance sZ that is the impedance of the union of the
sensing electrode s with the skin. Consequently,
s r s r
s
s g s
V VZ R
I V
− −
−
= = (2)
Finally signal is amplified and converted into digital form. A 16-bits differential analogue-to-
digital converter (ADC) was used to acquire the amplified and filtered signal from electrode, with
frequency of 256 samples per second. The skin-electrode contact impedance was therefore
measured at 256 different frequencies range between 1 and 1000 Hz with a maximum of pp1V ,
where the injected current is proportional to the selected resistor at 100 nA to 1µA . The resistor
R << 200 MΩ was large enough to secure this constant current condition in the circuit. All
measurements were taken without averaging and all data were recorded in the analyser and then
downloaded to a host PC employing the software provided by the manufacturer.
2.2. EEG recording
Figure 2. Overall flow of the data processing for classification.
EEG is detected from the measurement signal by first low-pass filtering the measurement signal
(Figure 1), which removes the high frequency signals from the skin-electrode impedance
contact[2,3]. Next the EEG signal is amplified and digitized. A 12-bits differential analogue-to-
digital converter (ADC) was used to acquire the amplified and filtered signal from electrode, with
sampling rate of 256 Hz. The sampled signals were then sent wirelessly to a computer for
processing. The overall flow of the proposed processing is presented in Figure 2.
International journal of Biomedical Engineering and Science (IJBES), Vol. 1, No. 3, October 2014
4
The processing steps include pre-processing and feature extraction[4]. Pre-processing including
filtering, digitizing, artefact removing and DC level correction are to be applied on the EEG
signals. Feature extraction part focus on extracting features accurately using FFT-PSD technique
as described in the previous chapter. Following the parameterization, classification is performed
using Feed Forward Back-Propagation Neural Network (BPNN) trained using Levenberg-
Marquardt algorithm. All processing and analysis were performed in Matlab R2009b, using
scripts for processing data[5].
3. EXPERIMENTAL RESULTS
All measurements were performed on eight (8) disabled subjects (6 males including 2 dark-
skinned and 4 fair-skinned, and 2 females including 1 dark-skinned and 1 fair-skinned). All
participants were volunteers and had a similar educational background, taking no medication, and
reporting no medical treatments or health problems. The experiment was undertaken at the Centre
for Health Technologies (CHT) at an ambient temperature of 23 ± 2 C and a relative humidity
between 50 and 55%, with the understanding and written consent of each participant, following
the recommendations of the ethics committee of the University of Technology Sydney-Australia.
3.1. Impedance
The contact impedance to several frequencies was obtained varying the injected current to obtain
a better noise-signal ratio. Before starting the measurements, we observed the warm-up time of 30
min after electrode placement, and then we performed a calibration to guarantee reliable and
reproducible results. The test signal of the impedance spectroscopy was set to 1 V and the
frequency range from 0.5 to 1000 Hz. Twenty four tests were performed on height different
subjects in this study.
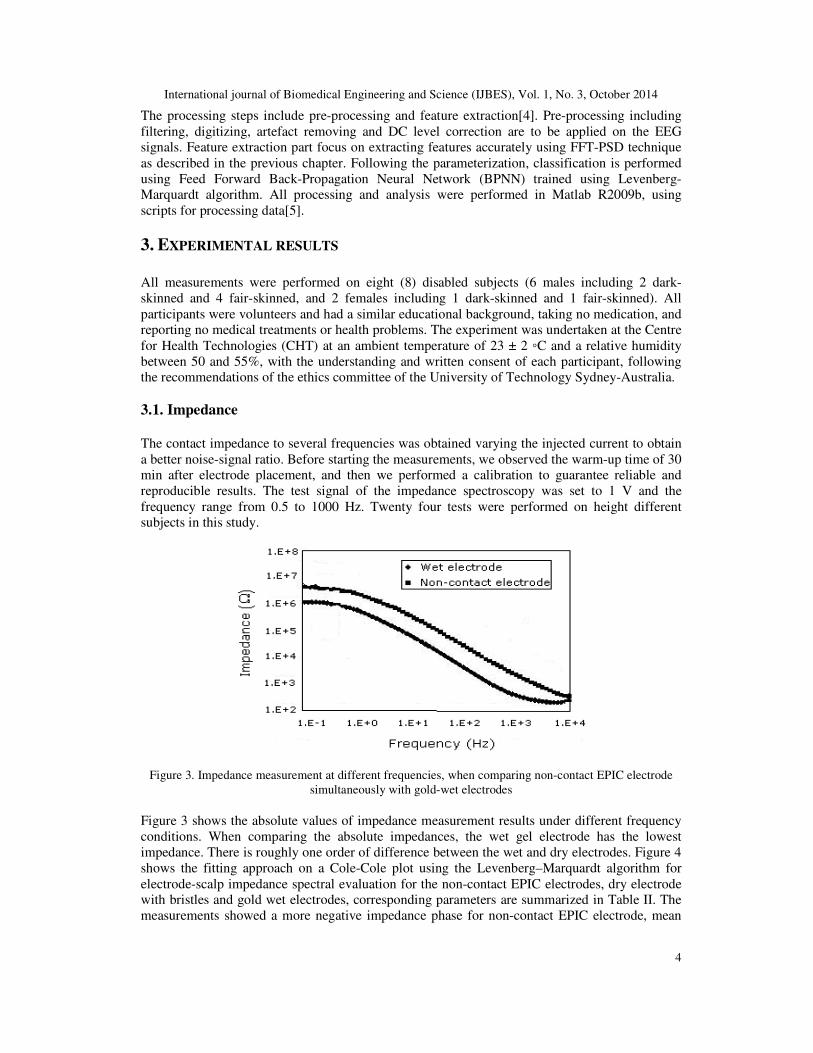
Figure 3. Impedance measurement at different frequencies, when comparing non-contact EPIC electrode
simultaneously with gold-wet electrodes
Figure 3 shows the absolute values of impedance measurement results under different frequency
conditions. When comparing the absolute impedances, the wet gel electrode has the lowest
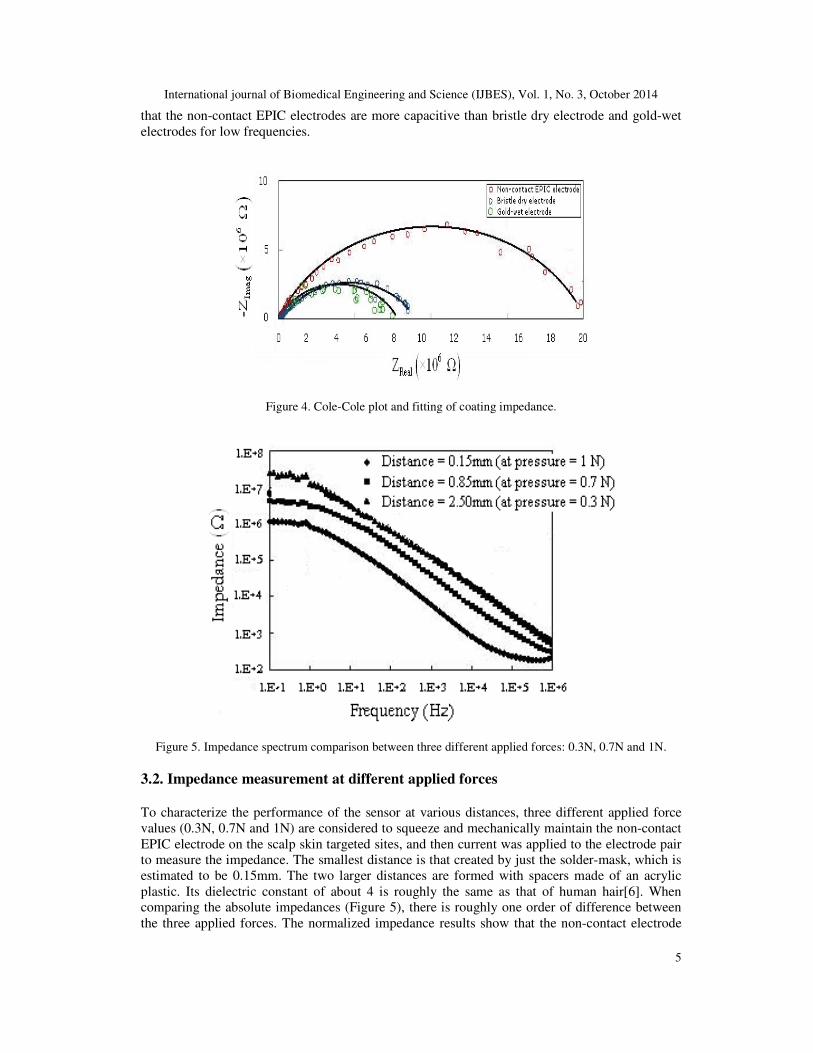
impedance. There is roughly one order of difference between the wet and dry electrodes. Figure 4
shows the fitting approach on a Cole-Cole plot using the Levenberg–Marquardt algorithm for
electrode-scalp impedance spectral evaluation for the non-contact EPIC electrodes, dry electrode
with bristles and gold wet electrodes, corresponding parameters are summarized in Table II. The
measurements showed a more negative impedance phase for non-contact EPIC electrode, mean
International journal of Biomedical Engineering and Science (IJBES), Vol. 1, No. 3, October 2014
5
that the non-contact EPIC electrodes are more capacitive than bristle dry electrode and gold-wet
electrodes for low frequencies.
Figure 4. Cole-Cole plot and fitting of coating impedance.
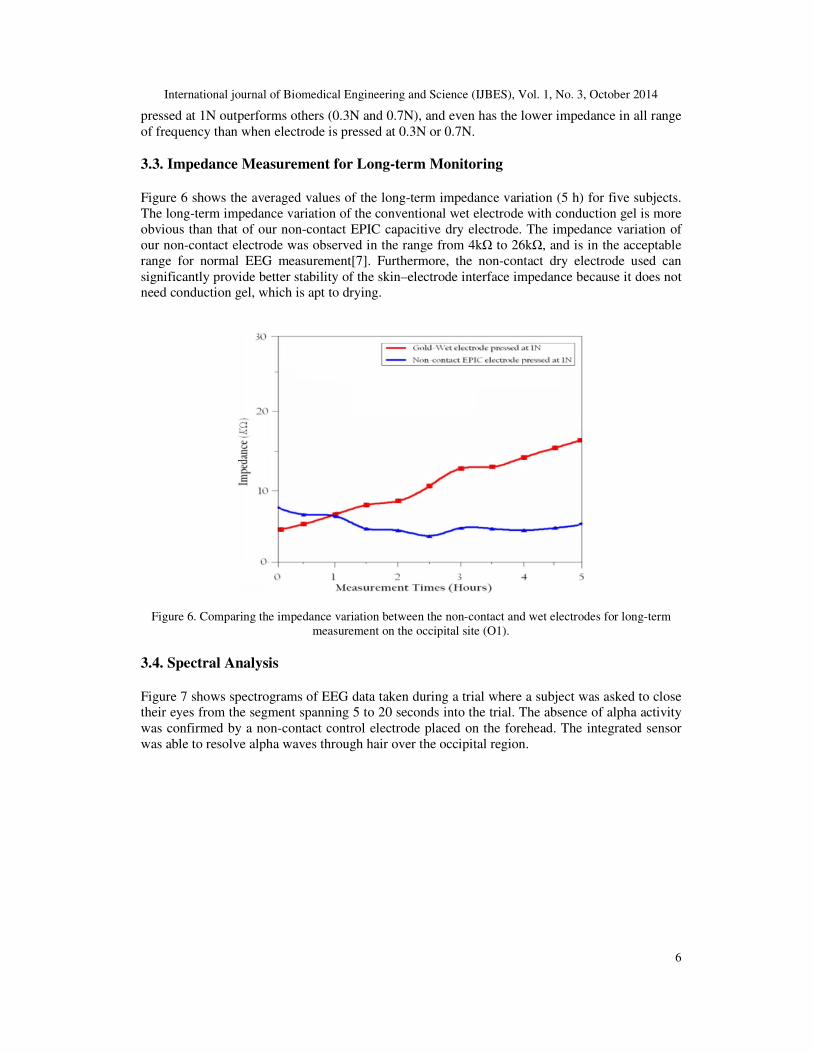
Figure 5. Impedance spectrum comparison between three different applied forces: 0.3N, 0.7N and 1N.
3.2. Impedance measurement at different applied forces
To characterize the performance of the sensor at various distances, three different applied force
values (0.3N, 0.7N and 1N) are considered to squeeze and mechanically maintain the non-contact
EPIC electrode on the scalp skin targeted sites, and then current was applied to the electrode pair
to measure the impedance. The smallest distance is that created by just the solder-mask, which is
estimated to be 0.15mm. The two larger distances are formed with spacers made of an acrylic
plastic. Its dielectric constant of about 4 is roughly the same as that of human hair[6]. When
comparing the absolute impedances (Figure 5), there is roughly one order of difference between
the three applied forces. The normalized impedance results show that the non-contact electrode
International journal of Biomedical Engineering and Science (IJBES), Vol. 1, No. 3, October 2014
6
pressed at 1N outperforms others (0.3N and 0.7N), and even has the lower impedance in all range
of frequency than when electrode is pressed at 0.3N or 0.7N.
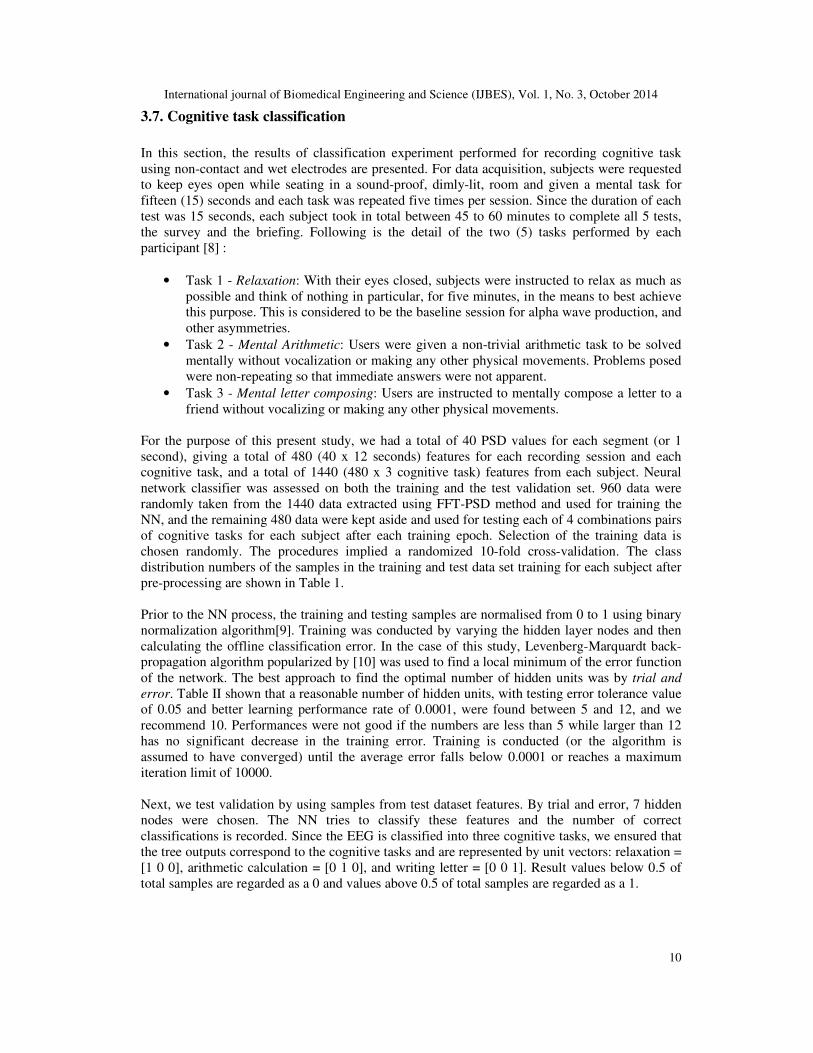
3.3. Impedance Measurement for Long-term Monitoring
Figure 6 shows the averaged values of the long-term impedance variation (5 h) for five subjects.
The long-term impedance variation of the conventional wet electrode with conduction gel is more
obvious than that of our non-contact EPIC capacitive dry electrode. The impedance variation of
our non-contact electrode was observed in the range from 4kΩ to 26kΩ, and is in the acceptable
range for normal EEG measurement[7]. Furthermore, the non-contact dry electrode used can
significantly provide better stability of the skin–electrode interface impedance because it does not
need conduction gel, which is apt to drying.
Figure 6. Comparing the impedance variation between the non-contact and wet electrodes for long-term
measurement on the occipital site (O1).
3.4. Spectral Analysis
Figure 7 shows spectrograms of EEG data taken during a trial where a subject was asked to close
their eyes from the segment spanning 5 to 20 seconds into the trial. The absence of alpha activity
was confirmed by a non-contact control electrode placed on the forehead. The integrated sensor
was able to resolve alpha waves through hair over the occipital region.

International journal of Biomedical Engineering and Science (IJBES), Vol. 1, No. 3, October 2014
7
Figure 7. Spectrograms of EEG data when subject was asked to close their eyes from the segment spanning
5 to 20 seconds into the trial. The absence and the presence of alpha activity when non-contact electrodes
are placed on the forehead and occipital.
3.5. Motion Sensitivity
Figure 8: Comparison of noise between wet gold and non-contact electrodes across five subjects during fast
motion.
In this experiment, EEG measurements were carried-out using the non-contact EPIC electrode
simultaneously with wet electrode to investigate whether it is possible to perform unsupervised
fast recordings with non-contact EPIC sensor.
To this end, we recorded ongoing EEG while the participant is at resting condition with eyes open
for around 10s. While recording, high-frequency oscillation evoked by median nerve stimulation
test was carried-out. This fast EEG activity is visibly in the 17.5–30 ms time interval with an
amplitude of around 0.2 – 0.4µV (Figure 8).

International journal of Biomedical Engineering and Science (IJBES), Vol. 1, No. 3, October 2014
8
3.6. Noise calculation
To help facilitate objective comparisons, we have computed the level of noise when non-contact
EPIC electrode is used in recording EEG signals. For this purpose, the time-domain EEG signal
from G-electrode in simultaneous comparison with its counterparts recorded by our proposed dry
non-contact EPIC electrode is shown in Figure 9. From first glance, the amplitude from the wet
electrode almost perfectly matches that from the non-contact, verifying that it is indeed capable of
acquiring EEG signals through hair.
Figure 9: the time-domain EEG signal from gold wet electrodes in simultaneous comparison with dry non-
contact EPIC electrode while subject is resting with eyes-closed for around 15s.
For quantitative analysis of the signal quality from the various electrode types, a few key
parameters are desired. First, it is useful to obtain a metric that conveys how close the signal from
non-contact electrodes matches the signal from a ’gold standard’ wet electrode. Secondly, it is
also useful to know the ratio, or SNR Specifically for this experiment, After the EEG signal
quality has been verified by the user, the application can switch to canonical correlation analysis
(CCA) mode, provided by each electrode showing the amount of useful cognitive EEG signal
versus the background noise. Correlations between dry and wet difference latencies were obtained
by calculating bivariate correlations (Pearson correlation), which were tested for significance by a
one sample t-test against zero. The probability of getting a correlation as large as the resulting one
by chance, if true correlation was zero, was evaluated against a significance level of 0.05. For
confirmation, the same event was experimentally repeated also to the remaining four subjects.
Their amplitude profiles, not included here, showed optimal match between both non-contact
electrode and wet electrode in all tested subjects similar to figure 9.

International journal of Biomedical Engineering and Science (IJBES), Vol. 1, No. 3, October 2014
9
Table 1. Signal correlation and computed SNR (in decibel)
between no-contact and wet electrodes
Subject Sensor Correlation SNR (dB)
N-C vs Wet N-C Wet 1 0.85 -12.7 -11.4 2 0.96 -9.3 -8.5 3 0.93 -10.2 -7.8 4 0.91 -11.5 -7.1 5 0.88 -10.4 -9.5
A summary of the computed correlations can be found in Table I. Results shown that bivariate
correlations could not show any significant differences in amplitude for both recording electrodes
across subjects. Over half (three) the subjects had a correlation of greater than 0.9 (0.96, 0.93 and
0.91) and the remaining (two) subjects had correlation values of above 0.8, between non-contact
and wet electrodes. Some minor differences in the oscillatory burst are likely to be due to
differences in spatial locations and skin preparation of electrodes.
EEG data collected were also used to examine the peaks and troughs of a wave differ on an
average from the mean voltage using the standard deviation. For analysing the statistical feature
of a signal, the signal’s mean has to be computed. It can also be claimed that the mean value is
the average value of a signal. The signal mean value is determined by:
1
0
1 N
i
i
xN
µ−
=
= ∑ (3)
where µ represents the signal mean and the signal contained in 0x through
1Nx − and i denote an
index that goes through these values. Using the equation Error! Reference source not found.,
the standard deviation is computed as,
( )1
2
0
1
1
N
std i
i
xN
σ µ−
=
= −−∑ (4)
which represents the noise and other inferences. The signal to noise (SNR) is thus calculated by
dividing the mean by the standard deviation value.
( ) ( )1020log
stdSNR dB µ σ= (5)
Computed values in Table 1 shown that the signal quality or instantaneous SNR using non-
contact electrodes was less significant compared with the wet gold-electrodes between subjects.
They are always well below 0 dB due to the small amplitude of the alpha EEG signal relative to
the background EEG and noise.
The complete analysis could confirm that electrodes used were in good contact with reduced
noisy. However, if the electrodes were in poor contact and noisy, causing the recording electrodes
to drift synchronously, then the correlation value should increase towards one, irrespective of how
well the individual sensors are performing.
International journal of Biomedical Engineering and Science (IJBES), Vol. 1, No. 3, October 2014
10
3.7. Cognitive task classification
In this section, the results of classification experiment performed for recording cognitive task
using non-contact and wet electrodes are presented. For data acquisition, subjects were requested
to keep eyes open while seating in a sound-proof, dimly-lit, room and given a mental task for
fifteen (15) seconds and each task was repeated five times per session. Since the duration of each
test was 15 seconds, each subject took in total between 45 to 60 minutes to complete all 5 tests,
the survey and the briefing. Following is the detail of the two (5) tasks performed by each
participant [8] :
• Task 1 - Relaxation: With their eyes closed, subjects were instructed to relax as much as
possible and think of nothing in particular, for five minutes, in the means to best achieve
this purpose. This is considered to be the baseline session for alpha wave production, and
other asymmetries.
• Task 2 - Mental Arithmetic: Users were given a non-trivial arithmetic task to be solved
mentally without vocalization or making any other physical movements. Problems posed
were non-repeating so that immediate answers were not apparent.
• Task 3 - Mental letter composing: Users are instructed to mentally compose a letter to a
friend without vocalizing or making any other physical movements.
For the purpose of this present study, we had a total of 40 PSD values for each segment (or 1
second), giving a total of 480 (40 x 12 seconds) features for each recording session and each
cognitive task, and a total of 1440 (480 x 3 cognitive task) features from each subject. Neural
network classifier was assessed on both the training and the test validation set. 960 data were
randomly taken from the 1440 data extracted using FFT-PSD method and used for training the
NN, and the remaining 480 data were kept aside and used for testing each of 4 combinations pairs
of cognitive tasks for each subject after each training epoch. Selection of the training data is
chosen randomly. The procedures implied a randomized 10-fold cross-validation. The class
distribution numbers of the samples in the training and test data set training for each subject after
pre-processing are shown in Table 1.
Prior to the NN process, the training and testing samples are normalised from 0 to 1 using binary
normalization algorithm[9]. Training was conducted by varying the hidden layer nodes and then
calculating the offline classification error. In the case of this study, Levenberg-Marquardt back-
propagation algorithm popularized by [10] was used to find a local minimum of the error function
of the network. The best approach to find the optimal number of hidden units was by trial and
error. Table II shown that a reasonable number of hidden units, with testing error tolerance value
of 0.05 and better learning performance rate of 0.0001, were found between 5 and 12, and we
recommend 10. Performances were not good if the numbers are less than 5 while larger than 12
has no significant decrease in the training error. Training is conducted (or the algorithm is
assumed to have converged) until the average error falls below 0.0001 or reaches a maximum
iteration limit of 10000.
Next, we test validation by using samples from test dataset features. By trial and error, 7 hidden
nodes were chosen. The NN tries to classify these features and the number of correct
classifications is recorded. Since the EEG is classified into three cognitive tasks, we ensured that
the tree outputs correspond to the cognitive tasks and are represented by unit vectors: relaxation =
[1 0 0], arithmetic calculation = [0 1 0], and writing letter = [0 0 1]. Result values below 0.5 of
total samples are regarded as a 0 and values above 0.5 of total samples are regarded as a 1.
International journal of Biomedical Engineering and Science (IJBES), Vol. 1, No. 3, October 2014
11
Table 2. Average squared error vs. hidden units
Parameters Values
Input Neurons 1440
Output Neurons 5 (0 and 1)
Hidden Neurons 5 - 30
Learning Rate 0.0001
Testing Error Tolerance 0.05
Maximum Epoch 10000
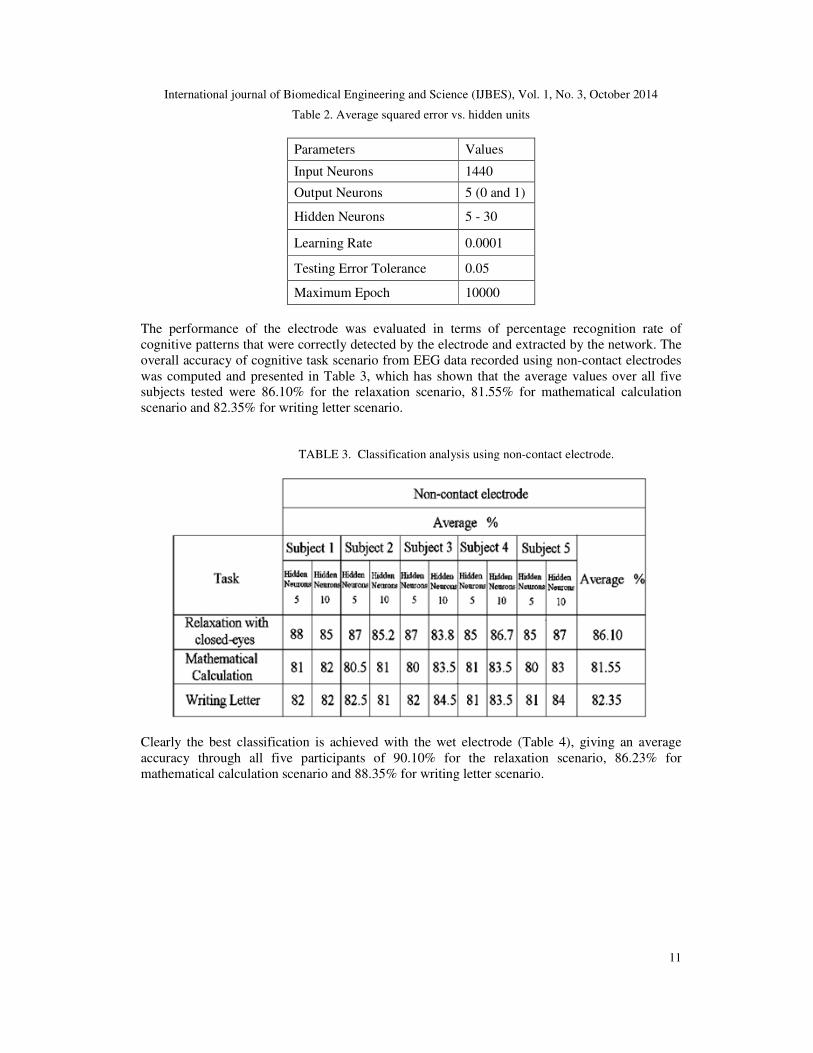
The performance of the electrode was evaluated in terms of percentage recognition rate of
cognitive patterns that were correctly detected by the electrode and extracted by the network. The
overall accuracy of cognitive task scenario from EEG data recorded using non-contact electrodes
was computed and presented in Table 3, which has shown that the average values over all five
subjects tested were 86.10% for the relaxation scenario, 81.55% for mathematical calculation
scenario and 82.35% for writing letter scenario.
TABLE 3. Classification analysis using non-contact electrode.
Clearly the best classification is achieved with the wet electrode (Table 4), giving an average
accuracy through all five participants of 90.10% for the relaxation scenario, 86.23% for
mathematical calculation scenario and 88.35% for writing letter scenario.

International journal of Biomedical Engineering and Science (IJBES), Vol. 1, No. 3, October 2014
12
TABLE 4. Classification analysis using wet electrodes.
4. CONCLUSION
In this paper, methods using non-contact capacitive EPIC electrodes in a headset system have
been proposed for effective EEG recordings and classification of the cognitive EEG signals as
relaxation with eye-closed, mathematical calculation and writing letter tasks. Results could show
that our proposed recording technique is able to acquire quality EEG signals at different
conditions. However, there is lack of optimal effectiveness and efficiency of the proposed non-
contact electrode in recording cognitive states in comparison with wet electrode. This is because
the PSD features extracted using FFT technique constitutes a high dimensional vector (1440
features from three different cognitive states recorded) that contains information pertinent to the
classification accuracy of electrode in recording cognitive states, as well as irrelevant
components. A novel EEG signal classification method is needed which will be presented in our
future work.
REFERENCES
[1] H. Berger, "On the Electroencephalogram of man," Arch. Psychiatrie. Nervenkrankheiten, vol. 87, pp.
527-570, 1929.
[2] M. S. Spach, J. W. Barr, J. W. Havstad, and E. C. Long, "Skin-electrode impedance and its effect on
recording cardiac potentials," Journal of the American Heart Association vol. 34, pp. 649-656, 1966.
[3] M. K. Kowar, "Characterization of a paste less ECG electrode," Impact: International Journal of
Research in Engineering & Technology, vol. 2(5), pp. 249-254, 2014.
[4] D. J. McFarland, C. W. Anderson, K. R. Muller, A. Schlogl, and D. J. Krusienski, "BCI meeting
2005-workshop on BCI signal processing: feature extraction and translation," IEEE Transaction on
Neural Systems and Rehabilitation Engineering, vol. 14, pp. 135-138, 2006.
[5] A. Delorme and S. Makeig, "EEGLAB: an open source toolbox for analysis of single-trial EEG
dynamics," Journal of Neuroscience Methods, vol. 134, pp. 9-21, 2004.
[6] J. Errera and H. S. Sack, "Dielectric Properties of Animal Fibers," Journal of Industrial and
Engineering Chemistry, vol. 35(6), pp. 712-716, 1943.
[7] Y. M. Chi, T.-P. Jung, and G. Cauwenberghs, "Dry-contact and Noncontact Biopotential Electrodes:
Methodological Review," IEEE Reviews in Biomedical Engineering, vol. Vol. 3, pp. pp. 106-119,
2010.
[8] Z. A. Keirn and J. I. Aunon, "A new mode of communication between man and his surroundings,"
IEEE Transactions on Biomedical Engineering, vol. 37(12), pp. 1209-1214, 1990.
International journal of Biomedical Engineering and Science (IJBES), Vol. 1, No. 3, October 2014
13
[9] S. N. Sivanandam and M. P. Paulraj, "Introduction to Artificial Neural Networks," Vikas Publishing
House, India, 2003.
[10] D. E. Rumelhart, G. E. Hinton, and R. J. Williams, "Learning Internal Representations by Error
Propagation - Chapter 8," Nature, vol. 323, pp. 533-536, 1986.
Author
Vangu Kitoko received his BS from the department of Electro-Mechanical
Engineering, Institut Superieur des Techniques Appliquees (ISTA), Kinshasa,
Democratic Republic of Congo in 1990, and two Ms degrees in Mechanical
Engineering, the Universidade of Brasilia, Brazil in 1996 and the University of
Sydney, Australia in 2003. He has many years of professional experiences. He is
currently studying in the PHD program at the University of Technology Sydney,
Australia.
In recent years, his research interests have included advanced bio-sensing techniques and advanced
mathematical formulation in designing of EEG acquisition system.