Impressions on Super Bowl advertisements - BCE Inc. · Final Sample Size 1,000 Randomly selected...
15
Impressions on Super Bowl advertisements Super Bowl Advertisements Survey Summary submitted by Nanos to Bell Media, July 2017 (Submission 2017-1042)
Transcript of Impressions on Super Bowl advertisements - BCE Inc. · Final Sample Size 1,000 Randomly selected...

Impressions on Super Bowl advertisements Super Bowl Advertisements Survey Summary submitted by Nanos to Bell Media, July 2017 (Submission 2017-1042)

Methodology
Confidential 15
Nanos conducted an RDD dual frame (land- and cell-lines) random telephone survey of 1,000 English speaking Canadians, 18 years of age or older, between June 22nd and 28th, 2017. Participants were randomly recruited by telephone using live agents and administered a survey. The sample is geographically stratified to be representative of Canada.
Individuals were randomly called using random digit dialling with a maximum of five call backs.
The margin of error for a random survey of 1,000 English speaking Canadians is ±3.1 percentage points, 19 times out of 20.
The research was commissioned by Bell Media.
Note: Charts may not add up to 100 due to rounding.

Technical NoteElement Description
Organization who commissioned the research
Bell Media
Final Sample Size 1,000 Randomly selected English speaking Canadians
Margin of Error ±3.1 percentage points, 19 times out of 20.
Mode of SurveyRDD dual frame (land- and cell-lines) random telephone survey
Sampling Method BaseThe sample included both land- and cell-lines RDD (Random Digit Dialed) across Canada.
Demographics (Captured)Atlantic Canada, Quebec, Ontario, Prairies, British Columbia; Men and Women; 18 years and older.Six digit postal code was used to validate geography.
Fieldwork/ValidationLive interviews with live supervision to validate work as per the MRIA Code of Conduct
Number of Calls Maximum of five call backs.
Time of CallsIndividuals were called between 12-5:30 pm and 6:30-9:30pm local time for the respondent.
Field Dates June 22nd to 28th, 2017.
Language of Survey The survey was conducted in English.
Element Description
Weighting of Data
The results were weighted by age and gender using the latest Census information (2014) and the sample is geographically stratified to ensure a distribution across all regions of Canada. See tables for full weighting disclosure
Screening
Screening ensured potential respondents did not work in the market research industry, in the advertising industry, in the media or a political party prior to administering the survey to ensure the integrity of the data.
Excluded Demographics
Non-English speakers; Individuals younger than 18 years old; individuals without land or cell lines could not participate.
Stratification
By age and gender using the latest Census information (2014) and the sample is geographically stratified to be representative of Canada. Smaller areas such as Atlantic Canada were marginally oversampled to allow for a minimum regional sample.
Estimated Response Rate
Nine percent, consistent with industry norms.
Question OrderQuestion order in the preceding report reflects the order in which they appeared in the original questionnaire.
Question Content All questions asked are contained in the report.
Question WordingThe questions in the preceding report are written exactly as they were asked to individuals.
Survey Company Nanos Research
Contact
Contact Nanos Research for more information or with any concerns or questions.http://www.nanosresearch.comTelephone:(613) 234-4666 ext. Email: [email protected].

www.nanosresearch.com 16
About NanosNanos is one of North America’s most trusted research and strategy organizations. Our team of professionals is regularly called upon by senior executives to deliver superior intelligence and market advantage whether it be helping to chart a path forward, managing a reputation or brand risk or understanding the trends that drive success. Services range from traditional telephone surveys, through to elite in-depth interviews, online research and focus groups. Nanos clients range from Fortune 500 companies through to leading advocacy groups interested in understanding and shaping the public landscape. Whether it is understanding your brand or reputation, customer needs and satisfaction, engaging employees or testing new ads or products, Nanos provides insight you can trust.
View our brochure
Nanos Research
North America [email protected]

TabulationsConfidential 18

2017-1042 – Bell Media – Super Bowl STAT SHEET
Nanos conducted an RDD dual frame (land- and cell- lines) telephone random survey of 1,000 English speaking Canadians, 18 years of age or older, between June 22nd and 28th, 2017. The margin of error for a random
survey of 1,000 Canadians is ±3.1 percentage points, 19 times out of 20. www.nanosresearch.com
Page 1
Region Gender Age
Canada 2017-06 Atlantic Quebec Ontario Prairies British Columbia Male Female 18 to 29 30 to 39 40 to 49 50 to 59 60 plus
Question 1 - Do you consider yourself someone who watches the Super Bowl live...
Total Unwgt N 1000 77 128 441 203 151 476 524 175 171 209 201 244
Wgt N 1000 77 128 443 201 151 486 514 200 164 189 187 261
All the time % 12.2 12.3 13.0 13.8 10.4 9.3 18.1 6.7 9.9 8.3 10.7 15.9 14.9
Most of the time % 8.1 5.0 6.7 8.1 11.6 6.5 10.4 6.0 3.9 14.5 9.2 10.3 5.1
Periodically % 25.1 13.4 23.1 27.0 31.4 19.1 27.9 22.5 27.0 26.1 23.6 25.5 24.0
Never % 54.5 69.2 57.2 51.1 46.6 65.2 43.6 64.8 59.3 51.0 56.6 48.3 56.0
Region Gender Age
Canada 2017-06 Atlantic Quebec Ontario Prairies British Columbia Male Female 18 to 29 30 to 39 40 to 49 50 to 59 60 plus
Question 2 – [IF WATCHES THE SUPER BOWL LIVE] When you watched the ads on the Super Bowl were you sure, somewhat sure, somewhat unsure or unsure that the products or services advertised were available in Canada?
Total Unwgt N 455 28 53 217 108 49 270 185 71 82 91 106 105
Wgt N 455 24 55 217 107 53 274 181 81 80 82 97 115
Sure % 20.0 23.8 13.6 21.8 15.0 28.0 21.6 17.7 20.7 20.6 22.0 17.6 19.7
Somewhat sure % 20.5 12.5 25.7 19.8 24.9 12.8 18.6 23.5 21.0 17.7 25.9 23.0 16.3
Somewhat unsure % 15.7 14.5 12.6 15.5 15.6 20.8 15.3 16.3 11.9 18.8 12.8 17.8 16.6
Unsure % 43.7 49.2 48.0 43.0 44.5 38.4 44.5 42.5 46.4 42.9 39.3 41.6 47.4

2017-1042 – Bell Media – Super Bowl STAT SHEET
Nanos conducted an RDD dual frame (land- and cell- lines) telephone random survey of 1,000 English speaking Canadians, 18 years of age or older, between June 22nd and 28th, 2017. The margin of error for a random
survey of 1,000 Canadians is ±3.1 percentage points, 19 times out of 20. www.nanosresearch.com
Page 2
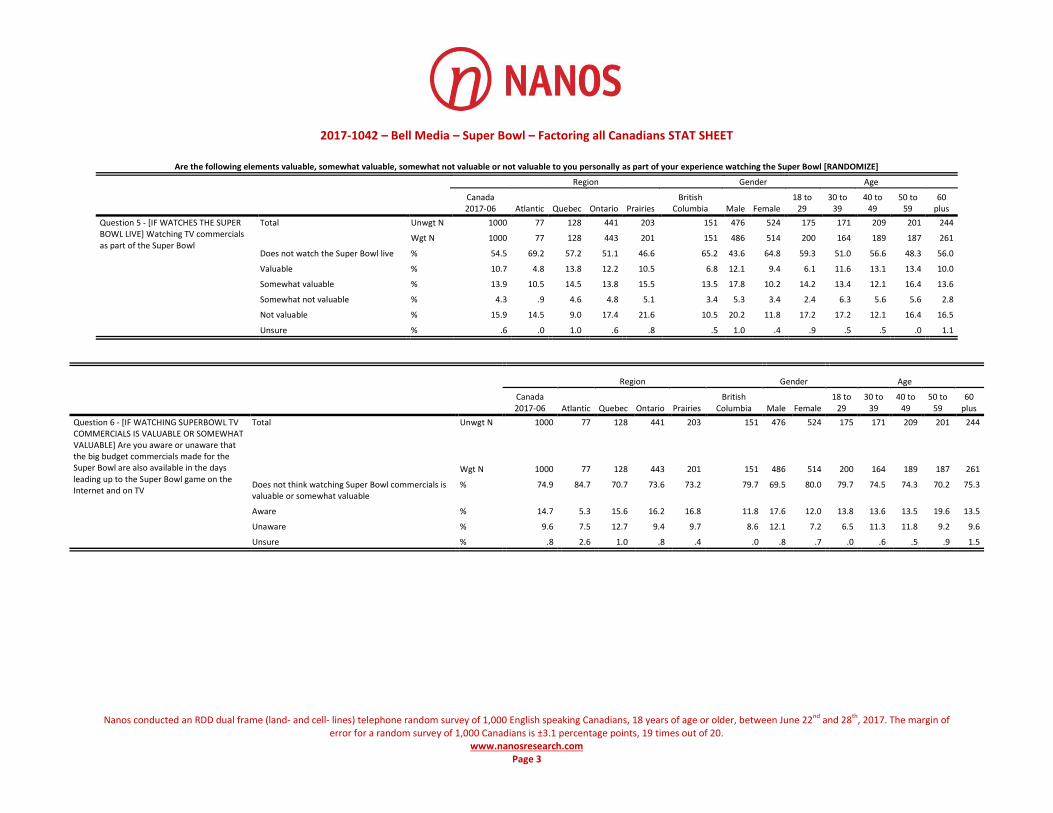
Are the following elements valuable, somewhat valuable, somewhat not valuable or not valuable to you personally as part of your experience watching the Super Bowl [RANDOMIZE]
Region Gender Age
Canada 2017-06 Atlantic Quebec Ontario Prairies British Columbia Male Female 18 to 29 30 to 39 40 to 49 50 to 59 60 plus
Question 3 - [IF WATCHES THE SUPER BOWL LIVE] Watching the Super Bowl game
Total Unwgt N 455 28 53 217 108 49 270 185 71 82 91 106 105
Wgt N 455 24 55 217 107 53 274 181 81 80 82 97 115
Valuable % 42.5 52.4 48.3 43.0 32.3 50.6 50.8 29.8 40.4 41.2 43.6 44.4 42.4
Somewhat valuable % 29.9 17.1 24.1 29.5 35.8 30.9 25.8 36.0 30.1 31.5 26.1 33.5 28.1
Somewhat not valuable % 8.2 11.6 8.8 6.4 13.8 1.9 5.7 12.0 13.3 6.7 13.6 3.5 5.8
Not valuable % 18.6 18.9 16.6 20.3 17.1 16.6 16.7 21.6 16.2 19.3 16.7 16.8 22.6
Unsure % .9 .0 2.2 .8 1.0 .0 1.1 .6 .0 1.3 .0 1.7 1.1
Are the following elements valuable, somewhat valuable, somewhat not valuable or not valuable to you personally as part of your experience watching the Super Bowl [RANDOMIZE]
Region Gender Age
Canada 2017-06 Atlantic Quebec Ontario Prairies British Columbia Male Female 18 to 29 30 to 39 40 to 49 50 to 59 60 plus
Question 4 - [IF WATCHES THE SUPER BOWL LIVE] Watching the Super Bowl half time show
Total Unwgt N 455 28 53 217 108 49 270 185 71 82 91 106 105
Wgt N 455 24 55 217 107 53 274 181 81 80 82 97 115
Valuable % 33.4 22.0 40.5 35.2 29.5 31.8 28.7 40.6 35.7 32.2 30.2 40.0 29.4
Somewhat valuable % 30.0 45.6 23.9 29.3 32.8 26.5 27.1 34.4 29.5 28.1 31.4 28.1 32.3
Somewhat not valuable % 9.0 9.7 7.3 7.9 9.6 13.8 11.5 5.3 10.4 9.5 11.8 7.2 7.1
Not valuable % 25.0 22.7 21.5 24.7 27.4 26.3 29.4 18.4 19.2 27.9 26.7 23.8 27.1
Unsure % 2.5 .0 6.7 2.8 .8 1.6 3.3 1.3 5.1 2.3 .0 .9 4.0

2017-1042 – Bell Media – Super Bowl STAT SHEET
Nanos conducted an RDD dual frame (land- and cell- lines) telephone random survey of 1,000 English speaking Canadians, 18 years of age or older, between June 22nd and 28th, 2017. The margin of error for a random
survey of 1,000 Canadians is ±3.1 percentage points, 19 times out of 20. www.nanosresearch.com
Page 3
Are the following elements valuable, somewhat valuable, somewhat not valuable or not valuable to you personally as part of your experience watching the Super Bowl [RANDOMIZE]
Region Gender Age
Canada 2017-06 Atlantic Quebec Ontario Prairies British Columbia Male Female 18 to 29 30 to 39 40 to 49 50 to 59 60 plus
Question 5 - [IF WATCHES THE SUPER BOWL LIVE] Watching TV commercials as part of the Super Bowl
Total Unwgt N 455 28 53 217 108 49 270 185 71 82 91 106 105
Wgt N 455 24 55 217 107 53 274 181 81 80 82 97 115
Valuable % 23.5 15.7 32.2 25.0 19.6 19.6 21.5 26.6 15.0 23.7 30.2 25.9 22.7
Somewhat valuable % 30.6 34.2 33.8 28.2 29.0 38.8 31.6 29.1 34.9 27.3 28.0 31.6 30.9
Somewhat not valuable % 9.5 2.9 10.7 9.9 9.5 9.9 9.4 9.7 5.8 12.8 12.9 10.8 6.4
Not valuable % 34.9 47.2 21.0 35.6 40.4 30.1 35.8 33.6 42.1 35.2 27.8 31.6 37.6
Unsure % 1.4 .0 2.2 1.3 1.5 1.6 1.7 1.0 2.2 1.1 1.1 .0 2.5
Region Gender Age
Canada 2017-06 Atlantic Quebec Ontario Prairies British Columbia Male Female 18 to 29 30 to 39 40 to 49 50 to 59 60 plus
Question 6 - [IF WATCHING SUPERBOWL TV COMMERCIALS IS VALUABLE OR SOMEWHAT VALUABLE] Are you aware or unaware that the big budget commercials made for the Super Bowl are also available in the days leading up to the Super Bowl game on the Internet and on TV
Total Unwgt N 253 14 35 116 59 29 146 107 39 43 55 58 58
Wgt N 251 12 37 117 54 31 148 103 41 42 49 56 64
Aware % 58.6 34.3 53.3 61.2 62.6 57.9 57.7 60.0 67.9 53.2 52.4 65.9 54.8
Unaware % 38.3 48.6 43.4 35.8 36.0 42.1 39.8 36.3 32.1 44.4 45.7 31.0 39.0
Unsure % 3.0 17.1 3.3 3.1 1.4 .0 2.6 3.7 .0 2.3 1.8 3.1 6.2

2017-1042 – Bell Media – Super Bowl STAT SHEET
Nanos conducted an RDD dual frame (land- and cell- lines) telephone random survey of 1,000 English speaking Canadians, 18 years of age or older, between June 22nd and 28th, 2017. The margin of error for a random
survey of 1,000 Canadians is ±3.1 percentage points, 19 times out of 20. www.nanosresearch.com
Page 4
Region Gender Age
Canada 2017-06 Atlantic Quebec Ontario Prairies
British
Columbia Male Female 18 to 29 30 to 39 40 to 49 50 to 59 60 plus
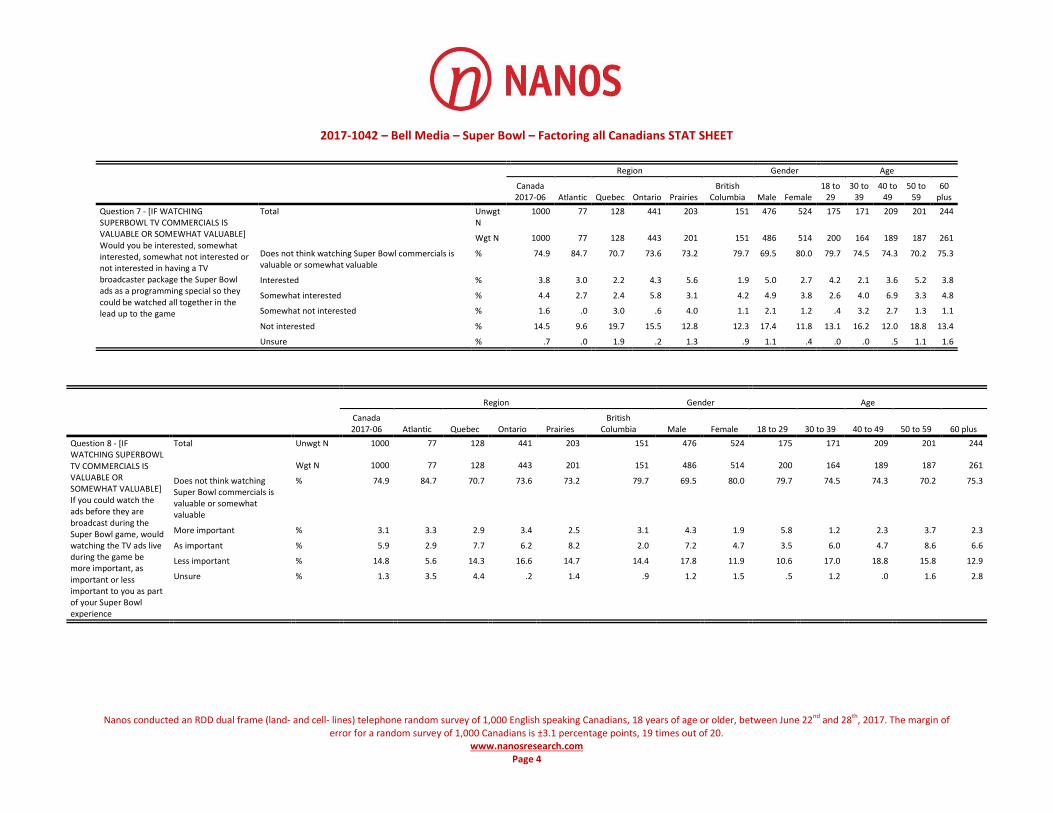
Question 7 - [IF WATCHING SUPERBOWL TV COMMERCIALS IS VALUABLE OR SOMEWHAT VALUABLE] Would you be interested, somewhat interested, somewhat not interested or not interested in having a TV broadcaster package the Super Bowl ads as a programming special so they could be watched all together in the lead up to the game
Total Unwgt N 253 14 35 116 59 29 146 107 39 43 55 58 58
Wgt N 251 12 37 117 54 31 148 103 41 42 49 56 64
Interested % 15.2 19.8 7.7 16.2 20.9 9.2 16.4 13.6 20.6 8.1 14.1 17.5 15.5
Somewhat interested % 17.4 17.7 8.3 22.0 11.7 20.8 16.1 19.3 12.6 15.9 27.0 11.2 19.5
Somewhat not interested % 6.5 .0 10.3 2.4 14.9 5.4 6.9 5.9 2.1 12.4 10.4 4.5 4.3
Not interested % 58.0 62.5 67.2 58.6 47.9 60.3 57.1 59.3 64.6 63.6 46.6 63.2 54.3
Unsure % 2.9 .0 6.6 .8 4.7 4.2 3.6 1.9 .0 .0 2.0 3.7 6.4
Region Gender Age
Canada 2017-06 Atlantic Quebec Ontario Prairies British Columbia Male Female 18 to 29 30 to 39 40 to 49 50 to 59 60 plus
Question 8 - [IF WATCHING SUPERBOWL TV COMMERCIALS IS VALUABLE OR SOMEWHAT VALUABLE] If you could watch the ads before they are broadcast during the Super Bowl game, would watching the TV ads live during the game be more important, as important or less important to you as part of your Super Bowl experience?
Total Unwgt N 253 14 35 116 59 29 146 107 39 43 55 58 58
Wgt N 251 12 37 117 54 31 148 103 41 42 49 56 64
More important % 12.3 21.6 9.8 12.9 9.3 15.0 14.2 9.6 28.3 4.9 8.9 12.5 9.5
As important % 23.5 19.1 26.4 23.3 30.7 10.0 23.5 23.6 17.2 23.5 18.2 29.0 26.9
Less important % 58.8 36.6 48.8 62.9 55.0 70.8 58.4 59.4 52.2 66.8 72.9 53.1 52.1
Unsure % 5.3 22.7 14.9 .9 5.1 4.2 3.9 7.4 2.3 4.8 .0 5.3 11.5

2017-1042 – Bell Media – Super Bowl STAT SHEET
Nanos conducted an RDD dual frame (land- and cell- lines) telephone random survey of 1,000 English speaking Canadians, 18 years of age or older, between June 22nd and 28th, 2017. The margin of error for a random
survey of 1,000 Canadians is ±3.1 percentage points, 19 times out of 20. www.nanosresearch.com
Page 5
Region Gender Age
Canada 2017-06 Atlantic Quebec Ontario Prairies British Columbia Male Female 18 to 29 30 to 39 40 to 49 50 to 59 60 plus
Question 9 - [IF WATCHING SUPERBOWL TV COMMERCIALS IS VALUABLE OR SOMEWHAT VALUABLE] Are you ware or not aware that Canadian ads in the Super Bowl on Canadian broadcasters help support Canadian news and TV programming?
Total Unwgt N 253 14 35 116 59 29 146 107 39 43 55 58 58
Wgt N 251 12 37 117 54 31 148 103 41 42 49 56 64
Aware % 58.8 80.0 51.8 64.9 47.4 56.1 57.4 60.8 52.4 51.1 56.5 67.4 62.2
Unaware % 39.7 20.0 44.9 34.3 49.9 43.9 40.8 38.3 47.6 48.9 43.5 31.3 33.3
Unsure % 1.4 .0 3.3 .8 2.7 .0 1.8 .9 .0 .0 .0 1.3 4.5

2017-1042 – Bell Media – Super Bowl – Factoring all Canadians STAT SHEET
Nanos conducted an RDD dual frame (land- and cell- lines) telephone random survey of 1,000 English speaking Canadians, 18 years of age or older, between June 22nd and 28th, 2017. The margin of
error for a random survey of 1,000 Canadians is ±3.1 percentage points, 19 times out of 20. www.nanosresearch.com
Page 1
Region Gender Age
Canada 2017-06 Atlantic Quebec Ontario Prairies
British Columbia Male Female
18 to 29
30 to 39
40 to 49
50 to 59
60 plus
Question 1 - Do you consider yourself someone who watches the Super Bowl live...
Total Unwgt N
1000 77 128 441 203 151 476 524 175 171 209 201 244
Wgt N 1000 77 128 443 201 151 486 514 200 164 189 187 261
All the time % 12.2 12.3 13.0 13.8 10.4 9.3 18.1 6.7 9.9 8.3 10.7 15.9 14.9
Most of the time
% 8.1 5.0 6.7 8.1 11.6 6.5 10.4 6.0 3.9 14.5 9.2 10.3 5.1
Periodically % 25.1 13.4 23.1 27.0 31.4 19.1 27.9 22.5 27.0 26.1 23.6 25.5 24.0
Never % 54.5 69.2 57.2 51.1 46.6 65.2 43.6 64.8 59.3 51.0 56.6 48.3 56.0
Region Gender Age
Canada 2017-06 Atlantic Quebec Ontario Prairies
British Columbia Male Female
18 to 29
30 to 39
40 to 49
50 to 59
60 plus
Question 2 - [IF WATCHES THE SUPER BOWL LIVE] When you watched the ads on the Super Bowl were you sure, somewhat sure, somewhat unsure or unsure that the products or services advertised were available in Canada?
Total Unwgt N
1000 77 128 441 203 151 476 524 175 171 209 201 244
Wgt N 1000 77 128 443 201 151 486 514 200 164 189 187 261
Does not watch the Super Bowl live % 54.5 69.2 57.2 51.1 46.6 65.2 43.6 64.8 59.3 51.0 56.6 48.3 56.0
Sure % 9.1 7.3 5.8 10.6 8.0 9.8 12.2 6.2 8.4 10.1 9.6 9.1 8.7
Somewhat sure % 9.3 3.9 11.0 9.7 13.3 4.5 10.5 8.3 8.6 8.7 11.2 11.9 7.2
Somewhat unsure % 7.2 4.5 5.4 7.6 8.3 7.2 8.6 5.7 4.9 9.2 5.6 9.2 7.3
Unsure % 19.9 15.1 20.6 21.0 23.8 13.3 25.1 15.0 18.9 21.0 17.1 21.5 20.9

2017-1042 – Bell Media – Super Bowl – Factoring all Canadians STAT SHEET
Nanos conducted an RDD dual frame (land- and cell- lines) telephone random survey of 1,000 English speaking Canadians, 18 years of age or older, between June 22nd and 28th, 2017. The margin of
error for a random survey of 1,000 Canadians is ±3.1 percentage points, 19 times out of 20. www.nanosresearch.com
Page 2
Are the following elements valuable, somewhat valuable, somewhat not valuable or not valuable to you personally as part of your experience watching the Super Bowl [RANDOMIZE]
Region Gender Age
Canada 2017-06 Atlantic Quebec Ontario Prairies
British Columbia Male Female
18 to 29
30 to 39
40 to 49
50 to 59
60 plus
Question 3 - [IF WATCHES THE SUPER BOWL LIVE] Watching the Super Bowl game
Total Unwgt N
1000 77 128 441 203 151 476 524 175 171 209 201 244
Wgt N 1000 77 128 443 201 151 486 514 200 164 189 187 261
Does not watch the Super Bowl live % 54.5 69.2 57.2 51.1 46.6 65.2 43.6 64.8 59.3 51.0 56.6 48.3 56.0
Valuable % 19.3 16.1 20.7 21.0 17.2 17.6 28.7 10.5 16.4 20.2 18.9 23.0 18.7
Somewhat valuable % 13.6 5.2 10.3 14.4 19.1 10.8 14.6 12.7 12.3 15.4 11.3 17.3 12.4
Somewhat not valuable % 3.7 3.6 3.8 3.1 7.4 .7 3.2 4.2 5.4 3.3 5.9 1.8 2.5
Not valuable % 8.5 5.8 7.1 9.9 9.2 5.8 9.4 7.6 6.6 9.5 7.3 8.7 10.0
Unsure % .4 .0 1.0 .4 .5 .0 .6 .2 .0 .7 .0 .9 .5
Are the following elements valuable, somewhat valuable, somewhat not valuable or not valuable to you personally as part of your experience watching the Super Bowl [RANDOMIZE]
Region Gender Age
Canada 2017-06 Atlantic Quebec Ontario Prairies
British Columbia Male Female
18 to 29
30 to 39
40 to 49
50 to 59
60 plus
Question 4 - [IF WATCHES THE SUPER BOWL LIVE] Watching the Super Bowl half time show
Total Unwgt N
1000 77 128 441 203 151 476 524 175 171 209 201 244
Wgt N 1000 77 128 443 201 151 486 514 200 164 189 187 261
Does not watch the Super Bowl live % 54.5 69.2 57.2 51.1 46.6 65.2 43.6 64.8 59.3 51.0 56.6 48.3 56.0
Valuable % 15.2 6.8 17.4 17.2 15.7 11.1 16.2 14.3 14.5 15.8 13.1 20.7 13.0
Somewhat valuable % 13.6 14.0 10.2 14.3 17.5 9.2 15.3 12.1 12.0 13.7 13.6 14.5 14.2
Somewhat not valuable % 4.1 3.0 3.1 3.9 5.1 4.8 6.5 1.9 4.3 4.7 5.1 3.7 3.1
Not valuable % 11.4 7.0 9.2 12.1 14.6 9.2 16.6 6.5 7.8 13.6 11.6 12.3 11.9
Unsure % 1.1 .0 2.9 1.4 .4 .5 1.9 .4 2.1 1.1 .0 .4 1.8
2017-1042 – Bell Media – Super Bowl – Factoring all Canadians STAT SHEET
Nanos conducted an RDD dual frame (land- and cell- lines) telephone random survey of 1,000 English speaking Canadians, 18 years of age or older, between June 22nd and 28th, 2017. The margin of
error for a random survey of 1,000 Canadians is ±3.1 percentage points, 19 times out of 20. www.nanosresearch.com
Page 3
Are the following elements valuable, somewhat valuable, somewhat not valuable or not valuable to you personally as part of your experience watching the Super Bowl [RANDOMIZE]
Region Gender Age
Canada 2017-06 Atlantic Quebec Ontario Prairies
British Columbia Male Female
18 to 29
30 to 39
40 to 49
50 to 59
60 plus
Question 5 - [IF WATCHES THE SUPER BOWL LIVE] Watching TV commercials as part of the Super Bowl
Total Unwgt N 1000 77 128 441 203 151 476 524 175 171 209 201 244
Wgt N 1000 77 128 443 201 151 486 514 200 164 189 187 261
Does not watch the Super Bowl live % 54.5 69.2 57.2 51.1 46.6 65.2 43.6 64.8 59.3 51.0 56.6 48.3 56.0
Valuable % 10.7 4.8 13.8 12.2 10.5 6.8 12.1 9.4 6.1 11.6 13.1 13.4 10.0
Somewhat valuable % 13.9 10.5 14.5 13.8 15.5 13.5 17.8 10.2 14.2 13.4 12.1 16.4 13.6
Somewhat not valuable % 4.3 .9 4.6 4.8 5.1 3.4 5.3 3.4 2.4 6.3 5.6 5.6 2.8
Not valuable % 15.9 14.5 9.0 17.4 21.6 10.5 20.2 11.8 17.2 17.2 12.1 16.4 16.5
Unsure % .6 .0 1.0 .6 .8 .5 1.0 .4 .9 .5 .5 .0 1.1
Region Gender Age
Canada 2017-06 Atlantic Quebec Ontario Prairies
British Columbia Male Female
18 to 29
30 to 39
40 to 49
50 to 59
60 plus
Question 6 - [IF WATCHING SUPERBOWL TV COMMERCIALS IS VALUABLE OR SOMEWHAT VALUABLE] Are you aware or unaware that the big budget commercials made for the Super Bowl are also available in the days leading up to the Super Bowl game on the Internet and on TV
Total Unwgt N 1000 77 128 441 203 151 476 524 175 171 209 201 244
Wgt N 1000 77 128 443 201 151 486 514 200 164 189 187 261
Does not think watching Super Bowl commercials is valuable or somewhat valuable
% 74.9 84.7 70.7 73.6 73.2 79.7 69.5 80.0 79.7 74.5 74.3 70.2 75.3
Aware % 14.7 5.3 15.6 16.2 16.8 11.8 17.6 12.0 13.8 13.6 13.5 19.6 13.5
Unaware % 9.6 7.5 12.7 9.4 9.7 8.6 12.1 7.2 6.5 11.3 11.8 9.2 9.6
Unsure % .8 2.6 1.0 .8 .4 .0 .8 .7 .0 .6 .5 .9 1.5
2017-1042 – Bell Media – Super Bowl – Factoring all Canadians STAT SHEET
Nanos conducted an RDD dual frame (land- and cell- lines) telephone random survey of 1,000 English speaking Canadians, 18 years of age or older, between June 22nd and 28th, 2017. The margin of
error for a random survey of 1,000 Canadians is ±3.1 percentage points, 19 times out of 20. www.nanosresearch.com
Page 4
Region Gender Age
Canada 2017-06 Atlantic Quebec Ontario Prairies
British Columbia Male Female
18 to 29
30 to 39
40 to 49
50 to 59
60 plus
Question 7 - [IF WATCHING SUPERBOWL TV COMMERCIALS IS VALUABLE OR SOMEWHAT VALUABLE] Would you be interested, somewhat interested, somewhat not interested or not interested in having a TV broadcaster package the Super Bowl ads as a programming special so they could be watched all together in the lead up to the game
Total Unwgt N
1000 77 128 441 203 151 476 524 175 171 209 201 244
Wgt N 1000 77 128 443 201 151 486 514 200 164 189 187 261
Does not think watching Super Bowl commercials is valuable or somewhat valuable
% 74.9 84.7 70.7 73.6 73.2 79.7 69.5 80.0 79.7 74.5 74.3 70.2 75.3
Interested % 3.8 3.0 2.2 4.3 5.6 1.9 5.0 2.7 4.2 2.1 3.6 5.2 3.8
Somewhat interested % 4.4 2.7 2.4 5.8 3.1 4.2 4.9 3.8 2.6 4.0 6.9 3.3 4.8
Somewhat not interested % 1.6 .0 3.0 .6 4.0 1.1 2.1 1.2 .4 3.2 2.7 1.3 1.1
Not interested % 14.5 9.6 19.7 15.5 12.8 12.3 17.4 11.8 13.1 16.2 12.0 18.8 13.4
Unsure % .7 .0 1.9 .2 1.3 .9 1.1 .4 .0 .0 .5 1.1 1.6
Region Gender Age
Canada 2017-06 Atlantic Quebec Ontario Prairies
British Columbia Male Female 18 to 29 30 to 39 40 to 49 50 to 59 60 plus
Question 8 - [IF WATCHING SUPERBOWL TV COMMERCIALS IS VALUABLE OR SOMEWHAT VALUABLE] If you could watch the ads before they are broadcast during the Super Bowl game, would watching the TV ads live during the game be more important, as important or less important to you as part of your Super Bowl experience
Total Unwgt N 1000 77 128 441 203 151 476 524 175 171 209 201 244
Wgt N 1000 77 128 443 201 151 486 514 200 164 189 187 261
Does not think watching Super Bowl commercials is valuable or somewhat valuable
% 74.9 84.7 70.7 73.6 73.2 79.7 69.5 80.0 79.7 74.5 74.3 70.2 75.3
More important % 3.1 3.3 2.9 3.4 2.5 3.1 4.3 1.9 5.8 1.2 2.3 3.7 2.3
As important % 5.9 2.9 7.7 6.2 8.2 2.0 7.2 4.7 3.5 6.0 4.7 8.6 6.6
Less important % 14.8 5.6 14.3 16.6 14.7 14.4 17.8 11.9 10.6 17.0 18.8 15.8 12.9
Unsure % 1.3 3.5 4.4 .2 1.4 .9 1.2 1.5 .5 1.2 .0 1.6 2.8

2017-1042 – Bell Media – Super Bowl – Factoring all Canadians STAT SHEET
Nanos conducted an RDD dual frame (land- and cell- lines) telephone random survey of 1,000 English speaking Canadians, 18 years of age or older, between June 22nd and 28th, 2017. The margin of
error for a random survey of 1,000 Canadians is ±3.1 percentage points, 19 times out of 20. www.nanosresearch.com
Page 5
Region Gender Age
Canada 2017-06 Atlantic Quebec Ontario Prairies
British Columbia Male Female 18 to 29 30 to 39 40 to 49 50 to 59 60 plus
Question 9 - [IF WATCHING SUPERBOWL TV COMMERCIALS IS VALUABLE OR SOMEWHAT VALUABLE] Are you ware or not aware that Canadian ads in the Super Bowl on Canadian broadcasters help support Canadian news and TV programming
Total Unwgt N
1000 77 128 441 203 151 476 524 175 171 209 201 244
Wgt N 1000 77 128 443 201 151 486 514 200 164 189 187 261
Does not think watching Super Bowl commercials is valuable or somewhat valuable
% 74.9 84.7 70.7 73.6 73.2 79.7 69.5 80.0 79.7 74.5 74.3 70.2 75.3
Aware % 14.8 12.3 15.2 17.1 12.7 11.4 17.5 12.1 10.6 13.0 14.5 20.1 15.4
Unaware % 10.0 3.1 13.1 9.1 13.4 8.9 12.4 7.6 9.7 12.5 11.2 9.3 8.2
Unsure % .4 .0 1.0 .2 .7 .0 .6 .2 .0 .0 .0 .4 1.1


![RDF Constraint Checking - uni-freiburg.deschaetzl/talks/RDD_LWDM...27.03.2015 RDF Constraint Checking with RDD 3 RDD RDF Data Descriptions (RDD) [1] • Human readable, easy to grasp,](https://static.fdocuments.net/doc/165x107/5f0a90177e708231d42c3eef/rdf-constraint-checking-uni-schaetzltalksrddlwdm-27032015-rdf-constraint.jpg)