Implementing the Industry-Based Survey for Gulf of Maine ... · Implementing the Industry-Based...
44
Implementing the Industry-Based Survey for Gulf of Maine Cod Pilot Study Final Report for Contract #: EA133F-03-CN-0010 Prepared by W. S. Hoffman, D. J. Salerno, S. J. Correia, and D. E. Pierce PhD. Submitted from: Massachusetts Division of Marine Fisheries Director - Paul J. Diodati Deputy Director – Daniel J. McKiernan Deputy Director – David E. Pierce PhD. Submitted to: National Oceanographic Atmospheric Administration Northeast Cooperative Research Partners Program
Transcript of Implementing the Industry-Based Survey for Gulf of Maine ... · Implementing the Industry-Based...

Implementing the
Industry-Based Survey for
Gulf of Maine Cod Pilot Study
Final Report for Contract #: EA133F-03-CN-0010
Prepared by W. S. Hoffman, D. J. Salerno, S. J. Correia, and D. E. Pierce PhD.
Submitted from: Massachusetts Division of Marine Fisheries
Director - Paul J. Diodati Deputy Director – Daniel J. McKiernan Deputy Director – David E. Pierce PhD.
Submitted to: National Oceanographic Atmospheric Administration
Northeast Cooperative Research Partners Program

IMPLEMENTING THE INDUSTRY-BASED SURVEY FOR GULF OF MAINE COD PILOT STUDY
TABLE OF CONTENTS
ABSTRACT EXECUTIVE SUMMARY 1 PURPOSE............................................................................................................................... 1
1.1 PROBLEM THAT WAS ADDRESSED........................................................................ 1 1.1.1 Project Objectives ................................................................................................... 2
2 APPROACH ........................................................................................................................... 3 2.1 SURVEY DESIGN......................................................................................................... 3
2.1.1 Systematic Grid....................................................................................................... 3 2.1.2 Stratified Random Grid........................................................................................... 3 2.1.3 Strata Design........................................................................................................... 4 2.1.4 Temporal Design/Survey Timing ........................................................................... 4
2.2 SURVEY PLATFORMS AND GEAR .......................................................................... 6 2.2.1 Survey Platforms..................................................................................................... 6 2.2.2 Gear to be Deployed ............................................................................................... 6 2.2.3 Net Builder.............................................................................................................. 7 2.2.4 Net Calibration........................................................................................................ 7
2.3 SAMPLING DESIGN .................................................................................................. 10 2.3.1 Data Collection ..................................................................................................... 10 2.3.2 Gear Condition...................................................................................................... 12 2.3.3 Towing Protocol.................................................................................................... 12
2.4 ADDITIONAL SURVEY COMPONENTS................................................................. 14 2.4.1 Data Management ................................................................................................. 14 2.4.2 Sale of Catch / Project income.............................................................................. 14 2.4.3 Outreach................................................................................................................ 15 2.4.4 Training................................................................................................................. 18 2.4.5 Safety Training...................................................................................................... 19
3 PROJECT MANAGEMENT................................................................................................ 20 3.1 Project Management ..................................................................................................... 20
4 FINDINGS............................................................................................................................ 23 4.1 RESULTS ..................................................................................................................... 23
4.1.1 Cod Spatiotemporal Distribution and Rolling Closure......................................... 23 4.1.2 Length Frequency Tables...................................................................................... 24 4.1.3 Spatial-Temporal Distribution of Species............................................................. 24 4.1.4 Cruise Completion Rates ...................................................................................... 25
4.2 SURVEY PROBLEMS ................................................................................................ 25 4.2.1 Fixed gear.............................................................................................................. 25 4.2.2 Survey Timing ...................................................................................................... 27 4.2.3 Federal Contract Scheduling................................................................................. 27 4.2.4 Final Report Writing ............................................................................................. 27 4.2.5 Maine Permitting .................................................................................................. 27
4.3 ADDITIONAL WORK NEEDED ............................................................................... 28
i
4.3.1 Food Habits for GOM Cod ................................................................................... 28 4.3.2 Individual Weights for GOM cod ......................................................................... 28 4.3.3 Increase Resolution in Areas of Abundance......................................................... 28 4.3.4 Habitat Information............................................................................................... 28 4.3.5 Fisheries Scientific Computing System (FSCS) ................................................... 29 4.3.6 Survey Trawl Reference Manual .......................................................................... 29
5 EVALUATION..................................................................................................................... 31 5.1 OBJECTIVES THAT WERE ATTAINED.................................................................. 31 5.2 ADDITIONAL OBJECTIVES THAT WERE ATTAINED........................................ 31 5.3 SURVEY MODIFICATIONS...................................................................................... 33
5.3.1 Maturity Sampling ................................................................................................ 33 5.3.2 Vessel Calibration, Depletion Tows ..................................................................... 33
5.4 PROPOSED SURVEY IMPROVEMENTS ................................................................ 34 5.4.1 Temporal Strata/Rolling Closure .......................................................................... 34 5.4.2 Strata Enhancement .............................................................................................. 36 5.4.3 Cruise Logistics .................................................................................................... 36
5.5 DISSEMINATION OF PROJECT RESULTS............................................................. 36 5.5.1 GIS-Based Website............................................................................................... 37
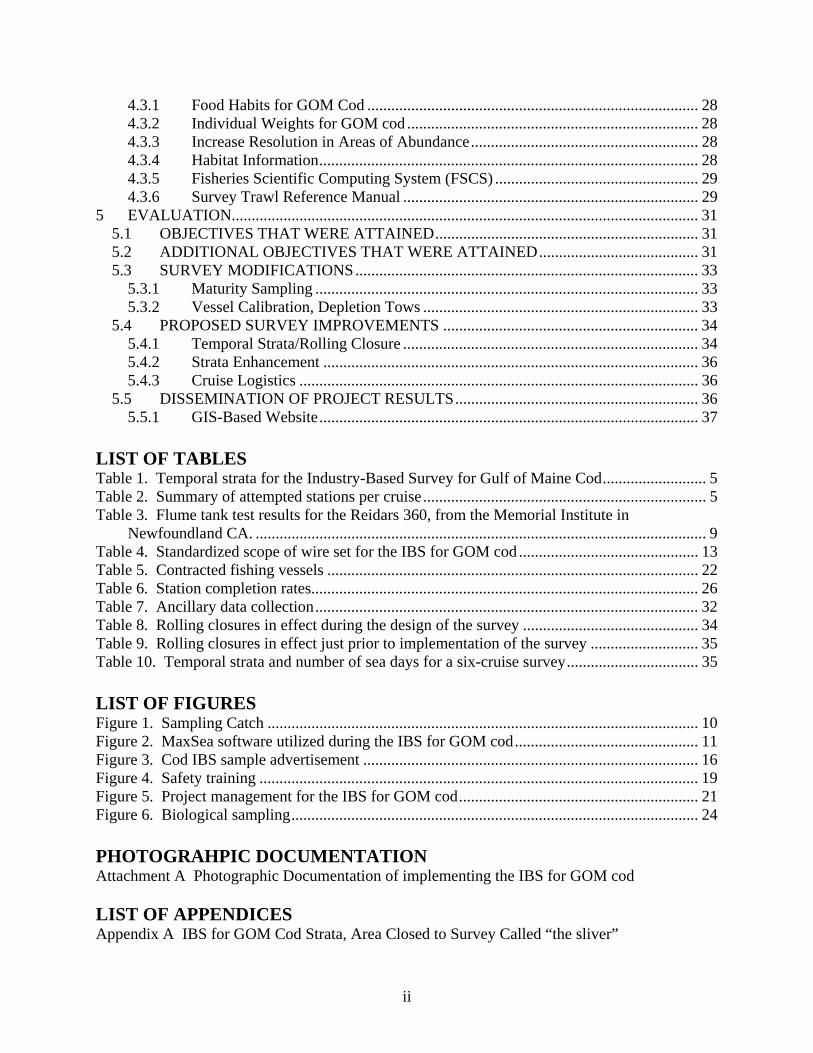
LIST OF TABLES Table 1. Temporal strata for the Industry-Based Survey for Gulf of Maine Cod.......................... 5 Table 2. Summary of attempted stations per cruise....................................................................... 5 Table 3. Flume tank test results for the Reidars 360, from the Memorial Institute in
Newfoundland CA. ................................................................................................................. 9 Table 4. Standardized scope of wire set for the IBS for GOM cod ............................................. 13 Table 5. Contracted fishing vessels ............................................................................................. 22 Table 6. Station completion rates................................................................................................. 26 Table 7. Ancillary data collection................................................................................................ 32 Table 8. Rolling closures in effect during the design of the survey ............................................ 34 Table 9. Rolling closures in effect just prior to implementation of the survey ........................... 35 Table 10. Temporal strata and number of sea days for a six-cruise survey................................. 35 LIST OF FIGURES Figure 1. Sampling Catch ............................................................................................................ 10 Figure 2. MaxSea software utilized during the IBS for GOM cod.............................................. 11 Figure 3. Cod IBS sample advertisement .................................................................................... 16 Figure 4. Safety training .............................................................................................................. 19 Figure 5. Project management for the IBS for GOM cod............................................................ 21 Figure 6. Biological sampling...................................................................................................... 24 PHOTOGRAHPIC DOCUMENTATION Attachment A Photographic Documentation of implementing the IBS for GOM cod LIST OF APPENDICES Appendix A IBS for GOM Cod Strata, Area Closed to Survey Called “the sliver”
ii

Appendix B Memorandum Describing IBS for GOM Cod Net Design, Trawl Net Plan, and Schematics Appendix C DVD of Underwater Footage of Trawl Net and Flume Tank Test Footage Appendix D Chief Scientist Guide and Data Collection Field Descriptions Appendix E Outreach Materials and Minutes from Subcommittee Meeting Appendix F Evaluation of Rolling Closures Appendix G Length Frequency Figures for Cod and Other Species Appendix H Ancillary Data: Species of Interest Distribution maps
iii

ABSTRACT
The Industry-Based Survey for Gulf of Maine Cod Pilot Study, funded through the National Marine Fisheries Service and administered by the Massachusetts Division of Marine Fisheries, began in November 2003. This cooperative research effort was designed to study cod stock distribution and demographics in Gulf of Maine waters from Cape Cod to the Bay of Fundy. Working together, scientists and fishermen combined their knowledge of cod stocks to devise a cod survey optimized for studying spatial and temporal distribution of cod in the inshore Gulf of Maine. This unique survey design utilized a standardized grid as well as sampling locations recommended by fishermen to assure sampling areas with traditionally high catch rates. Four commercial fishing otter trawlers from the States of Maine, New Hampshire and Massachusetts were contracted to serve as the survey vessels. During the 2003/2004 and 2004/2005 contract period two complete surveys and one additional cruise was completed. Data were audited into master data format and are now available on the WHOI/SUN database for authorized users. In addition, specific summary data are available to commercial fishermen, managers, scientists, and the general public on a GIS-based website which is housed on a Northeast Fisheries Science Center server.
Abstract

EXECUTIVE SUMMARY In 2000, U.S. congress allocated to the National Marine Fisheries Service (NMFS) $15 million dollars in New England groundfish disaster relief funds to be used for cooperative research efforts. NMFS and the New England Fishery Management Council Research Steering Committee decided that the primary focus of the funds should include establishing an industry-based survey (IBS) fleet and began the process to develop several pilot studies. On September 26, 2003, the Massachusetts Division of Marine Fisheries (MarineFisheries) was awarded a contract from the National Marine Fisheries Service (NMFS) to implement a pilot study for the Industry-Based Survey for the Gulf of Maine (GOM) cod (referenced hereafter as the cod IBS). The pilot study was the intended starting point for the development of a long-term IBS and a collaborative effort incorporating both the traditional knowledge of fishermen and net builders and the statistical design expertise of state and federal scientists. The primary objective of the cod IBS was to define a broad-scale distribution of cod aggregations in the Gulf of Maine, in space and time, by age and size composition. The secondary objectives were to provide information on the age/length structure during current rolling closure areas (November, April-May) when fishery-dependent data are unavailable and to provide information on the seasonal distribution and length composition of other groundfish within the GOM where data was sufficient. Given the hierarchy of objectives, the cod IBS utilized two types of grid systems as its design, the systematic grid and stratified random grid. The strata and stations for the survey were established in cooperation with federal and state government, participants from the commercial fishing industry, and a committee that was tasked with overseeing the implementation of the cod IBS. Each calendar year included five cod IBS cruises (Jan-Feb, Feb-Mar, Mar-April, April-May, and Nov-Dec) during which approximately 225 stations were attempted to be sampled, totaling 1,125 stations each year. A cruise consisted of a defined time period where all of the systematic grid tows and the randomly selected industry tows (industry tows were identified by commercial fishermen) were sampled. Approximately 64% and 36% of the stations samples were grid tows and industry tows, respectively, each cruise. Four commercial fishing otter trawlers from Maine, New Hampshire, and Massachusetts, and a net builder from Massachusetts were contracted through a competitive bidding process to implement the survey. Two full-time personnel were hired to administer survey operations and several contracts were created with fisheries observers to supply sea sampling. The trawl used in the survey was a product of many meetings and personal interviews held with participants from the commercial fishing industries from Rhode Island to Maine. The trawl was a two seam high-rise design that was specifically designed to catch a full range of cod year classes, while targeting the larger spawning size fish. The design also allowed fishing over all substrate types that were anticipated to be encountered during the survey (i.e. soft mud to hard rocky ledge). The cod IBS utilized a commercial-style survey tow rather than the more traditional straight-line survey tow. A commercial style tow is usually influenced by depth, bottom and substrate type, presence of fish, presence of fixed gear, and presence of other fishing vessels, and as a result, it did not always result in a straight-line tow. A successful tow was standardized to 30 minutes in
Executive Summary
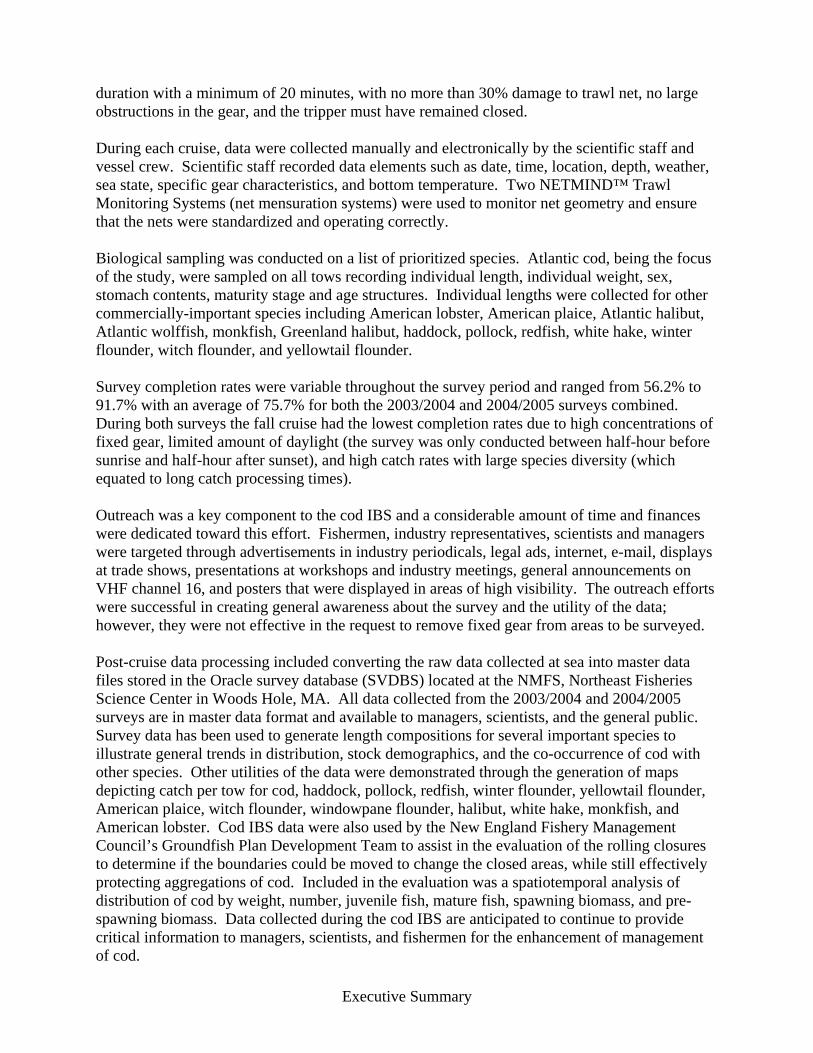
duration with a minimum of 20 minutes, with no more than 30% damage to trawl net, no large obstructions in the gear, and the tripper must have remained closed. During each cruise, data were collected manually and electronically by the scientific staff and vessel crew. Scientific staff recorded data elements such as date, time, location, depth, weather, sea state, specific gear characteristics, and bottom temperature. Two NETMIND™ Trawl Monitoring Systems (net mensuration systems) were used to monitor net geometry and ensure that the nets were standardized and operating correctly. Biological sampling was conducted on a list of prioritized species. Atlantic cod, being the focus of the study, were sampled on all tows recording individual length, individual weight, sex, stomach contents, maturity stage and age structures. Individual lengths were collected for other commercially-important species including American lobster, American plaice, Atlantic halibut, Atlantic wolffish, monkfish, Greenland halibut, haddock, pollock, redfish, white hake, winter flounder, witch flounder, and yellowtail flounder. Survey completion rates were variable throughout the survey period and ranged from 56.2% to 91.7% with an average of 75.7% for both the 2003/2004 and 2004/2005 surveys combined. During both surveys the fall cruise had the lowest completion rates due to high concentrations of fixed gear, limited amount of daylight (the survey was only conducted between half-hour before sunrise and half-hour after sunset), and high catch rates with large species diversity (which equated to long catch processing times). Outreach was a key component to the cod IBS and a considerable amount of time and finances were dedicated toward this effort. Fishermen, industry representatives, scientists and managers were targeted through advertisements in industry periodicals, legal ads, internet, e-mail, displays at trade shows, presentations at workshops and industry meetings, general announcements on VHF channel 16, and posters that were displayed in areas of high visibility. The outreach efforts were successful in creating general awareness about the survey and the utility of the data; however, they were not effective in the request to remove fixed gear from areas to be surveyed. Post-cruise data processing included converting the raw data collected at sea into master data files stored in the Oracle survey database (SVDBS) located at the NMFS, Northeast Fisheries Science Center in Woods Hole, MA. All data collected from the 2003/2004 and 2004/2005 surveys are in master data format and available to managers, scientists, and the general public. Survey data has been used to generate length compositions for several important species to illustrate general trends in distribution, stock demographics, and the co-occurrence of cod with other species. Other utilities of the data were demonstrated through the generation of maps depicting catch per tow for cod, haddock, pollock, redfish, winter flounder, yellowtail flounder, American plaice, witch flounder, windowpane flounder, halibut, white hake, monkfish, and American lobster. Cod IBS data were also used by the New England Fishery Management Council’s Groundfish Plan Development Team to assist in the evaluation of the rolling closures to determine if the boundaries could be moved to change the closed areas, while still effectively protecting aggregations of cod. Included in the evaluation was a spatiotemporal analysis of distribution of cod by weight, number, juvenile fish, mature fish, spawning biomass, and pre-spawning biomass. Data collected during the cod IBS are anticipated to continue to provide critical information to managers, scientists, and fishermen for the enhancement of management of cod.
Executive Summary

1 PURPOSE On September 26, 2003, the Massachusetts Division of Marine Fisheries (MarineFisheries) was awarded a contract from the National Marine Fisheries Service (NMFS) to implement a pilot study for the Industry-Based Survey (IBS) for the Gulf of Maine (GOM) cod (referenced hereafter as the cod IBS). This cod IBS was designed by the Industry-Based Survey Fleet Committee (IBS committee) and was the starting point for the development of a long-term Industry-Based Survey. This collaborative effort incorporated both the traditional knowledge of fishermen and net builders and the statistical design expertise of state and federal scientists. This report summarizes the sampling work performed, survey and sampling design, findings, and evaluates the cod IBS pilot study. Photographs were taken to document the implementation process of the survey. Several of these photographs are provided in the attachment Photographic Documentation at the end of this report.
1.1 PROBLEMS TO BE ADDRESSED In April 2001 the IBS Committee, convened by the NMFS, recommended implementing an industry-based survey pilot fleet in New England. Those recommendations pertained to IBS pilot projects and aimed to:
(1) provide timely information for evaluation of resource status and the development of sustainable fishing practices, (2) develop information on demographics and distribution of GOM cod and southern New England yellowtail flounder, (3) provide cost effective research platforms, while expanding the pool of vessels involved in and increasing the capacity for special purpose research, within the GOM and southern New England, (4) promote cooperation and reduce conflict between fishermen and managers by providing opportunities for jointly collected and shared data, and (5) coordinate with other cooperative research efforts (e.g., cod tagging projects).
The primary motivation for these surveys was $15 million provided by Congress to the NMFS for New England groundfish disaster relief and the decision by NMFS and the New England Fishery Management Council Research Steering Committee that a primary focus of the funds should include establishing an industry-based survey fleet. The IBS committee, which included federal and state fisheries scientists, managers, and fishermen from Massachusetts, New Hampshire, Maine, and Rhode Island, defined the objective to characterize the broad-scale spatial and temporal distribution by age and size composition of cod aggregations in the GOM. The project’s purpose was to:
(1) Complement NMFS, states and other surveys to characterize cod distribution; (2) Contribute to filling the gaps in time and space that are inherent in NMFS and state
surveys and improve robustness of stock assessments for cod; (3) Collect stock demographic (age structure and spawning condition) of cod; (4) Investigate the association of cod with other species in space and time; (5) Provide opportunities for complementary projects to take advantage of ancillary cruise
information; and
1

(6) Move toward the development of an optimal survey design for cod. The cod IBS was a response to the great concern about the status of GOM cod and the socioeconomic impacts of federal rules adopted to reduce fishing mortality and rebuild spawning stock biomass. Emphasizing that concern, the NMFS on June 11, 1999 published in the Federal Register a request for comments on “Disaster assistance for Northeast Multispecies fishery failure.” NMFS proposed a plan “for disbursing funds to assist persons who have incurred losses from a commercial fishery failure due to declining stocks of groundfish which has caused harm to the Northeast Multispecies fishery.” NMFS’s two goals were to provide a mechanism to get financial assistance as quickly as possible to fishermen most affected by the groundfish collapse, and to involve the industry in fisheries and gear research, thereby providing additional data for the long-term management of the fishery (emphasis added). The Commonwealth of Massachusetts, being the state most affected by cod and other groundfish regulations, was especially supportive of industry-based surveys that potentially would engender greater confidence in GOM cod assessments necessary for management of the cod fishery and achieving stock rebuilding goals. Consequently, the Commonwealth, other states, and NMFS agreed that the cod IBS should be initiated as a pilot as a way to improve management of the cod fishery by involving fishermen in net and survey designs (including station selection), data gathering, and interpretation of results. Shared “ownership” of a survey through the IBS concept was and still is considered to be an excellent approach for providing additional fisheries science to improve assessments and create/maintain sustainable fisheries.
1.1.1 Project Objectives The primary objective of the cod IBS was defined in April 2001 by the IBS committee and was included in a report that was created by Gulf of Maine Aquarium (now the Gulf of Maine Research Institute) and entitled: “Implementing an Industry-Based Survey Fleet Pilot Program; April 2002” (April 2002 Report). The primary objective of the cod IBS is: “To define a broad scale distribution of cod aggregations in the Gulf of Maine, in space and time, by age and size composition.” The April 2002 Report also detailed the program’s purpose, and incorporating the items of the list, two secondary objectives were created. The first was to provide information on the age/length structure during current rolling closure areas (November, April-May) when fishery-dependent data are unavailable. The second was to provide information on the seasonal distribution and length composition of other groundfish within the GOM where data was sufficient. Summarizing the objectives and information in the April 2002 Report, the cod IBS was designed to study cod distribution, monitor inshore cod stocks, assess the importance of areas as nursery and spawning grounds, and to enhance data used for management decisions. The information on cod distribution and demographics from this survey is of higher resolution than is currently available from existing surveys and is intended to assist the development of future area management initiatives.
2

2 APPROACH Prior to deployment, and during the survey, several key cod IBS components were developed. Working with the IBS implementation committee, federal and state scientists, and members of the commercial fishing industry, MarineFisheries developed the survey design, strata design, temporal design, strata location, survey timing, cruise schedule, sampling design, survey platforms, survey gear, outreach, training, and data management procedures.
2.1 SURVEY DESIGN The strata and stations for the survey were established in cooperation with Northeast Fisheries Science Center (NEFSC), Maine Department of Marine Resources (MEDMR), New Hampshire Fish and Game (NHFG), participants from the commercial fishing industry, and a committee that was tasked with overseeing the implementation of the cod IBS - the IBS Implementation Committee. Given the hierarchy of objectives, the cod IBS utilized two types of grid systems as its design, the systematic grid and stratified random grid.
2.1.1 Systematic Grid The IBS implementation committee selected the systematic sampling because this design allowed for uniform coverage of a broad area, and it is a relatively simple design that has been extensively employed in biological surveys. The systematic grid used in the cod IBS is a 9-minute grid that extends from the Maine/Canadian border south to 41°30’ north latitude and from a depth of 10 fathoms (Fm) out to 75 Fm (Appendix A). This includes the offshore areas of Platts Bank, Fippennies Ledge, Cashes Bank, Jefferys Ledge, and Outer Fall, but excludes Georges Bank. The grid does not extend inside Maine outer islands due to excessive fixed gear and extreme rock bottom. As recommended by NMFS personnel, the area within the western GOM specifically called ‘the sliver’ was incorporated into the strata design and was avoided during the survey due to the Benthic Habitat Monitoring Study in this area (Appendix A). The grid consists of 145 squares and sampling stations are located at the center of each square. All grid stations were attempted to be sampled on every cruise.
2.1.2 Stratified Random Grid The IBS Implementation Committee adopted a stratified random grid for sampling areas of potential seasonally high aggregations of cod that fall within IBS strata. Over 30 commercial fishermen throughout the survey area identified 265 3-minute squares (industry tows) as potential important areas of high abundance. All of the identified squares were incorporated into the design. However, due to the large number of industry tows and time constraints of the temporal design as described below in section 2.1.4, not all identified squares could be sampled every cruise. As a result, a randomized selection of stations was performed by dividing the 3-minute grid into 16 strata that were based on geographic location (Appendix A). Each stratum was weighted by the number of tows that it contained, and then using a random number selection feature in Microsoft Access software, the appropriate numbers of industry tows were selected from each stratum.
3

2.1.3 Strata Design Some of the squares in both the systematic grid and the stratified random grid did not meet depths and/or bottom survey criteria as specified in section 2.1.1. To determine if a station would be included in the systematic grid, it had to meet the predetermined criteria that the longest axis of towable area, within the square, must equal a minimum distance of 1.0 nautical mile (nm) and 30% of the square must encompass towable bottom (e.g. depths between 10-75Fm, absence of extreme rock bottom, no land/island, etc.). To qualify for inclusion in the stratified random grid, the minimum towable bottom was increased to 50% of the square, and the longest axis of towable area within the square had to equal a minimum distance of 1.0 nm. ARC/GIS software was used to help determine the acceptance or rejection of the individual squares in the grid. By studying bathymetric and backscatter layers, area of assumed towable bottom and/or estimated towable distance was calculated. Even though these conclusions were based on the best available data, ground-truthing was required. The strata were reviewed by the contracted commercial fishermen, and once the survey commenced, each square was thoroughly assessed at sea by the vessels to determine the possibility of completing a valid tow inside the square. Squares that were visited three times and were deemed untowable due to bottom depth, hardness, and/or roughness were removed from the grid. This process increased survey time during the first year of the cod IBS, but was imperative in creating the survey strata.
2.1.4 Temporal Design/Survey Timing Each calendar year included five cod IBS cruises. A cruise consisted of a defined time period (Jan-Feb, Feb-Mar, Mar-April, April-May, and Nov-Dec) where all of the systematic grid tows and the randomly selected industry tows were sampled. The first four cruises were completed between January and May, while the fifth cruise was completed during November and December. Although the strata and sampling design remained unchanged, each cruise was associated with a different goal. Goals for each of the cruises were developed by the IBS Implementation Committee during the initial stages of the study (Table 1). Note that cruise five is the last cruise of the calendar year, but the first cruise of the survey season. Depending on the cruise, each vessel was assigned a certain number of sea days to complete their assigned tows. Sampling was standardized to be conducted from ½ hour before sunrise to ½ hour after sunset. To compensate for the difference in daylight hours throughout the survey season, the number of dedicated sea days per cruise varied from cruise to cruise. This design allowed the boats to better utilize their time and more efficiently sample the selected stations. Depending on weather, sea conditions, and length of daylight hours, an average of five tows per day were completed during each cruise. Approximately 225 stations were attempted to be sampled per cruise, totaling 1,125 stations each year. Total stations per cruise were allocated as 36% industry tows and 64% grid tows (Table 2).
4
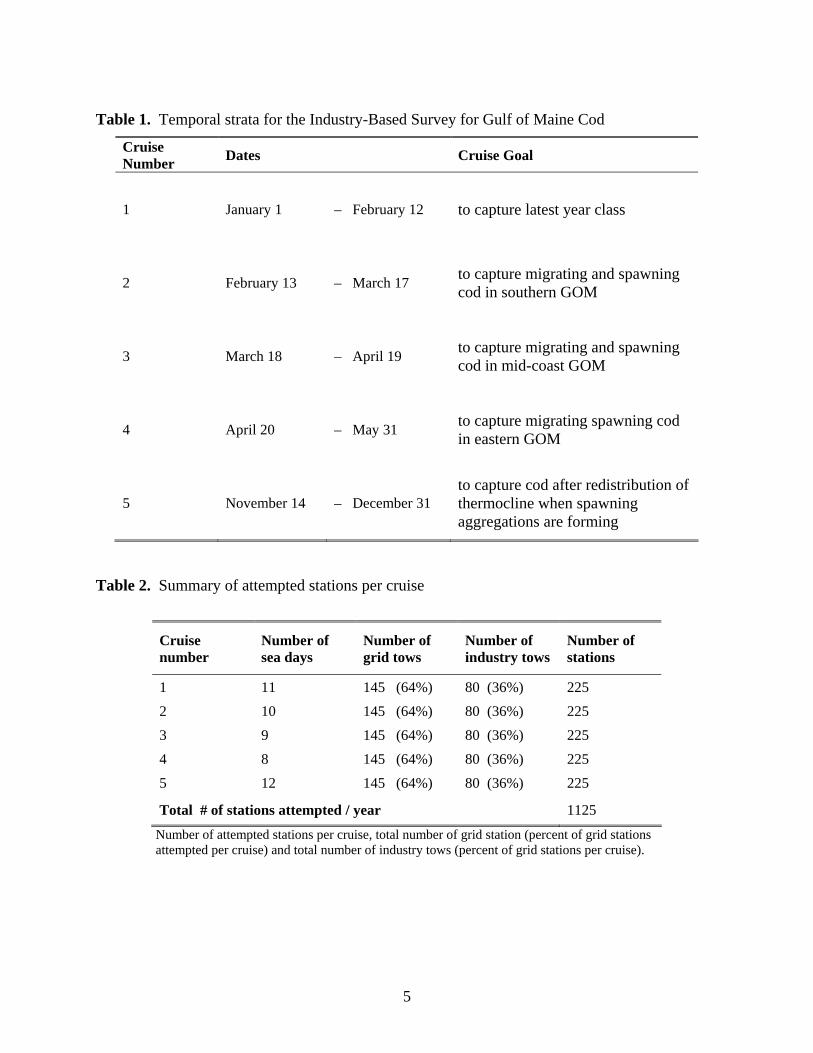
Table 1. Temporal strata for the Industry-Based Survey for Gulf of Maine Cod
Cruise Number Dates Cruise Goal
1 January 1 – February 12 to capture latest year class
2 February 13 – March 17 to capture migrating and spawning cod in southern GOM
3 March 18 – April 19 to capture migrating and spawning cod in mid-coast GOM
4 April 20 – May 31 to capture migrating spawning cod in eastern GOM
5 November 14 – December 31 to capture cod after redistribution of thermocline when spawning aggregations are forming
Table 2. Summary of attempted stations per cruise
Cruise number
Number of sea days
Number of grid tows
Number of industry tows
Number of stations
1 11 145 (64%) 80 (36%) 225 2 10 145 (64%) 80 (36%) 225 3 9 145 (64%) 80 (36%) 225 4 8 145 (64%) 80 (36%) 225 5 12 145 (64%) 80 (36%) 225
Total # of stations attempted / year 1125
Number of attempted stations per cruise, total number of grid station (percent of grid stations attempted per cruise) and total number of industry tows (percent of grid stations per cruise).
5

2.2 SURVEY PLATFORMS AND GEAR
2.2.1 Survey Platforms Four commercial fishing otter trawlers of similar size and horsepower were contracted to serve as the survey platforms. The vessels were contracted through the advertisement of a Request for Response (RFR) and a competitive bidding process. The process involved closely reviewing each proposal, interviewing captains and owners, contacting available references, and conducting dockside inspections of several vessels. The vessels were selected based on the following criteria:
1. Price. Bids were competitive and a relatively good value based on the vessel size. 2. Geographic location. The vessels selected were strategically distributed throughout the
GOM coast, allowing access throughout the strata. 3. Vessel size. Vessels provided a stable, safe, and comfortable work platform that allowed
sampling to be conducted in a wider range of adverse conditions ultimately increasing the probability of accomplishing the survey goals in the specified time frames.
4. Very similar in overall size and as a result fished similar size ground wire which
simplified standardizing the gear. 5. Deck layout and space for working up the catch and storing additional gear was adequate. 6. Comfortable accommodations including spacious wheelhouse, galley, bunk room, and
shower/head. Duties for the crew and scientific staff are very strenuous during the time of year the survey is conducted. Comfortable accommodations are a valuable asset for extended trips.
7. Versatility. Vessels were willing to travel if additional sampling was needed. 8. Experience. The captains and owners had experience in cooperative research and were
extremely interested and motivated to participate in this pilot study.
2.2.2 Gear to be Deployed The trawl used in the survey is a product of many meetings and personal interviews held with participants from the commercial fishing industries from Rhode Island to Maine. The trawl is a two seam high-rise design that is specifically designed to catch a full range of cod year classes, while targeting the larger spawning size fish. This design also allows fishing over all substrate types that are anticipated to be encountered during the survey (i.e. soft mud to hard rocky ledge). The net has a 150-foot fishing circle, 87-foot sweep, and an 84-foot headrope. The wings and body of the net are made with 4.5-inch Euro twine, which tapers in the extension to a 3-inch codend that has a 2-inch mesh liner. The sweep is a 14-inch “Rockhopper” which has 14-inch disks in the belly that taper to 12 inches in the wings. The bridals and ground cables are each 15
6

fathoms. Both the bottom leg and ground cable are rubber cookie-covered to decrease wear and to improve the mud-cloud effect. A detailed memorandum describing net description, rationale for net style selection, details of the net plan, and schematics of the sweep are provided in Appendix B.
2.2.3 Net Builder Similar to the selection of commercial fishing vessels, the net builder was selected through a competitive bidding process that included the advertising of a RFR. Selected criteria were:
1. Bid price for nets and service was competitive. 2. Net design achieved all criteria of the survey trawl.
3. Excellent recommendations. 4. Extensive experience and knowledge of the New England groundfish fishery. 5. Shop size was large and well-staffed. 6. Shop was capable of manufacturing all components of the gear, including the rockhopper
sweep, legs, and groundgear. 7. Could provide a one-ton truck with a crane for transporting, loading and unloading gear
for the vessels. 8. Worked closely with Northeast trawl systems; a leader in the otter trawl manufacturing
industry.
9. Staff, especially the lead net builder, was knowledgeable of survey design and the importance of standardization of the trawl nets.
10. Good working knowledge of computers and software, which assisted in the development
of net plans and sweep plans.
2.2.4 Net Calibration Before the nets were calibrated in the field, the net design was tested at The Centre for Sustainable Aquatic Resources of Memorial University of Newfoundland (CSAR) in St. John, Newfoundland Canada. CSAR is the largest flume tank in the world, and they have extensive knowledge and experience testing demersal trawls used in commercial and research operations (e.g. NEFSC bottom trawl survey, Department of Fisheries and Oceans (DFO) bottom trawl survey, DFO sentinel survey, MarineFisheries raised footrope trawl, etc.). To test the trawl in the flume tank, a model of the net was required to be produced. The Foundation for Scientific and Industrial Research at the Norwegian Institute of Technology
7
(SINTEF) Fisheries and Aquaculture in Hirtshals, Denmark was contracted to develop and construct the model. Testing the trawl in the flume tank allowed gear specialists to adjust the model to define its ideal geometric shape. The trawl’s optimum fishing shape is important because it yields the highest fish retention. The angles, heights, spread, needed lift, and door sizes are measured and applied to the trawl when at sea. Having the known values was instrumental in net calibration and contributed to a more efficient and less time-consuming calibration process. The net performance report developed from flume tank testing describes how minor changes to the rigging and towing speed affected the trawl’s geometry. This assisted the scientists and captains in deciding where to increase attention on rigging parameters and towing. In addition, the flume tank test was recorded digitally and a DVD was produced. A copy of the DVD is provided in Appendix C and the net performance report is provided in Table 3. The survey vessel captains/owners, contracted net builders, in-house gear experts, and scientific personnel participated in flume tank testing. Having the survey members at the flume tank not only gave an excellent opportunity to train and familiarize participants with the survey gear, but allowed other industry and interested parties to observe the vigilant steps that were being taken to assure quality control throughout the survey. Two net mensuration systems, produced by NorthStar Technical, were acquired to assist with the calibration of the survey trawl, and the two systems were to be rotated throughout the fleet during the cod IBS to assure net standardization. Members of the flume tank team received a tour of the NorthStar Technical production facility and were provided a demonstration of the performance of the equipment. In addition, prior to the sea trial and net calibration, a separate training session was convened, and members of NorthStar Technical trained survey fishermen and scientists to install and deploy the equipment. Sea trials were run on each vessel prior to the beginning of the first survey cruise. Using the net mensuration equipment, fishermen and scientific staff monitored the behavior of the trawl, ground gear, and doors in real time while towing. All nets were adjusted to optimal configuration by comparing flume tank measurements and the real-time data from the net mensuration system. The sea trials were conducted at various bottom depths and bottom substrate types. Nets were deemed standardized and ready for use in the survey when geometric configuration was similar to flume tank results. During both years of the survey, an underwater camera was attached to the net in strategic locations to study fish behavior when encountered by the survey trawl and to observe performance of the net on various bottom types. The net’s behavior in response to various factors, including speed, bottom type, and depth was documented. MarineFisheries provided the funds, staffing, and equipment to complete this task since this under water camera work was not included in the contract for the cod IBS pilot study. The underwater footage from this work is provided on the DVD included in Appendix C.
8

9
Table 3. Flume tank test results for the Reidars 360, from the Memorial Institute in Newfoundland CA.
Rig # 1 2 3 4 * 5 6 7 8 9 10 11 12 13 14 15
Tow Speed (kts) 3.0 3.0 2.5 3.0 3.5 3.0 3.0 3.0 3.0 3.0 2.5 3.0 3.5 3.0 3.0
Door Spread (ft) 182 184 181 182 185 181 181 147 150 152 124 162
Upper Wing Spread (ft) 49.6 49.6 49.2 49.4 49.6 48.5 49.6 42.6 43.1 43.3 38.0 56.8
Lower Wing Spread (ft) 55.0 53.6 52.8 53.0 53.7 52.9 52.7 45.9 46.6 46.4 39.4 62.3
Headline Height (ft) 13.9 14.4 16.0 14.4 13.4 13.9 15.0 15.7 17.1 14.7 17.1 15.5 13.9 16.0 14.4
Wing Opening (ft) 9.4 10.0 11.0 10.2 9.7 10.2 10.8 10.5 10.8 10.5pt 10.0st 10.8 10.2 9.7 10.2 10.8
Bridle Length (ft) 90 90 90 90 90 90 90 90 90 90 90 90 90 90 90
Sweep Length (ft) 90 90 90 90 90 90 90 90 90 90 90 90 90 90 0 Upper Bridle Extension
(ft) 0.0 1.0 0.0 0.0 0.0 0.0 1.0 0.0 0.0 0.0 0.0 0.0 0.0 0.0 0.0
Port Tension (tonnes) 0.92 1.17 1.44 1.1 1.2 1.2 1.2 0.88 1.10 1.35 1.04 1.22 Starboard Tension
(tonnes) 0.93 1.17 1.48 1.1 1.2 1.2 1.2 0.89 1.08 1.35 1.07 1.21
Total Tension (tonnes) 1.85 2.33 2.92 2.3 2.4 2.4 2.4 1.78 2.18 2.70 2.12 2.43
Mouth Area (sq. ft) 727.5 744.9 816.3 738.8 690.7 705.0 764.9 754.6 694.7 623.8 619.5 859.4
Mouth Drag (lbs / sq. ft) 5.0 7.0 9.3 7.1 6.8 5.2 6.9 9.5 7.5 6.2
# of 8” floats (6.83 lb lift) 58 58 58 58 58 50 58 66 76 58 58 58 58 58 58
Total Buoyancy (lbs) 393.3 393.3 393.3 393.3 393.3 340.9 393.3 448.0 516.3 393.3 393.3 393.3 393.3 393.3 393.3
Bridle Angle (degrees) 17.6 18.0 17.7 17.8 18.2 17.7 17.7 0.0 13.9 14.3 14.5 11.5 24.3 * Rig 4: design used for the cod IBS; Blank cells - not applicable
Rigging & Notes Rig 1: Starting rig Rig 2: 1” of upper bridle extension added, bridle endpoint where sweep is connected is 1.3’ off seabed Rig 3 – 5 : No set back, 50 lbs of weight at end of sweepline, sweeps making good contact Rig 6: 8 floats removed, sweepline end weight removed, at 3 knots sweepline off bottom at endpoint by 12” Rig 7: 8 floats reattached, delta plate and chain weight added (50 lbs) to end of sweepline and 1’ upper bride extension added Rig 8: Upper bridle extension removed, equivalent of 8 fullscale floats added to headline Rig 9: 10 extra fullscale floats added ( for a total of 18 extra), sweepline slightly raised off bottom Rig 10: 2 fathom extra warp added to port side, 18 floats removed Rig 11 – 13: Reduced door spread with standard number of floats (58), same as rigs 3 – 5 but with reduced door spread Rig 14: Trawl underspread Rig 15: Trawl overspread with sweepline removed

2.3 SAMPLING DESIGN Four commercial fishing vessels were contracted as the sampling platforms for the survey. The four vessels visited assigned stations, conducted tows with the standardized gear, and processed catches. To assist in the standardization of the processing of catches and towing protocols, a Chief Scientist Guide was developed specifically for the cod IBS (Appendix D). This guide provided detailed descriptions of all procedures and protocols for scientific staff and crew and included a data field description list.
Figure 1. Sampling Catch
A crew member from the contracted survey vessel Lady Jane samples a catch of cod
2.3.1 Data Collection During each survey, data were collected manually and electronically by the scientific staff and vessel crew. Scientific staff recorded date, time, location, depth, weather, sea state, and specific gear characteristics at the start of each tow. During the tow, several parameters were monitored electronically. The bottom temperature data was collected using a StowAway TidbiT temperature logger. To ensure the measured bottom temperature was standardized among all of the vessels, the location of the data logger was consistently placed on the bracket of the port side trawl door.
10

To collect tow position and track line data, MaxSea Marine Plotting Software was utilized. The MaxSea software, which was installed on a notebook computer, was interfaced with each vessel’s GPS device through a USB connection and was programmed to collect depth and position information in real-time. MaxSea is unique and powerful software due to its versatility and ability to display large amounts of detailed information in the survey area. The software also allows scientists to add “layers” of information that include survey strata, station location, historical tow information, wreck/tow hang information, and bathymetry data which are useful to both scientists and fishermen (Figure 2). The information created using this software could be retrieved and stored in tables and/or shared with other vessels participating in the survey. Two NETMIND™ Trawl Monitoring Systems (net mensuration systems) were shared among the four sampling vessels. The NETMIND™ system collected information regarding net configuration including headrope height, door spread and bottom contact. Typically, each vessel utilized the NETMIND™ system at the start of each cruise to ensure that the nets were operating at the correct geometry. Once correct geometry was established, the systems were rotated throughout the sampling fleet to monitor trawl performance. Nets that became entangled with fixed gear, wrecks, or hard bottom and then retrieved were considered priority for net mensuration and were checked with the system as soon as possible. At the end of each day, all computer-generated data by the NETMINDTM system were downloaded to a laptop, and backed up on a USB memory key.
Figure 2. MaxSea software utilized during the IBS for GOM cod
Station
9-minute grid
A screen shot of a MaxSea 3-D image that is utilized during the cod survey. The software provides information such as the 9-minute grid (rectangular box stretched over bathymetry base map), station location (located in the center of the grid), strata boundaries (>10Fm and <75 Fm), and bathymetry.
11

During the survey only successful tows were sampled. In order to qualify as a successful tow, the following quality criteria had to be met: minimum of 20 minutes tow time, no more than 30% damage to trawl net; no large obstructions in the gear; and the tripper must have remained closed. All catch was removed from the net and sorted on deck by species. Spiny dogfish, crabs and American lobster were further sorted by sex. A total weight was recorded for all species using calibrated Marel shipboard 60 kg and Pesola 10 kg spring scales. Biological sampling was conducted on a list of prioritized species. Atlantic cod biological sampling for all tows entailed recording individual length, individual weight, sex, stomach contents, and maturity stage. Otoliths were also removed and saved for aging. Individual lengths were collected for other commercially-important species including American lobster, American plaice, Atlantic halibut, Atlantic wolffish, monkfish, Greenland halibut, haddock, pollock, redfish, white hake, winter flounder, witch flounder, and yellowtail flounder. When catches of one or more species were significantly high for a tow, subsampling strategies were employed. Subsampling was generally used when total sampling of the particular species was impractical and would impede the schedule. The subsampling guidelines used were developed by the NMFS, Northeast Fisheries Science Center Ecosystems Survey Branch and adapted to the cod IBS. The Chief Scientist Guide details the methodology used during the cod IBS (Appendix D).
2.3.2 Gear Condition Maintaining the survey net and gear was essential to the integrity of the data and the standardization of the gear throughout the survey. Damaged gear or holes in the net can have a significant impact on the effectiveness of the trawl and therefore it was imperative that the trawl was kept in ideal condition. To accomplish this, the crew inspected the survey equipment after each tow and repaired any damage prior to the next deployment. If damage was severe, and the geometry or stability of the net was compromised, the trawl was removed from the vessel and returned to the net builder for repairs.
2.3.3 Towing Protocol As recommended by the IBS implementation committee, the cod IBS utilized a commercial style survey tow rather than the more traditional straight line survey tow. A commercial style tow is simply the style tow that is typically used by the fishermen when on a commercial venture, and is usually influenced by depth, bottom type, substrate type, presence of fish, presence of fixed gear, presence of other fishing vessels, etc. Turns were conducted as gradual as possible during a survey tow to avoid affecting the geometry of the survey trawl. In order to avoid gear conflicts, and to determine how to conduct the tow, protocol required the survey vessels to assess the selected station for fixed gear, depth gradients, bottom roughness, and bottom hardness prior to deploying the gear.
12

The stations were located in the center of each square of the systematic and stratified grid. The vessels had the flexibility to complete the tow in any direction, but were required to tow as close as possible to the station. If fixed gear was present or if the bottom type prohibited the vessel from completing the tow, the vessel searched for open bottom, as close as possible to the station. The survey tow location was considered valid if two-thirds of it fell inside the station’s square (which equals 20 minutes of tow time or approximately 1.0 nm). Tow speed and duration are variables that are directly associated with catch rates and therefore were standardized. As mentioned above, the standardized survey tow utilized in the cod IBS was 30 minutes in duration with a minimum time requirement of 20 minutes. If the tow could not be completed, and the time duration was less than the required amount, the net was hauled aboard, thoroughly cleaned free of fish and debris, and the tow was attempted again in an area adjacent to the previous tow. The second attempt, or alternate tow, could not overlap or intersect with the previous tow. Tows were required to be completed at a fixed speed of 3.0 knots. To avoid any variables of tide and current, the tow speed was monitored using the vessel’s Global Positioning System (GPS) and not the vessel’s speedometer. Tow start time began when the winch stopped paying out wire and the tow ended when the winch was engaged to retrieve the wire. The scope of wire set for each tow was standardized at 3:1 and is consistent with the scope ratio typically used by the New England commercial groundfish fishing fleet. Prior to deploying the net, the vessel’s captain was required to estimate the average depth of the tow and then calculate the amount of scope accordingly. In addition to the pre-tow assessment, digitized raster and vector Bathymetric charts, historical tow information, and local knowledge were resources used by vessel captains to determine the scope of wire. A scope chart was created to guide the vessel captains and chief scientists for the amount of wire to set (Table 4).
Table 4. Standardized scope of wire set for the IBS for GOM cod Depth (fathoms)
Amount of Wire Set (fathoms)
Amount of Wire Set (meters)
10 – 12.5 25 46
12.6 – 20.8 50 91
20.9 – 29.2 75 137
29.3 – 37.5 100 183
37.6 – 45.8 125 229
45.9 – 54.2 150 274
54.3 – 62.5 175 320
62.6 – 70.8 200 366
70.9 – 79.2 225 411 Scope ratios are consistent with the scope rates used by the New England commercial groundfish fishing industry.
13
2.4 ADDITIONAL SURVEY COMPONENTS
2.4.1 Data Management Post-cruise processing included converting the raw data collected at sea into master data files stored in the Oracle survey database (SVDBS) located at the NMFS, Northeast Fisheries Science Center (NEFSC) in Woods Hole, MA. This processing occurred over an 8 - 10 week period following the last day of each cruise. Processing began as raw data logs, biological samples, and computer-generated data files were returned to the MarineFisheries office in Gloucester, MA. Selected tow information was initially entered into a local Access database for a preliminary assessment of Atlantic cod catches and station completion rates for each cruise period. Preliminary audit of the data continued at over a period of 2 - 3 weeks. The preliminary audit entailed reviewing all data logs for accuracy and completeness. Any questions regarding the raw data were resolved by direct interviews with the appropriate chief scientists. All biological samples collected were cross-referenced and logged onto the corresponding detail data logs, and individual species were coded to facilitate the data entry process. Data entry was conducted by UNICOR / FPI, a contractor assigned for this task by the NEFSC. UNICOR was allowed five weeks for data entry from the date the data logs were submitted to them. Upon completion of the entry process, all data logs were returned to MarineFisheries in company with three electronic data files. These files were also submitted directly to the NEFSC for loading into the SVDBS raw data tables. An audit of the cruise data was conducted using a remote access connection to the NEFSC database, the WHOI/SUN. The audit followed the standardized procedures presented in the SVDBS Auditing Manual version 2.20. Once the audit was complete, the NEFSC loaded the data into the SVDBS master data tables. The computer-collected bottom temperature data strings, NETMIND™ gear configuration data strings, and vessel survey tow track line files were edited by eliminating data strings erroneously collected between hauls. The bottom temperature data was forwarded to the NEFSC for inclusion in the SVDBS master data table. Remaining files which have yet to be uploaded to the NEFSC database remain on file at MarineFisheries.
2.4.2 Sale of Catch / Project income Instead of wastefully discarding the catch overboard, cod and other commercially valuable species that underwent sampling were sold. Proceeds from the sale of these fish were deposited into the MarineFisheries Research and Conservation Trust account, which has been created to receive non-federal funds such as those from the sale of the survey catch. The income generated from the survey was used to pay unexpected expenses, enhance the survey and, if income allowed, to extend the survey to include the full spatiotemporal coverage recommended in the April 2002 Report, “Recommendations from the IBS Committee convened by NMFS”. The April 2002 Report also recommended the sale and distribution of funds as a standard policy to “eliminate any incentive for participants to alter their research practices to increase their catch of fish.”
14

2.4.3 Outreach Outreach was a key component to the cod IBS. The stakeholders of the survey were identified and divided into three groups: fishermen and industry from the New England groundfish fleet that would have an interest in or could assist the survey; fishermen and industry that would impact the survey and its activities; and the end users of the data (industry representatives/ scientists/managers). The first group was included during all phases of the implementation of the survey project. Several industry members with non-qualifying vessels participated on the implementation team. Others shared local knowledge of cod “hot spots” or areas of concern during the survey design phase. During the gear development meetings, informative debates guided the selection of gear for the survey, and once on the water part-time fishermen assisted as scientific staff. The contracted net builders and vessels also proved to be valuable in conducting the survey, making sacrifices and vesting countless hours to assure that the survey was successful. To keep this group informed and involved, several outreach outlets were utilized. Some of the outreach efforts included:
• Articles in local papers (Gloucester Daily Times), newsletters, and industry periodicals (Commercial Fisheries News) (Appendix E),
• Advertisements in local papers (Figure 3), • Several pages dedicated to the survey on MarineFisheries website
http://www.mass.gov/dfwele/dmf/programsandprojects/ibsurvey.htm#ib. Information included program description, maps of survey locations, coordinates, schedules, contact information, survey results, pictures and a short movie demonstrating age structure sampling, and
• Displays at trade shows – Working Waterfront Festival, New Bedford MA, Massachusetts Lobstermen’s Association trade show.
15

Figure 3. Cod IBS sample advertisement
Advertisement was run monthly in the Fisherman’s Voice and the Commercial Fisheries News, from October through May while the survey was being conducted.
The second group of stakeholders identified included the fishermen that had an impact on the survey and its activities, mainly fixed gear fishermen. Common with any survey that utilizes mobile gear as its sampling tool, interactions with fixed gear can potentially occur. Usually without intention, fixed gear fishermen set traps or nets in areas that have been randomly or systematically selected to be surveyed. This can cost both the fixed gear fishermen and the survey a considerable amount of inconvenience, time, and money. Most importantly, data quality can be impacted. To address this potential conflict, an outreach plan was developed for the cod IBS. The plan was the product of a collaborative effort between state scientists and commercial fishermen. The IBS outreach sub-committee, comprised of both scientists and fishermen from Maine, New Hampshire, Massachusetts and Rhode Island, reviewed and approved the plan. The outreach plan for the IBS of GOM cod included the following elements:
-Mailings
Maine: Letters sent to representatives of the LZC, LAC, MLA, Downeast Lobstermen’s Assoc., Commercial Fisheries News, Fishermen’s Call, and Fishermen’s Voice.
New Hampshire: Letters, maps, coordinates, and schedules sent to all fixed gear fishermen. A copy of the letter was supplied to NH F&G for copying, envelop stuffing, and distribution.
- MarineFisheries Newsletter An advertisement for the IBS for GOM cod was placed in MarineFisheries quarterly newsletter. This mailing reaches approximately 8,500 individuals that reside in Massachusetts and throughout the New England region.
16

- Listserv A memorandum summarizing the survey including, maps, coordinates, and schedules of the IBS for GOM cod was released on the MarineFisheries listserv. This electronic e-mail messaging system is one of the preferred methods for the distribution of immediate releases and emergency information. This distribution list reaches approximately 3,000 individuals that reside in Massachusetts and throughout the New England region.
- Website A dedicated page on the MarineFisheries website was created to provide instant updates. Site includes general cod IBS information as well as maps, coordinates, and schedules. Site address: http://www.mass.gov/dfwele/dmf/programsandprojects/ibsurvey.htm#ibs
- VHF Announcements New Hampshire: Contracted vessels made general announcements on VHF channel 16 that included dates, location of sampling tows, and vessel contact information 48 hours prior to deployment. Maine: The morning of deployment, a general announcement was transmitted on VHF channel 16 for all stations that will be towed in or near the state of Maine territorial waters. The announcement included dates, location of tows that would be attempted to be surveyed, and vessel’s contact information.
In addition to the outreach plan review, the IBS outreach sub-committee also developed alternative outreach methods. These methods were described in the minutes from the January 18, 2005 outreach sub-committee meeting (Appendix E). One method that was implemented was the creation of two hundred 22”x31” posters that depicted information regarding both the IBS yellowtail flounder and cod projects. Printed with funding provided by NOAA/NCRPP, the posters were distributed to both the state of Rhode Island and Massachusetts. Contracted personnel distributed and displayed cod IBS posters in areas of high visibility to commercial fishermen (dealers, fish auctions, fishing supply stores, bait dealers, town and state wharves, private wharves, harbor master offices, marinas, and general convenience stores, etc.). Other committee action items included broadening outreach to include organizations such as MA Lobstermen’s Association, Atlantic Offshore Lobstermen’s Association, and New England Marine Fisheries Council. Because interactions with fixed gear were a significant cause for uncompleted survey tows, a presentation focusing on the areas with the lowest completion rates for survey tows was given at the ME Lobster Advisory Council meeting. The presentation explained details of the purpose and goals of the survey, why the survey was needed, a description of the vessels, survey methodology, contact information for both state scientists and vessels, scheduling of the survey, location of the tows, the potential benefit of the survey, and a request for their assistance in keeping the survey tows free of fixed gear. The third group consisted of end users that would be using the data for research and management. Since this was a new data source, informing the group of the availability and how
17
to retrieve the data through specific requests was important. To do this, the above outreach outlets were utilized as well as the following:
• PowerPoint presentations given at the 2005 groundfish Plan Development Team meeting, MarineFisheries Cod Conservation Zone research working group cod workshop, and an at an observer training course at the NEFSC in Woods Hole, MA,
• Data was submitted for the 2005 GARM II and, • Packets that included information about the survey, species distribution maps, and length
frequency information for ten commercially valuable species were created and distributed to the appropriate scientists.
2.4.4 Training Staff were trained prior to the initiation of the cod IBS via an in-house sampling design/training meeting held for dedicated program staff and members of the MarineFisheries Resource Assessment program. The Resource Assessment program conducts a standardized trawl survey twice a year with the goals to estimate abundance and distribution of estuarine and coastal species found within Massachusetts territorial waters. They utilize the same protocols and procedures used by the NMFS, Northeast Fisheries Science Center Ecosystems Survey Branch and have knowledge of the procedure for completing the survey trawl haul and species detail logs that were used during the cod IBS. Training for the contracted vessels included one to two days of sea trials held prior to the start of the first leg. The sea trials entailed net calibration exercises while the catches were handled as mock work-up tows. Contracted scientific staff and vessel crew were instructed on proper biological sampling techniques including, but not limited to: species identification, collecting species weights and lengths, subsampling protocols, maturity sampling, and age structure extraction. Other scientific staff training was provided for the following topics: NMFS logs while in situ, computer equipment, software, data loggers, net mensuration equipment, digital shipboard balances, and other equipment required to conduct the survey. Captains and scientific staff tested and refined towing protocols and proper gear configurations, while decks and sampling stations were coordinated. The chief scientists deployed throughout the first cruise of the cod IBS were dedicated program staff and in-house staff from the Resource Assessment program. During the first cruise, these individuals trained three contracted scientific staff on the duties of chief scientist. These individuals’ responsibilities were later increased and in subsequent surveys they acted as chief scientists. Training material included detailed instructions for completing all survey data logs, techniques for accurate data collection, directions for all computer-generated data collection programs and guides for identification purposes. These identification guides included:
• NEFSC. Guide to Maturity Staging for Atlantic Cod Gadus morhua. National Marine Fisheries Service, Northeast Fisheries Science Center, Ecosystems Survey Branch. Woods Hole, MA.
18

• New Hampshire Sea Grant. 2002. Skates of the Western Gulf of Maine. NSGL#: NHU-
H-02-002.
• Robins, C.R., G.C. Ray, J. Douglass and R. Freund. 1986. A Field Guide to Atlantic Coast Fishes (North America). Houghton Mifflin Company. New York. 354 p.
• Tomkiewicz, J., L. Tybjerg, N. Holm, A. Hansen, C. Broberg and E. Hansen. 2002.
Manual to determine gonadal maturity of Baltic cod. DFU-rapport 116-02, Charlottenlund: Danish Institute for Fisheries Research. 49 p.
• Williams, A.B. 1974. Marine Flora and Fauna of the Northeastern United States.
Crustacea : Decapoda. NOAA Technical Report NMFS 389. 50 p.
2.4.5 Safety Training Conducting survey work, particularly during the time of year of the IBS for GOM cod, is hazardous work. Although some of the contracted professional observers, scientific staff and fishermen had varying degrees of safety training, a formal training session for the entire project was necessary. The North East Safety Training Company (NESTC) was contracted to conduct a commercial fishing vessel safety training class. This safety class gave basic instruction in unintentional flooding, fire fighting, man overboard and abandoning ship procedures and was open to all program scientific staff, the contracted fishing vessel crews, and other in-house staff that were projected to participate in the cod IBS.
Figure 4. Safety training
A member of the IBS for GOM cod scientific staff igniting a handheld signaling flare during the safety training class, taught by NESTC in Gloucester, MA.
19

3 PROJECT MANAGEMENT The cod IBS required a combination of dedicated hired staff, subcontractors, contracted professional fisheries observers, and in-house staff to conduct the survey. In addition, several volunteers and graduate students from local collages and universities assisted. In-house staff also contributed significantly to the implementation the survey. The majority of the support from in-house was donated by MarineFisheries and therefore did not impact the cod IBS budget.
3.1 Project Management A schematic of the pool of staff and support is detailed in Figure 5. A brief description of the duties for the staff that were involved in implementing the IBS for GOM cod are below: Program Manager: David Pierce, MarineFisheries Deputy Director, oversaw general operations, contracts, and budget. Program Leader: Bill Hoffman, MarineFisheries full-time employee, dedicated to the cod IBS. Responsible for management and implementation of the survey including, budget, outreach, survey vessels, survey staff, design, scheduling, and training. Completed permitting, analysis, report writing. Chief Scientist. Field Coordinator: Daniel Salerno, contracted employee, dedicated to the cod IBS. Data management including editing, auditing, and data queries/requests. Coordinates vessel supplies, conducts biological and safety training, Chief Scientist. Program income and expenditures: Kevin Creighton (Federal grants and contracts coordinator), Darlene Pari (accounting) MarineFisheries full-time staff. Responsible for submitting invoices to NMFS and paying project expenditures. Sea Samplers (contract): AIS inc., AIS is an observer company that also currently holds the federal observer contract. Jeff Robinson (Chief Scientist) and Sarah Reynolds (sea sampler), sea sampling support, professional Federal Observer. Contracted sea samplers (private): Andrew Gowen (chief scientist) and Peter Brawn (sea sampler). Privately contracted personnel, sea sampling support. Both have experience with cooperative research. Peter Brawn is also a commercial fisherman. Data Analysis: Steven Correia, MarineFisheries Aquatic Biologist III / Policy Management & Regulations. Assisted and provided guidance for survey design, sampling design, and data analysis. DMF staff: Pool of in-house staff that assisted in the field with sea sampling and chief scientist support MarineFisheries.
20

Figure 5. Project management for the IBS for GOM cod
21
Project Manager David Pierce
Dedicated Project Staff
Sea Sampling Contract AIS inc.
Private Contractors (sea samplers)
DMF Staff In-house Support
Jeff Robinson chief scientist
Sarah Reynolds sea sampler
Andrew Gowen chief scientist
Peter Brawn sea sampler
Reuben Macfarlan chief scientist
Micah Dean sea sampler
Brian Kelly sea sampler
Mark Rousseau sea sampler
Brad Chase sea sampler
Matt Ayer sea sampler
Additional in-house support
Staff Administrative SupportDirector
Paul Diodati
Deputy Director Dan McKiernan Project Leader
Bill Hoffman
Program income and Expenditures
Fed grants coordinator Kevin Creighton
Field Coordinator Dan Salerno
Accounting Darlene Pari
Conservation Engineering Resource Assessment Fisheries Statistics
Thomas Moth-Poulsen
Steve Correia Micah Dean
Jeremy King Mike Pol
Vincent Manfredi Mark Szymanski

Additional in-house support: Several MarineFisheries projects and personnel were drawn upon to assist with the implementation of the cod IBS. In particular, the Conservation Engineering program for net development, calibration, and underwater videography; Statistics program for data analysis, database support, GIS mapping, survey design; and the Resource Assessment program for survey design, sampling design, and sea sampling/chief scientist support. Commercial fishing industry participation: The four commercial fishing vessels that were selected to serve as the cod IBS sampling platforms were: F/V Jocka, F/V Titan, F/V Lisa Ann, and the F/V Lady Jane (Table 5). Reidar’s Manufacturing Inc, Fairhaven MA, was contracted as the survey’s net builder. In addition to building and providing the survey nets and gear, they also provided support throughout the survey. This support included maintaining the gear and nets (throughout the survey period, if major damage occurred Reidar’s would repair nets. At the end of each survey, they would meticulously inspect each net to ensure top condition and standardization for the next year’s survey), transporting nets and gear, and providing assistance with preparing the contracted vessels for survey work. The commercial fishermen that worked on a volunteer basis and provided local knowledge of vessels, gear, nets, and times and locations of local aggregations of GOM cod are too numerous to list.
Table 5. Contracted fishing vessels
Vessel Homeport Doc # L.O.A.1 Owner Captain
Jocka Cundy’s Harbor, ME 939745 67 Terry Alexander
Terry Alexander
Lisa Ann II Newburyport, MA 1139403 58 Jim Ford Jim Ford
Titan Portland, ME 1051164 66 Michael Love Russell DesJardins
Lady Jane Gloucester, MA 608078 76 Russell Sherman
Russell Sherman
1 L.O.A- length over all
22

4 FINDINGS The IBS for GOM cod pilot study’s first cruise began on November 19, 2003 and the final cruise finished on December 31, 2005. During that time two complete surveys (2003/2004 and 2004/2005), which consisted of five cruises each, were successfully conducted. The fifth cruise for 2005, which would have been the first of the 2005/2006 season, was also completed. All data are now in master data format and available to scientists and managers.
4.1 RESULTS Biological, oceanographic, and meteorological information were collected in all of the cruises, entered in logs and computers, edited, audited and are now available for analysis on the WHOI/SUN database. Detailed spatiotemporal information by length and weight was collected for GOM Atlantic cod, as well as for several other species of interest. Biological sampling was expanded for cod to include maturity, age structures, individual weights, and food habits.
4.1.1 Cod Spatiotemporal Distribution and Rolling Closures The April 2002 Report identified that this study was needed to “obtain more detailed information about cod than is currently available from the existing surveys and help refine the description of future closures in space and time.” However, note that the cod IBS was not specifically designed to study the rolling closures, and therefore it cannot be used for evaluating the “effectiveness” of closures in reducing mortality or to estimate the relative contribution of the rolling closures toward reducing GOM cod mortality, compared to other management measures. The rolling closures are only one component of a multi-faceted management plan and are used in conjunction with other management regulations (Days at Sea (DAS), trip limits, mesh-size, etc.), to achieve a goal of a targeted mortality rate. In August 2005, the groundfish Plan Development Team (PDT) met to evaluate the rolling closures to determine if the boundaries could be moved to change the closed areas, while still effectively protecting aggregations of cod. During the meeting, the cod IBS data were presented. Included in the presentation was a spatiotemporal analysis of distribution of cod by weight, number, juvenile fish, mature fish, spawning biomass, and pre-spawning biomass. For analysis purposes, the cod IBS data were post stratified into a 30-minute strata that comprised of six stratums. Each stratum was delimited using the same 30-minute lines of latitude that are used for the north and south boundaries of the rolling closures. These findings and a map of the 30-minute strata were updated and are attached in Appendix F. The PDT used several data sources including the cod IBS data from the 2003/2004 and the 2004/2005 surveys. The PDT concluded that location/ timing of the current area closures were consistent with area of high cod abundance. Based on the data that was available and the need for further reductions in cod mortality, the PDT decided to take no action and not alter the boundaries of the rolling closures.
23

4.1.2 Length Frequency Tables The length compositions for several important species are shown in figures in Appendix G. These figures have both mean numbers per tow at length and mean number at length as a proportion of total number by strata and cruise for the 2003/2004 and 2004/2005 surveys. Length distributions of different post-stratified strata can be examined by reading across rows. Temporal changes in length distribution within strata can be examined by reading down columns. Each figure includes a series of length frequency graphs that show average number at length throughout the entire survey period by post-stratified 30-minute strata. This type of analysis is unique because its format illustrates the general trends in distribution, stock demographics, and the co-occurrence of cod with other species.
4.1.3 Spatial-Temporal Distribution of Species The distributions of catch per tow for cod, haddock, pollock, redfish, winter flounder, yellowtail flounder, American plaice, witch flounder, windowpane flounder, halibut, white hake, monkfish, American lobster, and rainbow smelt) are shown in Appendix H. These data are equally as detailed and comprehensive as the cod data. Included in this appendix are ARC/GIS produced distribution maps of kilograms (Kg) per 30-minute tow. Also included are percent length frequencies, average number at length (where applicable), the average number at length as a percentage of total number, and a length frequency overview by species per cruise and strata.
Figure 6. Biological sampling
Scientific staff and crew collecting data from a survey catch
24
4.1.4 Cruise Completion Rates Completion rates varied from area to area within the cod IBS strata. During the 2003/2004 survey, vessel completion rates ranged from 56.2% to 91.4% and during the 04/05 survey, vessel completion rates ranged from 66.2% to 91.7%. Combined for both surveys the average completion rate was 75.7% (Table 6). The first cruise of the 2003/2004 survey had an average completion rate of 60.0%, which was the lowest of the both surveys. The low completion rate for that cruise was expected for the following reasons:
(1) This was the first time that the survey was conducted and there was a learning curve for all scientists, crew, and vessel captains. Learning protocols, species identification, software, and equipment operation all took time which impacted how many tows could be completed in a day.
(2) Many of the areas surveyed had not been commercially fished for several years, and therefore “new bottom” or towable bottom had to be identified.
(3) In addition, fall (the time at which the first cruise was conducted) is the most active time of year for the lobster industry, and fixed gear presented a major obstacle for the survey vessels. For both the fall cruises of the 2003/2004 and 2004/2005 surveys, the areas with the heaviest concentrations of fixed gear were in coastal areas of mid-coast Maine, generally in the vicinity of Mohegan island. Completing tows in the majority of the coastal areas from the New Hampshire/ Maine border east to the Grand Manan channel was difficult due to the concentrations of fixed gear. The fixed gear problem was also compounded by the limited amount of towable bottom due to hard and irregular bottom, and depths outside the survey strata found off the Maine coast.
4.2 SURVEY PROBLEMS Several unforeseeable obstacles were encountered during the first two years of the survey that resulted in less than satisfactory results. Although cooperative research is not a new concept, using multiple commercial fishing vessels as sampling platforms in a standardized survey in the GOM is. The development and implementation of the survey was a unique collaborative effort that included New England state and federal scientists, managers, and commercial fishermen working together to produce a cod survey. Some of the problems encountered during the first two years of the cod survey are detailed below.
4.2.1 Fixed gear As mentioned above, the presence of fixed gear was the most significant problem that the survey encountered. Despite numerous outreach attempts, the removal of fixed gear from the areas to be surveyed was not significantly successful. The problem is evident in Table 6, as the year-to-year tow completion rates did not improve. Within the survey season, rates did improve from fall to spring, but this was attributed to the differences in fishing effort, rather than a response to cod IBS outreach. The areas of the survey that were impacted the greatest were from the ME / NH border east to the Canadian / ME border.
25

Table 6. Station completion rates
Downeast – Mid Coast ME
Mid Coast - Southern ME & Offshore
Southern Maine – Cape Ann MA
Cape Ann – Cape Cod MA
Total
Cruise 2350 Nov – Dec
18/49 (36.7%)
22/57 (38.6%)
36/43 (83.7%)
44/51 (86.3%)
120/200 (60.0%)
Cruise 2455 Jan – Feb
23/56 (41.1%)
33/52 (38.6%)
40/44 (90.9%)
45/48 (93.8%)
141/200 (70.5%)
Cruise 2456 Feb – Mar
31/53 (58.5%)
32/52 (61.5%)
41/45 (91.1%)
45/49 (91.8%)
149/199 (70.5%)
Cruise 2457 Mar – Apr
42/52 (80.8%)
34/58 (58.6%)
54/56 (96.4%)
50/54 (92.6%)
180/220 (81.8%)
Cruise 2458 Apr – May
43/55 (78.2%)
33/55 (60.0%)
51/57 (92.7%)
50/55 (90.9%)
177/220 (80.5%)
2003
/200
4
Totals for 03/04
157/265 (59.2%)
154/274 (56.2%)
222/243 (91.4%)
234/257 (91.1%)
767/1039 (73.8%)
Cruise 2465 Nov – Dec
33/56 (58.9%)
31/56 (55.4%)
53/57 (93.0%)
49/57 (86.0%)
166/226 (73.5%)
Cruise 2561 Jan – Feb
33/55 (60.0%)
31/56 (55.4%)
46/54 (85.2%)
49/54 (90.7%)
159/219 (72.6%)
Cruise 2562 Feb – Mar
34/52 (65.4%)
49/55 (89.1%)
45/52 (86.5%)
52/54 (96.3%)
180/213 (84.5%)
Cruise 2563 Mar – Apr
35/52 (67.3%)
36/46 (78.3%)
54/60 (90.0%)
52/55 (94.5%)
177/213 (83.1%)
Cruise 2564 Apr – May
45/57 (78.9%)
43/56 (76.8%)
42/56 (75.0%)
51/56 (91.1%)
181/225 (80.4%)
2004
/200
5
Totals for 04/05
180/272 (66.2%)
190/269 (70.6%)
240/279 (86.0%)
253/276 (91.7%)
863/1096 (78.7%)
Totals for 03/04 & 04/05
337/537 (62.5%)
344/543 (61.2%)
462/522 (88.4%)
487/533 (91.4%)
1630/2135 (75.7%)
Station completion rates (# completed vs. # assigned) by region and cruise for the 2003/2004 and 2004/2005 surveys.
The most successful method to obtain stations free of fixed gear was by working tow-by-tow and one-on-one with fishermen. However, given that the strata covered such a large area, hundreds of fixed gear fishermen needed to be contacted, and it was logistically impossible to do so. Therefore, the areas with the highest concentrations of fixed gear (e.g., Mohegan island, southern Maine, and Massachusetts Bay) were the primary areas of focus for one-on-one contact.
26
4.2.2 Survey Timing Completion rates for cruise five (mid November – December) were the lowest and most problematic out of all the cruises. In addition to fixed gear, high concentrations of fish were present within the strata. The presence of high concentrations of fish increased the tow processing times, and because the survey was only conducted between ½ hour before and ½ hour after sunrise and sunset, the limited daylight hours available for surveying restricted the number of tows that could be successfully completed per sampling day.
4.2.3 Federal Contract Scheduling Conducting the survey is a major undertaking and commitment for both the primary contracted state agency, and the sub-contracted survey vessels. In order to be successful in achieving the targets for each cruise and the overall goals of the survey, the vessels are required to be fully committed to the survey and have flexible schedules during the times of the year that the survey is conducted. To do this, the vessels must know well in advance (usually in the beginning of the groundfish management fishing year, May 1st) of their required commitment for the following survey period beginning in November. During the contract period, information about contract extensions, or lack there of, was given ‘last minute’, causing serious scheduling problems for the fishermen. The processing time of the contracts was also too drawn out. For example, in between the first and second contract extension, MarineFisheries was forced to pay for six months’ worth of expenditures before being reimbursed from NMFS. Uncertainty of the future of the project and confusion with the project’s end dates complicated the management of the project as well. This impacted MarineFisheries ability to effectively manage the program and the ability of the vessels to properly plan, costing them income.
4.2.4 Final Report Writing Post survey data processing from the final cruise, cleaning and storing equipment, repairing nets and gear, and compiling and writing a final report requires several months. Sufficient time was not available to complete these tasks prior to the end date of the contract.
4.2.5 Maine Permitting One unforeseen obstacle to implementing the survey was the process required for re-issuance of the state of Maine permits for the sampling platforms. Due to an unexpected procedure for public notification, the permit re-issuance was delayed for several weeks. In addition, several thousand dollars were required to comply with the state’s requirements for mailings and outreach. Their procedures and requirements differed from year to year and adversely affected the survey schedule.
27
4.3 ADDITIONAL WORK NEEDED The cod survey is a pilot program and remains “work in progress”. This study has enormous potential and if developed into a long-term study, managers, scientists, and fishermen would be anticipated to benefit from the data collected during the survey. Some of the potential additional work that could be undertaken is discussed below, while some recommended survey improvements are described in section 5.4.
4.3.1 Food Habits for GOM Cod Collection for prey composition and energetic information was initiated the final cruise of the survey. The stomachs were preserved and analyzed during down times of the survey. Because only one cruise of data was collected, the data were limited; however, these data could provide a good basis for future studies. At the end of the contract, approximately 790 stomachs were collected and analyzed. Although this process was not included in the original scope of work, this task was incorporated into the samplers’ workload and did not compromise daily station completion rates.
4.3.2 Individual Weights for GOM cod Measuring individual weights (whole and eviscerated) for the development of a length-weight relationship and condition factor for Atlantic cod was conducted during the final cruise of the survey. Although preliminary, the work could be expanded upon.
4.3.3 Increase Resolution in Areas of Abundance The cod IBS was designed to measure spatial/temporal changes in cod distribution in the inshore waters of the GOM. However, the survey does not have sufficient stations to characterize cod in some localized areas of high abundance. Enhancement of resolution in these areas during times of historic abundance would facilitate comparing these areas throughout the strata.
4.3.4 Habitat Information Having the ability to correlate catch rates to habitat type and unique physical features is valuable information for both fishery scientists and managers. An advanced seabed classification system is capable of collecting this information. Once initiated, the system is capable of electronically collecting data in the background while survey tows are conducted. The unit is interfaced with the vessel’s sounder (if compatible) and a PC that is capable of quantifying substrate and bottom type. The system uses Roxanne technology and analyzes the second echo of the vessels sounder. Each substrate and bottom type is assigned a value that is stored both graphically on plotting software and numerically in a log. These data can be analyzed spatially or in correlation with trawl catch rates throughout the survey area. Preliminary work was done during the 2005 survey and demonstrated one aspect of the survey that could be enhanced.
28

4.3.5 Fisheries Scientific Computing System (FSCS) FSCS is a state-of-the-art digital data collection and information management system that can capture all critical data as survey catches are processed (i.e. species identification, catch weight, fish length, fish weight, sex ratio, reproductive maturity, and stomach content data), thereby providing near real-time stock assessment input data. The advantages to using the system in the cod IBS could be the elimination of the need to record information on paper logs which is inefficient, includes transcription errors, and expensive. The system is designed to improve efficiency on deck, data quality, tracking fish sampling protocols, and minimize data processing time. The initial set-up cost is high, but would significantly enhance survey data collection and processing.
4.3.6 Survey Trawl Reference Manual A survey trawl reference manual is an invaluable tool that could be developed for the cod IBS. Creating a manual would entail survey participants, scientists, and the survey’s contracted net builder to work with subcontracted gear specialists that have extensive knowledge of survey trawls and access to technical equipment. Below is a description of a manual that was supplied from Marine Institute/CSAR, Department of Fisheries and Oceans Canada:
Collecting data for population abundance surveys in a harsh environment, where the survey tool is away from direct visual observation, is often a difficult task. Added to this task, is the bias and variance that may be attributed to the survey trawl from human, environmental and gear performance issues. Knowing that the survey trawl is constructed in the same manner and out of the same material consistently is essential, thus the calibration and standardization of survey trawls is essential. A Survey Trawl Reference Manual is used by the fisheries scientific community to ensure that from one tow to the next, from year to year the survey trawl that is used for resource stock assessment has not been altered. A survey trawl reference manual is made up of three sections: a) trawl plans, b) a parts list and c) checklist. Trawl Plans Trawls plans can be further broken down into four smaller sub sections, 1) trawl profile and rigging, 2) trawl body, 3) footgear and 4) component drawings. Detail drawings are used in each section to elaborate on construction techniques used in trawl manufacture and footgear fabrication. Parts List A parts list is used to identify each component that is used in the survey trawl and it’s rigging through the use of a part number. The parts list provides a means of allowing the research vessel’s crew to communicate effectively to the purchasing department, whose
29
knowledge of survey trawls is usually limited. The list will indeed be useful in the procurement of the individual trawl parts. Checklist A checklist provides a means of ensuring the specifications of the trawl and its rigging are maintained throughout the survey. The checklist fills two valuable functions: it provides the measurer with a systematic guide ensuring nothing is overlooked and that a record of mensuration is kept. It is most useful for the vessel crew in maintaining survey gear standardization.
During the cod IBS fishermen and net builders were heavily relied on to inspect, rig and repair the nets to ensure net standardization. To enhance the ability to standardize the survey trawl nets, the development of a survey trawl reference manual would be beneficial for the cod IBS. This would not only add more credibility to the survey data, but will facilitate scientists, fishermen, and net builders before, during and after the survey.
30

5 EVALUATION
5.1 OBJECTIVES THAT WERE ATTAINED To summarize, the primary objective of the survey was to provide information on the seasonal distribution of cod within the GOM within 5 periods (November-December, January-February, Late February-early March, late March-April, and early April-May) and to characterize the length distribution and age structure of GOM cod during these periods, with the latter two objectives as secondary. The first was to provide information on the age/length structure during current rolling closure areas (November, April-May) when fishery-dependent data are unavailable, and the second was to provide information on the seasonal distribution of other groundfish within the GOM and to provide length frequency information where data was sufficient. As evident with the results that were presented in Section 4, the above three objectives were accomplished during the contractual period.
5.2 ADDITIONAL OBJECTIVES THAT WERE ATTAINED During the IBS Technical meeting on July 19, and 20, 2005, several “secondary objectives” or additional objectives were identified. These objectives were not new to the cod IBS, but more a clarification of the purpose of the survey. Note the distinction between primary, secondary, and additional objectives described in Section 5.1 and objectives listed above. The survey design was based on the primary objectives and the secondary or “additional” objectives were only addressed as resources allowed. IBS workshop additional objectives:
To collect information or provide data for other purposes including: • Help in the identification of Habitat Area of Particular Concern (HAPC) for cod. • To assist in the review of Experimental Fishing Permits (EFP) relative to other research
on cod spawning. • Identification of other species composition (e.g. GOM haddock). • Provide biological samples for other species at special requests. • Provide information regarding marine-protected areas (e.g., Stellwagen Bank Sanctuary)
Although the survey was a single species survey directed towards cod, it took advantage of the opportunity to sample the entire catch collecting information that supported the above additional objectives. The additional objectives have been met and, where it applies, data are in master data within the SVDBS database on the WHOI/SUN server. The objective to provide biological samples for other species at special requests has also been met. Several individuals and organizations have utilized the survey to collect ancillary information and biological samples (Table 7).
31

Table 7. Ancillary data collection
Institution Principal Investigator Sample Purpose
UMASS-Amherst Nikolai Klibansky cod ovaries
Fecundity study on GOM Atlantic cod
University of Maine Robert Lore cod otoliths
Comparative analysis with archaeological samples from Native American sites in southern Maine
Boston University Les Kaufman tissue samples and fin clips
Stable isotope analysis and DNA and RNA/DNA ratios on Atlantic cod and haddock
NOAA / NEFSC Paul Nitschke winter flounder
Fecundity study of Massachusetts / Cape Cod Bay winter flounder
Mass. Div. Of Marine Fisheries Brad Chase rainbow smelt
Fecundity study of rainbow smelt
University of New Hampshire David Berlinsky cod fin clips
Atlantic cod DNA population study
UNH, SMAST / UMASS, NE Cod Tagging Program, American Littoral Society
Hunt Powell cod tag recapture information
Migratory patterns of Atlantic cod
32

5.3 SURVEY MODIFICATIONS Working to create an optimal survey for GOM cod, several modifications to improve the survey design for cod IBS were evaluated. These modifications were created and evaluated by both MarineFisheries and a design subcommittee that was created in August 2004 during the IBS workshop. Before being adopted, all modifications to the survey were presented to the IBS implementation committee and/or IBS technical committee for review and approval. These modifications are discussed below.
5.3.1 Maturity Sampling Beginning in fall 2004 (cruise code: 2465, cruise number: 5), the survey improved the sampling protocol for cod maturity collection. To obtain a more accurate estimate of maturity at length for each station, the initial protocol (1 per 3cm and all over 80cm) was revised to 1 per 3cm < 40cm; 3 per cm > 40cm; and all over 80cm. Cod maturity data for tow by tow spatial analysis for the 2003/2004 survey were insufficient. Pooling stations within geographic blocks was required to get a spatial estimate of maturity at length throughout the entire timeline of the survey. These data were presented on August 19, 2005 to the PDT for use in characterizing the time/area of spawning for cod. This resolution of data was acceptable for use in evaluating rolling closures as described in section 4.1.1.
5.3.2 Vessel Calibration, Depletion Tows
Other areas of improvement were evaluated during the contract period. Two more modifications the IBS design subcommittee was tasked to evaluate were vessel calibration and the need for depletion tows. The IBS design committee recommended the following in the June 26, 2005 report:
“Tasks: a) Evaluate the number of tows necessary for vessel calibration. Identify variables that can be standardized to minimize vessel effects. b) Evaluate the number of necessary for depletion studies. Also consider the limitations of not including calibration or depletions tows.” “a) All vessels within each IBS survey have similar horsepower and tonnage. Gear mensuration for the cod IBS suggests little difference in net behavior among vessels. Similarly, Alaska surveys use multiple commercial vessels, but focus on standardized protocols rather than calibration. One idea proposed at the workshop was to compare the three cod IBS vessels to one standard vessel rather than all six pair-wise comparisons. Given the main objectives of the IBS (distribution and demographics), the subcommittee considered this issue to be important (e.g., spatial analyses will assume constant sampling efficiencies), but not a priority issue. Therefore, quantitative analyses were not completed for this report. b) There was general consensus at the workshop that neither calibration nor depletion tows would be cost-effective (i.e., would take away from vessel time for survey tows), but the Workshop requested a cost-benefit analysis. The committee felt that this issue could best be addressed with a review of sample sizes and effectiveness of previously conducted depletion and calibration studies.
The catchability issue is important if the goal is abundance estimation, either relative or absolute; but if our goal is more biological relative to differentiating distributions of cohorts with respect to closure areas, then net mensuration is cost effective. In the absence of depletion or calibration studies, the cod IBS data cannot be used to estimate absolute stock size.”
33

Survey objectives do not include estimating abundance on either a relative or absolute scale. However, the IBS design subcommittee determined that calibration and/or depletion experiments are not cost-effective, and are not necessary to meet the objectives of the survey.
5.4 PROPOSED SURVEY IMPROVEMENTS
5.4.1 Temporal Strata/Rolling Closure The survey was designed to assist cod management, specifically in characterizing cod within the groundfish rolling closures and therefore some of the primary utilities of the survey were:
• To describe and compare relative abundance of mature and juvenile cod within identified blocks with respect to seasonal closures,
• Provide information on the distribution of cod with respect to seasonal closures, and • Describe the spatial-temporal distribution and maturity condition of cod within the
constraints of the survey design (by 30-minute rolling block for the 03/04 survey and by station after the sampling protocol was improved for the 04/05 survey (Section 5.3.2)).
Unfortunately, the survey had limitations when being used to evaluate the rolling closures because the months of the survey did not directly correspond with the timing of the rolling closures, which have changed since the design of the survey. The rolling closures in the GOM when the survey was designed are shown in Table 8, and rolling closures in effect when the survey was implemented are shown in Table 9.
Table 8. Rolling closures in effect during the design of the survey
Block Number Months 121-123: March/April, October/November 124-125: January (if triggered), February/March/April, October/November 129-133: April/May 136-138: May 139-140: May/June
141-147, 152: June Cashes Ledge: July/August/September/October, November (if triggered)
34

Table 9. Rolling closures in effect just prior to implementation of the survey
Block Number Months 121-123: March/April 124-125: April/May, October/November 129-131: April/May 132-133: April/May/June 136-138: May/June 139-140: May/June
141-147, 152: June Cashes Ledge: Year round
The survey sampled closures occurring in November, January, February, March, April and May. The October and June closures were not sampled and therefore data that could be used for evaluation of the rolling closures are not available for this time period. Note that fishery independent sampling occurs in October (NEFSC survey, Maine-New Hampshire trawl survey) and June (Maine-New Hampshire trawl survey). Sampling coverage in June does not occur in the southern part of the inshore GOM; however, based on the surveys that cover the remaining portion of the GOM, sufficient information may be able to make inferences on the distribution/demographics of cod in June and October. To meet the objective of sampling during the June and October rolling closures, a sixth cruise would have to be incorporated into the temporal strata design. This improvement to the strata would allow the survey to cover the full span of the rolling closures (October, November, January, March, April, May, and June). Adding a sixth cruise would accomplish the secondary objective of sampling during the rolling closures without compromising the current sampling intensity or spatiotemporal strata. Comparisons with previous surveys, cruises and areas would allow for an evaluation of all rolling closure areas. The disadvantage of this option would be the financial encumbrance of adding another cruise to the survey. In Table 10, the temporal strata, number of calendar days, and sea days are shown as an example of a six-cruise survey.
Table 10. Temporal strata and number of sea days for a six-cruise survey
Cruise Number Start Date End Date Calendar Days Sea Days1 1 10/7 11/18 43 44 2 11/19 12/31 43 48 3 1/1 2/12 43 44 4 2/13 3/27 43 40 5 3/28 5/9 43 36 6 5/9 6/21 43 32 Totals 258 244
1Number of allocated sea days vary to compensate for the amount of daylight available during each cruise.
35

5.4.2 Strata Enhancement
During the development of the survey design, industry recommended that the depth be limited to 60 fathoms thus covering the “inshore” GOM. During the first year of the survey, cod catch rates of adults were low during the winter period within the 60 fathom line and adult cod were presumed to be distributed outside the survey sampling area. The survey was revised to sample to 75 Fathoms by reallocation of survey tows. It was acknowledged that the survey may not cover the entire range of cod in the GOM during the February cruise. The IBS design subcommittee examined this issue and concluded in a report that was submitted to the IBS technical committee on June 26, 2005 that:
“The prospect of extending the cod IBS to deeper water was evaluated. The additional number of tows required to increase the depth coverage of the cod IBS was examined. In 2004-2005, approximately 20 grid tows were added and 30 industry tows to increase the depth limit from 60 fathoms to 75 fathoms, but cod IBS cannot go deeper without increased funding or at the cost of industry-selected tow locations. The table below shows the additional number of grid tows by cruise needed to expand the survey to deeper water. The number of additional grid tows is proportional to the area of additional depth strata. The number of expected industry tows is based on the difference between the fixed 225 tows per cruise and the expected number of grid tows. Industry tows are presented as percentage of industry to total tows. Increasing the spatial coverage of the survey to 90 fathoms, while limiting each cruise to 225 total tows, requires reducing the number of industry tows to approximately 19%. The benefit of increasing spatial coverage needs to be evaluated against the cost of reducing industry tows by the design and implementation committees.”
Extending the range of the survey beyond 75 fathom would provide more comprehensive coverage of the cod distribution, but would require more funding or a change in the current allocation of stations (less density of samples). If the survey resolution was decreased, the ability to compare data from a consistent survey design across years would be negatively impacted and compromise the high-resolution objective of this survey.
5.4.3 Cruise Logistics The April 2002 report specified that an average 5 tows per day (minimum of 4 stations per day, with possible 6-7 stations per day depending on proximity and weather) were to be completed during the survey. As mentioned in section 2.1.4, the number of sea days assigned to the vessels per cruise was altered to compensate for the difference in daylight hours throughout the survey season. This change in design allowed the boats to better utilize their time and more efficiently sample the selected stations (Table 2).
5.5 DISSEMINATION OF PROJECT RESULTS As described in detail in Section 2.4.3, an outreach plan was developed for the survey, not only to make commercial fishermen aware of the survey activities, but to provide all interested parties (state and federal managers and scientists, commercial fishing industry, and general public) with results of the survey. Data are available via state and federal websites. Mailings and list-serv e-mails have been sent with details of the survey and information regarding where survey results can be found. Presentations have also been given to regulatory and industry related groups Section 4.1.1.
36

5.5.1 GIS-Based Website The GIS-based website is a useful tool that was created for the purpose of dissemination of information about the cod IBS and its results. This website was developed and completed under a contract held by ME DMR. The website was designed to allow fishermen, managers, scientists, and the general public to access specific summary data and create maps for the industry-based surveys. The website provides the public an opportunity to view and categorize survey data by species composition, length frequency, and location and year of survey tows. Data from 11 cruises (i.e. both the 2003/2004 and 2004/2005 survey and the additional cruise that was completed in the fall of 2005) is in master format and currently available by the website. The website can be found at: http://www.nero.noaa.gov/StateFedOff/coopresearch/.
37