

European legislation on the management of biowaste - Dutch Waste
Implementing and optimising
separate collection of biowaste: the Italian way to tackle operational and
economic issues
Enzo Favoino
Scuola Agraria del Parco di Monza

Development of source separation
of biowaste in the EU
Obligations for biowaste management
NL: compulsory schemes for separate collection
AUT: obligation upon households to either take part in separate collection or to compost in the backyard
GER: KrW-AbfG separate collection widely diffused
Catalunya (Spain): ley 6/95 compulsory for all Municipalities with a pop. > 5000 (recently extended to cover all Municipalities)
SK (Act 24/04): Garden Waste to be separately colelcted by 2006; biowaste by 2010
Targets
SWE: 35% composting target
ITA, UK: recycling targets acting as drivers
65% separate collection targeted in Italian Env. Act
In separate collection, what
does “OPTIMISED” mean?
High captures
Good quality (low % of impurities)
Avoid increase of waste arisings
Allow for cost optimisation
Contribute to fulfilling diversion targets of the Landfill Directive

Kerbside (door-to-door) collection
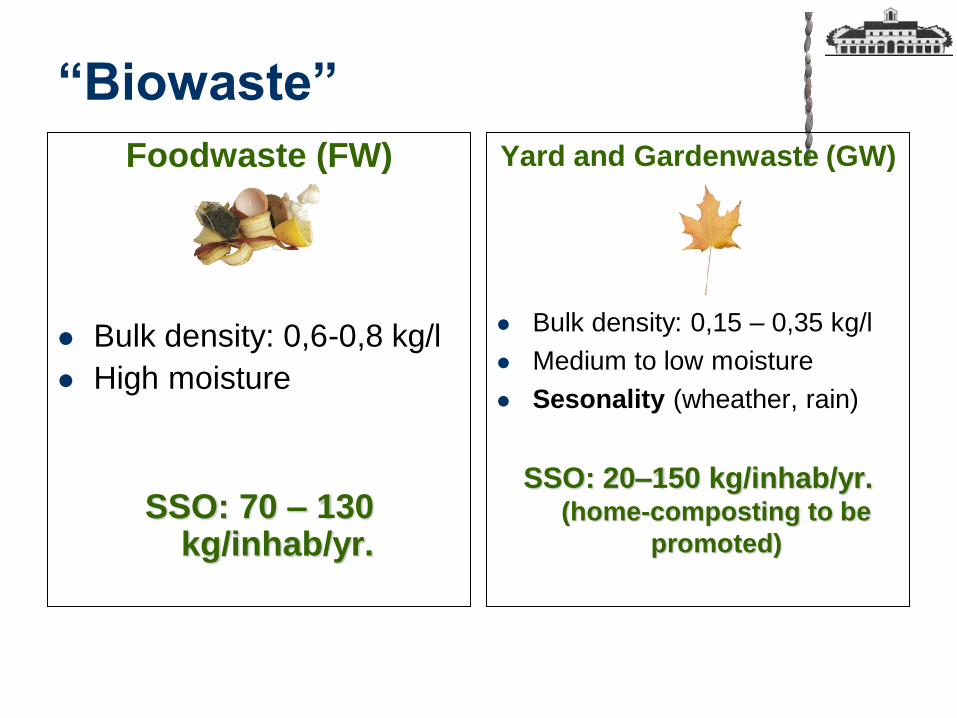
“Biowaste”
Foodwaste (FW)
Bulk density: 0,6-0,8 kg/l
High moisture
SSO: 70 – 130 kg/inhab/yr.
Yard and Gardenwaste (GW)
Bulk density: 0,15 – 0,35 kg/l
Medium to low moisture
Sesonality (wheather, rain)
SSO: 20–150 kg/inhab/yr. (home-composting to be
promoted)


Biobins (carts) for food waste –
some issues
The use of biobins may imply high deliveries of garden waste
Bins require mechanical loading
Low density implies adoption of expensive packer trucks – or high costs for transport
Reduced frequency of collection is therefore considered to save money
This impairs captures of food waste – fairly high percentages in residual waste
5
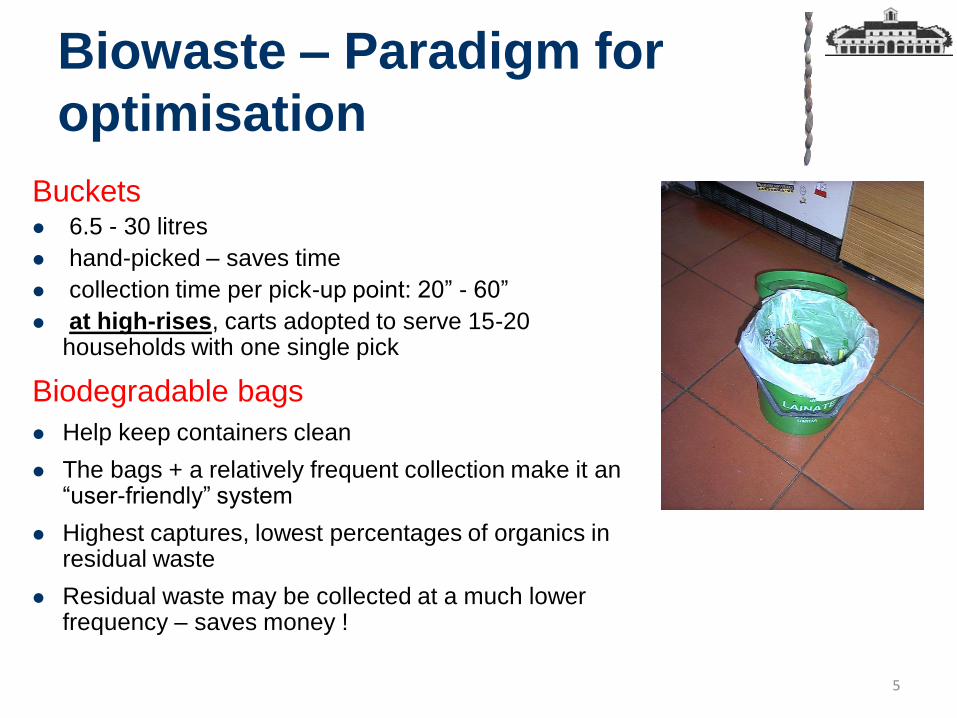
Biowaste – Paradigm for
optimisation
Buckets 6.5 - 30 litres
hand-picked – saves time
collection time per pick-up point: 20” - 60”
at high-rises, carts adopted to serve 15-20 households with one single pick
Biodegradable bags
Help keep containers clean
The bags + a relatively frequent collection make it an “user-friendly” system
Highest captures, lowest percentages of organics in residual waste
Residual waste may be collected at a much lower frequency – saves money !

Food waste in residual waste
Municipality % Food waste
Altivole 7,82
Arcade 8,24
Breda di Piave 7,61
Casale sul Sile 9,42
Castello di Godego 8,05
Cessalto 6,30
Conegliano 9,40
Cornuda 7,19
Giavera del Montello 6,88

Intensive SS of foodwaste
at detached houses

Intensive SS of foodwaste
at high-rises

Collection of garden waste
at Civic Amenity Sites (Municipal
Recycling Centres)
at the doorstep
less frequent than food waste
lower cost, higher participation in home
composting programmes

9
Best Recycling Municipalities,
pop < 10,000 inhabitants

10
Province capitals
(larger towns, with high-rise buildings)

Florianopolis october 28, 2010 Patrizia Lo Sciuto 14
Salerno
150,000 inhabitants
Separate collection= 75 %
Organics 50% !
Slide by Enzo Favoino

Milan Metropolitan Area
www.compost.it

Municipality of Milano -
Primaticcio district
Collection done mainly with non-
compacting vehicles
Transport to AD/composting plant done
with packer-trucks
Collection of foodwaste done 2/week
Most HH live in flats and high-rise building
Restaurants, canteens, etc served 2 to 4
times/week
www.compost.it


Results:
Capture of foodwaste: Foodwaste from 23kg/inhab/yr (large producers only) 90 kg/inhab/yr
Residual 140kg/inhab/yr
Purity of foodwaste from sep. collection: average non-compostable content 2,7% (worst case 5%)
Plastics (non-bags) content: about 30% of non-compostables
Plastic bags about 7-20% of non-compostables
www.compost.it

Captures (kgs/person.wk)
1,08
1,46
1,591,66
1,46 1,49
1,80
1,681,75
1,82
0
0,5
1
1,5
2
26/11 -2/12
3/12 -9/12
10/12 -16/12
17/12 -23/12
24/12 -30/12
31/12 -6/1
07/01 -13/1
14/01 -20/1
21/01 -27/1
28/01 -03/2
KG/abitante

4-7 November

Costs of MSW management –
some general remarks
Increased cost of disposal
Landfill Directive
Incineration Directive + IPPC
Anyway cost of collection may by itself be comparatively low – similar to commingled MSW collection
Savings on disposal

ITALIA NORD VENETOCONSORZIO
TVTRECONSORZIO
PRIULA
COSTO PROCAPITE (€/ab.*anno)
€ 131,00 € 117,90 € 99,00 € 96,00 € 95,50
% RACCOLTA DIFFERENZIATA
31% 45% 53% 66% 78%
€131,00
€117,90
€99,00 €96,00 €95,50
31
%
45
%
53
%
66
%
78
%
0%
10%
20%
30%
40%
50%
60%
70%
80%
90%
€ 0
€ 20
€ 40
€ 60
€ 80
€ 100
€ 120
€ 140
€ 160
€ 180
Italia, Nord e Veneto: dati 2006 (fonte Rapporto Rifiuti 2007 APAT - ONR)Consorzio Priula e Consorzio TvTre: costi dati 2008 - % RD stima anno 2008
% ra
ccol
ta d
iffe
renz
iata
cost
o pr
ocap
ite

INFA-VHE report (Germany, 2004)
Mixed MSW Residuals Biowaste R+B Difference to mixed MSW
Rural area
kg/inhab/y 220 130 100 230 5%
coll/week 1 0,5 0,5 1
coll/cost (€inhab/y) 9,4 5,93 4,63 10,56 12%
treat./cost (€/inhab/y) 27,5 16,25 6 22,25 -19%
treat./cost (€/t) 125 125 60
total cost (€/inhab/y) 36,9 22,18 10,63 32,81 -11%
Urban area
kg/inhab/y 270 225 50 275 2%
coll/week 1 0,5 0,5 1
coll/cost (€(inhab/y) 17,88 14,56 5,27 19,83 11%
treat./cost (€/inhab/y) 33,75 28,13 3 31,13 -8%
treat./cost (€/t) 125 125 60
total cost (€/inhab/y) 51,63 42,685 8,27 50,96 -1%

Cost optimisation (Lombardy, pop. 10M, 1500 Municipalities)
Cost of collection (green bars) and cost of treatment/disposal (blue bars)
Euro
/pers
on
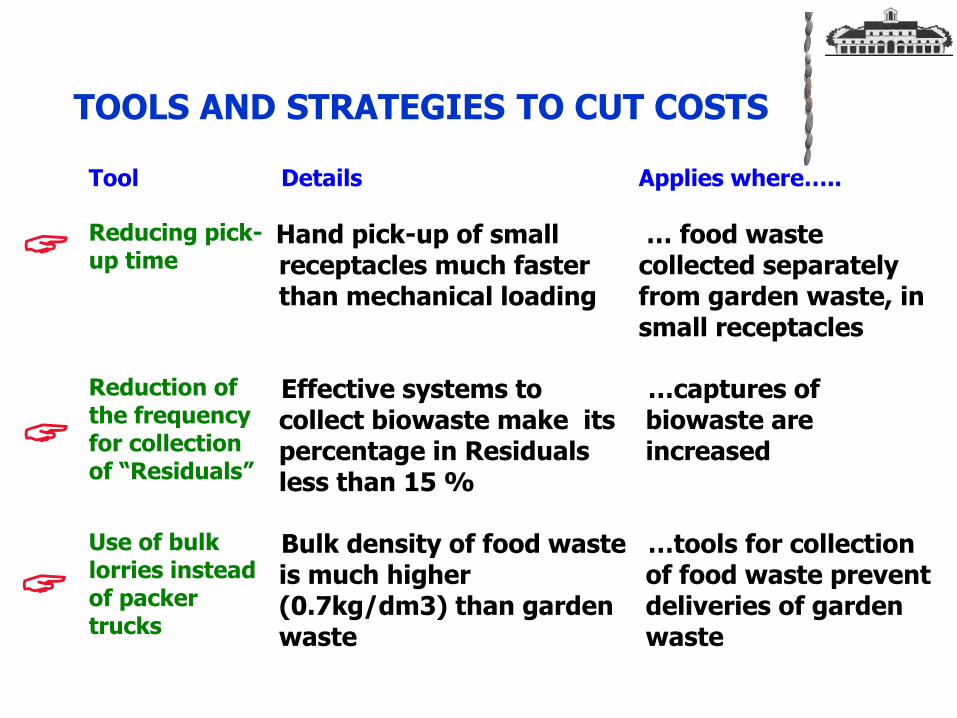
TOOLS AND STRATEGIES TO CUT COSTS
Tool Details Applies where…..
Reducing pick-up time
Hand pick-up of small receptacles much faster than mechanical loading
… food waste collected separately from garden waste, in small receptacles
Reduction of the frequency for collection of “Residuals”
Effective systems to collect biowaste make its percentage in Residuals less than 15 %
…captures of biowaste are increased
Use of bulk lorries instead of packer trucks
Bulk density of food waste is much higher (0.7kg/dm3) than garden waste
…tools for collection of food waste prevent deliveries of garden waste