Implementation of Green Technology Policy in Malaysia · PDF file7 December 2015. 1 (Paris) I....
46
I Implementation of Green Technology Policy in Malaysia by Datuk Loo Took Gee, Secretary General, Ministry of Energy, Green Technology & Water Malaysia
Transcript of Implementation of Green Technology Policy in Malaysia · PDF file7 December 2015. 1 (Paris) I....

7 December 2015(Paris)1
I
Implementation of Green Technology Policy in Malaysiaby
Datuk Loo Took Gee,Secretary General,
Ministry of Energy, Green Technology & Water Malaysia

2
Content
1. Background;
2. National Green Technology Policy
3. Rationale for Low Carbon Community;
4. Elements & Enablers of Low Carbon Community;
5. Malaysia’s Initiatives Towards Low Carbon Community;
6. Fiscal Incentives as an Enabler for Low Carbon Community;
7. Challenges in Developing Low Carbon Communities; and
8. Way Forward.

(1) Background
Emission Reduction Target 40 % reduction of carbon
intensity per GDP /capita by 2020
3
“…Malaysia is adopting anindicator of a voluntary reductionof up to 40 per cent in terms ofemissions intensity of GDP (grossdomestic product) by the year2020 compared to 2005 levels…”
MALAYSIA’S PLEDGE TOWARDS GLOBAL GHG EMISSION REDUCTION

Progress on GHG Emission Reduction
Emission Reduction Target 40 % reduction of carbon
intensity per GDP /capita by 2020
4
“I am pleased to be able toannounce that by the end of2015, Malaysia is projected tohave achieved a reduction inthe greenhouse gas intensity ofGDP of 35 percent.”
United Nations Climate Summit (2014)
IGEM 2015 Opening
Ceremony(2015)
Malaysia had already reducedthe emissions intensity of itsGDP by more than 33% despitefacing difficulties in fulfilling thepledge made in Copenhagen 6years ago.

(2) National Green Technology Policy
Emission Reduction Target 40 % reduction of carbon
intensity per GDP /capita by 2020
5
Policy Statement
Green Technology shall be a driver to accelerate the national
economy and promote sustainable development
NATIONAL GREEN TECHNOLOGY POLICY
(was launched in July 2009)

(2) National Green Technology Policy (cont.)
Emission Reduction Target 40 % reduction of carbon
intensity per GDP /capita by 2020
6
“Green technology is thedevelopment and application ofproducts, equipment andsystems used to conserve thenatural environment andresources, which minimizes andreduces the negative impact ofhuman activities”
CRITERIA OF GREEN TECHNOLOGY:o It minimizes the degradation of the environment;o It has a zero or low green house gas (GHG) emission;o It is safe for use and promotes healthy and improved
environment for all forms of life;o It conserves the use of energy and natural resources;
ando It promotes the use of renewable resources.
ENERGYSeek to attain energy independence and to
promote efficient utilisation
ENVIRONMENTConserve and minimise
the impact on environment
ECONOMYEnhance the national
economic development through the use of
technology
SOCIALImprove the quality of
life for all
NATIONAL GREEN TECHNOLOGY POLICY

Global Scenario Current global population is 7 billion and more than
50% of the world population live in cities today; UN estimates 5 billion urban residents (mostly in
Asia & Africa) by 2030; and Cities generate >40% global GHG.
Malaysia’s Scenario Malaysia’s urban population will rise to 82 percent of
its total population expected 32.4 million in 2020. (source: World Bank).
7
(3) Rationale for Low Carbon Community

Energy
Technology
Water & Waste
Management
Finance
(4) Elements and Enablers for Low Carbon Community
Elements
Enablers
Transport
Sustainable Consumption & Production
Policy Instruments
Public Awareness
8

(5) Malaysia’s Initiatives Towards Low Carbon Community
9

TRANSFORMING THE ENERGY SECTOR
10

Economic Indicators (2015)Population 30.03 million
Area 330,290 sq km
GDP RM1,070 billion
GDP Growth 6.0%
Per capita income RM33,875
Energy Resources (2013)Oil 5.9 billion barrel
Gas98.315 Trillion Standard Cubic
Feet(TSCF)
Coal 1.94 billion metric tonne
Hydro 20 GW11

12
Renewable Energy (RE)

► In 2014, the total RE capacity worldwide is 1,829 GW.► The highest RE source is hydropower. However, it had reduced
from 93% in 2000 to 64 % in 2014 due to the rapid growth in solar and wind energy.
Global Outlook of Renewable Energy
Souce :IRENA Capacity Statistic 2015
13

Background
►RE was introduced in the Five Fuel Policy (2000) with a target of 5% of RE inthe energy mix by 2005.►The initiative will be continued through the 11th Malaysia Plan.►With the introduction of the National Renewable Energy Policy and Action Plan(2010), the Feed-in Tariff is being implemented for biogas, biomass, mini hydro,solar PV and geothermal.
Way Forward
►Wind and Geothermal mappings are undertaken to identify the potentials ofnew RE sources.►Net Energy Metering (NEM) and Utility-scale Solar (USS) will be implementedto boost RE development.
Outlook of RE in Malaysia
14

15
RE targets in Malaysia
Year Cumulative RE Capacity
RE Power Mix (vs Peak Demand)
Cumulative CO2 avoided
2020 2,080 MW 11% 42.2 mt
2030 4,000 MW 17% 145.1 mt

16
Achievement of Feed-in Tariff (till 31 October 2015)

ENERGY EFFICIENCY
17

ENERGY EFFICIENCY POLICY DIRECTION
to ensure productive use of energy and minimizewaste in order to contribute to sustainabledevelopment and increased welfare and nationalcompetitiveness
OBJECTIVE OF ENERGY EFFICIENCY
18

19
1996-2000• Energy efficiency promotion in the Seventh Malaysia Plan
1999
• Malaysian Industrial Efficiency Improvement Programme(MIEEP)
2001
• Fiscal incentives for EE • Development of Malaysian Standard MS 1525
2002
• Capacity building in the Energy Commission and related key institutions on energy efficiency and Demand Side Management
National Initiatives in Encouraging EE

20
2002•Energy audit on government buildings •EE and RE in education curriculum and university courses
2006• Development of EE guidelines for Malaysian Industries
2008• Efficient Management Of Electrical Energy Regulations
2009• Green Building Index (GBI)
2013• Minimum Energy Performance Standards (MEPS)
National Initiatives in Encouraging (EE)- cont.
21
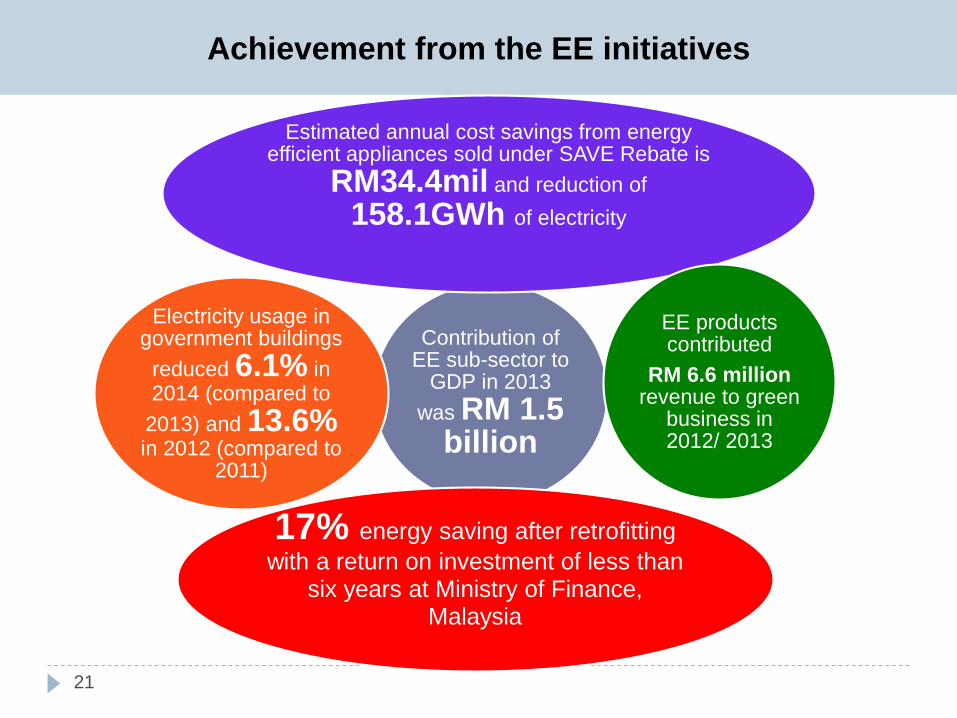
Achievement from the EE initiatives
Contribution of EE sub-sector to
GDP in 2013 was RM 1.5
billion
Estimated annual cost savings from energy efficient appliances sold under SAVE Rebate is
RM34.4mil and reduction of 158.1GWh of electricity
EE products contributed
RM 6.6 million revenue to green
business in 2012/ 2013
17% energy saving after retrofitting with a return on investment of less than
six years at Ministry of Finance, Malaysia
Electricity usage in government buildings
reduced 6.1% in 2014 (compared to
2013) and 13.6% in 2012 (compared to
2011)

One of the main game changers pursued under the11th Malaysia Plan is embarking on green growth.
Under this game changer, one of the focus areas thatthe government is emphasising on adopting is thesustainable consumption consumption and productionconcept.
EE UNDER THE 11th MALAYSIA PLAN (2016-2020)
22

EE UNDER THE 11th MALAYSIA PLAN (2016-2020)
23

• Identify potential improvements and appropriateapproaches to ensure efficient use of energy in buildings,industries and households.
• These measures include increasing competencies ofenergy service providers, especially Registered ElectricalEnergy Managers, and promoting the implementation ofEnergy Performance Contracting for governmentbuildings.
24
EE UNDER THE 11th MALAYSIA PLAN (2016-2020)

EE INITIATIVES UNDER RMKe-11
Government BuildingsEnergy Audit + Retrofit
(2016-2020)
Large Industrial BuildingsEnergy Audit(2016-2018)
Large Commercial BuildingsEnergy Audit(2016-2018)
Shared cost of Energy Audit between Government & Private
Sectors as an incentive for Private Sectors to pursue
retrofit program
Energy Audit And Energy Management in :
Energy Audit, Retrofit And Energy Management in :
25

26
EE UNDER THE 11th MALAYSIA PLAN (2016-2020)RMK11-Expanding demand side management measures*
Buildings• Achieve 700 Registered Electrical Energy
Manager (REEM)• Extend Energy Performance Contracting (EPC)
to other government buildings• All new government buildings to adopt energy
efficient design• Retrofit 100 government buildings
Industries• Introduce Enhanced Time of Use (e-ToU) with
three different time zones• Abolish Special Industrial Tariff (SIT)• Install 4 million smart meters• Increase on-grid co-generation capacity of 100
MW or more by reviewing utility standby charges

Energy labelling and the availability of standardssuch as ISO 50001 for buildings and MEPS forappliances will be promoted.
Introduction of Enhanced Time of Use (eTOU) tariffscheme and gradual abolishment of the SpecialIndustrial Tariff for energy intensive industries.
27
EE UNDER THE 11th MALAYSIA PLAN (2016-2020)

28
TRANSFORMING THE BUILDING SECTOR

29
National Initiatives in Greening the Building Sector•Green Building Tools/ Guides in Malaysia
No. Green Building Tools/ Guides Description1. Low Carbon Cities Framework &
Assessment System (LCCF)• Launched in 2011by Ministry of Energy,Green Technology and Water, Malaysia;
• Objectives of LCCF are(i) to encourage & promote the concept of
low carbon cities and townships inMalaysia;
(ii) to increase the compatibility ofcities/townships with their local naturalsystem;
(iii) To guide cities in makingchoice/decisions towards greenersolutions.
Achievements (till Nov 2015)-CO2 baseline calculated for 8 sites-Project Briefs completed for 6 sites

30
National Initiatives in Greening the Building Sector•Green Building Tools/ Guides in Malaysia (cont.)
No. Green Building Tools/ Guides
Description
2. Green Building Index (GBI) • Launched in 2009
• The index is based on criteria which are:
(i) energy & water efficiency;(ii) Indoor environmental quality;(iii) Usage of recyclable & environment
friendly material; and(iv) adoption of new technology.
• Achievement (till 15/10/2014):- 334 buildings certified (152 million sqft)- 0.73 MtCO2eq of emission reduction by
GBI certified buildings

31
National Initiatives in Greening the Building Sector•Green Building Tools/ Guides in Malaysia (cont.)
No. Green Building Tools/ Guides Description
4. Malaysian Carbon Reduction and Sustainability Tool
(MyCREST)
• currently being developed to be proposedas the National Green Rating Tool;
• tool for sustainable building rating systemwhich aims at quantifying, reducing builtenvironment’s impact in terms of carbonemissions and environmental implication;
• Integrating socio-economic considerationsrelating to the built environment and urbandevelopment.
• Takes into account a more holistic lifestyleview of the built environment; and
Design Construction Operation & Maintenance

32
TRANSFORMATION IN THE TRANSPORT SECTOR

CONFIDENTIAL 338/10/2014
Positioning Malaysia as the ‘Electric Mobility Marketplace’ in the region
Key EV marketsRight-hand drive (RHD) markets:Population 1.8 billion (47.9 million new cars registered annually; Malaysia: 600,000 per annum)
08/10/2014
National Initiatives in Greening the Transport Sector•Electric Mobility
33

CONFIDENTIAL 3508/10/2014
100,000 electric cars100,000 electric motorcycles
2,000 electric buses125,000 charging stations
Malaysia’s Targets for Electric Mobility by 2020
National Initiatives in Greening the Transport Sector•Electric Mobility (cont.)
• Reduction of emission by 0.6 mil tonnes CO2• Reduction fuel subsidy cost by 25%, estimated at
RM0.1 bill by 2020• Enhancement of economic growth: expected
RM328 mil investment by 2020• Reduction of healthcare cost from better
environmental condition
EXPECTED OUTCOMES
35

36
No. of Electric Cars:
120No. of Electric Bikes:
1,144
No. of EV Charging Stations:
41
No. of Hybrid Cars:
43,256
National Initiatives in Greening the Transport Sector•Energy Efficient Vehicles
CURRENT SCENARIO (till October 2015)
Revenue from Green Transportation in
2012/2013
RM 2.4 billion
36

37
National Initiatives in Greening the Transport Sector•Electric Mobility Blueprint
Ministry of Energy, Green Technology & Water isdeveloping the Electric Mobility Blueprint which focuses onthree key areas namely:
i. Electric Mobility in Public Transport - encourages deployment
of electric buses to complement existing LRT and MRT networks,
as well as new BRT routes. The first BRT line in Malaysia has
began operating in 2015 using all electric buses;
ii. Electric Mobility Eco System - addresses the charging
infrastructure, backend software, and the issues related to private
ownership of electric cars and electric motorcycles;
iii. Electric Mobility Economy

38
SUSTAINABLE CONSUMPTION AND PRODUCTION

MyHIJAU Industry & SMEs
Sustainable Consumption
MyHIJAU Mark
MyHIJAU Directory
MyHIJAU Procurement
Sustainable production
39
National Initiatives towards Sustainable Consumption and Production•MyHIJAU Programme

40
No. of products received SIRIM
Ecolabel
490
No. of products received SPAN Water Efficient Label Product
Scheme197
No. of products received Energy Rating Label
Scheme
1,418
National Initiatives towards SustainableConsumption and Production (cont.)
•Progress of MyHijau Mark Programme

41
DescriptionYear
2010 2011 2012 2013 2014 2015
Total Business Leads Reported
RM1.2 billion
RM1.6billion
RM1.3 billion
RM 0.5 billion
RM 1.9 billion
RM 1.9 billion
A platform to showcase innovative & creative green technology services, eco-products and initiatives
IGEM 2016
Date: 5-8 October 2016Venue: Kuala Lumpur Convention Centre
National Initiatives towards Sustainable Consumption and Production (cont.)
•International Greentech and Eco Products Exhibition & Conference

42
FISCAL INCENTIVES AS AN ENABLER FOR LOW CARBON
COMMUNITY

Projection of CO2 emission reduction by GTFS projects:
2.67 MtCO2e/yr
No. of green jobs created from GTFS projects:
3,018 jobs43
(6) Fiscal Incentives towards Low Carbon Community•Green Technology Financing Scheme
Total loan amount of RM 3.5 billion for producers (max RM 50 million) and users of green technology (max RM 10 million)
with 2% interest subsidy by the government & 60% government guarantee
RM2.37 billion has been disbursed till October 2015

a) Lack of funding to implement low carbon actions at cities;
b) Slow buy-in of the concept of Low Carbon Community
from the State and Local Authorities due to lack of
understanding and awareness;
c) Most cities lack credible GHG Inventory or a
comprehensive Blueprint to systematically implement &
monitor low-carbon actions; and
d) Short of expertise/ skills/ human capacity in areas such
as the low carbon cities concept.44
(7) Challenges in Developing Low Carbon Communities

a) Public-Private Partnership to encourage privateorganizations/ city developers to assist local councilsin building low carbon cities;
b) Formulation and implementation of attractive,innovative incentive schemes and tax-reliefs atmunicipality level;
c) Increasing awareness among the stakeholders;
d) Encouraging universities/ research Institutes to assistcities in conducting GHG inventory based on existinggreen tools;
45
(8) Way Forward

e) Mainstreaming green initiatives into the current
development processes (eg. government green
procurement, LCCF etc.); and
f) Encouraging research and commercialization of green
technology.
46
(8) Way Forward(cont.)