Impacts of the Invasive White Perch on the Fish … · largemouth and striped bass were primarily...
147
Impacts of the Invasive White Perch on the Fish Assemblage of Kerr Reservoir, Virginia by Johnathan Lee Harris Thesis submitted to the Faculty of the Virginia Polytechnic Institute and State University in partial fulfillment of the requirements for the degree of Master of Science In Fisheries and Wildlife Sciences APPROVED: B.R. Murphy, Chair J.J. Ney S.L. McMullin C.A. Dollof V.J. DiCenzo April 28, 2006 Blacksburg, Virginia Keywords: White perch, Striped bass, Largemouth bass, Crappie, Predation, Competition
Transcript of Impacts of the Invasive White Perch on the Fish … · largemouth and striped bass were primarily...

Impacts of the Invasive White Perch on the
Fish Assemblage of
Kerr Reservoir, Virginia
by
Johnathan Lee Harris
Thesis submitted to the Faculty of the
Virginia Polytechnic Institute and State University
in partial fulfillment of the requirements for the degree of
Master of Science
In
Fisheries and Wildlife Sciences
APPROVED:
B.R. Murphy, Chair
J.J. Ney
S.L. McMullin
C.A. Dollof
V.J. DiCenzo
April 28, 2006
Blacksburg, Virginia
Keywords: White perch, Striped bass, Largemouth bass, Crappie, Predation, Competition

Impacts of the Invasive White Perch on the
Fish Assemblage of Kerr Reservoir, Virginia
by
Johnathan L. Harris
ABSTRACT
The white perch (Morone americana) is a highly successful invader of freshwater
systems, with negative consequences to some resident fishes. White perch are ovivores and may
prey upon as well as compete with juvenile sportfishes. Since 1988, an introduced population of
white perch has proliferated in the 19,790-ha Kerr Reservoir, NC-VA, potentially threatening
popular sport fisheries for largemouth bass (Micropterus salmoides), crappie (Pomoxis spp.), and
self-sustaining striped bass (Morone saxatilis). Trophic relationships between white perch and
resident sportfish were examined in the Kerr Reservoir system to determine the white perch’s
impact on them.
Striped bass eggs were found in the stomach contents of white perch collected from the
Roanoke River during their concurrent spawning runs in May, and at times egg predation was
intense (frequency of egg occurrence in white perch individuals up to 100 %). However,
modeling simulations indicated that observed densities of white perch in the Roanoke River
during the peak spawning period of striped bass (May) were too low to have a substantial effect
on striped bass recruitment. Crappie eggs were found in the diets of white perch collected from
Kerr Reservoir during April, but the significance of this predation was not determined.
Trophic overlap (Schoener’s Index) was high (> 0.5) between age-0 white perch and age-
0 crappie, largemouth bass, and striped bass in June, but only remained high between white
perch and crappie in the remainder of the growing season (July – September). After June,

largemouth and striped bass were primarily piscivorous, whereas white perch and crappie
remained primarily invertivorous. Trophic overlap was high between adult white perch and adult
crappie (> 0.6), but not between white perch and any other species of adult sportfish.
The utilization of white perch by adult piscivores (Ictalurids, Pomoxis spp., Moronids,
and Percids) as a food source was low (< 2% of diets by weight). Piscivorous sportfish primarily
ate clupeids, which are highly abundant in Kerr Reservoir.
Analysis of sportfish performance before (1974 – 1987) versus after (1996 – 2005) white
perch establishment indicated no change in abundance and growth of striped bass and
largemouth bass. Performance data for crappie prior to white perch introductions were
unavailable, but observed egg predation by and trophic overlap with white perch suggests that
crappie have the highest potential to suffer deleterious interactions with the white perch.
Abundance of white bass has significantly declined in years since white perch introductions.
Future research in Kerr Reservoir should concentrate on interactions between white perch and
these two species.
iii

ACKNOWLEDGEMENTS
First and foremost, I would like to thank my major advisor, Dr. John Ney, for giving me
the privilege to collaborate with him on this project. Dr. Ney’s humor and expertise in fisheries
ecology provided an entertaining and invaluable graduate experience, and his mentorship has
helped to make me a better fisheries biologist and most importantly a better person. I would also
like to express my gratitude to the other members of my graduate committee (Dr. Brian Murphy,
Dr. Steve McMullin, Dr. Andy Dollof, and Mr. Vic DiCenzo) whose suggestions helped to
create an overall better project.
Secondly, I wish to give thanks to The Virginia Department of Game and Inland
Fisheries (VDGIF), Federal Aid in Sportfish Restoration, and The Department of Fisheries and
Wildlife Sciences at Virginia Tech for their financial support. Also, a special appreciation is
extended to The Buggs Island Striper Club, whose letters of support to VDGIF were a significant
reason this project was funded.
Various VDGIF biologists and employees provided critical support and technical advice
during my research. Vic DiCenzo was lead biologist working with me on this project, and I
thank him for all his help and valuable guidance. I also wish to express my appreciation to Dan
Michaelson, Tim Wood, Cory Kovacs, and Mike Isel for all their help with field collections.
Lastly, I thank VDGIF personnel at Vic Thomas State Fish Hatchery for providing me with their
knowledge on striped bass activity on the Roanoke River.
The assistance and counsel of numerous other people were crucial to the completion of
this study. I thank the technicians (Alton Temple, Brad Ray, Susanna Scott, Mike Leonard, and
Dave Ferguson) that worked with me in the field and laboratory. I express great gratitude to
Marcy Anderson, Jason Corrao, Greg Batts, Jamie Follin, Mike Duncan, Dennis Brown, Josh
iv

Milam, Tony Milam, and members of The Buggs Island Striper Club for volunteering their time
helping me with field collections. Additional thanks are given to Marcy Anderson, Brad Ray,
and Jamie Roberts for their editorial advice. I would like to thank Scott Klopfer for creating the
maps presented in this thesis. I express my gratitude to Linda Boothe, Rosemary Ellis, Jesse
Sherman, and Ramona Shaver for their clerical support on this project. Last, but certainly not
least, I wish to thank Todd Elder and everyone at Ridgeway Farms for giving me a place to stay
during my spring collections in the Roanoke River and for their generous hospitality during my
time on the farm.
Most importantly, I give a great thanks to my friends and family, who have been there
for me during this lengthy process. I would especially like to thank Jacob Rash and John
Kilpatrick for their guidance through the graduate process at Virginia Tech and for all their
encouragement. Finally, my mother and grandmother have been my biggest supporters
throughout my life, and I am extremely grateful for having them behind me every step of the
way.
v

TABLE OF CONTENTS
INTRODUCTION......................................................................................................................... 1 White Perch Biology and Ecology.............................................................................................. 5
Distribution ............................................................................................................................. 5 Food Habits ............................................................................................................................ 6 Age and Growth ...................................................................................................................... 7 Spawning and Reproduction ................................................................................................... 8
Goal and Objectives.................................................................................................................... 9
STUDY SITE ............................................................................................................................... 11 METHODS .................................................................................................................................. 15
Age and Growth Analysis......................................................................................................... 15 Objective 1: Predation.............................................................................................................. 16
Field Collection .................................................................................................................... 16 Food Habits .......................................................................................................................... 19 Estimates of Total Egg Predation ......................................................................................... 22
Objective 2: Trophic Competition ............................................................................................ 26
Field Collection .................................................................................................................... 26 Food Habits .......................................................................................................................... 31 Diet Overlap.......................................................................................................................... 31
Objective 3: Sportfish Utilization of White Perch................................................................... 32
Field Collection .................................................................................................................... 32 Food Habits .......................................................................................................................... 33
Objective 4: Sportfish Performance.......................................................................................... 34
vi
VDGIF Historical Data Sets ................................................................................................. 34 Statistical Analysis.................................................................................................................... 36
RESULTS .................................................................................................................................... 39
Age and Growth Analysis......................................................................................................... 39 Objective 1: Predation.............................................................................................................. 39
Collection Results ................................................................................................................. 39 2004 Food Habits ................................................................................................................. 47 2005 Food Habits ................................................................................................................. 56 Estimates of Total Egg Predation ......................................................................................... 61
Objective 2: Trophic Competition ........................................................................................... 63
Collection Results ................................................................................................................. 63 Age-0 Crappie Food Habits.................................................................................................. 63 Age-0 Largemouth Bass Food Habits................................................................................... 66 Age-0 Striped Bass Food Habits........................................................................................... 70 Age-0 White Perch Food Habits ........................................................................................... 72 Diet Overlap.......................................................................................................................... 75
Objective 3: Sportfish Utilization of White Perch................................................................... 81
Collection Results ................................................................................................................. 81 Food Habits of Adult Sportfish ............................................................................................. 81
Objective 4: Sportfish Performance.......................................................................................... 86
DISCUSSION .............................................................................................................................. 90
White Perch Age and Growth ................................................................................................... 90 Predation ................................................................................................................................... 91
vii

Egg and Larval Predation by White Perch........................................................................... 91 Juvenile Fish Predation by White Perch .............................................................................. 97
Trophic Competition................................................................................................................. 98
Food Habits of Age-0 Fishes ................................................................................................ 98 Potential for Trophic Competition...................................................................................... 101
Sportfish Utilization of White Perch....................................................................................... 102 Sportfish Performance ............................................................................................................ 106
SUMMARY AND CONCLUSIONS ....................................................................................... 109 MANAGEMENT RECOMENDATIONS .............................................................................. 115 LITERATURE CITED ............................................................................................................ 118 VITA...........................................................................................................................................135
viii

LIST OF TABLES Table 1. Striped bass stocking history of Kerr Reservoir and the Roanoke River, Virginia from
1975-1997. .................................................................................................................. 13 Table 2. White perch sampling record for 2004 from Roanoke River in relation to peak
spawning period of striped bass.................................................................................. 20 Table 3. White perch sampling record for 2005 from Roanoke River in relation to peak
spawning period of striped bass.................................................................................. 21 Table 4. Detailed descriptions of 2004 and 2005 seining and electrofishing locations from the
Roanoke River side of Kerr Reservoir, Virginia. ....................................................... 27 Table 5. Detailed descriptions of 2004 and 2005 seining and electrofishing locations from the
Dan River side of Kerr Reservoir, Virginia. ............................................................... 28 Table 6. Distribution of sampling for age-0 fish over time and sites. .......................................... 30 Table 7. Statistical procedures used to analyze Kerr Reservoir data sets.................................... 38 Table 8. Calculated lengths of white perch at successive ages from Kerr Reservoir, Virginia.... 40 Table 9. Electrofishing collection numbers and relative abundances (CPUE) of white perch
obtained from the Roanoke River, Virginia during May of 2004............................... 44 Table 10. Electrofishing collection numbers and relative abundances (CPUE) of white perch
obtained from the Roanoke River, Virginia during May of 2005............................... 46 Table 11. Number, size, and method of capture for white perch collected from the upper end of
Kerr Reservoir, Virginia during the growing seasons of 2005 and 2005. .................. 48 Table 12. Frequency of occurrence (FOO) of striped bass eggs in the diets of white perch
collected from two locations within the Roanoke River, Virginia during the peak of striped bass spawning activity in 2004. ...................................................................... 52
Table 13. Daily accounts of striped bass egg predation by white perch collected from four
locations within the Roanoke River, Virginia during the peak of striped bass spawning activity in 2005. .......................................................................................... 58
Table 14. Projected population sizes of white perch required to consume various percentages of
striped bass (STB) eggs spawned in the Roanoke River, Virginia during the peak spawning period of May, 2005.. ................................................................................. 62
Table 15. Collection numbers of juvenile sportfish obtained from Kerr Reservoir, Virginia.. ... 64
ix

Table 16. Prey categories used in all Schoener’s Overlap comparisions between white perch x age-0 and adult sportfish from Kerr Reservoir, Virginia. Prey categories are listed by prey type...................................................................................................................... 76
Table 17. Diet overlap for age-0 sportfishes versus white perch collected in 2004 from Kerr
Reservoir, Virginia...................................................................................................... 77 Table 18. Diet overlap for age-0 sportfishes collected in 2005 versus white perch collected in
2004 and 2005 from Kerr Reservoir, Virginia............................................................ 79 Table 19. Diet overlap for adult sportfishes versus adult white perch collected in 2004 and 2005
from Kerr Reservoir, Virginia..................................................................................... 80 Table 20. Adult sportfish collected from Kerr Reservoir, Virginia in 2004 and 2005. ............... 82 Table 21. Frequency of occurrence (FOO) of white perch found in diets of adult sportfishes
collected in Kerr Reservoir, Virginia.......................................................................... 87 Table 22. Comparison results of Kerr Reservoir data sets in years prior to white perch
introduction (1979-1986) versus years after white perch establishment (1996-2004)...................................................................................................................................... 89
x

LIST OF FIGURES Figure 1. Map of Kerr Reservoir, Virginia/North Carolina ......................................................... 12 Figure 2. Map of the Roanoke River below Brookneal, Virginia, with locations of white perch
sampling sites in May 2004 and 2005......................................................................... 18 Figure 3. Map of the upper end of Kerr Reservoir, Virginia, 2004 and 2005 seining and
electrofishing locations for age-0 sportfishes and adult white perch.......................... 29 Figure 4. Monthly mean lengths of age-0 sportfish collected in 2004 from Kerr Reservoir,
Virginia ....................................................................................................................... 41 Figure 5. Monthly mean lengths of age-0 sportfish collected in 2005 from Kerr Reservoir,
Virginia ....................................................................................................................... 42 Figure 6. Length distribution of white perch collected throughout the Roanoke River, Virginia
during May of 2004 and 2005..................................................................................... 45 Figure 7. Diet composition of white perch collected throughout the Roanoke River, Virginia
during May of 2004 .................................................................................................... 49 Figure 8. Spatial occurrence of egg predation by white perch throughout the Roanoke River,
Virginia during May of 2004 ...................................................................................... 51 Figure 9. Temporal food habits of adult white perch collected from Kerr Reservoir, Virginia
during 2004 ................................................................................................................. 53 Figure 10. Percentage of fish by weight in diets of age-1 and older white perch collected from
Kerr Reservoir, Virginia. ............................................................................................ 54 Figure 11. Diet composition of white perch collected throughout the Roanoke River, Virginia
during May of 2005. ................................................................................................... 55 Figure 12. Spatial occurrence of egg and larval predation by white perch throughout the
Roanoke River, Virginia during the entire month of May, 2005................................ 57 Figure 13. Temporal distribution of food habits of adult white perch collected from Kerr
Reservoir, Virginia during 2005 ................................................................................. 60 Figure 14. Temporal patterns in food habits of age-0 crappie collected in 2004 and 2005 from
Kerr Reservoir, Virginia ............................................................................................. 65 Figure 15. Temporal patterns in food habits of age-0 largemouth bass collected in 2004 and
2005 from Kerr Reservoir, Virginia............................................................................ 67
xi

Figure 16. Size-dependent food habits of age-0 largemouth bass collected in 2004 and 2005 from Kerr Reservoir, Virginia..................................................................................... 69
Figure 17. Temporal patterns in food habits of age-0 striped bass collected in 2004 and 2005
from Kerr Reservoir, Virginia..................................................................................... 71 Figure 18. Size-dependent food habits of age-0 striped bass collected in 2004 and 2005 from
Kerr Reservoir, Virginia ............................................................................................. 73 Figure 19. Temporal patterns in food habits of age-0 white perch collected in 2004 and 2005
from Kerr Reservoir, Virginia..................................................................................... 74 Figure 20. Food habits of adult sportfish collected in Kerr Reservoir during 2004 .................... 83 Figure 21. Food habits of adult sportfish collected in Kerr Reservoir during 2005 .................... 84
xii

INTRODUCTION
Reservoirs present challenging problems for fishery managers because of their variable
ecological conditions (Summerfelt 1999). Most are built primarily for the purposes of
hydroelectric generation, flood control, and/or water storage rather than for a fishery. Because of
their design, reservoirs generally have limited littoral areas, steep depth contours, and water
fluctuations that limit productivity in littoral zones (Hayes et al. 1999). These systems are prone
to invasions of non-native species because resident riverine fishes may have a difficult time
establishing viable populations in systems with limited littoral zones. Consequently, fishery
managers often stock apparently suitable fish species to fill perceived vacant niches and meet
management objectives (Kohler et al. 1986). Non-native introductions can have a dramatic
effect on resident fish populations, creating instable and unpredictable environments (Magnuson
1976). In recent years, non-native species have been defined as “invasive” if their introduction
has the potential to cause environmental or economic harm (Clinton 1999). Invasions by non-
native species occur by many means other than agency stockings. Canal and river systems,
unauthorized angler stockings, and bait-bucket introductions are all channels for invasion of non-
natives (Li and Moyle 1999).
The white perch (Morone americana) is an invasive species that has steadily increased its
distribution throughout inland waters of North America. White perch are native to estuaries in
the Atlantic slope but beginning in the late 1880s, white perch have invaded inland waters in
north-Atlantic states (Zeurlein 1981), the Great Lakes (Boileau 1985), Nebraska (Hergenrader
and Bliss 1971), and mid-Atlantic states (Wong et al. 1999). White perch were introduced to
non-native waters by many means including voluntary and incidental agency stockings,
migration, and possible angler introductions (Jenkins and Burkhead 1993; Carlander 1997; Fuller
1

et al. 1999). White perch have become the most abundant species in many of these waters as a
result of their opportunistic feeding, broadcast spawning with no preference for substrate type,
and high fecundity (Wong et al. 1999).
Kerr Reservoir (Buggs Island Lake) is a 19,790-ha hydroelectric and flood control
impoundment in south-central Virginia that has a reputation for its largemouth bass (Micropterus
salmoides) and trophy crappie (Pomoxis spp.) fisheries. Kerr also features one of the few self-
sustaining landlocked striped bass (Morone saxatilis) populations. White perch populations have
been established in Kerr Reservoir since 1988 (Wilson 1997), probably through angler
introductions. In 2000, the white perch was the most abundant sportfish species collected in
Virginia Department of Game and Inland Fisheries’s (VDGIF) fall gillnet samples (N =711,
catch rate 15.0/net; VDGIF, unpublished). A small panfish fishery has even become established
for white perch in Kerr Reservoir (Wilson 1997; DiCenzo 2001), but there is concern that an
overabundance of white perch in Kerr Reservoir may produce a stunted population. Many
instances of stunting in white perch populations have been observed in other inland waters
(Hergenrader and Bliss 1971; Marcy and Richards 1974; Zeurlein 1981; Boileau 1985; Wong et
al. 1999).
White perch invasions can have dramatic negative effect on resident fish populations.
Drops in abundance of resident fishes have often followed white perch invasions (Hergenrader
and Bliss 1971; Zeurlein 1981; Boileau 1985; Gopalan et al. 1998; Wong et al. 1999; Madenjian
et al. 2000). Madenjian et al. (2000) found that the most plausible explanations for the reduction
of native white bass (Morone chrysops) populations in Lake Erie and Oneida Lake, New York
were that white perch interfered with the survival of white bass eggs, larvae, and/or juveniles. It
2

is likely that the mechanisms causing the declines in resident fish populations are white perch
competition and/or predation.
White perch are opportunistic feeders (Wong et al. 1999). Small white perch (<150 mm
TL) primarily feed on zooplankton and benthic invertebrates, the important foods of larval and
early stages of most age-0 fishes. Significant trophic overlap (> 0.6 on a 0-1.0 scale) has been
reported between age-0 striped bass and age-0 white perch in the lower James River and
Potomac Estuary, Virginia (Setzler-Hamilton et al. 1982; Rudershausen and Loesch 2000), age-0
yellow perch (Perca flavescens) and age-0 white perch in Oneida Lake, New York (Prout et al.
1990), and age-0 white bass, alewife (Alosa pseudoharengus), and yellow perch versus age-0
white perch in western Lake Erie (Gopalan et al. 1998). Larger white perch (>200 mm) have
been known to eat a variety of foods, including other fish species (Warner 1974; Elrod et al.
1981; Boileau 1985; Weisberg and Janicki 1990).
White perch are also known to be ovivores (Elrod et al. 1981; Bath and O’Connor 1985).
White perch have been documented eating the eggs of white perch and striped bass in the
Pamunkey River, Virginia (McGovern and Olney 1988); white perch, white bass, and walleye
(Stzostedion vitreum) eggs in the Sandusky River tributary of Lake Erie (Schaeffer and Margraf
1987); alewife eggs in Lake Ontario (Danehy et al. 1991); and walleye eggs in the western basin
of Lake Erie (Roseman et al. 1996). In addition, white perch have been found to feed on striped
bass eggs and larvae even in instances of high turbidity (McGovern and Olney 1988; Monteleone
and Houde 1992).
Although white perch can be detrimental to native fish populations, they can also provide
a valuable forage base for sportfishes. In their native, estuarine environment, white perch have
been important forage for striped bass over 200 mm TL (Gardinier and Hoff 1982), and age-0
3

bluefish (Pomatomus saltatrix) (Juanes et al. 1993). Hartman and Margraf (1992) found that
walleye in Lake Erie fed on Morone species (primarily white perch) when gizzard shad
(Dorosoma cepedianum) were not abundant. White perch constituted a seasonally important
food source for the white bass in Lake Erie throughout the summer (Hartman 1998). In Lake
Ontario, northern pike (Esox lucius) had substantial proportions of white perch in their diets two
years after white perch had become established (Boileau 1985). Piscivores that eat spiny-rayed
prey (such as largemouth bass) have also been shown to target white perch, when white perch
was the most abundant prey fish (Ward and Neumann 1998).
State biologists have speculated that white perch may be having a significant effect on
resident sport fishes in Kerr Reservoir. Indices of striped bass year-class strength were reduced
in the early 1990’s directly after the first white perch were found in Kerr Reservoir gillnet
samples (Wilson 1997). Since the establishment of white perch in Kerr Reservoir, anglers have
suggested that striped bass fishing is not as good as it used to be and requested supplemental
stocking of fingerings. Additionally, the adult white bass population has declined dramatically
since the establishment of white perch (V. DiCenzo, Virginia Department of Game and Inland
Fisheries, personal communication). The trophic significance of white perch on sportfish
communities in Kerr Reservoir is unknown, but the white perch’s reputation and performance
record leads to some concern. To determine the impact of white perch to the overall fishery of
Kerr Reservoir, it is imperative to gain an understanding of the trophic relationships between
white perch and resident sportfishes.
To assess the impacts of the white perch introduction into Kerr Reservoir, I conducted an
analysis of trophic benefits (utilization) and detriments (predation and competition) to resident
4

sportfishes. My research focused on the trophic interactions between white perch and resident
sportfishes, in particular striped bass.
White Perch Biology and Ecology
Distribution - The white perch is native to estuaries in the Atlantic Slope of North
America as far south as South Carolina (Jenkins and Burkhead 1993), and as far north as the
Miramichi River Estuary in New Brunswick (Johnson and Evans 1991). During the period
between 1880 and 1950, federal and state hatcheries established inland populations of white
perch in Maine, Maryland, Connecticut, New York, and Massachusetts (Zeurlein 1981).
After initial introductions, the white perch extended its western range by means of canals
and river systems. In the late 1940s, white perch became established in Lake Ontario from a
population in Oneida Lake, New York and in Lake Erie via the Erie Barge Canal (Scott and
Christie 1963). By 1983, populations were established in the Detroit River, Lake St. Clair, the
St. Clair River, and Lake Huron (Boileau 1985). By 1988, white perch populations had been
established in Lake Michigan, the Illinois River (Cochran and Hesse 1994), and more recently
have been found in the Upper Mississippi River System (Irons et al. 2002).
Before 1964, the western range of white perch distribution was the Great Lakes. In 1964,
white perch were stocked in Nebraska lakes by the Game and Parks Commission to establish
suitable fisheries in highly alkaline lakes (Hergenrader and Bliss 1971). From initial stockings,
white perch have established populations in the Platte and Missouri River systems (Hergenrader
and Bliss 1971). From Nebraska, the white perch has moved south into Oklahoma through the
Arkansas River system, and white perch have been recently found in Oklahoma reservoirs (K.
Kuklinski, Oklahoma Department of Wildlife Conservation, personal communication).
5

In Virginia, the white perch is indigenous to all of the coastal drainages below the Fall
Line (Jenkins and Burkhead 1993). By means of canal systems and possible stockings, the white
perch has colonized waters above the Fall Line in the Potomac, Roanoke, and York drainages
(Jenkins and Burkhead 1993). Inland waters of North Carolina have also experienced
establishment of white perch populations (Wong et al. 1999).
Food Habits - The white perch has a terminal mouth and a tongue with two narrow tooth
patches on the anterolateral margin for grasping prey items (Jenkins and Burkhead 1993). Larval
white perch (3-23 mm TL) first feed on micro-zooplankton (rotifers, cladocerns, and copepods)
(Setzler-Hamilton et al 1982). Hjorth (1988) found that white perch larvae are efficient
predators at a relatively small size, because they shift diets to smaller zooplankton prey when
abundances of larger, preferred zooplankton are low.
The diets of young-of-year and older white perch are very diverse, varying with spatial
and temporal availability of suitable prey. Young-of-year white perch feed on zooplankton early
in life, but soon shift to benthic invertebrates (Gopalan et al. 1998). In the James River, Virginia,
the diets of age-0 white perch up to 40 mm TL consisted primarily of copepods and leptodorids,
but diets shifted to mysids, insect larvae and pupae in white perch above 40 mm TL
(Rudershausen and Loesch 200). A similar diet shift at 40 mm TL (from copepods and daphnids
to amphipods and chironomids) was documented in the diets of age-0 white perch in Oneida
Lake, New York (Prout et al. 1990). Diets of white perch in the Richibucto Estuary, New
Brunswick shifted at 50 mm TL from copepods and amphipods to sand shrimp (Crangon
septenspinosa) (St-Hilaire et al. 2002).
Age-1 and older white perch are opportunistic, benthic feeders. Aquatic insects
(chironomids, trichopterans, and ephemeropterans), amphipods, isopods, and zooplankton
6

(cladocerns and copepods) all constitute seasonally important prey items for age-1 and older
white perch (Alsop and Forney 1962; Moore et al. 1975; Elrod et al. 1981; Zuerlein 1981;
Schaeffer and Margraf 1986; Weisberg and Janicki 1990; Danehy et al. 1991; Hurley 1992).
White perch also feed on the eggs of fish. White perch have been documented eating the eggs of
white perch (McGovern and Olney 1988), white bass (Schaeffer and Margraf 1987), alewife
(Danehy et al. 1991), freshwater drum (Aplodinotus grunniens), and walleye (Roseman et al.
1996). Schaeffer and Margraf (1987) observed that in the Sandusky River tributary of Lake Erie,
fish eggs constituted 100% (by volume) of white perch diets from May-June. In larger white
perch (>200 mm TL), fish constitute an important prey item. When the prey was abundant,
white perch have eaten gizzard shad (Schaeffer and Margraf 1986), other white perch, yellow
perch (Madenjian et al. 2000), shiners (Notropis spp.) (Schaeffer and Margraf 1987), and bluegill
(Lepomis macrochirus) (Zuerlein 1981).
Age and Growth - White perch prolarvae are approximately 3 mm TL, and postlarvae
(yolk and oil globule absorbed) are approximately 4 mm TL (Mansueti 1964). Scales develop on
white perch between 20 and 25 mm TL, after which most of the adult meristics are attained
(Mansueti 1964). White perch growth is greatest during the first two growing seasons and
decreases after age 3 (Alsop and Forney 1962; Marcy and Richards 1974; Zuerlein 1981).
Growth of white perch varies dependent on water body (Zuerlein 1981). In Nebraska reservoirs
(Zuerlein 1981) and in Oneida Lake, New York (Alsop and Forney 1962), white perch reached
230 mm TL by age 3. Comparatively, white perch did not reach 200 mm TL until age 4 in the
Lower Connecticut River (Marcy and Richards 1974), age 5 in the Fox River, Wisconsin
(Cochran and Hesse 1994), and age 7 in the Delaware River (Wallace 1971). In the tidal James
River, Virginia, mean length-at-age for white perch observed was 76 mm TL, age 1; 120 mm TL,
7

age 2; 149 mm TL, age 3; 172 mm TL, age 4; 189 mm TL, age 5; 204 mm TL, age 6; 220 mm
TL, age 7; 236 mm TL, age 8; 253 mm TL, age 9; 262 mm TL, age 10 (St. Pierre and Davis
1972). The maximum age of 17 and total length of 483 mm of a white perch was found in Maine
(Jenkins and Burkhead 1993).
Growth of white perch can also be density dependent. Stunting of white perch can occur
when population densities are high (Boileau 1985; Wong et al. 1999). When abundances
increased, mean length-at-age of age-1 white perch declined from 130 mm TL in 1966 to 112
mm TL in 1967 in Wagon Trail Reservoir, Nebraska (Hergenrader and Bliss 1971), and from 96
mm TL in 1959 to 69 in 1965 in the lower Connecticut River (Marcy and Richards 1974).
Spawning and Reproduction - In its native estuarine environment, the white perch is
semianadromous and spawns in the spring when water temperatures are between 10 and 16º C
(Mansueti 1961; Jenkins and Burkhead 1993). In Kerr Reservoir, this temperature range occurs
in May, the same month when the majority of striped bass spawn (Neal 1969). In landlocked
waters, white perch spawn in both river and reservoir areas, and migrate from deep to shallow
waters to spawn when temperature are between 15 and 20º C (Zuerlein 1981). White perch have
no preference for habitat types during spawning and egg deposition (Zuerlein 1981). Spawning
occurs in a 1- to 2-week period, with individual females expelling eggs on more than one
occasion (Mansueti 1961). Female white perch are oviparous, broadcasting demersal, adhesive
eggs to be fertilized externally (Mansueti 1961). White perch fecundity ranges between 20,000
and 150,000 eggs per individual female (Jenkins and Burkhead 1993).
White perch maturation is size-specific with males maturing at smaller sizes than females
(Mansueti 1961). In the Patuxent Estuary, Maryland, male white perch began maturing at 80
mm SL (50% mature by 100 mm SL), while females began maturing at 90 mm SL (50% mature
8

by 105 mm SL) (Mansueti 1961). In this same system, all males were mature by age 2 and all
females by age 4 (Mansueti 1961). Zuerlein (1981) found that male and female white perch
matured earlier (by age 1 with total lengths between 102-127 mm) in Nebraska reservoirs where
they exhibit rapid growth.
Goal and Objectives
Scientific evidence reveals that white perch can be detrimental to sportfish populations
when introduced to inland waters. Reported negative effects of the white perch are mostly due to
some form of predation and/or competition. However, it has also been reported that white perch
can add to the forage base for piscivorous fishes in these systems when less than ideal forage is
unavailable. My research focused on the trophic impacts, both beneficial and detrimental, of
white perch on pre-existing sportfishes (striped bass, largemouth bass, and crappie) in Kerr
Reservoir, Virginia. The study particularly focused on the impacts to striped bass. The Kerr
Reservoir self-sustaining striped bass population supports a very popular sport fishery, but there
is growing concern among striped bass anglers that the fishing success has decline. Anglers have
requested supplemental stockings of striped bass to improve the fishery. Specific biological data
to support a need for supplemental stockings have not as yet been developed, but the history of
the white perch provides many reasons for concern.
Findings from this study may also reveal important information on the effects of white
perch introductions to the community of fishery mangers and professionals. The range of the
white perch is extending rapidly, and climate warming may accelerate range expansion (Johnson
and Evans 1990). Fisheries personnel must recognize the effects on and changes to sportfish
communities after white perch invasions to minimize impacts. This study was one of the most
comprehensive investigations undertaken to date on the trophic interactions between white perch
9

and other sportfishes. The goal of this two-year study was to describe the trophic relationships
and assess impacts of white perch on the Kerr Reservoir sport fish community, especially striped
bass: Specific objectives were to:
1. Describe the intensity and extent of white perch predation on the eggs and larvae
of co-occurring sportfishes;
2. Evaluate the potential for trophic competition between white perch and age-0
sportfishes;
3. Quantify the contribution of white perch to the diets of piscivorous sport fishes;
and
4. Compare growth and abundance of sportfishes before and after white perch
establishment.
10

11
STUDY SITE
Kerr Reservoir is a 19,790-ha impoundment on the Roanoke (Staunton) and Dan Rivers
(Figure 1). The reservoir borders Virginia and North Carolina between Clarksville, Virginia and
Henderson, North Carolina. Kerr Dam was constructed in 1952 and is operated by the U.S.
Army Corps of Engineers for the purposes of flood control, hydroelectric generation, and water
supply. The eutrophic reservoir is highly dendritic with 1,287 km of shoreline, and it has an
annual water level fluctuation of approximately 5 m (Wilson 1997). The high water level
fluctuations limit the establishment of significant aquatic vegetation (DiCenzo 2001) and result
in severe shoreline erosion (Wilson 1997). The reservoir has a maximum depth of 32 m, a mean
depth of 10 m, a retention time of approximately 98 days, and a drainage area of 2,020,184 ha
(DiCenzo 2001).
Kerr Reservoir supports sport fisheries for blue catfish (Ictalurus furcatus), channel
catfish (Ictalurus punctatus), crappie, flathead catfish (Pylodicyis olivaris), largemouth bass,
striped bass, and walleye (Dicenzo 2001). The Kerr Reservoir crappie fishery is sustained by
populations of both black crappie (Pomoxis nigromaculatus) and white crappie (Pomoxis
annularis), but is dominated by black crappie (approximately 95% black crappie; V. DiCenzo,
Virginia Department of Game and Inland Fisheries, personal communication). For my study
black and white crappie were pooled for analysis, because anglers seldom differentiate between
the two species (Mitzner 1981; Maceina and Stimpert 1998; Isermann et al. 2002; Sammons et
al. 2002). The reservoir’s sportfish assemblage is supported by an abundance of available forage
fish populations including threadfin shad (Dorosoma petenense), gizzard shad, alewife, and
blueback herring (Alosa aestivalis). The reservoir is renowned for its largemouth bass and
trophy crappie fisheries. It also has one of the few self-sustaining landlocked striped bass stocks

Figure 1. Map of Kerr Reservoir, Virginia/North Carolina.
12
Year Location Size Class Number Stocked Year Location Size Class Number Stocked1953 Kerr Reservoir Fry 670,000 1987 Roanoke River fry 150,0001954 Kerr Reservoir Fry 500,000 Roanoke River Fingerling 5,1681955 Kerr Reservoir Fry 1,000,000 1988 Kerr Reservoir Fry 3,250,0001975 Kerr Reservoir Fry 476,548 Kerr Reservoir Fingerling 15,403
Kerr Reservoir Fingerling 76,631 Roanoke River Fry 100,000Roanoke River Fry 5,375,016 1989 Kerr Reservoir Fry 3,200,000
1976 Kerr Reservoir Fry 3,669,255 Kerr Reservoir Fingerling 9,624Kerr Reservoir Fingerling 239,751 Roanoke River fry 1,000,000
1979 Kerr Reservoir Fingerling 45,073 1990 Kerr Reservoir Fry 5,800,000Roanoke River Fry 13,773,000 Kerr Reservoir Fingerling 166,284
1980 Roanoke River Fry 18,700,000 Roanoke River fry 826,0001981 Kerr Reservoir Fry 7,500,000 1991 Roanoke River Fry 1,600,000
Kerr Reservoir Fingerling 77,000 1992 Kerr Reservoir Fingerling 45,600Roanoke River Fry 10,500,000 1993 Kerr Reservoir Fingerling 147,660Roanoke River Fingerling 175,000 1994 Kerr Reservoir Fingerling 161,523
1982 Kerr Reservoir Fry 3,425,000 1995 Kerr Reservoir Fingerling 750,000Kerr Reservoir Fingerling 53,300 1997 Kerr Reservoir Fingerling 14,330Roanoke River fry 13,440,000 1998 Kerr Reservoir Fingerling 535,323
1983 Kerr Reservoir Fry 12,350,000 Roanoke River fry 1,100,000Roanoke River Fry 740,000 1999 Roanoke River Fingerling 19,437
1984 Kerr Reservoir Fingerling 233,503 2000 Kerr Reservoir Fingerling 159,840Roanoke River Fry 1,650,000 2001 Kerr Reservoir Fingerling 33,721
1985 Kerr Reservoir Fry 4,200,000 2002 Kerr Reservoir Fingerling 287,847Roanoke River fry 950,000 2003 Kerr Reservoir Fingerling 369,945
1986 Kerr Reservoir Fingerling 67,620 2004 Kerr Reservoir Fingerling 339,304Roanoke River Fry 1,400,000 2005 Kerr Reservoir Fingerling 406,935
Table 1. Striped bass stocking history of Kerr Reservoir and the Roanoke River, Virginia from 1975-1997.
13

in North America (Neal 1969). Kerr Reservoir was originally stocked with striped bass fry
between 1953 and 1955 (Neal 1969), and it has been subject to periodic surplus fry and
fingerling stocking (Table 1). Since the initial stockings, successful striped bass spawns have
occurred annually (Neal 1969).
The Roanoke and Dan Rivers are the spawning grounds for Kerr Reservoir striped bass
(Whitehurst 1982). Striped bass spawning locations (upstream from Kerr) are 39-66 km in the
Roanoke River and 37-68 km in the Dan River (Neal 1969). Average annual flows are similar in
both rivers. The Roanoke had an annual average flow of 94 m3/s into Kerr, while the Dan had an
average annual flow of 80 m3/s into Kerr between the years of 1972 and 1975 (Weiss et al. 1978;
Whitehurst 1982). The Roanoke provides 103 km of unobstructed stream flow above Kerr
Reservoir, while the Dan provides 68 km of unobstructed flow with respective barriers at
Leesville Dam on the Roanoke River and Brantley Steam Plant on the Dan River (Whitehurst
1982).
For this study, all field sampling occurred in the Roanoke River and the upper end of
Kerr Reservoir (above the Route 58 Bridge). Sampling sites pursuant to each objective are
described in Methods.
14

METHODS
Extensive field collection and laboratory work were essential to the completion of this
two-year study. The first year of this study, 2004, was of value both for the data obtained and
refinement of adequate sampling arrangements and laboratory procedures. Because of the
knowledge gained in 2004, sampling and laboratory procedures were refined and intensified in
2005.
Age and Growth Analysis
Concerns regarding possible stunting and vulnerability to predation prompted analysis of
the length-at-age distribution of the Kerr Reservoir white perch population based on specimens
(N = 192) collected pursuant to project objectives. Because collected white perch were
sacrificed for diet analysis (described in project objectives), perch were aged using sagittal
otoliths to insure aging accuracy and precision (Devries and Frie 1996).
In the laboratory, otoliths were prepared and aged using a quick process. Otoliths were
lightly burned using an open flame to enhance annulus contrast in the opaque white perch
otoliths (Christensen 1964). After burning, otoliths were broken at the nucleus using a sharp
scalpel (Maceina 1988), because otoliths were too thick to age by whole-view methods. Broken
edges were polished using wetted, fine-grit sandpaper (600 grit) and dipped in immersion oil.
Polished edges of the posterior end of otoliths were viewed and aged under a compound light
microscope (40-100 x). Each otolith was read independently by two readers without knowledge
of perch total length (TL), and agreement between readers was greater than 95 %. In cases of
disagreement of age estimations between readers, otoliths were read a third time and assigned
congruent ages between readers.
15

Length-at-age of white perch was back-calculated using the direct proportion method
(Devries and Frie 1996):
Ln = Sn/Sc * Lc
where Ln is the length-at-age of white perch when a given annulus was formed, Sn is the
otolith measurement to the given annulus, Sc is the measurement to the edge of the otolith, and
Lc is the white perch total length (TL) at capture. The direct proportional method was used
because regressions of white perch body length-at-age versus otolith radius had intercepts at or
near the origin.
Additionally, patterns of first–year growth of white perch, crappie, largemouth bass, and
striped bass were described as mean TL by month for each species. Age-0 fishes were collected
pursuant to Objective 2.
Objective 1: Predation
Field Collection. - White perch were collected in the spring of 2004 and 2005 to quantify
the perch’s spring-time diet and determine whether they preyed on the eggs and larvae of Kerr
Reservoir sportfishes (primarily striped bass). White perch were obtained throughout the day
using pulsed-DC boat electrofishing (4-6 A, pulsed at a frequency of 120 pulses per second) in
the Roanoke River tributary of Kerr Reservoir. In each sampling day, shorelines and main
channels of the Roanoke River were sampled at each location where white perch were collected.
The Roanoke River rather than the Dan River was selected because of its numerous access
points. Due to controlled flow conditions, the greater numbers of viable striped bass eggs are
spawned in the Roanoke River (Whitehurst 1982). In each year, sampling started at the
beginning of May when surface water temperatures approached 18ºC, the temperature when
striped bass start spawning in the Roanoke River (Neal 1969).
16

17
White perch were collected from five locations within the Roanoke River throughout
May of 2004 and 2005. The most upstream location (Clarkton Boat Launch) was located
approximately 58 km above the backwaters of Kerr Reservoir (Figure 2), which were defined by
Whitehurst (1982). By collecting and ageing striped bass eggs from the Roanoke River during
the spawning period of striped bass, Neal (1969) and Whitehurst (1982) found that the mean
spawning site of striped bass was located just below Clarkton Boat Launch, around Turnip Creek
(48-55 km upstream of reservoir backwaters). The four other collection sites were located
approximately 39 km (Ridgeway Farms), 26 km (Watkins Bridge), 14 km (Route 360 Bridge),
and 0 km (Staunton View Boat Launch) upstream from the backwater of the reservoir (Figure 2).
All sites were selected for their proximities to boat launches and were distributed throughout the
river.
In the Roanoke River, striped bass spawn throughout May and early June, but the
majority of striped bass (approximately 80%; Neal 1969) spawn in a 1 to 2 week period in May
which I considered the peak striped bass spawning period. In each year, adult white perch
collection was concentrated at the four upriver sites prior to and during the peak striped bass
spawning period, to collect fish that had the potential to consume striped bass eggs. Directly
after the peak spawn, perch collection was concentrated in the most downriver site (Staunton
View Boat Launch), to obtain fish that had the potential to eat striped bass larvae entering the
reservoir. Through egg collections in the Roanoke River, Neal (1969) and Whitehurst (1982)
determined that the majority of striped bass eggs hatch between 360 Bridge and Staunton View
Boat Launch. Collection continued throughout the month of May, or approximately 16 days
after the peak spawn. Whitehurst (1982) found that striped bass eggs in the Roanoke River hatch
in two to four days, and in lab studies white perch predation on striped bass larvae declines
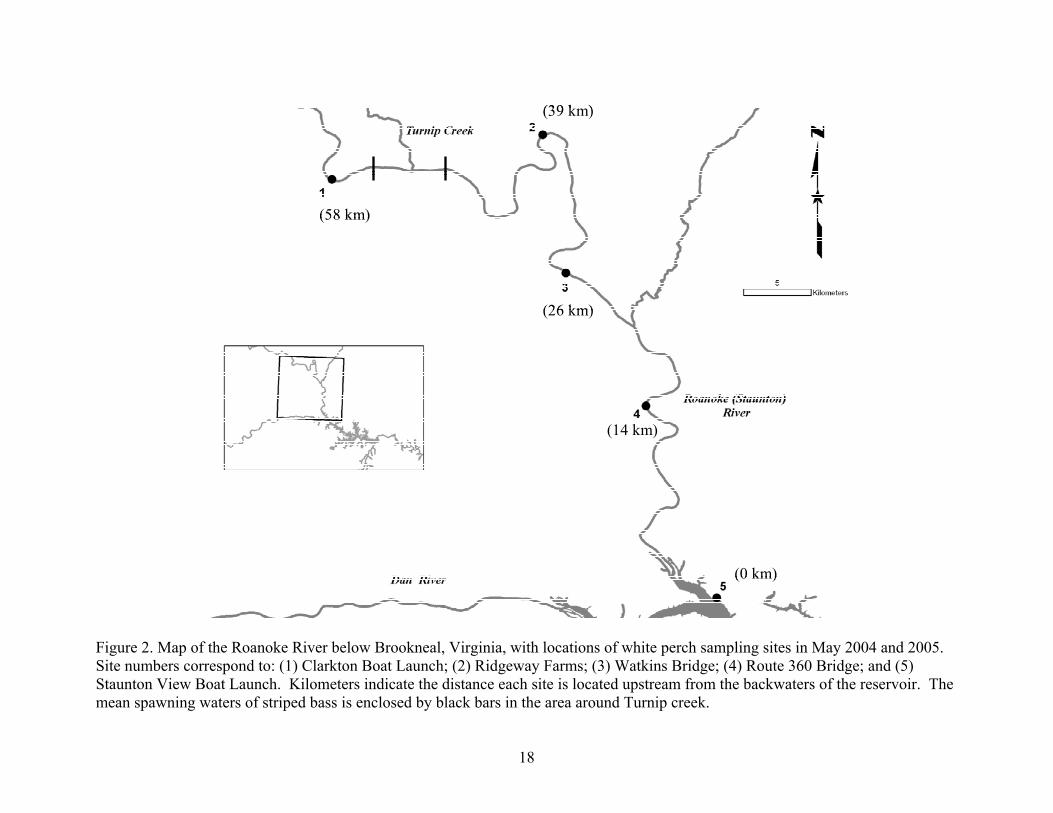
Figure 2. Map of the Roanoke River below Brookneal, Virginia, with locations of white perch sampling sites in May 2004 and 2005. Site numbers correspond to: (1) Clarkton Boat Launch; (2) Ridgeway Farms; (3) Watkins Bridge; (4) Route 360 Bridge; and (5) Staunton View Boat Launch. Kilometers indicate the distance each site is located upstream from the backwaters of the reservoir. The mean spawning waters of striped bass is enclosed by black bars in the area around Turnip creek.
(39 km)
(58 km)
(26 km)
(14 km)
(0 km)
(39 km)
(58 km)
(26 km)
(14 km)
(0 km)
18

sharply 12 days post hatch (Monteleone and Houde 1992). In 2004, white perch were only
collected on weekdays so collections would not interfere with anglers during that period, but
white perch collection were expanded to included weekend periods in 2005. A detailed account
of sampling in the Roanoke River relating to the peak striped bass spawn for 2004 and 2005 is
presented in Tables 2 and 3, respectively. A qualitative assessment of the peak striped bass
spawning period was determined through visual observations of striped bass spawning activity,
increased abundance of striped bass throughout the river, presence of striped bass eggs in the
water column of the river, and from communication with striped bass hatchery officials at Vic
Thomas State Fish Hatchery in Brookneal, Virginia who collect striped bass from the Roanoke
River during the spawning period.
Collected perch were immediately placed on ice. Due to the observation of partially
digested stomach contents in 2004, stomach (visceral) cavities of white perch collected in 2005
were injected with 10% buffered formalin at the time of capture using a 23-gauge hypodermic
needle to cease digestion (Emmett et al. 1982). At the end of each sampling day, white perch
were measured to the nearest 1 mm, and weighed to the nearest 1 g. Stomachs were removed
and preserved in a 10% formalin solution for further laboratory analysis. Additional samples of
white perch and their gut contents were collected pursuant to Objective 2 (June through
December) and in 2005 VDGIF spring trapnet surveys, during the period when other Kerr
Reservoir sportfish spawn. White perch were also collected during this time period to determine
their predation on the larvae, juveniles, and adults of Kerr Reservoir sportfish.
Food Habits. - Once in the laboratory, white perch stomach contents were analyzed for
the presence of eggs and larvae. Each stomach item was identified to the lowest practical taxon
using a dissecting microscope and keys for fish eggs and larvae. Striped bass eggs were
19
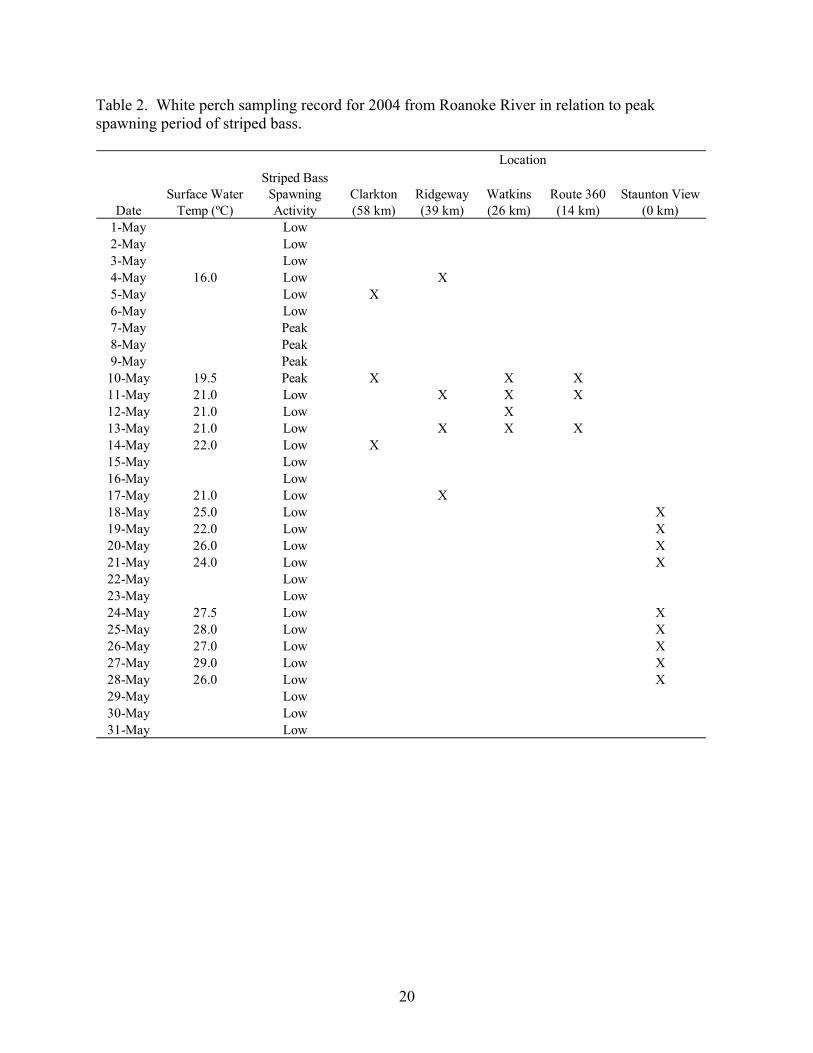
Table 2. White perch sampling record for 2004 from Roanoke River in relation to peak spawning period of striped bass.
DateSurface Water
Temp (ºC)
Striped Bass Spawning Activity
Clarkton (58 km)
Ridgeway (39 km)
Watkins (26 km)
Route 360 (14 km)
Staunton View (0 km)
1-May Low2-May Low3-May Low4-May 16.0 Low X5-May Low X6-May Low7-May Peak8-May Peak9-May Peak10-May 19.5 Peak X X X11-May 21.0 Low X X X12-May 21.0 Low X13-May 21.0 Low X X X14-May 22.0 Low X15-May Low16-May Low17-May 21.0 Low X18-May 25.0 Low X19-May 22.0 Low X20-May 26.0 Low X21-May 24.0 Low X22-May Low23-May Low24-May 27.5 Low X25-May 28.0 Low X26-May 27.0 Low X27-May 29.0 Low X28-May 26.0 Low X29-May Low30-May Low31-May Low
Location
20
Table 3. White perch sampling record for 2005 from Roanoke River in relation to peak spawning period of striped bass.
DateSurface Water
Temp (ºC)
Striped Bass Spawning Activity
Clarkton (58 km)
Ridgeway (39 km)
Watkins (26 km)
Route 360 (14 km)
Staunton View (0 km)
1-May Low2-May 17.2 Low X3-May 15.6 Low X X X4-May 15.6 Low X X5-May 17.8 Low X6-May Low7-May Low8-May Low9-May 17.8 Low X X10-May 17.8 Peak X X11-May 20.0 Peak X X X12-May 20.0 Peak X X X13-May 22.2 Peak X X X14-May 20.0 Peak X X15-May Peak16-May 20.0 Low X X17-May 20.6 Low X X18-May 22.2 Low X19-May 21.1 Low X20-May Low21-May Low22-May Low23-May 23.3 Low X24-May 21.7 Low X25-May 21.1 Low X26-May 21.1 Low X27-May 22.2 Low X28-May Low29-May Low30-May Low31-May Low
Location
21

distinguished from other eggs because of their large size and perivitelline space (Mansueti 1964).
Stomach items were then blotted dry and weighed to the nearest 0.001 g. To determine the
percent of white perch selecting eggs and larvae in their diet, frequency of occurrence (FOO)
was calculated (Bowen 1996). FOO was determined using the equation:
FOO = Ni/Nt,
where FOO is the percent of white perch selecting for food item i, Ni is the number of
white perch containing food item i in their stomach, and Nt is the total number of white perch
containing food.
To determine the relative importance of fish eggs and larvae in the diet of white perch,
percent contribution by weight (Hylsop 1980) of major diet items was calculated using the
equation:
%WTPi = ∑ (WTPi/WT)/N,
where %WTPi is the mean percent contribution by weight for prey item i, WTPi is the
weight of prey item i eaten by an individual white perch, WT is the total weight of all prey items
consumed by that white perch, and N is the total number of white perch sampled containing food
(Sutton 1997; Rash 2003). The percent-contribution-by-weight method suggests the relative
importance of individual prey items in terms of nourishment by quantifying prey items in
directly comparable weight units (Bowen 1996; Sutton 1997).
Estimates of Total Egg Predation. - The occurrence of striped bass egg predation is of
little importance without some quantification of how this predation affects the recruitment of this
species. It was not possible to estimate total consumption of striped bass eggs by white perch
directly, because the total number of white perch in the Roanoke River could not be determined.
As an alternate approach, I estimated the population sizes of white perch needed to consume
22
10%, 50%, and 90% of the annually produced striped bass eggs, and then evaluated whether the
resultant white perch abundance estimates were realistic from field collections of white perch.
Inputs needed for this approach were annual number of striped bass eggs spawned in the
Roanoke River, consumptions rates of white perch, and diet composition of white perch.
Egg estimates were derived from a comprehensive study of striped bass in the Roanoke
River from 1976 to 1979, which was the most current study on eggs production of striped bass in
the Roanoke River. Whitehurst (1982) estimated striped bass egg production by two methods:
(1) egg collections in the Roanoke River; and (2) population estimates of female striped bass and
average fecundity in the Roanoke River. Only egg production estimates from the egg collections
were used for this study, because the population estimate method often produced much higher
estimates of egg production, probably due to the assumption that all ovarian eggs were spawned.
Further, egg production estimates using the egg collection method were similar in magnitude to
those from previous studies on striped bass egg production in the Roanoke River (Neal 1969;
Neal 1976). Throughout the Whitehurst (1982) study, 1976-79, egg estimates ranged from
1,509,533,243 to 5,015,570,772 eggs produced annually, with an average yearly production of
3,068,024,698. To account for annual variability, two scenarios of egg production were
modeled: (1) worst-case scenario of egg production (1,509,533,243 eggs); and (2) average
annual egg production (3,068,024,698 eggs). Additionally, egg production numbers were
adjusted to represent the number of eggs produced during the peak striped bass spawning period,
because in this study, instances of egg predation by white perch were only found during this
period. Approximately 80% of the total striped bass eggs produced are spawned during the peak
spawn in the Roanoke River (Neal 1969).
23

The white perch total daily ration, CD, were obtained from a combination of scientific
literature and a bioenergetics model. A study by Parrish and Margraf (1990) on Lake Erie was
the only reference found that contained consumption values for white perch. During their study,
white perch consumption ranged between 0.026 and 0.219 grams of food ingested per gram of
fish per day (g*g-1*d-1) in two basins of Lake Erie and were some of the highest ever reported for
any species. For my model, maximum consumption (0.219 g*g-1*d-1) observed was used in the
egg predation simulations to represent worst-case (most intense) egg predation. Due to the lack
of information on white perch consumption, consumption was alternatively calculated with a
bioenergetics model using input parameters of congeneric age-1 striped bass (Hartman and
Brandt 1995); no bioenergetics model has been developed for white perch (K. Hartman, West
Virginia University, personal communication). In this model, temperature-dependent maximum
consumption was calculated from the equation:
Cmax = CA * WCB * f(T)
where Cmax is maximum daily consumption, CA and CB are species specific constants
(Hartman and Brandt 1995), W is fish body weight, and f(T) is an algorithm of temperature
dependency for consumption (Thornton and Lessem 1978; Hartman and Brandt 1995). Average
weight of white perch collected in May 2005 (65.4 g) and mean water temperatures during the
peak striped bass spawn during 2005 (18º C) were used in the bioenergetics equation. This
model predicted a maximum consumption value of 0.104 g*g-1*d-1, which was comparable to the
mean consumption value but was less than the maximum consumption values reported by Parris
and Margraf (1990). Since bioenergetic estimates were close to the mean value observed by
Parris and Margraf (1990) and were modeled at specific spring temperatures of the Roanoke
River, consumption rates of age-1 striped bass (0.104 g*g-1*d-1) were used in the egg predation
24

models to represent realistic temperature-based egg consumption rates of white perch. Lastly, all
consumption rates were converted to grams of food ingested daily by the average-sized white
perch.
White perch diet composition was obtained from stomach contents of white perch
collected in May of 2005, the year when considerable striped bass egg predation was apparent.
For my simulations, percent contribution by weight of striped bass eggs to diets of white perch
was averaged in days during the peak striped bass spawn. Additionally, only food habits of
white perch collected from locations where significant instances of striped bass egg predation
occurred (Ridgeway Farms and Watkins Bridge) were used to calculate means. This mean value
of eggs was 58% of white perch stomach contents by weight.
Total weight of striped bass eggs consumed daily by one white perch was calculated by
multiplying daily grams of food ingested by one white perch versus percent contribution by
weight of eggs in diets of white perch. Consumed egg weights were then converted to the
number of striped bass eggs need to represent those weights. The average weight of one striped
bass egg (0.0076 g) was determined by calculating the mean weight of 30 randomly selected
eggs collected from Vic Thomas State Fish Hatchery.
Once all variables were established, population sizes of white perch needed to consume
different quantities of eggs were calculated using the following equation:
PerchWhite Oneby Daily Consumed Eggsof # River) thein Eggs/Days BassStriped of # (Total PerchWhite of Size Population =
In 2005, peak striped bass spawning occurred during a six-day period, and all egg
predation observed occurred during this period. Further, Neal (1969) determined that striped
bass eggs hatch within 2 days after they were spawned with springtime Roanoke River water
25

26
temperatures. For both these reasons, eggs were estimated to be in the river for 8 days during the
peak striped bass spawn in 2005.
Objective 2: Trophic Competition
Field Collection. - The collection of age-0 sportfishes (crappie, largemouth bass, striped
bass and white perch) and adult white perch was necessary to quantify diets and determine the
potential for trophic competition. Age-0 sportfishes and white perch of all sizes were collected
in 2004 and 2005 from June through November. Collection began during the second week of
June of both 2004 and 2005 in the upper end of Kerr Reservoir, near Staunton View State Park
(see Figure 2). Because of the great size of Kerr Reservoir and to increase the collection of
naturally reproduced (versus stocked) striped bass, fish collection was concentrated at the upper
end of the reservoir. In historical trawl surveys of Kerr Reservoir during 1978-1979, age-0
striped bass spawned in the Roanoke and Dan Rivers were mostly collected in the upper portions
of the reservoir (Whitehurst 1982). Sampling locations were derived from traditional VDGIF
striped bass seining sites (Tables 4 and 5; Figure 3). In each sampling session, a variety of
collection sites were sampled depending on sampling gear used (Table 6).
Age-0 fish were collected throughout the growing season using a variety of gear types.
Initially, age-0 fishes were collected two to four times per month by seining shallow,
unvegetated shorelines with a 10-m-long x 1-m-deep seine (bar mesh size of 3.2 mm). By mid-
July age-0 fish were large enough to capture with electrofishing gear, so from July through
November, age-0 fish were collected two to four times per month via shoreline pulsed-DC boat
electrofishing (4-6 A, pulsed at a frequency of 120 pulses per second).
To collect larger age-0 fish in deeper water, late in the growing season, three bi-panel
monofilament gillnets (30.5 m long and 2.0 m deep consisting of two 15.2-m-long panels with

Table 4. Detailed descriptions of 2004 and 2005 seining and electrofishing locations from the Roanoke River side of Kerr Reservoir, Virginia.
Site # Site Description Latitude Longitude
1 Big point at confluence of Roanoke and Dan Rivers 36.6955 -78.6519
2 Beach just above Staunton View Boat Launch 36.6993 -78.64275 Red shoreline on right 3/4 mile above Staunton View Landing (small island of trees out from bank) 36.7082 -78.6530
6 Beach across cove from Staunton view landing 36.6980 -78.63847 Next beach down from site 6 (big rock at upper end of beach) 36.6862 -78.6304
8 Beach on Roanoke River side in front of red and white houses 36.6768 -78.6217
9 Beach below red and white houses 36.6743 -78.620410 2nd beach uplake from mouth of Bluestone Creek 36.6650 -78.6069
11 Beach at uplake end of the mouth of Bluestone Creek 36.6585 -78.592312 Beach next to old boat ramp at the mouth of Bluestone Creek 36.6573 -78.5863
13 Red bank on the right as you go into Bluestone (major point) 36.6616 -78.5830
14 Beach adjacent to Corps of Engineers boat ramp in Bluestone Creek 36.6642 -78.570615 1st beach below the mouth of Bluestone 36.6537 -78.5821
16 Beach below site 15 (2nd major cove uplake from powerline) 36.6474 -78.560017 Beach 3/4 mile below site 16 (1st cove uplake from powerline) 36.6438 -78.5530
18 Beach 1/4 mile below site 17 (beach between railroad trestle and powerline) 36.6404 -78.549919 Beach 200 yards uplake of site 20 36.6409 -78.5468
20 Beach in front of trailer park between railroad trestle and bridge 36.6383 -78.5456
32 Large boat launch at Occoneechee State Park 36.6336 -78.535633 Small boat launch on the back side of Occoneechee State Park 36.6240 -78.5251
35 Large gravel hill across lake from Buffalo Creek 36.6689 -78.6149
27
Table 5. Detailed descriptions of 2004 and 2005 seining and electrofishing locations from the Dan River side of Kerr Reservoir, Virginia. Site # Site Description Latitude Longitude3 Beach up Dan River Arm on the right 36.6959 -78.66154 Beach across lake from Staunton River State Park 36.6878 -78.662621 Beach slightly upstream of Prestwood Plantation (1st major point uplake from trestle) 36.6381 -78.568022 Beach 1/2 mile below mouth of Bluestone Creek 36.6394 -78.582523 Point below site 25 36.6521 -78.5981
25Above mouth of Bluestone (4th major point downstream of Buffalo adjacent to small point with rip-rap) 36.6529 -78.6021
26 Uplake from site 25 but before Buffalo (3rd major point, Flag Point, downlake of Buffalo) 36.6558 -78.608827 Beach across mouth from Buffalo Creek point 36.6585 -78.622628 1st beach on right in Buffalo (Army Corps. recreational beach) 36.6606 -78.626629 Beach next to Buffalo Creek fish shelter 36.6627 -78.626930 1/4-1/2 mile uplake from site 28 (adjacent to creek and brown house on hill) 36.6669 -78.630431 Uplake of site 29 at cedar tree (large cove across lake from Staunton View) 36.6849 -78.644234 Large point at the mouth of Buffalo Creek 36.6609 -78.6239
28

1
26
5
13
7
12
10
11
8
9
15
14
16
17
1819
21
4
22
23
3
2625
27
28
2930
31
34
2032
35
1
26
5
13
7
12
10
11
8
9
15
14
16
17
1819
21
4
22
23
3
2625
27
28
2930
31
34
2032
35
Figure 3. Map of the upper end of Kerr Reservoir, Virginia. 2004 and 2005 seining and electrofishing locations for age-0 sportfishes and adult white perch are indicated by black dots.
29

Sampling Period Seine Electrofishing
Sampling Period Seine Electrofishing
Jun 15-17 All Sites ---- Jun 7-8 All Sites ----Jun 22-24 All Sites ---- Jun 15-16 All Sites ----Jun 28-29 All Sites ---- Jun 21-22 All Sites ----Jul 6-7 All Sites ---- Jun 29-30 All Sites ----Jul 20-22 1, 2, 3, 5, 6, 7, 8, 9, 10 14, 5, 25, 28, 34 Jul 8-9 All Sites ----Jul 26-27 ---- 1, 2, 3, 5, 6, 28, 34 Jul 18-19 All Sites ----Aug 4-5 ---- 1, 4, 5, 7, 11, 28, 29, 34 Jul 26-27 ---- 1, 3, 5, 6, 9, 10, 11, 14, 28, 34Aug 10-11 ---- 1, 5, 28, 29, 34 Aug 2-3 ---- 1, 5, 11, 28, 34, 35Sept 1-2 ---- 1, 5, 11, 28, 34 Aug 11-12 ---- 5, 10, 11, 13, 28, 34, 35 Sept 15-16 ---- 1, 5, 11, 25, 29, 34 Aug 23-24 ---- 5, 11, 13, 28, 34, 35Sept 22-23 ---- 1, 4, 5, 34 Sept 19-20 ---- 5, 6, 11, 34Oct 6-7 ---- 11, 14, 28, 29, 34 Sept 29-30 ---- 11, 15, 25, 35, 34Oct 13-14 ---- 5, 11, 23, 29, 28, 34 Oct 12-13 ---- 11, 13, 15, 28, 34, 35Oct 20-21 ---- 5, 11, 23, 25, 28, 34 Oct 18-19 ---- 11, 13, 15, 28, 34, 35Oct 27-28 ---- 5, 11, 13, 23, 25, 34 Oct 25-26 ---- 13, 14Nov 3-4 ---- 11, 28, 34 Nov 27-28 ---- 11, 13, 14, 32Nov 8-9 ---- 11, 15, 28, 34Dec 16-17 ---- 11, 13, 14, 15, 28, 34
2004 2005
Sampling Period Seine Electrofishing
Sampling Period Seine Electrofishing
Jun 15-17 All Sites ---- Jun 7-8 All Sites ----Jun 22-24 All Sites ---- Jun 15-16 All Sites ----Jun 28-29 All Sites ---- Jun 21-22 All Sites ----Jul 6-7 All Sites ---- Jun 29-30 All Sites ----Jul 20-22 1, 2, 3, 5, 6, 7, 8, 9, 10 14, 5, 25, 28, 34 Jul 8-9 All Sites ----Jul 26-27 ---- 1, 2, 3, 5, 6, 28, 34 Jul 18-19 All Sites ----Aug 4-5 ---- 1, 4, 5, 7, 11, 28, 29, 34 Jul 26-27 ---- 1, 3, 5, 6, 9, 10, 11, 14, 28, 34Aug 10-11 ---- 1, 5, 28, 29, 34 Aug 2-3 ---- 1, 5, 11, 28, 34, 35Sept 1-2 ---- 1, 5, 11, 28, 34 Aug 11-12 ---- 5, 10, 11, 13, 28, 34, 35 Sept 15-16 ---- 1, 5, 11, 25, 29, 34 Aug 23-24 ---- 5, 11, 13, 28, 34, 35Sept 22-23 ---- 1, 4, 5, 34 Sept 19-20 ---- 5, 6, 11, 34Oct 6-7 ---- 11, 14, 28, 29, 34 Sept 29-30 ---- 11, 15, 25, 35, 34Oct 13-14 ---- 5, 11, 23, 29, 28, 34 Oct 12-13 ---- 11, 13, 15, 28, 34, 35Oct 20-21 ---- 5, 11, 23, 25, 28, 34 Oct 18-19 ---- 11, 13, 15, 28, 34, 35Oct 27-28 ---- 5, 11, 13, 23, 25, 34 Oct 25-26 ---- 13, 14Nov 3-4 ---- 11, 28, 34 Nov 27-28 ---- 11, 13, 14, 32Nov 8-9 ---- 11, 15, 28, 34Dec 16-17 ---- 11, 13, 14, 15, 28, 34
2004 2005
Table 6. Distribution of sampling for age-0 fish over time and sites (see Tables 4 and 5).
30

bar mesh sizes of 25 and 19 mm, 19 and 13 mm, and 25 and 13 mm) were set perpendicular to
the shoreline from mid-September through November, concurrent with electrofishing sampling.
Additionally, in 2005 trapnets were set one night per week during June to supplement age-0
crappie collections. To increase capture efficiency, all age-0 collection took place after dark, the
period when most age-0 fish migrate to shallow areas. On each sampling trip, I attempted to
collect at least 30 fish from each species for diet analysis. Fish captured were immediately put
on ice and returned to the laboratory for analysis.
Food Habits. - In the laboratory, fish were measured to the nearest 1mm, weighed to the
nearest 1 g, and had their stomachs removed. Stomachs were preserved in a 10% formalin
solution pending later analysis. After initial preservation, stomach contents were examined with
a dissecting microscope, identified to the lowest practical taxon (using keys for aquatic
invertebrates, zooplankton and larval fish), and weighed to the nearest 0.001g. Partially digested
clupeid species were differentiated from other fish species by the presence of a gizzard-like
stomach (Jenkins and Burkhead 1993). Diet composition of different species of age-0 fishes and
adult white perch was quantified for each month in 2004 and 2005 and each 10 mm-length
interval as percent of each diet item by total diet weight using the same equation as in Objective
1 (page 23).
Diet Overlap. - To assess interspecific trophic competition between white perch and age-
0 sportfishes, diet overlap was calculated for adult and age-0 white perch versus each species of
age-0 sportfish (crappie, largemouth bass, and striped bass) for every month and for each 10-mm
length interval during the 2004 and 2005 growing seasons (Sutton and Ney 2002). Overlap was
evaluated using Schoener’s (1970) overlap index, which is defined as:
31

n
Cxy = 1.0 – 0.5 ∑ |pxi - pyi|,
i=1
where Cxy is the overlap index, pxi is the percentage of food type i eaten by species x, pyi is the
percentage of food type i eaten by species y, and n is the total number of prey item categories
(Sutton 1997 and Rash 2003). Schoener’s index values range from 0.0 to 1.0 with values greater
than 0.6 indicating significant trophic overlap for the resource (Zaret and Rand 1971). Wallace
(1981) determined that when resource availability is unknown, Schoener’s index, using weight
percentages, is the best method available to calculate diet overlap.
Overlap estimates can often lead to inaccurate results and unreliable interpretations when
sample sizes are small (Smith 1985). To avoid misleading results, cumulative prey species
curves were used to determine adequate samples sizes needed to accurately describe diets of each
species for each month and 10-mm length interval (Brodeur and Pearcy 1984; Sutton 1997).
Only samples large enough to properly quantify diets were used in overlap analysis. Due to low
collection numbers of age-0 white perch in 2005, diet overlap was additionally calculated
between age-0 white perch collected in 2004 versus age-0 crappie, largemouth bass, and striped
bass collected in 2005.
To determine the potential for trophic competition between white perch and adult
sportfishes, diet overlap was computed between adult white perch versus adult sportfish species
collected in both 2004 and 2005. Adult sportfish were collected pursuant to Objective 3.
Objective 3: Sportfish Utilization of White Perch
Field Collection. - Stomach contents of adult (age 1 and older) sportfishes were obtained
from a variety of sources beginning in the summer of 2004. Adult largemouth bass were
32

collected throughout the growing season (July-December) of 2004 and 2005 using pulsed-DC
boat electrofishing (4-6 A, pulsed at a frequency of 120 pulses per second). Largemouth bass
collection took place in the upper end of Kerr Reservoir pursuant to Objective 2. Once collected,
largemouth bass were measured to the nearest 1 mm and had their stomachs evacuated.
Stomachs were evacuated by inserting an acrylic tube into the fish’s esophagus and stomach
(Van Den Avyle and Roussel 1980). Stomach contents were then preserved in a 10% formalin
solution for laboratory analysis.
All other adult sportfish species were obtained through VDGIF annual gillnet surveys.
These species included striped bass, walleye, catfish species, white bass and crappie species. A
total of six gillnets (60.96 m long and 2.44 m deep containing bar mesh sizes of 50.8 mm, 31.8
mm, and 19.1 mm) were set once per month October through December of 2004 and 2005.
Upon retrieving gillnets, fish were immediately placed on ice. Subsequently, fish were measured
to the nearest 1 mm and had their stomachs removed within three hours of capture. Excised
stomachs were preserved in a 10% formalin solution pending laboratory analysis. Additional
crappies were collected in April 2005 from VDGIF annual trapnet surveys. Trapnetted fish were
processed in the same manner as gillnetted fish.
Food Habits. - In the laboratory, individual stomach contents were examined with a
dissecting microscope, identified to the lowest practical taxon and weighed to the nearest 0.001g.
Partially digested clupeid species were differentiated from other fish species by the presence of a
gizzard-like stomach (Jenkins and Burkhead 1993).
Frequency of Occurrence (FOO) of white perch consumed was calculated for each
species-group of sportfish to determine the percentage with white perch in their diet. Diet
33

composition was quantified as percent by weight of white perch and other major prey items
consumed by each species-group of sportfish.
Total length, eye diameter, and caudal peduncle depth of consumed white perch were
measured and converted to total lengths using the regressions developed by Scharf et al. (1997).
The regressions were defined as:
Total Length of white perch = 14.911* Eye Diameter – 2.923, and
Total Length of white perch = 9.991 * Caudal Peduncle Depth + 2.427.
Total lengths of white perch consumed were calculated to determine sizes of white perch
vulnerable to predation by adult sportfish in Kerr Reservoir.
Objective 4: Sportfish Performance
VDGIF Historical Data Sets. - Annual sampling by VDGIF personnel provided yearly
data on key resident fishes of Kerr Reservoir used for comparison of performance (before versus
after white perch establishment) in this study. Data sets provided relative abundance and length
information on fish collected in annual electrofishing and gillnet samples.
Annual electrofishing surveys provided catch-per-unit-effort (CPUE) and length data on
largemouth bass for the years of 1982-1994, 1996, 1997, 1999, 2001, 2002, and 2004.
Beginning in 1999, electrofishing samples were collected only in the spring of each year, so for
comparative reasons, only fish collected from March through June in years prior to 1999 were
used in this analysis. Annual largemouth bass relative abundance (CPUE = N/hour) in years
prior to white perch introductions (before 1988) were compared to yearly abundance after white
perch were establish in Kerr Reservoir (1996 to the present). Although white perch were first
found in 1988 VDIF samples, they were not collected in high abundance until 1996 (Wilson
1997). Total lengths of largemouth bass were used to calculate proportional stock density (PSD)
34
and relative stock density of preferred fish (RSD-P) (Anderson and Neumann 1996). Stock
density estimates (PSD and RSD-P) were compared in years pre- versus post-white perch to
determine whether proportions of quality- (≥ 300 mm TL) and preferred- (≥ 380 mm TL)
(Gabelhouse 1984) sized largemouth bass declined. Largemouth bass length-at-age data were
obtained for the years of 1974-1980, 1982, 1985, 1993, 1997, and 2004. Lengths of age-3
largemouth bass were compared pre-white perch (1974 to 1987) versus post-white perch (1997-
2004), to evaluate growth of largemouth before versus after white perch. Age-3 was chosen for
comparison because at age-3 all largemouth bass are recruited to electrofishing gear and usually
comprise the most abundant age group in the sample.
Yearly VDGIF gillnet samples provided abundance data for pelagic species (clupeid
species, striped bass, and white bass) of Kerr Reservoir. In each year, gillnet samples were
collected only in the fall (September-December), but the number of nets set and mesh sizes
differed among years. From 1980 through 1994, gillnets with mesh sizes of 51 mm, 32 mm, and
19 mm (traditional gillnets) were fished in two fixed area of Kerr Reservoir. After 1994,
additional gillnets with added mesh sizes (76, 64, 38, 16, and 13 mm) were used in other
reservoir locations. To ensure comparability among years, only data collected from fish obtained
in traditional gillnet locations and mesh sizes were used in temporal comparisons. Relative
abundance (CPUE = N/100 m2 of net) was calculated for striped bass in the years of 1974-2004,
for clupeid species in 1980-1997, and 1999-2004, and for white bass in 1980-1999, and 2001-
2004. For each pelagic species, annual CPUEs were compared pre versus post-white perch
establishment. Length-at-age data were also provided for striped bass in 1979-1985, 1987, 1988,
1995-1997, and 1999-2004. As with largemouth bass, lengths of age-3 striped bass were
35
compared before and after white perch introductions. Age-3 striped bass were used to ensure
that all striped bass in this age class were recruited to gillnet gear.
Data on other key species of Kerr Reservoir sportfish (e.g. crappie species) were also
obtained from VDGIF data sets, but sampling effort and gear were inconsistent among years
and/or fish were not collected in enough years for comparison. For these reasons, comparison of
growth and abundance pre- versus post-white perch establishment for crappie, catfishes, and
walleye was not undertaken.
Statistical Analysis
A variety of parametric and non-parametric statistics were used to analyze data sets.
Because parametric tests have strict assumptions of normality and equal variance (Townend
2002), each data set was tested for normality using the Kolmogorov-Smirnov Test and equal
variance using the “F” or Bartlett’s Tests. Normality and variance tests were passed at levels
greater than α = 0.05. The CPUEs of white perch collected from the Roanoke River in 2004
were used to compare relative abundances of white perch collected among sites with one-way
Analysis of Variance (ANOVA). The CPUEs of fish collected in 2005 were compared over sites
using a Kruskal-Wallis Test (non-parametric equivalent of the parametric ANOVA) because the
test for normality failed. In the case that a significant difference in relative abundance among
sites was found in either year, Tukey-Kramer’s HSD range test was used to determine site
differences (Zarr 1999).
Annual relative abundances (CPUE) of largemouth bass, striped bass, and white bass pre-
versus post-white perch were compared using the parametric Student’s “T” test. Clupeid CPUEs
before versus after white perch were compared using a Mann-Whitney “U” test (non-parametric
counterpart to the parametric Student’s “T” test), because the test of normality failed.
36

37
Additionally, pooled lengths of age-3 largemouth bass and striped bass were compared pre
versus post-white perch using the Mann-Whitney “U” test, because data failed the tests for
normal distribution.
All tests were two sided and were considered significant at the α = 0.05 level, to account
for type-I error. All statistical procedures used in this study are shown in Table 7.

Data Set Normality Test Equal Variance Test Staistical Tests Used
Relative abundance of White Perch collected at sites in the Roanoke River 2004 Passed (P = 0.066) Passed (P = 0.146) ANOVA, Tukeys Kramer's HSD
Relative abundance of White Perch collected at sites in the Roanoke River 2005 Failed (P < 0.05) Passed (P = 0.123) Kruskal-Wallis, Tukey's Kramer's HSD
Relative abundance of largemouth bass pre vs. post-white perch establishment Passed (P = 0.474) Passed (P = 0.147) Student's "T" test
PSD of largemouth bass pre vs. post-white perch establishment Passed (P = 0.609) Passed (P = 0.329) Student's "T" test
RSD-P of largemouth bass pre vs. post-white perch establishment Passed (P = 0.553) Passed (P = 0.228) Student's "T" test
Length at age-3 of largemouth bass pre vs. post-white perch establishment Failed (P < 0.05) Failed (P < 0.05) Mann-Whitney "U" test
Relative abundance of striped bass pre vs. post-white perch establishment Passed (P = 0.081) Passed (P = 0.354) Student's "T" test
Length at age-3 of striped bass pre vs. post-white perch establishment Failed (P < 0.05) Passed (P = .996) Mann-Whitney "U" test
Relative abundance of clupeid species pre vs. post-white perch establishment Failed (P < 0.05) Passed (P = 0.624) Mann-Whitney "U" test
Relative abundance of white bass pre vs. post-white perch establishment Passed (P = 0.536) Passed (P = 0.384) Student's "T" test
Table 7. Statistical procedures used to analyze Kerr Reservoir data sets.
38

39
RESULTS
Age and Growth Analysis
A total of 192 white perch collected from Kerr Reservoir were aged using sagittal
otoliths. Collected white perch ranged in age from one to nine years, with the majority of white
perch (94%) in the 1- to 4-year age groups. Mean calculated total lengths of ages one through
nine white perch were 104, 149, 175, 208, 239, 254, 264, 281, and 303 mm, respectively (Table
8). White perch experienced the most growth (49%) in their first two years of life. Continued
growth in length was still displayed after perch reached age two, but declined to less than 35 mm
per year.
In 2004, all age-0 species averaged lengths less than 55 mm TL during the first month of
the growing season (June). Both white perch and largemouth bass reached 100 mm TL by
September and 110 mm by December (see Figure 4). Crappie achieved 100 mm in October and
reached 130 mm TL by December. Striped bass grew to 100 mm by August and 170 mm TL by
December. In June 2005, all age-0 species had average lengths less than 44 mm TL (see Figure
5). Both white perch and largemouth bass grew to 100 mm TL by September, and largemouth
bass reached total lengths of 140 mm TL by November. Crappie reached 60 mm TL by
September. Striped bass achieved total lengths of 100 mm by August, 240 mm by November,
and 250 mm by December.
Objective 1: Predation
Collection Results. - To obtain white perch that had the potential to consume striped bass
eggs and larvae, juveniles and adults were collected in the Roanoke River in May of 2004 and
2005, during the peak of the Roanoke River striped bass spawn. Striped bass egg densities were

Table 8. Calculated lengths of white perch at successive ages from Kerr Reservoir, Virginia.
Year Class N 1 2 3 4 5 6 7 8 9
2004 44 101 -- -- -- -- -- -- -- --2003 3 99 142 -- -- -- -- -- -- --2002 97 105 145 170 -- -- -- -- -- --2001 36 107 155 186 206 -- -- -- -- --1999 4 119 170 205 228 248 -- -- -- --1998 4 99 148 189 222 248 264 -- -- --1997 0 -- -- -- -- -- -- -- -- --1996 3 107 146 170 195 219 240 262 280 --1995 1 124 158 183 213 236 260 270 287 303
104 149 175 208 239 254 264 281 303104 45 26 33 31 15 10 17 2234 15 9 11 10 5 3 6 7192 148 145 48 12 8 4 4 1
Increments (mm)
Number
Weighted Mean
Mean Length Age (mm)
% growth to the 9th year
40

Crappie
50
100
150
200
250
Largemouth Bass
50
100
150
200
250
Jun Jul Aug Sep Oct Nov Dec
Striped Bass
50
100
150
200
250
White Perch
50
100
150
200
250
Jun Jul Aug Sep Oct Nov Dec
Len
gth
(mm
)Crappie
50
100
150
200
250
Largemouth Bass
50
100
150
200
250
Jun Jul Aug Sep Oct Nov Dec
Striped Bass
50
100
150
200
250
White Perch
50
100
150
200
250
Jun Jul Aug Sep Oct Nov Dec
Crappie
50
100
150
200
250
Largemouth Bass
50
100
150
200
250
Jun Jul Aug Sep Oct Nov Dec
Striped Bass
50
100
150
200
250
White Perch
50
100
150
200
250
Jun Jul Aug Sep Oct Nov Dec
Len
gth
(mm
)
Figure 4. Monthly mean lengths of age-0 sportfish collected in 2004 from Kerr Reservoir, Virginia. Dotted lines indicate 10th and 90th percentiles.
41
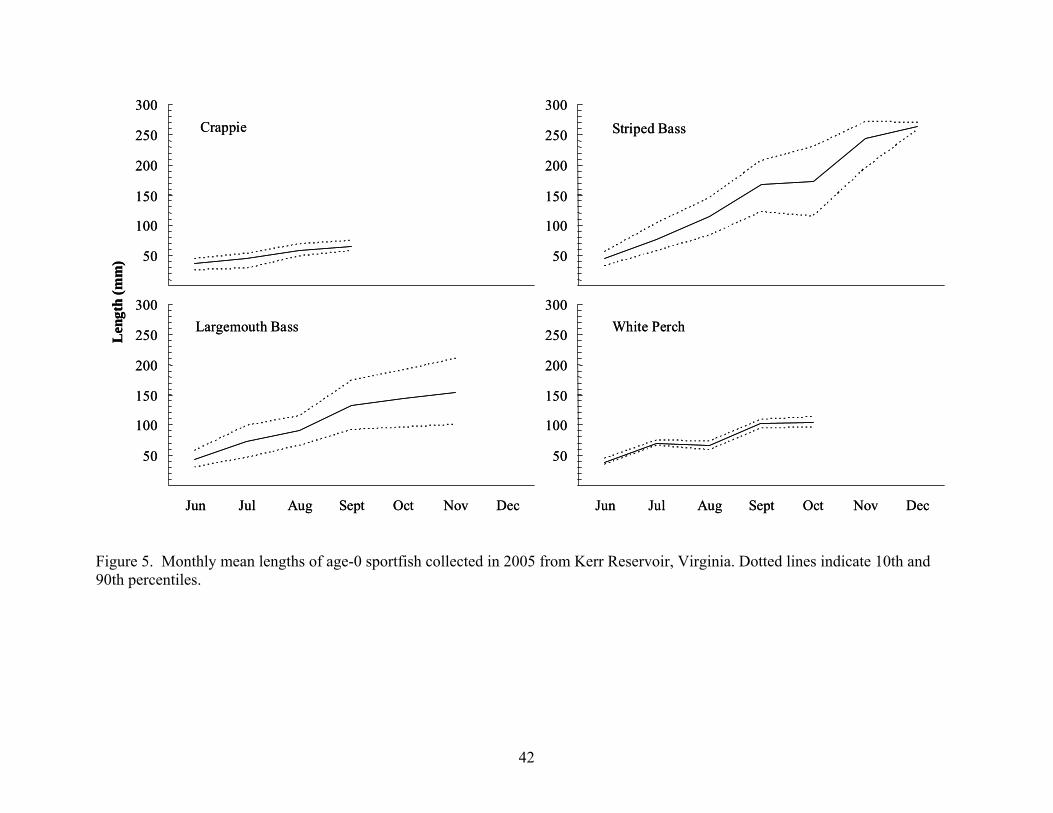
Crappie
50
100
150
200
250
300L
engt
h (m
m)
Largemouth Bass
50
100
150
200
250
300
Jun Jul Aug Sept Oct Nov Dec
Striped Bass
50
100
150
200
250
300
White Perch
50
100
150
200
250
300
Jun Jul Aug Sept Oct Nov Dec
Crappie
50
100
150
200
250
300L
engt
h (m
m)
Largemouth Bass
50
100
150
200
250
300
Jun Jul Aug Sept Oct Nov Dec
Striped Bass
50
100
150
200
250
300
White Perch
50
100
150
200
250
300
Jun Jul Aug Sept Oct Nov Dec
42
Figure 5. Monthly mean lengths of age-0 sportfish collected in 2005 from Kerr Reservoir, Virginia. Dotted lines indicate 10th and 90th percentiles.

43
not directly measured in the Roanoke River, so the peak spawn was determined qualitatively by
visual observation of striped bass spawning activity and the presence of striped bass eggs in the
water column of the river. In 2004, peak striped bass spawning occurred in a five-day period
beginning on the 6th of May, when water temperatures reached approximately 18ºC, and
concluded on the 10th of May. During this period, the majority of observed spawning activity
was concentrated in a 33-km stretch of river between Clarkton Bridge and Watkins Bridge
(Figure 2). From May 4th until May 28th, 733 adult white perch were collected throughout the
Roanoke River. Daily site collection and relative abundances are shown in Table 9. Mean
relative abundances (CPUE) of white perch were not significantly different among all sites
except between 360 Bridge (60.5 fish/hour) and Staunton View (17.3 fish/hour) (ANOVA,
Tukey-Kramer’s HSD, df = 4, P = 0.04). White perch collected in May 2004 ranged in size from
72 to 330 mm TL (see Figure 6) with an average total length of 146 mm, and ranged in weight
from 4 to 400 g with a mean weight of 47 g.
In 2005, the observed peak striped bass spawn was 7 days versus 5 days in 2004. The
peak spawn began on the night of May 9th and continued through May 15th. Surface water
temperatures during this period ranged from 17ºC to 22ºC. In 2005, white perch sampling began
on May 2nd and concluded on May 27th. A total of 986 white perch were collected during this
period. Table 10 details daily collection records and relative abundances of white perch
collected throughout the Roanoke River. During May of 2005, mean CPUEs of white perch
were higher at 360 Bridge (43 fish/hour) and Staunton View (44 fish/hour) versus Watkins
Bridge (14 fish/hour) (ANOVA, Tukey-Kramer’s HSD, df = 4, P < 0.05), but CPUEs were not
statistically different versus any other site. In May 2005, white perch averaged (means for May)

Table 9. Electrofishing collection numbers and relative abundances (CPUE) of white perch obtained from the Roanoke River, Virginia during May of 2004.
Date NCPUE
(catch/hr.) NCPUE
(catch/hr.) NCPUE
(catch/hr.) NCPUE
(catch/hr.) NCPUE
(catch/hr.)
4-May-04 20 9.0
5-May-04 34 21.1
10-May-04 35 60.0 22 30.5 79 114.5
11-May-04 19 27.4 32 41.0 25 31.9
12-May-04 27 31.5
13-May-04 31 27.6 58 67.6 27 35.0
14-May-04 29 31.9
17-May-04 9 9.1
18-May-04 22 8.8
19-May-04 13 12.9
20-May-04 51 24.721-May-04 56 28.7
25-May-04 28 10.226-May-04 34 12.8
27-May-04 34 12.1
28-May-04 48 28.7Total 98 31.6 79 15.7 139 43.2 131 58.4 286 16Mean 33 37.7 20 18.3 35 42.7 44 60.5 36 17.3
Staunton ViewClarkton Ridgeway Watkins 360 Bridge
44

2005
0.05
0.1
0.15
0-10
21-3
0
41-5
0
61-7
0
81-9
0
101-
110
121-
130
141-
150
161-
170
181-
190
201-
210
221-
230
241-
250
261-
270
281-
290
301-
310
321-
330
Total Length (mm)
Freq
uenc
y of
Occ
urre
nce
2004
0.05
0.1
0.15
0.2
2005
0.05
0.1
0.15
0-10
21-3
0
41-5
0
61-7
0
81-9
0
101-
110
121-
130
141-
150
161-
170
181-
190
201-
210
221-
230
241-
250
261-
270
281-
290
301-
310
321-
330
Total Length (mm)
Freq
uenc
y of
Occ
urre
nce
2004
0.05
0.1
0.15
0.2
Figure 6. Length distribution of white perch collected throughout the Roanoke River, Virginia during May of 2004 and 2005.
45

Date NCPUE
(catch/hr.) NCPUE
(catch/hr.) NCPUE
(catch/hr.) NCPUE
(catch/hr.) NCPUE
(catch/hr.)
2-May-05 0 0.03-May-05 19 19.6 16 7.3 40 91.24-May-05 36 61.7 12 20.65-May-05 26 23.49-May-05 32 22.5 10 9.7
10-May-05 14 16.7 12 6.911-May-05 24 13.8 17 12.5 74 195.612-May-05 39 26.3 26 19.1 73 190.413-May-05 22 12.3 28 22.0 27 45.514-May-05 31 34.8 18 14.016-May-05 20 17.9 21 35.317-May-05 23 19.2 36 42.018-May-05 36 34.619-May-05 40 43.723-May-05 34 25.424-May-05 32 34.225-May-05 67 114.726-May-05 39 29.527-May-05 43 28.4
Total 89 30.7 154 18.8 159 13.3 258 72.0 327 38.4Mean 30 34.9 22 18 18 14.4 43 96.2 41 44.1
Staunton ViewClarkton Ridgeway Watkins 360 Bridge
Table 10. Electrofishing collection numbers and relative abundances (CPUE) of white perch obtained from the Roanoke River, Virginia during May of 2005.
46

47
163 mm TL and 65 g, with respective ranges of 92 to 303 mm TL (Figure 6) and 12 to 410 g. In
both years of the study, white perch obtained from the Roanoke River were primarily captured in
slack, back-water areas near structure. Other habitats were sampled, but capture efficiency was
decreased considerably in these areas due to high spring-time flows of the Roanoke River.
Additionally in 2004 and 2005, age-1 and older white perch were captured from June
until December, during age-0 fish collection for Objective 2 (Competition) and adult sportfish
collection for Objective 4 (Sportfish Utilization). A majority (86%) of adult white perch
obtained in both years were collected by electrofishing along unvegetated, sandy shorelines and
points in the upper end of Kerr Reservoir (above the Route 58 Bridge). The rest were collected
from VDGIF fall gillnet samples. A total of 668 and 497 white perch of potentially piscivorous
(> 80 mm TL) size were collected in 2004 and 2005, respectively in Kerr Reservoir (see Table
11). A small sample (N = 11) of white perch also was obtained in April of 2005 from VDGIF
trapnet surveys. Stomach contents of white perch captured in the Roanoke River and Kerr
Reservoir were analyzed for incidence and intensity of predation on sportfish eggs, larvae, and
juveniles.
2004 Food Habits. - In May 2004, 77% of the 733 white perch stomachs collected
contained prey items. White perch consumed primarily aquatic insects throughout the Roanoke
River (Figure 7). Aquatic insects comprised greater than 89% by weight of perch stomach
contents at all sites. Ephemeropterans (between 20% and 55% of diet by weight at all sites) and
chironomids (between 21% and 70% of diet by weight at all sites) were the principal insect prey.
A variety of other aquatic invertebrates (insects, crayfish, Asiatic clams, and zooplankton) were
consumed but not in high percentages (< 11% of diet by weight for any taxon). Fish predation

Table 11. Number, size, and method of capture for white perch collected from the upper end of Kerr Reservoir, Virginia during the growing seasons of 2005 and 2005.
Year MonthNumber Collected
Mean Length (mm) Range (mm)
Mean Weight (g) Range (g) Capture Method
2004 June 116 169 89-211 73.6 9-150 SeiningJuly 155 147 85-230 51.2 9-205 Seining, Electrofishing
August 67 147 117-191 44.7 20-112 ElectrofishingSeptember 111 148 120-213 45.8 22-146 ElectrofishingOctober 153 172 121-227 53.5 21-159 Electrofishing, VDGIF Gillnets
November 66 158 133-221 51.2 27-147 ElectrofishingDecember None -- -- -- -- --2004 Total 668 154 85-230 54.3 9-205 --
2005 June None -- -- -- -- --July 55 157 100-203 60.9 17.8-122.5 Electrofishing
August 101 168 119-248 72 21.9-235 ElectrofishingSeptember 69 157 129-226 54.3 25.1-176 ElectrofishingOctober 237 161 120-255 59.5 20.3-264 Electrofishing, VDGIF Gillnets
November 28 235 198-312 209 117.5-480 VDGIF GillnetsDecember 7 219 195-292 175.2 87-410 VDGIF Gillnets2005 Total 497 167 100-312 71.5 17.8-480 --
48
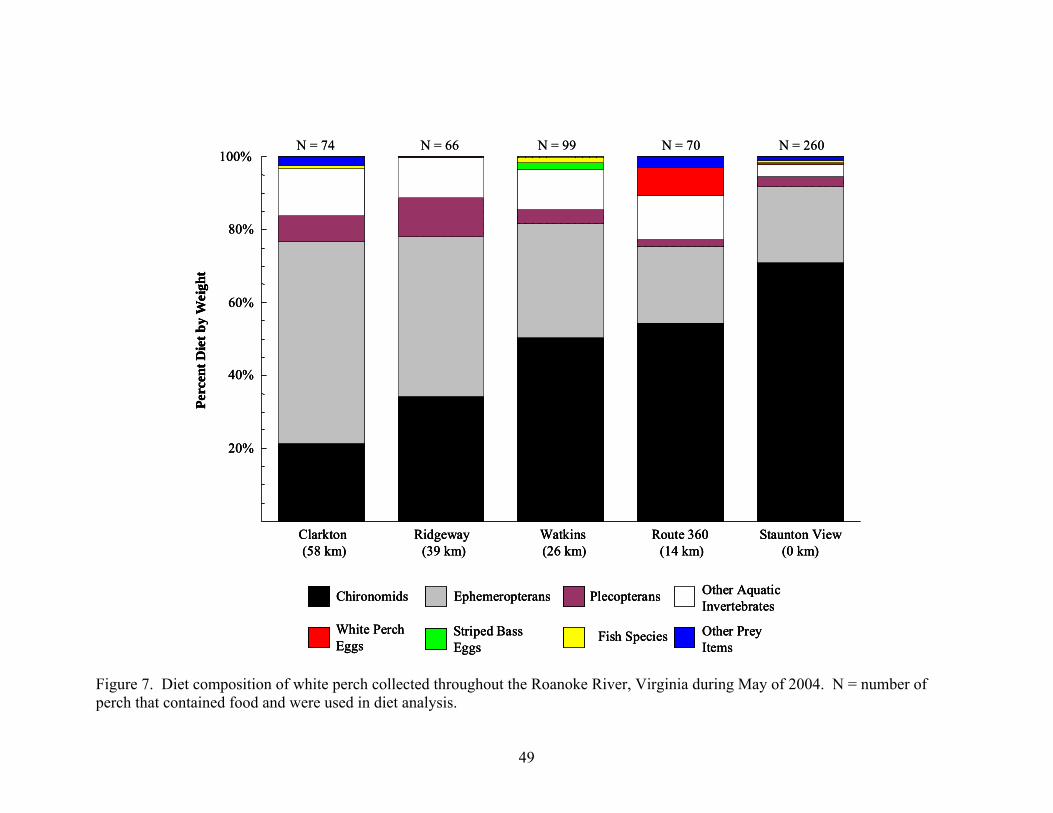
Figure 7. Diet composition of white perch collected throughout the Roanoke River, Virginia during May of 2004. N = number of perch that contained food and were used in diet analysis.
N = 74 N = 66 N = 99 N = 70 N = 260
20%
40%
60%
80%
100%
Clarkton (58 km)
Ridgeway (39 km)
Watkins (26 km)
Route 360 (14 km)
Staunton View(0 km)
Perc
ent D
iet b
y W
eigh
t
Other Prey Items
Fish SpeciesStriped Bass Eggs
White Perch Eggs
Other Aquatic Invertebrates
PlecopteransEphemeropteransChironomids
20%
40%
60%
80%
100%
Clarkton (58 km)
Ridgeway (39 km)
Watkins (26 km)
Route 360 (14 km)
Staunton View(0 km)
Perc
ent D
iet b
y W
eigh
t
Other Prey Items
Fish SpeciesStriped Bass Eggs
White Perch Eggs
Other Aquatic Invertebrates
PlecopteransEphemeropteransChironomids
49

50
(cyprinid and percid species) was also observed but never exceeded 2% of diets by weight at any
site. Larval fish were not observed in white perch diets.
Eggs of striped bass and white perch were found in white perch stomachs during May
2004. Egg predation occurred at all sites where white perch were collected, but the majority of
eggs eaten were of white perch (Figure 7). Striped bass eggs were only observed in a total of 6
white perch stomachs collected throughout May. Striped bass egg predation was only observed
at two locations, Ridgeway Farms and Watkins Bridge, and at very low frequency of occurrence
(1.5% and 5%, respectively) (Figure 8). Observed frequency of occurrence of eggs in the diets
of white perch at these sites was highest during May 10th - 17th, coinciding with the peak of
striped bass spawning (Table 12). Striped bass and white perch eggs represented small
proportions of white perch diets (< 2% and < 8% by weight, respectively, for any site) during
May 2004 (Figure 7).
From June through November 2004, white perch fed primarily on aquatic invertebrates in
Kerr Reservoir (Figure 9). Ephemeropterans, chaoborids, and chironomids were the
predominant prey items (between 87% and 97% by weight) found in stomachs of white perch
until October, after which greater than 70% of stomach contents by weight were comprised of
ephemeropterans and zooplankton (copepods and cladocerans). Fish (clupeid, centrarchid,
cyprinid and percid species) were infrequently found (FOO < 14% in all months) in the stomachs
of white perch and never exceeded 12% of stomach contents by weight for any month (Figure 9).
Other than age-0 centrarchids (Lepomis species), no juvenile sportfish were observed in the diets
of white perch. White perch were piscivorous at all sizes greater than 80 mm, and fish predation
was relatively consistent among all size classes of white perch greater than 80 mm (Figure 10).

51
FOO (%)
STB Eggs = 0.0
WP Eggs = 1.3FOO (%)
STB Eggs = 5.0
WP Eggs = 0.0
FOO (%)
STB Eggs = 1.5
WP Eggs = 0
FOO (%)
STB Eggs = 0.0
WP Eggs = 2.2
FOO (%)
STB Eggs = 0.0
WP Eggs = 5.6
FOO (%)
STB Eggs = 0.0
WP Eggs = 1.3FOO (%)
STB Eggs = 5.0
WP Eggs = 0.0
FOO (%)
STB Eggs = 1.5
WP Eggs = 0
FOO (%)
STB Eggs = 0.0
WP Eggs = 2.2
FOO (%)
STB Eggs = 0.0
WP Eggs = 5.6
Figure 8. Spatial occurrence of egg predation by white perch throughout the Roanoke River, Virginia during May of 2004. FOO represents frequency of occurrence in diets of white perch, STB represents striped bass, and WP represents white perch.
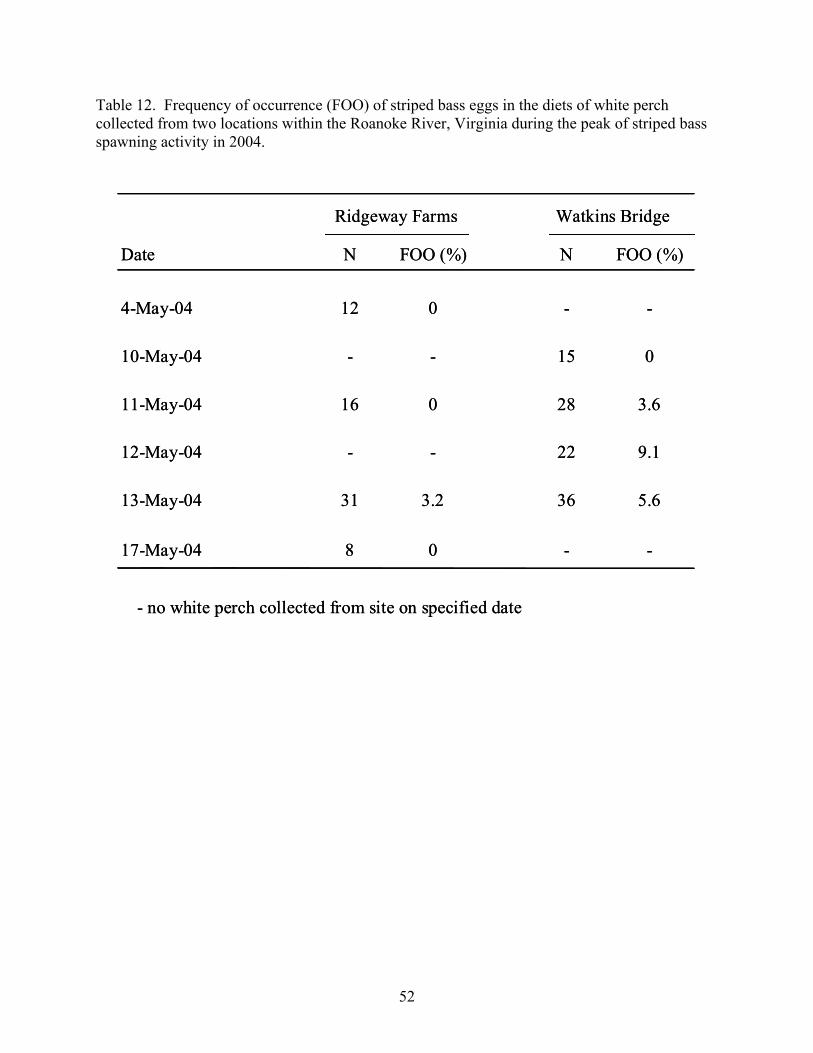
Table 12. Frequency of occurrence (FOO) of striped bass eggs in the diets of white perch collected from two locations within the Roanoke River, Virginia during the peak of striped bass spawning activity in 2004.
52
Date N FOO (%) N FOO (%)
4-May-04 12 0 - -
10-May-04 - - 15 0
11-May- 3.6
12-May- 9.1
13-May- 5.6
17-May- -
Ridgeway Farms Watkins Bridge
04 16 0 28
04 - - 22
04 31 3.2 36
04 8 0 -
- no w
Date N FOO (%) N FOO (%)
4-May-04 12 0 - -
10-May-04 - - 15 0
11-May- 3.6
12-May- 9.1
13-May- 5.6
17-May- -
Ridgeway Farms Watkins Bridge
hite perch collected from site on specified date
04 16 0 28
04 - - 22
04 31 3.2 36
04 8 0 -
- no white perch collected from site on specified date
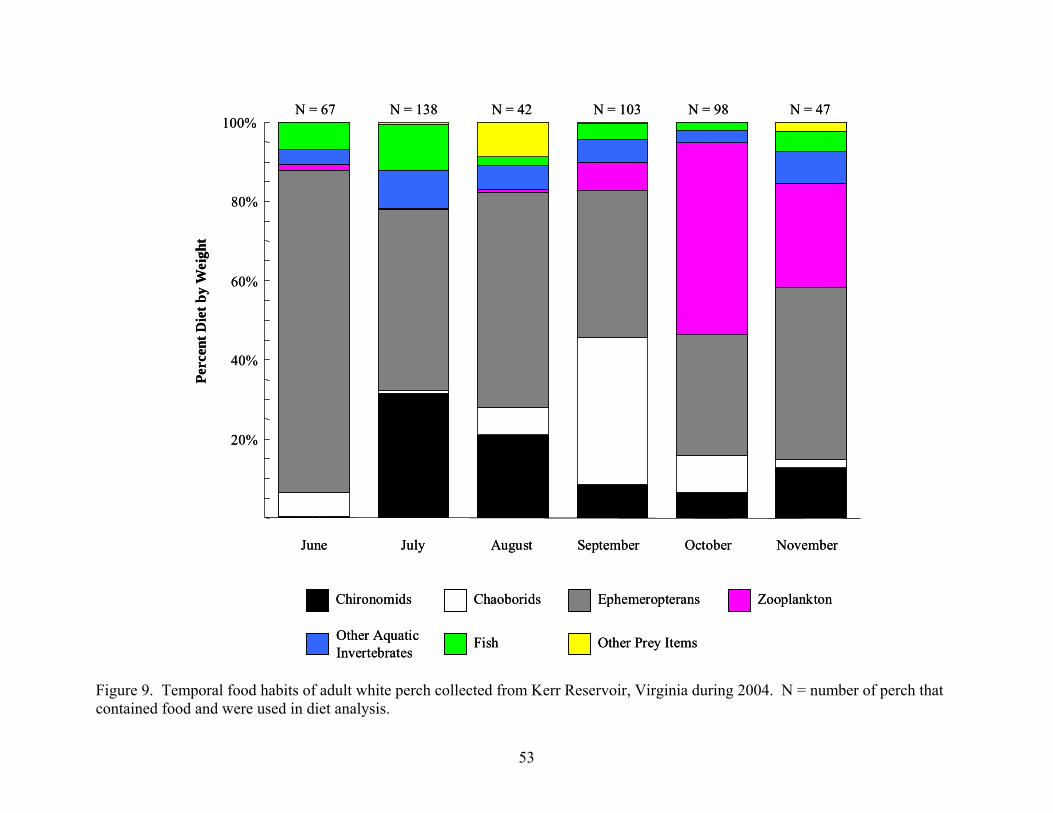
20%
40%
60%
80%
100%
June July August September October November
Perc
ent D
iet b
y W
eigh
t
Other Prey ItemsFishOther Aquatic Invertebrates
ZooplanktonEphemeropteransChaoboridsChironomids
N = 67 N = 138 N = 42 N = 103 N = 98 N = 47
20%
40%
60%
80%
100%
June July August September October November
Perc
ent D
iet b
y W
eigh
t
Other Prey ItemsFishOther Aquatic Invertebrates
ZooplanktonEphemeropteransChaoboridsChironomids
N = 67 N = 138 N = 42 N = 103 N = 98 N = 47
Figure 9. Temporal food habits of adult white perch collected from Kerr Reservoir, Virginia during 2004. N = number of perch that contained food and were used in diet analysis.
53
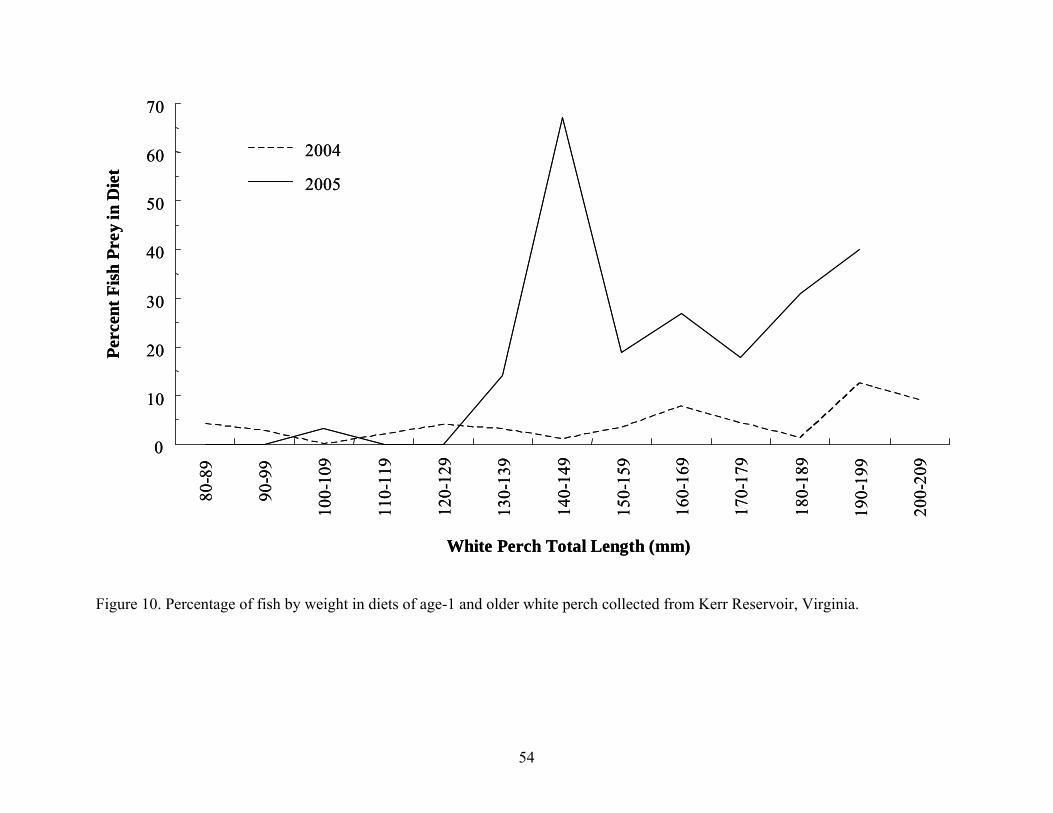
0
10
20
30
40
50
60
70
80-8
9
90-9
9
100-
109
110-
119
120-
129
130-
139
140-
149
150-
159
160-
169
170-
179
180-
189
190-
199
200-
209
White Perch Total Length (mm)
Perc
ent F
ish
Prey
in D
iet
2004
2005
0
10
20
30
40
50
60
70
80-8
9
90-9
9
100-
109
110-
119
120-
129
130-
139
140-
149
150-
159
160-
169
170-
179
180-
189
190-
199
200-
209
White Perch Total Length (mm)
Perc
ent F
ish
Prey
in D
iet
2004
2005
Figure 10. Percentage of fish by weight in diets of age-1 and older white perch collected from Kerr Reservoir, Virginia.
54

Figure 11. Diet composition of white perch collected throughout the Roanoke River, Virginia during May of 2005. N = number of perch that contained food and were used in diet analysis.
Other Prey Items
Fish SpeciesStriped Bass Larvae
Striped Bass Eggs
White Perch Eggs
Other Aquatic Invertebrates
PlecopteransEphemeropteransChironomids
20%
40%
60%
80%
100%
Clarkton (58 km)
Ridgeway (39 km)
Watkins (26 km)
Route 360 (14 km)
Staunton View (0 km)
Perc
ent D
iet b
y W
eigh
t
N = 70 N = 111 N = 131 N = 136 N = 284
55

56
2005 Food Habits. - Of the 986 white perch collected in May of 2005, 74% had food in
their stomachs. As in 2004, white perch collected in 2005 preyed predominately on aquatic
insects, principally chironomids and ephemeropterans (Figure 11). Aquatic insects represented
between 59% and 98% (by weight) of white perch diets at all sites. Percid, cyprinid, and clupeid
species were found infrequently (FOO < 3% at any site) in the stomachs of white perch
throughout May 2005, and were never a large portion of diet (< 2% by weight) at any site.
Unlike 2004, larval fish predation by white perch was observed during May 2005. All larval
predation found was of newly hatched striped bass, but it was only observed in the stomachs of
white perch collected at three locations (Ridgeway Farms, Watkins Bridge, and Staunton View).
Observed predation on striped bass larvae was low, and larvae never exceeded 1% of white perch
diets by weight (Figure 11). Additionally, larvae were rarely found in stomachs of white perch
(frequency of occurrence < 2% at all sites) (Figure 12).
The only other prey items regularly found in the diets of white perch collected in May of
2005 were striped bass and white perch eggs. Striped bass eggs were found in white perch
stomach contents at all collection sites except Staunton View, but they were a relatively small
proportion of perch diets at Clarkton Bridge (2% by weight) and 360 Bridge (< 1% by weight).
However, striped bass eggs were a much larger proportion of white perch stomach contents at
Ridgeway Farms (31% by weight) and Watkins Bridge (40% by weight), with approximately
40% (Ridgeway Farms) and 52% (Watkins Bridge) of the non-empty white perch stomachs
containing striped bass eggs (Figure 12). Striped bass eggs were comprised larger proportions of
white perch diets (up to 93% by weight) on days during the peak striped bass spawn (see Table
13), indicating that much of the egg predation occurred during this period. Additionally, striped
bass eggs were eaten by a large percentage (frequency of occurrence as high as 100%) of white
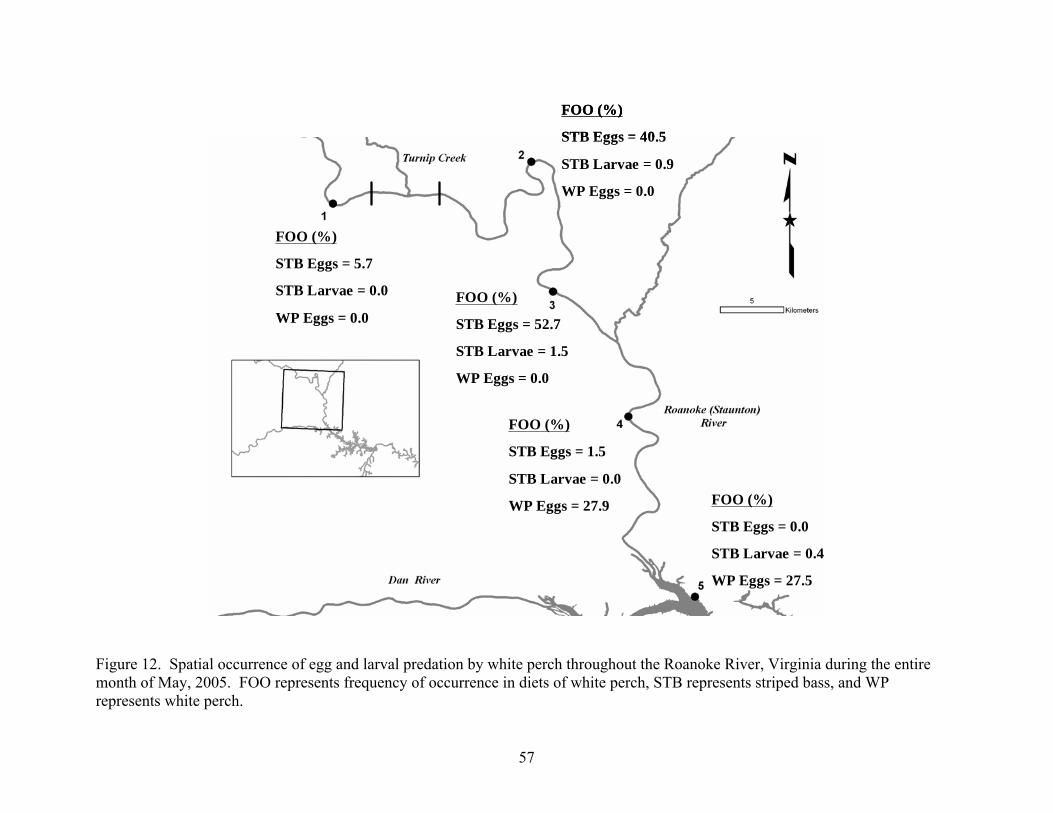
FOO (%)
STB Eggs = 5.7
STB Larvae = 0.0
WP Eggs = 0.0
FOO (%)
STB Eggs = 40.5
STB Larvae = 0.9
WP Eggs = 0.0
FOO (%)
STB Eggs = 52.7
STB Larvae = 1.5
WP Eggs = 0.0
FOO (%)
STB Eggs = 1.5
STB Larvae = 0.0
WP Eggs = 27.9 FOO (%)
STB Eggs = 0.0
STB Larvae = 0.4
WP Eggs = 27.5
FOO (%)
STB Eggs = 5.7
STB Larvae = 0.0
WP Eggs = 0.0
FOO (%)
STB Eggs = 40.5
STB Larvae = 0.9
WP Eggs = 0.0
FOO (%)
STB Eggs = 52.7
STB Larvae = 1.5
WP Eggs = 0.0
FOO (%)
STB Eggs = 1.5
STB Larvae = 0.0
WP Eggs = 27.9 FOO (%)
STB Eggs = 0.0
STB Larvae = 0.4
WP Eggs = 27.5
Figure 12. Spatial occurrence of egg and larval predation by white perch throughout the Roanoke River, Virginia during the entire month of May, 2005. FOO represents frequency of occurrence in diets of white perch, STB represents striped bass, and WP represents white perch.
57

Table 13. Daily accounts of striped bass egg predation by white perch collected from four locations within the Roanoke River, Virginia during the peak of striped bass spawning activity in 2005.
Site
Distance Upstream from
Reservoir DateStriped Bass
Spawning Activity N FOO (%) Percent Diet by Weight
Clarkton 58 (km) 4-May-05 Low 25 0 0Bridge 10-May-05 Peak 12 17 2
12-May-05 Peak 33 6 5
Ridgeway 39 (km) 3-May-05 Low 16 0 0Farms 5-May-05 Low 8 0 0
9-May-05 Low 22 0 011-May-05 Peak 24 67 3913-May-05 Peak 21 100 9114-May-05 Peak 20 40 29
Watkins 26 (km) 3-May-05 Low 9 0 0Bridge 4-May-05 Low 9 0 0
9-May-05 Low 4 0 010-May-05 Peak 10 50 5011-May-05 Peak 17 88 4512-May-05 Peak 25 88 6013-May-05 Peak 26 100 9314-May-05 Peak 13 8 116-May-05 Low 18 0 0
360 Bridge 14 (km) 3-May-05 Low 13 0 0Bridge 11-May-05 Peak 26 4 < 1
12-May-05 Peak 35 3 213-May-05 Peak 22 0 016-May-05 Low 18 0 017-May-05 Low 21 0 0
Striped Bass Eggs
58

59
perch collected at Ridgeway Farms and Watkins Bridge on days during the peak spawn (Table
13). During the entire month of May, 10% of non-empty white perch stomachs (pooled from all
sites) contained striped bass eggs (12% of stomach contents by weight), while during the peak
striped bass spawn, 42% of all non-empty white perch contained eggs of striped bass (31% of
stomach contents by weight). The differences in consumption of eggs during these two periods
is further indication that striped bass egg predation by white perch was primarily concentrated
during the peak spawning period. White perch eggs were found in white perch diets only at the
two most downstream sites (360 Bridge and Staunton View), and were between 15% and 18% of
stomach contents by weight.
White perch collected in the summer and fall months of 2005 fed on a variety of prey
items (Figure 13). In June and July, ephemeropterans, fish (clupeids, centrarchids, and
cyprinids), and chironomids constituted approximately 90% of white perch diets by weight, with
ephemeropterans being the dominant prey item (40% by weight). During these months, fish
(primarily clupeid species) represented 29% (July) and 35% (August) of white perch stomach
contents by weight. From September through October, white perch fed mainly on chironomids,
ephemeropterans, and cladocerans (Figure 13), with chironomids representing at least 52% of
stomach contents by weight in both months. In September and October, fish comprised less than
12% of white perch stomach contents by weight. By November, fish (primarily clupeids) were
the principal prey for adult white perch, constituting greater than 90% of stomach contents by
weight for the months of November and December. As in 2004, the only species of juvenile
sportfish found in stomach contents of adult white perch were age-0 lepomid species, but
sunfishes were never more than 7% of stomach contents by weight in any month. In 2005, fish
prey was found in the stomachs of white perch greater than 90 mm TL, but fish prey only

60
Other Prey ItemsFishOther Aquatic Invertebrates
ZooplanktonEphemeropteransChaoboridsChironomids
20%
40%
60%
80%
100%
July August September October November December
Perc
ent D
iet b
y W
eigh
t
N = 41 N = 82 N = 63 N = 121 N = 19 N = 6
Other Prey ItemsFishOther Aquatic Invertebrates
ZooplanktonEphemeropteransChaoboridsChironomids
20%
40%
60%
80%
100%
July August September October November December
Perc
ent D
iet b
y W
eigh
t
N = 41 N = 82 N = 63 N = 121 N = 19 N = 6
Figure 13. Temporal distribution of food habits of adult white perch collected from Kerr Reservoir, Virginia during 2005. N = number of perch that contained food and were used in diet analysis.

61
constituted considerable proportions of white perch diets (>20% by weight) in fish greater than
140 mm TL (see Figure 10).
Stomachs of white perch collected in April 2005 trapnet surveys contained crappie eggs.
Of the 11 perch collected during this time, five had prey items in their stomach, and two of
thesecontained the eggs of Pomoxis species. A total of 46 crappie eggs were found in the
stomachs of the two white perch.
Estimates of Total Egg Predation. - Projected population sizes of white perch required to
consume given percentages of striped bass eggs spawned during the peak spawn of 2005 varied
with egg production estimates and white perch consumption rates (Table 14). In my analysis, the
average (64.5 g) white perch ate 520 striped bass eggs/day (58% diet by weight) for eight days.
In the worst-case scenario (lowest egg production and highest consumption), large numbers of
white perch (> 68,724 perch) would be needed throughout the Roanoke River to consume at least
50% of the striped bass eggs. Egg predation was only observed in a 44-km stretch of river from
Clarkston Bridge (just above the mean striped bass spawning location) to 360 Bridge, so these
populations would have to be concentrated in this section of River. This translates to totals of
greater than 1,561 white perch needed per kilometer in this section of the Roanoke River to
consume at least 50% of the striped bass eggs.
In average circumstances (egg production and consumption), predicted population sizes
of white perch were approximately five times larger than the worst-case scenarios (Table 14). At
least 295,344 (6,713 perch/km) white perch would be required to consume at least 50% of the
total number of striped bass eggs spawned during the peak spawning period.
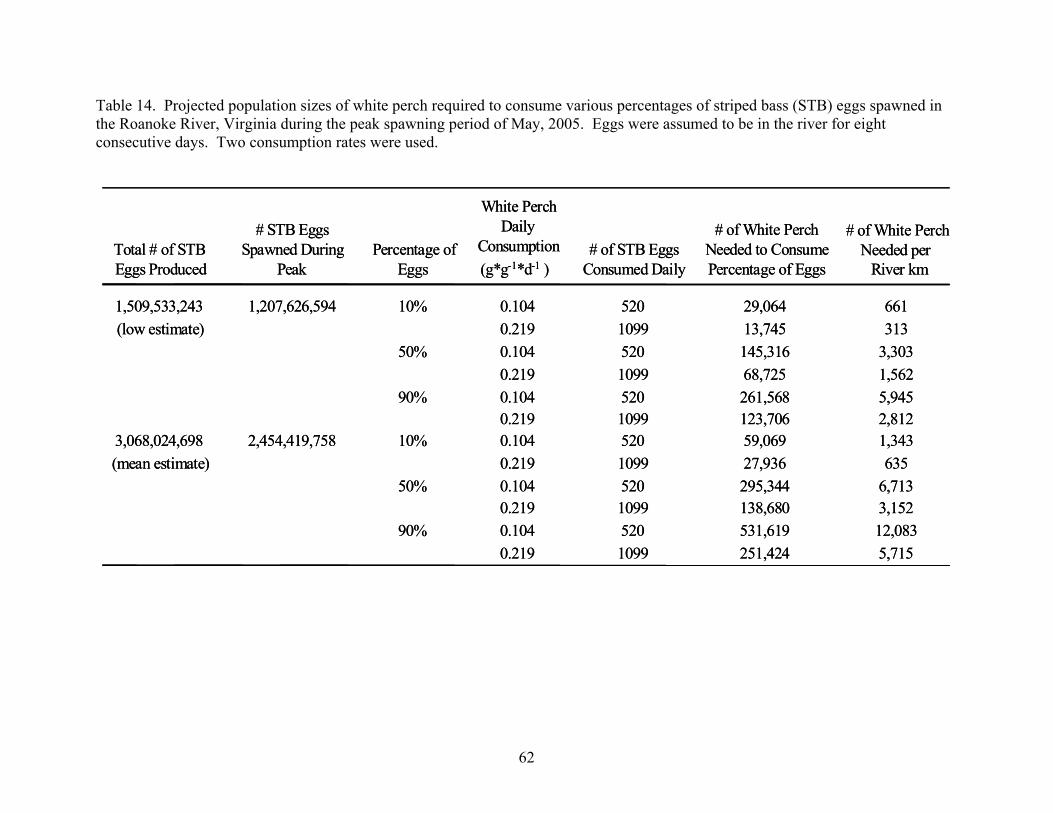
Total # of STB Eggs Produced
# STB Eggs Spawned During
PeakPercentage of
Eggs
White Perch Daily
Consumption (g*g-1*d-1 )
# of STB Eggs Consumed Daily
# of White Perch Needed to Consume Percentage of Eggs
# of White PerchNeeded per
River km
1,509,533,243 1,207,626,594 10% 0.104 520 29,064 661(low estimate) 0.219 1099 13,745 313
50% 0.104 520 145,316 3,3030.219 1099 68,725 1,562
90% 0.104 520 261,568 5,9450.219 1099 123,706 2,812
3,068,024,698 2,454,419,758 10% 0.104 520 59,069 1,343(mean estimate) 0.219 1099 27,936 635
50% 0.104 520 295,344 6,7130.219 1099 138,680 3,152
90% 0.104 520 531,619 12,0830.219 1099 251,424 5,715
Table 14. Projected population sizes of white perch required to consume various percentages of striped bass (STB) eggs spawned in the Roanoke River, Virginia during the peak spawning period of May, 2005. Eggs were assumed to be in the river for eight consecutive days. Two consumption rates were used.
62

Objective 2: Trophic Competition
Collection Results. - Age-0 specimens of crappies, largemouth bass, and striped bass as
well as white perch of all sizes were collected in the growing seasons of two successive years to
describe food habits and determine the potential for trophic competition. In both years, fish were
collected by seining and electrofishing unvegetated shorelines in the upper end of Kerr
Reservoir. Experimental gillnets and trapnets were unproductive for age-0 sportfish; no fishwere
collected with these methods. However, additional samples of age-0 striped bass and adult white
perch were obtained from VDGIF fall gillnet samples.
In 2004, collection began on June 15th and concluded on December 17th. During this
period, a total of 2107 age-0 fish and 668 adult white perch were collected (Table 15). Of the
age-0 fish collected, 43% were white perch, 25% were largemouth bass, 23% were striped bass,
and the remaining 9% were crappie.
As in 2004, fish collection in 2005 began in June (7th) and concluded by December (8th).
A total of 1646 age-0 fish were collected, with the majority (94%) being striped bass and
largemouth bass (Table 15). Additionally, 497 adult white perch were collected during this
period.
Age-0 Crappie Food Habits. - In 2004, adequate samples to quantify diets (determined
from cumulative prey species curves) of age-0 crappies were collected for all months of the
growing season except August. Throughout the 2004 growing season, juvenile crappies fed
heavily on aquatic insects (chironomids, ephemeropterans, and chaoborids) and zooplankton
(copepods and cladocerans), with these prey items representing greater than 93% of crappie
stomach contents by weight for every month (Figure 14). Composition of aquatic insects in the
diet varied from month to month, dependent on available prey items. From June through
63

64
Year MonthCollection Method
Age-0 Crappie
Age-0 Largemouth Bass
Age-0 Striped Bass
Age-0 White Perch
2004 Jun S 43 116 56 42Jul S, E 15 109 71 136
Aug E 4 73 67 177Sept E 19 68 71 119Oct E,V 50 81 138 241
2005
Table 15. Collection numbers of juvenile sportfish obtained from Kerr Reservoir, Virginia. Fish were collected by seining (S) boat electrofishing (E) and from VDGIF fall gillnet samples (V).
Nov E,V 40 59 62 157Dec E,V 31 14 15 33Total 202 520 480 905
Jun S 16 177 177 2Jul S, E 28 155 172 4
Aug E 14 188 185 3Sept E 4 116 102 16Oct E, V ---- 93 78 20Nov E, V ---- 19 74 ----Dec E, V ---- ---- 3 ----Total 62 748 791 45
---- no fi
Year MonthCollection Method
Age-0 Crappie
Age-0 Largemouth Bass
Age-0 Striped Bass
Age-0 White Perch
2004 Jun S 43 116 56 42Jul S, E 15 109 71 136
Aug E 4 73 67 177Sept E 19 68 71 119Oct E,V 50 81 138 241
2005
sh captured in respective month
Nov E,V 40 59 62 157Dec E,V 31 14 15 33Total 202 520 480 905
Jun S 16 177 177 2Jul S, E 28 155 172 4
Aug E 14 188 185 3Sept E 4 116 102 16Oct E, V ---- 93 78 20Nov E, V ---- 19 74 ----Dec E, V ---- ---- 3 ----Total 62 748 791 45
---- no fish captured in respective month
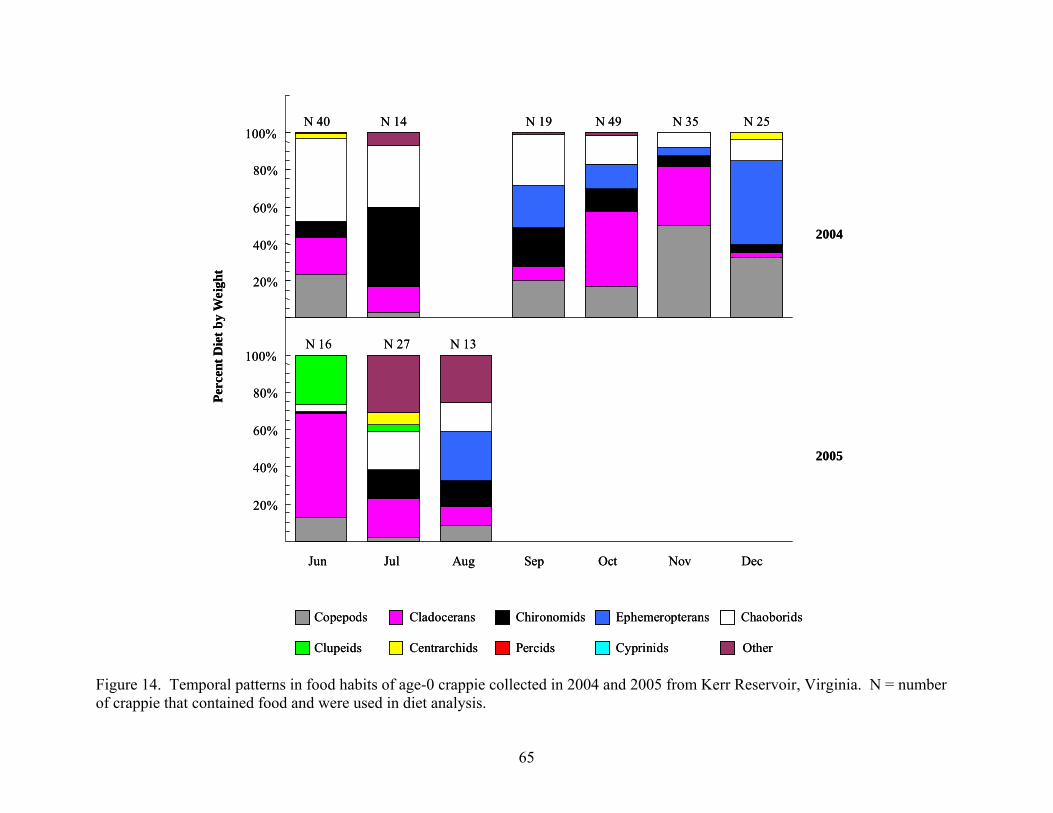
Figure 14. Temporal patterns in food habits of age-0 crappie collected in 2004 and 2005 from Kerr Reservoir, Virginia. N = number of crappie that contained food and were used in diet analysis.
OtherCyprinidsPercidsCentrarchidsClupeids
ChaoboridsEphemeropteransChironomidsCladoceransCopepods
2005
20%
40%
60%
80%
100%
Jun Jul Aug Sep Oct Nov Dec
Perc
ent D
iet b
y W
eigh
t2004
20%
40%
60%
80%
100%N 40 N 14 N 19 N 49 N 35 N 25
N 16 N 27 N 13
OtherCyprinidsPercidsCentrarchidsClupeids
ChaoboridsEphemeropteransChironomidsCladoceransCopepods
2005
20%
40%
60%
80%
100%
Jun Jul Aug Sep Oct Nov Dec
Perc
ent D
iet b
y W
eigh
t2004
20%
40%
60%
80%
100%N 40 N 14 N 19 N 49 N 35 N 25
N 16 N 27 N 13
65

66
September, chaoborids were the principal aquatic insect consumed (between 27% and 45% of
stomach contents by weight), after which all insect groups were equally represented in crappie
diets (Figure 14). Zooplankton consumption also varied from month to month (Figure 14), but
was a larger percentage (between 58% and 82% by weight) of crappie diets in the months of
October and November. Fish prey (lepomid species) also were found in the stomach contents of
age-0 crappies, but only in the months of June and December. During these months Lepomis
prey represented small proportions of crappie diets (< 5% by weight).
In 2005, food habits of age-0 crappies were only described in the summer months of the
growing season (June through August). During this time period, juvenile crappies preyed
primarily on zooplankton (copepods and cladocerans) and aquatic insects (amphipods, dipterans,
corixids, ephemeropterans, chaoborids, and trichopterans), with both categories combined
comprising greater than 74% of stomach contents by weight (Figure 14). Unlike 2004, fish
species (primarily age-0 clupeids) were found in the stomach contents of age-0 crappies
collected in 2005, but were only a considerable proportion (26% by weight) in the month of June
(Figure 14). The smallest piscivorous crappie was 31 mm TL.
Age-0 Largemouth Bass Food Habits. - Food habits of age-0 largemouth bass were
quantified throughout the growing seasons of 2004 and 2005. In 2004, juvenile largemouth bass
fed on a mixture of aquatic invertebrates (insects and zooplankton) and fish (centrarchids,
clupeids, cyprinids, and percids) during the growing season (Figure 15). Zooplankton (copepods
and cladocerans) was the largest proportion of juvenile diets in the months of June (43% of
stomach contents by weight) and October (33% of stomach contents by weight). During June,
all largemouth collected were less than 60 mm. In all other months, age-0 fishes (primarily
centrarchids and clupeids) were the dominant prey consumed by juvenile largemouth bass
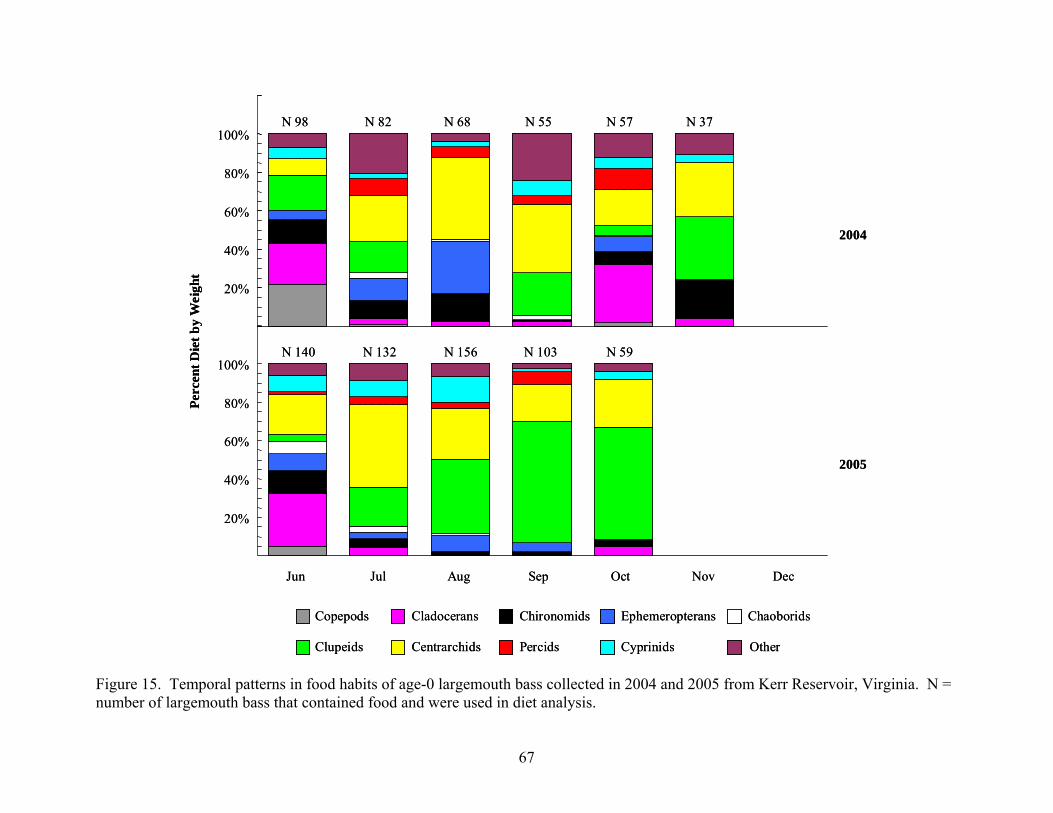
67
OtherCyprinidsPercidsCentrarchidsClupeids
ChaoboridsEphemeropteransChironomidsCladoceransCopepods
2004
20%
40%
60%
80%
100%
2005
20%
40%
60%
80%
100%
Jun Jul Aug Sep Oct Nov Dec
Perc
ent D
iet b
y W
eigh
t
N 98 N 82 N 68 N 55 N 57 N 37
N 140 N 132 N 156 N 103 N 59
OtherCyprinidsPercidsCentrarchidsClupeids
ChaoboridsEphemeropteransChironomidsCladoceransCopepods
2004
20%
40%
60%
80%
100%
2005
20%
40%
60%
80%
100%
Jun Jul Aug Sep Oct Nov Dec
Perc
ent D
iet b
y W
eigh
t
N 98 N 82 N 68 N 55 N 57 N 37
N 140 N 132 N 156 N 103 N 59
Figure 15. Temporal patterns in food habits of age-0 largemouth bass collected in 2004 and 2005 from Kerr Reservoir, Virginia. N = number of largemouth bass that contained food and were used in diet analysis.

68
(Figure 15), representing at least 41% of diets by weight. Fish consumption remained relatively
consistent for the remaining months of the growing season, except for September and November
when fish prey represented greater than 65% of stomach contents by weight. Percids and
cyprinids were the only other fish prey found in stomachs of age-0 largemouth bass.
In 2005, food habits of age-0 largemouth bass displayed temporal shifts in prey types.
Although juveniles were piscivorous in all months, largemouth bass stomach contents contained
an assortment of fish (35% of stomach contents by weight), aquatic insects (33% of stomach
contents by weight), and zooplankton (32% of stomach contents by weight) in June of 2005
(Figure 15). In July, juvenile largemouth bass fed almost exclusively on age-0 fish species
(centrarchids, clupeids, cyprinids, percids), which represented approximately 75% of juvenile
stomach contents by weight (Figure 15). In this period when largemouth diets shifted to fish, the
majority of juveniles were approaching 80 mm in length (see Figure 5). From August through
October, greater than 82% of largemouth stomach contents by weight were composed of fish,
with fish consumption reaching its height (approximately 90% of stomach contents by weight) in
September. Composition of fish consumed by age-0 largemouth bass also changed during the
2005 growing season. In the early months of the growing season, age-0 centrarchids were the
dominant fish prey consumed (Figure 15), but by September approximately 63% (by weight) of
largemouth bass diets were composed of age-0 clupeids.
In both years of this study, age-0 largemouth bass displayed a size-dependent shift in
food habits during the growing season (Figure 16). In 2004, stomach contents of juvenile
largemouth <100 mm were composed of large proportions (greater than 40% by weight) of
aquatic invertebrates (aquatic insects and zooplankton). However, aquatic insects were
considerably lower proportions of stomach contents of juveniles greater than 100 mm and were
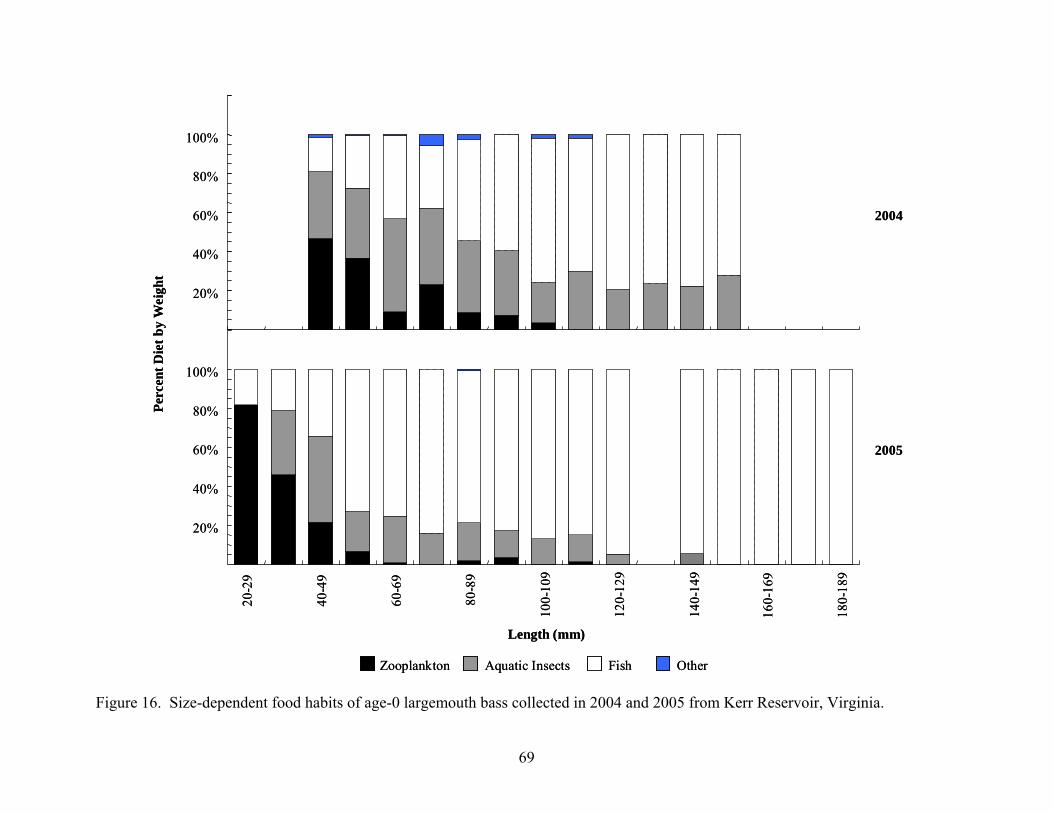
OtherFishAquatic InsectsZooplankton
2004
20%
40%
60%
80%
100%Pe
rcen
t Die
t by
Wei
ght
2005
20%
40%
60%
80%
100%
20-2
9
40-4
9
60-6
9
80-8
9
100-
109
120-
129
140-
149
160-
169
180-
189
Length (mm)
OtherFishAquatic InsectsZooplankton
2004
20%
40%
60%
80%
100%Pe
rcen
t Die
t by
Wei
ght
2005
20%
40%
60%
80%
100%
20-2
9
40-4
9
60-6
9
80-8
9
100-
109
120-
129
140-
149
160-
169
180-
189
Length (mm)
Figure 16. Size-dependent food habits of age-0 largemouth bass collected in 2004 and 2005 from Kerr Reservoir, Virginia.
69

70
replaced by fish prey (Figure 16). In 2005, this same shift occurred in age-0 largemouth bass
food habits, but at a much smaller size (approximately 50 mm; Figure 16).
Age-0 Striped Bass Food Habits. - In both 2004 and 2005, age-0 striped bass displayed
temporal shifts in consumed prey items during the growing seasons (Figure 17). In June of 2004,
striped bass (mean length of 50 mm) fed on a variety of diet items, including fish (clupeids and
centrarchids), zooplankton (copepods and cladocerans), and aquatic insects (chaoborids and
chironomids) (Figure 17). Age-0 fishes represented the largest proportion of striped bass
stomach contents in June (approximately 52% by weight), while 46% of stomach contents by
weight were comprised of zooplankton and aquatic insects. Fish and aquatic insects, but not
zooplankton, continued to be significant proportions of striped bass diets until the end of August
(Figure 17). After August, striped bass fed primarily on age-0 fishes, which represented between
62% and 75% of juvenile stomach contents by weight for the rest of the growing season. This
diet shift to fish prey after August occurred when striped bass were approaching 120 mm (see
Figure 4). Of the fish consumed by striped bass, age-0 clupeids were the dominant prey type
(Figure 17), representing greater than 62% of stomach contents by weight for all months after
August.
A similar trend in food habits of age-0 striped bass was exhibited during 2005, but it
occurred much earlier in the growing season (Figure 17). In June of 2005, striped bass ate an
assortment of prey types, distributed rather evenly amounts of zooplankton, aquatic insects, and
fish. By July, age-0 fishes (mainly clupeids) became the principal prey item, representing
greater than 80% of striped bass diets by weight for each month after June (Figure 17).
Size-dependent shifts in food habits of age-0 striped bass were exhibited in both 2004 and
2005. In 2004, age-0 striped bass fed on a mixture of aquatic insects, zooplankton, and fish

Figure 17. Temporal patterns in food habits of age-0 striped bass collected in 2004 and 2005 from Kerr Reservoir, Virginia. N = number of striped bass that contained food and were used in diet analysis.
OtherCyprinidsPercidsCentrarchidsClupeids
ChaoboridsEphemeropteransChironomidsCladoceransCopepods
2004
20%
40%
60%
80%
100%
Perc
ent D
iet b
y W
eigh
t
2005
20%
40%
60%
80%
100%
Jun Jul Aug Sep Oct Nov Dec
N 48 N 46 N 57 N 61 N 104 N 33
N 143 N 143 N 141 N 94 N 48 N 64
OtherCyprinidsPercidsCentrarchidsClupeids
ChaoboridsEphemeropteransChironomidsCladoceransCopepods
2004
20%
40%
60%
80%
100%
Perc
ent D
iet b
y W
eigh
t
2005
20%
40%
60%
80%
100%
Jun Jul Aug Sep Oct Nov Dec
N 48 N 46 N 57 N 61 N 104 N 33
N 143 N 143 N 141 N 94 N 48 N 64
71

72
species at sizes less than 130 mm (Figure 18). Juvenile striped bass >130 mm preyed primarily
(greater the 80% of stomach contents by weight) on fishes (mostly age-0 clupeids). In 2005, the
same shift occurred, but at a much smaller size than in 2004 (Figure 18). Greater than 83% of
stomach contents by weight were composed of fish in striped bass larger than 70 mm, while fish
smaller than 70 mm consumed mixtures of fish and aquatic invertebrates (Figure 18). In 2005,
striped bass were able to become piscivorous at smaller sizes because of the high abundance of
the smaller clupeid species (threadfin shad) as opposed to the larger, faster growing clupeid
species (gizzard shad) in 2004. Additionally, juvenile striped bass collected in 2005 became
completely piscivorous at a length of 160 mm and grew to larger average sizes than striped bass
collected in 2004 (see Figures 4 and 5).
Age-0 White Perch Food Habits. - Diets of age-0 white perch were quantified for all
months of the growing season in 2004 but, due to low sample sizes, only the months of
September and October in 2005. In both years, aquatic invertebrates were the only prey items
consumed by age-0 white perch (Figure 19). In 2004, composition of invertebrates found in
perch stomachs varied from month to month (Figure 19). Cladocerans were the primary prey
item consumed in the months of June, October, and November, representing 43%, 50%, and 61%
of stomach contents by weight in respective months. In every other month, chaoborids,
chironomids, and ephemeropterans were the principal prey items found in diets of age-0 white
perch (Figure 19).
White perch collected in September and October of 2005 fed primarily on chironomids
(greater than 62% of stomach contents by weight in each month) (Figure 19). In September but
not October, considerable portions (approximately 31%) of cladocerans also were found in the
stomach contents of age-0 white perch. The only other prey items consumed by white perch
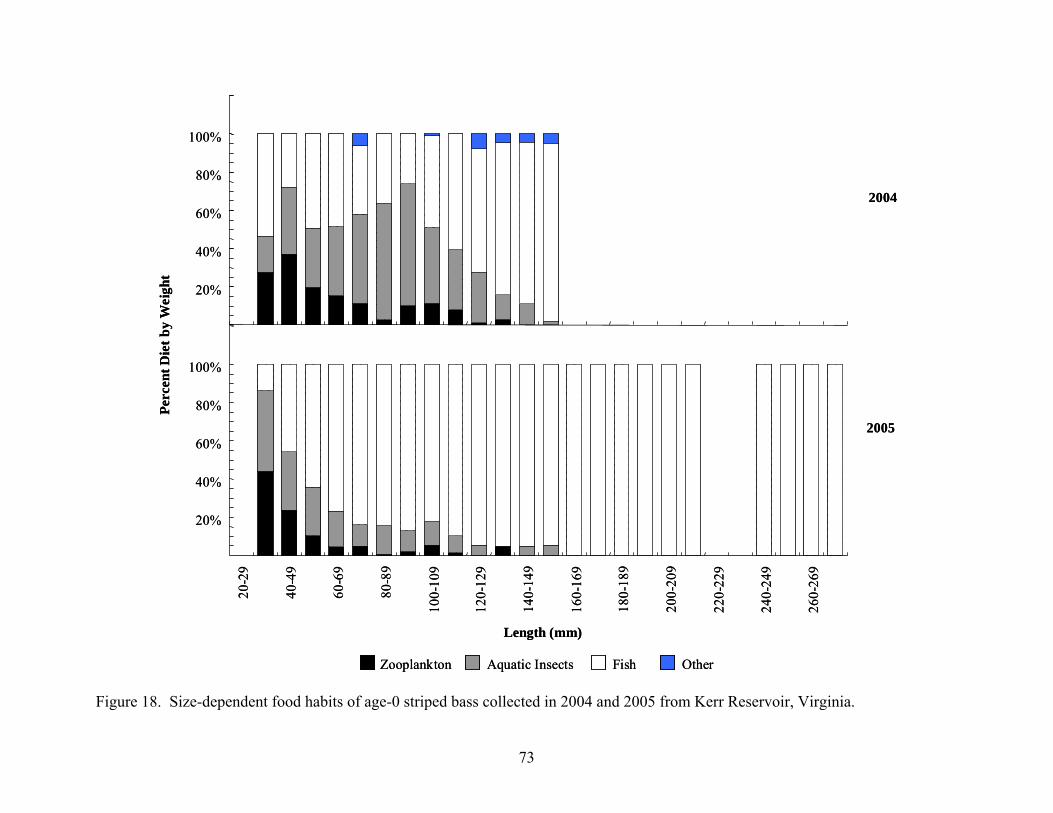
OtherFishAquatic InsectsZooplankton
2004
20%
40%
60%
80%
100%
Perc
ent D
iet b
y W
eigh
t
2005
20%
40%
60%
80%
100%
20-2
9
40-4
9
60-6
9
80-8
9
100-
109
120-
129
140-
149
160-
169
180-
189
200-
209
220-
229
240-
249
260-
269
Length (mm)
OtherFishAquatic InsectsZooplankton
2004
20%
40%
60%
80%
100%
Perc
ent D
iet b
y W
eigh
t
2005
20%
40%
60%
80%
100%
20-2
9
40-4
9
60-6
9
80-8
9
100-
109
120-
129
140-
149
160-
169
180-
189
200-
209
220-
229
240-
249
260-
269
Length (mm)
Figure 18. Size-dependent food habits of age-0 striped bass collected in 2004 and 2005 from Kerr Reservoir, Virginia.
73
74
OtherCyprinidsPercidsCentrarchidsClupeids
ChaoboridsEphemeropteransChironomidsCladoceransCopepods
2005
20%
40%
60%
80%
100%
Jun Jul Aug Sep Oct Nov Dec
2004
20%
40%
60%
80%
100%
Perc
ent D
iet b
y W
eigh
t
N 16 N 20
N 42 N 121 N 162 N 108 N 207 N 151 N 25
OtherCyprinidsPercidsCentrarchidsClupeids
ChaoboridsEphemeropteransChironomidsCladoceransCopepods
2005
20%
40%
60%
80%
100%
Jun Jul Aug Sep Oct Nov Dec
2004
20%
40%
60%
80%
100%
Perc
ent D
iet b
y W
eigh
t
N 16 N 20
N 42 N 121 N 162 N 108 N 207 N 151 N 25
Figure 19. Temporal patterns in food habits of age-0 white perch collected in 2004 and 2005 from Kerr Reservoir, Virginia. N = number of perch that contained food and were used in diet analysis.

75
collected in 2005 were copepods, chaoborids, ephemeropterans, and odonates, but these were
never large percentages of diets (Figure 19). White perch grew relatively slow compared to
striped bass (see Figures 4 and 5), and by fall (end of the growing season) of both years white
perch were only approaching 100 mm.
Diet Overlap. - Diet composition of age-0 sportfishes versus both juvenile and adult
white perch were compared monthly and by length intervals in both years of this study to
determine potential for trophic competition. Additionally, adult white perch diets were
compared annually to diets of adult sportfish for both 2004 and 2005. To make overlap
estimates realistic in terms of potential competition, a variety of prey categories were used in
comparison between white perch and sportfish (Table 16). A prey category was included in
overlap analysis if that category represented at least 5% (by weight) of the stomach contents of
one or more species in at least one month during collections.
In 2004, trophic overlap values between age-0 sportfishes versus age-0 white perch were
the highest in early months of the growing season (Table 17). During this time, all age-0 species
were dependent on aquatic insects and zooplankton for much of their nutrition. Although
overlap values were highest for all species in the summer months, significant overlap (>0.6) with
white perch was only found for age-0 crappies in the months of June, July, and September. In
these months, the diets of crappie and white perch were almost completely composed of aquatic
invertebrates, while largemouth bass and striped bass had considerable proportions of fish in
their diets. Overlap between crappies and age-0 white perch declined somewhat for the
remainder of the growing season (Table 17). During this time, age-0 crappies consumed small
cladocerans species (e.g. Bosmina), whereas age-0 white perch fed primarily on larger
cladocerans species (e.g. Daphnia). Diets of adult white perch displayed significant overlap with

Table 16. Prey categories used in all Schoener’s Overlap comparisions between white perch x age-0 and adult sportfish from Kerr Reservoir, Virginia. Prey categories are listed by prey type.
Fish Zooplankton Aquatic InsectsOther Aquatic Invertebrates Other
Alosa species Bosmina Ceratopogonidae Amphipoda Organic debrisCentrarchid species Calanoid Copepods Chaoboridae Corbicula Terrestrail InsectDorosoma species Daphnia Chironomidae Decapoda
Gambusia Ostracods Corixidae HirudineaIctalurid species Parasitic Copepods Culicidae HydracarinaNotropis species DytiscidaePercid species Elmidae
EphemeropteraHemiptera
HymenopteraOdonata
PlecopteraTabanidaeTipulidae
Trichoptera
76
---- Minimum number of stomachs to adequately characterizes food habits not acquired
Month CrappieLargemouth
Bass Striped Bass CrappieLargemouth
Bass Striped Bass
Jun 0.71 0.52 0.46 0.08 0.10 0.09
Jul 0.77 0.22 0.48 0.31 0.32 0.38Aug ---- 0.24 0.57 0.43 0.28 0.31
Sep 0.71 0.15 0.27 0.68 0.23 0.29
Oct 0.46 0.48 0.30 0.46 0.49 0.28
Nov 0.15 0.16 0.13 0.17 0.17 0.13
Dec 0.57 ---- ---- ---- ---- ----
Age-0 White Perch Adult White Perch
Table 17. Diet overlap for age-0 sportfishes versus white perch collected in 2004 from Kerr Reservoir, Virginia.
77

age-0 crappies, but only in September. Overlap was the highest in this month due to large
proportions of ephemeropterans and chaoborids present in the diets of each species. Overlap
between adult white perch and all other species was relatively low throughout the growing
season (Table 17).
In 2005, I was unable to capture age-0 white perch consistently throughout the growing
season, and adequate numbers of perch stomachs to describe diets were only collected in
September and October. For this reason, food habits of age-0 sportfishes collected in 2005 were
compared separately to diets of white perch collected in both years of this study. Overlap values
between age-0 sportfishes collected in 2005 and age-0 white perch collected in 2004 were
highest in the June (Table 18), the month when all juveniles fed heavily on aquatic invertebrates.
Significant overlap was only observed between age-0 crappies and age-0 white perch, and only
for the diets described in the months of June. Overlap values between all age-0 sportfish
collected in 2005 and adult white perch collected in 2004 were relatively low in months when
diets were described (Table 18). From the white perch collected in 2005, significant diet overlap
(0.79) was only observed with age-0 striped bass and adult white perch during the month of
November. At this time both species heavily fed on age-0 clupeid species.
In both 2004 and 2005, trophic overlap values between adult white perch versus each
species of adult sportfish, with the exception of crappies, were low (Table 19). Trophic overlap
between adult crappies and white perch was high in both years but was only significant (0.73) in
2005. Both adult crappies and white perch consumed considerable portions of aquatic
invertebrates in both 2004 and 2005 leading to similarities in diets for these species. The only
other sportfish species that consumed large proportions of invertebrates was white catfish
(Ameiurus catus), but the majority of the invertebrates consumed were Asiatic clams (Corbicula
78
79
---- M
Month CrappieLargemouth
BassStriped Bass Crappie
Largemouth Bass
Striped Bass
Jun 0.61 0.48 0.49 0.07 0.18 0.19
Jul 0.48 0.15 0.11 0.25 0.23 0.18Aug 0.44 0.14 0.07 0.48 0.13 0.09
Sept ---- 0.07 0.02 ---- 0.11 0.04Oct
Nov
Dec
Jun
Jul
Aug
Sept
Oct
NovDec
2004 Age-0 White Perch 2004 Adult White Perch
Table 18. Diet overlap for age-0 sportfishes collected in 2005 versus white perch collected in 2004 and 2005 from Kerr Reservoir, Virginia.
inimum number of stomachs to adequately characterizes food habits not acquired
---- 0.11 0.08 ---- 0.13 0.10
---- ---- 0.00 ---- ---- 0.01
---- ---- ---- ---- ---- ----
CrappieLargemouth
BassStriped Bass Crappie
Largemouth Bass
Striped Bass
---- ---- ---- ---- ---- ----
---- ---- ---- 0.25 0.36 0.30
---- ---- ---- 0.48 0.28 0.42
---- 0.06 0.02 ---- 0.16 0.08
---- 0.05 0.05 ---- 0.20 0.18
---- ---- ---- ---- ---- 0.79---- ---- ---- ---- ---- ----
2005 Age-0 White Perch 2005 Adult White Perch
---- M
Month CrappieLargemouth
BassStriped Bass Crappie
Largemouth Bass
Striped Bass
Jun 0.61 0.48 0.49 0.07 0.18 0.19
Jul 0.48 0.15 0.11 0.25 0.23 0.18Aug 0.44 0.14 0.07 0.48 0.13 0.09
Sept ---- 0.07 0.02 ---- 0.11 0.04Oct
Nov
Dec
Jun
Jul
Aug
Sept
Oct
NovDec
2004 Age-0 White Perch 2004 Adult White Perch
inimum number of stomachs to adequately characterizes food habits not acquired
---- 0.11 0.08 ---- 0.13 0.10
---- ---- 0.00 ---- ---- 0.01
---- ---- ---- ---- ---- ----
CrappieLargemouth
BassStriped Bass Crappie
Largemouth Bass
Striped Bass
---- ---- ---- ---- ---- ----
---- ---- ---- 0.25 0.36 0.30
---- ---- ---- 0.48 0.28 0.42
---- 0.06 0.02 ---- 0.16 0.08
---- 0.05 0.05 ---- 0.20 0.18
---- ---- ---- ---- ---- 0.79---- ---- ---- ---- ---- ----
2005 Age-0 White Perch 2005 Adult White Perch
Table 19. Diet overlap for adult sportfishes versus adult white perch collected in 2004 and 2005 from Kerr Reservoir, Virginia.
Species 2004 2005
Blue Catfish 0.18 0.37
Channel Catfish 0.31 0.18
Crappie 0.50 0.73
Largemouth Bass 0.08 0.22
Striped Bass 0.05 0.20
Walleye 0.02 0.21
White Bass 0.02 0.21
White Cat 0.03 0.28
Year
Species 2004 2005
Blue Catfish 0.18 0.37
Channel Catfish 0.31 0.18
Crappie 0.50 0.73
Largemouth Bass 0.08 0.22
Striped Bass 0.05 0.20
Walleye 0.02 0.21
White Bass 0.02 0.21
White Cat 0.03 0.28
Year
80

81
fluminea), which were low percentages of white perch diets. All other sportfish species preyed
predominantly on fish prey, whereas white perch consumed primarily aquatic invertebrates.
Objective 3: Sportfish Utilization of White Perch
Collection Results. - Adult sportfish from Kerr Reservoir were collected in two
consecutive years to determine the degree to which they utilized white perch for forage. In 2004,
a total of 387 piscivorous fish were collected, including three species of catfish (blue, channel,
and white), crappie (white and black), largemouth bass, striped bass, walleye, and white bass
(see Table 20). The majority (66%) of the fish were collected from VDGIF fall gillnet samples,
the rest were collected by boat electrofishing gear during May through November.
In 2005, an increased number of adult sportfish were collected, partially due to
collections of crappie species via VDGIF trapnet surveys. From April through December, 785
piscivores were collected (see Table 20). Of the fish obtained for diet analysis, 60% were
collected from VGDIF gillnet samples, 29% from VDGIF trapnet surveys, and 11% from boat
electrofishing during age-0 fish collection.
Food Habits of Adult Sportfish. - In both years of the study, a variety of diet items were
consumed by adult sportfish (Figures 20 and 21). Adult catfishes (blue, channel, and white) ate
primarily aquatic insects (between 30% and 87% of diet by weight), clupeid species (between
6% and 63% of diet by weight), and organic matter (between 2% and 42% of diet by weight) in
2004 and 2005 (Figures 20 and 21). Aquatic invertebrates consumed were mainly Asiatic clams
(Corbicula fluminea) and ephemeropterans, while filamentous algae represented the largest
proportion of vegetative matter found in catfish diets. Although each of the catfish species
consumed similar prey items, the larger blue catfish species relied more on clupeid fish (63% and

Table 20. Adult sportfish collected from Kerr Reservoir, Virginia in 2004 and 2005.
Number Collected
Mean Length (mm)
Length Range (mm) Collection Method Month Collected
2004
Blue catfish 64 437 167-776 VDGIF Gillnets Oct., Nov., Dec.Channel Catfish 16 413 185-545 VDGIF Gillnets Oct., Nov., Dec.Crappie 48 255 125-370 Electrofishing, VDGIF Gillnets May, Oct., Nov., Dec.Largemouth Bass 111 281 123-535 Electrofishing Jul. through Nov.Striped Bass 107 546 357-810 VDGIF Gillnets Oct., Nov., Dec.Walleye 12 461 393-635 VDGIF Gillnets Oct., Nov., Dec.White Bass 5 301 257-362 VDGIF Gillnets Oct., Nov., Dec.White Catfish 24 279 202-332 VDGIF Gillnets Oct., Nov., Dec.
2005
Blue catfish 112 406 197-1020 VDGIF Gillnets Oct., Nov., Dec.Channel Catfish 33 426 255-512 VDGIF Gillnets Oct., Nov., Dec.Crappie 302 203 101-420 VDGIF Trapnets, VDGIF Gillnets Apr., Oct, Nov, Dec.Largemouth Bass 89 278 170-474 Electrofishing Jul. through Nov.Striped Bass 202 512 249-780 VDGIF Gillnets Oct., Nov., Dec.Walleye 5 545 500-586 VDGIF Gillnets Oct., Nov., Dec.White Bass 16 357 323-410 VDGIF Gillnets Oct., Nov., Dec.White Catfish 26 238 191-273 VDGIF Gillnets Oct., Nov., Dec.
82
OtherFish
WhitePerch
CentrarchidSpecies
ClupeidSpecies
OrganicMatter
AquaticInvertebrates
N = 30 N = 33 N = 10N = 55 N = 77 N = 7 N = 3N = 8
20%
40%
60%
80%
100%
Blu
e C
atfis
h
Cha
nnel
C
atfis
h
Cra
ppie
Sp
ecie
s
Larg
emou
thB
ass St
riped
B
ass
Wal
leye
Whi
te
Bas
s
Whi
te
Cat
fish
Perc
ent D
iet b
y W
eigh
t
Figure 20. Food habits of adult sportfish collected in Kerr Reservoir during 2004. N = number of fish that contained food and were used in diet analysis.
83
84
N = 59 N = 50 N = 155 N = 4 N = 12 N = 15N = 26 N = 264
OtherFish
WhitePerch
CentrarchidSpecies
ClupeidSpecies
OrganicMatter
AquaticInvertebrates
0%
20%
40%
60%
80%
100%
Blu
e C
atfis
h
Cha
nnel
C
atfis
h
Cra
ppie
Sp
ecie
s
Larg
emou
th
Bas
s
Strip
edB
ass
Wal
leye
Whi
te
Bas
s
Whi
te
Cat
fish
Perc
ent D
iet b
y W
eigh
t
Figure 21. Food habits of adult sportfish collected in Kerr Reservoir during 2005. N = number of fish that contained food and were used in diet analysis.

54% of diet by weight for 2004 and 2005, respectively) for nutrition whereas the smaller channel
and white catfishes ate more aquatic invertebrates and plant matter (Figures 20 and 21).
Crappie species were chiefly dependent on aquatic invertebrates (ephemeropterans,
chironomids, and zooplankton) in both 2004 and 2005 (Figure 20 and 21). Aquatic invertebrates
comprised 50% and 70% of crappie stomach contents by weight for 2004 and 2005, respectively.
Clupeid fishes were the only other prey item consistently eaten by crappie species (48% of diet
by weight for 2004 and 29% of diet by weight for 2005).
Unlike crappies, largemouth bass were almost completely piscivorous (Figures 20 and
21). In 2004, fish were 83% (by weight) of largemouth bass stomach contents, with clupeids
(55% of diet by weight) and centrarchids (14% of diet by weight) being the primary forage
fishes. As in 2004, clupeids (68% weight) and centrarchids (15% weight) were the primary prey
items found in largemouth bass stomachs during 2005. Other fishes consumed by largemouth
bass were ictalurids, cyprinids, and white perch, but never were more than 6% of diet by weight
for any species in either year.
Similar to largemouth bass, adult striped bass preyed predominantly on fish (> 98% of
stomach contents by weight for 2004 and 2005; Figures 20 and 21). Soft-rayed clupeids were
the dominant fish consumed by striped bass at percentages of 92 and 98 of their overall stomach
contents by weight in 2004 and 2005, respectively. Centrarchid, darter, and ictalurid species, as
well as white perch were also found in the diets of striped bass, but never individually exceeded
2% by weight.
The diets of walleye and white bass were also examined, but low collection numbers
made diet interpretation questionable. In both years, clupeids were the only prey found in the
stomachs of white bass and all but one walleye (Figure 20 and 21). A single white perch was the
85

86
only other diet item found in the stomach of a walleye captured in 2004, which represented 17%
of walleye stomach contents by weight. Considering the lack of white perch observed in the
diets of walleye collected the following year, this percentage may be an overestimation, and
needs to be viewed with caution.
In both years of the study, soft-rayed clupeids were the only prey item found in the
stomachs contents of all species of sportfishes, and were usually the highest percentage of the
diet (Figures 20 and 21). In contrast, white perch never exceeded 2% of diet by weight for any
sportfish species in either year, excluding walleye in 2004. White perch were only found in the
stomachs of 3 fish (1 largemouth bass, 1 striped bass, and 1 walleye) in 2004 and in the stomach
of 1 striped bass in 2005. Consequently, frequency of white perch predation was low to non-
existent for all species during both years (Table 21), except walleye collected in 2004
(approximately 14%).
White perch consumed by largemouth bass, striped bass, and walleye ranged in size from
82 mm to 152 mm total length (TL), with a mean length total length of 110 mm. The largest
white perch (152 mm TL) was found in the stomach contents of an adult walleye (635 mm TL).
The two striped bass (687 mm and 765 mm TL) ate white perch that were less than 125 mm TL.
Total lengths of white perch consumed by striped bass were 12% and 16% of the total lengths of
the predator that consumed them. The smallest white perch consumed (TL 88 mm) was found in
the stomach contents of a 324 mm (TL) largemouth bass.
Objective 4: Sportfish Performance
Comparative statistics were used to determine whether relative abundance and growth of
resident fish of Kerr Reservoir differed during the years prior to versus post-white perch
87
Table 21. Frequency of occurrence (FOO) of white perch found in diets of adult sportfishes collected in Kerr Reservoir, Virginia.
Species NFOO (%) of White Perch N
FOO (%) of White Perch
Blue catfish 30 0 59 0
Channel Catfish 8 0 26 0
Crappie 33 0 264 0
Largemouth Bass 55 1.6 50 0
Striped Bass 77 1.3 155
Walleye 7 14.3 4 0
White Bass 3 0 12 0
White Catfish 10 0 15 0
2004 2005
0.7
Species NFOO (%) of White Perch N
FOO (%) of White Perch
Blue catfish 30 0 59 0
Channel Catfish 8 0 26 0
Crappie 33 0 264 0
Largemouth Bass 55 1.6 50 0
Striped Bass 77 1.3 155
Walleye 7 14.3 4 0
White Bass 3 0 12 0
White Catfish 10 0 15 0
2004 2005
0.7

88
establishment in the reservoir. Annual data sets of electrofishing and gillnet sampling provided
CPUE, length, and length-at-age data on largemouth bass and striped bass, and CPUE data on
clupeid species and white bass. Reliable data on Kerr Reservoir crappie species were lacking, so
comparisons of abundance and growth of this species was not undertaken.
Electrofishing CPUEs of largemouth bass collected in spring electrofishing surveys were
significantly higher (Student’s t-test, df = 10, P < 0.001) in years after white perch establishment
(mean CPUE of 55 fish/hour, N = 6) than in years before white perch introduction (mean CPUE
of 25 fish/hour, N = 6). Annual proportional stock density and relative stock densities of
preferred length largemouth bass were not statistically different in years pre- versus post-white
perch (Table 22) with respective P-values of 0.768 (Student’s t-test, df = 11) and 0.473
(Student’s t-test, df = 11). Lengths of age-3 largemouth bass had a higher mean value (350 mm)
in years before white perch compared to lengths after white perch (343 mm), but median
differences were not significant (Mann Whitney “U” test, df = 226; P = 0.053).
Gillnet data revealed that relative abundances of striped bass and clupeid species were
not significantly different, with respective p-values of 0.240 (Student’s t-test, df = 21) and 0.075
(Mann Whitney “U” test, df = 14), between periods before versus after white perch
establishment. Conversely, white bass relative abundance was significantly lower (Student’s t-
test, df = 13, P = 0.012) in years after white perch introduction (mean CPUE of 0.22 fish/929 m2
of net, N = 8) compared to years before white perch (mean CPUE of 0.32 fish/929 m2 of net, N =
8). Striped bass growth was not statistically different in years before versus after white perch
(Mann Whitney “U” test, df = 181, P = 0.543) with age-3 fish averaging 628 mm (before perch)
and 632 mm (after perch).
Data Set N MeanStandard Deviation N Mean
Standard Deviation P-Value
Annual relative abundances of largemouth bass (N/hour) 6 25.03 3.43 6 55.14 14.64 P < 0.001
Annual PSDs of largemouth bass 7 71 14 6 74 10 P = 0.768
Annual RSD-Ps of largemouth bass 7 44 15 6 38 11 P = 0.473
Annual lengths of age-3 largemouth bass (mm) 183 350 58 45 343 27 P = 0.053
Annual relative abundances of striped bass (N/929 m2) 14 5.38 2.29 9 4.14 2.52 P = 0.240
Annual lengths of age-3 striped bass (mm) 57 628 32.1 126 632 44 P = 0.543
Annual relative abundances of clupeid species (N/929 m2) 8 24.2 15.89 8 20.09 26.28 P = 0.705
Annual relative abundances of white bass (N/929 m2) 7 0.66 0.32 8 0.25 0.22 P = 0.012
Before White Perch After White Perch
Table 22. Comparison results of Kerr Reservoir data sets in years prior to white perch introduction (1979-1986) versus years after white perch establishment (1996-2004).
89

DISCUSSION
The focus of this study was to evaluate the trophic relationships between white perch and
sportfishes (striped bass, crappie, and largemouth bass) of Kerr Reservoir to identify interactions
that may affect the recruitment and performance of the latter. Specific trophic interactions
examined were predation on sportfish eggs, larvae, and juveniles by white perch, competition for
food resources between white perch and sportfish species, and contribution of white perch to
diets of adult sportfish. Additionally, trends in sportfish performance (abundance and growth)
before versus after white perch establishment were evaluated and related to trophic interactions
with white perch.
White Perch Age and Growth
In Kerr Reservoir, white perch reached 100 mm TL by age 1, 200 mm TL by age 4, 250
mm TL by age 6, and 300 mm TL by age 9. Similar patterns in white perch growth have been
reported in North Carolina reservoirs (Tatum 1961; Carlander 1997) and in Lake Ontario (Sheri
and Power 1969). Higher growth of white perch has been documented in Nebraska reservoirs,
with perch attaining 230 mm TL by age 3. In their native estuaries, white perch growth is
typically slower than exhibited in Kerr Reservoir, with perch not achieving 100 mm TL until age
2, and 200 mm until age 6 (Mansueti 1961; Wallace 1971; St. Pierre and Davis 1972; Marcy and
Richards 1974; Cochran and Hesse 1994).
Indications that density-dependent factors are affecting white perch growth were apparent
in Kerr Reservoir due to the observance of declining growth of white perch in years after they
became abundant. Mean length of age-1 white perch declined from 124 mm TL in 1995 to 101
mm TL in 2005, and mean length of age-2 perch was reduced to 142 mm TL in 2004 compared
to 159 mm in 1995. Density-dependent growth of white perch is common in waters where white
90

perch are abundant (Hergenrader and Bliss 1971; Marcy and Richards 1974; Boileau 1985;
Wong et al. 1999).
Density-dependent reduction in growth of white perch can often lead to severe stunting of
white perch populations (Grice 1958). In Kerr Reservoir, the high abundance of white perch
does not appear to dramatically affect growth to the point that the population has become
severely stunted. In contrast, stunted populations of white perch in Indian Lake, Massachusetts
did not approach 150 mm TL until age 8 and no white perch 200 mm TL or greater were
collected (Grice 1958). In this lake, white perch grew less than 10 mm per year after age 2. Kerr
Reservoir white perch were approaching 150 mm TL by age 2 and reached 200 mm by age 4. In
Kerr Reservoir, anglers start to harvest white perch when they reach sizes of 150 mm and
regularly harvest fish that are greater 200 mm (DiCenzo 2001). Kerr Reservoir white perch
reached harvestable lengths by age 2 and preferred lengths by age 4.
Predation
Egg and Larval Predation by White Perch. - White perch collected in the Roanoke River
were ovivorous in May of both years, consuming the eggs of striped bass and white perch.
Predation on eggs of moronid species by white perch has also been observed in the Sandusky
River tributary of Lake Erie (Schaeffer and Margraf 1987), and in the Pamunkey River, Virginia
(McGovern and Olney 1988). Throughout the Roanoke River, striped bass eggs were low
proportions of the diets of the white perch I collected during May of 2004 (< 1 % by weight) and
2005 (12 % by weight), and were eaten in low frequency (FOO < 11 % in both years). In
contrast, Schaeffer and Margraf (1987) reported that nearly 100 % of white perch stomach
contents by weight were moronid and walleye eggs from May to June in the Sandusky River.
91

Although egg predation by white perch was observed in both 2004 and 2005,
consumption of striped bass eggs by white perch that I collected was much greater in 2005.
Difference in intensity and distribution of sampling effort and a longer peak spawning period in
2005 were the likely causes for the observed increased egg predation. In 2004, white perch were
only sampled during weekdays (Monday-Friday) and the majority of striped bass spawning
occurred during a weekend period (May 7-9). To avoid missing the peak spawning period in
2005, white perch were collected on both weekday and weekend periods during May of 2005.
Additionally, the peak spawning period of striped bass in 2005 was two days longer than in
2004, and the river had eggs in the water column for a longer period of time.
White perch consumption of striped bass eggs varied temporally and spatially during
May of both years. Based on sampling results, white perch primarily fed on striped bass eggs
during the peak period of striped bass spawning, and eggs were considerable proportions of the
diet during this period especially in 2005 (31% by weight for all sites combined). Eggs were
also eaten by a large percentage (FOO > 42% for all sites combined) of white perch collected
during this period in 2005. During this peak striped bass spawning period, greater than 80% of
the Roanoke River striped bass eggs produced are spawned (Neal 1969). It appears that Roanoke
River white perch are not specifically targeting striped bass eggs, but are only consuming eggs at
times when large quantities are present in the water column. Similarly, Roseman et al. (1996)
observed that a large proportion of white perch (approximately 86%) collected in western Lake
Erie contained walleye eggs when walleye incubation periods were prolonged, because these
eggs were then abundant when the reproductive periods of the two species overlapped. Further
evidence of opportunistic consumption of eggs by white perch is the egg cannibalism evidenced
by white perch collected from the Roanoke River.
92

Striped bass eggs were primarily consumed at only two of the five locations that I
sampled, Ridgeway Farms and Watkins Bridge. In 2004, striped bass eggs were only found in
the stomachs of white perch collected at these two sampling sites. In 2005, 41% (Ridgeway
Farms) and 52% (Watkins Bridge) of non-empty white perch stomachs collected during May
contained striped bass eggs. At all other locations, frequency of occurrence of eggs in white
perch diets never exceeded 6%. Striped bass eggs also constituted larger proportions of white
perch diets at Ridgeway Farms and Watkins Bridge (> 30% by weight at both sites in 2005)
versus all other locations where perch were collected (< 3% by weight at all locations in 2005).
Egg predation by white perch was especially high on specific days during the peak spawn with
up to 100% of the white perch collected on these days contained striped bass eggs. The increased
instances of predation observed at these locations likely were due to the abundance of striped
bass spawning within and in close proximity to these locations. Both Ridgeway Farms and
Watkins Bridge sites are located within the mean spawning grounds of striped bass determined
by Neal (1969) and Whitehurst (1982). I observed large numbers of striped bass spawning
directly upstream and within this section of river in both 2004 and 2005, but not in other sections
of the river. For this reason, large quantities of eggs were only available for white perch to
consume in this section of river and directly downstream. By the time eggs reached the 360
Bridge site (14 km upriver from Kerr Reservoir), the majority of eggs appeared to have hatched
because eggs were no longer observed in the water column.
The impact of egg predation on the recruitment of striped bass in 2005 is unknown, but it
is possible that predation by white perch had some effect. Projected population sizes of white
perch in the Roanoke River needed to consume between 50% and 90% of striped bass eggs
produced during the peak spawn ranged from 138,680 to 531,619, depending on inputs of
93

consumption and egg production. These estimates would only require recruitment rates of white
perch to be between 8 and 27 perch/ha from the 19,790-ha Kerr Reservoir. White perch densities
in Kerr Reservoir are likely higher than this, as indicated by VDGIF gillnet CPUE data with
average catch rates of 15 perch/net in 2000 samples. Although a sufficient reservoir population
of white perch was probably present, it is unlikely that they ascended the Roanoke River in high
densities. At least 5,715 white perch/river km would have been needed in the 44 km section of
river (between Clarkston and Watkins Bridges) to consume at least 50% of striped bass eggs
spawned during the peak. Population estimates could not be calculated for white perch in the
Roanoke River, but high densities were never observed during electrofishing collections in May
of 2005. On the most efficient collection days, I was only able to collect between 20 and 40
perch/km from both sides of the river. Although capture efficiency was probably lowered due to
turbidity and high flows, it is unlikely that population densities of white perch were more than
one hundred times greater than catch rates. In Tennessee tailwaters, capture efficiency with boat
electrofishers ranged from 5% to 54% dependent on the fish species collected (Ruhr 1957;
Jacobs and Swink 1982). If capture efficiency of white perch was as low as 5% in the Roanoke
River, collections numbers of 40 white perch per kilometer would only translate to 800 white
perch in that river kilometer which is still well below projected estimates of white perch needed
to have a substantial effect on striped bass recruitment.
In Kerr Reservoir, it appears that the occurrence of a peak striped bass spawning period is
an evolutionary advantage because potential predators (e.g. white perch) are swamped with a
large abundance of eggs during this peak spawning period. During the peak spawn, predators
likely become satiated on eggs allowing for a large percentage of eggs to pass downriver and
hatch. If eggs were spawned evenly over the entire spawning period of striped bass as opposed
94

to a one-week period, white perch would have the able to consume much greater proportions of
striped bass eggs produced annually. Reductions in percentage of predation mortality have been
documented for salmon (Oncorhynchus spp.) fry when fry numbers increased and predators were
swamped with the abundance of fry (Neave 1953; Hunter 1959; Peterman and Gatto 1978).
Predator swamping has been observed to be an important ecological strategy for prey survival in
many other organisms including mayflies (ephemeropterans), cichlids, Japanese flounder
(Paralichthys olivaceus), greater snow geese (Chen caerulescens atlantica), common tern
(Sterna hirundo), mule deer (Odocoileus hemionus), and bison (Bison bison) (Green and
Rothstein 1993; Becker 1995; Whittaker and Lindzey 1999; Kellison et al. 2002; Gauthier et al.
2004; Matter and Mannan 2005)
Without estimates of current striped bass egg production and white perch population size
in the Roanoke River, the true impact of egg predation is unknown. Projected number of white
perch needed to consume given percentages of eggs were calculated with particular assumptions
and uncertainties. Egg production estimates were gathered from historical studies on striped bass
in the Roanoke River, and these estimates could be substantially different from current
production numbers. Secondly, I assumed that these eggs were spawned evenly throughout the
peak spawning period. If larger percentages of eggs were spawned on specific days, then greater
densities of white perch would be need to consume eggs on that day. Additionally, sparse
information on white perch daily feeding rates was available, so data for striped bass were
substituted. Finally, the contribution of eggs to the diets of white perch could be higher than
what was observed in this study, if the digestion rate for eggs was faster than for other foods
(principally aquatic invertebrates). I could find no published study that compared digestion rates
of fish eggs versus other food items for any species of fish. However, if striped bass eggs were
95

underrepresented in the stomach contents that I examined, then the true number of white perch
required to eat a set percentage of eggs would be lowered. The Roanoke River would require
only 3,895 perch/km to consume 50% of striped bass eggs produced annually if white perch diets
were completely (100%) composed of eggs. Even this lower white perch density was unlikely,
given my much lower electrofishing catch rates. Additionally, the overall impact of egg
predation on Kerr Reservoir striped bass recruitment is unknown, because the intensity of egg
predation in the Dan River (the other important tributary of Kerr Reservoir for striped bass
spawning; Whitehurst 1982) was not examined.
Predation by white perch on striped bass larvae was observed in 2005, but not 2004.
Striped bass larvae were found in the stomachs of white perch at multiple sites in the Roanoke
River (Ridgeway Farms, Watkins Bridge, and Staunton View), indicating that larval predation
occurred throughout the river. Although predation occurred in more than one location, striped
bass larvae were infrequently found in the stomachs of white perch (FOO < 2 % at any site), and
never exceeded 1% of white perch diets by weight. The occurrence of larval predation may have
been underestimated due to the increased digestion rate of larval prey (Dowd 1986; Rogers and
Barley 1991), but it did not seem to be rampant enough in the river to have any substantial effect
on striped bass recruitment. Although successful hatches of striped bass eggs occur in the lower
reaches of the Roanoke River (Whitehurst 1982), striped bass larvae quickly descend to the
upper part of Kerr Reservoir (between 2 to 3 days depending on river flows). Because the
majority of my white perch collection was concentrated in the Roanoke River, food habits of
white perch should be examined in the upper end of Kerr Reservoir after the peak spawn to fully
assess the intensity of striped bass larval predation.
96

Crappie eggs were found in the diets of a small sample (N = 11) of white perch collected
during April of 2005 in Kerr Reservoir. The small sample size did not allow quantification of
white perch food habits during spring months (March-May) in Kerr Reservoir, so the intensity of
eggs or larval predation on early spring spawners (crappie and largemouth bass) in Kerr
Reservoir is unknown. Future research should focus on examining food habits of white perch in
Kerr Reservoir during the March-through-May period.
Juvenile Fish Predation by White Perch. - From June through December, age-1 and older
white perch (> 80 mm TL) fed on a variety of fish species in Kerr Reservoir during both 2004
and 2005. From June through December, Lepomis species were the only sportfish species found
in the diets of white perch, occurring in low proportions (< 7% by weight in any month) in both
years. Consumption of centrarchid species by white perch has been observed in Nebraska
reservoirs (Zuerlein 1981). In Kerr Reservoir, all Lepomis specimens consumed by white perch
were small (< 30 mm TL) age-0 fish. Because other sportfish (crappie, largemouth bass, and
striped bass) are spawned early in the spring compared to continuous summer spawning of
Lepomis species, it is possible that they have outgrown vulnerability to predation by white perch
before the summer months (June-August), when I was collecting white perch in Kerr Reservoir.
To determine the predation potential of white perch on the juveniles of other sportfish, white
perch food habits in Kerr Reservoir need to be examined in spring when age-0 sportfish are
newly hatched and relatively small in size.
Predation on fish prey by white perch in Kerr Reservoir differed between 2004 and 2005.
In 2004, fish were relatively low proportions of white perch diets from June through December
(< 12% by weight for any month), while fish prey averaged 47% of white perch stomach
contents by weight during these same months in 2005. During both years, the majority of fish
97

consumed by white perch in Kerr Reservoir were small (< 50 mm) clupeids. Predation on other
fish species (cyprinids, percids, and centrarchids) was also observed, but was infrequent. In
2005, temporal shifts in clupeid consumption by white perch were observed. From June through
October, clupeids were smaller proportions of white perch diets compared to months of
November and December (> 90% by weight). A strong year-class of threadfin shad was
produced in 2005, and small age-0 clupeids were very abundant in fall months compared to other
prey items. Temporal shifts in clupeid consumption by white perch have also been observed in
Lake Ontario when alewives were abundant (Danehy et al. 1991) and in Lake Erie when gizzard
shad were abundant (Schaeffer and Margraf 1986).
In Kerr Reservoir, white perch were piscivorous at relatively small sizes (by 80 mm in
2004 and by 150 mm in 2005), and fish were consumed consistently by all sizes classes of perch.
This is contrary to the reported food habits of white perch in other waters where size-dependent
shifts in fish consumption by white perch were observed. Fish were not regularly consumed by
white perch until the perch reached sizes of 200 mm in Nebraska Reservoirs (Zuerlein 1981),
Maine lakes (Warner 1974), and in the Susquehanna River, Maryland (Weisburg and Janicki
1990).
Trophic Competition
Food Habits of Age-0 Fishes. - Food habits of age-0 sportfishes varied between species
and temporally with each species. Age-0 crappies displayed primarily invertivorous food habits,
consuming mixtures of zooplankton and aquatic insects throughout the growing season; however
age-0 crappie also ate small amounts of fish prey. The observed occurrence of fish in the diets of
age-0 crappies was unusual compared to other studies. In other reservoirs, age-0 crappies have
been documented consuming only zooplankton prey (Ewers and Boesel 1935; Schael et al. 1991;
98

Devries et al. 1998; Pope and Willis 1998; Pine and Allen 2001; Dubuc and Devries 2002), or
combinations of zooplankton and aquatic insects (Mathur and Robbins 1971; Ellison 1984;
O’Brien et al. 1984). Generally, crappies do not regularly consume fish until they reach lengths
greater than 150 mm (TL), typically reached in their second growing season (Marthur and
Robbins 1971; Ellison 1984; O’Briean et al. 1984; Pine and Allen 2001). In Kerr Reservoir, age-
0 crappie consumed fish prey at much smaller sizes (by 30 mm TL). In each year of the study,
clupeids had very strong year classes (alewife in 2004 and threadfin shad in 2005), and all fish
consumed by juvenile crappie were small age-0 clupeids. The occurrence of fish in the diets of
age-0 crappies in Kerr Reservoir can be attributed to the abundance of small age-0 clupeids
present in the reservoir.
Food habits of age-0 white perch were described for June through December 2004 but
only for September and October in 2005, due to low collections of juveniles in 2005. It appeared
that white perch experienced low reproductive success in 2005, as opposed to 2004 when age-0
white perch were very abundant. High interannual variability in year-class strength of white
perch has been reported in other waters (Cacela 1989; Pace et al. 1993; Gopalan et al. 1998;
O’Gorman and Burnett 2001); variability in year-class strength of white perch is thought to be a
function of spring temperatures (O’Gorman and Burnett 2001). In both years when diets were
quantified, age-0 white perch fed only on aquatic invertebrates (mostly copepods, daphnia,
dipterans, and ephemeropterans). Food habits of age-0 white perch in Kerr Reservoir were
similar to diet data collected on white perch in coastal waters, where key diets items were
copepods, insect larvae and pupae, isopods, and mysids (Bath and O’Conner 1985;
Rudershausen and Loesch 2000; St-Hilaire 2002), and in other inland systems where primary
99

diet items were amphipods, copepods, daphnia, chironomids, and trichopterans (Leach 1962;
Elrod et al. 1981; Prout et al. 1990; Hurley 1992; Gopalan et al. 1998).
Both age-0 largemouth bass and striped bass fed on a mixture of aquatic invertebrates and
fish in June of both 2004 and 2005, but they consumed mostly fish prey from July through
December of both years. Similar temporal shifts in food habits of age-0 largemouth bass have
been documented in other systems (Pasch 1975; Shelton et al. 1979; Timmons et al. 1980; Keast
and Eadie 1985; Mathews et al. 1992; Olsen 1996; Sutton 1997; Garvey et al. 1998; Olsen and
Young 2003), and for striped bass in coastal waters (Merriman 1941; Heubach et al. 1963;
Markle and Grant 1970; Schaefer 1970; Boynton et al. 1981; Rudershausen and Loesch 2000),
and in other inland reservoirs (Stevens 1958; Gomez 1970; Ware 1970; Weaver 1975; Axon
1979; Higginbotham 1979; Saul 1981; Richardson 1982; Humphreys 1983; Van Den Avyle et al.
1983; Mathews et al. 1992; Sutton 1997; Rash 2003). Shifts in diets from invertebrates to fish
for age-0 piscivores are dependent on predator size and the availability of ingestible prey (Pasch
1975; Shelton et al. 1979; Timmons et al. 1980; Keast and Eadie 1985; Garvey et al. 1998;
Sutton 1997; Rash 2003). Previous studies in other Virginia reservoirs showed that this shift
usually occurs at sizes between 120 mm and 130 mm for both largemouth bass and striped bass
(Sutton 1997; Rash 2000). In this study, shifts occurred at similar or smaller sizes. Ontogenetic
shifts to piscivory of age-0 largemouth were exhibited in fish at sizes of approximately 100 mm
in 2004 and at 50 mm in 2005; age-0 striped bass exhibited shifts to piscivory when fish reached
approximately 130 mm in 2004 but only 70 mm in 2005. These earlier ontogenetic shifts in diets
of largemouth and striped bass were most likely a function of the abundance of age-0 threadfin
shad present in Kerr Reservoir in 2005 as opposed to 2004 when the larger age-0 gizzard shad
were more abundant.
100

Potential for Trophic Competition. - High similarities (Schoener’s Overlap >0.5) in diets
between age-0 white perch and the three species of age-0 sportfish occurred in early June when
all were largely invertivorous, but only overlap between age-0 crappie and white perch exceeded
0.6. Additionally, high diet similarities between white perch and sportfish were displayed in
small largemouth bass (< 60 mm, Schoener’s Overlap > 0.53) and striped bass (< 100 mm,
Schoener’s Overlap between 0.45 and 0.64). At these small sizes largemouth and striped bass
consume large amounts of invertebrates similar to age-0 white perch, and have not made the
ontogenetic shift to fish prey. Previous studies have found high trophic overlap between age-0
white perch and striped bass in their native estuaries when both species relied heavily on
invertebrate prey (Setzler-Hamilton 1982; Rudershausen and Loesh 2000; St-Hilaire et al. 2002).
Diet overlap of white perch versus crappie, largemouth bass, and striped bass has not been
reported in inland waters, but white perch have been reported to have high trophic overlap with
other age-0 species (alewife; yellow perch, and white bass) that have highly invertivorous diets
in inland waters (Elrod et al. 1981; Emmons 1986; Parrish and Margraf 1990; Prout et al. 1990;
Gopalan et al. 1998).
High trophic overlap values were also found between age-1 and older white perch versus
adult crappie, with overlap values of 0.50 in 2004 and 0.73 in 2005. Both of these species fed
on mixtures of zooplankton, aquatic insects, and fish in both years, causing high similarities in
diets between these species. Catfish species were the only other species that regularly consumed
aquatic invertebrates, but ictalurids fed more heavily on Asiatic clams and organic matter than on
the zooplankton and insects consumed by white perch. All other adult sportfish (largemouth
bass, striped bass, walleye, and white bass) were primarily piscivorous, and their diets had low
overlap (< 0.38) with the diets of the primarily invertivorous white perch.
101
Similarities in diets indicated that competitive trophic interactions could occur between
white perch and all age-0 species of sportfish, especially early in the growing season, and
between adult white perch and crappie throughout the year. Determination of the degree and
intensity to which trophic competition actually occurs depends on knowledge of the abundance
of food resources (Wiens 1977), which was beyond the scope of this study.
The results of trophic competition are manifested in the performance of the competing
species. Competitive interactions between fish have often been found to lead to reduced growth
and increased mortality (Werner and Hall 1977; Hanson and Leggett 1985, 1986; Osenberg et al.
1988; Frank and Leggett 1994; Cushing 1988; Dong and DeAngelis 1998). Comparisons in
temporal trends of sportfish growth and abundance (before vs. after white perch establishment)
conclude this discussion.
Sportfish Utilization of White Perch
An analysis of the food habits of Kerr Reservoir sportfishes revealed that white perch
were not utilized as a prey source by any species. In all instances, when sportfish preyed on fish
they consumed primarily clupeids. Between 2000 and 2004, the mean catch rate of clupeids from
fall gillnet samples was 23 fish/929 m2 of net, which was nearly 2.5 times greater than catch
rates of white perch (9 fish/929 m2 of net). In Kerr Reservoir, clupeids are the most abundant
forage fish and are readily available for consumption by piscivorous predators.
Kerr Reservoir catfishes were omnivores, feeding on mixtures of aquatic invertebrates,
fish, and filamentous algae. This generalist feeding behavior has been previously reported in
other waters for blue catfish (Brown and Deny 1961; Minckly 1962; Perry 1969), channel catfish
(Menzel 1943; Bailey and Harrison 1948; Armstrong and Brown 1983; Weisberg and Janicki
1990), and white catfish (Stevens 1959; Crumpton 1999). Although each catfish species was
102

omnivorous, blue catfish consumed primarily clupeids (>52% by weight in both 2004 and 2005),
whereas channel and white catfish diets were comprised large mixtures of invertebrates and
filamentous algae. The difference in degree of fish consumption among the ictalurids was most
likely a function of habitat preference and species-specific behavior. In reservoir systems, blue
catfish prefer deep pelagic areas (Graham 1999) where clupeids may be abundant, while channel
and white catfish prefer the shallower littoral areas (Klaassen and Marzolf 1971; Hubert and
O’Shea 1992).
Kerr Reservoir crappies consumed mainly clupeids and aquatic invertebrates in both
2004 and 2005, with these prey categories representing approximately 98% of stomach contents
by weight in both years. Crappie diets consisting of aquatic invertebrates and fish have also been
reported in Florida Lakes (Reid 1949), Nebraska reservoirs (Ellison 1984), and Illinois reservoirs
(Heidinger 1977, Heidinger et al. 1985). Although crappies consumed fish in the present study,
they did not prey on white perch. The absence of white perch in crappie diets was most likely
due to prey size, habitat differences, and alternative prey (clupeid) abundance. Gape-limited
piscivores often consume deep-bodied prey much smaller than their maximum potential
(Hoogland et al. 1956; Lawrence 1958; Kerby 1979; Gillen et al. 1981; Ott and Malvestuto 1981;
Humphreys 1983; Hoyle and Keast 1987; Dennerline 1990; Hambright 1991; Juanes 1994;
Dettmers et al. 1996; Sutton 1997). In Kerr Reservoir, adult crappies only ate small (< 80 mm)
age-0 clupieds, and Kerr Reservoir white perch are only in this size range during summer months
of their first growing season (June through September, see Figures 4 and 5). In reservoir
systems, crappies primarily suspend in deep offshore areas near submerged structure during
summer months (Grinstead 1969; O’Brien et al. 1984; Durfey 1986; Markham et al. 1991;
Johnson and Lynch 1992; Guy et al. 1994). During my summer collections, small (< 100 mm)
103

white perch were only collected in unvegetated, littoral areas where adult crappies were not
present. Crappies appeared to rely on the more abundant, soft-rayed clupeid species that were
available in offshore areas.
Kerr Reservoir largemouth bass were almost completely piscivorous, with clupeids
(mostly threadfin and gizzard shad) being the primary prey fish consumed by adult and juvenile
bass in both years. When abundant, soft-rayed clupeids have been shown to be the preferred
prey of largemouth bass (Storck 1986), and their importance to diets of adult largemouth has
been reported in many other waters (Aggus 1973; Lewis et al. 1974; Pasch 1975; Michaletz
1997; Carline et al. 1984; Moore 1988; Timmons et al. 1981; and Yako et al. 2000).
Over the two years of this study, only one captured largemouth bass contained a white perch
(FOO < 2%). In contrast, Ward and Neumann (1998) reported that white perch were the most
important and seasonally consistent prey item consumed by largemouth bass in Lake Lillinonoh,
Connecticut, which lacked a clupeid prey base.
Striped bass fed almost exclusively on clupeids in both years. The high importance of
clupeids to the diets of adult striped bass has previously been documented in their native
estuarine environment (Gardinier and Hoff 1982; Walter and Austin 2003) and in inland waters
(Stevens 1958; Combs 1978; Deppert 1979; Morris and Follis 1978; Kohler and Ney 1981;
Persons and Bulkley 1982; Filipek and Tommey 1984; Moore et al. 1985; Bonds 2000). As
opposed to shad, white perch were rarely found in diets of striped bass (FOO <2%), and were of
low importance (<2% by weight) in both years. Gardinier and Hoff (1982) reported low
occurrences (FOO approximately 11%) of white perch consumption by mature striped bass in the
Hudson River Estuary in the presence of an alternative clupeid prey base. Additionally,
104
Manooch (1973) found that striped bass preferred soft-rayed fish over spiny-rayed fish (e.g.,
white perch).
Food-habits analysis for walleye and white bass were questionable due to low sample
sizes for each species. In other southern reservoirs, reliance on clupeid prey has been
documented for both walleye (Dendy 1946; Momot et al. 1977; Fitz and Holbrook 1978; Moore
1988; Bonds 2002) and white bass (Olmstead and Kilambi 1971; Ruelle 1971). Only one white
perch was found in stomachs of Kerr Reservoir walleye (FOO approximately 17%) and none
were found in white bass. In Kerr Reservoir, walleye and white bass seem to prefer and depend
on the more-abundant clupeids; however it has been documented that both species will prey on
white perch when less desirable prey is not abundant (Forney 1974; Hartman and Margraf 1992;
Hartman 1998).
Reservoir systems can be highly variable due to rapid fluctuations in water quality and
levels (Summerfelt 1999), and shortages in clupeid prey can occur due to these changing
conditions (Jenkins and Morais 1978; Jenkins 1979; Michaletz 1997). In times of low clupeid
abundance, competition between sportfish species could intensify and white perch could add an
alternative forage base for these predators (Forney 1974; Gardinier and Hoff 1982; Hartman and
Margraf 1992; Ward and Neumann 1998). Additionally, white perch could be larger proportions
of piscivores’ diets at different times of year. Piscivores were only collected in the fall for all
species except largemouth bass, which were collected June through December. Hartman (1998)
found that white perch were a seasonally important food resource for white bass during summer
months (June-August) in Lake Erie. It is possible that piscivores fed on white perch at other
times of the year, but it seems unlikely due to the high year-round abundant forage base of
clupeids.
105

In summary, white perch are not utilized as a major food source for Kerr Reservoir
sportfishes, but the occasional occurrence of white perch consumption indicates that they might
become more important in the event of weak year classes of clupeids.
Sportfish Performance
Observed egg predation by white perch and potential trophic competition with white
perch indicates that crappies are the sportfish species most likely to be adversely affected by
white perch introductions. In B. Everrett Jordan Reservoir, North Carolina abundances of black
crappie declined with concurrent increases in white perch abundance (Wong et al. 1999).
Unfortunately, comparison in abundance and growth of Kerr Reservoir crappies before and after
white perch establishment was not possible in the present study due to a lack of available or
reliable data.
Relative abundance of pelagic fishes (striped bass and clupeid species) collected from
annual gillnet samples were similar in years prior to and after white perch introduction, except
for CPUEs of white bass (which declined after white perch establishment). DiCenzo and Duval
(2002) determined that declines in abundance of Kerr Reservoir white bass were related to low
April inflows from the Roanoke and Dan Rivers, which negatively affected year-class strength of
white bass. Although interactions between Kerr Reservoir white bass and white perch were not
featured in my study, their known interactions in other waters give cause to believe that white
perch may have contributed to reductions in white bass populations. In Lake Erie, declines in
white perch populations were correlated to the introduction and establishment of white perch
(Madenjian et al. 2000), and were thought to be caused by some form of egg predation (Shaffer
and Margraf 1987), competition (Gopalan et al. 1998), and/or hybridization (Todd 1986; Irons
2002). Although CPUEs of striped bass did not differ before and after white perch
106

establishment, stocking history of striped bass in Kerr Reservoir could have affected comparative
results. In years after white perch were established (1996-present), average numbers of striped
bass fingerlings supplementary stocked in Kerr Reservoir were nearly four times greater than in
years prior to white perch introductions (1974-87; see Table 1). Increased number of striped
bass stocked in years after white perch compared to years before white perch could have
facilitated similar CPUEs between the two periods even if white perch were affecting
recruitment success of striped bass.
Largemouth bass relative abundances obtained from VDGIF electrofishing surveys were
higher in years after white perch establishment (mean CPUE 55 fish/hour) versus years before
white perch introductions (mean CPUE 25 fish/hour). It may seem that the rise in relative
abundance of largemouth bass is an indication that interactions with white perch are minimal, but
relative abundance increases were mostly likely due to enhanced capture efficiency of
largemouth bass in years after white perch establishment (post 1995). In 1997, VDGIF
personnel upgraded their electrofishing equipment and procedures, and a new modernized
electrofishing boat and gear was used then and in later years (V. DiCenzo, VDGIF, personal
communication). In Briery Creek Lake, Virginia, Wilson and Dicenzo (2002) found similar
significantly higher higher catch rates of largemouth bass in years when the new modernized
electrofishing gear (boat mounted anodes) was used as opposed to years when the older methods
(hand-held anode) was used. Difference in capture efficiency appears to be the probable cause
for the increase in relative abundance of largemouth bass in the period after white perch
establishment, and comparison of abundance between the two periods may lead to faulty
conclusions. Largemouth bass stock density estimates (PSD and RSD-P) were similar in years
before and after white perch establishment.
107

Growth of largemouth bass and striped bass was evaluated by comparing length at age-3
fish for each species. Lengths of age-3 largemouth and striped bass collected in Kerr Reservoir
were not statistically different between pre- and post-white perch years. Although no difference
in growth of these age-3 sportfish was observed, differences in ageing procedures between time
periods could have led to misleading results. In years prior to white perch establishment, all
sportfish were aged using scales, but otoliths were used to age fish in years after white perch
were established. Unlike otoliths, aging using scales has been found to lead to overestimation on
ages of younger largemouth bass (Long and Fisher 2001) and reduced precision in age estimates
with striped bass (Welch et al. 1993). Largemouth bass growth may have been greater than
reported during years that scale-aging procedures were used, and therefore the comparison
between age-3 largemouth bass before and after white perch establishment may have been faulty.
Although growth and abundance of Kerr Reservoir fishes were similar in periods before
and after white perch, except abundance of white bass, observed predation on the eggs of
sportfish and potential competition with the young of sportfish leads to some concern. It is
possible that changes in resident fish dynamics were not observed due to sampling
inconsistencies among the two periods. For future collections, sampling and recording
procedures should be standardized to permit accurate annual comparisons.
Analysis of growth and abundance of largemouth bass and striped bass indicates that both
parameters were similar before and after white perch introductions for each species. It does not
appear that these species are competing for food resources with white perch, but differences in
sampling and aging procedure could have lead to faulty comparisons. Crappie growth could not
be evaluated, but overlap results suggest the potential for trophic competition.
108

SUMMARY AND CONCLUSIONS
1. Stomach contents of white perch and piscivorous sportfishes were collected in 2004 and
2005 to examine the trophic impacts (predation and/or competition) and benefits (as a
forage resource) of the white perch in Kerr Reservoir. Adult white perch were collected
throughout the Roanoke River and in Kerr Reservoir by boat electrofishing gear to
determine whether they preyed on sportfish eggs, larvae, and juveniles. Throughout the
growing season (June-December), age-0 white perch, crappie, largemouth bass, and
striped bass were collected in Kerr Reservoir by seining and boat electrofishing to
examine the potential for trophic competition between white perch and other sportfishes.
Adult piscivores were sampled by gillnetting and electrofishing to determine whether
they utilized white perch as a prey resource. Additionally, data from VDGIF annual
sampling were used to compare growth and abundance of piscivores and forage fish of
Kerr Reservoir before and after white perch establishment.
2. Age-and-growth analysis of white perch indicated that white perch growth does not
appear to be stunted in Kerr Reservoir at this time. Kerr Reservoir white perch are
approaching sizes of 150 mm TL by age-2 and surpass 200 mm TL by age-4. Growth of
Kerr Reservoir white does not appear to limit the fishery for white perch at this time,
because anglers start harvesting white perch at sizes of 150 mm TL.
3. Predation by white perch on striped bass eggs during the striped bass spawning run up the
Roanoke River was observed in 2004 but was more intense in 2005. Striped bass eggs
were eaten by up to 100% of the white perch collected at certain locations on days during
the peak striped bass spawn in 2005. In both years, egg predation only occurred during
the peak striped bass spawning period. Spatially, egg predation primarily occurred within
109

or just below the mean spawning location of striped bass (Clarkton Bridge to Watkins
Bridge). It appears that white perch opportunistically fed on striped bass eggs when and
where eggs were in high abundance.
4. Although considerable egg predation was observed at times during 2005, projected
population sizes of white perch large enough to significantly affect recruitment of striped
bass likely were not present. Population densities greater than 5,000 perch/km would
have been needed in the stretch of river where predation occurred to consume at least 50
% of the striped bass eggs spawned annually; electrofishing surveys captured fewer than
30 perch/km.
5. Predation by white perch on striped bass larvae was observed at several sites in the
Roanoke River in May of 2005 during the striped bass spawning period, but appeared to
be quite low. Only 4 of 986 (0.4 %) of white perch captured contained striped bass
larvae. Instances of larval predation could have been higher than observed due increased
digestion rates of larval prey, but still did not appear to be sufficiently intense to affect
recruitment of striped bass. Striped bass larvae hatch in the 10-km stretch of the Roanoke
River above Kerr Reservoir and are in the river less than one day. Larval predation by
white perch may have been more intense in the upper end of Kerr Reservoir, but my
sampling was not designed to assess this issue.
6. Predation by white perch on the eggs of crappie was detected during April of 2005 in
Kerr Reservoir. White perch diets were not quantified during this period, so the
frequency and impact of this predation to crappie populations in Kerr Reservoir is
unknown. Further investigation into the food habits of white perch in Kerr Reservoir
110

needs to be accomplished during the crappie spawning period (March-April) to determine
the effect of egg and larval predation by white perch on this popular sportfish.
7. Instances of predation on the young of other sportfish by white perch were observed from
June through December in Kerr Reservoir, but only age-0 Lepomis species were
consumed. Frequency of predation appeared to be low with less than 5 % of 1165 white
perch collected in both years containing Lepomis prey. Only small (< 30 mm TL) age-0
lepomids were observed in the diets of white perch; young of largemouth and striped bass
had outgrown the size of prey targeted by white perch by June, when my sampling began.
White perch food habits should be examined in Kerr Reservoir from April through May
to determine whether white perch prey on the young of other sportfish when they are of
vulnerable size.
8. White perch consumed large amounts of clupeid prey, especially at times when clupeids
were more abundant than alternative invertebrate prey types. Clupeids comprised greater
than 90% by weight of perch stomach contents in the fall of 2005, indicating that white
perch will feed heavily on fish prey.
9. Both age-0 crappie species and age-0 white perch were highly invertivorous throughout
their first growing season. Aquatic invertebrates represented greater than 90 % of age-0
crappie stomach contents by weight throughout the growing season of both years, while
100 % of age-0 white perch diets were composed of invertebrates during both growing
seasons.
10. Age-0 largemouth bass and striped bass displayed ontogenetic shifts in food habits from
invertebrates to fish in both 2004 and 2005, but shift occurred at smaller sizes than
previously reported in other Virginia reservoirs. Diet shifts in largemouth bass occurred
111

at sizes between 50 mm and 100 mm, while striped bass displayed shifts in diets at sizes
between 70 mm and 130 mm.
11. Trophic overlap as an indicator of interspecific competition between age-0 white perch
and young-of-year sportfishes was highest in early summer, when all fed heavily on
zooplankton and aquatic macroinvertebrates. Largemouth bass and striped bass soon
became piscivorous, but age-0 white perch did not. Significant diet overlap (>0.6,
Schoener’s index) occurred only between white perch and crappie; both species were
essentially invertivores throughout their first growing season.
12. Schoener’s (1970) Trophic Overlap Index revealed the potential for interspecific
competition for food resources exists between adult white perch and adult crappie, but
not between white perch and other adult sportfish species (catfishes, striped bass,
largemouth bass, walleye, and white bass). Both adult white perch and crappie consumed
considerable amounts of aquatic invertebrates whereas other sportfish were primarily
piscivorous.
13. Analysis of food habits of Kerr Reservoir piscivores showed that utilization of white
perch as forage was low. For both years, frequency of occurrence of white perch in
piscivore diets was ~1% in a combined sampling of 526 striped bass, largemouth bass,
and walleye. Most species fed primarily on the more abundant clupeid species, but the
occurrence of predation on white perch indicates that perch could add an alternative
forage base in times of low clupeid abundance.
14. Temporal comparisons of growth rates and relative abundance of major forage and sport
fishes before and after white perch establishment in Kerr Reservoir revealed that white
bass abundance has declined since white perch establishment. Low spring flows from the
112

Roanoke and Dan Rivers are thought to be the primary cause for this reduction, but
interactions between white perch and white bass in other systems is cause for concern.
Growth and abundance of all other species (clupeids, striped bass, and largemouth bass)
examined were either similar or greater in the period after white perch establishment.
The introduction of the white perch in Kerr Reservoir was cause for concern for management
biologists due to the track record of the white perch in other waters, and reductions of year class
strength of striped bass in Kerr Reservoir during the early 1990s. Results of this study indicated
that there are potentially negative interactions between white perch and striped bass as well as
other popular sportfish in Kerr Reservoir.
White perch preyed on the eggs of striped bass, and at times predation was intense.
Allowing for low capture efficiency of white perch, it is unlikely that white perch densities were
sufficiently high to result in consumption of a large fraction of striped bass eggs produced in the
Roanoke River. The intensity of predation on eggs of other sportfish species by white perch is
unknown, but the observance of predation on crappie eggs reveals that the potential for a
substantial impact exists in Kerr Reservoir.
Potential competitive trophic interaction of white perch with largemouth bass and striped
bass seem to be minimal and restricted to early months of the growing season. The abundant
forage base of age-0 clupeids provides juvenile piscivores the ability to consume fish throughout
the growing season. Abundance of clupeid species can be quiet variable in reservoir systems,
and competitive interactions between these species might occur in years when the clupeid forage
base is low.
113
This study indicated that crappie appear to have the highest potential for competitive
interactions with white perch. Trophic overlap was high between these species for all life stages
(juveniles and adults). Without some quantification of available food supply, it is not possible to
assess whether these similarities in diets are suppressing the growth of crappie. Further, reliable
data on crappie growth were not available in periods before white perch were introduced into
Kerr Reservoir, preventing comparison of crappie growth before and after white perch
establishment.
Growth and abundance of most sportfish have not declined since white perch
establishment. It is possible that effects on performance of sportfish were not observed due to
sampling inconsistencies between periods before and after white perch. Of all the sportfish
examined, only white bass relative abundance has decline since white perch introduction.
Interactions between these species were not examined during this study, but white perch
introductions have preceded white bass decline in other waters.
The benefits of white perch as a forage fish to resident piscivores of Kerr Reservoir are
minimal to nonexistent. Adult piscivores rely heavily on the abundant clupeid forage and do not
readily consume spiny-rayed white perch, but might at times that clupeids are unavailable.
In summary, white perch are adding little benefit (with the exception of a small pan-fish
fishery) to the overall Kerr Reservoir fishery, but appear to have some negative interactions with
resident sportfish of Kerr Reservoir. Further research on white perch in Kerr Reservoir should
be undertaken to better understand how these interactions are affecting the dynamics of these
resident sportfish. Food habits of white perch should be examined in Kerr Reservoir and the
Roanoke and Dan Rivers throughout spring months to truly assess the predation and competition
potential of white perch in Kerr Reservoir.
114
MANAGEMENT RECOMENDATIONS
This study identified potential impacts of white perch on resident fishes of Kerr
Reservoir, some of which merit more directed study. An alternative stocking regime for striped
bass and consistency in assessment monitoring are among my recommendations to managers of
the Kerr Reservoir fishery. My specific recommendations follow.
1. VDGIF should annually monitor year-class strength of striped bass in Kerr Reservoir and white perch relative abundance in the Roanoke and Dan Rivers. To assess year-class strength, monitoring of age-0 striped bass should take place in the upper end of Kerr Reservoir before supplemental stockings of striped bass occur (late May through June). During this time, age-0 striped bass could be collected with seining procedures described in Objective 2 of this study and/or with trawling techniques used by Whitehurst (1982). White perch relative abundance should be assessed during the peak spawning season of striped bass (April in the Dan River and May in the Roanoke River) using boat electrofishing gear.
Predation on striped bass eggs by white perch in the Roanoke River was observed in both years of this study. Although population sizes of white perch do not appear to be large enough in the Roanoke River to substantially affect natural recruitment of striped bass, the actual impact of egg predation is unknown. Further, the intensity of striped bass egg predation in the Dan River, the other important spawning tributary for Kerr Reservoir striped bass, was not examined. Having predictions on striped bass year-class strength and relative abundances of white perch in spawning waters of striped bass over multiple years would provide empiric evidence of a causal relationship (or its lack) between these two indices.
2. A study on white perch abundance and food habits should be conducted in the upper end of Kerr Reservoir (section of lake above mouth of Buffalo Creek) directly after the striped bass spawning period (May-June).
White perch fed on striped bass larvae in the Roanoke River, but larval predation appeared to be infrequent. Although larval predation was low in the Roanoke River, the overall intensity of striped bass larval predation by white perch is unknown because food habits of white perch were not examined in the upper end of Kerr Reservoir where striped bass larvae aggregate after hatching.
3. Future research should be accomplished to examine the food habits of white perch during spring months (April-May) and should be concentrated in the areas of Kerr Reservoir where Kerr Reservoir sportfish species (e.g. crappie and largemouth bass) primarily spawn.
115
The observance of crappie egg and juvenile centrarchid predation by white perch raise concern for how this predation affects populations of these species. In this study, diets of white perch were not examined in Kerr Reservoir during or directly after the spring spawning period of crappie and largemouth bass. Future research should be designed to determine the intensity of egg, larvae, and juvenile predation of these species by white perch and competitive trophic interactions between these species during this spring period.
4. I recommend stocking striped bass earlier in the growing season (May through early
June) or at larger sizes (> 100 mm). Striped bass could be collected from the Roanoke River by Vic Thomas Hatchery personnel earlier in the spring than they have traditionally been collected, and spawning in these fish could be induced in hatchery facilities to provide earlier availability of fingerling striped bass for stocking (Sutton 1997).
In Kerr Reservoir, populations of striped bass are sometimes sustained by supplemental stockings of fingerlings. Potential competitive interactions between age-0 striped bass and white perch for food resources were observed between these species early in the growing season (June) and between smaller fish (< 100 mm TL). To minimize these potential interactions between these species, stocking strategies of fingerling striped bass could be adjusted. Traditionally, striped bass fingerlings have been stocked at the end of June at sizes less than 60 mm. Stocking striped bass earlier in the growing would allow juveniles to grow to lengths where ontogenetic shifts from invertebrates to fish prey occur before age-0 white perch are abundant in Kerr Reservoir.
5. VDGIF should continue to monitor abundance and growth of Kerr Reservoir crappies. Crappie species should be collected by traditional sampling gear and methods (spring trapnet surveys) for annual comparisons.
Potential negative interactions (predation and/or competition) were observed between Kerr Reservoir white perch and crappie, but comparisons of growth and abundance before and after white perch establishment were not performed due to insufficient data. To determine if these population characteristics are declining in the presence of white perch, indices growth and abundance of crappies should be monitored annually.
6. Future research should be conducted to examine the relationships between white bass and white perch in Kerr Reservoir. Specifically, intensity of white perch predation on eggs and juveniles of white bass and trophic competition with white bass should be accomplished.
Populations of white bass experienced drops in abundance after white perch were established, and published studies have shown that white perch can negatively affect white bass population dynamics through forms of predation, competition,
116

and/or hybridization. This study did not evaluate interactions between these species in Kerr Reservoir.
7. VDGIF annual sampling should be performed with high consistency in regards to sampling gear and strategies, to assure future population data of Kerr Reservoir fishes can be used for comparative purposes.
Annual monitoring data collected by VDGIF personnel were essential to this research, but sampling inconsistencies between periods before and after white perch establishment in Kerr Reservoir created difficulties for comparisons between the two periods. In instances when sampling technologies are similar among years, consistency in sampling techniques ensures more accurate comparability in long-in data from long-term data set.
117

LITERATURE CITED
Aggus, L.R. 1973. Food of angler harvested largemouth, spotted, and smallmouth bass in Bull Shoals Reservoir. Proceedings of the Annual Conference Southeastern Association of Game and Fish Commissioners 26:519-529.
Alsop, R.G., and J.L. Forney. 1962. Growth and food of white perch in Oneida Lake. New York
Fish and Game Journal 9(2):133-136. Anderson, R.O., and R.M. Neumann. 1996. Length, weight, and associated structural indices.
Pages 447-482 in B.R. Murphy and D.W. Willis, editors. Fisheries Techniques, 2nd Edition. American Fisheries Society, Bethesda, Maryland.
Armstrong M.L., and A.V. Brown. 1983. Diel drift and feeding of channel catfish alevins in the
Illinois River, Arkansas. Transactions of the American Fisheries Society 112:302-307. Axon, J.R. 1979. An evaluation of striped bass introductions in Herrington Lake. Kentucky
Department of Fish and Wildlife Resources, Fisheries Bulletin 63. Bailey, R.M., and H.M. Harrison, Jr. 1948. Food habits of the southern channel catfish (Ictalurus
lacustris punctatus) in the Des Moines River, Iowa. Transactions of the American Fisheries Society 75:110-138.
Bath, D.W., and J.M. O’Connor. 1985. Food preferences of white perch in the Hudson River
Estuary. New York Fish and Game Journal 32(1):63-70. Becker, P.H. 1995. Effects of coloniality on gull predation on common tern (Sterna hirundo)
chicks. Colonial Waterbirds 8:11-22. Boileau, M.G. 1985. The expansion of white perch, Morone americana, in the lower Great lakes.
Fisheries 10(1):6-10. Bonds, C.C. 2000. Assessment of the response of piscivorous sportfishes to the establishment of
gizzard shad in Claytor Lake, Virginia. Master’s thesis. Virginia Polytechnic Institute and State University, Blacksburg, Virginia.
Bowen, S. H. 1996. Quantitative description of the diet. Pages 513-532 in B. R. Murphy and D.
W. Willis, editors. Fisheries techniques, 2nd edition. American Fisheries Society, Bethesda, Maryland.
Boynton, W.B., T.T. Polgar, and H.H. Zion. 1981. Importance of juvenile striped bass food
habits in the Potomac Estuary. Transactions of the American Fisheries Society 110:56-63.
Brodeur, R.D., and W.G. Pearcy. 1984. Food habits and dietary overlap of some shelf rockfishes
(genus Sebastes) from the northeastern Pacific Ocean. Fishery Bulletin 82:269-293.
118
Brown, B.E., and J.S. Deny. 1961. Observations on the food habits of the flathead and blue catfish in Alabama. Proceedings of the Annual Conference Southeastern Association of Game and Fish Commissioners 15:219-222.
Cacela, D.A. 1989. Recruitment dynamics of white perch (Morone americana) in Oneida Lake,
New York, 1960-1985. Master’s thesis. Cornell University, Ithaca, NewYork. Carlander, K.D. 1997. Handbook of freshwater fisheries biology, volume 3, life history data on
ichthyopercid and percid fishes of the United States and Canada. Iowa State University Press, Ames, Iowa.
Carline, R.F., B.L. Johnson, and T.J. Hall. 1984. Estimation and interpretation of proportional
stock density of fish populations in Ohio impounds. North American Journal of Fisheries Management 4:139-154.
Christensen, J.M. 1964. Burning of otoliths, a technique for age determination of soles and other
fish. Journal of Conservation 29:73-81. Clinton, W.J. 1999. Invasive species, Executive Order 13112. Federal Register 64(25):6183-
6186. Cochran, P.A., and P.J. Hesse. 1994. Observations on the white perch (Morone americana) early
in its invasion of Wisconsin. Transactions of the Wisconsin Academy of Sciences, Arts and Letters 82:25-31.
Combs, D.L. 1978. Food habits of adult striped bass from Keystone Reservoir and it tailwaters.
Proceedings of the Annual Conference of the Southeastern Association of Fish and Wildlife Agencies 32:571-575.
Crumpton, J.E. 1999. Relative abundance, age, growth, and food habits of channel and white
catfish from the Clermont Chain of Lakes, Florida. Pages 115-119 in E.R. Irwin, W.A. Hubert, C.F. Rabeni, H.L. Schramm, Jr., and T. Coon, editors. Catfish 2000: proceedings of the international ictalurid symposium. American Fisheries Society, Symposium 24, Bethesda, Maryland.
Cushing, D.H. 1988. The study of stock and recruitment. Pages 105-128 in J.A. Gulland, editor.
Fish population dynamics, 2nd edition. Wiley, New York. Danehy, R.J., N.H. Ringler, and J.E. Gannon. 1991. Influence of nearshore structure on growth
and diets of yellow perch (Perca flavescens) and white perch (Morone americana) in Mexico Bay, Lake Ontario. Journal of Great Lakes Research 17(2):183-193.
Dennerline, D.E., 1990. Prey sizes utilized by hybrid and striped bass: implications for assessing
prey availability. Master’s thesis. University of Georgia, Athens, Georgia.
119

Dendy, J.S. 1946. Food of several species of fish, Norris Reservoir, Tennessee. Journal of the Tennessee Academy of Science 21:105-127.
Deppert, D.L. 1979. Effects of striped bass predation on an Oklahoma trout fishery. Proceedings
of the Annual Conference of the Southeastern Association of Fish and Wildlife Agencies 33:384-392.
Dettmers, J.M., D.R. DeVries, and R.A. Stein. 1996. Reservoir biomanipulation: quantifying
piscivores effects and prey productivity across multiple trophic levels. Transactions of the American Fisheries Society 125:491-504.
Devries, D.R., and R.V. Frie. 1996. Determination of age and growth. Pages 483-512 in B.R.
Murphy and D.W. Willis, editors. Fisheries Techniques, second edition. American Fisheries Society, Bethesda, Maryland.
Devries, D.R., M.T. Bremigan, and R.A. Stein. 1998. Prey selection by larval fishes as
influenced by available zooplankton and gape limitation. Transactions of the American Fisheries Society 127:1040-1050.
DiCenzo, V.J., 2001. Kerr Reservoir Angler Survey-2001. Virginia Department of Game and
Inland Fisheries, Farmville, VA. DiCenzo, V.J., and M.C. Duval. 2002. Importance of reservoir inflow in determining white bass
year-class strength in three Virginia reservoirs. North American Journal of Fisheries Management 22:620-626.
Dong, Q. and D.L. DeAngelis. 1998. Consequences of cannibalism and competition for food in a
smallmouth bass population: an individual-based modeling study. Transactions of the American Fisheries Society 127:174-191.
Dowd, C.E. 1986. Predator-prey interactions between juvenile bay anchovy (Anchoa mitchilli)
and larvae of sea bream (Archosargus rhomboidalis). Ph.D. dissertation. University of Miami, Coral Gables, Florida.
Dubuc, R.A., and D.R. Devries 2002. An exploration of factors influencing crappie early life
history in three Alabama impounds. Transactions of the American Fisheries Society 131:476-491.
Durfey, L.W. 1986. Diel patterns of young white crappie distribution and feeding. Master’s
thesis. The Ohio State University, Columbus, Ohio. Ellison, D.G. 1984. Trophic dynamic of a Nebraska black crappie and white crappie population.
North American Journal of Fisheries Management. 4:355-364.
120

Elrod, J.H., W.N. Busch, B.L. Griswold, C.P. Schneider, and D.R. Wolfert. 1981. Food of white perch, rock bass and yellow perch in eastern Lake Ontario. New York Fish and Game Journal 28(2):191-201.
Emmett, R.L., W.D. Muir, and R.D. Pettit. 1982. Device for injecting preservative into the
stomach of fish. Progressive Fish-Culturist 44:107-108. Emmons, E.E. 1986. Diets of white bass, Morone chrysops, and white perch, M. americana,
from two inshore Lake Erie marshes. The Ohio Journal of Science 86(2):54. Ewers, L.A., and M.M. Boesel. 1935. The food of some Buckeye Lake fishes. Transactions of
the American Fisheries Society 65:57-69. Filipek, S.P., and W.H. Tommey. 1984. The food habits of adult striped bass from Lake
Hamilton, Arkansas, before and during an extreme drawdown. Proceedings of the Annual Conference of the Southeastern Association of Fish and Wildlife Agencies 38:327-334.
Fitz, R.B., and J.A. Holbrook II. 1978. Sauger and walleye in Norris Reservoir, Tennessee. Pages
11-82 in R.L. Kendall, editor. Selected coolwater fishes of North America. American Fisheries Society. Bethesda, Maryland.
Forney, J.L. 1974. Interactions between yellow perch abundance, walleye predation, and survival
of alternative prey in Oneida Lake, New York. Transactions of the American Fisheries Society 103:15-24.
Frank, K.T, and W.C. Leggett. 1994. Fisheries ecology in the context of ecological and
evolutionary theory. Annual Review of Ecology and Systematics 25:401-422. Fuller, P.L., L.G. Nico, and J.D. Williams. 1999. Nonindigenous fishes introduced into inland
waters of the United States. American Fisheries Society, Special Publication 27, Bethesda, Maryland.
Gabelhouse, D.W., Jr. 1984. A length-categorization system to assess fish stocks. North
American Journal of Fisheries Management 4:273-285. Gardinier, M.N., and T.B. Hoff. 1982. Diet of striped bass in the Hudson River Estuary. New
York Fish and Game Journal 29(2): 153-165. Garvey, J.E., and R.A. Stein. 1998. Linking bluegill and gizzard shad prey assemblages to
growth of age-0 largemouth bass in reservoirs. Transactions of the American Fisheries Society 127:70-83.
Gauthier, G., J. Bety, J. Giroux, and L. Rochefort. 2004. Trophic interactions in a high artic snow
goose colony. Integrative and Comparative Biology 44:119-129.
121

Gillen, A.L., R.A. Stein, and R.F. Carline. 1981. Predation by pellet-reared tiger muskellunge on minnows and bluegills in experimental systems. Transactions of the American Fisheries Society 110:197-209.
Gomez, R. 1970. Food habits of young-of-year striped bass, Roccus saxatilis (Walbaum), in
Canton Reservoir. Proceedings of the Oklahoma Academy of Sciences 50:79-83. Gopalan, G., D.A. Culver, L. Wu, and B. K. Trauben. 1998. Effects of recent ecosystem changes
on the recruitment of young-of-the-year fish in western Lake Erie. Canadian Journal of Fisheries and Aquatic Sciences 55:2572-2579.
Graham, K. 1999. A review of the biology and management of blue catfish. Pages 37-49 in E.R.
Irwin, W.A. Hubert, C.F. Rabeni, H.L. Schramm, Jr., and T. Coon, editors. Catfish 2000: proceedings of the international ictalurid symposium. American Fisheries Society, Symposium 24, Bethesda, Maryland.
Green, W.C.H, and A. Rothstein. 1993. Asynchronous parturition in bison: implications for the
hider-follower dichotomy. Journal of Mammalogy 74:920-925. Grice, F. 1958. Effect of removal of panfish and trashfish by fyke nets upon fish populations of
some Massachusetts ponds. Transactions of the American Fisheries Society 87:108-115. Grinstead, B.G. 1969. The vertical distribution of the white crappie in the Buncombe Creek Arm
of Lake Texoma. Oklahoma Fishery Research Laboratory, Bulletin 3, Norman, Oklahoma.
Guy, C.S., D.W. Willis, and J.J. Jackson. 1994. Biotelemetry of white crappies in a South Dakota
glacial lake. Transactions of the American Fisheries Society 123:63-70. Hambright, K.D. 1991. Experimental analysis of prey selection by largemouth bass: role of
predator mouth width and prey body depth. Transactions of the American Fisheries Society. 120:500-508.
Hanson, J.M. and W.C. Leggett. 1985. Experimental and field evidence for inter- and
intraspecific competition in two freshwater fishes. Canadian Journal of Fisheries and Aquatic Sciences 42:280-286.
Hanson, J.M. and W.C. Leggett. 1986. Effect of competition between two freshwater fishes on
prey consumption and abundance. Canadian Journal of Fisheries and Aquatic Sciences 43:1363-1372.
Hartman, K.J. 1998. Diet of white bass in the Ohio waters of Lake Erie during June-October
1988. Transactions of the American Fisheries Society 127:323-328.
122

Hartman, K.J., and S.B. Brandt. 1995. Comparative energetics and the development of bioenergetics models for sympatric estuarine piscivores. Canadian Journal of Fisheries and Aquatic Sciences 52:1647-1666.
Hartman, K.J., and F.J. Margraf. 1992. Effects of prey and predator abundances on prey
consumption and growth of walleyes in western Lake Erie. Transactions of the American Fisheries Society 121:245-260.
Hayes, D.B., W.W. Taylor, and P.A. Soranno. 1999. Natural lakes and large impounds. Pages
589-621 in C.C. Kohler and W.A. Hubert, editors. Inland fisheries management in North America, 2nd edition. American Fisheries Society, Bethesda, Maryland.
Heidinger, R.C. 1977. Potential of threadfin shad as a forage fish in midwestern power cooling
reservoirs. Transactions of the Illinois State Academy of Science 70:15-25. Heidinger, R.C., B. Tetzlaff, and J. Stoeckel. 1985. Evidence of two feeding subpopulations of
white crappie (Pomoxis annularis) in Rend Lake, Illinois. Journal of Freshwater Ecology 3:133-143.
Hergenrader, G.L,. and Q.P. Bliss. 1971. The white perch in Nebraska. Transactions of the
American Fisheries Society 100(4):734-738. Heubach, W., R.J. Toth, and A.M. McCready. 1963. Food of young-of-the-year striped bass
(Roccus saxatilis) in the Sacramento-San Joaquin River system. California Fish and Game 49:224-239.
Higginbotham, B. 1979. Growth, food habits, maturity, and distribution of the striped bass
(Morone saxatilis) in Watts Bar Reservoir, Tennessee. Master’s thesis. University of Tennessee, Knoxville, Tennessee.
Hjorth, D.A. 1988. Feeding selection of larval striped bass and white perch in the Peekskill
Region of the Hudson River. Pages 134-147 in C.L. Smith, editor. Fisheries Research in the Hudson River. State University of New York Press, Albany, New York.
Hoogland, R., D. Morris, and N. Tinberg. 1956. The spines of sticklebacks (Gasterosteus and
Pygosteus) as means of defense against predators (Perca and Esox). Behavior 10:205-236.
Hoyle, J.A., and A. Keast. 1987. The effect of prey morphology and size on handling time in a
piscivore, the largemouth bass (Micropterus salmoides). Canadian Journal of Zoology 65:1972-1977.
Hubert, W.A., and D.T. O’Shea. 1992. Use of spatial resources by fishes in Grayrocks Reservoir,
Wyoming. Journal of Freshwater Ecology 7:219-225.
123

Humphreys, M. 1983. Effects of forage variations on young-of-year striped bass and other young predators in Cherokee Reservoir, Tennessee. Master’s thesis. University of Tennessee, Knoxville, Tennessee.
Hunter, J.G. 1959. Survival and production of pink and chum salmon in a coastal stream. Journal
of the Fisheries Research Board of Canada 16:835-886. Hurley, D.A., 1992. Feeding and trophic interactions of white perch (Morone americana) in the
Bay of Quinte, Lake Ontario. Canadian Journal of Fisheries and Aquatic Sciences 49:2249-2259.
Hyslop, E. J. 1980. Stomach contents analysis – a review of methods and their application.
Journal of Fish Biology 17:411-429. Irons, K.S., T.M. O’Hara, M.A. McClelland, and M.A. Pegg. 2002. White perch occurrence,
spread, and hybridization in the middle Illinois River, upper Mississippi River system. Transactions of the Illinois State Academy of Science 95(3):207-214.
Isermann, D.A., W.L. McKibbin, and D.W. Willis. 2002. An analysis of methods for quantifying
crappie recruitment variability. North American Journal of Fisheries Management 22:1124-1135.
Jacobs, K.E., and W.D. Swink. 1982. Estimations of fish population size and sampling efficiency
of electrofishing and rotenone in two Kentucky tailwaters. North American Journal of Fisheries Management 2:219-248.
Jenkins, R.M. 1979. Predator-prey relations in reservoirs. Pages 123-134 in H. Clepper, editor.
Predator-prey systems in fisheries management. Sport Fishing Institute, Washington, D.C.
Jenkins, R. E., and N. M. Burkhead. 1993. Freshwater fishes of Virginia. American Fisheries
Society, Bethesda, Maryland. Jenkins, R.M., and D.J. Morais. 1978. Prey-predator relations in the predator-stocking-evaluation
reservoirs. Proceedings of the Annual Conference of the Southeastern Association of Fish and Wildlife Agencies 30:141-157.
Johnson, T.B., and D.O. Evans. 1990. Size-dependent winter mortality of young-of-the-year
white perch: climate warming and invasion of the Laurentian Great Lakes. Transactions of the American Fisheries Society 119:301-313.
Johnson, T.B., and D.O. Evans. 1991. Behaviour, energetics, and associated mortality of young-
of-the-year white perch (Morone americana) and yellow perch (Perca flavescens) under simulated winter conditions. Canadian Journal of Fisheries and Aquatic Sciences 48:672-680.
124

Johnson, D.L., and W.E. Lynch, Jr. 1992. Panfish use of and angler success at evergreen tree, brush, and stake-bed structures. North American Journal of Fisheries Management 12:222-229.
Juanes, F. 1994. What determines prey size selectivity in piscivorous fishes? Pages 79-100 in
D.J. Stouder, K.L. Fresh, and R.J. Fuller, editors. Theory and application in fish feeding ecology. University of South Carolina Press, Columbia, South Carolina.
Juanes, F., R.E. Marks, K.A. McKown, and D.A. Conover. 1993. Predation by age-0 bluefish on
age-0 anadromous fishes in the Hudson River Estuary. Transactions of the American Fisheries Society 122:348-356.
Keast, A., and J.M. Eadie. 1985. Growth depensation in year-0 largemouth bass: the influence of
diet. Transactions of the American Fisheries Society 114:204-213. Kellison, G.T., D.B. Eggleston, and M. Tanaka. 2002. Density-dependent predation and
implications for stock enhancement with Japanese flounder. Journal of Fish Biology 60:968-980.
Kerby, J.H. 1979. Morphometric characters of two Morone hybrids. Proceedings of the Annual
Conference of the Southeastern Association of Fish and Wildlife Agencies 33:344-352. Klaassen, H.E, and G.R. Marzolf. 1971. Relationships between distributions of benthic insects
and bottom feeding fishes in Turtle Creek Reservoir. Pages 385-395 in G.E. Hall, editor. Reservoir fisheries and limnology. American Fisheries Society, Special Publication 8, Bethesda, Maryland.
Kohler, C.C., and J.J. Ney. 1981. Consequences of an alewife die-off to fish and zooplankton in
a reservoir. Transactions of the American Fisheries Society 110:360-369. Kohler, C. C., J. J. Ney, and W. E. Kelso. 1986. Filling the void: development of a pelagic
fishery and its consequences to littoral fishes in a Virginia mainstream reservoir. Pages 166-177 in G. E. Hall and M. J. Van Den Avyle, editors. Reservoir Fisheries Management: Strategies for the 80s. American Fisheries Society, Bethesda, Maryland.
Lawrence, J.M. 1958. Estimated sizes of various forage fishes largemouth bass can swallow.
Proceedings of the Annual Conference Southeastern Association of Game and Fish Commissioners 11:220-225.
Leach, J.F. 1962. Summer food and feeding of white perch Roccus americanus (Gmelin), in the
Bay of Quinte. Master’s Thesis. University of Toronto Library. Lewis, W.M., R. Heidinger, W. Kirk, W. Chapman, and D. Johnson. 1974. Food intake of the
largemouth bass. Transactions of the American Fisheries Society 2:277-280.
125
Li, H.W., and P.M. Moyle. 1999. Management of introduced fishes. Pages 345-374 in C.C. Kohler and W.A. Hubert, editors. Inland fisheries management in North America, 2nd edition. American Fisheries Society, Bethesda, Maryland.
Long, J.M., and W.L. Fisher. 2001. Precision and bias of largemouth, smallmouth, and spotted
bass ages estimated from scales, whole otoliths, and sectioned otoliths. North American Journal of Fisheries Management 21:636-645.
Maceina, M.J. 1988. Simple grinding procedure to section otoliths. North American Journal of
Fisheries Management 8:141-143. Maceina, M.J., and M.R. Stimpert. 1998. Relations between reservoir hydrology and crappie
recruitment in Alabama. North American Journal of Fisheries Management 18:104-113. Madenjian, C.P., R.L. Knight, M.T. Bur, and J.L. Forney. 2000. Reduction in recruitment of
white bass in Lake Erie after invasion of white perch. Transactions of the American fisheries Society 129:1340-1353.
Magnuson, J.J. 1976. Managing with exotics-a game of chance. Transactions of the American
Fisheries Society 105:1-9. Manooch, C.S., III. 1973. Food habits of yearling and adult striped bass, Morone saxatilis
(Walbaum), from Albemarle Sound, North Carolina. Chesapeake Science 14(2):73-86. Mansueti, R.J. 1961. Movements, reproduction, and mortality of the white perch, Roccus
americanus, in the Patuxent Estuary, Maryland. Chesapeake Science 2:142-205. Mansueti, R.J., 1964. Eggs, larvae, and young of the white perch, Roccus americanus, with
comments on its ecology in the estuary. Chesapeake Science 5(1-2):3-45. Marcy, B.C., Jr., and F.P. Richards. 1974. Age and growth of the white perch Morone americana
in the lower Connecticut River. Transactions of the American Fisheries Society 103(1):117-120.
Markham, J.L., D.L. Johnson, and R.W. Petering. 1991. White crappie summer movements and
habitat use in Delaware reservoir, Ohio. North American Journal of Fisheries Management 11:504-512.
Markle, D.F., and G.C. Grant. 1970. The summer food habits of young-of-year striped bass in
three Virginia rivers. Chesapeake Science 11:50-54. Mathews, W.J., F.P. Gelwick, and J.J. Hoover. 1992. Food and habitat use by juveniles of
species of Micropterus and Morone in a southwestern reservoir. Transactions of the American Fisheries Society 121:54-66.
126

Mathur, D., and T.W. Robbins. 1971. Food habits and feeding chronology of young white crappie, Poxomis annularis Rafinesque, in Conowingo Reservoir. Transactions of the American Fisheries Society 100:307-311.
Matter, W.J., and R.W. Mannan. 2005. How do Prey Persist? The Journal of Wildlife
Management 69:1315-1320. McGovern, J. C., and J. E. Olney. 1988. Potential predation by fish and invertebrates on early
life history stages of striped bass in Pamunkey River, Virginia. Transactions of the American Fisheries Society 117:152-161.
Menzel, R.W. 1943. The catfish fishery of Virginia. Transactions of the American Fisheries
Society 73:364-372. Merriman, D. 1941. Studies on the striped bass, Roccus saxatilis, of the Atlantic Coast. U.S. Fish
and Wildlife Service Bulletin 50:1-77. Michaletz, P.H. 1997. Influence of abundance and size of age-0gizzard shad on predator diets,
diet overlap, and growth. Transactions of the American Fisheries Society 126:101-111. Minckly, W.L. 1962. Spring foods of juvenile blue catfish from the Ohio River. Transactions of
the American Fisheries Society 91:95. Mitzner, L. 1981. Influence of floodwater storage on abundance of juvenile crappie and
subsequent harvest at Lake Rathbun, Iowa. North American Journal of Fisheries Management 1:46-50.
Momot, W.T., J. Erickson, and F. Stevenson. 1977. Maintenance of a walleye (Stizostedion
vitreum vitreum) fishery in a eutrophic reservoir. Journal of the Fisheries Research Board of Canada 34:1725-1733.
Monteleone, D.M., and E.D. Houde. 1992. Vulnerability of striped bass Morone saxatilis
Waldbaum eggs and larvae to predation by juvenile white perch Morone americana Gemelin. Journal of Experimental Marine Biology and Ecology 158:93-104.
Moore, C.M. 1988. Food habits, population dynamics, and bioenergetics of four predatory fish
species in Smith Mountain Lake, Virginia. Ph.D. dissertation. Virginia Polytechnic Institute and State University, Blacksburg, VA.
Moore, C.J., S.L.H. Fuller, and D.T. Burton. 1975. A comparison of food habits of white perch
(Morone americana) in the heated effluent canal of a steam electric station and in an adjacent river system. Environmental Letters 8(4):315-323.
127

Moore, C.M., R.J. Neves, J.J. Ney, and D.K. Whitehurst. 1985. Utilization of alewives and gizzard shad by striped bass in Smith Mountain Lake, Virginia. Proceedings of the Annual Conference of the Southeastern Association of Fish and Wildlife Agencies 39:108-115.
Morris, D.J., and Follis. 1978. Effects of striped bass predation upon shad in Lake E.V. Spence,
Texas. Proceedings of the Annual Conference of the Southeastern Association of Fish and Wildlife Agencies 32:697-702.
Neal, W.E. 1969. Landlocked striped bass of John H. Kerr Reservoir, a ten year summary of
research and management activities. Virginia Commission of Game and Inland Fisheries, Richmond, VA.
Neal, W.E. 1976. Landlocked striped bass survey. Virginia Commission of Game and Inland
Fisheries, Richmond, VA. Neave, F. 1953. Principles affecting the size of pink and chum salmon populations in British
Columbia. Journal of the Fisheries Research Board of Canada 9:450-491. O’Brien, W.J., B. Loveless, and D. Wright. 1984. Feeding ecology of young white crappie in a
Kansas reservoir. North American Journal of Fisheries Management 4:341-349. O’Gorman, R., and J.A.D. Burnett. 2001. Fish community dynamics in northeastern Lake
Ontario with emphasis on the growth and reproductive success of yellow perch (Perca flavescens) and white perch (Morone americana), 1978 to 1997. International Association of Great Lakes Research 27(3):367-383.
Olsen, M.H. 1996. Ontogenetic niche shifts in largemouth bass: variability and consequences for
first year growth. Ecology 77(1):179-190. Olsen, M.H., and B.P. Young. 2003. Patterns of diet and growth in co-occurring populations of
largemouth bass and smallmouth bass. Transactions of the American Fisheries Society 132:1207-1213.
Olmstead, L.L., and R.V. Kilambi. 1971. Interrelationships between environmental factors and
feeding biology of white bass of Beaver Reservoir, Arkansas. Pages 397-409 in G.E. Hall, editor. Reservoir fisheries and limnology. American Fisheries Society, Special Publication 8, Bethesda, Maryland.
Osenberg, C.W., E.E. Werner, G.G. Mittelbach, and D.J. Hall. 1988. Growth patterns in bluegill
(Lepomis macrochirus) and pumpkinseed (L. gibbosus) sunfish: environmental variation and the importance of ontogenetic niche shifts. Canadian Journal of Fisheries and Aquatic Sciences 45:17-26.
128

Ott, R.A., Jr., and S.P. Malvestuto. 1981. The striped bass x white bass hybrid in West Point Reservoir. Proceedings of the Annual Conference of the Southeastern Association of Fish and Wildlife Agencies 35:641-646.
Pace, M.L., S.B. Baines, H. Cyr, and J.A. Downing. 1993. Relationships among early life stages
of Morone americana and Morone saxatilis from long-term monitoring of the Hudson River Estuary. Canadian Journal of Fisheries and Aquatic Sciences 50:1976-1985.
Parrish, D.L., and F.J. Margraf. 1990. Interactions between white perch (Morone americana) and
yellow perch (Perca flavescens) in Lake Erie as determined from feeding and growth. Canadian Journal of Fisheries and Aquatic Sciences 47:1779-1781.
Pasch, R.W. 1975. Some relationships between food habits and growth of largemouth bass in
Lake Blackshear, Georgia. Proceedings of the Annual Conference Southeastern Association of Game and Fish Commissioners 28:307-321.
Perry, Jr., W.G. 1969. Food habits of blue catfish and channel catfish collected from a brackish
water habitat. Progressive Fish-Culturist 31:47-50. Persons, W.R., and R.V. Bulkley. 1982. Feeding activity and spawning time of striped bass in
the Colorado River Inlet, Lake Powell, Utah. North American Journal of Fisheries Management. 5:242-247.
Peterman, R.M., and M. Gatto. 1978. Estimation of functional responses of predators on juvenile
salmon. Journal of the Fisheries Research Board of Canada 35:797-807. Pine, W.E., III., and M.S. Allen. 2001. Differential growth and survival of weekly age-0 black
crappie cohorts in a Florida lake. Transactions of the American Fisheries Society 130:80-91.
Pope, K.L., and D.W. Willis. 1998. Early life history and recruitment of black crappie (Pomoxis
nigromaculatus) in two South Dakota waters. Ecology of Freshwater Fish 7:56-68. Prout, M.W., E.L. Mills, and J.L. Forney. 1990. Diet, growth and potential competitive
interactions between age-0 white perch and yellow perch in Oneida Lake, New York. Transactions of the American Fisheries Society 119:966-975.
Rash, J.M. 2003. Comparative ecology of juvenile striped bass and juvenile hybrid striped bass
in Claytor Lake, Virginia. Master’s thesis. Virginia Polytechnic Institute and State University, Blacksburg, Virginia.
Richardson, J.M. 1982. Food habits and growth of young-of-the-year striped bass in Norris
Reservoir, Tennessee. Master’s thesis. University of Tennessee, Knoxville, Tennesse.
Reid, G.K., Jr. 1949. Food of the black crappie Poxomis Nigro-Maculatus (LeSueur), in Orange Lake, Florida. Transactions of the American Fisheries Society 1:145-154.
129

Rogers, J.B., and C.C. Burley. 1991. A sigmoid model to predict gastric evacuation rates of smallmouth bass (Micropterus dolomieui) fed juvenile salmon. Canadian Journal of Fisheries and Aquatic Sciences 48:933-937.
Roseman, E.F., W.W. Taylor, D.B. Hayes, R.C. Hass, R.L. Knight, and K.O. Paxton. 1996.
Walleye egg deposition and survival on reefs in western Lake Erie (USA). Annales Zoology Fennici 33:341-351.
Ruderchausen, P.J., and J.G. Loesch. 2000. Feeding habits of young-of-year striped bass,
Morone saxatilis, and white perch, Morone americana, in the lower James River, VA. Virginia Journal of Science 51(1):23-36.
Ruelle, R. 1971. Factors influencing growth of white bass in Lewis and Clark Lake. Pages 411-
423 in G.E. Hall, editor. Reservoir fisheries and limnology. American Fisheries Society, Special Publication 8, Bethesda, Maryland.
Ruhr, E.C. 1957. Stream survey methods in the southeast. Pages 45-50 in K.D. Carlander, editor.
Symposium on evaluation of fish populations in warm-water streams. Iowa State College, Ames, Iowa, USA.
Sammons, S.M., D.A. Isermann, and P.W. Bettoli. 2002. Variation in population characteristics
and gear selection between black and white crappies in Tennessee reservoirs: potential effects on management decisions. North American Journal of Fisheries Management 22:863-869.
Saul, B.M. 1981. Food habits and growth of young-of-year striped bass in Cherokee Reservoir,
Tennessee. Master’s thesis. University of Tennessee, Knoxville, Tenneesee. Schaefer, R.H. 1970. Feeding habits of striped bass from the surf waters of Long Island. New
York Fish and Game Journal 17:1-17. Schaeffer, J.S., and F.J. Margraf. 1986. Food of white perch (Morone americana) and potential
for competition with yellow perch (Perca flavescens) in Lake Erie. The Ohio Journal of Science 86(1):26-29.
Schaeffer, J.S., and F.J. Margraf. 1987. Predation on fish eggs by white perch, Morone
americana, in western Lake Erie. Environmental Biology of Fishes 18(1):77-80. Schael, D.M., L.G. Rudstam, and J.R. Post. 1991. Gape limitation and prey selection in larval
yellow perch (Perca flavescens), freshwater drum (Aplodinotus grunniens), and black crappie (Pomoxis nigromaculatus). Canadian Journal of Fisheries and Aquatic Sciences 48:1919-1925.
Scharf, F.S., J.A. Buckel, F. Juanes, and D.O. Conover. 1997. Estimating piscine prey size from
partial remains: testing for shifts in foraging mode by juvenile bluefish. Environmental Biology of Fishes 49:377-388.
130

Schoener, T. W. 1970. Non-synchronous spatial overlap of lizards in patchy habitats. Ecology 51:408-418.
Scott, W.B., and W.J. Christie. 1963. The invasion of the lower Great Lakes by the white perch,
Roccus americanus (Gmelin). Journal of the Fisheries Research Board of Canada 20:1189-1195.
Setzler-Hamilton, E.M., P.W. Jones, F.D. Martin, K. Ripple, J.A. Mihursky, G.E. Drewry, and
M. Beaven. 1982. Comparative feeding habits of white perch and striped bass larvae in the Potomac Estuary. Proceedings of the Annual Meeting of the Potomac Chapter of the American Fisheries Society 5:139-157.
Shelton, W.L., W.D. Davies, T.A. King, and T.J. Timmons. 1979. Variation in growth of the
initial year class of largemouth bass in West Point Reservoir, Alabama and Georgia. Transactions of the American Fisheries Society 108: 142-149.
Sheri, A.N., and G. Power. 1969. Validity of the scale method and back calculation for
estimating age and growth of white perch, Morone americana. Pakistan Journal of Zoology 1:97-111.
Smith, E.P. 1985. Statistical comparison of weighted overlap measures. Transactions of the
American Fisheries Society 114:250-257. Stevens, R.A. 1958. Striped bass of the Santee-Cooper Reservoirs. Proceedings of the Annual
Conference Southeastern Association of Game and Fish Commissioners 11:253-264. Stevens, R. 1959. The white and channel catfishes of the Santee-Cooper Reservoir and tailrace
sanctuary. Proceedings of the Annual Conference Southeastern Association of Game and Fish Commissioners 13:203-219.
St-Hilaire, A., S.C. Courtenay, F. Dupont, and A.D. Boghen. 2002. Diet of white perch (Morone
americana) in the Richibucto Estuary, New Brunswick. Northeastern Naturalist 9(3):303-316.
Storck, T.W. 1986. Importance of gizzard shad in the diets of largemouth in Lake Shelpyville,
Illinois. Transactions of the American Fisheries Society 115:21-27. St. Pierre, R.A., J. Davis. 1972. Age, growth, and mortality of the white perch, Morone
americana, in the James and York Rivers, Virginia. Chesapeake Science 13(4):272-281. Summerfelt, R.C. 1999. Lake and reservoir habitat management. Pages 285-320 in C.C. Kohler
and W.A. Hubert, editors. Inland fisheries management in North America, 2nd edition. American Fisheries Society, Bethesda, Maryland.
131

Sutton, T. M. 1997. Early life history dynamics of a stocked striped bass (Morone saxatilis) population and assessment of strategies for improving stocking success in Smith Mountain Lake, Virginia. Doctoral dissertation. Virginia Polytechnic Institute and State University, Blacksburg, Virginia.
Sutton, T.M., and J.J. Ney. 2002.Trophic resource overlap between age-0 striped bass and
largemouth bass in Smith Mountain Lake, Virginia. North American Journal of Fisheries Management 22:1250-1259.
Tatum, B. 1961. Yadkin and Lower Catawba River Reservoirs, federal aid projects F5r and
F6R. North Carolina Wildlife Resoures Commission. Raleigh, NC. Thornton, K.W., and A.S. Lessem. 1978. A temperature algorithm for modifying biological
rates. Transactions of the American Fisheries Society 107:284-287. Timmons, T.J, W.L. Shelton, and W.D. Davies. 1980. Differential growth of largemouth bass in
West Point Reservoir, Alabama-Georgia. Transactions of the American Fisheries Society 109:176-186.
Timmons, T.J., W.L. Shelton, and W.D. Davies. 1981. Food of the largemouth bass before and
during the first three years after impoundment of West Point Reservoir, Alabama and Georgia. Journal of the Tennessee Academy of Science 56:23-27.
Todd, T.N. 1986. Occurrence of white bass-white perch hybrids in Lake Erie. Copeia 1986:1996-
1999. Townend, J. 2002. Practical statistics for environmental and biological scientists. John Wiley and
Sons Ltd., West Sussex, England. Van Den Avyle, M.J., B.J. Higginbotham, B.T. James, and F.J. Bulow. 1983. Habitat preferences
and food habits of young-of-the-year striped bass, white bass, and yellow bass in Watts Bar Reservoir, Tennessee. North American Journal of Fisheries Management 3:163-170.
Van Den Avyle, M.J., and J.E. Roussel. 1980. Evaluation of a simple method for removing food
items from live black bass. The Progressive Fish-Culturist 42:222-223. Wallace, D.C., 1971. Age, growth year class strength, and survival rates of the white perch,
Morone americana (Gmelin) in the Delaware River in the vicinity of Artificial Island. Chesapeake Science 12(4):205-218.
Wallace, R.K., Jr. 1981. An assessment of diet-overlap indexes. Transactions of the American
Fisheries Society 110:72-76. Walter, J.F., and H.M. Austin. 2003. Diet consumption of large striped bass (Morone saxatilis) in
Chesapeake Bay. Fisheries Bulletin 101(2):414-423.
132

Ward, S.M., and R.M. Neumann. 1998. Seasonal and size-related food habits of largemouth bass in two Connecticut lakes. Journal of Freshwater Ecology 13(2):213-220.
Ware, F.J. 1970. Some early life history of Florida’s inland striped bass, Morone saxatilis.
Proceedings of the Annual Conference Southeastern Association of Game and Fish Commissioners 24:439-447.
Warner, K. 1974. Utilization of fish as spring food by white perch and yellow perch in Maine
lakes. The Progressive Fish-Culturist 36(2):96-98. Weaver, O.R. 1975. A study of the striped bass, Morone saxatilis, in J. Percy Priest Reservoir,
Tennessee. Master’s thesis. Tennessee Technological University, Cookeville, Tennessee. Weisberg, S.B., and A.J. Janicki. 1990. Summer feeding patterns of white perch, channel catfish,
and yellow perch in the Susquehanna River, Maryland. Journal of Freshwater Ecology 5(4):391-405.
Weiss, C.M., P.H. Campbell, D.Y. Conlin, and S.L. Pfaender. 1978. John H. Kerr Reservoir
limnology study. A report to the U.S. Army Corps of Engineers, Wilmington District. University of North Carolina at Chapel Hill, N.C.
Welch, T.J., W.J. Van De Avyle, R.K. Betsill, and E.M. Driebe. 1993 Precision and relative
accuracy of striped bass age estimates from otoliths, scales, and anal fin rays and spines. North American Journal of Fisheries Management 13:616-620.
Werner, E.E. and D.J. Hall. 1977. Competition and habitat shift in two sunfishes (Centrarchidae).
Ecology 58:869-876. Whitehurst, D.K. 1982. Kerr Reservoir Striped Bass Population Study, Virginia Dingell Johnson
Project F-34. Virginia Commission of Game and Inland Fisheries, Richmond, VA. Whittaker, D.G., and F.G. Lindzey. 1999. Effects of coyote predation on early fawn survival in
sympatric deer species. Wildlife Society Bulletin 27:256-262. Wiens, J.A. 1977. On competition and variable environments. American Scientist 65:590-597. Wilson, D. 1997. Large impoundment report: John H. Kerr Reservoir. Virginia Department of
Game and Inland Fisheries, Farmville, VA. Wilson, D.M. and V.J. DiCenzo. 2002. Profile of a trophy largemouth bass fishery in Briery
Creek Lake, Virginia. Pages 583-592 in D.P. Philipp and M.S. Ridgeway, editors. Black bass: ecology, conservation, and management. American Fisheries Society, Symposium 31, Bethesda, Maryland.
133

Wong, R.K, R.L. Noble, J.R. Jackson, and S. Van Horn. 1999. White perch invasion of B. Everett Jordan Reservoir, North Carolina. Proceedings of the Annual Conference Southeastern Association of Fish and Wildlife Agencies 53:162-169.
Yako, L.A., M.M. Mather, and F. Juanes. 2000. Assessing the contribution of anadromous
herring to largemouth bass growth. Transactions of the American Fisheries Society 129:77-88.
Zaret, T.M., and A.S. Rand. 1971. Competition in tropical stream fishes: support of the
competitive exclusion principle. Ecology 52:336-342. Zarr, J.H. 1999. Biostatistical analysis, fourth edition. Prentice Hall, Upper Saddle River, New
Jersey. Zuerlein, G. 1981. The white perch, Morone americana (Gamelin) in Nebraska. Nebraska
Technical Series No. 8, Lincoln, Nebraska.
134

VITA
Johnathan Lee Harris was born on June 25, 1977, in Chesterfield, Virginia. Since
childhood, Johnathan has had a great passion for the outdoors, especially fishing and hunting.
His enthusiasm to enhance and sustain natural resources gave him a desire to pursue a career in
fisheries management. In 1999, he began his collegiate studies at Virginia Polytechnic Institute
and State University in Blacksburg, Virginia, where he received a Bachelor’s degree in Fisheries
Science in 2002. After working for a variety of agencies and organizations, including Virginia
Tech, Virginia DEQ, and University of Nevada at Reno, he entered the graduate program in the
Department of Fisheries and Wildlife Sciences at Virginia Tech in 2004 to pursue a Master of
Science in Fisheries Science. His Master’s research focused on the trophic ecology of the white
perch and their impacts on sportfishes of Kerr Reservoir, Virginia.
135