Impacts of Policies on Poverty - Food and Agriculture ... · Impacts of Policies on Poverty...
19
Module 006 Impacts of Policies on Poverty Relative Poverty Lines
Transcript of Impacts of Policies on Poverty - Food and Agriculture ... · Impacts of Policies on Poverty...
Impacts of Policies on Poverty Relative Poverty Lines
Module 006
Impacts of Policies on Poverty Relative Poverty Lines by
Lorenzo Giovanni Bellù, Agricultural Policy Support Service, Policy Assistance Division, FAO, Rome, Italy
Paolo Liberati, University of Urbino, "Carlo Bo", Institute of Economics, Urbino, Italy for the Food and Agriculture Organization of the United Nations, FAO
About EASYPol EASYPol is a an on-line, interactive multilingual repository of downloadable resource materials for capacity development in policy making for food, agriculture and rural development. The EASYPol home page is available at: www.fao.org/tc/easypol. EASYPol is developed and maintained by the Agricultural Policy Support Service, Policy Assistance Division, FAO.
The designations employed and the presentation of the material in this information product do not imply the expression of any opinion whatsoever on the part of the Food and Agriculture Organization of the United Nations concerning the legal status of any country, territory, city or area or of its authorities, or concerning the delimitation of its frontiers or boundaries.
© FAO November 2005: All rights reserved. Reproduction and dissemination of material contained on FAO's Web site for educational or other non-commercial purposes are authorized without any prior written permission from the copyright holders provided the source is fully acknowledged. Reproduction of material for resale or other commercial purposes is prohibited without the written permission of the copyright holders. Applications for such permission should be addressed to: [email protected].
Impacts of Policies on Poverty Relative Poverty Lines
Table of Contents
1 Summary ....................................................................................1
2 Introduction.................................................................................1
3 Conceptual background .................................................................2 3.1 Income levels (IL) ..................................................................... 2 3.2 Income positions (IP) ................................................................ 3
4 A step-by-step procedure and examples for the Income Levels (IL) method ......................................................................................4 4.1 A simplified step-by step numerical example for the IL method........ 5 4.2 The IL method in South Africa..................................................... 6 4.3 The IL method in the European Union and Portugal........................ 6
5 Step-by-step procedure and examples for the Income Position (IP) method........................................................................................7
6 Synthesis and conclusions..............................................................9
7 ... 10A comprehensive step-by-step procedure to select a poverty line
8 Readers’ Notes ........................................................................... 12 8.1 Time requirements.................................................................. 12 8.2 Frequently asked questions ...................................................... 12 8.3 Links to other EASYpol modules ................................................ 12
9 References and further readings ................................................... 13
Module metadata .............................................................................. 14

Impacts of Policies on Poverty Relative Poverty Lines
1
1 SUMMARY
This module illustrates how to define “relative” poverty lines, i.e. poverty lines based on approaches that consider the welfare position of each individual or household in relation to the welfare position of other individuals or households belonging to the same community. In particular, the module, after emphasizing the importance of the relative
poverty concept in policy work, discusses two methods to define relative poverty
lines: a) the “income levels” method; and b) the “income positions” method. It also shows in what these methods differ, and how they can be made operational, by means of step-by-step procedures and examples. In policy work, relativist concepts of poverty are widely used.
2 INTRODUCTION
The aim of this module is to provide the reader with concepts and tools to build poverty lines on the basis of relative concepts of poverty and to illustrate related advantages and shortcomings implicit in these methods. This topic is particularly relevant in policy work both in less industrialized and in industrialized countries because relative poverty measures may encompass almost all poverty measures based on a monetary definition of well-being. Furthermore, the effects of anti-poverty policies and the impacts of other policies on poverty are often assessed on the basis of their impacts on relative poverty. This module also belongs to a set of modules that discuss the definition of poverty, the identification of poverty and measurement of poverty.
Target audience
This module targets applied analysts who want to work on poverty issues. In addition, academics, officers in ministries and other professionals can make use of this material for their work. Furthermore, students interested in poverty issues may find this material relevant for their studies.
Required background
The trainer should verify that the audience is familiar with the concept of income distribution and with the concept of poverty and the way in which poverty is defined. Elementary knowledge of mathematics and statistics is required. Familiarity with the definition of poverty and the identification of poverty is also required. A complete set links of other related EASYPol modules are included at the end of this module. However, you will also find links to related material throughout the text where relevant1.
1 EASYPol hyperlinks are shown in blue, as follows:
a) training paths are shown in underlined bold font b) other EASYPol modules or complementary EASYPol materials are in bold underlined italics; c) links to the glossary are in bold; and d) external links are in italics.
EASYPol Module 006 Analytical Tools
2
3 CONCEPTUAL BACKGROUND
Poverty may be conceptualised either in absolute terms or in relative terms2. This module will analyse the relative concepts. In particular, the following methods will be investigated: income levels (IL); income positions (IP).
These methods rely on defining a threshold that is relative to a widely accepted measure of well-being. In particular, they rely on a threshold that is relative to either income or expenditure. The final aim is to define a poverty line. In both cases, the “relative” definition of poverty may make the poverty line responsive to the way in which the income is distributed among individuals as well as the mean income3. In this module, we will take income as a reference variable. Whatever will be said, however, holds its validity if expenditure is considered instead of income. In applied works, expenditure is sometimes taken as a more correct welfare indicator than income, as transitory shocks may drive observed income far from its permanent (or life-cycle) level. Expenditures, instead, are thought to better reflect this level of permanent income4. Expenditure may therefore be more appropriate if concerns rest primarily on the level of welfare attained by a given individual or household. However, Atkinson, 1989, argued that where poverty is concerned with the right to a certain level of participation in a society, a minimum level of income might be more appropriate than expenditure (based on consumption).
3.1 Income levels (IL)
Any income distribution may be characterized by its measures of location, e.g, MEDIAN or MEAN. Using IL methods means expressing poverty in relation to a measure of location of the income distribution. The features of the IL method are as follows: It defines a poverty line as «less than mean income», «less than median income»
or «less than a given percentage of either mean or median income». In any case, what counts is the level of individual incomes in the income distribution. By this property, the value of the poverty line automatically evolves over time as far as mean or median income evolve;
It makes poverty analysis a subset of inequality analysis; It requires that the appropriate threshold of income be determined below which an
individual is consdiered to be poor. In some sense, this choice has some degree of arbitrariness (e.g.: mean or median income? 50 per cent or 60 per cent of mean income?);
2 See the EASYPol Module 005: Impacts of Policies on Poverty: Absolute Poverty Lines. 3 See Fuchs, 1965, and Fuchs, 1976. 4 The classical references are Modigliani and Brumberg, 1954; Friedman, 1957.
Impacts of Policies on Poverty Relative Poverty Lines
3
It focuses exclusively on income as an indicator of poverty. In this sense, it is mostly uni-dimensional, as no other indicator is usually taken into account to define poverty.
The notion of relative poverty has convincing, yet indirect, support by Townsend, 1979, who says that, lacking an alternative criterion, the best assumption would be to relate sufficiency to the average rise (or fall) in real incomes. One critique has been formulated by Sen, 1983, that argues that consequences of taking a rigid relativist view is that poverty cannot – simply cannot – be eliminated, and an anti-poverty programme can never really be quite successful. A counter-critique to this argument is by Atkinson, 1983, who replies that it is quite possible to imagine a society in which no one has less than a half the average income, and therefore where there is no poverty according to this definition.
3.2 Income positions (IP)
An alternative, yet similar way of defining relative poverty is to look not at income levels but at the income position in the income distribution. The income distribution may be represented by quantiles. The IP method defines as being “poor” all those individuals (or households) who fall below a given quantile (usually the tenth or the twentieth) of the income distribution ranked in ascending order. The main features of the IP method are: It looks at the position of the individual in the income distribution; Poverty is seen as a part of the total income distribution, i.e. «poverty as
inequality»; It requires that the position below which an individual falls in poverty be defined.
In some sense, this choice has some degree of arbitrariness (e.g. bottom 10 or 20 per cent of the population?);
It gives rise to the case where «poverty will be always with us»5. Every income distribution, indeed, has a bottom end of the distribution, unless it is perfectly egalitarian;
It usually focuses on income as the indicator of poverty, as for IL. In this sense, it is mostly uni-dimensional, as no other indicator is usually taken into account to define poverty.
A widely quoted statement supporting this approach is from Miller and Roby, 1970. They say that casting the issue of poverty in terms of stratification leads to regarding poverty as an issue of inequality. In this way, we look at the nature and size of the differences between the bottom 20 or 10 per cent and the rest of society. The main concern of a poverty averse decision maker, they say, is to narrow the differences between those who are worse off and those who are better-off in each stratification dimension.
5 See Fiegehen, Lansley and Smith, 1977; p. 14.
EASYPol Module 006 Analytical Tools
4
A general warning that should be considered when using relative poverty lines of both IL and IP types described above is to be sure that they are meaningful in the context in which they are used. This implies matching information on both relative and absolute standards of living. This reinforces the impression that these methods should not be seen as mutually exclusive, rather they should be considered complementary to poverty analysis. Let us consider, for example, the case developed by Tinios et al., 1993, for Tanzania. Using absolute poverty lines based on calorific-defined poverty lines, they found that the proportion of poor people was measured in about 52 per cent. Using relative poverty lines measured as half of the median national income, they found that this percentage would drop to about 24 per cent. The main reason is that average income, in Tanzania, was substantially below the monetary requirement to satisfy the absolute caloric intake. Since in a typical income distribution the median income is less than the mean income, using half of the median income as a poverty line resulted in an extremely low poverty line, leaving more poor people artificially above the poverty line. This issue, however, is not peculiar of less developed countries. In a study based on Canada, Anderson and Ibbott, 1999, have shown that between 1978 and 1982 the income-based poverty measure declined, while the necessity expenditure-based poverty measure increased. Between 1982 and 1986, the income-based measure increased, while the necessity expenditure-based measure declined.
4 A STEP-BY-STEP PROCEDURE AND EXAMPLES FOR THE INCOME LEVELS (IL) METHOD
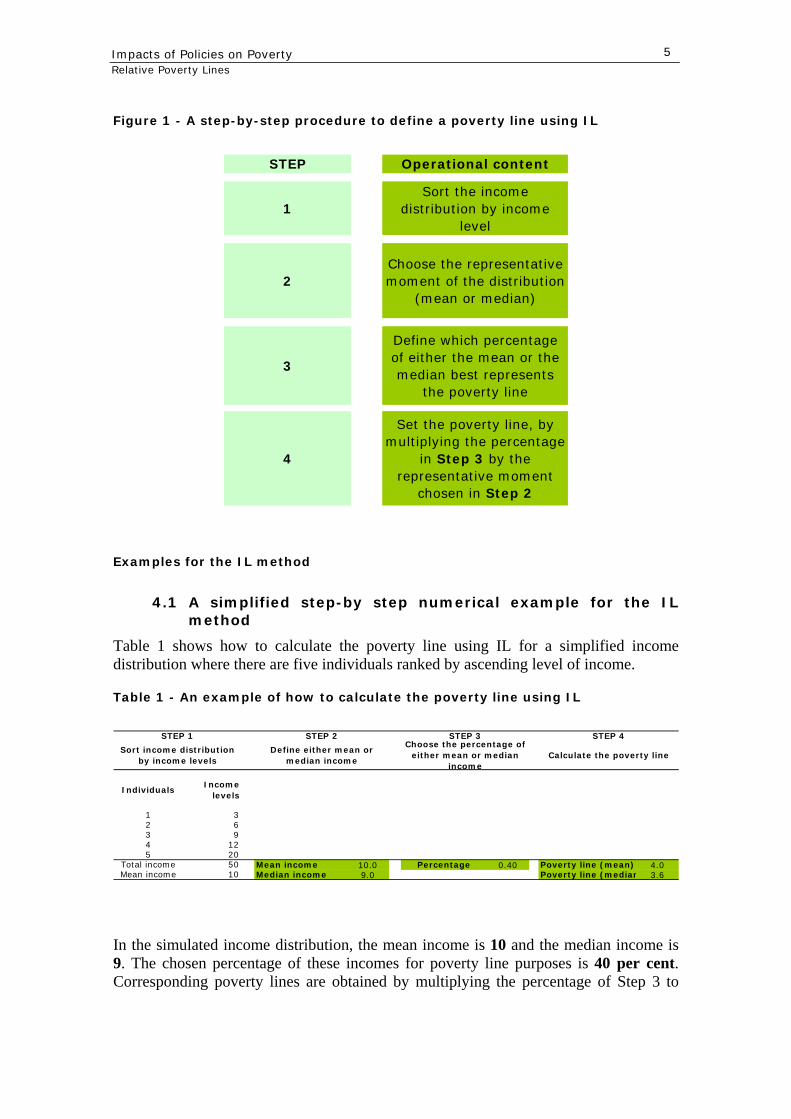
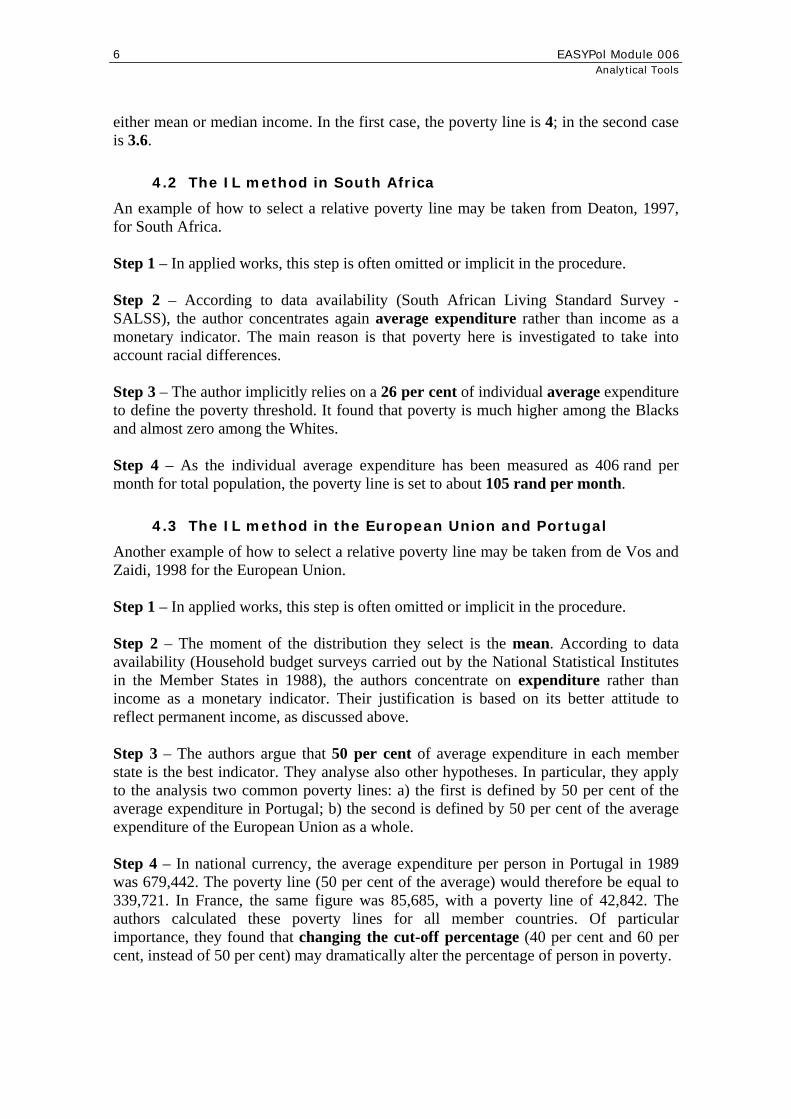
Figure 1, below, illustrates the simple steps needed to calculate poverty lines using IL methods. Step 1 requires that we sort the income distribution by income levels. This is not compulsory, but it is always better looking at a pre-sorted income distribution. Step 2 requires that we choose the representative indicator of the income distribution. Typically the choice falls on either the mean or the median income. Step 3 requires that we define which percentage of this indicator is suitable to represent the poverty line. It may be 50 per cent of the mean or 40 per cent of the median, and so on. In this step lies the arbitrariness of the procedure to set the poverty line. There is no scientific basis to decide upon the appropriate percentage. The poverty line can therefore be set by multiplying either the mean or the median income of the distribution by the chosen percentage.
Impacts of Policies on Poverty Relative Poverty Lines
5
Figure 1 - A step-by-step procedure to define a poverty line using IL
STEP Operational content
1Sort the income
distribution by income level
2Choose the representative moment of the distribution
(mean or median)
3
Define which percentage of either the mean or the median best represents
the poverty line
4
Set the poverty line, by multiplying the percentage
in Step 3 by the representative moment
chosen in Step 2
Examples for the IL method
4.1 A simplified step-by step numerical example for the IL method
Table 1 shows how to calculate the poverty line using IL for a simplified income distribution where there are five individuals ranked by ascending level of income.
Table 1 - An example of how to calculate the poverty line using IL
IndividualsIncome
levels
1 32 63 94 125 20
Total income 50 10.0 0.40 4.0Mean income 10 9.0 3.6Poverty line (median
STEP 3Choose the percentage of
either mean or median income
Percentage
STEP 4
Calculate the poverty line
Poverty line (mean)
STEP 1
Sort income distribution by income levels
Mean incomeMedian income
STEP 2
Define either mean or median income
In the simulated income distribution, the mean income is 10 and the median income is 9. The chosen percentage of these incomes for poverty line purposes is 40 per cent. Corresponding poverty lines are obtained by multiplying the percentage of Step 3 to
EASYPol Module 006 Analytical Tools
6
either mean or median income. In the first case, the poverty line is 4; in the second case is 3.6.
4.2 The IL method in South Africa
An example of how to select a relative poverty line may be taken from Deaton, 1997, for South Africa. Step 1 – In applied works, this step is often omitted or implicit in the procedure. Step 2 – According to data availability (South African Living Standard Survey - SALSS), the author concentrates again average expenditure rather than income as a monetary indicator. The main reason is that poverty here is investigated to take into account racial differences. Step 3 – The author implicitly relies on a 26 per cent of individual average expenditure to define the poverty threshold. It found that poverty is much higher among the Blacks and almost zero among the Whites. Step 4 – As the individual average expenditure has been measured as 406 rand per month for total population, the poverty line is set to about 105 rand per month.
4.3 The IL method in the European Union and Portugal
Another example of how to select a relative poverty line may be taken from de Vos and Zaidi, 1998 for the European Union. Step 1 – In applied works, this step is often omitted or implicit in the procedure. Step 2 – The moment of the distribution they select is the mean. According to data availability (Household budget surveys carried out by the National Statistical Institutes in the Member States in 1988), the authors concentrate on expenditure rather than income as a monetary indicator. Their justification is based on its better attitude to reflect permanent income, as discussed above. Step 3 – The authors argue that 50 per cent of average expenditure in each member state is the best indicator. They analyse also other hypotheses. In particular, they apply to the analysis two common poverty lines: a) the first is defined by 50 per cent of the average expenditure in Portugal; b) the second is defined by 50 per cent of the average expenditure of the European Union as a whole. Step 4 – In national currency, the average expenditure per person in Portugal in 1989 was 679,442. The poverty line (50 per cent of the average) would therefore be equal to 339,721. In France, the same figure was 85,685, with a poverty line of 42,842. The authors calculated these poverty lines for all member countries. Of particular importance, they found that changing the cut-off percentage (40 per cent and 60 per cent, instead of 50 per cent) may dramatically alter the percentage of person in poverty.
Impacts of Policies on Poverty Relative Poverty Lines
7
5 STEP-BY-STEP PROCEDURE AND EXAMPLES FOR THE INCOME POSITION (IP) METHOD
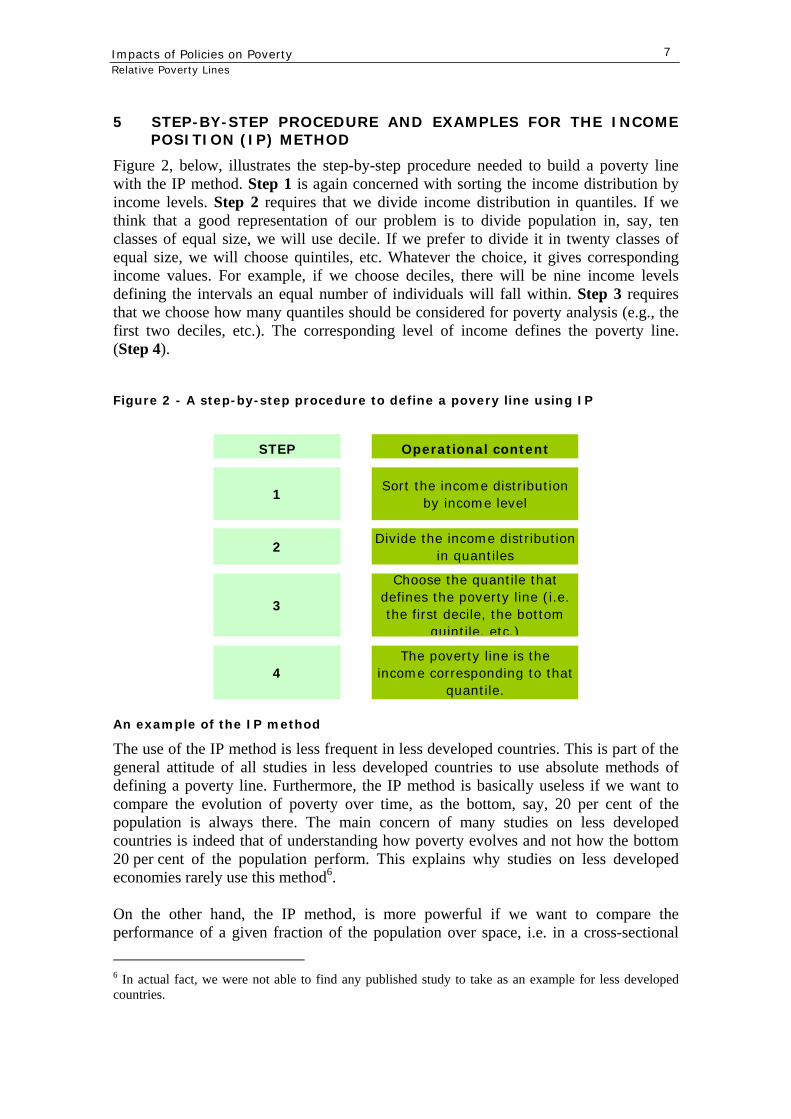
Figure 2, below, illustrates the step-by-step procedure needed to build a poverty line with the IP method. Step 1 is again concerned with sorting the income distribution by income levels. Step 2 requires that we divide income distribution in quantiles. If we think that a good representation of our problem is to divide population in, say, ten classes of equal size, we will use decile. If we prefer to divide it in twenty classes of equal size, we will choose quintiles, etc. Whatever the choice, it gives corresponding income values. For example, if we choose deciles, there will be nine income levels defining the intervals an equal number of individuals will fall within. Step 3 requires that we choose how many quantiles should be considered for poverty analysis (e.g., the first two deciles, etc.). The corresponding level of income defines the poverty line. (Step 4).
Figure 2 - A step-by-step procedure to define a povery line using IP
STEP Operational content
1Sort the income distribution
by income level
2Divide the income distribution
in quantiles
3
Choose the quantile that defines the poverty line (i.e. the first decile, the bottom
quintile, etc.)
4The poverty line is the
income corresponding to that quantile.
An example of the IP method
The use of the IP method is less frequent in less developed countries. This is part of the general attitude of all studies in less developed countries to use absolute methods of defining a poverty line. Furthermore, the IP method is basically useless if we want to compare the evolution of poverty over time, as the bottom, say, 20 per cent of the population is always there. The main concern of many studies on less developed countries is indeed that of understanding how poverty evolves and not how the bottom 20 per cent of the population perform. This explains why studies on less developed economies rarely use this method6. On the other hand, the IP method, is more powerful if we want to compare the performance of a given fraction of the population over space, i.e. in a cross-sectional
6 In actual fact, we were not able to find any published study to take as an example for less developed countries.
EASYPol Module 006 Analytical Tools
8
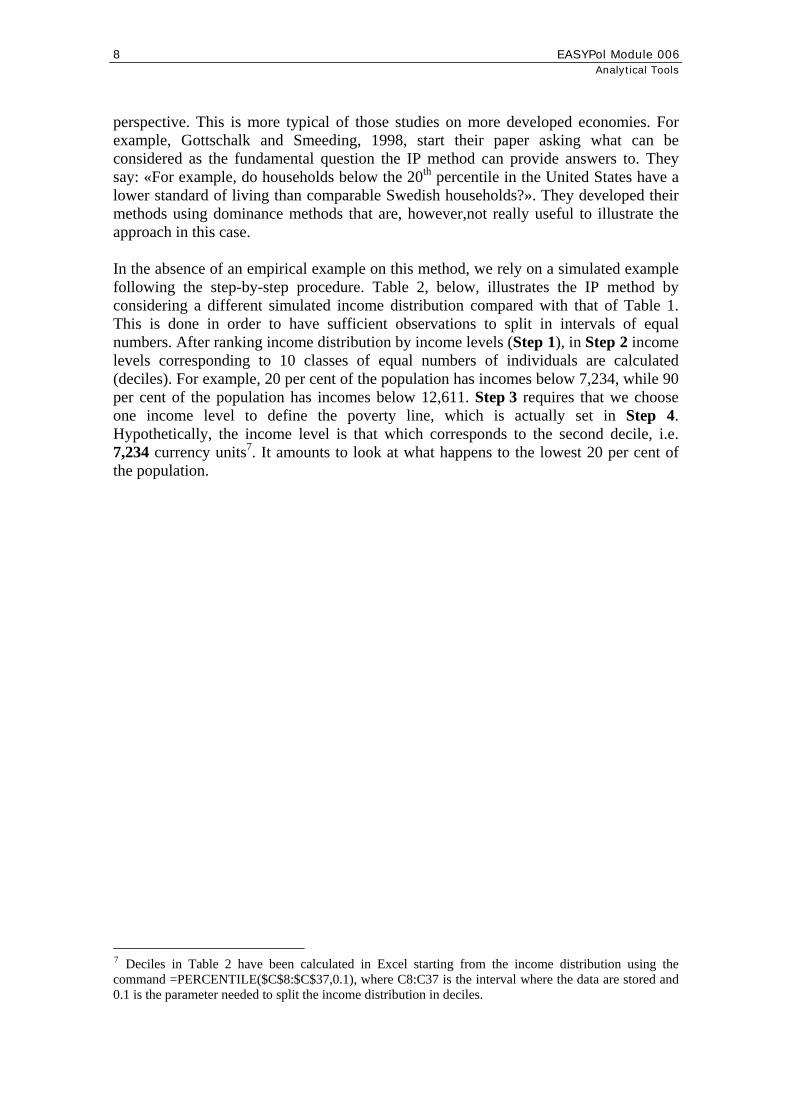
perspective. This is more typical of those studies on more developed economies. For example, Gottschalk and Smeeding, 1998, start their paper asking what can be considered as the fundamental question the IP method can provide answers to. They say: «For example, do households below the 20th percentile in the United States have a lower standard of living than comparable Swedish households?». They developed their methods using dominance methods that are, however,not really useful to illustrate the approach in this case. In the absence of an empirical example on this method, we rely on a simulated example following the step-by-step procedure. Table 2, below, illustrates the IP method by considering a different simulated income distribution compared with that of Table 1. This is done in order to have sufficient observations to split in intervals of equal numbers. After ranking income distribution by income levels (Step 1), in Step 2 income levels corresponding to 10 classes of equal numbers of individuals are calculated (deciles). For example, 20 per cent of the population has incomes below 7,234, while 90 per cent of the population has incomes below 12,611. Step 3 requires that we choose one income level to define the poverty line, which is actually set in Step 4. Hypothetically, the income level is that which corresponds to the second decile, i.e. 7,234 currency units7. It amounts to look at what happens to the lowest 20 per cent of the population.
7 Deciles in Table 2 have been calculated in Excel starting from the income distribution using the command =PERCENTILE($C$8:$C$37,0.1), where C8:C37 is the interval where the data are stored and 0.1 is the parameter needed to split the income distribution in deciles.
Impacts of Policies on Poverty Relative Poverty Lines
9
Table 2 - An example of how to calculate the poverty line using IP
Individual Income
distribution AIncome levels 7,234
1 2,417 5,8732 4,392 7,2343 5,200 7,8104 5,948 8,2345 6,500 8,6166 7,048 9,3567 7,280 10,2138 7,800 11,2829 7,800 12,61110 7,81411 8,01112 8,14313 8,29514 8,45015 8,48916 8,74417 9,11118 9,23919 9,53120 9,82221 10,07222 10,54023 10,90624 11,16825 11,73926 12,31627 12,57228 12,95729 14,51930 15,239
89
234567
Poverty line
1
Sort income distribution by income levels
Define quantiles, e.g. decilesChoose the quantile
defining the poverty lineCalculate the poverty line
Second decileDecile
STEP 1 STEP 2 STEP 3 STEP 4
6 SYNTHESIS AND CONCLUSIONS
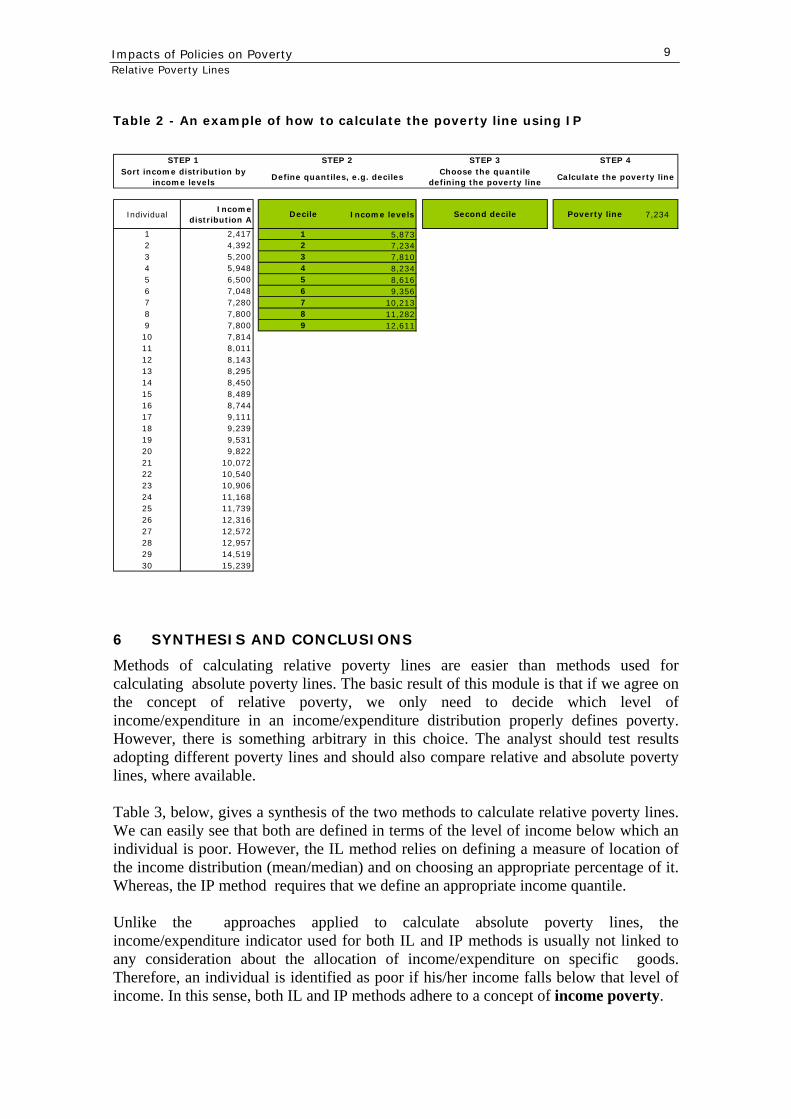
Methods of calculating relative poverty lines are easier than methods used for calculating absolute poverty lines. The basic result of this module is that if we agree on the concept of relative poverty, we only need to decide which level of income/expenditure in an income/expenditure distribution properly defines poverty. However, there is something arbitrary in this choice. The analyst should test results adopting different poverty lines and should also compare relative and absolute poverty lines, where available. Table 3, below, gives a synthesis of the two methods to calculate relative poverty lines. We can easily see that both are defined in terms of the level of income below which an individual is poor. However, the IL method relies on defining a measure of location of the income distribution (mean/median) and on choosing an appropriate percentage of it. Whereas, the IP method requires that we define an appropriate income quantile. Unlike the approaches applied to calculate absolute poverty lines, the income/expenditure indicator used for both IL and IP methods is usually not linked to any consideration about the allocation of income/expenditure on specific goods. Therefore, an individual is identified as poor if his/her income falls below that level of income. In this sense, both IL and IP methods adhere to a concept of income poverty.
EASYPol Module 006 Analytical Tools
10
Table 3 - Poverty lines in a relative perspective
Definition
General concept
Main requirements
Flaws/CriticismPoverty line numeraire
1Income levels
The percentage of mean/median
income below which an individual is poor
Income/expenditure poverty
Determine the measure of
location of the income distribution
to be taken as reference and the percentage of it
Uni-dimensional. It neglects other poverty dimensions.
Income/expenditure units
2Income position
The income quantile below
which an individual is poor
Income/expenditure poverty
Determine the income quantile
that better represents the
threshold
a) Uni-dimensional. It neglects other poverty
dimensions. b) Poverty is always with us. Not useful for temporal comparisons.
More useful for comparisons across space
Income/expenditure units
METHODS
The main criticism to both indicators is that they are uni-dimensional. Furthermore, the IP method is useless for temporal comparisons. In both cases, finally, the poverty line is expressed in terms of income or expenditure units.
7 A COMPREHENSIVE STEP-BY-STEP PROCEDURE TO SELECT A POVERTY LINE
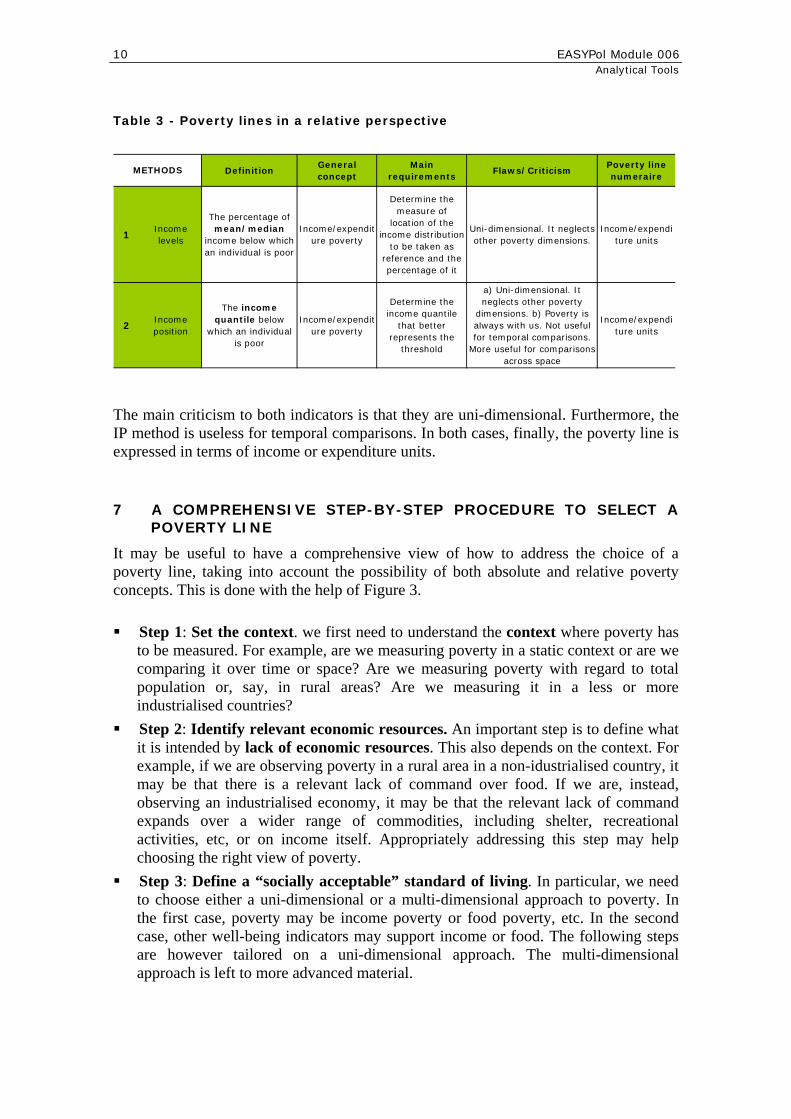
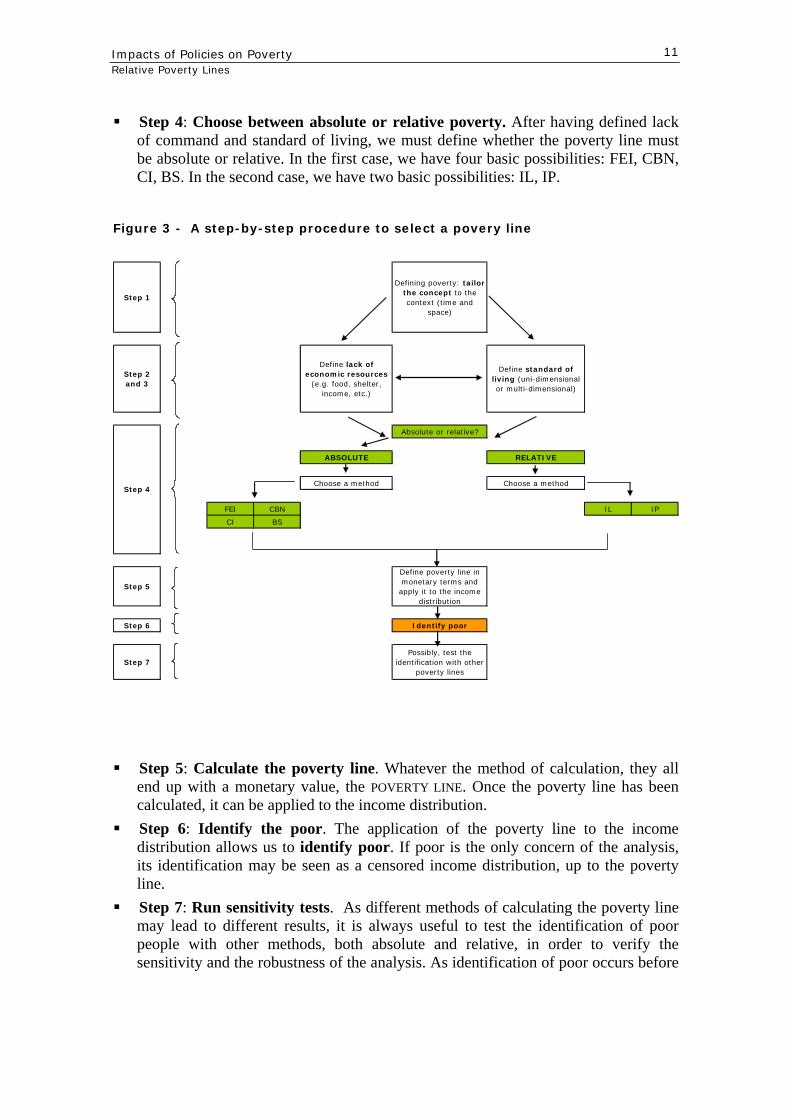
It may be useful to have a comprehensive view of how to address the choice of a poverty line, taking into account the possibility of both absolute and relative poverty concepts. This is done with the help of Figure 3. Step 1: Set the context. we first need to understand the context where poverty has
to be measured. For example, are we measuring poverty in a static context or are we comparing it over time or space? Are we measuring poverty with regard to total population or, say, in rural areas? Are we measuring it in a less or more industrialised countries?
Step 2: Identify relevant economic resources. An important step is to define what it is intended by lack of economic resources. This also depends on the context. For example, if we are observing poverty in a rural area in a non-idustrialised country, it may be that there is a relevant lack of command over food. If we are, instead, observing an industrialised economy, it may be that the relevant lack of command expands over a wider range of commodities, including shelter, recreational activities, etc, or on income itself. Appropriately addressing this step may help choosing the right view of poverty.
Step 3: Define a “socially acceptable” standard of living. In particular, we need to choose either a uni-dimensional or a multi-dimensional approach to poverty. In the first case, poverty may be income poverty or food poverty, etc. In the second case, other well-being indicators may support income or food. The following steps are however tailored on a uni-dimensional approach. The multi-dimensional approach is left to more advanced material.
Impacts of Policies on Poverty Relative Poverty Lines
11
Step 4: Choose between absolute or relative poverty. After having defined lack of command and standard of living, we must define whether the poverty line must be absolute or relative. In the first case, we have four basic possibilities: FEI, CBN, CI, BS. In the second case, we have two basic possibilities: IL, IP.
Figure 3 - A step-by-step procedure to select a povery line
Step 1
Defining poverty: tailor the concept to the context (time and
space)
Step 2 and 3
Define lack of economic resources
(e.g. food, shelter, income, etc.)
Define standard of living (uni-dimensional or multi-dimensional)
Absolute or relative?
ABSOLUTE RELATIVE
Choose a method Choose a method
FEI CBN IL IP
CI BS
Step 5
Define poverty line in monetary terms and
apply it to the income distribution
Step 6 Identify poor
Step 7Possibly, test the
identification with other poverty lines
Step 4
Step 5: Calculate the poverty line. Whatever the method of calculation, they all
end up with a monetary value, the POVERTY LINE. Once the poverty line has been calculated, it can be applied to the income distribution.
Step 6: Identify the poor. The application of the poverty line to the income distribution allows us to identify poor. If poor is the only concern of the analysis, its identification may be seen as a censored income distribution, up to the poverty line.
Step 7: Run sensitivity tests. As different methods of calculating the poverty line may lead to different results, it is always useful to test the identification of poor people with other methods, both absolute and relative, in order to verify the sensitivity and the robustness of the analysis. As identification of poor occurs before
EASYPol Module 006 Analytical Tools
12
measurement, bad identification may lead to bad measurement and to bad policies. Particular care must therefore be used with the identification activity.
8 READERS’ NOTES
8.1 Time requirements
The delivery of this module to an audience already familiar with the definition of poverty and with the identification of poverty by absolute concepts may take up two hours.
8.2 Frequently asked questions
Some frequently asked questions are:
What is better, relative or absolute concepts of poverty? There is no conclusive answer. Poverty is to some extent a matter of value judgment. An analysis embodying both concepts is strongly suggested, whenever available data allow it.
How do we build a relative poverty line? The main methods are IL and IP. Their basic functioning is the same. The common feature is that they record income poverty, without taking into consideration other indicators.
If we use relative approaches, does this not mean that poverty is always with us? To some extent, this is true. However, if we make recourse to the IP method, it is true that the same fraction of population is always poor. For this reason, the IP method should not be used in a time perspective, but only on cross-sectional comparisons. On the other hand, the use of the IL method does not imply that poverty is always with us, as it is perfectly conceivable that, at a given point in time, no one has an income less than half the average income.
8.3 Links to other EASYPol modules
Complementary EASYPol modules are: EASYPol Module 004: Impacts of Policies on Poverty: The Definition of Poverty
which is propaedeutic to this module; EASYPol Module 005: Impacts of Policies on Poverty: Absolute Poverty Lines
which complements the relative poverty approach of this module; EASYPol Module 007: Impacts of Policies on Poverty: Basic Poverty Measures
EASYPol Module 035: Impacts of Policies on Poverty: Poverty and Dominance
which is useful to understand how to skip the controversial issue of setting apoverty line. The “Poverty and Dominance” module, however, can be fullyappreciated by the reader if the other modules on poverty identification,definition and measurement are addressed first.
Impacts of Policies on Poverty Relative Poverty Lines
13
9 REFERENCES AND FURTHER READINGS
Anderson G., Ibbott P., 1999. Measuring Poverty in Canada: Ambiguity and Conflict,
paper presented at the Centre for the Study of Living Standards Conference on the State of Living Standards and Quality of Life in Canda, Ottawa, Canada.
Atkinson A., 1983. Social Justice and Public Policy, MIT Press, Cambridge, MA, USA. Atkinson A., 1989. Poverty and Social Security, Harverster Wheatsheaf, Hemel
Hempstead, UK. Deaton A., 1997. The Analysis of Household Surveys, The Johns Hopkins University
Press, Baltimore, USA. Fieghen G. C., Lansley P. S., Smith A. D., 1977. Poverty and Progress in Britain 1953-
1973, Cambridge University Press, Cambridge, UK. Friedman M., 1957. A Theory of the Consumption Function, Princeton University Press,
Princeton, USA. Fuchs V., 1965. Towards a Theory of Poverty, Task Force on Economic Growth and
Opportunity, The Concept of Poverty, Chamber of Commerce of the United States of America, Washington DC, USA
Fuchs V., 1976. Redefining Poverty and Redistributing Income, The Public Interest, 8, Washington DC, USA.
Miller Roby, 1970. Poverty: Changing Social Stratification, in Townsend P., The Concept of Povety, Heinemann, London, UK.
Modigliani F., Brumberg R., 1954. Utility Analysis and the Consumption Function: An Interpretation of Cross-Section Data, in Kurihara K.K. (ed.), Post-Keynesian Economics, New Brunswick: Rutgers University Press, pp. 388-436, Piscataway, USA.
Sen A., 1983. Poor, Relatively Speaking, Oxford Economic Papers, 35, pp.153-169, Oxford University Press, Oxford, UK.
Townsend P., 1979. Poverty in the United Kingdom, Penguin, London, UK. Tinios P., Sarris A., Amani H. K. R., 1993. Households, Consumption and Poverty in
Tanziania: Results from the 1991 National Cornell-ERB Survey, Cornell Food and Nutrition Policy Programme, Ithaca, New York, USA.
EASYPol Module 006 Analytical Tools
14
Module metadata
1. EASYPol module 006
2. Title in original language
English Impacts of Policies on Poverty
French
Spanish
Other language
3. Subtitle in original language
English Relative Poverty Lines
French
Spanish
Other language
4. Summary
This module illustrates how to define “relative” poverty lines, i.e. poverty lines based on approaches that consider the welfare position of each individual or household in relation to the welfare position of other individuals or households belonging to the same community. In particular, the module, after emphasizing the importance of the relative poverty concept in policy work, discusses two methods to define “relative poverty lines”: a) the “income levels” method; and b) the “income positions” method. It also shows in what these methods differ, and how they can be made operational, by means of step-by-step procedures and examples. In policy work, relativist concepts of poverty are widely used.
5. Date
November 2005
6. Author(s)
Lorenzo Giovanni Bellù, Agricultural Policy Support Service, Policy Assistance Division, FAO, Rome, Italy Paolo Liberati, University of Urbino, "Carlo Bo", Institute of Economics, Urbino, Italy
7. Module type
Thematic overview Conceptual and technical materials Analytical tools Applied materials Complementary resources
8. Topic covered by the module
Agriculture in the macroeconomic context Agricultural and sub-sectoral policies Agro-industry and food chain policies Environment and sustainability Institutional and organizational development Investment planning and policies Poverty and food security Regional integration and international trade Rural Development
9. Subtopics covered by the module
Impacts of Policies on Poverty Relative Poverty Lines
15
10. Training path Analysis and monitoring of socio-economic impacts of policies
11. Keywords