Impacts of exotic mangroves and chemical eradication of mangroves on tide pool fish ... · ·...
19
MARINE ECOLOGY PROGRESS SERIES Mar Ecol Prog Ser Vol. 472: 219–237, 2013 doi: 10.3354/meps09961 Published January 9 INTRODUCTION Mangroves in novel ecosystems Native mangrove forests provide important habitat for many species of resident and transient fish during high tides. Structural complexity resulting from tree trunks, prop roots, buttresses, and pneumatophores provides partial refuge from predation (Rönnbäck et al. 1999, Laegdsgaard & Johnson 2001, Ellis & Bell 2004). Algae and invertebrates that colonize tree roots and mangrove sediments are important food resources for various nekton species (Manson et al. 2005, Lin et al. 2007, Lugendo et al. 2007). However, most if not all studies documenting the fish habitat values of mangroves have been conducted within the native range of mangrove tree species. It is unclear how the invasion of coastlines by exotic mangroves alters fish habitat or whether exotic mangrove forests provide similar fish habitat value outside their native range. It is also unclear whether the invasion of native coastal ecosystems provides improved condi- tions for the invasion of other exotic fish, shrimp, or crabs. © Inter-Research 2013 · www.int-res.com *Email: [email protected] Impacts of exotic mangroves and chemical eradication of mangroves on tide pool fish assemblages Richard A. MacKenzie 1, * , Caitlin L. Kryss 1,2 1 USDA Forest Service, Pacific Southwest Research Station, Institute of Pacific Islands Forestry, 60 Nowelo St., Hilo, Hawaii 96720, USA 2 Marine Science Department, University of Hawaii at Hilo, 200 W. Kawili St., Hilo, Hawaii 96720, USA ABSTRACT: Fish were sampled from tide pools in Hawaii to determine how exotic mangroves Rhizophora mangle and the use of herbicides to chemically eradicate them are impacting tide pool fish assemblages. Ecological parameters were compared among mangrove-invaded, native vege- tated, and non-vegetated tide pools before and after mangroves had been chemically eradicated. Native fish densities were higher than exotic fish densities in all treatments, were dominated by flagtails Kuhlia xenura, did not differ among treatments, and 1 yr after herbicidial eradication of mangroves, were greater than or equal to pre-control densities. Exotic fish densities did not differ between mangrove and native vegetated tide pools, were dominated by mollies Poecilia sp., were significantly lower in non-vegetated vs. vegetated pools, and did not differ before and after man- grove eradication. Significantly smaller native flagtails and exotic mollies were present in man- grove tide pools than in all other treatments. Our data suggests that exotic mangroves in Hawaii are not having an adverse effect on native fish assemblages in tide pools, and may actually pro- vide nursery habitat for native and exotic fish. Furthermore, the presence of vegetation and not its origin may be more influential on exotic fish assemblages. Finally, our data suggests that if chem- ical eradication of mangroves negatively affected tide pool fish assemblages, those effects are short-lived. Future studies should attempt to quantify the ecological value of native versus exotic vegetation in supporting native (or exotic) fish assemblages. KEY WORDS: Rhizophora mangle · Invasive species · Non-native species · Nursery habitat · Kuhlia xenura · Poecilia · Hawaii · Pacific Island Resale or republication not permitted without written consent of the publisher This authors' personal copy may not be publicly or systematically copied or distributed, or posted on the Open Web, except with written permission of the copyright holder(s). It may be distributed to interested individuals on request.
Transcript of Impacts of exotic mangroves and chemical eradication of mangroves on tide pool fish ... · ·...
MARINE ECOLOGY PROGRESS SERIESMar Ecol Prog Ser
Vol. 472: 219–237, 2013doi: 10.3354/meps09961
Published January 9
INTRODUCTION
Mangroves in novel ecosystems
Native mangrove forests provide important habitatfor many species of resident and transient fish duringhigh tides. Structural complexity resulting from treetrunks, prop roots, buttresses, and pneumatophoresprovides partial refuge from predation (Rönnbäck etal. 1999, Laegdsgaard & Johnson 2001, Ellis & Bell2004). Algae and invertebrates that colonize treeroots and mangrove sediments are important food
resources for various nekton species (Manson et al.2005, Lin et al. 2007, Lugendo et al. 2007). However,most if not all studies documenting the fish habitatvalues of mangroves have been conducted within thenative range of mangrove tree species. It is unclearhow the invasion of coastlines by exotic mangrovesalters fish habitat or whether exotic mangrove forestsprovide similar fish habitat value outside their nativerange. It is also unclear whether the invasion ofnative coastal ecosystems provides improved condi-tions for the invasion of other exotic fish, shrimp, orcrabs.
© Inter-Research 2013 · www.int-res.com*Email: [email protected]
Impacts of exotic mangroves and chemical eradication of mangroves on tide pool fish
assemblages
Richard A. MacKenzie1,*, Caitlin L. Kryss1,2
1USDA Forest Service, Pacific Southwest Research Station, Institute of Pacific Islands Forestry, 60 Nowelo St., Hilo, Hawaii 96720, USA
2Marine Science Department, University of Hawaii at Hilo, 200 W. Kawili St., Hilo, Hawaii 96720, USA
ABSTRACT: Fish were sampled from tide pools in Hawaii to determine how exotic mangrovesRhizophora mangle and the use of herbicides to chemically eradicate them are impacting tide poolfish assemblages. Ecological parameters were compared among mangrove-invaded, native vege-tated, and non-vegetated tide pools before and after mangroves had been chemically eradicated.Native fish densities were higher than exotic fish densities in all treatments, were dominated byflagtails Kuhlia xenura, did not differ among treatments, and 1 yr after herbicidial eradication ofmangroves, were greater than or equal to pre-control densities. Exotic fish densities did not differbetween mangrove and native vegetated tide pools, were dominated by mollies Poecilia sp., weresignificantly lower in non-vegetated vs. vegetated pools, and did not differ before and after man-grove eradication. Significantly smaller native flagtails and exotic mollies were present in man-grove tide pools than in all other treatments. Our data suggests that exotic mangroves in Hawaiiare not having an adverse effect on native fish assemblages in tide pools, and may actually pro-vide nursery habitat for native and exotic fish. Furthermore, the presence of vegetation and not itsorigin may be more influential on exotic fish assemblages. Finally, our data suggests that if chem-ical eradication of mangroves negatively affected tide pool fish assemblages, those effects areshort-lived. Future studies should attempt to quantify the ecological value of native versus exoticvegetation in supporting native (or exotic) fish assemblages.
KEY WORDS: Rhizophora mangle · Invasive species · Non-native species · Nursery habitat · Kuhlia xenura · Poecilia · Hawaii · Pacific Island
Resale or republication not permitted without written consent of the publisher
This authors' personal copy may not be publicly or systematically copied or distributed, or posted on the Open Web, except with written permission of the copyright holder(s). It may be distributed to interested individuals on request.
Mar Ecol Prog Ser 472: 219–237, 2013
Over 60 species of mangroves can be found onPacific Islands throughout Oceania (Duke et al. 1998,2002). Isolation of many Pacific Islands, such as Tahitiand Hawaii, has prevented the natural colonizationof their coastlines by any of these mangrove tree spe-cies despite the fact that these islands share similarclimatic and geological features with islands thatsupport extant mangrove forests (Allen 1998). In1902, Rhizophora mangle seedlings from Floridawere planted along the shorelines of Molokai Islandto minimize erosion (Walsh 1967). Today, R. mangleis present on all 5 major Hawaiian Islands due tointentional plantings and spread of propagules viainterisland currents (Allen 1998, Bantilan-Smith et al.2009) and has established populations in habitatsthat range from mudflats to vegetated coastal wet-lands to tide pools. In its native new world range, R.mangle provides valuable fish habitat (Thayer et al.1987, Lorenz et al. 1997). However, it is unclear howexotic R. mangle is impacting native fish assem-blages along invaded coastlines of the Hawaiian andSociety Islands. This is especially interesting as Rhi-zophora species native to other Pacific Islands (e.g.Federated States of Micronesia, Australia) providehabitat for several species of cosmopolitan and con-generic fish (Vance et al. 1996, Rönnbäck et al. 1999,MacKenzie & Cormier 2012) also found in the Hawai-ian Islands.
Impacts of exotic mangroves
The colonization of mudflats by mangroves isthought to degrade native bird feeding and nurseryhabitat as well as provide refuge for bird predatorssuch as mongoose or cats (Allen 1998, Rauzon &Drigot 2002). Exotic stands of mangroves on Oahuand Molokai Islands increased densities of exoticepifaunal and infaunal invertebrates, and causedshifts in food web structure compared to adjacentsand flats. Both of these impacts were attributed toincreased structural complexity from mangroveroots coupled with shifts in organic matter inputs(Demopoulos et al. 2007, Demopoulos & Smith 2010).
Modified hydrology from increased structural com-plexity of mangrove roots and large inputs of organicmatter (e.g. mangrove leaf litter) to invaded coastalareas have been suggested as mechanisms that maynegatively impact native nekton habitat in Hawaii(Allen 1998, Fronda et al. 2008), yet few studies haveexamined this. Indeed, degradation of nekton habitathas been reported in coastal ecosystems invaded byexotic plants in other parts of the world. Decreased
densities of mummichog larvae and juveniles inPhragmites australis-invaded marshes versus nativeSpartina spp. marshes were attributed to a reducednumber of water-filled depressions and alteredhydrological cycles that resulted from increasedorganic matter inputs and stem densities of invasiveP. australis (Able et al. 2003, Osgood et al. 2003,Raichel et al. 2003). While similar impacts may occurin mangrove-invaded coastlines of Pacific Islands,comparisons of fish densities among intertidal man-groves and sand flats on Molokai Island using dropnets revealed no significant differences, althoughmangroves generally harbored higher densities ofexotic molly fish Poecilia sp. (Nakahara 2007). Man-groves invading tide pools may have greater impactson fish assemblages that utilize these habitatsbecause pools form discrete subtidal units to whichfish are restricted at low tide and neap tidal cycles.Leaf litter from mangrove trees can also accumulatein tide pools and potentially lead to anoxic conditionsthrough organic matter breakdown (Fronda et al.2008). Negative impacts to tide pools would not onlybe ecological through loss of native biodiversity, butcultural and economic as well, as tide pools supplytraditional food sources (i.e. snails, sea cucumbers)and support tourism by providing snorkeling areasprotected from rip tides or wave action (Flanders2007).
The invasion of coastlines by Rhizophora manglehas also negatively impacted the cultural values ofthese areas. Prop roots and trunks can destroy arche-ologically significant structures such as rock wallsbuilt by Hawaiians for fish ponds or heiau platforms(i.e. Hawaiian temples) (Allen 1998, Rauzon & Drigot2002). As a result of the negative impacts exotic man-groves are having on the ecological, cultural, andeconomical value of Hawaiian coasts, efforts toremove or control mangroves have increased. How-ever, these efforts have been costly and time con-suming. For example, the removal of 20 acres of R.mangle from Oahu island required nearly 20 yr ofvolunteer efforts and 2.5 million dollars (Rauzon &Drigot 2002). Clearly, more cost-effective and labor-efficient techniques are needed.
Study objectives
Mangroves around tide pools in Kapoho, Hawaiiserve as model ecosystems for examining the impactsof mangrove invasion on tide pool fish assemblages.Here, replicate tide pools differ in vegetation cover(mangrove, native vegetation, open), but not in sub-
220A
utho
r cop
y
MacKenzie & Kryss: Exotic mangroves and tide pool fish
strate (i.e. basalt), tidal inundation, and ground waterand nutrient inputs. This is especially important asthe latter 2 factors can vary significantly along thecoast of Hawaii Island (Johnson et al. 2008). Further-more, a planned effort to test the effectiveness of her-bicides at eradicating mangroves and their ability tospread to non-vegetated open tide pools and adja-cent uncolonized areas allowed us to examine howtide pools and nekton assemblages would respond tothis eradication technique.
The objectives of the study were to document thestructure of fish communities associated with thesedifferent tide pools and determine whether chemicaleradication of mangroves would have any impact onnearshore fish assemblages. Assuming that therewas minimal inter-annual variance in fish popula-tions, we hypothesized that (1) fish assemblagesassociated with mangrove tide pools would be domi-nated by densities and biomass of exotic fish species,(2) fish assemblages associated with native and non-vegetated tide pools would be dominated by densi-ties and biomass of native fish species, (3) densitiesand biomass of fish assemblages associated withmangrove tide pools would shift from exotic- tonative-dominated after mangrove eradication, and
(4) mangrove eradication via herbicide would haveminimal negative impacts on densities and biomassof native fish assemblages that utilize tide pools.
MATERIALS AND METHODS
Study site
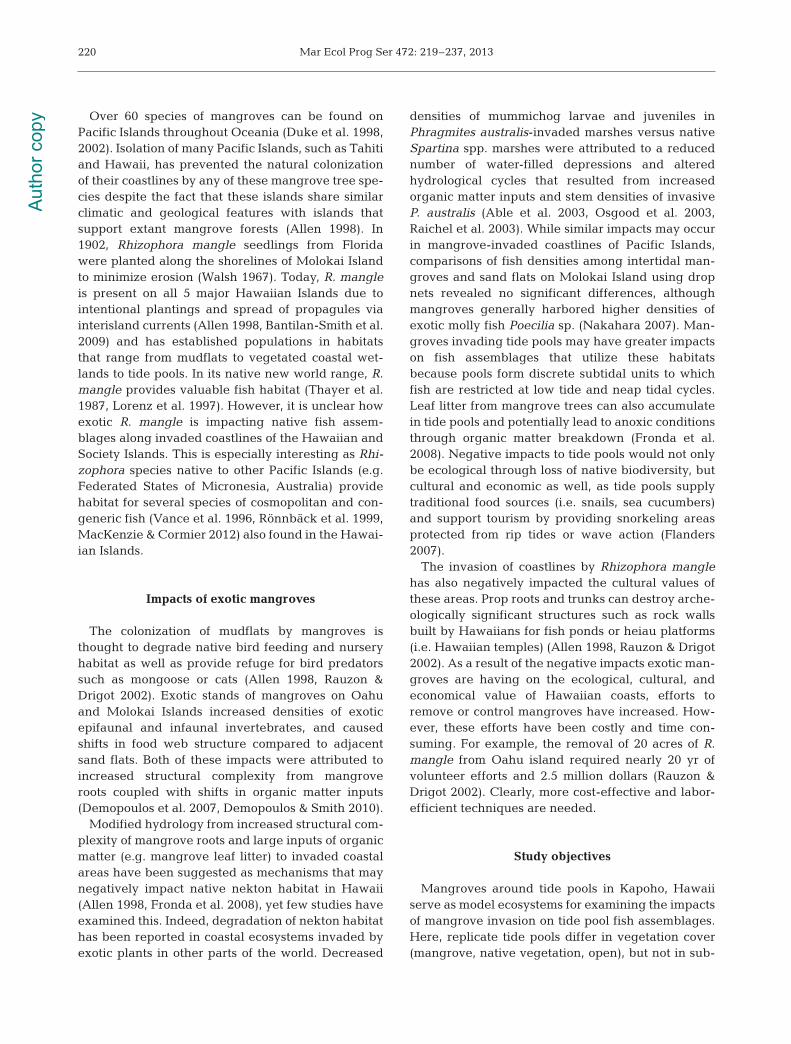
The Kapoho tide pools are located on the easterncoast of Hawaii Island, Hawaii, USA (19° 29’ 10”N,154° 49’ 19” W) (Fig. 1). The area is a sunken basaltbench comprising several shallow tide pools that areonly connected to each other during the highest oftides and that provide habitat for juveniles and adultsof many reef-associated fish species (Friedlander etal. 2007). The abundant fish and coral populations inthe tide pools are an important component ofHawaii’s tourism industry as they attract manysnorkelers each year (Flanders 2007). This area wasgranted protection in 2003 as a Marine Life Conser-vation District, due to recognition that it provides fishnursery habitat for the area’s coastline. Rhizophoramangle is thought to have been introduced in themid-1960s and now covers approximately 9.3 ha.
221
Fig. 1. Location of Kapoho tide pools on Hawaii Island. Solid line encloses area of mangroves treated with herbicide in 2009 (7.3 ha), dashed line encloses area of mangroves treated in 2010 (2 ha). Aerial photos: USDA NRCS (2007)
Aut
hor c
opy
Mar Ecol Prog Ser 472: 219–237, 2013
Other dominant vegetation cover includes native hauHibiscus tiliaceus and milo Thespesia populnea trees.
Study design
The impacts of mangroves and chemical era di -cation of mangroves on fish communities in Kapohotide pools were ex amined using a before-after- control- impact (BACI) design. Fish were sampledfrom 6 mangrove vegetated, 3 native vegetated, and6 non-vegetated tide pools in 2008 (before mangroveeradication), in 2009 (during mangrove eradication),and in 2010 (after mangrove eradication). Mangrovevegetated tide pools were surrounded by mangrovetrees, native vegetated tide pools were surroundedby milo and hau, and non-vegetated tide pools werepredominantly surrounded (>50%) by uncolonizedbasalt. Mangrove propa gules were occasionally re -moved from non-vegetated pools to maintain theseopen sites. Only 3 native vegetated pools were sam-pled because only 3 pools could be identified withinour study area that met the above criteria. After theinitial sampling period in 2008, the majority of man-groves (7.3 ha) were chemically treated by a non-profit environmental group (Malama O Puna) fromJune 2008 until May 2009. Holes were drilled in thetrunks of mangrove trees >1 m high in coastal areassurrounding 3 of the mangrove tide pools (impacted,hereafter referred to as 2009 MN). Mangrove treeswere then injected with 1 ml of Aquamaster™(53.8% glyphosate) per 2.54 cm of tree basal diame-ter for trees ≥5 cm dia meter and 0.3 ml per 2.54 cm ofdiameter for trees <5 cm. Smaller trees (<1 m) weresprayed with a mixture containing 0.3% Habitat™(28.7% imazapyr), 0.3% methylated seed oil surfac-tant and 0.2% marker dye. The remaining 3 man-grove (2010 MN), 3 native vegetated (NATVEG) and6 non-vegetated tide pools (OPEN) functioned ascontrol pools. As differences in coastal water chem-istry can result from differences in groundwater tem-peratures (e.g. presence/absence of hot springs),substrate age, or presence/absence of cess pools,mangrove, native vegetated and non-vegetated con-trol tide pools were located within the same water-shed as the treated areas. Inter-annual difference indensities and biomass of fish were thus considered toindicate a treatment effect as visual surveys con-ducted in these tide pools over the past 30 yr haveshown minimal inter-annual variation (Friedlander etal. 2007, Walsh et al. 2009).
Immediately after the sampling period in 2009,remaining stands of mangroves (2.0 ha) were eradi-
cated from the end of June 2009 until May 2010 asdescribed above, with the exception that trees wereinjected with 0.5 ml of Habitat™ per 2.54 cm of treebasal diameter for trees ≥5 cm diameter and 0.1 mlper 2.54 cm of diameter for trees <5 cm. Habitat™was used in the second year because smaller dosageswere required and proved to be more effective thanAquamaster™ (A. Kobsa unpubl. data). Living man-groves in the previously treated area were retreatedor removed by hand. This resulted in 2 groups ofimpacted pools: 2009 mangrove (mangroves chemi-cally eradicated before 2009 fish sampling; 2009 MN)and 2010 mangrove tide pools (mangroves chemi-cally eradicated before 2010 fish sampling; 2010MN). Native vegetated and open pools functioned ascontrol pools. From here on, these 4 groups of poolswill be referred to as 2009 MN, 2010 MN, NATVEG,and OPEN, respectively (Fig. 1).
Two independent techniques were used to monitorfish communities in Kapoho tide pools: visual surveysand fyke nets. Visual surveys allowed us to comparefish abundance and community composition withinthe tide pools among the different treatments. Fykenets allowed us to compare abundances and commu-nity composition of fish assemblages accessingflooded vegetated surfaces adjacent to tide pools.
Visual surveys
Fish communities were sampled using visual sur-veys conducted in all 4 treatments 2 h before and afterpeak low tides in May 2008 (before mangrove eradi-cation) and June 2009 and 2010 (after mangrove erad-ication) using standard belt transect methodology(Brock 1954). Visual surveys were conducted over this4 h time period and during the neap tidal cycle eachyear to ensure that pools sampled were discrete units;all pools and their respective transects were sampledonce over a 2 d period. Ten minute long surveys wereconducted in large treatment pools (area = 180 to 260m2) along 25 m long × 2 m wide transects, with 3 mbuffers on each end. In smaller tide pools (area = 50 to100 m2), 5 min surveys were conducted along 10 mlong × 2 m wide transects. In the vegetated treatments,visual surveys were conducted near the locations ofthe fyke nets. In the 2 larger OPEN tide pools (area >200 m2), two 25 m long × 2 m wide belt transect visualsurveys were conducted simultaneously by 2 survey-ors so that surveys could be treated as discreet sam-ples. Visual surveys recorded fish species and totallength. Total length was estimated to the nearest cmfor fish up to 10 cm long; fish greater than 10 cm were
222A
utho
r cop
y
MacKenzie & Kryss: Exotic mangroves and tide pool fish
placed into 5 cm bins (i.e. 10 to 15 cm, 15 to 20 cm,etc.). Fish densities (no. m−2) were determined by di-viding the total number of fish observed along a tran-sect by the area of that transect. Individual fish bio-mass values were estimated using length-weightregressions from www.fishbase.org or Kulbicki et al.(2005). Total fish biomass (g m−2) was equal to the sumof biomass along each transect divided by the area ofthe transect.
Fyke nets
Fish communities leaving the flooded surfacesadjacent to the 2009 MN, 2010 MN, and NATVEGpools during the ebb spring tide were sampled using3 mm mesh mini-fyke nets. Fyke nets were deployedduring the full moon phase in May 2008 (before man-grove eradication), in June 2009 (during mangroveeradication) and in June 2010 (after mangrove eradi-cation). Three fyke nets were deployed in the 3 repli-cate pools of each treatment; treatments were sam-pled on consecutive days. Fyke nets were placeddirectly in front of vegetation at low tide with open-ings facing vegetated areas. The bottom edges of thefyke side wings were secured into the substrateusing concrete nails or tent stakes; the tops of thewings were tied to the secured bottom edges usingdaisy chain knots, thereby minimizing the areaobstructed from fish and invertebrates attempting toaccess the flooded mangrove prop roots or nativevegetation. At or near slack high tide, the wings ofthe fyke net were released and lifted through thewater so that the fish exiting the vegetation with thefalling tide would be caught in the net. Nets werethen sampled 6 h later at the next low tide and fishwere identified to species, weighed to the nearestmg, and total lengths measured to the nearest mm.As the area of flooded vegetation sampled could notbe accurately measured, fish densities and biomassunits are reported as catch per unit effort (CPUE),where the same effort (6 h of soak time per fyke net)was used to normalize data (Arthington et al. 2005).
Physicochemical parameters
Temperature (°C), specific conductivity (mS), pH,and dissolved oxygen concentrations (mg l−1) werecontinuously measured in each of the 3 vegetatedtreatments (2009 MN, 2010 MN, and NATVEG pools)each year using YSI™ 600XLM data sondes. Twosondes were deployed into 2 of the 3 replicate pools
for each treatment on consecutive days by attachingto the sides of the fyke nets at or near slack high tide.
In 2009, during mangrove eradication, we wereable to collect water samples from all 4 treatmentpools (2009 MN, 2010 MN, NATVEG, OPEN) fornutrient analyses. In each pool, 50 ml of water wassampled at or near low tide to minimize mixing fromadjacent pools. Water samples were then filteredthrough a GF/F filter into acid-washed centrifugetubes and returned to the laboratory on ice wherethey were stored frozen until they could be analyzed.Nutrients were measured on a Technicon Pulse 2Autoanalyzer and included ammonium (NH4
+)(USGS 1-2525-89), nitrate and nitrite (ΣNO3
−)(USEPA 353.2), soluble reactive phosphorus (PO4
3+)(USEPA 365.1), total nitrogen (TN) (ShimadzuTNM-1), and total phosphorus (TP).
Statistical analyses
Dissolved oxygen concentrations, water tempera-tures, specific conductivity, and pH were comparedfrom similar tidal cycles (full moon, spring tide) atsimilar times of the day (18:00 h). Comparisons weremade near dusk to minimize the influence of the sunon water temperature and dissolved oxygen. Allparameters from each treatment pool were averagedfrom 18:00 to 19:00 h in each year. Values were thencompared among years (2008, 2009, 2010) as well asamong treatments (2009 MN, 2010 MN, NATVEG)using a 2-way analysis of variance (ANOVA). Nutri-ents were compared among treatments using a 1-way ANOVA.
Fish densities and biomass from visual surveys andfyke nets were compared between fish type (exotic vs.native) and among treatments using a 3-way factorialANOVA. Fixed effects of the model included fishtype, treatment, year, along with all three 2-way inter-actions and one 3-way interaction. Densities of Kuhliaxenura and Poecilia sp. from visual surveys and fykenets were also compared among treatments and yearsusing a 2-way factorial ANOVA. Densities of these 2fish species were compared as they represented thedominant species collected from the tide pools.
Species richness was determined by summing upthe total number of fish species observed or collectedfrom each site; Shannon-Wiener index of diversity(H’) and evenness (J ) were calculated as describedby Krebs (1989). Species richness, diversity, andevenness from visual surveys and fyke nets werethen compared between years as well as among sitesusing a 2-way factorial ANOVA.
223A
utho
r cop
y
Mar Ecol Prog Ser 472: 219–237, 2013
Size classes of native flagtails Kuhlia xenura andexotic mollies Poecilia sp., the most abundant speciesin fyke net samples, were compared between yearsand among treatments using a 2-way ANOVA. Sizeclasses were pooled within each treatment in eachyear and average lengths were then compared. Sizeclass analysis was only conducted on fyke net sam-ples because fish were measured to the nearest mmas opposed to visual surveys, where fish were meas-ured to the nearest cm (<10 cm) or placed into 5 cmbins (>10 cm).
Community compositions from visual surveys andfyke net samples were compared at the species levelamong treatments and years using a 2-way crossedanalysis of similarities test (ANOSIM). Communitycomposition from visual surveys and fyke net sampleswere also compared across years for each individualtreatment using 1-way ANOSIMs. ANOSIM estimatescommunity similarity using species composition andabundances in a non-parametric permutation proce-dure applied to a Bray-Curtis similarity matrix (Clarke& Warwick 1994). For each significant ANOSIM test,pair-wise comparisons were made between eachtreatment or year using a SIMPER analysis, which ex-tracts similarities, re-ranks them, repeats the ANOSIMprocedure, and identifies species that are contributingto differences in species assemblages.
Fish densities and biomass from visual surveys andfyke net samples did not meet assumptions of nor-mality and equal variance and were therefore log(x+1)-transformed prior to statistical analysis. AllANOVAs accounted for repeated measures (overtime) on each pool, with covariance structures set asan autoregressive of order 1 (i.e. measurements inthe same pool in 2008 were potentially more corre-lated with 2009 than 2010). Post-hoc analyses wereconducted using the Tukey-Kramer method. AllANOVAs were performed in PROC MIXED fromSAS 9.1 (2002, SAS Institute) at an α level of 0.05,while similarity and diversity analyses were per-formed in the PRIMER statistical package (v. 6.1.92007) (Clarke & Warwick 1994, Carr 1997).
RESULTS
Mangrove control
Over 13 000 mangrove trees were treated withglyphosate in 2008 and over 2000 trees with imaza-pyr in 2009. Both chemicals appeared to eradicatemangroves as most trees were dead and defoliated1 yr later, although the dead tree trunks and prop
roots that remained could still provide potential habi-tat structure around treated mangrove pools. Light levels, although not quantitatively measured, weremuch higher in tide pools after mangrove eradicate.In 2009, immediately after the larger mangrove areahad been eradicated, algal blooms appeared in allsample tide pools but were largely absent in 2010.
Physicochemical parameters
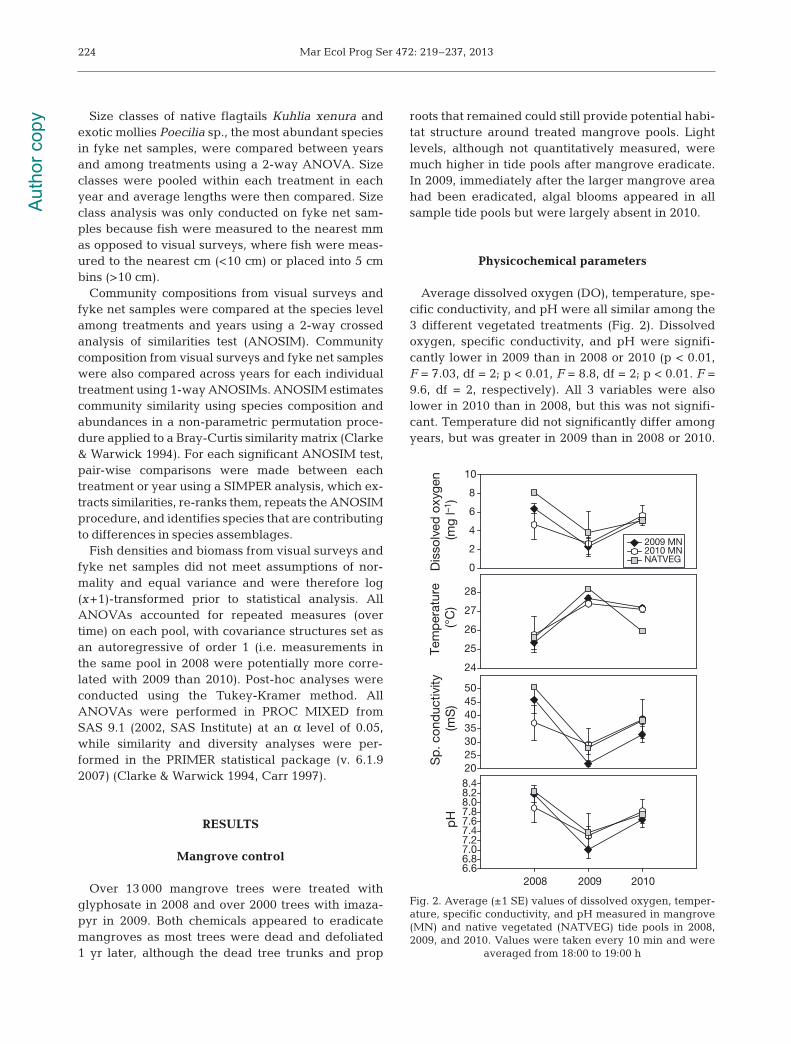
Average dissolved oxygen (DO), temperature, spe-cific conductivity, and pH were all similar among the3 different vegetated treatments (Fig. 2). Dissolvedoxygen, specific conductivity, and pH were signifi-cantly lower in 2009 than in 2008 or 2010 (p < 0.01,F = 7.03, df = 2; p < 0.01, F = 8.8, df = 2; p < 0.01. F =9.6, df = 2, respectively). All 3 variables were alsolower in 2010 than in 2008, but this was not signifi-cant. Temperature did not significantly differ amongyears, but was greater in 2009 than in 2008 or 2010.
224
Dis
solv
ed o
xyge
n (m
g l–1
)
0
2
4
6
8
10
2009 MN 2010 MN NATVEG
Tem
per
atur
e (°
C)
24
25
26
27
28
Sp
. con
duc
tivity
(m
S)
20253035404550
2008 2009 2010
pH
6.66.87.07.27.47.67.88.08.28.4
Fig. 2. Average (±1 SE) values of dissolved oxygen, temper-ature, specific conductivity, and pH measured in mangrove(MN) and native vegetated (NATVEG) tide pools in 2008,2009, and 2010. Values were taken every 10 min and were
averaged from 18:00 to 19:00 h
Aut
hor c
opy
MacKenzie & Kryss: Exotic mangroves and tide pool fish
Concentrations of NH4+, PO4
−, and TP were allbelow the level of detection (1.0, 0.25, and 0.25 µM,respectively). Total dissolved nitrogen and ΣNO3
−
ranged from 9.3 to 26.0 µM and 6.0 to 28.4 µM, re -spectively. The high amounts of ΣNO3
− relative toTDN suggest that TDN was largely made up ofΣNO3
−; dissolved organic forms of nitrogen were aminor component. Comparisons could not be madebetween years as data were not collected in 2008 or2010. Comparisons among the 4 treatments revealedno significant difference in either TDN or ΣNO3
−
concentrations.
Visual surveys
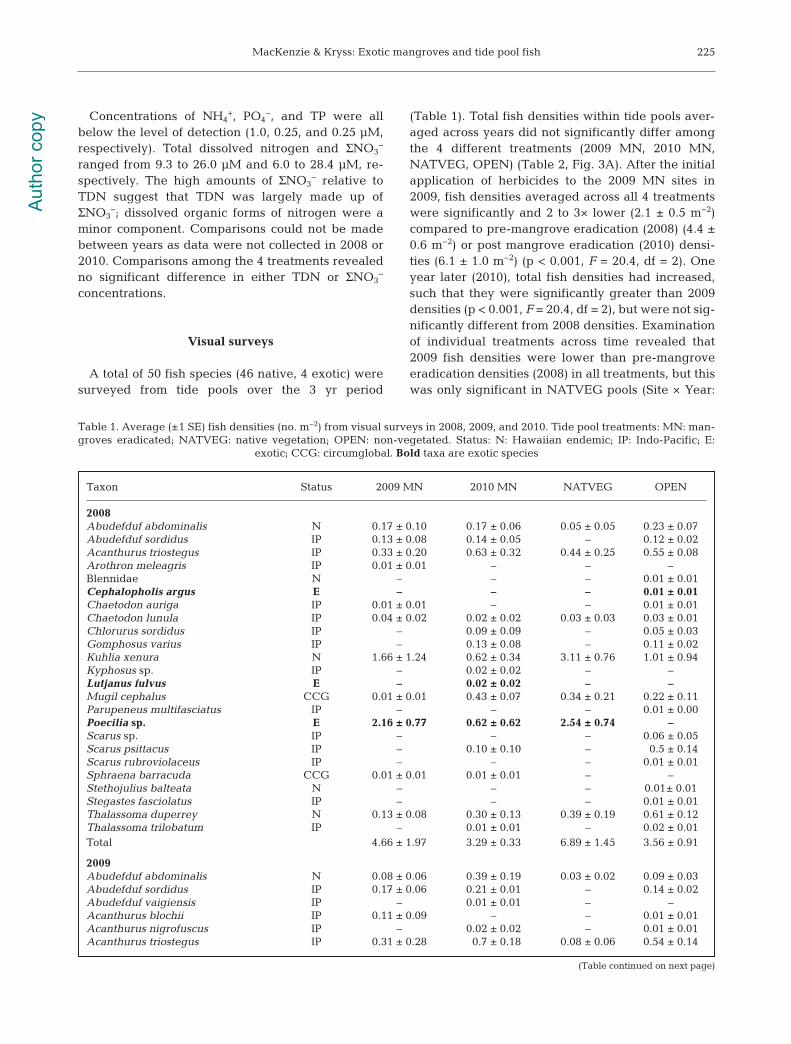
A total of 50 fish species (46 native, 4 exotic) weresurveyed from tide pools over the 3 yr period
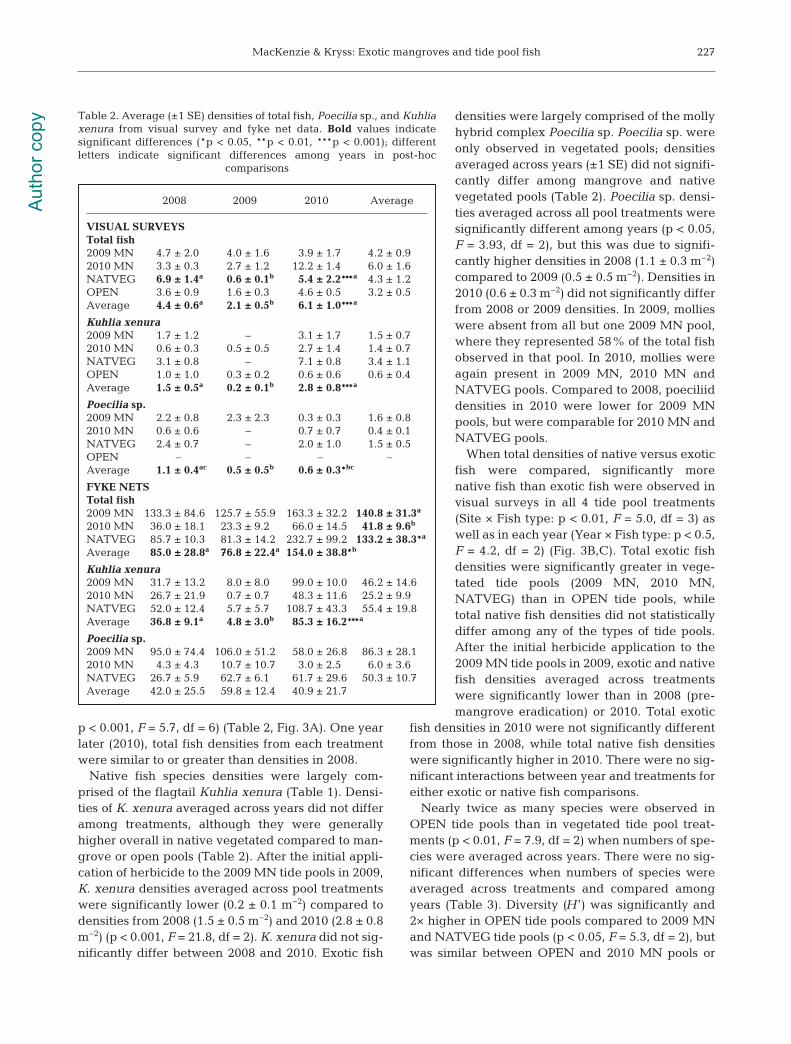
(Table 1). Total fish densities within tide pools aver-aged across years did not significantly differ amongthe 4 different treatments (2009 MN, 2010 MN,NATVEG, OPEN) (Table 2, Fig. 3A). After the initialapplication of herbicides to the 2009 MN sites in2009, fish densities averaged across all 4 treatmentswere significantly and 2 to 3× lower (2.1 ± 0.5 m−2)compared to pre-mangrove eradication (2008) (4.4 ±0.6 m−2) or post mangrove eradication (2010) densi-ties (6.1 ± 1.0 m−2) (p < 0.001, F = 20.4, df = 2). Oneyear later (2010), total fish densities had increased,such that they were significantly greater than 2009densities (p < 0.001, F = 20.4, df = 2), but were not sig-nificantly different from 2008 densities. Examinationof individual treatments across time revealed that2009 fish densities were lower than pre-mangroveeradication densities (2008) in all treatments, but thiswas only significant in NATVEG pools (Site × Year:
225
Taxon Status 2009 MN 2010 MN NATVEG OPEN
2008Abudefduf abdominalis N 0.17 ± 0.10 0.17 ± 0.06 0.05 ± 0.05 0.23 ± 0.07Abudefduf sordidus IP 0.13 ± 0.08 0.14 ± 0.05 – 0.12 ± 0.02Acanthurus triostegus IP 0.33 ± 0.20 0.63 ± 0.32 0.44 ± 0.25 0.55 ± 0.08Arothron meleagris IP 0.01 ± 0.01 – – –Blennidae N – – – 0.01 ± 0.01Cephalopholis argus E – – – 0.01 ± 0.01Chaetodon auriga IP 0.01 ± 0.01 – – 0.01 ± 0.01Chaetodon lunula IP 0.04 ± 0.02 0.02 ± 0.02 0.03 ± 0.03 0.03 ± 0.01Chlorurus sordidus IP – 0.09 ± 0.09 – 0.05 ± 0.03Gomphosus varius IP – 0.13 ± 0.08 – 0.11 ± 0.02Kuhlia xenura N 1.66 ± 1.24 0.62 ± 0.34 3.11 ± 0.76 1.01 ± 0.94Kyphosus sp. IP – 0.02 ± 0.02 – –Lutjanus fulvus E – 0.02 ± 0.02 – –Mugil cephalus CCG 0.01 ± 0.01 0.43 ± 0.07 0.34 ± 0.21 0.22 ± 0.11Parupeneus multifasciatus IP – – – 0.01 ± 0.00Poecilia sp. E 2.16 ± 0.77 0.62 ± 0.62 2.54 ± 0.74 –Scarus sp. IP – – – 0.06 ± 0.05Scarus psittacus IP – 0.10 ± 0.10 – 0.5 ± 0.14Scarus rubroviolaceus IP – – – 0.01 ± 0.01Sphraena barracuda CCG 0.01 ± 0.01 0.01 ± 0.01 – –Stethojulius balteata N – – – 0.01± 0.01Stegastes fasciolatus IP – – – 0.01 ± 0.01Thalassoma duperrey N 0.13 ± 0.08 0.30 ± 0.13 0.39 ± 0.19 0.61 ± 0.12Thalassoma trilobatum IP – 0.01 ± 0.01 – 0.02 ± 0.01Total 4.66 ± 1.97 3.29 ± 0.33 6.89 ± 1.45 3.56 ± 0.91
2009Abudefduf abdominalis N 0.08 ± 0.06 0.39 ± 0.19 0.03 ± 0.02 0.09 ± 0.03Abudefduf sordidus IP 0.17 ± 0.06 0.21 ± 0.01 – 0.14 ± 0.02Abudefduf vaigiensis IP – 0.01 ± 0.01 – –Acanthurus blochii IP 0.11 ± 0.09 – – 0.01 ± 0.01Acanthurus nigrofuscus IP – 0.02 ± 0.02 – 0.01 ± 0.01Acanthurus triostegus IP 0.31 ± 0.28 0.7 ± 0.18 0.08 ± 0.06 0.54 ± 0.14
Table 1. Average (±1 SE) fish densities (no. m−2) from visual surveys in 2008, 2009, and 2010. Tide pool treatments: MN: man-groves eradicated; NATVEG: native vegetation; OPEN: non-vegetated. Status: N: Hawaiian endemic; IP: Indo-Pacific; E:
exotic; CCG: circumglobal. Bold taxa are exotic species
(Table continued on next page)
Aut
hor c
opy
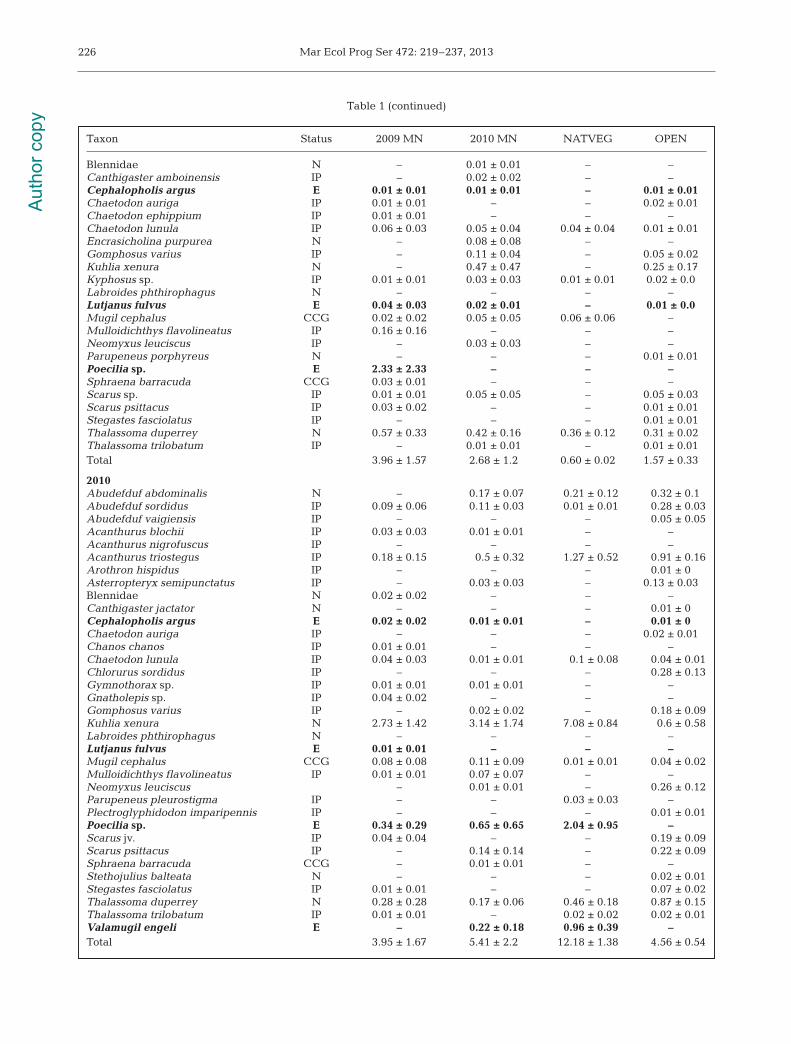
Mar Ecol Prog Ser 472: 219–237, 2013226
Taxon Status 2009 MN 2010 MN NATVEG OPEN
Blennidae N – 0.01 ± 0.01 – –Canthigaster amboinensis IP – 0.02 ± 0.02 – –Cephalopholis argus E 0.01 ± 0.01 0.01 ± 0.01 – 0.01 ± 0.01Chaetodon auriga IP 0.01 ± 0.01 – – 0.02 ± 0.01Chaetodon ephippium IP 0.01 ± 0.01 – – –Chaetodon lunula IP 0.06 ± 0.03 0.05 ± 0.04 0.04 ± 0.04 0.01 ± 0.01Encrasicholina purpurea N – 0.08 ± 0.08 – –Gomphosus varius IP – 0.11 ± 0.04 – 0.05 ± 0.02Kuhlia xenura N – 0.47 ± 0.47 – 0.25 ± 0.17Kyphosus sp. IP 0.01 ± 0.01 0.03 ± 0.03 0.01 ± 0.01 0.02 ± 0.0Labroides phthirophagus N – – – –Lutjanus fulvus E 0.04 ± 0.03 0.02 ± 0.01 – 0.01 ± 0.0Mugil cephalus CCG 0.02 ± 0.02 0.05 ± 0.05 0.06 ± 0.06 –Mulloidichthys flavolineatus IP 0.16 ± 0.16 – – –Neomyxus leuciscus IP – 0.03 ± 0.03 – –Parupeneus porphyreus N – – – 0.01 ± 0.01Poecilia sp. E 2.33 ± 2.33 – – –Sphraena barracuda CCG 0.03 ± 0.01 – – –Scarus sp. IP 0.01 ± 0.01 0.05 ± 0.05 – 0.05 ± 0.03Scarus psittacus IP 0.03 ± 0.02 – – 0.01 ± 0.01Stegastes fasciolatus IP – – – 0.01 ± 0.01Thalassoma duperrey N 0.57 ± 0.33 0.42 ± 0.16 0.36 ± 0.12 0.31 ± 0.02Thalassoma trilobatum IP – 0.01 ± 0.01 – 0.01 ± 0.01Total 3.96 ± 1.57 2.68 ± 1.2 0.60 ± 0.02 1.57 ± 0.33
2010Abudefduf abdominalis N – 0.17 ± 0.07 0.21 ± 0.12 0.32 ± 0.1Abudefduf sordidus IP 0.09 ± 0.06 0.11 ± 0.03 0.01 ± 0.01 0.28 ± 0.03Abudefduf vaigiensis IP – – – 0.05 ± 0.05Acanthurus blochii IP 0.03 ± 0.03 0.01 ± 0.01 – –Acanthurus nigrofuscus IP – – – –Acanthurus triostegus IP 0.18 ± 0.15 0.5 ± 0.32 1.27 ± 0.52 0.91 ± 0.16Arothron hispidus IP – – – 0.01 ± 0Asterropteryx semipunctatus IP – 0.03 ± 0.03 – 0.13 ± 0.03Blennidae N 0.02 ± 0.02 – – –Canthigaster jactator N – – – 0.01 ± 0Cephalopholis argus E 0.02 ± 0.02 0.01 ± 0.01 – 0.01 ± 0Chaetodon auriga IP – – – 0.02 ± 0.01Chanos chanos IP 0.01 ± 0.01 – – –Chaetodon lunula IP 0.04 ± 0.03 0.01 ± 0.01 0.1 ± 0.08 0.04 ± 0.01Chlorurus sordidus IP – – – 0.28 ± 0.13Gymnothorax sp. IP 0.01 ± 0.01 0.01 ± 0.01 – –Gnatholepis sp. IP 0.04 ± 0.02 – – –Gomphosus varius IP – 0.02 ± 0.02 – 0.18 ± 0.09Kuhlia xenura N 2.73 ± 1.42 3.14 ± 1.74 7.08 ± 0.84 0.6 ± 0.58Labroides phthirophagus N – – – –Lutjanus fulvus E 0.01 ± 0.01 – – –Mugil cephalus CCG 0.08 ± 0.08 0.11 ± 0.09 0.01 ± 0.01 0.04 ± 0.02Mulloidichthys flavolineatus IP 0.01 ± 0.01 0.07 ± 0.07 – –Neomyxus leuciscus – 0.01 ± 0.01 – 0.26 ± 0.12Parupeneus pleurostigma IP – – 0.03 ± 0.03 –Plectroglyphidodon imparipennis IP – – – 0.01 ± 0.01Poecilia sp. E 0.34 ± 0.29 0.65 ± 0.65 2.04 ± 0.95 –Scarus jv. IP 0.04 ± 0.04 – – 0.19 ± 0.09Scarus psittacus IP – 0.14 ± 0.14 – 0.22 ± 0.09Sphraena barracuda CCG – 0.01 ± 0.01 – –Stethojulius balteata N – – – 0.02 ± 0.01Stegastes fasciolatus IP 0.01 ± 0.01 – – 0.07 ± 0.02Thalassoma duperrey N 0.28 ± 0.28 0.17 ± 0.06 0.46 ± 0.18 0.87 ± 0.15Thalassoma trilobatum IP 0.01 ± 0.01 – 0.02 ± 0.02 0.02 ± 0.01Valamugil engeli E – 0.22 ± 0.18 0.96 ± 0.39 –Total 3.95 ± 1.67 5.41 ± 2.2 12.18 ± 1.38 4.56 ± 0.54
Table 1 (continued)
Aut
hor c
opy
MacKenzie & Kryss: Exotic mangroves and tide pool fish
p < 0.001, F = 5.7, df = 6) (Table 2, Fig. 3A). One yearlater (2010), total fish densities from each treatmentwere similar to or greater than densities in 2008.
Native fish species densities were largely com-prised of the flagtail Kuhlia xenura (Table 1). Densi-ties of K. xenura averaged across years did not differamong treatments, although they were generallyhigher overall in native vegetated compared to man-grove or open pools (Table 2). After the initial appli-cation of herbicide to the 2009 MN tide pools in 2009,K. xenura densities averaged across pool treatmentswere significantly lower (0.2 ± 0.1 m−2) compared todensities from 2008 (1.5 ± 0.5 m−2) and 2010 (2.8 ± 0.8m−2) (p < 0.001, F = 21.8, df = 2). K. xenura did not sig-nificantly differ between 2008 and 2010. Exotic fish
densities were largely comprised of the mollyhybrid complex Poecilia sp. Poecilia sp. wereonly observed in vegetated pools; densitiesaveraged across years (±1 SE) did not signifi-cantly differ among mangrove and nativevegetated pools (Table 2). Poecilia sp. densi-ties averaged across all pool treatments weresignificantly different among years (p < 0.05,F = 3.93, df = 2), but this was due to signifi-cantly higher densities in 2008 (1.1 ± 0.3 m−2)compared to 2009 (0.5 ± 0.5 m−2). Densities in2010 (0.6 ± 0.3 m−2) did not significantly differfrom 2008 or 2009 densities. In 2009, mollieswere absent from all but one 2009 MN pool,where they represented 58% of the total fishobserved in that pool. In 2010, mollies wereagain present in 2009 MN, 2010 MN andNATVEG pools. Compared to 2008, poeciliiddensities in 2010 were lower for 2009 MNpools, but were comparable for 2010 MN andNATVEG pools.
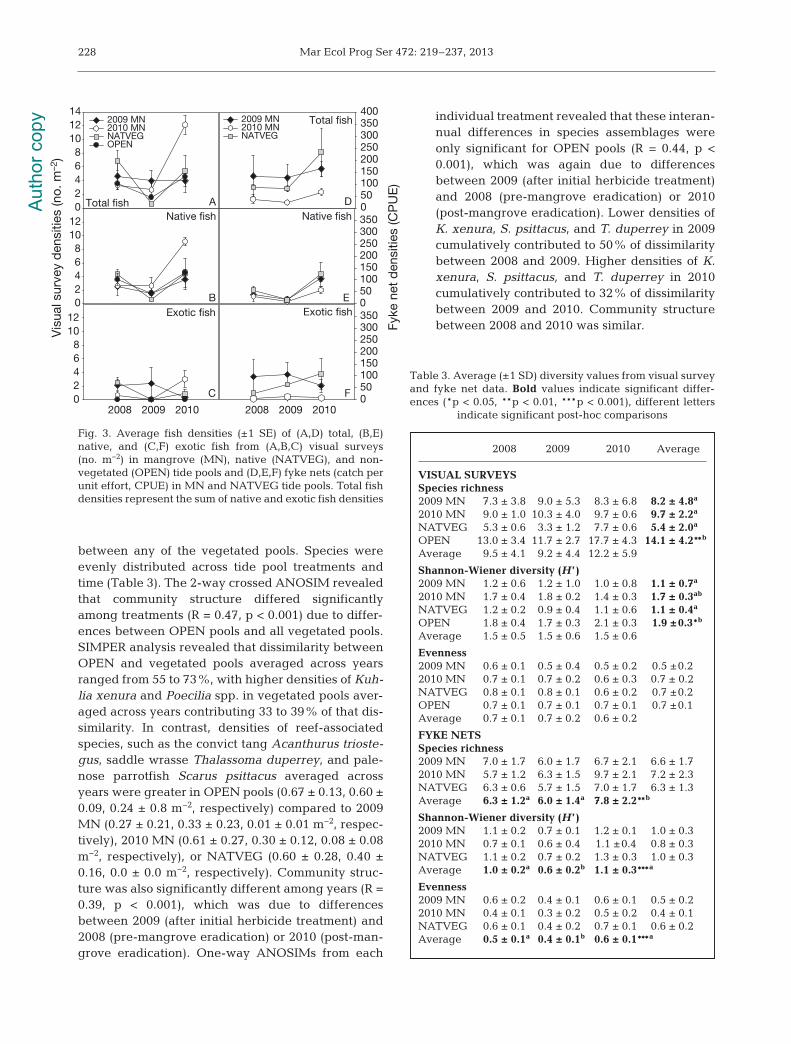
When total densities of native versus exoticfish were compared, significantly morenative fish than exotic fish were observed invisual surveys in all 4 tide pool treatments(Site × Fish type: p < 0.01, F = 5.0, df = 3) aswell as in each year (Year × Fish type: p < 0.5,F = 4.2, df = 2) (Fig. 3B,C). Total exotic fishdensities were significantly greater in vege-tated tide pools (2009 MN, 2010 MN,NATVEG) than in OPEN tide pools, whiletotal native fish densities did not statisticallydiffer among any of the types of tide pools.After the initial herbicide application to the2009 MN tide pools in 2009, exotic and nativefish densities averaged across treatmentswere significantly lower than in 2008 (pre-mangrove eradication) or 2010. Total exotic
fish densities in 2010 were not significantly differentfrom those in 2008, while total native fish densitieswere significantly higher in 2010. There were no sig-nificant interactions between year and treatments foreither exotic or native fish comparisons.
Nearly twice as many species were observed inOPEN tide pools than in vegetated tide pool treat-ments (p < 0.01, F = 7.9, df = 2) when numbers of spe-cies were averaged across years. There were no sig-nificant differences when numbers of species wereaveraged across treatments and compared amongyears (Table 3). Diversity (H ’) was significantly and2× higher in OPEN tide pools compared to 2009 MNand NATVEG tide pools (p < 0.05, F = 5.3, df = 2), butwas similar between OPEN and 2010 MN pools or
227
2008 2009 2010 Average
VISUAL SURVEYS Total fish 2009 MN 4.7 ± 2.0 4.0 ± 1.6 3.9 ± 1.7 4.2 ± 0.92010 MN 3.3 ± 0.3 2.7 ± 1.2 12.2 ± 1.4 6.0 ± 1.6NATVEG 6.9 ± 1.4a 0.6 ± 0.1b 5.4 ± 2.2***a 4.3 ± 1.2OPEN 3.6 ± 0.9 1.6 ± 0.3 4.6 ± 0.5 3.2 ± 0.5Average 4.4 ± 0.6a 2.1 ± 0.5b 6.1 ± 1.0***a
Kuhlia xenura 2009 MN 1.7 ± 1.2 – 3.1 ± 1.7 1.5 ± 0.72010 MN 0.6 ± 0.3 0.5 ± 0.5 2.7 ± 1.4 1.4 ± 0.7NATVEG 3.1 ± 0.8 – 7.1 ± 0.8 3.4 ± 1.1OPEN 1.0 ± 1.0 0.3 ± 0.2 0.6 ± 0.6 0.6 ± 0.4Average 1.5 ± 0.5a 0.2 ± 0.1b 2.8 ± 0.8***a
Poecilia sp. 2009 MN 2.2 ± 0.8 2.3 ± 2.3 0.3 ± 0.3 1.6 ± 0.82010 MN 0.6 ± 0.6 – 0.7 ± 0.7 0.4 ± 0.1NATVEG 2.4 ± 0.7 – 2.0 ± 1.0 1.5 ± 0.5OPEN – – – –Average 1.1 ± 0.4ac 0.5 ± 0.5b 0.6 ± 0.3*bc
FYKE NETS Total fish 2009 MN 133.3 ± 84.6 125.7 ± 55.9 163.3 ± 32.2 140.8 ± 31.3a
2010 MN 36.0 ± 18.1 23.3 ± 9.2 66.0 ± 14.5 41.8 ± 9.6b
NATVEG 85.7 ± 10.3 81.3 ± 14.2 232.7 ± 99.2 133.2 ± 38.3*a
Average 85.0 ± 28.8a 76.8 ± 22.4a 154.0 ± 38.8*b
Kuhlia xenura 2009 MN 31.7 ± 13.2 8.0 ± 8.0 99.0 ± 10.0 46.2 ± 14.62010 MN 26.7 ± 21.9 0.7 ± 0.7 48.3 ± 11.6 25.2 ± 9.9NATVEG 52.0 ± 12.4 5.7 ± 5.7 108.7 ± 43.3 55.4 ± 19.8Average 36.8 ± 9.1a 4.8 ± 3.0b 85.3 ± 16.2***a
Poecilia sp. 2009 MN 95.0 ± 74.4 106.0 ± 51.2 58.0 ± 26.8 86.3 ± 28.12010 MN 4.3 ± 4.3 10.7 ± 10.7 3.0 ± 2.5 6.0 ± 3.6NATVEG 26.7 ± 5.9 62.7 ± 6.1 61.7 ± 29.6 50.3 ± 10.7Average 42.0 ± 25.5 59.8 ± 12.4 40.9 ± 21.7
Table 2. Average (±1 SE) densities of total fish, Poecilia sp., and Kuhliaxenura from visual survey and fyke net data. Bold values indicate significant differences (*p < 0.05, **p < 0.01, ***p < 0.001); differentletters indicate significant differences among years in post-hoc
comparisons
Aut
hor c
opy
Mar Ecol Prog Ser 472: 219–237, 2013
between any of the vegetated pools. Species wereevenly distributed across tide pool treatments andtime (Table 3). The 2-way crossed ANOSIM revealedthat community structure differed significantlyamong treatments (R = 0.47, p < 0.001) due to differ-ences between OPEN pools and all vegetated pools.SIMPER analysis revealed that dissimilarity betweenOPEN and vegetated pools averaged across yearsranged from 55 to 73%, with higher densities of Kuh-lia xenura and Poecilia spp. in vegetated pools aver-aged across years contributing 33 to 39% of that dis-similarity. In contrast, densities of reef-associatedspecies, such as the convict tang Acanthurus trioste-gus, saddle wrasse Thalassoma duperrey, and pale-nose parrotfish Scarus psittacus averaged acrossyears were greater in OPEN pools (0.67 ± 0.13, 0.60 ±0.09, 0.24 ± 0.8 m−2, respectively) compared to 2009MN (0.27 ± 0.21, 0.33 ± 0.23, 0.01 ± 0.01 m−2, respec-tively), 2010 MN (0.61 ± 0.27, 0.30 ± 0.12, 0.08 ± 0.08m−2, respectively), or NATVEG (0.60 ± 0.28, 0.40 ±0.16, 0.0 ± 0.0 m−2, respectively). Community struc-ture was also significantly different among years (R =0.39, p < 0.001), which was due to differencesbetween 2009 (after initial herbicide treatment) and2008 (pre-mangrove eradication) or 2010 (post-man-grove eradication). One-way ANOSIMs from each
individual treatment revealed that these interan-nual differences in species assemblages wereonly significant for OPEN pools (R = 0.44, p <0.001), which was again due to differencesbetween 2009 (after initial herbicide treatment)and 2008 (pre-mangrove eradication) or 2010(post-mangrove eradication). Lower densities ofK. xenura, S. psittacus, and T. duperrey in 2009cumulatively contributed to 50% of dissimilaritybetween 2008 and 2009. Higher densities of K.xenura, S. psittacus, and T. duperrey in 2010cumulatively contributed to 32% of dissimilaritybetween 2009 and 2010. Community structurebetween 2008 and 2010 was similar.
228
02468
101214
2009 MN 2010 MN NATVEG OPEN
Native fish
Vis
ual s
urve
y d
ensi
ties
(no.
m–2
)
02468
1012
Exotic fish
2008 2009 2010 2008 2009 201002468
1012 Exotic fish
050100150200250300350
B E
C F
050100150200250300350400
2009 MN2010 MNNATVEG
A DTotal fish
Total fish
Native fish
Fyke
net
den
sitie
s (C
PU
E)
050100150200250300350
Fig. 3. Average fish densities (±1 SE) of (A,D) total, (B,E)native, and (C,F) exotic fish from (A,B,C) visual surveys(no. m−2) in mangrove (MN), native (NATVEG), and non -vegetated (OPEN) tide pools and (D,E,F) fyke nets (catch perunit effort, CPUE) in MN and NATVEG tide pools. Total fishdensities represent the sum of native and exotic fish densities
2008 2009 2010 Average
VISUAL SURVEYS Species richness 2009 MN 7.3 ± 3.8 9.0 ± 5.3 8.3 ± 6.8 8.2 ± 4.8a
2010 MN 9.0 ± 1.0 10.3 ± 4.0 9.7 ± 0.6 9.7 ± 2.2a
NATVEG 5.3 ± 0.6 3.3 ± 1.2 7.7 ± 0.6 5.4 ± 2.0a
OPEN 13.0 ± 3.4 11.7 ± 2.7 17.7 ± 4.3 14.1 ± 4.2**b
Average 9.5 ± 4.1 9.2 ± 4.4 12.2 ± 5.9
Shannon-Wiener diversity (H ’)2009 MN 1.2 ± 0.6 1.2 ± 1.0 1.0 ± 0.8 1.1 ± 0.7a
2010 MN 1.7 ± 0.4 1.8 ± 0.2 1.4 ± 0.3 1.7 ± 0.3ab
NATVEG 1.2 ± 0.2 0.9 ± 0.4 1.1 ± 0.6 1.1 ± 0.4a
OPEN 1.8 ± 0.4 1.7 ± 0.3 2.1 ± 0.3 1.9 ±0.3*b
Average 1.5 ± 0.5 1.5 ± 0.6 1.5 ± 0.6
Evenness2009 MN 0.6 ± 0.1 0.5 ± 0.4 0.5 ± 0.2 0.5 ±0.22010 MN 0.7 ± 0.1 0.7 ± 0.2 0.6 ± 0.3 0.7 ± 0.2NATVEG 0.8 ± 0.1 0.8 ± 0.1 0.6 ± 0.2 0.7 ±0.2OPEN 0.7 ± 0.1 0.7 ± 0.1 0.7 ± 0.1 0.7 ±0.1Average 0.7 ± 0.1 0.7 ± 0.2 0.6 ± 0.2
FYKE NETSSpecies richness 2009 MN 7.0 ± 1.7 6.0 ± 1.7 6.7 ± 2.1 6.6 ± 1.72010 MN 5.7 ± 1.2 6.3 ± 1.5 9.7 ± 2.1 7.2 ± 2.3NATVEG 6.3 ± 0.6 5.7 ± 1.5 7.0 ± 1.7 6.3 ± 1.3Average 6.3 ± 1.2a 6.0 ± 1.4a 7.8 ± 2.2**b
Shannon-Wiener diversity (H ’)2009 MN 1.1 ± 0.2 0.7 ± 0.1 1.2 ± 0.1 1.0 ± 0.32010 MN 0.7 ± 0.1 0.6 ± 0.4 1.1 ±0.4 0.8 ± 0.3NATVEG 1.1 ± 0.2 0.7 ± 0.2 1.3 ± 0.3 1.0 ± 0.3Average 1.0 ± 0.2a 0.6 ± 0.2b 1.1 ± 0.3***a
Evenness2009 MN 0.6 ± 0.2 0.4 ± 0.1 0.6 ± 0.1 0.5 ± 0.22010 MN 0.4 ± 0.1 0.3 ± 0.2 0.5 ± 0.2 0.4 ± 0.1NATVEG 0.6 ± 0.1 0.4 ± 0.2 0.7 ± 0.1 0.6 ± 0.2Average 0.5 ± 0.1a 0.4 ± 0.1b 0.6 ± 0.1***a
Table 3. Average (±1 SD) diversity values from visual surveyand fyke net data. Bold values indicate significant differ-ences (*p < 0.05, **p < 0.01, ***p < 0.001), different letters
indicate significant post-hoc comparisons
Aut
hor c
opy
MacKenzie & Kryss: Exotic mangroves and tide pool fish
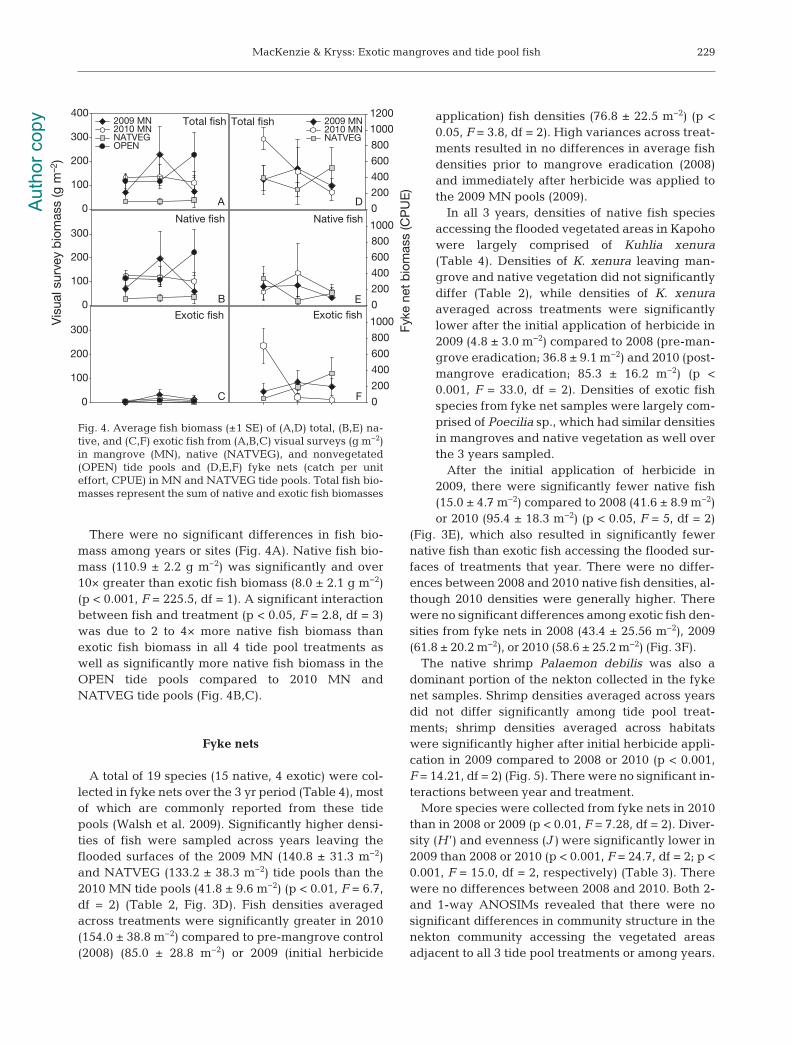
There were no significant differences in fish bio-mass among years or sites (Fig. 4A). Native fish bio-mass (110.9 ± 2.2 g m−2) was significantly and over10× greater than exotic fish biomass (8.0 ± 2.1 g m−2)(p < 0.001, F = 225.5, df = 1). A significant interactionbetween fish and treatment (p < 0.05, F = 2.8, df = 3)was due to 2 to 4× more native fish biomass thanexotic fish biomass in all 4 tide pool treatments aswell as significantly more native fish biomass in theOPEN tide pools compared to 2010 MN andNATVEG tide pools (Fig. 4B,C).
Fyke nets
A total of 19 species (15 native, 4 exotic) were col-lected in fyke nets over the 3 yr period (Table 4), mostof which are commonly reported from these tidepools (Walsh et al. 2009). Significantly higher densi-ties of fish were sampled across years leaving theflooded surfaces of the 2009 MN (140.8 ± 31.3 m−2)and NATVEG (133.2 ± 38.3 m−2) tide pools than the2010 MN tide pools (41.8 ± 9.6 m−2) (p < 0.01, F = 6.7,df = 2) (Table 2, Fig. 3D). Fish densities averagedacross treatments were significantly greater in 2010(154.0 ± 38.8 m−2) compared to pre-mangrove control(2008) (85.0 ± 28.8 m−2) or 2009 (initial herbicide
application) fish densities (76.8 ± 22.5 m−2) (p <0.05, F = 3.8, df = 2). High variances across treat-ments resulted in no differences in average fishdensities prior to mangrove eradication (2008)and immediately after herbicide was applied tothe 2009 MN pools (2009).
In all 3 years, densities of native fish speciesaccessing the flooded vegetated areas in Kapohowere largely comprised of Kuhlia xenura(Table 4). Densities of K. xenura leaving man-grove and native vegetation did not significantlydiffer (Table 2), while densities of K. xenuraaveraged across treatments were significantlylower after the initial application of herbicide in2009 (4.8 ± 3.0 m−2) compared to 2008 (pre-man-grove eradication; 36.8 ± 9.1 m−2) and 2010 (post-mangrove eradication; 85.3 ± 16.2 m−2) (p <0.001, F = 33.0, df = 2). Densities of exotic fishspecies from fyke net samples were largely com-prised of Poecilia sp., which had similar densitiesin mangroves and native vegetation as well overthe 3 years sampled.
After the initial application of herbicide in2009, there were significantly fewer native fish(15.0 ± 4.7 m−2) compared to 2008 (41.6 ± 8.9 m−2)or 2010 (95.4 ± 18.3 m−2) (p < 0.05, F = 5, df = 2)
(Fig. 3E), which also resulted in significantly fewernative fish than exotic fish accessing the flooded sur-faces of treatments that year. There were no differ-ences between 2008 and 2010 native fish densities, al-though 2010 densities were generally higher. Therewere no significant differences among exotic fish den-sities from fyke nets in 2008 (43.4 ± 25.56 m−2), 2009(61.8 ± 20.2 m−2), or 2010 (58.6 ± 25.2 m−2) (Fig. 3F).
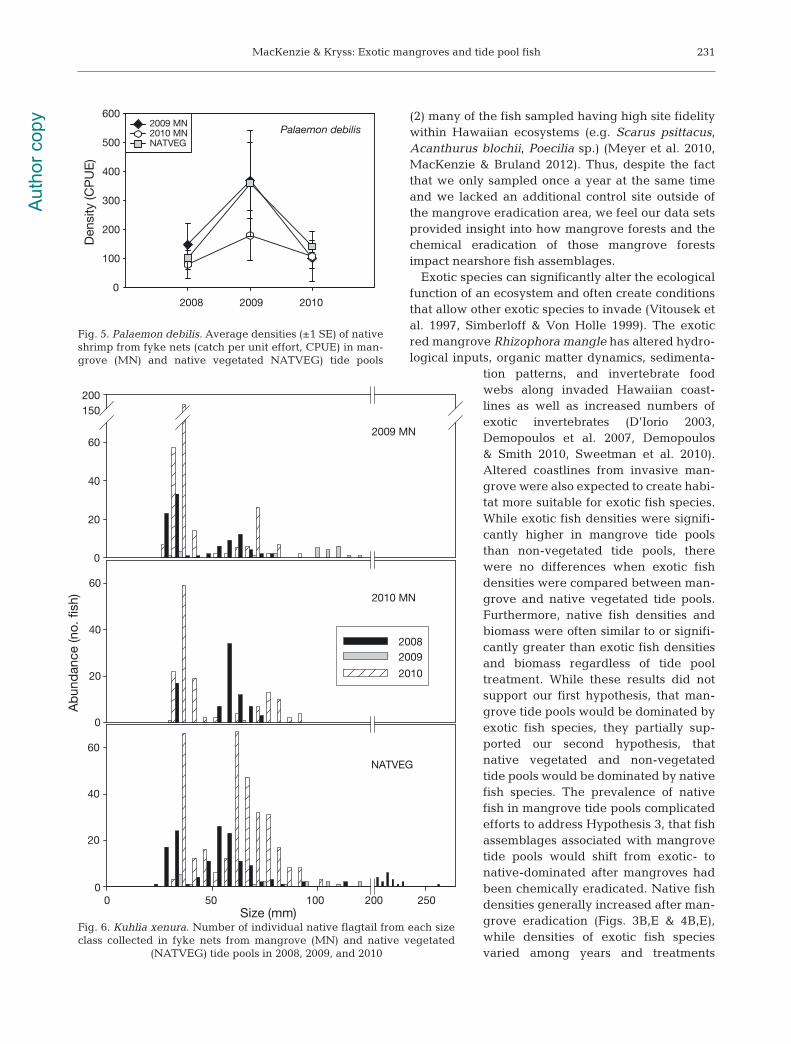
The native shrimp Palaemon de bilis was also adominant portion of the nekton collected in the fykenet samples. Shrimp densities averaged across yearsdid not differ significantly among tide pool treat-ments; shrimp densities averaged across habitatswere significantly higher after initial herbicide appli-cation in 2009 compared to 2008 or 2010 (p < 0.001,F = 14.21, df = 2) (Fig. 5). There were no significant in-teractions between year and treatment.
More species were collected from fyke nets in 2010than in 2008 or 2009 (p < 0.01, F = 7.28, df = 2). Diver-sity (H ’) and evenness (J) were significantly lower in2009 than 2008 or 2010 (p < 0.001, F = 24.7, df = 2; p <0.001, F = 15.0, df = 2, respectively) (Table 3). Therewere no differences between 2008 and 2010. Both 2-and 1-way ANOSIMs revealed that there were nosignificant differences in community structure in thenekton community accessing the vegetated areasadjacent to all 3 tide pool treatments or among years.
229
Native fish
Vis
ual s
urve
y b
iom
ass
(g m
–2)
0
100
200
300Native fish
Fyke
net
bio
mas
s (C
PU
E)
0
200
400
600
800
1000
Exotic fish
0
200
400
600
800
1000
B E
C
A D
F
Total fish
0
100
200
300
4002009 MN2010 MN NATVEG OPEN
Total fish
0
200
400
600
800
1000
12002009 MN2010 MNNATVEG
Exotic fish
0
100
200
300
Fig. 4. Average fish biomass (±1 SE) of (A,D) total, (B,E) na -tive, and (C,F) exotic fish from (A,B,C) visual surveys (g m−2)in mangrove (MN), native (NATVEG), and non vegetated(OPEN) tide pools and (D,E,F) fyke nets (catch per uniteffort, CPUE) in MN and NATVEG tide pools. Total fish bio-masses represent the sum of native and exotic fish biomasses
Aut
hor c
opy
Mar Ecol Prog Ser 472: 219–237, 2013
There were no significant differences in fish bio-mass when years, treatments, or fish types were com-pared (Fig. 4D,E,F).
Fish size class distribution
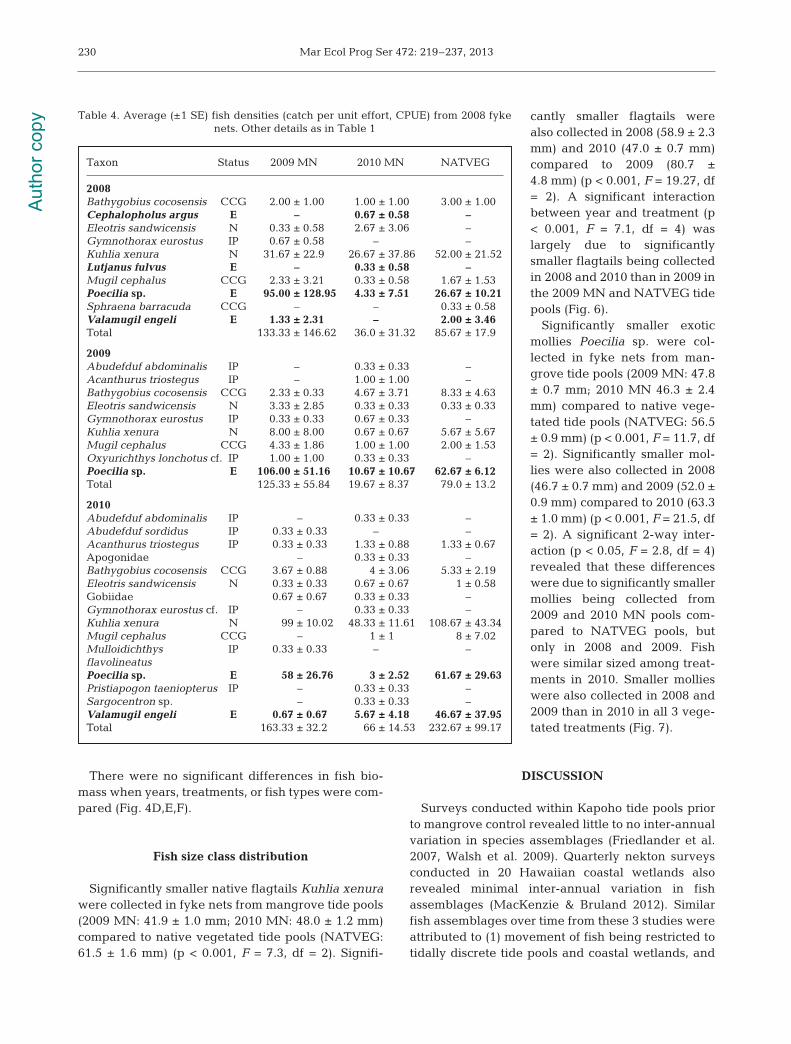
Significantly smaller native flagtails Kuhlia xenurawere collected in fyke nets from mangrove tide pools(2009 MN: 41.9 ± 1.0 mm; 2010 MN: 48.0 ± 1.2 mm)compared to native vegetated tide pools (NATVEG:61.5 ± 1.6 mm) (p < 0.001, F = 7.3, df = 2). Signifi-
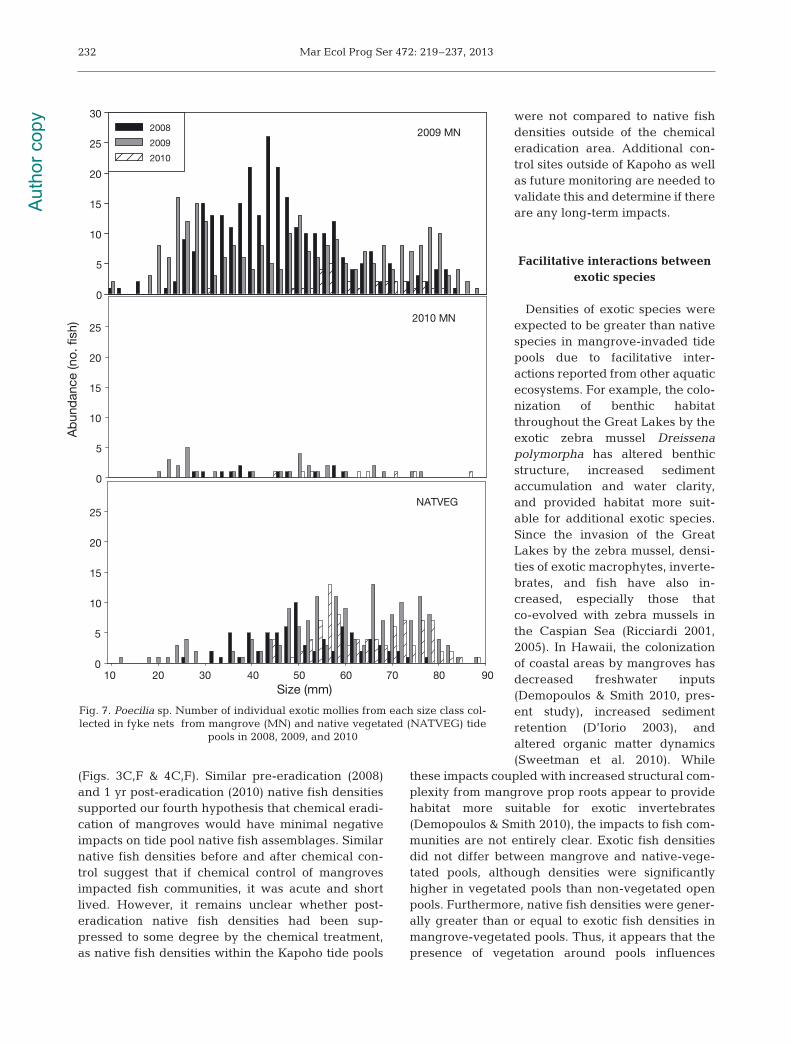
cantly smaller flagtails werealso collected in 2008 (58.9 ± 2.3mm) and 2010 (47.0 ± 0.7 mm)compared to 2009 (80.7 ±4.8 mm) (p < 0.001, F = 19.27, df= 2). A significant interactionbetween year and treatment (p< 0.001, F = 7.1, df = 4) waslargely due to significantlysmaller flagtails being collectedin 2008 and 2010 than in 2009 inthe 2009 MN and NATVEG tidepools (Fig. 6).
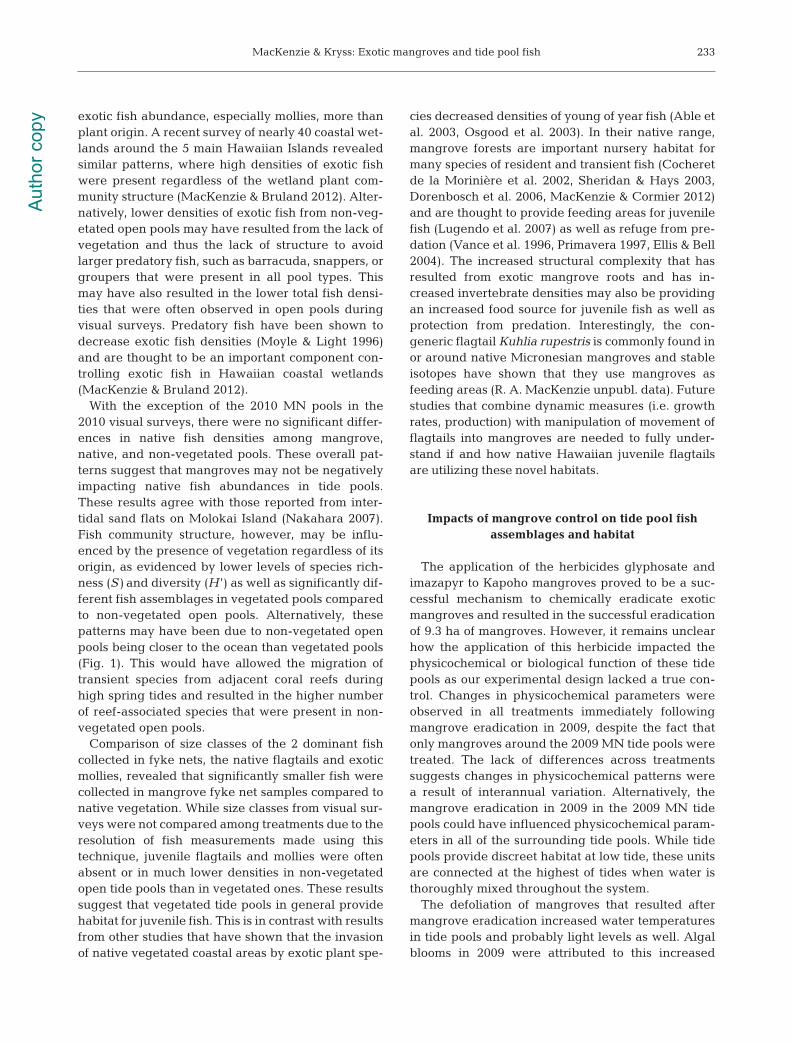
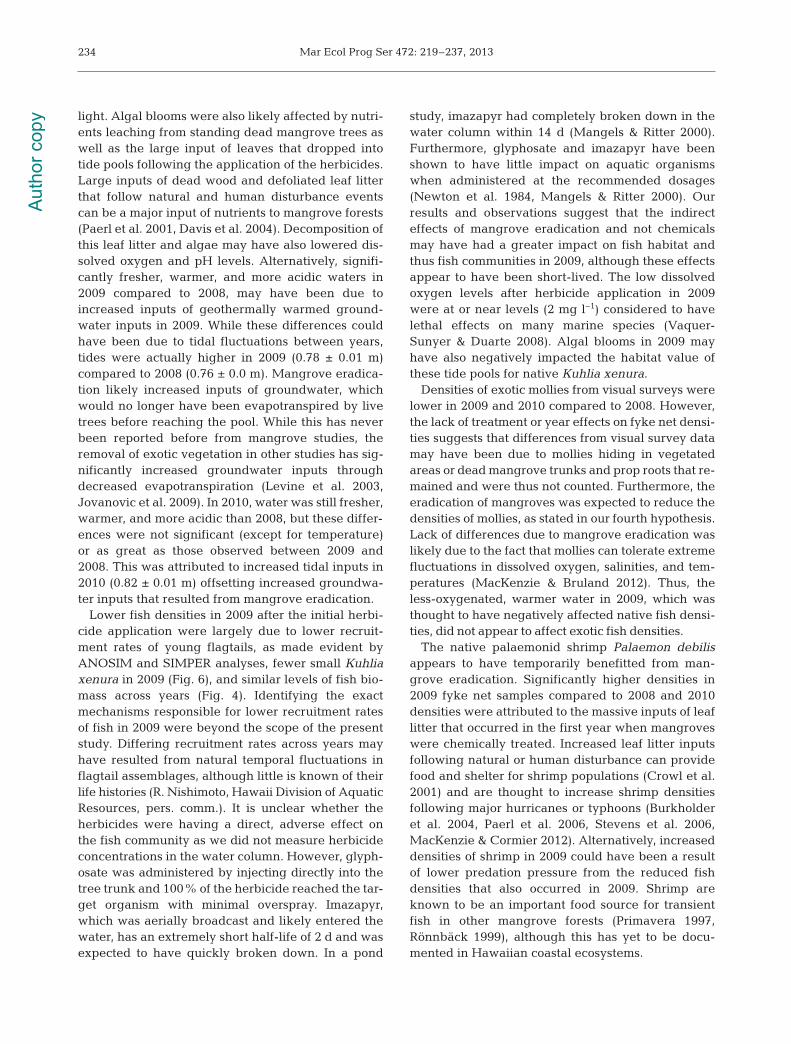
Significantly smaller exoticmollies Poecilia sp. were col-lected in fyke nets from man-grove tide pools (2009 MN: 47.8± 0.7 mm; 2010 MN 46.3 ± 2.4mm) compared to native vege-tated tide pools (NATVEG: 56.5± 0.9 mm) (p < 0.001, F = 11.7, df= 2). Significantly smaller mol-lies were also collected in 2008(46.7 ± 0.7 mm) and 2009 (52.0 ±0.9 mm) compared to 2010 (63.3± 1.0 mm) (p < 0.001, F = 21.5, df= 2). A significant 2-way inter-action (p < 0.05, F = 2.8, df = 4)revealed that these differenceswere due to significantly smallermollies being collected from2009 and 2010 MN pools com-pared to NATVEG pools, butonly in 2008 and 2009. Fishwere similar sized among treat-ments in 2010. Smaller mollieswere also collected in 2008 and2009 than in 2010 in all 3 vege-tated treatments (Fig. 7).
DISCUSSION
Surveys conducted within Kapoho tide pools priorto mangrove control revealed little to no inter-annualvariation in species assemblages (Fried lander et al.2007, Walsh et al. 2009). Quarterly nekton surveysconducted in 20 Hawaiian coastal wetlands alsorevealed minimal inter-annual variation in fishassemblages (MacKenzie & Bruland 2012). Similarfish assemblages over time from these 3 studies wereattributed to (1) movement of fish being restricted totidally discrete tide pools and coastal wetlands, and
230
Taxon Status 2009 MN 2010 MN NATVEG
2008Bathygobius cocosensis CCG 2.00 ± 1.00 1.00 ± 1.00 3.00 ± 1.00Cephalopholus argus E – 0.67 ± 0.58 –Eleotris sandwicensis N 0.33 ± 0.58 2.67 ± 3.06 –Gymnothorax eurostus IP 0.67 ± 0.58 – –Kuhlia xenura N 31.67 ± 22.9 26.67 ± 37.86 52.00 ± 21.52Lutjanus fulvus E – 0.33 ± 0.58 –Mugil cephalus CCG 2.33 ± 3.21 0.33 ± 0.58 1.67 ± 1.53Poecilia sp. E 95.00 ± 128.95 4.33 ± 7.51 26.67 ± 10.21Sphraena barracuda CCG – – 0.33 ± 0.58Valamugil engeli E 1.33 ± 2.31 – 2.00 ± 3.46Total 133.33 ± 146.62 36.0 ± 31.32 85.67 ± 17.9
2009Abudefduf abdominalis IP – 0.33 ± 0.33 –Acanthurus triostegus IP – 1.00 ± 1.00 –Bathygobius cocosensis CCG 2.33 ± 0.33 4.67 ± 3.71 8.33 ± 4.63Eleotris sandwicensis N 3.33 ± 2.85 0.33 ± 0.33 0.33 ± 0.33Gymnothorax eurostus IP 0.33 ± 0.33 0.67 ± 0.33 –Kuhlia xenura N 8.00 ± 8.00 0.67 ± 0.67 5.67 ± 5.67Mugil cephalus CCG 4.33 ± 1.86 1.00 ± 1.00 2.00 ± 1.53Oxyurichthys lonchotus cf. IP 1.00 ± 1.00 0.33 ± 0.33 –Poecilia sp. E 106.00 ± 51.16 10.67 ± 10.67 62.67 ± 6.12Total 125.33 ± 55.84 19.67 ± 8.37 79.0 ± 13.2
2010Abudefduf abdominalis IP – 0.33 ± 0.33 –Abudefduf sordidus IP 0.33 ± 0.33 – –Acanthurus triostegus IP 0.33 ± 0.33 1.33 ± 0.88 1.33 ± 0.67Apogonidae – 0.33 ± 0.33 –Bathygobius cocosensis CCG 3.67 ± 0.88 4 ± 3.06 5.33 ± 2.19Eleotris sandwicensis N 0.33 ± 0.33 0.67 ± 0.67 1 ± 0.58Gobiidae 0.67 ± 0.67 0.33 ± 0.33 –Gymnothorax eurostus cf. IP – 0.33 ± 0.33 –Kuhlia xenura N 99 ± 10.02 48.33 ± 11.61 108.67 ± 43.34Mugil cephalus CCG – 1 ± 1 8 ± 7.02Mulloidichthys IP 0.33 ± 0.33 – –flavolineatusPoecilia sp. E 58 ± 26.76 3 ± 2.52 61.67 ± 29.63Pristiapogon taeniopterus IP – 0.33 ± 0.33 –Sargocentron sp. – 0.33 ± 0.33 –Valamugil engeli E 0.67 ± 0.67 5.67 ± 4.18 46.67 ± 37.95Total 163.33 ± 32.2 66 ± 14.53 232.67 ± 99.17
Table 4. Average (±1 SE) fish densities (catch per unit effort, CPUE) from 2008 fyke nets. Other details as in Table 1
Aut
hor c
opy
MacKenzie & Kryss: Exotic mangroves and tide pool fish
(2) many of the fish sampled having high site fidelitywithin Hawaiian ecosystems (e.g. Scarus psittacus,Acanthurus blochii, Poecilia sp.) (Meyer et al. 2010,MacKenzie & Bruland 2012). Thus, despite the factthat we only sampled once a year at the same timeand we lacked an additional control site outside ofthe mangrove eradication area, we feel our data setsprovided insight into how mangrove forests and thechemical eradication of those mangrove forestsimpact near shore fish assemblages.
Exotic species can significantly alter the ecologicalfunction of an eco system and often create conditionsthat allow other exotic species to invade (Vitousek etal. 1997, Simberloff & Von Holle 1999). The exoticred mangrove Rhizophora mangle has altered hydro-logical inputs, or ganic matter dynamics, sedimenta-
tion patterns, and invertebrate foodwebs along invaded Hawaiian coast-lines as well as increased num bers ofexotic invertebrates (D’Iorio 2003,Demo poulos et al. 2007, Demopoulos& Smith 2010, Sweetman et al. 2010).Altered coastlines from invasive man -grove were also expected to create habi-tat more suitable for exotic fish species.While exotic fish densities were signifi-cantly higher in mangrove tide poolsthan non-vegetated tide pools, therewere no differences when exotic fishdensities were compared between man-grove and native vegetated tide pools.Furthermore, native fish densities andbiomass were often similar to or signifi-cantly greater than exotic fish densitiesand biomass regardless of tide pooltreatment. While these results did notsupport our first hypothesis, that man-grove tide pools would be dominated byexotic fish species, they partially sup-ported our second hypo thesis, thatnative vegetated and non-vegetatedtide pools would be dominated by nativefish species. The prevalence of nativefish in mangrove tide pools complicatedefforts to address Hypothesis 3, that fishassemblages associated with mangrovetide pools would shift from exotic- tonative-dominated after mangroves hadbeen chemically eradicated. Native fishdensities generally increased after man-grove eradication (Figs. 3B,E & 4B,E),while densities of exotic fish species varied among years and treatments
231
Palaemon debilis
2008 2009 2010
Den
sity
(CP
UE
)
0
100
200
300
400
500
6002009 MN 2010 MN NATVEG
Fig. 5. Palaemon debilis. Average densities (±1 SE) of nativeshrimp from fyke nets (catch per unit effort, CPUE) in man-grove (MN) and native vegetated NATVEG) tide pools
2010 MN
Ab
und
ance
(no.
fish
)
0
20
40
60
NATVEG
Size (mm)0 50 100 200 250
0
20
40
60
2009 MN
0
20
40
60
150200
20082009
2010
Fig. 6. Kuhlia xenura. Number of individual native flagtail from each sizeclass collected in fyke nets from mangrove (MN) and native vegetated
(NATVEG) tide pools in 2008, 2009, and 2010
Aut
hor c
opy
Mar Ecol Prog Ser 472: 219–237, 2013
(Figs. 3C,F & 4C,F). Similar pre-eradication (2008)and 1 yr post-eradication (2010) native fish densitiessupported our fourth hy pothesis that chemical eradi-cation of mangroves would have minimal negativeimpacts on tide pool native fish assemblages. Similarnative fish densities before and after chemical con-trol suggest that if chemical control of mangrovesimpacted fish communities, it was acute and shortlived. However, it remains unclear whether post- eradication native fish densities had been sup-pressed to some degree by the chemical treatment,as native fish densities within the Kapoho tide pools
were not compared to native fishdensities outside of the chemicaleradication area. Additional con-trol sites outside of Kapoho as wellas future monitoring are needed tovalidate this and determine if thereare any long-term impacts.
Facilitative interactions betweenexotic species
Densities of exotic species wereexpected to be greater than native species in mangrove-invaded tidepools due to facilitative inter -actions reported from other aquaticecosystems. For example, the colo-nization of benthic habitatthrough out the Great Lakes by theexotic zebra mussel Dreissenapolymorpha has altered benthicstructure, increased sedimentaccumulation and water clarity,and provided habitat more suit-able for additional exotic species.Since the invasion of the GreatLakes by the zebra mussel, densi-ties of exotic macrophytes, inverte-brates, and fish have also in -creased, especially those thatco-evolved with zebra mussels inthe Caspian Sea (Ricciardi 2001,2005). In Hawaii, the colonizationof coastal areas by mangroves hasdecreased freshwater inputs(Demopoulos & Smith 2010, pres-ent study), increased sedimentretention (D’Iorio 2003), andaltered organic matter dynamics(Sweetman et al. 2010). While
these impacts coupled with in creased structural com-plexity from mangrove prop roots appear to providehabitat more suitable for exotic invertebrates(Demopoulos & Smith 2010), the impacts to fish com-munities are not entirely clear. Exotic fish densitiesdid not differ between mangrove and native-vege-tated pools, although densities were significantlyhigher in vegetated pools than non-vegetated openpools. Furthermore, native fish densities were gener-ally greater than or equal to exotic fish densities inmangrove-vegetated pools. Thus, it appears that thepresence of vegetation around pools influences
232
2009 MN
0
5
10
15
20
25
302008
2009
2010
NATVEG
Size (mm)10 20 30 40 50 60 70 80 90
0
5
10
15
20
25
2010 MN
Ab
und
ance
(no.
fish
)
0
5
10
15
20
25
Fig. 7. Poecilia sp. Number of individual exotic mollies from each size class col-lected in fyke nets from mangrove (MN) and native vegetated (NATVEG) tide
pools in 2008, 2009, and 2010
Aut
hor c
opy
MacKenzie & Kryss: Exotic mangroves and tide pool fish
exotic fish abundance, especially mollies, more thanplant origin. A recent survey of nearly 40 coastal wet-lands around the 5 main Hawaiian Islands revealedsimilar patterns, where high densities of exotic fishwere present regardless of the wetland plant com-munity structure (MacKenzie & Bruland 2012). Alter-natively, lower densities of exotic fish from non-veg-etated open pools may have resulted from the lack ofvegetation and thus the lack of structure to avoidlarger predatory fish, such as barracuda, snappers, orgroupers that were present in all pool types. Thismay have also resulted in the lower total fish densi-ties that were often observed in open pools duringvisual surveys. Predatory fish have been shown todecrease exotic fish densities (Moyle & Light 1996)and are thought to be an important component con-trolling exotic fish in Hawaiian coastal wetlands(MacKenzie & Bruland 2012).
With the exception of the 2010 MN pools in the2010 visual surveys, there were no significant differ-ences in native fish densities among mangrove,native, and non-vegetated pools. These overall pat-terns suggest that mangroves may not be negativelyimpacting native fish abundances in tide pools.These results agree with those reported from inter-tidal sand flats on Molokai Island (Nakahara 2007).Fish community structure, however, may be influ-enced by the presence of vegetation regardless of itsorigin, as evidenced by lower levels of species rich-ness (S) and diversity (H ’) as well as significantly dif-ferent fish assemblages in vegetated pools comparedto non-vegetated open pools. Alternatively, thesepatterns may have been due to non-vegetated openpools being closer to the ocean than vegetated pools(Fig. 1). This would have allowed the migration oftransient species from adjacent coral reefs duringhigh spring tides and resulted in the higher numberof reef-associated species that were present in non-vegetated open pools.
Comparison of size classes of the 2 dominant fishcollected in fyke nets, the native flagtails and exoticmollies, revealed that significantly smaller fish werecollected in mangrove fyke net samples compared tonative vegetation. While size classes from visual sur-veys were not compared among treatments due to theresolution of fish measurements made using thistechnique, juvenile flagtails and mollies were oftenabsent or in much lower densities in non-vegetatedopen tide pools than in vegetated ones. These resultssuggest that vegetated tide pools in general providehabitat for juvenile fish. This is in contrast with resultsfrom other studies that have shown that the invasionof native vegetated coastal areas by exotic plant spe-
cies decreased densities of young of year fish (Able etal. 2003, Osgood et al. 2003). In their native range,mangrove forests are important nursery habitat formany species of resident and transient fish (Cocheretde la Morinière et al. 2002, Sheridan & Hays 2003,Dorenbosch et al. 2006, MacKenzie & Cormier 2012)and are thought to provide feeding areas for juvenilefish (Lugendo et al. 2007) as well as refuge from pre-dation (Vance et al. 1996, Primavera 1997, Ellis & Bell2004). The increased structural complexity that hasresulted from exotic mangrove roots and has in-creased invertebrate densities may also be providingan increased food source for juvenile fish as well asprotection from predation. Interestingly, the con-generic flagtail Kuhlia rupestris is commonly found inor around native Micronesian mangroves and stableisotopes have shown that they use mangroves asfeeding areas (R. A. MacKenzie un publ. data). Futurestudies that combine dynamic measures (i.e. growthrates, production) with manipulation of movement offlagtails into mangroves are needed to fully under-stand if and how native Hawaiian juvenile flagtailsare utilizing these novel habitats.
Impacts of mangrove control on tide pool fishassemblages and habitat
The application of the herbicides glyphosate andimazapyr to Kapoho mangroves proved to be a suc-cessful mechanism to chemically eradicate exoticmangroves and resulted in the successful eradicationof 9.3 ha of mangroves. However, it remains unclearhow the application of this herbicide impacted thephysicochemical or biological function of these tidepools as our experimental design lacked a true con-trol. Changes in physicochemical parameters wereob served in all treatments immediately followingmangrove eradication in 2009, despite the fact thatonly mangroves around the 2009 MN tide pools weretreated. The lack of differences across treatmentssuggests changes in physicochemical patterns werea result of interannual variation. Alternatively, themangrove eradication in 2009 in the 2009 MN tidepools could have influenced physicochemical param-eters in all of the surrounding tide pools. While tidepools provide discreet habitat at low tide, these unitsare connected at the highest of tides when water isthoroughly mixed throughout the system.
The defoliation of mangroves that resulted aftermangrove eradication increased water temperaturesin tide pools and probably light levels as well. Algalblooms in 2009 were attributed to this increased
233A
utho
r cop
y
Mar Ecol Prog Ser 472: 219–237, 2013234
light. Algal blooms were also likely affected by nutri-ents leaching from standing dead mangrove trees aswell as the large input of leaves that dropped intotide pools following the application of the herbicides.Large inputs of dead wood and defoliated leaf litterthat follow natural and human disturbance eventscan be a major input of nutrients to mangrove forests(Paerl et al. 2001, Davis et al. 2004). Decomposition ofthis leaf litter and algae may have also lowered dis-solved oxygen and pH levels. Alternatively, signifi-cantly fresher, warmer, and more acidic waters in2009 compared to 2008, may have been due toincreased inputs of geothermally warmed ground-water inputs in 2009. While these differences couldhave been due to tidal fluctuations between years,tides were actually higher in 2009 (0.78 ± 0.01 m)compared to 2008 (0.76 ± 0.0 m). Mangrove eradica-tion likely increased inputs of groundwater, whichwould no longer have been evapotranspired by livetrees before reaching the pool. While this has neverbeen reported before from mangrove studies, theremoval of exotic vegetation in other studies has sig-nificantly increased groundwater inputs throughdecreased evapotranspiration (Levine et al. 2003,Jovanovic et al. 2009). In 2010, water was still fresher,warmer, and more acidic than 2008, but these differ-ences were not significant (except for temperature)or as great as those observed between 2009 and2008. This was attributed to increased tidal inputs in2010 (0.82 ± 0.01 m) offsetting increased groundwa-ter inputs that resulted from mangrove eradication.
Lower fish densities in 2009 after the initial herbi-cide application were largely due to lower recruit-ment rates of young flagtails, as made evident byANOSIM and SIMPER analyses, fewer small Kuhliaxenura in 2009 (Fig. 6), and similar levels of fish bio-mass across years (Fig. 4). Identifying the exactmechanisms responsible for lower recruitment ratesof fish in 2009 were beyond the scope of the presentstudy. Differing recruitment rates across years mayhave resulted from natural temporal fluctuations inflagtail assemblages, although little is known of theirlife histories (R. Nishimoto, Hawaii Division of AquaticResources, pers. comm.). It is unclear whether theherbicides were having a direct, adverse effect onthe fish community as we did not measure herbicideconcentrations in the water column. However, glyph -o sate was administered by injecting directly into thetree trunk and 100% of the herbicide reached the tar-get organism with minimal overspray. Imazapyr,which was aerially broadcast and likely entered thewater, has an extremely short half-life of 2 d and wasexpected to have quickly broken down. In a pond
study, imazapyr had completely broken down in thewater column within 14 d (Mangels & Ritter 2000).Furthermore, glyphosate and imazapyr have beenshown to have little impact on aquatic organismswhen administered at the recommended dosages(Newton et al. 1984, Mangels & Ritter 2000). Ourresults and observations suggest that the indirecteffects of mangrove eradication and not chemicalsmay have had a greater impact on fish habitat andthus fish communities in 2009, although these effectsappear to have been short-lived. The low dissolvedoxygen levels after herbicide application in 2009were at or near levels (2 mg l−1) considered to havelethal effects on many marine species (Vaquer -Sunyer & Duarte 2008). Algal blooms in 2009 mayhave also negatively impacted the habitat value ofthese tide pools for native Kuhlia xenura.
Densities of exotic mollies from visual surveys werelower in 2009 and 2010 compared to 2008. However,the lack of treatment or year effects on fyke net densi-ties suggests that differences from visual survey datamay have been due to mollies hiding in vegetated areas or dead mangrove trunks and prop roots that re-mained and were thus not counted. Furthermore, theeradication of mangroves was expected to reduce thedensities of mollies, as stated in our fourth hypothesis.Lack of differences due to mangrove eradication waslikely due to the fact that mollies can tolerate extremefluctuations in dissolved oxygen, salinities, and tem-peratures (MacKenzie & Bruland 2012). Thus, theless-oxygenated, warmer water in 2009, which wasthought to have negatively affected native fish densi-ties, did not appear to affect exotic fish densities.
The native palaemonid shrimp Palaemon debilisappears to have temporarily benefitted from man-grove eradication. Significantly higher densities in2009 fyke net samples compared to 2008 and 2010densities were attributed to the massive inputs of leaflitter that occurred in the first year when mangroveswere chemically treated. Increased leaf litter inputsfollowing natural or human disturbance can providefood and shelter for shrimp populations (Crowl et al.2001) and are thought to increase shrimp densitiesfollowing major hurricanes or typhoons (Burkholderet al. 2004, Paerl et al. 2006, Stevens et al. 2006,MacKenzie & Cormier 2012). Alternatively, increaseddensities of shrimp in 2009 could have been a resultof lower predation pressure from the reduced fishdensities that also occurred in 2009. Shrimp areknown to be an important food source for transientfish in other mangrove forests (Primavera 1997,Rönnbäck 1999), although this has yet to be docu-mented in Hawaiian coastal ecosystems.
Aut
hor c
opy
MacKenzie & Kryss: Exotic mangroves and tide pool fish
SUMMARY
Densities of native fish and fish community struc-ture recovered to pre-mangrove eradication levels1 yr after mangroves were successfully eradicatedfrom Kapoho tide pools. It was not clear if the reduc-tion in native fish densities or shift in communitycomposition in 2009 during mangrove eradicationwas a result of the control treatment, increasedgroundwater inputs, or natural inter-annual variationin fish populations or if recovered fish populationsrepresented fish populations outside of the Kapohotide pools. Densities of exotic fish varied across sitesand years with no consistent pattern. This may havebeen due to the fact that exotic fish were dominatedby poeciliids, which can tolerate extreme fluctuationsin dissolved oxygen, salinities, and temperatures(MacKenzie & Bruland 2012).
Exotic mangroves negatively impact the ecologicalfunction of coastal ecosystems in Hawaii (Demo -poulos et al. 2007, Demopoulos & Smith 2010, Sweet-man et al. 2010) and our results suggest that they maypotentially reduce amounts of groundwater enteringcoastal areas. However, they do not seem to have anadverse effect on tide pool fish assemblages inHawaii, except where mangroves are colonizing non-vegetated areas. Mangroves, therefore, may convertnative species-rich, open tide pools to less diversepools that support more exotic fish. Conversely, thepresence of juvenile flagtails in flooded mangrove areas adjacent to tide pools and the general lack ofyoung flagtails in non-vegetated pools suggests thatmangroves may in fact be providing nursery habitatfor native flagtails. The ability of exotic mangroves toprovide nursery habitat for native species has inter-esting implications for Hawaii as well as for the Soci-ety Islands, where mangroves are also invasive. Ad-ditional studies are needed using stable isotopes,growth rates, or fish production to determine the eco-logical value of native versus exotic vegetation insupporting native (or exotic) fish assemblages.
Results revealed that if mangrove eradication onKapoho tide pools had any negative effects on the fishcommunity, those effects may have been acute andshort lived. Two years after mangroves had beenchemically eradicated, native fish densities and spe-cies richness were greater than or equal to pre-controldensities and community structure did not signifi-cantly differ from pre-eradication community struc-ture. Additional control sites outside of the treatedarea coupled with additional monitoring are neededto verify this as well as to determine if there are anylong term effects from the mangrove eradication.
Acknowledgements. The authors thank the countless volun-teers who spent many hours setting and retrieving fyke netsand processing fish, especially A. Kobsa and R. Syracuse.Partial support for this project was provided by the NationalFish and Wildlife Foundation and the Hawaii TourismAuthority. Thanks to K. Ewel, A. Kobsa, and 2 anonymousreviewers who provided constructive comments on an ear-lier draft of the manuscript. Any use of trade, product, orfirm names is for descriptive purposes only and does notimply endorsement by the US Government.
LITERATURE CITED
Able KW, Hagan SM, Brown SA (2003) Mechanisms ofmarsh habitat alteration due to Phragmites: Response ofyoung-of-the year mummichog (Fundulus heteroclitus)to treatment for Phragmites removal. Estuaries 26:484−494
Allen JA (1998) Mangroves as alien species: the case ofHawaii. Global Ecol Biogeogr Lett 7:61−71
Arthington AH, Balcombe SR, Wilson GA, Thoms MC, Mar-shall J (2005) Spatial and temporal variation in fish-assemblage structure in isolated waterholes during the2001 dry season of an arid-zone floodplain river, CooperCreek, Australia. Mar Freshw Res 56:25−35
Bantilan-Smith M, Bruland GL, MacKenzie RA, Henry A,Ryder CR (2009) A quantitative assessment of the vege-tation and soils of coastal lowland wetlands in Hawai`i.Wetlands 29:1023−1036
Brock VE (1954) A preliminary report on a method of esti-mating reef fish populations. J Wildl Manag 18:297−308
Burkholder J, Eggleston D, Glasgow H, Brownie C and oth-ers (2004) Comparative impacts of two major hurricaneseasons on the Neuse River and western Pamlico Soundecosystems. Proc Natl Acad Sci USA 101:9291−9296
Carr MR (1997) PRIMER User manual: Plymouth routines inmultivariate ecological research. Plymouth Marine Labo-ratories, Plymouth
Clarke KR, Warwick RM (1994) Change in marine commu-nities: an approach to statistical analysis and interpreta-tion. 2nd edn. PRIMER-E, Plymouth
Cocheret de la Morinière E, Pollux BJ, Nagelkerken I, Vander Velde G (2002) Post-settlement life cycle migrationpatterns and habitat preference of coral reef fish that useseagrass and mangrove habitats as nurseries. EstuarCoast Shelf Sci 55:309−321
Crowl TA, McDowell WH, Covich AP, Johnson SL (2001)Freshwater shrimp effects on detrital processing andnutrients in a tropical headwater stream. Ecology 82:775−783
D’Iorio MM (2003) Mangrove and shoreline change onMolokai, Hawaii: assessing the role of introduced Rhizo -phora mangle in sediment dynamics and coastal changeusing remote sensing and GIS. PhD dissertation, Univer-sity of California, Santa Cruz, CA
Davis SE III, Cable JE, Childers DL, Coronado-Molina C andothers (2004) Importance of storm events in controllingecosystem structure and function in a Florida Gulf Coastestuary. J Coast Res 20:1198−1208
Demopoulos AWJ, Smith CR (2010) Invasive mangrovesalter macrofaunal community structure and facilitateopportunistic exotics. Mar Ecol Prog Ser 404:51−67
Demopoulos AWJ, Fry B, Smith CR (2007) Food web struc-ture in exotic and native mangroves: A Hawaii-Puerto
235A
utho
r cop
y
Mar Ecol Prog Ser 472: 219–237, 2013
Rico comparison. Oecologia 153:675−686Dorenbosch M, Grol MGC, Nagelkerken I, van der Velde G
(2006) Seagrass beds and mangroves as potential nurs-eries for the threatened Indo-Pacific humphead wrasse,Cheilinus undulatus and Caribbean rainbow parrotfish,Scarus guacamaia. Biol Conserv 129:277−282
Duke NC, Ball MC, Ellison JC (1998) Factors influencingbiodiversity and distributional gradients in mangroves.Global Ecol Biogeogr Lett 7:27−47
Duke NC, Lo EYY, Sun M (2002) Global distribution andgenetic discontinuities of mangroves—emerging pat-terns in the evolution of Rhizophora. Trees 16: 65−79
Ellis WL, Bell SS (2004) Conditional use of mangrove habi-tats by fishes: Depth as a cue to avoid predators. Estuar-ies 27:966−976
Flanders LS (2007) Recommendations for a state manage-ment plan at the WaiOpae tide pools Kapoho, Hawaii.Hawaii Department of Land and Natural Resources,Honolullu, HI
Friedlander AM, Brown EK, Monaco ME (2007) Couplingecology and GIS to evaluate efficacy of marine protectedareas in Hawaii. Ecol Appl 17:715−730
Fronda R, Lane-Kamahele M, Harry B (2008) Removal ofalien red mangrove from Kaloko-Honokohau NationalHistorical Park. Tech Rep 162, National Park ResourcesStudy Unit, Department of Botany, University of Hawai’i,Honolulu, HI
Johnson AG, Glenn CR, Burnett WC, Peterson RN, LuceyPG (2008) Aerial infrared imaging reveals large nutrient-rich groundwater inputs to the ocean. Geophys Res Lett35:L15606, doi:10.1029/2008GL034574
Jovanovic NZ, Israel S, Tredoux G, Soltau L and others(2009) Nitrogen dynamics in land cleared of alien vege-tation (Acacia saligna) and impacts on groundwater atRiverlands Nature Reserve (Western Cape, SouthAfrica). Water SA 35:37−44
Krebs CJ (1989) Ecological methodology. Harper Collins,New York, NY
Kulbicki M, Guillemot N, Amand M (2005) A generalapproach to length–weight relationships for New Cale-donian lagoon fishes. Cybium 29:235−252
Laegdsgaard P, Johnson C (2001) Why do juvenile fishutilise mangrove habitats? J Exp Mar Biol Ecol 257:229−253
Levine JM, Vila M, D’Antonio CM, Dukes JS, Grigulis K,Lavorel S (2003) Mechanisms underlying the impacts ofexotic plant invasions. Proc R Soc Lond B Biol Sci 270:775−781
Lin HJ, Kao WY, Wang YT (2007) Analyses of stomach con-tents and stable isotopes reveal food sources of estuarinedetritivorous fish in tropical/subtropical Taiwan. EstuarCoast Shelf Sci 73:527−537
Lorenz JJ, McIvor CC, Powell GVN, Frederick PC (1997) Adrop net and removable walkway used to quantitativelysample fishes over wetland surfaces in the dwarf man-groves of the southern Everglades. Wetlands 17:346−359
Lugendo BR, Nagelkerken I, Kruitwagen G, Van Der VeldeG, Mgaya YD (2007) Relative importance of mangrovesas feeding habitats for fishes: A comparison betweenmangrove habitats with different settings. Bull Mar Sci80: 497−512
MacKenzie RA, Bruland GL (2012) Nekton communitystructure in coastal wetlands across the HawaiianIslands. Estuaries Coasts 35:212−226
MacKenzie RA, Cormier N (2012) Stand structure influences
nekton community composition and provides protectionfrom natural disturbance in Micronesian mangroves.Hydrobiologia 685:155–171
Mangels GA, Ritter A (2000) Estimated environmental con-centration of imazapyr resulting from aquatic uses ofArsenal herbicide. Pesticide Registration Report # EXA00-008, American Cyanamid Co., Princeton, NJ
Manson FJ, Loneragan NR, Skilleter GA, Phinn SR (2005)An evaluation of the evidence for linkages betweenmangroves and fisheries: a synthesis of the literature andidentification of research directions. Oceanogr Mar BiolAnnu Rev 43:483−513
Meyer CG, Papastamatiou YP, Clark TB (2010) Differentialmovement patterns and site fidelity among trophicgroups of reef fishes in a Hawaiian marine protectedarea. Mar Biol 157:1499−1511
Moyle PB, Light T (1996) Biological invasions of fresh water:empirical rules and assembly theory. Biol Conserv 78:149−161
Nakahara BA (2007) Utilization of mangrove habitat bymegafauna along the southern coast of Molokai, Hawaii.MSc thesis, University of Hawaii at Manoa, Honolulu, HI
Newton M, Howard KM, Kelpsas BR, Danhaus R, LottmanCM, Dubelman S (1984) Fate of glyphosate in an OregonForest Ecosystem. J Agric Food Chem 32:1144−1151
Osgood DT, Yozzo DJ, Chambers RM, Jacobson D, HoffmanT, Wnek J (2003) Tidal hydrology and habitat utilizationby resident nekton in Phragmites and non-Phragmitesmarshes. Estuaries 26:522−533
Paerl HW, Bales JD, Nusley LW, Buzzelli CP and others(2001) Ecosystem impacts of three sequential hurricanes(Dennis, Floyd, and Irene) on the United States’ largestlagoonal estuary, Pamlico Sound, NC. Proc Natl Acad SciUSA 98:5655−5660
Paerl HW, Valdes LM, Joyner AR, Peierls BL and others(2006) Ecological response to hurricane events in thePamlico Sound system, North Carolina, and implicationsfor assessment and management in a regime ofincreased frequency. Estuaries Coasts 29:1033−1045
Primavera JH (1997) Fish predation on mangrove-associatedpenaids: the role of structure and substrate. J Exp MarBiol Ecol 215:205−216
Raichel DL, Able KW, Hartman JM (2003) The influence ofPhragmites (common reed) on the distribution, abun-dance, and potential prey of a resident marsh fish in theHackensack Meadowlands, New Jersey. Estuaries 26:511−521
Rauzon MJ, Drigot DC (2002) Red mangrove eradicationand pickleweed control in a Hawaiian wetland, water-bird responses, and lessons learned. In: Veitch CR, CloutMN (eds) Turning the tide: the eradication of invasivespecies. IUCN SSC Invasive Species Specialist Group,IUCN, Gland and Cambridge
Ricciardi A (2001) Facilitative interactions among aquaticinvaders: Is an ‘invasional meltdown’ occurring in theGreat Lakes? Can J Fish Aquat Sci 58:2513−2525
Ricciardi A (2005) Facilitation and synergistic interactionsamong introduced aquatic species. In: Mooney HA,Mack RN, McNeely J, Neville LE, Schei PJ, Waage JK(eds) Invasive alien species: a new synthesis. IslandPress, Washington, DC
Rönnbäck P (1999) The ecological basis for economic valueof seafood production supported by mangrove ecosys-tems. Ecol Econ 29:235−252
Rönnbäck P, Troell M, Kautsky N, Primavera JH (1999) Dis-
236A
utho
r cop
y
MacKenzie & Kryss: Exotic mangroves and tide pool fish
tribution pattern of shrimps and fish among Avicenniaand Rhizophora microhabitats in the Pagbilao Man-groves, Philippines. Estuar Coast Shelf Sci 48:223−234
Sheridan P, Hays C (2003) Are mangroves nursery habitatfor transient fishes and decapods? Wetlands 23:449−458
Simberloff D, Von Holle B (1999) Positive interactions ofnonindigenous species: invasional meltdown? Biol Inva-sions 1:21−32
Stevens PW, Blewett DA, Casey JP (2006) Short-term effectsof a low dissolved oxygen event on estuarine fish assem-blages following the passage of Hurricane Charley. Estu-aries Coasts 29:997−1003
Sweetman AK, Middleburg JJ, Berle AM, Bernardino AF,Schander C, Demopoulos AWJ, Smith CR (2010) Impactsof exotic mangrove forests and mangrove deforestationon carbon remineralization and ecosystem functioning inmarine sediments. Biogeochemistry 7:2129−2145
Thayer GW, Colby DR, Hettler WF Jr (1987) Utilization ofthe red mangrove prop root habitat by fishes in SouthFlorida. Mar Ecol Prog Ser 35:25−38
USDA NRCS (2007) Orthophoto Mosaic of the Island ofHawai’i, Hawai’i County, HI. US Department of Agricul-
ture, Natural Resources Conservation Service, NationalCartography and Geospatial Center
Vance DJ, Haywood MDE, Heales DS, Kenyon RA, Lonera-gan NR, Pendrey RC (1996) How far do prawns and fishmove into mangroves? Distribution of juvenile bananaprawns Penaeus merguiensis and fish in a tropical man-grove forest in northern Australia. Mar Ecol Prog Ser131:115−124
Vaquer-Sunyer R, Duarte MC (2008) Thresholds of hypoxiafor marine biodiversity. Proc Natl Acad Sci USA 105:15452−15457
Vitousek PM, D’Antonio CM, Loope LL, Rejmánek M, West-brooks R (1997) Introduced species: a significant compo-nent of human-caused global change. NZ J Ecol 21:1−16
Walsh GE (1967) An ecological study of a Hawaiian man-grove swamp. In: Lauff GH (ed) Estuaries. Horn-ShaferCompany, Baltimore, MD
Walsh W, Sparks R, Barnett C, Couch C and others (2009)Long-term monitoring of coral reefs of the main Hawai-ian Islands, Final Report. State of Hawaii MonitoringReport NA06NOS4260113, 2009 NOAA Coral Reef Con-servation Program
237
Editorial responsibility: Ivan Nagelkerken,Nijmegen, Netherlands
Submitted: August 12, 2011; Accepted: July 27, 2012Proofs received from author(s): December 18, 2012
Aut
hor c
opy