Impact of the carbon price on Australia’s electricity ... · O’Gorman, M. and Jotzo, F., 2014,...
69
| THE AUSTRALIAN NATIONAL UNIVERSITY Crawford School of Public Policy Centre for Climate Economic & Policy Impact of the carbon price on Australia’s electricity demand, supply and emissions CCEP Working Paper 1411 17 July 2014 Marianna O’Gorman Research Associate, Centre for Climate Economics and Policy, Crawford School of Public Policy, ANU Frank Jotzo Centre for Climate Economics and Policy, Crawford School of Public Policy, ANU Abstract Australia’s carbon price has been in operation for two years. The electricity sector accounts for the majority of emissions covered under the scheme. This paper examines the impact of the carbon price on the electricity sector between 1 July 2012 and 30 June 2014, focusing on the National Electricity Market (NEM). Over this period, electricity demand in the NEM declined by 3.8 per cent, the emissions intensity of electricity supply by 4.6 per cent, and overall emissions by 8.2 per cent, compared to the two-year period before the carbon price. We detail observable changes in power demand and supply mix, and estimate the quantitative effect of the effect of the carbon price. We estimate that the carbon price led to an average 10 per cent increase in nominal retail household electricity prices, an average 15 per cent increase in industrial electricity prices and a 59 per cent increase in wholesale (spot) electricity prices. It is likely that in response, households, businesses and the industrial sector reduced their electricity use. We estimate the demand reduction attributable to the carbon price at 2.5 to 4.2 TWh per year, about 1.3 to 2.3 per cent of total electricity demand in the NEM. The carbon price markedly changed relative costs between different types of power plants. Emissions-intensive brown coal and black coal generators reduced output and 4GW of emissions-intensive generation capacity was taken offline. We estimate that these shifts in the supply mix resulted in a 16 to 28kg CO2/MWh reduction in the emissions intensity of power supply in the NEM, a reduction between 1.8 and 3.3 per cent. The combined impact attributable to the carbon price is estimated as a reduction of between 5 and 8 million tonnes of CO2 emissions (3.2 to 5 per cent) in 2012/13 and between 6 and 9 million tonnes (3.5 to 5.6 per cent) in 2013/14, and between 11 and 17 million tonnes cumulatively. There are fundamental difficulties in attributing observed changes in demand and supply to specific causes, especially over the short term, and in this light we use conservative parameters in the estimation of the effect of the carbon price. We conclude that the carbon price has worked as expected in terms of its short-term impacts. However, its effect on investment in power generation assets has probably been limited, because of policy uncertainty about the continuation of the carbon pricing mechanism. For emissions pricing to have its full effect, a stable, long-term policy framework is needed.
-
Upload
hoangnguyet -
Category
Documents
-
view
214 -
download
0
Transcript of Impact of the carbon price on Australia’s electricity ... · O’Gorman, M. and Jotzo, F., 2014,...

| T H E A U S T R A L I A N N A T I O N A L U N I V E R S I T Y
1
Crawford School of Public Policy
2
Centre for Climate Economic & Policy
Impact of the carbon price on Australia’s electricity demand, supply and emissions
CCEP Working Paper 1411 17 July 2014
Marianna O’Gorman Research Associate, Centre for Climate Economics and Policy, Crawford School of Public Policy, ANU
Frank Jotzo Centre for Climate Economics and Policy, Crawford School of Public Policy, ANU
Abstract
Australia’s carbon price has been in operation for two years. The electricity sector accounts for the majority of emissions covered under the scheme. This paper examines the impact of the carbon price on the electricity sector between 1 July 2012 and 30 June 2014, focusing on the National Electricity Market (NEM). Over this period, electricity demand in the NEM declined by 3.8 per cent, the emissions intensity of electricity supply by 4.6 per cent, and overall emissions by 8.2 per cent, compared to the two-year period before the carbon price. We detail observable changes in power demand and supply mix, and estimate the quantitative effect of the effect of the carbon price. We estimate that the carbon price led to an average 10 per cent increase in nominal retail household electricity prices, an average 15 per cent increase in industrial electricity prices and a 59 per cent increase in wholesale (spot) electricity prices. It is likely that in response, households, businesses and the industrial sector reduced their electricity use. We estimate the demand reduction attributable to the carbon price at 2.5 to 4.2 TWh per year, about 1.3 to 2.3 per cent of total electricity demand in the NEM. The carbon price markedly changed relative costs between different types of power plants. Emissions-intensive brown coal and black coal generators reduced output and 4GW of emissions-intensive generation capacity was taken offline. We estimate that these shifts in the supply mix resulted in a 16 to 28kg CO2/MWh reduction in the emissions intensity of power supply in the NEM, a reduction between 1.8 and 3.3 per cent. The combined impact attributable to the carbon price is estimated as a reduction of between 5 and 8 million tonnes of CO2 emissions (3.2 to 5 per cent) in 2012/13 and between 6 and 9 million tonnes (3.5 to 5.6 per cent) in 2013/14, and between 11 and 17 million tonnes cumulatively. There are fundamental difficulties in attributing observed changes in demand and supply to specific causes, especially over the short term, and in this light we use conservative parameters in the estimation of the effect of the carbon price. We conclude that the carbon price has worked as expected in terms of its short-term impacts. However, its effect on investment in power generation assets has probably been limited, because of policy uncertainty about the continuation of the carbon pricing mechanism. For emissions pricing to have its full effect, a stable, long-term policy framework is needed.

| T H E A U S T R A L I A N N A T I O N A L U N I V E R S I T Y
Keywords Emissions pricing; Australia; electricity supply and demand; ex-post evaluation.
JEL Classification Q58, Q48, Q41, Q28.
Suggested Citation: O’Gorman, M. and Jotzo, F., 2014, ‘Impact of the carbon price on Australia’s electricity demand, supply and emissions’, July 2014. CCEP Working Paper 1411, Crawford School of Public Policy, The Australian National University.
Address for correspondences: Frank Jotzo Crawford School of Public Policy Australian National University [email protected]
The Crawford School of Public Policy is the Australian National University’s public policy school, serving and influencing Australia, Asia and the Pacific through advanced policy research, graduate and executive education, and policy impact.
The Centre for Climate Economics & Policy is an organized research unit at the Crawford School of Public Policy, The Australian National University. The working paper series is intended to facilitate academic and policy discussion, and the views expressed in working papers are those of the authors. Contact for the Centre: Dr Frank Jotzo, [email protected]

1
Impact of the carbon price on Australia’s electricity demand,
supply and emissions
Marianna O’Gorman1 and Frank Jotzo2
Abstract
Australia’s carbon price has been in operation for two years. The electricity sector accounts for the majority of emissions covered under the scheme. This paper examines the impact of the carbon price on the electricity sector between 1 July 2012 and 30 June 2014, focusing on the National Electricity Market (NEM). Over this period, electricity demand in the NEM declined by 3.8 per cent, the emissions intensity of electricity supply by 4.6 per cent, and overall emissions by 8.2 per cent, compared to the two-year period before the carbon price. We detail observable changes in power demand and supply mix, and estimate the quantitative effect of the effect of the carbon price. We estimate that the carbon price led to an average 10 per cent increase in nominal retail household electricity prices, an average 15 per cent increase in industrial electricity prices and a 59 per cent increase in wholesale (spot) electricity prices. It is likely that in response, households, businesses and the industrial sector reduced their electricity use. We estimate the demand reduction attributable to the carbon price at 2.5 to 4.2 TWh per year, about 1.3 to 2.3 per cent of total electricity demand in the NEM. The carbon price markedly changed relative costs between different types of power plants. Emissions-intensive brown coal and black coal generators reduced output and 4GW of emissions-intensive generation capacity was taken offline. We estimate that these shifts in the supply mix resulted in a 16 to 28kg CO2/MWh reduction in the emissions intensity of power supply in the NEM, a reduction between 1.8 and 3.3 per cent. The combined impact attributable to the carbon price is estimated as a reduction of between 5 and 8 million tonnes of CO2 emissions (3.2 to 5 per cent) in 2012/13 and between 6 and 9 million tonnes (3.5 to 5.6 per cent) in 2013/14, and between 11 and 17 million tonnes cumulatively. There are fundamental difficulties in attributing observed changes in demand and supply to specific causes, especially over the short term, and in this light we use conservative parameters in the estimation of the effect of the carbon price. We conclude that the carbon price has worked as expected in terms of its short-term impacts. However, its effect on investment in power generation assets has probably been limited, because of policy uncertainty about the continuation of the carbon pricing mechanism. For emissions pricing to have its full effect, a stable, long-term policy framework is needed.
1 Research Associate, Centre for Climate Economics and Policy, Crawford School of Public Policy, ANU
2 Director, Centre for Climate Economics and Policy, Crawford School of Public Policy, ANU
Acknowledgements: Hugh Saddler, Lucy Carter and Tony Wood provided useful comments. All errors and possible shortcomings are the authors’.

2
1 Introduction
Since 1 July 2012, Australia has had a carbon pricing scheme in place, the centrepiece of the ‘Clean Energy Future’ policy (Clean Energy Act 2011) passed by the Labor government in 2011. Under the carbon pricing mechanism, emitters responsible for over 60 per cent of Australia’s emissions are covered by a liability to acquit permits for their emissions arising from the combustion of fossil fuels as well as some process and other emissions. In 2012-13, this equated to 348 of Australia’s highest emitting entities, including power stations, mines and emissions-intensive manufacturers (Clean Energy Regulator 2013e). The carbon pricing mechanism is a permit scheme where, for the first three years, the price is fixed starting at $23 per tonne of carbon dioxide and equivalent in 2012-13, $24.15 in 2013-14 and $25.40 in 2014-15. During the fixed-price period (2012-2015), the government sells an unlimited amount of permits at the fixed price and neither international trading nor banking of permits is allowed. Under existing legislation, on 1 July 2015, the fixed-price transitions into a floating price where a fixed number of permits is sold at auction and the market sets the price. International permits can also be used from 1 July 2015. Other notable features include recycling of around half the expected revenue to low- and middle-income households through lower income tax rates and increases in welfare payments; assistance to emissions-intensive trade-exposed industries through output-linked free permits at a declining rate; an offset mechanism for agriculture and forestry; funding for investment in renewable technology and innovation; and newly created independent institutions (Jotzo 2012, Keenan 2012, Clean Energy Act 2011). Policy uncertainty has dogged Australia’s climate change policy, and carbon pricing in particular, for many years. The Labor government under Prime Minister Rudd negotiated an emissions trading scheme with the Liberal party Opposition during 2008-09, but then lost the Opposition’s support and postponed consideration of the policy. The next Labor government, under Prime Minister Gillard, was a minority government supported by Greens and Independents. Prime Minister Gillard announced a Multi-Party Climate Change Committee in September 2010, which developed the components of what later became the Clean Energy Future policy. However, the conservative Opposition (Liberal-National coalition) made it clear all along that it intended to repeal the policy, and at the introduction of the policy in July 2012 a substantial share of experts, including in industry, did not expect the scheme to survive (Jotzo et al. 2012). In September 2013, the Liberal-National coalition was elected promising to repeal the Clean Energy Act and associated legislation immediately. A bill for repeal has twice passed the House of Representatives (Clean Energy (Carbon Tax Repeal) 2013) however, both times, passage was blocked in the Senate. On 1 July 2014, a new Senate was sworn in which the balance of power predominantly rests with eight independent senators. At the time of writing,

3
the Bill is before the new Senate again, which will have the deciding vote on whether the Clean Energy Act 2011 remains in place beyond 2014 or is repealed.
In this context, it is timely to assess the impact of the carbon price over the first two years of its operation. We focus on effects in the electricity sector, as emissions from electricity generation are the largest contributor to Australia’s overall emissions, and are probably the largest opportunity for reducing emissions both in the near term and the longer term, including through the use of carbon pricing. The electricity sector also makes up the majority of emissions covered under the carbon price. We investigate five aspects: electricity prices, electricity demand, electricity generation, the carbon-intensity of supply and overall emissions. We provide a description and qualitative analysis of observed changes, as well as quantitative estimates of the impact of the carbon price. Given the uncertainty surrounding climate change policy in Australia and the prospect that the present carbon pricing scheme may not last, coupled with the short period of operation to date, we would not expect the scheme to have had significant impacts on investment choices. However, we may expect there to be some shorter-term impacts in the dispatch of different kinds of power plants, and in electricity demand. We estimate these, taking a conservative approach to quantification of the effects of the carbon price, in light of the fundamental difficulties in attribution of observed short-term changes in power supply and demand.
Emissions reductions are also being achieved through other policy instruments in force in Australia. In the power sector, the greatest abatement effect has come through the Renewable Energy Target (RET), which provides a premium to producers of renewable energy (SKM MMA 2012). State-based renewable energy support schemes, mostly in the form of feed-in tariffs (SKM MMA 2012), as well as a range of policies to improve energy efficiency (AEMO 2012c) also contributed. Many of the renewables support schemes are being or have been phased out. A range of non-pricing policies also apply outside the electricity sector. In this paper we do not evaluate the effect of these policies, nor their interaction with the carbon pricing scheme.
Section 1 and 2 provide an overview of the mitigation potential and recent trends in the electricity sector. Section 3 explores the impact of the carbon price on electricity prices over the past two years. Section 4 compares changes in electricity demand over the past decade with the change in demand in 2012/13 and 2013/14. Section 5 and 6 looks at the changing composition of Australia’s electricity supply after the carbon price was introduced and how this influenced the emissions intensity of electricity supply. Section 7 explores how the combined changes to demand and supply have affected overall emissions in the electricity sector. Section 8 concludes with some observations on the possible future of the carbon price and implications.

4
2 Importance of the electricity sector for Australia’s mitigation response
2.1 Mitigation in the electricity sector
Australia’s highly emissions-intensive electricity sector is the main reason why Australia’s emissions are the highest per capita amongst advanced economies. Around 75 per cent of Australia’s electricity supply is generated from coal, higher than in most other advanced countries, and very high in global comparison (World Bank 2012). Electricity generation accounts for more than one-third of Australia’s overall emissions, and emissions from this sector have grown faster than any other sector over the past decade (DIICCSRTE 2013 and see Table 1).
Modelling indicates that the least-cost combination of greenhouse gas emissions reductions in Australia would involve significant changes to the electricity sector. For example, ClimateWorks (2013d, p.51) estimated that, if recent trends in emissions reductions continue, over 60 per cent of cumulative emission reductions would come from the electricity sector alone by 2020. Similarly, Treasury (2011b, chart 5.8 and 5.9) estimated that by 2050, over half of cumulative domestic emission reductions would come from this sector in a scenario with a carbon price of $29/t CO2 at 2020 and $131/t at 2050 (real) in 2010 prices (Table 1). Recent modelling of a very low carbon scenario for Australia by 2050 (Jotzo, Skarbek et al 2014) indicates that the cornerstone of a deep decarbonisation scenario for Australia is a near-zero emissions power sector. The same is generally true for all the world’s main emitters (Sachs et al 2014). On the demand side, consumers can change their electricity consumption comparatively quickly; for example, by purchasing solar panels that displace part of their demand from the grid; purchasing energy efficient appliances; and by changing their consumption patterns. It takes longer for significant changes on the supply-side to occur, as it requires investment in and construction of new generation capacity or the development of new technology. That is why modelling of a carbon price shows reduced electricity demand as a major factor behind abatement in the short term but over the longer term, supply-side responses that reduce the emissions intensity of electricity generation – such as a shift from coal-fired generation to gas and renewables, and coal with carbon capture and storage (if available) – are expected to be the main source of abatement (Treasury 2011b; ACIL Allen 2013a). For example, Treasury (2011b) estimated 81 per cent of cumulative abatement in the electricity sector to 2050 would come from the reduced emissions intensity of electricity supply whilst reduced demand would only make up 19 per cent (Treasury 2011a).

5
Table 1: The role of the electricity sector in Australia’s emissions profile and abatement options
Sector Emissions 2011-12
(Mt CO2) a
Share of CO2
emissions 2011-12 (%) a
Growth in annual emissions
1989/90 - 2011/12
(Mt CO2) a
Annual average
growth in CO2 emissions 1989/90 –
2011/12 (%) a
Modelling of abatement
potential % of
cumulative abatement
2012-2020 b
% of cumulative abatement
2012-2050 b Electricity generation 194.2 34 64.6 1.9 43 53
Other stationary energy
93.5 16 28 1.6 13 12
Transport 87.4 15 25.4 1.6 2 2
Fugitives 40.9 7 8.5 1.2 22 18
Agriculture 90.1 16 3.6 0.2 0 03
Industrial processes 30.9 5 6.2 1.1 12 9
Waste 14.1 2 -3.3 -0.9 9 6
Forestry & land use b 26.8 5 n/a n/a 0 0
Total 577.8 100 133 100 100
a Data from DCCEE 2012b b Data from Treasury (2011b), ‘Clean Energy Future’ and ‘Medium Global Action’ scenario
3 Treasury modelling assumes that without a domestic carbon price, abatement from the Carbon Farming Initiative is exported or used in voluntary markets and therefore cannot be counted towards Australia’s abatement task (Treasury 2011a)

6
3 Recent trends in electricity demand, supply and emissions
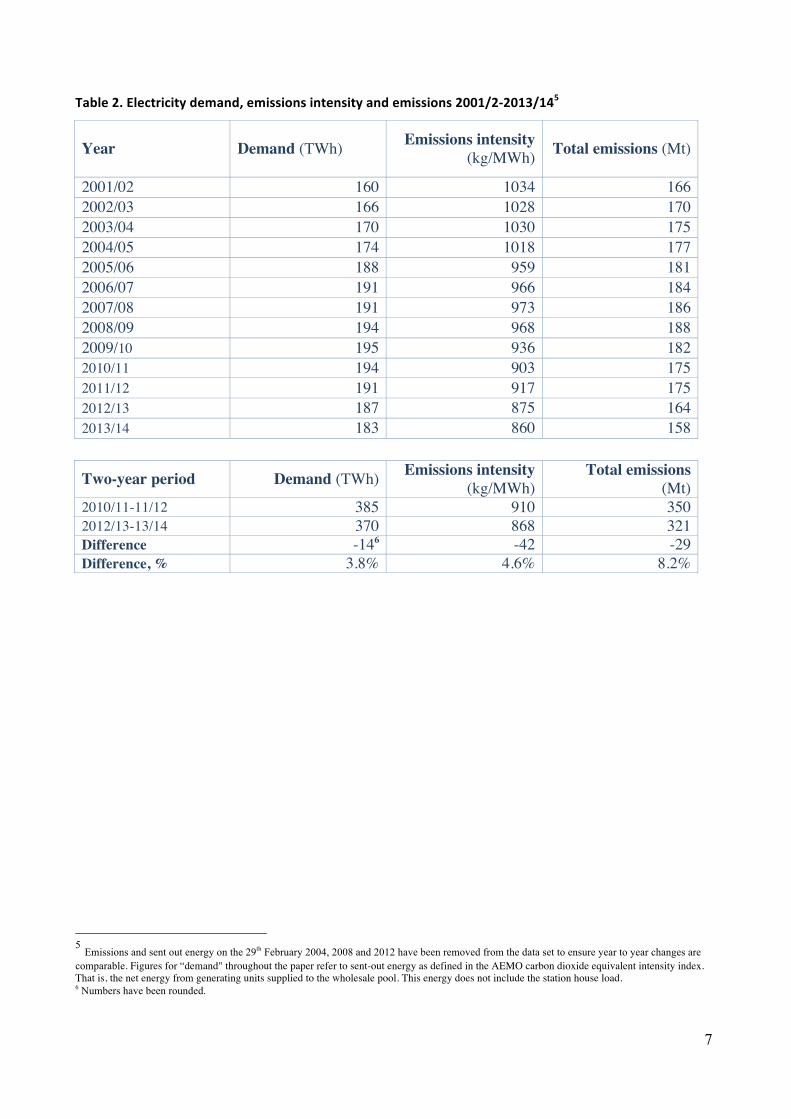
Prior to the introduction of the carbon price, electricity demand, emissions-intensity (the amount of emissions released for every megawatt hour of electricity produced) and overall emissions in the electricity sector had begun to trend downwards. The last year of rising demand in the National Electricity Market (NEM)4 was 2009-10. However, during the two year period following the introduction of the carbon price (July 2012 to end of June 2014) this trend accelerated with demand down 3.8 per cent (14 TWh), average emissions intensity down 4.6 per cent (42 kilograms CO2 p/MWh) and overall emissions down 8.2 per cent (29 million tonnes of CO2) compared to the two year period prior to its introduction (July 2010 to end of June 2012). Comparing 2013/14 to 2011/12 (the year before the introduction of the carbon price), emissions were down by 18 million tonnes or 10 per cent.
Figure 1. Electricity demand, emissions intensity and emissions compared to 2008-‐9
4 Unless specified otherwise, data referring to the ‘electricity market’ refers to the National Electricity Market (NEM), that is, the electricity market used by all states and territories except the Northern Territory and Western Australia covering 80 per cent of total Australian electricity generation. A number of organizations publish data on demand and emissions in the NEM, each with slightly different methods of measurement. For this paper, the primary data on demand, emissions and emissions intensity is from the Australian Energy Market Operator’s Carbon Dioxide Equivalent Intensity Index as this is the only publicly available data that is updated monthly.
09/10
09/10 09/10
10/11
10/11 10/11
11/12
11/12
11/12
12/13
12/13
12/13
13/14
13/14
13/14 -‐18
-‐16
-‐14
-‐12
-‐10
-‐8
-‐6
-‐4
-‐2
0
2
1 2 3
Percentage change from
2008/09
Demand Emissions intensity Total Emissions
7
Table 2. Electricity demand, emissions intensity and emissions 2001/2-‐2013/145
Year Demand (TWh) Emissions intensity (kg/MWh) Total emissions (Mt)
2001/02 160 1034 166 2002/03 166 1028 170 2003/04 170 1030 175 2004/05 174 1018 177 2005/06 188 959 181 2006/07 191 966 184 2007/08 191 973 186 2008/09 194 968 188 2009/10 195 936 182 2010/11 194 903 175 2011/12 191 917 175 2012/13 187 875 164 2013/14 183 860 158
Two-year period Demand (TWh) Emissions intensity (kg/MWh)
Total emissions (Mt)
2010/11-11/12 385 910 350 2012/13-13/14 370 868 321 Difference -146 -42 -29 Difference, % 3.8% 4.6% 8.2%
5 Emissions and sent out energy on the 29th February 2004, 2008 and 2012 have been removed from the data set to ensure year to year changes are comparable. Figures for “demand" throughout the paper refer to sent-out energy as defined in the AEMO carbon dioxide equivalent intensity index. That is, the net energy from generating units supplied to the wholesale pool. This energy does not include the station house load. 6 Numbers have been rounded.

8
The figure below shows changes in emissions intensity, demand and overall emissions from 2005/6 after Tasmania joined the NEM.
Figure 2: Electricity demand, emissions intensity of supply and emissions, 2005/6 to 2013/14
3.1 Electricity prices
Retail residential electricity prices rose by 25 per cent (nominal) across the NEM in the two years following the introduction of the carbon price. Of this increase, 10 per cent was as a result of the carbon price and 15 per cent was related to other factors (Appendix A; Figure 3)7. Residential electricity prices have risen steeply since the mid-2000s, but the price rise in 2012/13 was higher than recent price rises.8 Electricity prices for manufacturing industry drawing power from the grid are estimated to have risen by 24 per cent in the two years following the introduction of the carbon price. Of this increase, 15 per cent was attributable to the carbon price and 9 per cent was attributable to other factors (Appendix C; Figure 3). Price effects are likely to have differed between different enterprises, with different patterns for more and less energy intensive producers.
7 This is based on regulated tariffs where available. 8 Prior to the introduction of the carbon price, electricity prices had risen 54 per cent (nominal) over the four years to June 2012.
85
90
95
100
105
110
Emissions intensity
Emissions
Electricity demand
Index, 2011/12 =100
Carbon price introduced

9
The increase in residential, business and wholesale prices due to the carbon price was limited almost completely to 2012/13. The carbon component of electricity prices is dependent on the emissions intensity of electricity provided. In 2013-14, the carbon price increased from $23.00 to $24.15 but emission intensity of the grid decreased meaning the carbon component of electricity prices only rose slightly; by 0.4 per cent for residential users and an estimated 0.5 per cent for manufacturers (ICRC 2013; Appendix A). As the carbon price is applied at the point of generation, wholesale (spot) prices increased significantly - 85 per cent over two years following 1 July 2012, of which, 59 per cent was due to the carbon price (Appendix B; Figure 4). Although spot prices had been at their lowest ever levels in many parts of the NEM throughout 2011-12 due to weaker demand and increased competition from renewable energy generators (AER 2012a; Appendix B).

10
Figure 3: Residential & Manufacturing annual electricity price increases year on year (%) 2008/9-‐2013/14 1
Source: Appendix A, Appendix C
1As there is no industrial sector electricity price index, the manufacturing electricity price index taken from Australian Bureau of Statistics Producer Price Index is used to estimate the impact on industrial electricity prices.
-‐5
0
5
10
15
20
25
08/09
09/10
10/11
11/12
12/13
13/14
08/09
09/10
10/11
11/12
12/13
13/14
08/09
09/10
10/11
11/12
12/13
13/14
08/09
09/10
10/11
11/12
12/13
13/14
08/09
09/10
10/11
11/12
12/13
13/14
08/09
09/10
10/11
11/12
12/13
13/14
08/09
09/10
10/11
11/12
12/13
13/14
08/09
09/10
10/11
11/12
12/13
13/14
NSW QLD ACT SA Tas Vic* NEM Avg (Residential)
Manufacturing
(%) increase
Carbon costs
Generation, network & retail costs

11
Figure 4. Wholesale (spot) electricity price changes ($) 2007/8-‐2013/14 in the NEM
Source: Appendix B
20
30
40
50
60
70
80
90
100
07/08
08/09
09/10
10/11
11/12
12/13
13/14
07/08
08/09
09/10
10/11
11/12
12/13
13/14
07/08
08/09
09/10
10/11
11/12
12/13
13/14
07/08
08/09
09/10
10/11
11/12
12/13
13/14
07/08
08/09
09/10
10/11
11/12
12/13
13/14
07/08
08/09
09/10
10/11
11/12
12/13
13/14
NSW QLD SA Tas Vic NEM Avg
$/MWh
Carbon costs
Non-‐carbon costs

12
In the five years prior to the introduction of the carbon price, rising network costs were the primary driver behind rising electricity prices; accounting for between 35 and 50 per cent of total residential price rises (Appendix A; AER 2012a; AER 2013d; Productivity Commission 2013; Garnaut 2011). One of the main reasons behind rising network costs was the anticipated rise in peak demand (Owen 2013; Wood & Carter 2013; CEDA 2012). Networks were upgraded to cater for these very rare peaks in demand, which occur less than 1 per cent of the year (Ernst & Young 2011; DCCEE 2012a). Upgrades took place at a time of historically high average demand and were built to cater for an anticipated increase in peak demand that did not occur to the extent expected.
In 2012-13, network costs accounted for 51 per cent of the average household electricity bill, generation and retail costs accounted for 20 per cent each and the carbon price accounted for 9 per cent (DRET 2013).
1.1 Government assistance to households and industry in relation to the carbon price
Household Assistance
The on-average 10 per cent increase in household electricity prices due to the carbon price was mitigated for low and middle-income households through assistance provided by the Federal Government. Though often termed “compensation”, the assistance arrangements did not remove the financial incentive for households to reduce their electricity consumption. Assistance payments were delivered through the tax and transfer system, rather than as direct rebates on electricity bills. Assistance measures provided low-income households with assistance that at least offset the average price impact of the carbon price and provided middle-income households with assistance to help meet these price impacts (Hatfield-Dodds et al. 2011). Most high-income households did not receive any financial assistance (Phillips & Taylor 2011).
Industry Assistance
Some companies also received assistance to help transition to the carbon price. Some of this assistance was delivered in cash payments, but the majority was delivered in the form of free carbon permits. Assistance was provided to the most emissions-intensive power producers and industries, with a particular focus on trade-exposed manufacturing industries that are constrained in their capacity to pass through costs on the global market and whose production processes are of high emissions intensity, such as aluminium smelting, alumina refining, petroleum refining and iron, steel and liquefied natural gas production (Clean Energy Regulator 2013g). Most companies in the commercial and services sector, therefore, were not eligible for assistance.

13
Industry assistance did not remove the incentive for companies to reduce emissions and electricity consumption. This is because it was based on the historical industry average level of emissions and electricity consumption, rather than on a company’s future emissions, consumption or output. Therefore, any reductions in power use or emissions saved businesses money.
The majority of assistance to electricity generators was provided through the Energy Security Fund, which provided transitional assistance (in the form of cash payments and free permits) targeted at generators with an emissions-intensity greater than 1.0t CO2 p/MWh (Clean Energy Regulator 2013f), thus covering only the more emissions intensive coal fired generators. Again, as assistance was based on historical generation patterns, it did not remove the incentive for generators to reduce the emissions intensity of production, nor to reduce output from dirty plants (though generators were required to remain potentially operational in order to be eligible for payments (Clean Energy Act 2011, Part 8, Division 4). The Government also announced a program to provide financial incentives for emissions-intensive electricity generators to close. The negotiations involved five companies (Alinta, HRL, Hazelwood Power Partnership, Ratch and Truenergy) submitting a tender outlining a dollar figure for their closure (Ferguson 2012a). In September 2012, the Government announced that negotiations were unsuccessful as the level of compensation sought by generators was significantly higher than the Government was prepared to pay, so the program was cancelled (Ferguson 2012b). Subsequently, however, all five companies voluntarily announced closures or reduced operations without any Government compensation (Table 9 & 10 below).
1.2 Future impact of the carbon price
The increases in electricity prices seen in 2012/13 is likely to be the only substantial increases due to the carbon-pricing scheme for some time, and indeed a reduction of the carbon component of power prices is likely if the scheme remained in place. This is because the carbon component of electricity bills moves almost directly with the carbon price level, which is legislated to increase only slightly in 2014/15. If the scheme survived under the present legislative arrangements, from July 2015 it would be the same as the European Union’s (EU) emissions trading scheme price. During 2013, the EU carbon price was much lower than the Australian price, and is more likely to be below than above the fixed Australian carbon price by 2015. The New South Wales Independent Pricing and Regulatory Tribunal and the Federal Treasury forecast that electricity prices would fall by around 7 per cent as a result of moving to an emissions trading scheme at EU trading prices (IPART 2013; Butler 2013) whilst AEMC expects prices to fall by between 4.1 and 8.3 per cent (varying by state) in 2015/16, largely attributable to the impact of moving from a fixed to floating carbon price (AEMC 2013d).

14
2 Electricity demand
2.1 Electricity demand over the past decade
Demand for electricity in the NEM increased steadily at 2.8 per cent per annum from 2001/2-2004/5 (Figure 5). In 2005/6, demand growth increased by 8 per cent, as a result of Tasmania joining the NEM. From 2007/8-2009/10, growth in demand slowed to just under 1 per cent per annum (Figure 5). Then in 2010/11, for the first time since the NEM began, overall demand fell (0.6 per cent) and has continued to fall each year since. In the two years following the introduction of the carbon price, demand was down 3.8 per cent compared to the same two-year period ending 30 June 2012.
The 3.8 per cent decline is the largest drop since the founding of the NEM, representing a drop of 14 TWh. Whilst demand had been declining over the two financial years preceding 2012-13, those reductions were much more modest (only 3.5 TWh over the two-year period 10/11-11/12) (AEMO 2011; AEMO 2012B; 2013a; AEMO 2014b). All states experienced a decline in residential and commercial consumption over the period (AEMO 2014c).
Figure 5: National Electricity Market Demand 2001/02-‐2013/14
Data source: AEMO 2001, AEMO 2002, AEMO 2003, AEMO 2004, AEMO 2005, AEMO 2006, AEMO 2007, AEMO 2008, AEMO
2009, AEMO 2010b, AEMO 2011, AEMO 2012b, AEMO 2013a, AEMO 2014b
155
165
175
185
195
Annual dem
and TW
h

15
2.2 Price elasticity of demand
Demand for electricity is sensitive to changes in price, and price elasticity is greater in the long term than the short term, as many empirical studies have shown (Table 3). It is lower in the short term because it takes time for households to purchase more energy efficient appliances or install items like home insulation, or for companies to invest in more energy efficient equipment. Changes in consumption habits, production processes and operating practices can often be realised in the short term.
Table 3: Empirical estimates of price elasticity of electricity demand
Region Study Estimated demand elasticity
Australia (NEM)
AEMO (2013f)
Residential and commercial instantaneous: -0.08 to -0.37 Residential and commercial (short run – 4 quarters): -0.11 to -0.40 Residential and commercial long run (10 quarters): -0.13 to -0.44
Australia Hill and Cao (2013) Manufacturing industry short run: -0.24
Australia (NEM)
Saddler (2013b) Large industry: -0.1
Australia (NEM)
Vivid Economics (2013) Residential Long run: -0.14 Commercial Long run: -0.42 Manufacturing Long Run: -0.55
Australia Pitt and Sherry (2013d) Long run: -0.25
South Australia Fan & Hyndman (2010) -0.36 to -0.43
Australia (NEM)
AEMO (2010a)
Long run elasticity of -0.16 to -0.38 depending on state
Australia (NEM)
National institute of economic and industry research (2007)
Residential -0.25 Commercial -0.35 Industrial -0.38
Global Productivity Commission (2011)
Ranges from -0.2 to -0.7 across residential, commercial and industrial sector
US Bohi & Zimmerman (1984) Residential sector Short run: -0.2 Long run -0.7
Switzerland Filippini (1999) Residential and industrial: -0.3
Israel Beenstock (1999) Residential -0.21 to -0.58 Industrial -0.002 to -0.44
US King (2003) Residential -0.1 to -0.4 US Reiss (2005) Residential -0.39 UK Taylor (2005) Industrial -0.05 to -0.26 Review of international case studies
OECD (2008)
Residential sector Short run: -0.3 Long run: -0.7
Adapted from: Fan and Hyndman 2010

16
In the NEM, the Australian Energy Market Operator (AEMO) breaks down demand into two categories: large industrial consumption and residential and commercial consumption. Large industrial consumption accounts for around 25 per cent of total consumption and residential and commercial consumption makes up the remaining 75 per cent (AEMO 2014c). The short-run elasticities used by AEMO (2013f) (above) are based on recent historical electricity consumption trends in the NEM. AEMO includes light industrial consumption as part of residential and commercial sector consumption. We use AEMO’s estimates of short-run price elasticity as anchor points for our estimates of the impact of the carbon price on residential and commercial electricity use, which ranges from -0.11 to -0.40, varying by state.1 Comparison with other estimates of short-term demand responses (Table 3) suggests that the majority of estimates for Australia and internationally are towards the upper bound used in our analysis. Hence, our estimated range of the impact of the carbon price on power demand can be seen as conservative. AEMO does not use an elasticity-based estimation to forecast large industrial use. Its forecasts are based on information gathered from directly contacting large industrial users and collating individual company data (AEMO 2013g). Instead, we use two different estimates of the impact of the carbon price on industrial electricity consumption as boundary cases. The upper bound is the short-term elasticity estimated by Hill and Cao (2013) of -0.24. This is broadly in line with other estimates, though estimates in the literature vary widely. The lower estimate used is an elasticity of -0.10 by Saddler (2013b), based on an analysis of NEM demand from 2000-2012.
2.3 Estimates of demand changes for households and the commercial sector
Across the NEM, residential electricity prices have risen by an average of 93 per cent (nominal) since 2008/09. This is thought to have been the primary driver behind the decline in residential and commercial electricity consumption (Vivid 2013; Appendix A; Jordan 2013a, DCCEE 2013; AEMO 2013e). The actual drivers of increased efficiency and lower demand are much more complex than just the effect of rising prices, of course. Mandated energy efficiency standards, increasing availability of energy efficient appliances, as well as greater awareness of energy saving opportunities and electricity costs all play a role. A quantitative analysis as in this paper however needs to rely on changes in price as a first order proxy for demand responses.
1 We have adapted the elasticity estimates used by AEMO, Hill & Cao and Saddler using a simplified version that does not take into account changes in external factors, such as a temperature or income.

17
Households and commercial entities responded to higher electricity prices by taking steps to reduce their consumption (CLP 2013; AER 2013; AEMO 2013f). Consumers became more conscious of purchasing appliances and premises with a high-energy efficiency rating and appliances and buildings themselves became increasingly energy efficient, driven by a change in government standards and labeling (Clean Energy Council 2012a; Wood & Carter 2013). More than 70 per cent of consumers who recently purchased an air-conditioner, washing machine, clothes dryer or dishwasher considered its energy efficiency an important factor when deciding which model to purchase (ABS 2012c). The overwhelming majority of households are thought to have taken steps to reduce their power consumption. For example, nearly 90 per cent of households dry clothes on the washing line for all or most washes, 80 per cent use energy efficient light bulbs and 70 per cent have insulation (ABS 2013). Together, these measures impacted on final consumption in 2012/13-2013/14, with a number of electricity companies reporting a decline in total residential consumption of 3-4 per cent on average (Energex 2013; Ausgrid 2013) and 4-5 per cent decline on a per capita basis (Ergon 2013; Ausgrid 2013).
To estimate the demand response by households to the carbon price increase, we apply the chosen range of elasticities to electricity demand by state and retail price increase by state in the year 2012-13 (Table 4). 2 We limit the focus to price changes in 2012/13 because the increase in prices related to the carbon price in 2013/14 was insignificant (0.4 per cent). On this basis, the 9.4 per cent average increase in retail power prices in 2012/13 due to the carbon price is estimated to have led to a reduction of 1.8 TWh in household and commercial electricity use, equivalent to 1.3 per cent of household and commercial consumption, during 2012-13. We treat this estimate as a lower bound. We also posit a higher bound of 2.6 TWh in 2012-13. For the higher bound we assume that non-price related factors, such as extensive media and political coverage as discussed below, exacerbated the impact on electricity consumption patterns, leading more households to switch to new appliances or install solar (see below). To estimate a higher bound, we attribute one-fifth of additional solar generation in 2012/13 (0.24 TWh) to the carbon price and estimate the consumer response to be one third higher than historical elasticities would suggest (0.54TWh) For our overall assessment of the effect of the carbon price, we assume that this effect lasted during 2013/14, thus assuming no additional changes but equally no ‘backsliding’. We do not account for the further 0.4 per cent increase in the carbon component in 2013/14. We also do not take account of the higher amount of small-scale solar power generation in 2013/14.
2 For simplicity and tractability, we assume that the same elasticity holds in all Australian States that are part of the NEM, although AEMO estimates elasticities separately for each of the States.

18
Therefore, using an upper and lower bound, the overall household and commercial on-grid electricity reduction during the two years of the operation of the carbon price is estimated at between 3.6 TWh and 5.3 TWh.
Table 4: Estimated demand responses to carbon price, 2012-‐13, households and commercial electricity demand
Qld NSW & ACT Victoria South
Australia Tasmania NEM total
NEM, % change
Change in nominal electricity price (%)
Due to carbon price 10.6 8.9 10.6 4.6 5.6 9.4
Due to other factors 0 9.2 11.6 8.1 5 7.4
Price elasticity -0.12 -0.16 -0.11 -0.19 -0.40
Residential electricity use 2011/12 (GWh) 33635 53775 36335 10275 3811 137831
Estimated change in electricity demand (GWh)
Due to carbon price (Low)
-428 -766 -426 -92 -86 -1,797 -1.30%
Due to carbon price (High)
-626 -1,121 -623 -134 -126 -2,630 -1.91%
Due to other factors 0 -792 -466 -161 -77 -1,496 -1.09%
Source: Appendix A, AEMO 2013f, AEMO 2014c, Clean Energy Regulator 2014b
Why demand responsiveness may be greater than elasticities would indicate
It is possible that the carbon price had a stronger effect on household electricity savings than our lower bound estimate because of the high degree of salience of carbon price related power cost increases. Since the demise of the bipartisan approach to emissions trading in late 2009, the Coalition political parties very frequently highlighted the impacts of the carbon price on household electricity prices. Media and political coverage of the carbon pricing mechanism, ahead of its introduction, was more prominent than any other national policy issue from 2009-2012. In 2011/12, more than 7000 news articles were published across New South Wales, Queensland, Victorian and South Australian newspapers focusing on electricity prices, a 600 per cent increase in attention compared to 2006/07 (Simshauser 2014). In addition, unlike regular price increases announced by state regulators one month before introduction, consumers were informed of the 2012/13 carbon price increase 12 months before it came into effect and therefore had longer to prepare.

19
Because people were more aware of the fact that electricity prices would rise in mid-2012 than they were about other price rises not related to the carbon price, they may have been more conscious of their consumptions pattern and more likely to switch to energy savings practices both in the lead up to 1 July 2012 and in the two years following (ABS 2012a; Pitt & Sherry 2013c; Climate Institute 2013; Saddler 2013b). In other words, consumers may have adjusted their usage by a greater degree than would ordinarily be the case for a 9.4 per cent price increase. To the extent that this is so, our lower bound estimates – based on pure price elasticities not other factors of public communication and politically induced salience – are likely to underestimate the impact of the carbon price on demand. Our higher bound estimate aims to take into account these factors. Another factor that may have added to the reduction in demand is the additional financial incentives offered under the Clean Energy Future policy. This included $166 million in revenue from the carbon price that was allocated to small-scale energy efficiency measures. This enabled 33,000 low-income households to increase their energy efficiency; for example, to install solar hot water or undertake a household energy assessment. Funding was also made available to 160 local government and not-for-profit groups to make energy efficiency upgrades to their facilities.
Political and media attention had a similar impact on the commercial sector with 60 per cent of businesses (both small and large) indicating that the carbon price was an important motivation in taking action to increase energy efficiency (AIG 2012). A number of companies also reported taking action in 2011/12 (in anticipation of the carbon price), given they had over 12 months to prepare (AIG 2012; AIG 2013a). Similarly, the Clean Energy Finance Corporation (CEFC) began operations in 2013 providing finance for local council and commercial business upgrades that have resulted in project energy savings of between 10 and 70 per cent. As the CEFC’s business financing has also targeted a number of manufacturers and agribusinesses, it also impacted on large industrial energy consumption in 2013/14.
Small-‐scale solar power production
In addition to power savings through changed practices and more energy efficient equipment, the amount of solar power produced by households and businesses has increased. This was driven largely by subsidies for the installation of solar panels and feed-in tariff schemes, but probably in part also in response to rising electricity prices. We provide an estimate of the magnitude of the effect here. Our lower bound estimate does not attribute any part of it to the carbon price; our higher bound estimate only includes a small fraction of overall solar generated in 2012-13 (0.24TWh). Self-generated solar displaces demand for on-grid electricity consumption. The dramatic fall in the costs of solar panels and home systems, meant solar panels remained an attractive investment even as generous government subsidies and tariffs were wound down over the two-year period. The carbon price also increased the financial payback associated with solar

20
photovoltaic investments, acting as a further incentive to increase uptake (AEMC 2013; BREE 2012; AEMC 2012a; ABS 2012). Over the two-year period, electricity generated from solar panels increased by over 190 per cent (Clean Energy Regulator 2014b), displacing an additional 4.5 TWh compared to 2010/11-2011/12 (Table 5).
Table 5: Contribution of small-‐scale solar Photovoltaic in the National Electricity Market
Cumulative number of solar PV homes (in the
NEM)
Rated power of Solar PV installed
(MW)
Estimate of electricity produced (annually in
TWh) 2010-11a 456,497 9,33 0.7 2011-12 715,022 1,658 1.7 2012-13 b 947,999 2,490 2.9 2013-14 b 1,092,002 3,103 43
Source: Clean Energy Regulator 2014b; AEMO 2014c. a Includes all installation from 2001 up until 2010-11. b This provides the number of registered solar panels to date (30 June 2014), but as owners can register as late as 12 months after installation, the 2013-14 figures will continue to increase.
2.4 Demand in the large scale industrial sector
The large-scale industrial sector includes aluminium and steel producers, liquefied national gas export and related facilities, paper and chemical producers, large grid-connected mines and water desalination (AEMO 2013g). The large industrial sector is generally less responsive to changes in price than the residential sector in the short term, mainly because it takes much longer to replace large operating machinery and equipment and production processes (AEMO 2013f; Saddler 2013b). Changes in demand in this sector can usually be traced back to the commencement, expansion, or closure of an electricity-intensive operation. There is very little public information about the electricity prices paid by large industrial users as they are negotiated privately. Some large industrial users are transmission-connected customers, so are less exposed to retail and distribution network costs but more exposed to changes in wholesale pricing (National Emissions Trading Taskforce 2006; McLennan Magasanik Associates 2008, AER 2013e; Productivity Commission 2013, p. 109; Energy Users Association of Australia 2012 p.1). As there is no public measure, the Manufacturing Producer Price Index is used to estimate changes in industrial electricity prices over 2012/13-13/14. It shows that electricity price rose by 24 per cent over the two-year period and it is estimated that 15 per cent of this increase was
3 This is calculated using the Clean Energy Council guidelines for average daily output per kilowatt of installed solar photovoltaic across the NEM.

21
directly attributable to the carbon price (Appendix C).
Rising electricity prices, improvements in energy efficiency, the high dollar combined with slower economic growth and sectoral shifts in the economy contributed to a decline in electricity demand in the industrial sector between 2008/09 and 2013/14 (AER 2013d; Vivid 2013; Wood & Carter 2013). The reduction in 2012/13 and 2013/14 was however much larger than recent falls in industrial consumption (AEMO 2014c). The reduction in industrial consumption was concentrated in New South Wales where industrial demand declined by 16 per cent, coupled with a small reduction in Victorian industrial consumption (AEMO 2014c). This decline in industrial consumption in New South Wales was offset by a modest increase in some states, predominantly Queensland driven by the mining and gas sector as well as South Australia (AEMO 2014c). Large industrial companies make up the majority of entities covered under the carbon price and there is strong evidence from a range of surveys to suggest that the carbon price influenced decision making on electricity usage and energy efficiency projects for companies in this sector during the period (AIG 2012, AIG 2013a, ACIL Tasman 2013, Climateworks 2013a, 2013b, 2013c) In 2013, 82 per cent of large industrial energy users4 surveyed indicated the carbon price had a highly or moderately significant impact on their energy efficiency activity (Climateworks 2013a). In an earlier study, 67 per cent of large industrial energy users cited a direct carbon liability as influential in their search for energy efficiency improvements (ACIL Tasman 2013). The carbon price provided an added financial incentive for companies to look at opportunities to switch fuel, upgrade lighting, install energy-monitoring equipment, install renewable energy or co-generation technology or upgrade other plant and equipment (Climateworks 2013a; Climateworks 2013b; AIG 2012; AIG 2013a). It helped reduce barriers preventing the take-up of energy efficiency measures (ACIL Tasman 2013) and increased senior management attention on internal energy use (Climateworks 2013a).
Programs such as the Clean Technology Program also helped to promote change. This program used revenue from the carbon price to co-invest in projects to help manufacturing companies reduce their emissions intensity and develop and commercialize clean technology products, processes and services (Ausindustry 2013; Climateworks 2013a). Five hundred companies undertook projects as part of this program and projects are expected to save up to 3.3 TWh of energy between 2012/13 and 2016/17 (DIICCSRTE 2013b; Climateworks 2013). Industrial consumption in 2012/13-13/14 was also impacted by a number of industrial closures, mainly in New South Wales (AEMO 2014c). Changes in the operations of three energy intensive companies had the greatest impact: Norsk Hydro’s Kurri Kurri aluminium
4 Companies that consume more than 0.5 Petajoules per annum

22
smelter which closed in September/October 2012, Shell’s closure of the Clyde Oil refinery in October 2012 and Bluescope’s changes to production in October 2011. Together, these three industrial changes had the effect of reducing industrial electricity consumption by an estimated 6 TWh over 2012/13-13/14 compared to 2010/11-11/12 (DCCEE 2012c; CER 2012; Saddler 2013b; Australian Institute of Petroleum 2013; DCCEE 2013c).5 The carbon price was not a factor behind the closures at Bluescope or Shell (Shell 2011; Bluescope 2011). Norsk Hydro (which accounts for around 4.8 TWh of the total reduction) did cite the carbon price as a factor that contributed to its closure; however, company statements indicate the decision to close would have been the same regardless of whether the carbon price was in place or not (Norsk Hydro 2012a; Mollan 2012). It is possible, then, that the carbon price impacted on the timing of this decision. For example, a delay in closing of just 6 months would have increased industrial demand by 1.2 TWh.
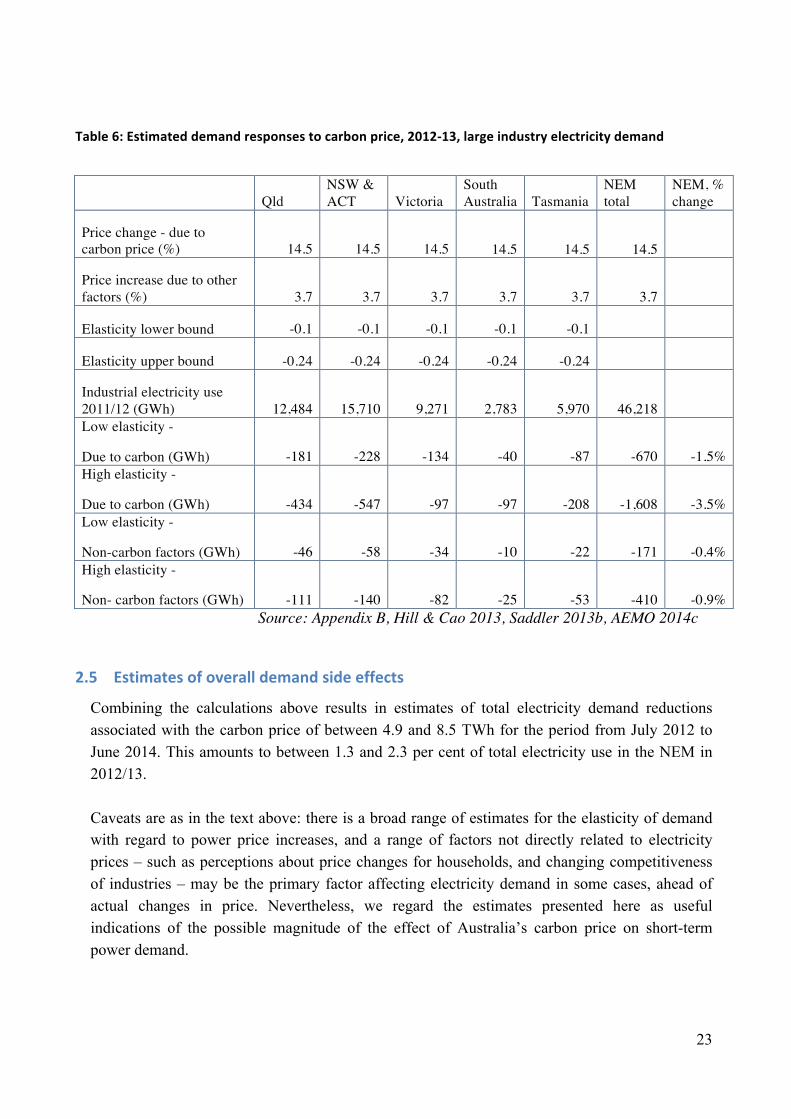
Estimates of large industry demand effects
The carbon price-induced price rise provided industry with an incentive to save energy. As in the case of households and the commercial sector, there are a range of factors influencing energy demand, some of them unrelated to short-term changes in power prices, so attribution of observed changes is difficult. Nevertheless, in the absence of better methodologies, we apply estimated demand elasticities to provide a lower and upper estimate. We assume low and high elasticity of large industry demand of -0.10 and -0.24 respectively as explained in Section 4.2, and apply the same methodology as for household demand effect estimation in Section 4.3. We arrive at a lower bound estimate of 0.7 TWh and an upper estimate of 1.6 TWh for the year 2012/13, equivalent to 1.5 and 3.5 per cent of industrial electricity demand (Table 6). The proportional change estimated is larger than for households and the commercial sector, because the proportional change in electricity prices is larger. This is because industrial users tend to incur much lower costs for power transmission and distribution, so generation related costs (including the carbon price) constitute a much larger share of the total electricity price that applies to industrial users.
5 No public data is available on either Clyde Oil or Port Kembla’s on-grid electricity consumption. This estimate is generated by using data on Scope 2 emissions from the Australian Institute of Petroleum (2013), the National Greenhouse and Energy Reporting Scheme (CER 2012), data on National Greenhouse Account Factors (DCCEE 2013c) and data on electricity consumption from the Australia Institute (Saddler 2013b).
23
Table 6: Estimated demand responses to carbon price, 2012-‐13, large industry electricity demand
Qld NSW & ACT Victoria
South Australia Tasmania
NEM total
NEM, % change
Price change - due to carbon price (%) 14.5 14.5 14.5 14.5 14.5 14.5
Price increase due to other factors (%) 3.7 3.7 3.7 3.7 3.7 3.7
Elasticity lower bound -0.1 -0.1 -0.1 -0.1 -0.1
Elasticity upper bound -0.24 -0.24 -0.24 -0.24 -0.24
Industrial electricity use 2011/12 (GWh) 12,484 15,710 9,271 2,783 5,970 46,218 Low elasticity -
Due to carbon (GWh) -181 -228 -134 -40 -87 -670 -1.5% High elasticity -
Due to carbon (GWh) -434 -547 -97 -97 -208 -1,608 -3.5% Low elasticity -
Non-carbon factors (GWh) -46 -58 -34 -10 -22 -171 -0.4% High elasticity -
Non- carbon factors (GWh) -111 -140 -82 -25 -53 -410 -0.9% Source: Appendix B, Hill & Cao 2013, Saddler 2013b, AEMO 2014c
2.5 Estimates of overall demand side effects
Combining the calculations above results in estimates of total electricity demand reductions associated with the carbon price of between 4.9 and 8.5 TWh for the period from July 2012 to June 2014. This amounts to between 1.3 and 2.3 per cent of total electricity use in the NEM in 2012/13. Caveats are as in the text above: there is a broad range of estimates for the elasticity of demand with regard to power price increases, and a range of factors not directly related to electricity prices – such as perceptions about price changes for households, and changing competitiveness of industries – may be the primary factor affecting electricity demand in some cases, ahead of actual changes in price. Nevertheless, we regard the estimates presented here as useful indications of the possible magnitude of the effect of Australia’s carbon price on short-term power demand.

24
Table 7: Combined estimates for electricity demand
2012/13 Low estimate High estimate
Impact on households & commercial sector demand (GWh)
-1,797 -2,630
Impact on industrial demand (GWh) -670 -1,608
Total impact on demand (GWh) -2,467 -4,239 Households and commercial sector -1.3% -1.9% Industry -1.5% -3.5% Total % of 2012-13 demand 1.3% 2.3%
2012-13 and 2013-14 combined
Households and commercial sector (GWh) -3,595 -5260
Industry (GWh) -1,340 -3,217 Total (GWh) -4,935 -8,477
Note: Data from Tables 4 and 6. Total NEM electricity demand in 2011-12 is 191.3 GWh. To calculate the estimated two-year impact, we assume that the same effect on demand occurred in both years.
3 Electricity generation
Whilst declining demand is an important source of abatement in the short term, significant changes are needed on the supply-side to achieve substantial long-term emissions reductions (Treasury 2011, p.121). Government policy can influence the electricity supply mix over the long term, creating an environment in which the construction and operation of lower or zero carbon power plants – namely gas, renewables and where applicable nuclear power – are more attractive than others (Vivid Economics 2013).
3.1 Carbon pricing and the composition of electricity supply: theory
The carbon price affects the economics of generation, increasing the cost of producing electricity for any form of generation that produces CO2 emissions, and relatively more for the most emissions intensive plants, namely brown coal and inefficient black coal power plants. As brown coal, followed by black coal, has historically been the cheapest form of electricity generation, coal has rarely represented the marginal (most expensive) unit of production (AEMC 2012b; Daley & Edis 2011). Instead, electricity from less emissions-intensive sources, in particular gas, has usually represented the marginal unit. As the carbon price is based on the emissions-intensity of the generator, it places the heaviest burden on brown coal generators followed closely by black coal. The cost burden imposed on natural gas suppliers is less than half that imposed on brown coal, and renewable generators face no additional cost. Generators who face higher generation costs then pass these costs onto

25
the wholesale market in the form of higher pool and contract prices; the generator with the highest marginal cost at any one time – usually an open cycle gas fired turbine plant – sets the price in the NEM spot market. 6 Less emissions-intensive forms of generation become relatively more profitable, and high emissions generators less profitable to operate. This leads to changes in the dispatch or merit order. More emissions intensive generators will reduce their hours of operation, and at a high enough carbon price, some of the most emissions-intensive coal generators may be taken off the grid altogether.
3.2 Changes in electricity generation after the introduction of the carbon price
Since the introduction of the carbon price there have been significant changes in the composition of electricity supplied to the NEM. Electricity generated from renewables and gas increased whilst the share of electricity generated from black and brown coal reached a record low (Figure 6; Pitt & Sherry 2014a; Pitt & Sherry 2014b). Comparing the years 2011/12 and 2012/13, the amount of coal fired generation decreased by 11 TWh, with a particularly large decrease in brown coal fired generation (Figure 6). Renewables and gas generation by contrast increased in absolute terms. The Climate Institute (2014) finds that renewable energy increased 38 per cent since June 2012. Electricity generation from wind reached it’s highest ever level in 2013/14 (Pitt & Sherry 2014b). The fall in brown coal is of most significance as the proportion of electricity generated from black coal had been declining before the introduction of the carbon price; but the proportion generated from brown coal had been relatively stable until July 2012 (Pitt & Sherry 2013b). The carbon price changed this. As the executive manager one of Australia’s largest and most emissions-intensive generators explained, the introduction of the carbon price ‘represent[ed] a new era in the management of brown coal fired generation’ (EnergyAustralia 2013b).
6 At times of peak demand, hydroelectricity – a storable form of renewable energy – tends to set the price in the wholesale market.

26
Figure 6: Change in composition of electricity generation after introduction of the carbon price
Table 8: Composition of electricity generated in the NEM (%)7
10/11 (TWh)
10-11 (%)
11/12 (TWh)
11/12 (%)
12/13 (TWh)
12/13 (%)
Brown coal 55 26.8 55 27.2 48 24.6 Black coal 107 51.8 105 52.1 101 51.5 Gas & Liquids
23 11.1 22 10.9 23 11.8
Wind & Water
21 10.2 19 9.6 24 12.1
Source: Pitt & Sherry 2014a; AEMO 2013i; Pitt & Sherry 2014b; AEMO 2014c.
Black and brown coal generators
A number of brown and black coal generators reported that the carbon price significantly increased operating expenses and reduced their company’s profitability, with some indicating that, combined with the renewable energy target, it will lead to a delay in new investment in coal-fired generation (Macquarie Generation 2013; CS Energy 2013; Stanwell 2013a; Stanwell 2011; Alinta 2012c). Companies that reported a decline in profitability largely attributed it to the carbon price and weaker demand, reporting losses of between 7 and 82 per cent in 2012-13 (Macquarie Generation 2013; CS Energy 2013; Stanwell 2013a).
Higher operating costs, increased competition from less emission-intensive generators, and lower demand, also caused a number of black and brown coal–fired generators to reduce
7 Public data for 2013-14 electricity supply on an ‘as generated’ basis won’t be released by AEMO until later this year.
0
25
50
75
100
125
150
175
200
2010/11 2011/12 2012/13
TWh (as generatedd)
Wind and water
Gas and liquids
Black coal
Brown coal
27
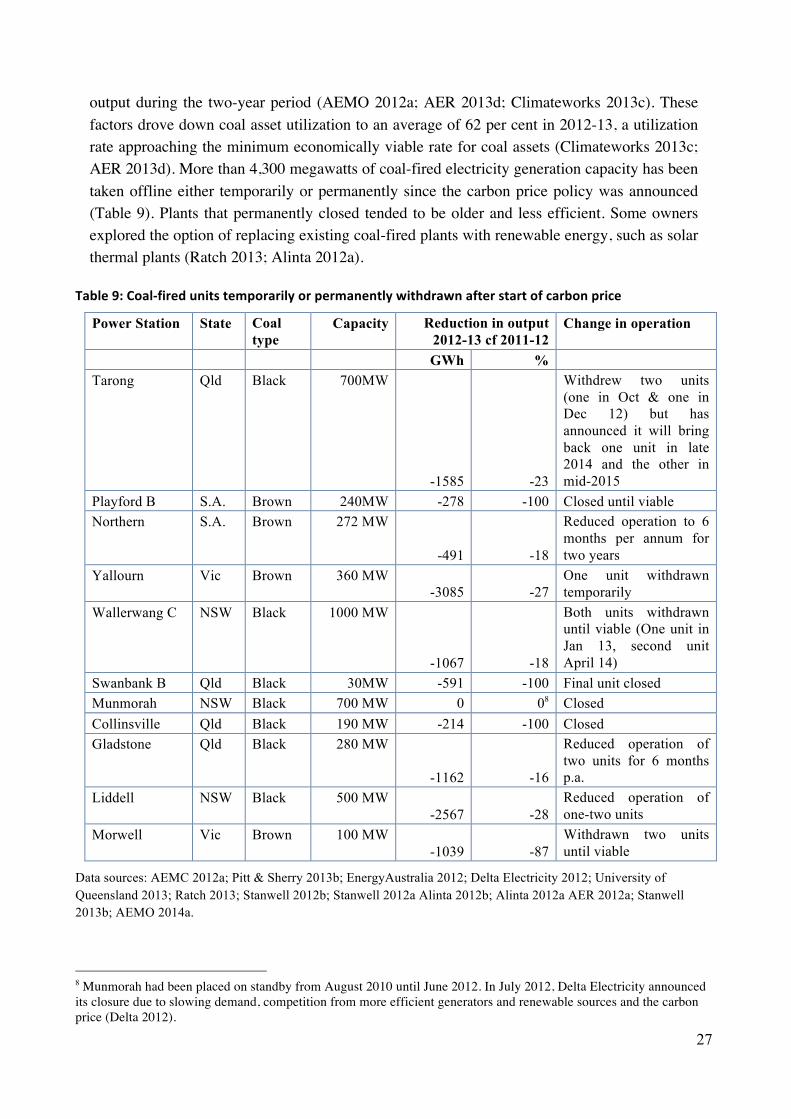
output during the two-year period (AEMO 2012a; AER 2013d; Climateworks 2013c). These factors drove down coal asset utilization to an average of 62 per cent in 2012-13, a utilization rate approaching the minimum economically viable rate for coal assets (Climateworks 2013c; AER 2013d). More than 4,300 megawatts of coal-fired electricity generation capacity has been taken offline either temporarily or permanently since the carbon price policy was announced (Table 9). Plants that permanently closed tended to be older and less efficient. Some owners explored the option of replacing existing coal-fired plants with renewable energy, such as solar thermal plants (Ratch 2013; Alinta 2012a).
Table 9: Coal-‐fired units temporarily or permanently withdrawn after start of carbon price
Power Station State Coal type
Capacity Reduction in output 2012-13 cf 2011-12
Change in operation
GWh % Tarong Qld Black 700MW
-1585 -23
Withdrew two units (one in Oct & one in Dec 12) but has announced it will bring back one unit in late 2014 and the other in mid-2015
Playford B S.A. Brown 240MW -278 -100 Closed until viable Northern S.A. Brown 272 MW
-491 -18
Reduced operation to 6 months per annum for two years
Yallourn Vic Brown 360 MW -3085 -27
One unit withdrawn temporarily
Wallerwang C NSW Black 1000 MW
-1067 -18
Both units withdrawn until viable (One unit in Jan 13, second unit April 14)
Swanbank B Qld Black 30MW -591 -100 Final unit closed Munmorah NSW Black 700 MW 0 08 Closed Collinsville Qld Black 190 MW -214 -100 Closed Gladstone Qld Black 280 MW
-1162 -16
Reduced operation of two units for 6 months p.a.
Liddell NSW Black 500 MW -2567 -28
Reduced operation of one-two units
Morwell Vic Brown 100 MW -1039 -87
Withdrawn two units until viable
Data sources: AEMC 2012a; Pitt & Sherry 2013b; EnergyAustralia 2012; Delta Electricity 2012; University of Queensland 2013; Ratch 2013; Stanwell 2012b; Stanwell 2012a Alinta 2012b; Alinta 2012a AER 2012a; Stanwell 2013b; AEMO 2014a.
8 Munmorah had been placed on standby from August 2010 until June 2012. In July 2012, Delta Electricity announced its closure due to slowing demand, competition from more efficient generators and renewable sources and the carbon price (Delta 2012).

28
In each of the above cases, company statements cited the carbon price and/or changed market conditions following the carbon price as a contributing factor to their decision to withdraw units or cease operations (sources: see notes to Table 8). Similarly, the Australian Energy Market Commission (AEMC) and the Australian Energy Regulator concluded these changes in operation were driven by a combination of the carbon price, falling demand and the renewable energy target (RET) (AEMC 2012a; AER 2012a; AER 2013d). AEMO (2013h), placed a much stronger emphasis on the carbon price being behind these changes, with modelling suggesting that coal-fired generation would be 16 TWh higher in 2014-15 if the carbon price is repealed (AEMO 2013h). In addition to the 11 black and brown coal generators that announced a permanent or temporary withdrawal of capacity (Table 9), a further eight black and brown coal-fired generators reduced output without officially taking any units offline (Table 10, see generators*) and another six generators increased output (Table 10), although generators that increased output tended to be less emissions-intensive.9 In net terms, coal-fired generation declined by 11.2 TWh in 2012-13, mainly driven by a reduction in brown coal (Table 10). This compares to a decline of 3 TWh in coal-fired generation on average over the three years prior to 1 July 2012, mainly driven by a reduction in black coal (AEMO 2013i). The largest reduction in 2012-13 (3.1 TWh) came from the Yallourn power station. This decline was caused in part by a decision to withdraw one of its four units, which the executive manager said was “an example of the carbon price working to reduce Australia’s emissions”, although weaker demand and the renewable energy target were also contributing factors (EnergyAustralia 2012). The 3.1 TWh reduction was also partly caused by reasons completely unrelated to the carbon price, including a flood to the power station (June-Sept 2012), which reduced output by 0.72 TWh over the first quarter of 2012-13 (compared to output for the remainder of 2012-13) and ongoing industrial action (EnergyAustralia 2013c). However, the flood also reduced output by 0.69 TWh in the last quarter of 2011-12, so when comparing the change in brown coal generation in 2012-13 versus 2011-12, the impact of the Yallourn flood is insignificant.
9 Generators that increased production averaged 960 kg/CO2 p/MWh whilst those that reduced output produced 1000 kg/CO2 per MWh in 2012-13.

29
Table 10: Changes in electricity output of all coal-‐fired generators in 2012-‐13
Fuel source
Station Change in output (GWh)
Change in output in 2012-13 (%)
Blac
k co
al
Swanbank B -591 -100 Collinsville -214 -100 Liddell -2567 -28 Tarong -1585 -23 Wallerawang C -1067 -18 Gladstone -1162 -16 Callide C -426 -8 Mt Piper* -389 -4 Eraring* -480 -4 Callide B* -125 -3 Bayswater* -259 -2 Tarong North* -15 -1 Munmorah 0 0 Redbank 36 3 Stanwell 846 12 Millmerran 1194 20 Kogan Creek 995 21 Vales Point B 1488 25 Black coal total -4321 -4.1
Brow
n co
al
Playford B -278 -100 Morwell (Energy Brix) -1038 -87 Yallourn W -3085 -27 Northern -491 -18 Anglesea* -142 -11.5 Hazelwood* -1286 -10 Loy Yang A* -879 -5 Loy Yang B 290 3
Brown coal total -6909 12.6
Total (black & brown coal) -11230 -7.0
*Reduced capacity without taking units offline. Source: AEMO 2013i
Renewable generation and policy uncertainty
The carbon price is likely to have had only limited impact on both capacity and supply of renewable energy due to ongoing political uncertainty about the scheme’s future. New renewable generation projects can take 2-5 years, often longer, to develop and construct (Infigen 2013), and decades for revenues to return the up-front capital. Political uncertainty impaired the ability of the carbon price to provide a stable, long-term price signal, which would encourage new renewable investment. Just under 1.2 TW of renewable generation capacity was added to the market in the two years after the carbon price was introduced. The Renewable Energy Target was the primary driver
30
behind this new capacity, although there is some anecdotal evidence of the carbon price having provided additional impetus (Hydro Tasmania 2011; Origin 2012; EcoGeneration 2011). With greater long-term certainty, the carbon price would have factored more heavily into new electricity investment decisions. The owners of black and brown coal-fired generators who took units offline temporarily, would have had a greater incentive to close units permanently. Given the carbon price has only been in operation a short time, and given the unstable environment in which it’s operated, the carbon price has not been able to materially change the composition of generating capacity in the NEM in 2012/13-2013/14. It has, however, impacted on the composition of electricity supplied from existing generators. As coal-fired generators temporarily or permanently withdrew units, the carbon price provided an incentive for existing renewable generators to increase output (Delta 2013), with wind and hydro both reaching record highs at various points throughout 2012-13 and 2013-14 (Reputex 2013a). The ongoing uncertainty may have impaired the long-term price signal, but it amplified the carbon-price signal over the short-term, particularly for hydroelectricity generators. With the knowledge that the policy may be short-lived, hydroelectricity generators rushed to take advantage of higher prices in 2012/13. Hydroelectricity increased 36 per cent in 2012/13 as a result (AEMO 2013d). This boosted the share of renewable energy generation to higher levels than otherwise may be experienced if generators were certain that the fixed price would be in place for a long period. This strong increase was also due to good rainfall catchment (AER 2013d) and market strategies employed by large-scale hydro generators in the lead up to the carbon price (Hydro Tasmania 2013). Once the carbon price was legislated in late 2011, some hydro producers conserved water until July 2012 when they were able to sell electricity at an inflated price (Hydro Tasmania 2013, p.22; Saddler 2013a). The increase in hydroelectricity production in 2012/13-2013/14 was expected and was an example of the carbon price doing exactly as intended, making it more appealing for renewable generators to produce more power. However, the strategy of preserving water supplies in 2011-12 had the effect of increasing the impact of the carbon price somewhat artificially (Frontier Economics 2013a). Preserving water supplies and thereby reducing hydro output in 2011-12, had the effect of lowering overall generation from renewables in 2011-12, making the 2012-13 increase in renewable seem larger as it was coming off a slightly lower base. It is difficult to quantify the impact of this factor, particularly as hydro production is highly variable from year to year depending on rainfall. ACIL Allen (2013a) modeling indicates that hydroelectricity generation was around 0.5 TWh lower in 2011-12 because of the anticipated carbon price. In its place, gas stepped in to contribute the additional supply needed (ACIL Allen

31
2013a, Figure ES2 & Figure ES3).10 The changes to the generation mix witnessed in 2012/13 and 2013/14 are likely to continue whilst the carbon price policy remains in place (Reputex 2013c). Whilst some coal-fired generating units have been taken offline permanently, most were only withdrawn temporarily, meaning some of these changes are likely to be reversed if the carbon price is repealed as the merit order will revert back to the way it was pre-2012.
4 Emissions intensity of electricity supply
The reduction in coal-fired generation, combined with the increase in generation from renewable energy and gas, led to a significant reduction in the overall carbon intensity of the market (AEMC 2013b). This shift represents an increase in the overall efficiency of the market; meaning fewer emissions are produced for every megawatt hour of electricity generated. In the two years following the introduction of the carbon price, for every megawatt hour of electricity generated, an average of 868 kilograms of carbon dioxide (CO2/MWh) was produced compared with 910 CO2/MWh on average during 2010/11 and 2011/12, a decline of 4.6 per cent. As we show here, much, but not all, of this change is attributable to the carbon price. The emissions intensity of the national electricity market has been gradually declining for over a decade, due to an increase in gas-fired and renewable electricity generation, as well as improvements in the carbon intensity of fossil-fuel inputs. In 2005-6, Tasmania joined the NEM, which had a large impact on supply as the majority of Tasmania’s electricity comes from renewable sources. With the exception of 2005-6, the emissions intensity of the NEM has declined on average by 0.7 per cent per annum over the past ten years. The decline had been steeper between 2009/10-2011/12 (1.8 per cent per annum on average) mainly driven by falling generation from black coal and an increase in gas (AEMO 2013i).
Table 11: Emissions intensity of NEM
Year Emissions intensity
kg CO2 /MWh % Change (Year on
Year) 2006/07 966 0.7 2007/08 973 0.7 2008/09 968 -0.4 2009/10 936 -3.4 2010/11 903 -3.5 2011/12 917 1.5 2012/13 875 -4.5 2013/14 860 -1.7
Data source: AEMO 2005, AEMO 2006, AEMO 2007, AEMO 2008, AEMO 2009, AEMO 2010b, AEMO 2011, AEMO 2012b, AEMO 2013a, AEMO 2014b
10 This is based on Australia-wide data on hydroelectricity rather than NEM specific hydroelectricity. However, more than 9mt of Australia’s hydro is generated from within the NEM, so Australia-wide figures should be almost identical to NEM figures with regards to hydro generation (Clean Energy Regulator 2013d).

32
With the exception of 2005-6, the decline in 2012/13 represents the largest fall in emissions-intensity on public record and, even after this large decline, emissions-intensity continued to fall further in 2013/14. On 2 October 2013, the lowest daily emission-intensity in the NEM was also recorded when 778 kilograms of carbon dioxide was produced per megawatt hour.
Figure 7: Average emission-‐intensity of the National Electricity Market pre and post carbon price
Data source: AEMO 2010b, AEMO 2011, AEMO 2012b, AEMO 2013a, AEMO 2014b
4.1 Impact of the carbon price on emissions intensity of power supply
The carbon price not only contributed to fuel switching between coal, gas and renewable sources, as discussed above, but also between different generators within each broad category. For example, the carbon price led Delta electricity to prioritize the purchase of coal with a higher energy-to-emissions ratio (Climateworks 2013c). Some generators found the carbon price forced them to look at ways to increase their plant’s efficiency and research and develop new technologies (Delta 2013; Stanwell 2011). These changes also contributed to the reduction in emission-intensity post 1-July 2012, although their contribution was much smaller than the contribution of fuel-switching itself. Under the carbon price, brown coal generators paid a $28 to $35 carbon cost per megawatt hour in 2012-13; whereas natural gas generators paid around $12 per megawatt hour; and renewables did not pay a carbon price (Combet 2013). Data from the Australian Energy Regulator finds that annual volume weighted average spot prices across the NEM rose from $33 in 2010/11-11/12 to $59 during 2012/13-2013/14, on average (Appendix B). Renewable generators and gas generators have thus been able to sell to the market at much higher prices despite only facing a comparatively small or no increase in costs. This led to some shifts in the overall merit order.
903
917
875
860
840
860
880
900
920
2010/11 2011/12 2012/13 2013/14
Kg per MWh

33
In the NEM, generators provide a bid detailing how much electricity they are willing to provide and at what price. AEMO then accepts these bids, starting from the lowest priced bid up to the point where demand equals supply (RBA 2013). Figure 8 (below) provides an indication of the merit order before the carbon price was introduced. It illustrates that brown coal, followed by black coal, had the lowest short-run marginal costs almost without exception. Most gas-fired generators had significantly higher costs. Therefore, it is likely that electricity would have been dispatched in the following order pre July 1 2012: brown coal, black coal, followed by gas.
Figure 8: Fossil-‐fuel merit order without carbon price
Source ACIL Tasman 2009
Once a carbon price is factored in, the order shifts slightly, and some gas-fired generators are able to compete more readily with brown and black coal as the overall gap between the short-run marginal costs for coal and gas narrows (Figure 9 below provides an indication). There is a shift away from emissions-intensive brown coal towards black coal. There is also a shift within each fuel source; for example, a black coal plant that uses coal with a higher energy-to-emissions ratio, will be more competitive than other black coal plants and consequently progress up the merit order. Renewable sources tend to have high up-front capital costs but low short-run marginal costs and were thus able to continue to bid into the market and receive higher spot prices in return. As a result of the shift in the merit order in 2012/13-13/14, the greatest absolute decline in electricity generation came from brown coal followed by black coal; whilst the greatest increase came from renewables followed by gas.
$0
$10
$20
$30
$40
$50
$60
$70
Brown coal Brown coal Brown coal Brown coal Brown coal Black coal Gas Brown coal Black coal Black coal Black coal Black coal Black coal Black coal Black coal Black coal Black coal Brown coal Black coal Black coal Black coal Black coal Black coal Black coal Brown coal Gas Black coal Gas Gas Gas Gas Gas Gas Gas Gas Gas Gas Gas Gas Gas Gas Gas Gas Gas Gas Gas Gas Gas Gas Gas Gas
Short-‐run margina
l cost $
/MWh
Fossil-‐fuel generators with short-‐run marginal costs under $70/MWh (in 2009/10 $)
Brown coal Black coal Gas

34
Figure 9: Fossil-‐fuel merit order with $23 carbon price
Source ACIL Tasman 2009
Whilst the average emissions intensity of electricity fell significantly after 1 July 2012, the emissions intensity of the marginal unit increased (AEMC 2012b). In the NEM, prices are set at the cost of the last and most expensive megawatt supplied to the grid and the generator of that unit is known as the ‘marginal generator’ (NERA Economic Consulting 2013). Because brown coal and black coal are relatively inexpensive to operate in the absence of a carbon price, they rarely represented the marginal unit before 2012. Therefore, when new capacity was added from renewable sources (as mandated by the RET) it would displace other electricity generated further up the marginal abatement cost curve, such as gas, not brown coal (AEMC 2012b). Post-1 July 2012, the combination of the RET and the carbon price increased the marginal generating cost for all non-renewable electricity generators, making it more likely that new renewable energy will displace more emissions-intensive generation than it did previously (AEMC 2012b; BREE Economics 2012; AEMO 2012a).
4.2 Factors other than the carbon price driving the reduction in carbon intensity
We estimate the impact of the carbon price on emissions intensity as the residual after accounting for other factors influencing emissions intensity. The emissions intensity of the NEM had been gradually declining before the introduction of the carbon price due to an increase in gas-fired and renewable electricity generation, a reduction in black coal-fired generation, as well as improvements in both the carbon intensity of fuel inputs and how efficiently fuels were used. The increase in renewables was mainly driven by government policies such as the Renewable Energy Target, whilst the shift in fossil fuels was mainly driven by the Queensland Gas Scheme and New South Wales Greenhouse Gas Reduction
$0
$10
$20
$30
$40
$50
$60
$70
$80
Short-‐run margina
l cost p
/MWh
Fossil-‐fuel generators with short-‐run marginal costs of under $80 (2009/10 $)
Gas
Black coal Brown coal

35
Scheme (GGAS) (Vivid 2013). Modeling of the Australian electricity sector, including the Western Australian and Northern Territory grids, found that recent declines in the emissions intensity of electricity were primarily driven by an increase in renewables generation (accounting for 51 per cent) and changes in the fossil mix (accounting for 33 per cent) (Vivid 2013). The remainder was driven by increases in fuel efficiency and carbon intensity; in other words, the quality of the fuel used and the way it was used.11 Between 2006/07-2010/11, emissions intensity in the NEM declined for similar reasons, averaging a decline of 16 kg/MWh per year. For the purpose of this analysis, we assume that half (8kg/MWh) of this decline was due to renewables supply growth driven by the RET, a third (5kg/MWh) was due to changes in the fossil fuel mix and the remainder (3kg/MWh) was driven by changes in the fuel and carbon intensity. We further assume that the pre-existing downward trend in emissions intensity driven by the RET and improvements in fuel and carbon intensity continued in 2012/13 and 2013/14. We assume the pre-existing downward trend related to changes in fossil fuel mix slowed as it was primarily policy driven by the NSW GGAS and Queensland Gas scheme (Vivid 2013). The GGAS ended in 2012 and the Queensland Gas scheme ended in 2013, with both state governments citing reliance on the carbon price to drive further changes in fossil fuel mix. Therefore, we estimate that changes in the fossil fuel mix, not related to the carbon price, only contributed to a 2-kilogram decline in 2012/13 and no decline in 2013/14.
The assumptions on the effect of the RET can be compared with estimates of the emissions reductions effect of the RET by SKM MMA (2012). This analysis showed the annual incremental effect of the RET at about 0.8 MtCO2 (equivalent to a 5 kg/MWh reduction in emissions intensity) from 2010 to 2011, and 1.2 MtCO2 (7 kg/MWh) from 2011 to 2012. A further factor in emissions intensity of the grid around the time of the introduction of the carbon price, identified by many observers, was the flooding of the Yallourn power station, one of the most emissions-intensive power plants in Australia. The flooding (5 June to 29 September 2012) took the station offline and contributed to the drop in emissions intensity and overall emissions in 2012-13. Yallourn first started flooding at the beginning of June 2012, at which point emissions and output dropped significantly, causing a 4kg CO2/MWh drop in emissions intensity in 2011-12. The flood continued in 2012-13 until the end of September reducing emissions-intensity by a further 5kg CO2/MWh in 2012-13. On this basis, the net change from 2011-12 to 2012-13 is just 1kg CO2/MWh.
11 The RET was expanded in 2009.

36
Figure 10: Emission intensity change before, during and after the period of the Yallourn flood
A further factor was “water shifting” by hydroelectric power producers, who preserved water (and produced less hydroelectricity) in the lead-up to the carbon price. Stored water was used to produce more electricity after the start of the carbon price, when it attracted higher prices in the wholesale market. Additional gas-fired power was generated to fill the gap left by hydroelectricity (which is mostly used during peak demand, and is thus not usually substituted with coal fired power). The effect was a 2kg CO2/MWh increase in the emissions intensity of the grid during 2011-12. In addition, the water that had been shifted from 2011-12 to 2012-13 was used to generate additional hydroelectricity in 2012-13 which lowered emissions intensity by an additional 2 kg CO2/MWh, as it displaced generation from non-renewable sources. The full effect of “water shifting” was therefore a reduction in emissions intensity of the grid of 4 kg CO2/MWh. In net terms, the flood and shift in hydro meant emissions intensity was 2kg CO2/MWh lower than it otherwise would have been in 2011-12 and 7kg lower than otherwise would have been in 2012-13. It is likely that supply-side responses were limited to shorter-term aspects such as dispatch and temporary closure of high-emitting generators, because of ongoing policy uncertainty. Decisions regarding which fuel source to use for a new power-plant or whether to overhaul operating practices at large industrial companies take much longer to implement and the return on investment can hinge on the carbon price. Therefore, for a price signal to work effectively, long-term certainty is key. At the introduction of the carbon price in mid-2012, a survey found that 40 per cent of experts, including decision makers at liable entities under the Australian carbon pricing mechanism, expected the scheme to be repealed by 2016 (Jotzo et al 2012).
903
921
864
917
850
884 875
860
840
860
880
900
920
2010/11 11/12 Pre-‐Flood
11/12 During Flood
2011/12 Avg
12/13 During Flood
12/13 Post-‐Flood
2012/13 Avg
2013/14
Kg per MWh

37
4.3 Estimates of the impact on emissions intensity
As shown in section 5, the carbon price had a significant impact on the composition of electricity supplied in the NEM and the overall merit order of generation. It is difficult to construct a precise quantitative estimate of these effects. However, the analysis above allows us to estimate the magnitude of this effect by subtracting the estimated effects of other factors – namely the RET, non-carbon related changes in the fossil fuel mix, the Yallourn flooding and water shifting by hydro power producers – from the observed reductions in emissions intensity over time. On this basis, we estimate that the reduction in emissions intensity attributable to the impact of the carbon price was 24kg CO2/MWh (2.7 per cent) in 2012/13, and an additional 4 kg CO2/MWh (for a total of 28kg CO2/MWh) (3.3 per cent) in 2013/14. This estimate relies on a number of assumptions about causes of different changes and the magnitudes of their effects, and on the absence of additional factors not considered here. In making our estimates, we have made conservative assumptions about the impact of the carbon price. Nevertheless, for the purpose of the estimates of overall emissions reductions we treat the estimate as an upper bound. We posit a lower bound one third below, thus for the lower bound we assume that one third of the residual is attributable to other factors that are unknown to our analysis, or that the known factors other than the carbon price are underestimated.
Table 12: Assumptions about factors in annual incremental changes to emissions intensity of the NEM
Change in 2012-13 compared to 2010/11-12 (kg
CO2/MWh)
Change in 2013-14 compared to 2012-13 (kg CO2/MWh)
Notes
Total -42 -15 NEM data Carbon price (high)
-24 -4 Calculated as residual of changes below; treating this as upper bound, assuming a lower bound of two thirds of this estimate
Carbon price (low)
-16 -3 4.3.1.1.1 Lower bound, comprising two thirds of the high estimate.
RET -8 -8 4.3.1.1.2 Extrapolation of estimates, see text. Changes in fossil fuel mix (not attributable to carbon price)
-2 -0 4.3.1.1.3 Extrapolation of estimates, see text.
Underlying carbon and fuel intensity improvements
-3 -3 Extrapolation of estimates, see text.
Yallourn flooding
-1 0 Observed reductions in output during flooding episode across the years 2011-12 and 2012-13
Hydro water shift
-4 0 Observed shifts in hydro generation from 2011-12 to 2012-13
38
5 Emissions from the electricity sector
Annual CO2 emissions in the NEM fell by 3.6 per cent in 2013-14 and 6.7 per cent in 2012/13, a combined decrease of 29 MtCO2 or 8.2 per cent of NEM emissions over the two years following 1 July 2012, compared to the preceding two-year period preceding (AEMO 2013d). The calculations in the preceding sections allow us to estimate the effect of the carbon price on emissions, as distinct from other factors (Table 13). On the demand side, we estimate that reductions in electricity use of between 4.9 and 8.5 TWh (or 1.3 and 2.3 per cent per annum) over the two years are attributable to the carbon price. Given the average emissions intensity of the grid, this translates to an emissions saving between 4.3 and 7.3 MtCO2. On the supply side, we estimate that the carbon price resulted in a reduction in emissions intensity of the NEM between 16 and 24 kg/MWh (or 1.8 and 2.7 per cent) during 2012-13 and 19 to 28 kgCO2/kwh (2.2 – 3.3 per cent) during 2013-14. This translates to an emissions saving between 3 and 4.5 MtCO2 in 2012/13 and 3.4 and 5.1 MtCO2 in 2013-14. Therefore, the combined impact attributable to the carbon price is estimated as a reduction of between 5 and 8 million tonnes of CO2 emissions (3.2 to 5 per cent) in 2012/13 and between 6 and 9 million tonnes (3.5 to 5.6 per cent) in 2013/14, and between 11 and 17 million tonnes cumulatively. The effects of the carbon price in reducing electricity sector emissions would likely be significantly greater if there was an expectation that the carbon price would remain over time. Policy uncertainty, in particular the prospect that the carbon price would be repealed, has greatly diminished the incentive to invest in long-lived assets that run at lower emissions than the alternatives. This is important in particular in electricity supply. The carbon price in Australia is likely to have resulted mainly in short-term changes such as altered patterns of electricity dispatch and temporary closures of power stations. If the carbon price had been considered a stable policy likely to remain in place over relevant investment horizons, it is likely to have resulted in additional investment in low-emissions generation assets, and in more permanent closures of inefficient, high-carbon generators. Quantifying this potential effect is beyond the scope of this ex-post analysis.

39
Table 13: NEM emissions and estimated changes attributed to the carbon price
NEM emissions,
MtCO2
Estimated demand side reductions from carbon
price, MtCO2
Estimated supply side reductions from carbon
price, MtCO2
Estimated overall reductions from carbon
price, MtCO2
Low estimate
High estimate
Low estimate
High estimate
Low estimate
High estimate
2001-02 165.9
2002-03 170.5 2003-04 175.5 2004-05 177.4 2005-06 180.5 2006-07 184.2 2007-08 186.2 2008-09 188.0 2009-10 182.3 2010-11 174.8 2011-12 175.3 2012-13 163.7 -2.2 -3.7 -3.0 -4.5 -5.2 -8.2 2013-14 157.8 -2.1 -3.6 -3.4 -5.1 -5.5 -8.8
Source: Emissions data: AEMO 2001, AEMO 2002, AEMO 2003, AEMO 2004, AEMO 2005, AEMO 2006, AEMO 2007, AEMO 2008, AEMO 2009, AEMO 2010b, AEMO 2011, AEMO 2012b, AEMO 2013a, AEMO 2014b; Emissions reduction – author’s own calculations see preceding sections.

40
Figure 11: NEM emissions – Actual and scenarios without estimated effect of carbon price
Source: Scenarios without carbon price: authors’ calculations; actual emissions: AEMO 2001, AEMO 2002, AEMO 2003, AEMO 2004, AEMO 2005, AEMO 2006, AEMO 2007, AEMO 2008, AEMO 2009, AEMO 2010b, AEMO 2011, AEMO 2012b, AEMO 2013a, AEMO 2014b
6 Conclusion
We have provided an assessment of the effect of Australia’s carbon price on electricity demand and supply in the National Electricity Market (NEM). The analysis covers the period 1 July 2012 to 30 June 2014, the first two years of operation of the scheme. Over this period, electricity demand in the NEM declined by 3.8 per cent, the emissions intensity of electricity supply declined by 4.6 per cent, and overall emissions by 8.2 per cent, compared to the two-year period before the introduction of the carbon price.
We find that the carbon price reduced power demand from both households and industry in response to increased electricity prices, and led to lower average emissions intensity of electricity supply, which together have meant significant reductions in carbon dioxide emissions from Australia’s power sector. Household electricity prices rose by an average of 10 per cent and industrial electricity prices rose by an estimated 15 per cent across the NEM, as a result of the carbon price. Other factors resulted in further price increases. We estimate that in response to the carbon price, households, businesses and industrial collectively reduced their electricity use by 2.5 and 4.2 TWh per year since the introduction of the carbon price, about 1.3 to 2.3 per cent of total electricity demand in the NEM in 2012/13.
140$145$150$155$160$165$170$175$180$185$190$195$
2001+02$
2002+03$
2003+04$
2004+05$
2005+06$
2006+07$
2007+08$
2008+09$
2009+10$
2010+11$
2011+12$
2012+13$
2013+14$
MtCO2$
Without$carbon$price$+$high$es?mate$$
Without$carbon$price$+$low$es?mate$$
Actual$NEM$emissions$

41
We find that the carbon price has resulted in changes in the merit order and dispatch of power stations, with a number of high emissions plants taken out of operation. We estimate that the shifts in the supply mix likely attributable to the carbon price resulted in a 16 and 24 CO2 kg/MWh reduction in the emissions intensity of power supply in the NEM in 2012-13 or between 1.8 - 2.7 per cent and a 19 to 28 kgCO2/MWh reduction during 2013-14 (2.2 – 3.3 per cent). We estimate that the combined impact attributable to the carbon price was a reduction of between 5 and 8 million tonnes of CO2 emissions (3.2 to 5 per cent) in 2012/13 and between 6 and 9 million tonnes (3.5 to 5.6 per cent) in 2013/14. In cumulative terms, this represents an 11 to 17 million tonne reduction over the two years following 1 July 2012. All of these estimates are subject to fundamental difficulty in attributing observed changes to a particular cause, in particular over a short period of time. We have used conservative assumptions in deriving our estimates. Due to policy uncertainty, the carbon price is likely not to have resulted in significant impacts on investment in low carbon power generation assets, and permanent closure of high emissions generators. If markets had had the expectation that the carbon price was to remain in place, larger emissions reductions than estimated here would have eventuated. The power sector is the largest source of emissions in Australia’s emissions profile, and it is the greatest potential source of emissions reductions. Hence, any effective and cost-effective policy to reduce Australia’s greenhouse gas emissions needs to centrally involve electricity sector. Australia’s carbon pricing mechanism was designed to do so. In the first two years of its operation, it was demonstrably successful in reducing power sector emissions, both on the supply and the demand side. It stands to reason that the very existence of a carbon price has an effect in reducing emissions, because it focuses attention on emissions and on options to reduce them. However, ongoing political uncertainty has limited the ability of the carbon price to provide the stability and certainty investors and large industries need. Had there been ongoing bipartisan support for the carbon pricing mechanism (or its proposed predecessor in 2009), it is possible that substantial structural changes in electricity supply and within key industrial electricity consumers would already be underway. At the time of writing at the start of July 2014, it appears highly likely that the carbon pricing mechanism will be repealed in the Australian parliament. The ex-post analysis in this paper supports the notion that a carbon price is central to effective and cost-effective climate change mitigation in the power sector. The carbon price has worked as expected in terms of its short-term impacts. For a carbon price to have its full effect, a long-term expectation of carbon pricing is needed. That in turn requires a stable and politically uncontested policy framework.
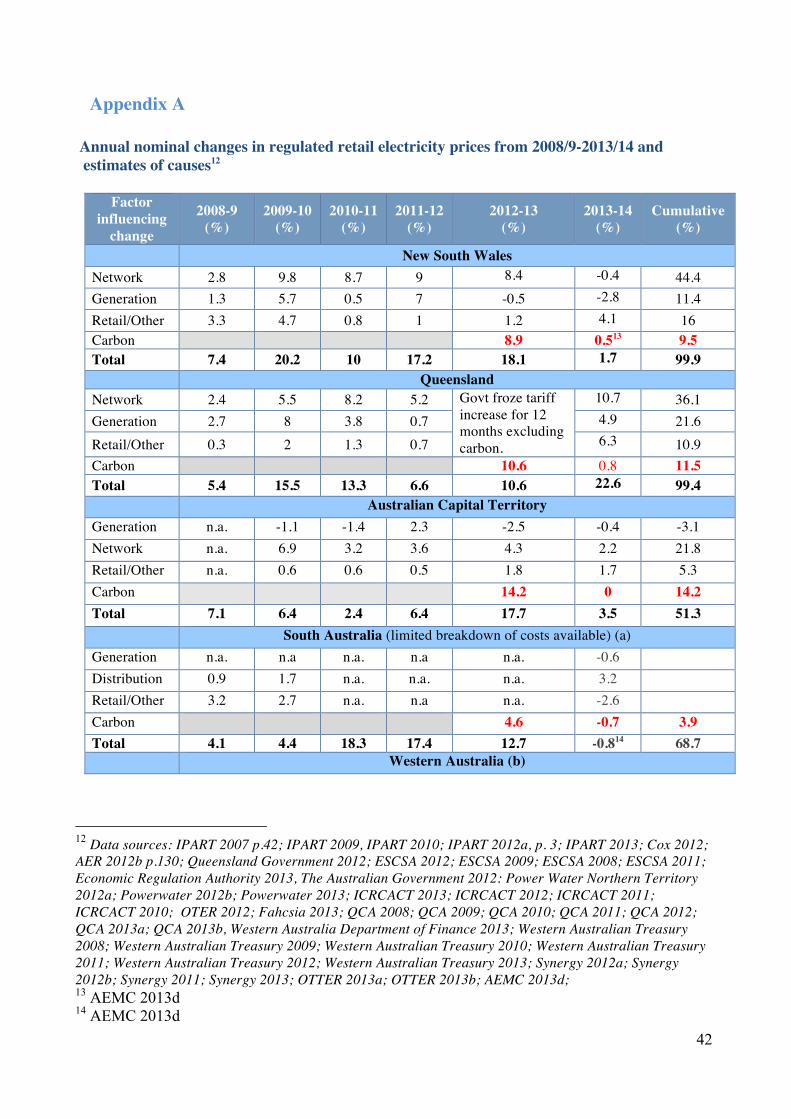
42
Appendix A Annual nominal changes in regulated retail electricity prices from 2008/9-2013/14 and estimates of causes12
Factor influencing
change
2008-9 (%)
2009-10 (%)
2010-11 (%)
2011-12 (%)
2012-13 (%)
2013-14 (%)
Cumulative (%)
New South Wales Network 2.8 9.8 8.7 9 8.4 -0.4 44.4 Generation 1.3 5.7 0.5 7 -0.5 -2.8 11.4 Retail/Other 3.3 4.7 0.8 1 1.2 4.1 16 Carbon 8.9 0.513 9.5 Total 7.4 20.2 10 17.2 18.1 1.7 99.9
Queensland Network 2.4 5.5 8.2 5.2 Govt froze tariff
increase for 12 months excluding carbon.
10.7 36.1 Generation 2.7 8 3.8 0.7 4.9 21.6 Retail/Other 0.3 2 1.3 0.7 6.3 10.9 Carbon 10.6 0.8 11.5 Total 5.4 15.5 13.3 6.6 10.6 22.6 99.4
Australian Capital Territory Generation n.a. -1.1 -1.4 2.3 -2.5 -0.4 -3.1 Network n.a. 6.9 3.2 3.6 4.3 2.2 21.8 Retail/Other n.a. 0.6 0.6 0.5 1.8 1.7 5.3 Carbon 14.2 0 14.2 Total 7.1 6.4 2.4 6.4 17.7 3.5 51.3
South Australia (limited breakdown of costs available) (a) Generation n.a. n.a n.a. n.a n.a. -0.6 Distribution 0.9 1.7 n.a. n.a. n.a. 3.2 Retail/Other 3.2 2.7 n.a. n.a n.a. -2.6 Carbon 4.6 -0.7 3.9 Total 4.1 4.4 18.3 17.4 12.7 -0.814 68.7
Western Australia (b)
12 Data sources: IPART 2007 p.42; IPART 2009, IPART 2010; IPART 2012a, p. 3; IPART 2013; Cox 2012; AER 2012b p.130; Queensland Government 2012; ESCSA 2012; ESCSA 2009; ESCSA 2008; ESCSA 2011; Economic Regulation Authority 2013, The Australian Government 2012: Power Water Northern Territory 2012a; Powerwater 2012b; Powerwater 2013; ICRCACT 2013; ICRCACT 2012; ICRCACT 2011; ICRCACT 2010; OTER 2012; Fahcsia 2013; QCA 2008; QCA 2009; QCA 2010; QCA 2011; QCA 2012; QCA 2013a; QCA 2013b, Western Australia Department of Finance 2013; Western Australian Treasury 2008; Western Australian Treasury 2009; Western Australian Treasury 2010; Western Australian Treasury 2011; Western Australian Treasury 2012; Western Australian Treasury 2013; Synergy 2012a; Synergy 2012b; Synergy 2011; Synergy 2013; OTTER 2013a; OTTER 2013b; AEMC 2013d; 13 AEMC 2013d 14 AEMC 2013d

43
Carbon 9.1 0.1 9.2
Total 10 23.6 10 5 12.6 4.1 84.1 Northern Territory (b)
Carbon 6.8 0.2 7 Total 3.4 18 5 2.8 29.7 11.815 91
Tasmania (b)
Carbon 5.6 - 2 (c) 3.5 Total 4.1 6.2 15.3 11 10.6 -3.5 51
Victoria (d) Carbon 10.6 0.4 11 Total 7.8 6.3 14.1 10.6 22.2 4.316 85
Australia
Total change 2008/09-2012/13 Between 51-100
Weighted average change across the NEM (2008/9-2013/14) 93
(a) In 2008-09 and 2009-10 South Australian Tariffs broke down costs by retail and distribution costs only. There was no separate breakdown of generation costs.
(b) No data on the breakdown of electricity price increases is publicly available
(c) No breakdown of the carbon cost in 2013-14 is provided by the Tasmanian regulator. The estimated fall of -1 per cent is based on the fact that generation costs fell 7.8 per cent in Tasmania in 2013-14 and average emissions intensity of generation in Tasmania fell 47 per cent, more than any other state (AEMO 2014b)
(d) Prices in Victoria are not regulated. These figures are estimates taken 17from an average of each retailer’s increases in Victoria in 2012.
(e) As prices are not regulated, all retailers passed on different costs after the carbon price came into operation. The 10.6 per cent is an estimate based on AEMC 2013d.
15 AEMC 2013d 16 AEMC 2013d

44
Appendix B Changes to volume weighted average spot electricity prices in the NEM: Percentage change
year on year %18
Factor behind changes by state
2007-8 2008-9 2009-10 2010-11 2011-12 2012-13 2013-14
(%) (%) (%) (%) (%) (%) (%) New South Wales
Carbon related 58.1 1.8 Non-carbon related -34.3 -2.3 20.9 -17.3 -27.9 22.6 -‐7.1
Total -34.3 -2.3 20.9 -17.3 -27.9 80.7 -‐5.4 Queensland
Carbon related 60 0.8 Non-carbon related 1.8 -37.9 2.8 -8.1 -11.8 73.3 -‐13.7
Total 1.8 -37.9 2.8 -8.1 -11.8 133.3 -‐12.9 South Australia
Carbon related 53.1 -‐0.8 Non-carbon related 71.2 -31.7 20.3 -49.4 -23.8 78.1 -‐6.1
Total 71.2 -31.7 20.3 -49.4 -23.8 131.3 -‐8.1 Tasmania
Carbon related 30.3 -‐4.5 Non-carbon related 11.8 8.8 -51.6 3.3 6.5 18.2 -‐9.7
Total 11.8 8.8 -51.6 3.3 6.5 48.5 -‐14.3 Victoria
Carbon related 60.7 1.2 Non-carbon related -16.4 -3.9 -14.3 -31 -3.4 57.1 -‐12.7
Total -16.4 -3.9 -14.3 -31 -3.4 117.9 -‐11.5
Source: AEMO 2014b; Saddler 2013b, AER 2012a, AER 2013d, DCCEE 2012c, DIICCSRTE 2012c
18 The ‘carbon related’ factor is an estimation of the carbon liability faced by the marginal generator in each region, which in turn sets the price for the rest of the market. It is not an indication of the average carbon liability faced by all generators in this state.

45
Appendix B Changes to volume weighted average spot prices in the NEM ($/MWh), and sources of change
Factors behind changes by State
2007-8 2008-9 2009-10 2010-11 2011-12 2012-13 2013-14 ($) ($) ($) ($) ($) ($) ($)
New South Wales Change from previous year due to carbon costs 18 1
Change from previous year due to other factors -23 -1 9 -9 -12 7 -4
Price level 44 43 52 43 31 56 53 Queensland
Change from previous year due to carbon costs 18 0.6
Change from previous year due to other factors 1 -22 1 -3 -4 22 -9.6
Price level 58 36 37 34 30 70 61 South Australia
Change from previous year due to carbon costs 17 -0.6
Change from previous year due to other factors 42 -32 14 41 -10 25 -4.5
Price level 101 69 83 42 32 74 68 Tasmania
Change from previous year due to carbon costs 10 -2.2
Change from previous year due to other factors 6 5 -32 1 2 6 -5
Price level 57 62 30 31 33 49 42 Victoria
Change from previous year due to carbon costs 17 0.8
Change from previous year due to other factors -10 -2 -7 -13 -1 16 -8
Price level 51 49 42 29 28 61 54 Source: AEMO 2014b, DCCEE 2012c, DIICCSRTE 2012c, Saddler 2013b, AER 2012a, AER 2013d

46
Appendix C Annual nominal percentage changes in industrial users electricity prices from 2008/9-2013/14 and estimates of causes of price changes19
Factor behind change by state
2008-9 (%)
2009-10 (%)
2010-11 (%)
2011-12 (%)
2012-13 (%)
2013-14 (%)
Nationwide Change from previous year due to carbon costs
14.5 0.5
Change from previous year due to other factors
6.6 10.0 9.7 10.2 3.7 4
Total change 6.6 10.0 9.7 10.2 18.2 4.520 Source: ABS 2014, AIG 2013a; Appendix A & Appendix B
19 There is no publicly available breakdown of the impact of the carbon price on business electricity bills. An AIG survey released in June 2013 finds that manufacturers estimated the carbon price led to a 14.5 per cent increase in electricity in 2012-13. Given the data in Appendix A and B, and given that the manufacturing producer price index for electricity rose by 18.2 in 2012-13, this estimate seems reasonable. Wholesale prices make up a much larger portion of manufacturing electricity bills than household bills, with some users being directly connected to the electricity grid. Given the small carbon price impact on wholesale or residential electricity prices in 2013-14, it is assumed that there was a similar impact (0.5 per cent) on manufacturing electricity prices. Note, the only available manufacturing price index is Australia-wide which is used as a proxy for NEM specific electricity price changes. 20 2013-14 estimate is based on the 2013-14 Producer Price Index as at the March Quarter 2014 as final 2013-14 figures have not been released at time of writing.

47
References
The ABC 2012, ‘NSW Greenhouse gas scheme scrapped’, The ABC, 5 April, viewed 10 December 2013 <http://www.abc.net.au/news/2012-04-05/nsw-greenhouse-gas-scheme-scrapped/3934212>
ABS, see Australian Bureau of Statistics ACIL TASMAN 2009, Fuel resource, new entry and generation costs in the NEM, ACIL Tasman, Sydney. -- 2013, Energy efficiency opportunities program review: report prepared for Department of resources, energy and tourism, ACIL Tasman, Sydney. ACIL Allen 2013a, Report to the Department of Innovation, Industry, Climate Change, Science, Research and Tertiary Education: Electricity sector emissions – modeling of the Australian electricity generation sector, ACIL Allen, Sydney. -- 2013b, ‘NEM Outlook & Emerging Trends’, presentation to the Energy Users Association Australia Annual Conference, 17 October.
AEMC, see Australian Energy Market Commission AEMO, see Australian Energy Market Operator AER, see Australian Energy Regulator
AIG, see Australian Industry Group Alinta Energy 2012a, ‘Media release: Northern power station return to service’, Alinta Energy, viewed 23 May 2013, <http://alintaenergy.com.au/WA/Everything-Alinta-Energy/News/Archived-News/Northern-Power-Station-return-to-service>. -- 2012b, ‘Media release: contract for closure’, viewed 1 August 2013, <http://alintaenergy.com.au/Everything-Alinta-Energy/News/Archived-News/Contract-for-Closure>. -- 2012c, ‘Submission to the renewable energy target review issues paper’, Climate Change Authority, viewed 23 May 2013, <http://climatechangeauthority.gov.au/sites/climatechangeauthority.gov.au/files/SUB-RET-2012-089.pdf>. Ausgrid 2013, ‘Average electricity use’, Ausgrid, viewed 10 January 2014, <http://www.ausgrid.com.au/Common/About-us/Sharing-information/Data-to-share/Average-electricity-use.aspx#.Us9IwkKd7dk>. Ausindustry 2013, Clean technology investment program, Ausindustry, Canberra, viewed on 25 May 2013,

48
<http://www.ausindustry.gov.au/programs/cleantechnology/cleantechnologyinvestment/Pages/default.aspx>. The Australian 2014a, ‘Victorian wind put on ice’, The Australian, 14 May. -- 2014b, ‘Senate threat to Abbott’s tax plans’, The Australian, 9 June. Australian Bureau of Statistics 2011, 4602.0.55.001 - Environmental Issues: Energy Use and Conservation, Australian Bureau of Statistics, Canberra viewed 17 December 2013, <http://www.abs.gov.au/AUSSTATS/[email protected]/DetailsPage/4602.0.55.001Mar%202011?OpenDocument>. -- 2012a, 4102.0 Australian social trends - household energy use and costs, Australian Bureau of Statistics, Canberra, viewed 16 June 2013, <http://www.abs.gov.au/AUSSTATS/[email protected]/Lookup/4102.0Main+Features10Sep+2012#Reducingenergyuse>. -- 2012b, 6401.0 Consumer price index - December 2012, Canberra viewed 16 June 2013, <http://www.abs.gov.au/AUSSTATS/[email protected]/allprimarymainfeatures/9D90A4167E865489CA257B56001629A2?opendocument>. -- 2012c, 4626.0.55.001 Environmental views and behaviour - December 2012, Canberra, viewed 16 June 2013, <http://www.abs.gov.au/ausstats/[email protected]/mf/4626.0.55.001>. -- 2013, 4670 Household Energy Consumption Survey September 2013, Canberra, <http://www.abs.gov.au/ausstats/[email protected]/mf/4670.0>. -- 2014, 6427.0 Producer price index - March 2014, Canberra viewed 16 June 2014, <http://www.abs.gov.au/ausstats/[email protected]/mf/6427.0>. Australian Energy Market Commission 2012a, ‘Australia’s energy future’, speech presented to ANU Coombs Forum, Canberra, 30 October. -- 2012b, ‘The Australian National Electricity Market: Choosing a New Future’, paper presented at the World Energy Forum, Quebec, 13-16 May. -- 2013a, ‘Media release: household electricity price trends’, Australian Energy Market Commission, viewed 22 April 2013, <http://www. aemc.gov.au/News/Whats-New/household-electricity-price-trends.html>. -- 2013b, Electricity price trends final report: possible future retail electricity price movements: 1 July 2012 to 30 June 2015, Australian Energy Market Commission, Sydney.
-- 2013c, ‘Electricity Market’, Australian Energy Market Commission, viewed 19 May 2013, <http://www.aemc.gov.au/Electricity/Electricity-Market.html>. -- 2013d, Final report: residential electricity price trends final report 2013, Australian Energy Market Commission, Sydney.

49
Australian Energy Market Operator 2001, Carbon Dioxide Equivalent Intensity Index 2001, Australian Energy Market Operator viewed 19 May 2013, <http://www.aemo.com.au/Electricity/Settlements/Carbon-Dioxide-Equivalent-Intensity-Index>. -- 2002, Carbon dioxide equivalent intensity index 2002, Australian Energy Market Operator, viewed 19 May 2013, <http://www.aemo.com.au/Electricity/Settlements/Carbon-Dioxide-Equivalent-Intensity-Index>. -- 2003, Carbon dioxide equivalent intensity index 2003, Australian Energy Market Operator, viewed 19 May 2013, <http://www.aemo.com.au/Electricity/Settlements/Carbon-Dioxide-Equivalent-Intensity-Index>. -- 2004, Carbon dioxide equivalent intensity index 2004, Australian Energy Market Operator, viewed 19 May 2013, <http://www.aemo.com.au/Electricity/Settlements/Carbon-Dioxide-Equivalent-Intensity-Index>. -- 2005, Carbon dioxide equivalent intensity index 2005, Australian Energy Market Operator, viewed 19 May 2013, <http://www.aemo.com.au/Electricity/Settlements/Carbon-Dioxide-Equivalent-Intensity-Index>. -- 2006, Carbon dioxide equivalent intensity index 2006, Australian Energy Market Operator, viewed 19 May 2013, <http://www.aemo.com.au/Electricity/Settlements/Carbon-Dioxide-Equivalent-Intensity-Index>. -- 2007, Carbon dioxide equivalent intensity index 2007, Australian Energy Market Operator, viewed 19 May 2013, <http://www.aemo.com.au/Electricity/Settlements/Carbon-Dioxide-Equivalent-Intensity-Index>. -- 2008, Carbon dioxide equivalent intensity index 2008, Australian Energy Market Operator, viewed 19 May 2013, <http://www.aemo.com.au/Electricity/Settlements/Carbon-Dioxide-Equivalent-Intensity-Index>. -- 2009, Carbon dioxide equivalent intensity index 2009, Australian Energy Market Operator, viewed 19 May 2013, <http://www.aemo.com.au/Electricity/Settlements/Carbon-Dioxide-Equivalent-Intensity-Index>. -- 2010a, Electricity statement of opportunities for the national electricity market, Australian Energy Market Operator, Melbourne. -- 2010b, Carbon dioxide equivalent intensity index 2010, Australian Energy Market Operator, viewed 19 May 2013, <http://www.aemo.com.au/Electricity/Settlements/Carbon-Dioxide-Equivalent-Intensity-Index>. -- 2011, Carbon dioxide equivalent intensity index 2011, Australian Energy Market Operator, viewed 19 May 2013, <http://www.aemo.com.au/Electricity/Settlements/Carbon-Dioxide-Equivalent-Intensity-Index>. -- 2012a, Carbon price - market review, Australian Energy Market Operator, viewed 19 May 2013,

50
<http://www.aemo.com.au/Electricity/Resources/Reports-and-Documents/Carbon-Price-Market-Review>. -- 2012b, Carbon dioxide equivalent intensity index 2012, Australian Energy Market Operator, viewed 10 November 2013, <http://www.aemo.com.au/Electricity/Settlements/Carbon-Dioxide-Equivalent-Intensity-Index>. -- 2012c, 2012 National electricity forecasting report for the national electricity market, Australian Energy Market Operator, Melbourne. --2012d, 2012 National transmission network development plan, Australian Energy Market Operator, Melbourne. -- 2013a, Carbon dioxide equivalent intensity index 2013, Australian Energy Market Operator, viewed 10 November 2013, <http://www.aemo.com.au/Electricity/Settlements/Carbon-Dioxide-Equivalent-Intensity-Index>. -- 2013b, Generation information, Australian Energy Market Operator, viewed 15 November 2013, <www.aemo.com.au/.../20130628_Generation_Information_VIC.ashx >. -- 2013c, Media release - slower growth in electricity use to continue, Australian Energy Market Operator, viewed on 20 July 2013, <http://www.google.com.au/url?sa=t&rct=j&q=&esrc=s&source=web&cd=1&ved=0CCkQFjAA&url=http%3A%2F%2Fwww.aemo.com.au%2FNews-and-Events%2FNews%2F~%2Fmedia%2FFiles%2FOther%2Fcorporate%2FAEMO_NEFR_NEM_Media_Release_2013.pdf.ashx&ei=Ce2oUr6ZPKa9iAftm4DoAQ&usg=AFQjCNFjuJN84soGXdE80oCu0Gz1Xr21RQ&sig2=lTTRy9lP6iNqMHqOAfl0DQ&bvm=bv.57799294,d.aGc> -- 2013d, Electricity statement of opportunities for the national electricity market, Australian Energy Market Operator, Melbourne. -- 2013e, Industry newsletter: energy update - June 2013, Australian Energy Market Operator, viewed 12 August 2013, <http://www.aemo.com.au/About-the-Industry/Resources/Energy-Update> -- 2013f, 2013 National electricity forecasting report for the national electricity market, viewed on 15 August 2013, <http://www.aemo.com.au/Electricity/Planning/Forecasting/National-Electricity-Forecasting-Report-2013>. --2013g, 2013 Forecasting methodology information paper, Australian Energy Market Operator, Melbourne. --2013h, National transmission network development plan, Australian Energy Market Operator, Melbourne. --2013i, NEM Historical Market Information Report, Australian Energy Market Operator, Melbourne.

51
-- 2013j, Victorian Annual Planning Report 2014, Australian Energy Market Operator, viewed 20 May 2014, <http://www.aemo.com.au/Electricity/Planning/Victorian-Annual-Planning-Report-2013>. -- 2014a, Generation information, Australian Energy Market Operator, viewed 15 March 2014, <http://www.aemo.com.au/Electricity/Planning/Related-Information/Generation-Information> -- 2014b, Carbon dioxide equivalent intensity index 2014, Australian Energy Market Operator, viewed 20 January 2014, <http://www.aemo.com.au/Electricity/Settlements/Carbon-Dioxide-Equivalent-Intensity-Index>. -- 2014c, 2014 National electricity forecasting report for the national electricity market, Australian Energy Market Operator, Melbourne. Australian Energy Regulator 2012a, State of the energy market 2012a, Australian Competition and Consumer Commission, Commonwealth of Australia, Melbourne. -- 2012b, Senate select committee on electricity prices submission – September 2012, Australian Energy Regulator, Melbourne. -- 2013a, ‘Media release: AER release state of the energy market report 2013’, Australian Energy Regulator, NR 026/12, viewed 21 December 2013, <http://www.aer.gov.au/node/18993>. -- 2013b, Electricity supply to regions of the national electricity market, Australian Energy Regulator, viewed online 10 August 2013, < http://www.aer.gov.au/node/9778>. -- 2013c, Electricity report: 14-20 July 2013, Australian Energy Regulator, viewed 15 August 2013, <http://www.aer.gov.au/node/21385>. -- 2013d, State of the Energy Market 2013, Australian Competition and Consumer Commission, Melbourne. -- 2013e, Transmission network service providers: electricity performance report 2010-11, Australian Energy Regulator, Melbourne.
-- 2014, Electricity report: 15-21 June 2014, Australian Energy Regulator, viewed 12 July 2014, <http://www.aer.gov.au/sites/default/files/20140615%20-%2020140621%20electricity%20report.pdf>.
Australian Industry Group 2012, Energy shock: pressure mounts for efficiency action, Australian Industry Group, Sydney. -- 2013a, ‘Ai Group survey: business picks up carbon tax bill’, Australian Industry Group, viewed 1 August 2013, <http://www.aigroup.com.au/portal/binary/com.epicentric.contentmanagement.servlet.ContentDeliveryServlet/LIVE_CONTENT/Publications/Reports/2013/Carbon%2520Tax%2520report%2520FINAL.pdf>.

52
Australian Institute of Petroleum 2011, ‘Downstream petroleum 2011’, Australian Institute of Petroleum, viewed 6 January 2014, <http://www.aip.com.au/pdf/Downstream_Petroleum_2011_Report.pdf>. -- 2013, ‘Submission to the Department of Environment on the Emissions Reduction Fund terms of reference’, Department of Environment, viewed 8 January 2014, <http://www.environment.gov.au/submissions/emissions-reduction/tor/196-australian-institute-of-petroleum.pdf>.
Beenstock, M, Goldin, E, & Natbot, D,1999, ‘The demand for electricity in Israel’, Energy Economics, vol. 21, pp. 168–183. Bluescope 2011, ‘Media release: Bluescope announces major restructure to Australian operations and reinforces commitment to steel production in Australia’, Bluescope, viewed 10 January 2014, <http://www.bluescopesteel.com/media/31671/mediareleasefullyearresultsfy20111.pdf>. Bohi, D & Zimmerman, M 1984, ‘An update on econometric studies of energy demand behavior’, Annual Review of Energy, vol. 9, pp. 105-154. BREE, see Bureau of Resources and Energy Economics Bureau of Resources and Energy Economics 2012, Australian energy technology assessment 2012, Department of Resources, Energy and Tourism, Commonwealth of Australia, Canberra. -- 2013a, Energy in Australia 2013, Department of Resources, Energy and Tourism, Commonwealth of Australia, Canberra. -- 2013b, Energy statistics 2013, Department of Resources, Energy and Tourism, Commonwealth of Australia, Canberra. Business Council of Australia 2012, Submission to the Department of the Environment on the carbon tax repeal, Business Council of Australia, Melbourne. Butler, M 2013, ‘Interview ABC 774 with Raphael Epstein 17 July 2013’ viewed 1 August 2013, <http://minister.innovation.gov.au/markbutler/Transcripts/Pages/ABC7.aspx>. CEDA, see Committee for Economic Development of Australia
Committee for Economic Development of Australia (2012) ‘Australia's Energy Options: Policy Choice not Economic Inevitability’, Committee for Economic Development of Australia, Melbourne.
Clean Energy Act 2011 (Commonwealth of Australia) Clean Energy (Carbon Tax Repeal) Bill 2013 (Commonwealth of Australia) Clean Energy (Household Assistance Amendments) Act 2011 (Commonwealth of Australia). Clean Energy (Tax Laws Amendments) Act 2011 (Commonwealth of Australia).

53
Clean Energy (Income Tax Rates Amendments) Act 2011 (Commonwealth of Australia). Clean Energy Council 2012a, Clean energy Australia report, Clean Energy Council, Melbourne, viewed 1 August 2013, <https://www.cleanenergycouncil.org.au/resourcecentre/reports.html>. -- 2012b, ‘Consumer guide to buying household solar panels’, vol. 21, 19 December 2012. Clean Energy Regulator 2012, ‘Publication of greenhouse and energy information 2011-12’, Clean Energy Regulator, Commonwealth of Australia, viewed 6 January 2014, <http://www.cleanenergyregulator.gov.au/National-Greenhouse-and-Energy-Reporting/published-information/greenhouse-and-energy-information/Greenhouse-and-Energy-information-2011-2012/Pages/default.aspx>. -- 2013a, Renewable energy target 2012 administrative report, Clean Energy Regulator, Commonwealth of Australia, Canberra. -- 2013b, ‘One million solar panel systems installed under the Renewable Energy Target’, Clean Energy Regulator, Commonwealth of Australia, viewed 19 May 2013, <http://ret.cleanenergyregulator.gov.au/Latest-Updates/2013/April/one-million-solar-panel-systems-installed>. -- 2013c, ‘List of SGU/SWH installations by postcode’ Clean Energy Regulator, Commonwealth of Australia, viewed 4 December 2013, <http://ret.cleanenergyregulator.gov.au/REC-Registry/Data-reports>. -- 2013d, ‘Accredited power stations’ Clean Energy Regulator, Commonwealth of Australia, viewed 9 November 2013, <http://ret.cleanenergyregulator.gov.au/REC-Registry/Data-reports>. -- 2013e, ‘LEPID for 2012-13 financial year’, Clean Energy Regulator, Commonwealth of Australia, viewed 10 December 2013, <http://www.cleanenergyregulator.gov.au/Carbon-Pricing-Mechanism/Liable-Entities-Public-Information-Database/LEPID-for-2012-13-Financial-year/Pages/Default.aspx?Paged=TRUE&p_Title=SUGAR%20AUSTRALIA%20PTY%20LIMITED&p_ID=974&PageFirstRow=301&&View={4BE4C5B4-03EA-444B-BC62-687E22738135}>. -- 2013f, ‘Coal-fired generation assistance’, Clean Energy Regulator, Commonwealth of Australia, viewed 10 December 2013, <http://www.cleanenergyregulator.gov.au/Carbon-Pricing-Mechanism/Industry-Assistance/coal-fired-generators/Pages/default.aspx>. -- 2013g, ‘Units issued in the 2012-13 financial year’, Clean Energy Regulator, Commonwealth of Australia, viewed 10 December 2013, <http://www.cleanenergyregulator.gov.au/Carbon-Pricing-Mechanism/Industry-Assistance/jobs-and-competitiveness-program/free-carbon-units/Pages/units-issued-in-2012-13.aspx>. -- 2014a, Renewable energy target 2013 administrative report, Clean Energy Regulator,

54
Commonwealth of Australia, Canberra. -- 2014b, ‘List of SGU/SWH installations by postcode’ Clean Energy Regulator, Commonwealth of Australia, viewed 10 July 2014, <http://ret.cleanenergyregulator.gov.au/REC-Registry/Data-reports>. The Climate Institute 2013, ‘The carbon laws one year on: lower emissions, cleaner energy and a strong economy’, The Climate Institute, Sydney, viewed on 1 August 2013, <http://www.climateinstitute.org.au/articles/media-briefs/the-carbon-laws-one-year-on.html>. The Climate Institute 2014, ‘The carbon laws two years on’, The Climate Institute, Sydney, viewed on 10 July 2014, <http://www.climateinstitute.org.au/verve/_resources/CarbonLawsTwoYearsOn_PolicyBrief_1July2014.pdf>. ClimateWorks 2013a, Tracking progress towards a low carbon economy: special report on factors influencing large industrial energy, ClimateWorks Australia, Melbourne. -- 2013b, Tracking progress towards a low carbon economy: industry, ClimateWorks Australia, Melbourne. -- 2013c, Tracking progress towards a low carbon economy: power, ClimateWorks Australia, Melbourne. -- 2013d, Tracking progress towards a low carbon economy: national progress report, ClimateWorks Australia, Melbourne. -- 2013e, Tracking progress towards a low carbon economy: land-use and waste, ClimateWorks Australia, Melbourne. -- 2013f, Energy efficiency opportunities program: additionally analysis, ClimateWorks Australia, Melbourne CLP Group 2013, ‘CLP Group 2012 final results’ CLP Group, viewed 20 May 2013, <https://www.clpgroup.com/ourcompany/aboutus/resourcecorner/investmentresources/Analyst%20briefings/FY2012/e_2012AnnualResults.pdf>. Combet, G 2013a, ‘Media release: transformation of the national electricity market’, Minister for Industry, Innovation and Climate Change, Canberra, viewed 23 May 2013, <http://minister.innovation.gov.au/gregcombet/MediaReleases/Documents/TransformationoftheNationalElectricityMarket.pdf>. -- 2013b, ‘The clean energy future: one year on’, speech to the National Press Club, Canberra, 5 June. Cox, J 2012, ‘The challenges of balancing electricity retail prices’, speech presented to Australian Energy and Utility Summit Conference, Eveleigh 29 June, <http://www.ipart.nsw.gov.au/Home/Quicklinks/Speeches/Speech_-_The_challenges_of_balancing_electricity_retail_prices_-_29_June_2012>.

55
CS Energy 2013, CS Energy Annual Report 2012-13, CS Energy, Queensland. Daley, J & Edis, T 2011, Learning the hard way: Australia’s policies to reduce emissions, Grattan Institute, Melbourne. DCCEE, see Department of Climate Change and Energy Efficiency Dennis, G, Bateman, B, Thomas, N & Farmer, R 2013, ‘Axing the tax: what’s involved and what are the implications for business’, Clayton Utz, Sydney, viewed 11 November 2013, <http://claytonutz.com/publications/edition/26_september_2013/20130926/axing_the_tax_whats_involved_and_what_are_the_implications_for_business.page>. Delta Electricity 2012, ‘Media release: Munmorah power station to close’, Delta Electricity, viewed 22 May 2013, <http://www.de.com.au/Media-Centre/Media-releases/default.aspx>. -- 2013, Delta Electricity Annual Report 2013, Delta Electricity, New South Wales. Department of Climate Change and Energy Efficiency 2011a, Carbon Farming Initiative: preliminary estimates of abatement, Department of Climate Change and Energy Efficiency, Commonwealth of Australia, Canberra. -- 2011b, Securing a clean energy future: the Australian Government’s climate change plan, Department of Climate Change, Commonwealth of Australia, Canberra. -- 2012a, ‘Your Electricity Bill’, Clean Energy Future, Department of Climate Change and Energy Efficiency, Commonwealth of Australia, Canberra, viewed 22 May 2013, <http://www.cleanenergyfuture.gov.au/helping-households/your-electricity-bill/>. -- 2012b, Australian national greenhouse gas accounts: Quarterly update of Australia’s national greenhouse gas inventory – June 2012, Department of Climate Change and Energy Efficiency, Commonwealth of Australia, Canberra. -- 2012c, Australian national greenhouse gas accounts: National greenhouse account factors – July 2012, Department of Climate Change and Energy Efficiency, Commonwealth of Australia, Canberra. Department of Environment 2013, Repeal of the carbon tax: exposure draft legislation and consultation paper, Department of Environment, Commonwealth of Australia, Canberra. Department of Families, Housing, Community Services and Indigenous Affairs (Fahcsia) and The Treasury 2013, ‘Review of the Clean Energy Household Assistance Package’ Commonwealth of Australia, Canberra, viewed 22 May 2013, <http://www.fahcsia.gov.au/review-of-the-clean-energy-future-household-assistance-package>. Department of Finance Western Australia 2013 ‘Electricity pricing’, Department of Finance, Government of Western Australia, viewed on 10 May 2014, <http://www.finance.wa.gov.au/cms/content.aspx?id=15096>. Department of Foreign Affairs and Trade 2011 ‘Australia’s coal and iron ore exports’,

56
Department of Foreign Affairs and Trade, Commonwealth of Australia, Canberra viewed on 4 November 2013, <http://www.dfat.gov.au/publications/stats-pubs/australias-coal-and-iron-ore-exports-2001-to-2011.pdf>. Department of Industry, Innovation, Climate Change, Science, Research and Tertiary Education 2011, ‘National greenhouse gas inventory 2011’, Department of Climate Change and Energy Efficiency, Commonwealth of Australia, viewed 19 May 2013, <http://ageis.climatechange.gov.au>. -- 2013a, Australian national greenhouse gas accounts: Quarterly update of Australia’s national greenhouse gas inventory – December 2012, Department of Industry, Innovation, Climate Change, Science, Research and Tertiary Education, Commonwealth of Australia, Canberra. -- 2013b, How Australia’s carbon price is working: one year on, Department of Industry, Innovation, Climate Change, Science, Research and Tertiary Education, Commonwealth of Australia, Canberra. -- 2013c, Australian national greenhouse gas accounts: National greenhouse account factors – July 2013, Department of Climate Change and Energy Efficiency, Commonwealth of Australia, Canberra. Department of Resources, Energy and Tourism 2013, ‘The facts on electricity prices’, Australian Government, viewed on 18 August 2013, <http://www.ret.gov.au/Department/Documents/clean-energy-future/ELECTRICITY-PRICES-FACTSHEET.pdf> Department of the Treasury 2009f, Department of the Treasury, Commonwealth of Australia, Canberra. -- 2011a, Strong growth, low pollution: modelling a carbon price, Department of the Treasury, Commonwealth of Australia, Canberra. -- 2011b, Strong growth, low pollution: update, Department of the Treasury, Commonwealth of Australia, Canberra. Department of Treasury and Finance Western Australian 2008, Economic and fiscal outlook: budget paper no. 3, Government of Western Australia, Perth. -- 2009, Economic and fiscal outlook: budget paper no. 3, Government of Western Australia, Perth. -- 2010, Economic and fiscal outlook: budget paper no. 3, Government of Western Australia, Perth. Department of Treasury Western Australian 2011, Economic and fiscal outlook: budget paper no. 3, Government of Western Australia, Perth. -- 2012 , Economic and fiscal outlook: budget paper no. 3, Government of Western Australia, Perth.
57
-- 2013 , Economic and fiscal outlook: budget paper no. 3, Government of Western Australia, Perth. DIICCSRTE, see Department of Industry, Innovation, Climate Change, Science, Research and Tertiary Education DRET, see Department of Resources, Energy and Tourism. EcoGeneration 2011, What’s up with wind, EcoGeneration May/June 2011 edition, viewed 10 May 2013, <http://ecogeneration.com.au/news/whats_up_with_wind/056539/>.
Economic Regulation Authority Western Australia 2012, Synergy’s costs and electricity tariffs, Economic Regulation Authority, Perth. Energetics 2013, ‘Carbon tax repeal consultation underway’, Energetics Climate Change Matters, Energetics, Sydney, viewed 11 November 2013 <http://www.energetics.com.au/insights/latest-news/climate-change-matters/carbon-tax-price-repeal-consultation-is-underway>. Energex 2013, Annual performance report 2012-13, Energex, Brisbane. EnergyAustralia 2012, ‘Changes to Renewable Energy Target required for a sustainable electricity market’, EnergyAustralia, viewed 23 May 2013, <http://www.energyaustralia.com.au/about-us/media-centre/current-news/changes-to-renewable-energy-target>. -- 2013a, Carbon Tax Repeal: submission to the carbon tax repeal taskforce, EnergyAustralia, Melbourne. -- 2013b, ‘Yallourn Social and Environmental Performance Summary 2012’, EnergyAustralia, viewed 20 January 2014, <http://www.energyaustralia.com.au/about-us/what-we-do/generation-assets/yallourn-power-station>. -- 2013c, ‘Focus on driving return from investments’, EnergyAustralia, viewed 20 January 2014, <http://www.energyaustralia.com.au/servlet/Satellite?c=Page&childpagename=EnergyAustralia%2FPage%2F3ColumnLayout&cid=1343354036624&pagename=GST%2FDispatcher>. Energy Supply Association of Australia 2013a, Carbon Tax Repeal: submission to the carbon tax repeal taskforce, Energy Supply Association Australia, Melbourne. -- 2013b, Electricity Gas Australia, Energy Supply Association Australia, Melbourne. Energy Users Association of Australia 2012, Submission in relation to Australian Energy Regulator’s draft determination on Powerlink’s regulatory proposal 2012-2017 and Powerlink’s revised proposal’, Australian Energy Regulator, viewed 10 January 2014, <http://www.aer.gov.au/sites/default/files/Energy%20Users%20Association%20of%20Australia%20(20%20Feb%202012).pdf>.

58
Ergon 2012, ‘Ergon Energy proposed reductions and efficiency measures’, Ergon Energy, viewed 25 May 2013, <http://www.ergon.com.au/about-us/news-room/archived-media-releases/2012/general/ergon-energy-proposed-reductions-and-efficiency-measures>. -- 2013, Ergon Energy annual stakeholder report 2012/13, Ergon Energy, Queensland. Ernst & Young 2011, Power of choice: rationale and drivers for DSP in the electricity market – demand and supply of electricity, viewed on 12 December 2013, <http://www.aemc.gov.au/Media/docs/EPR0022-Rationale-and-drivers-for-DSP-in-the-electricity-market-Final-Report-EY---for-publication-pdf-1295dc06-199b-4b09-b9d7-8e52ca564492-2.PDF>. ESCSA, see Essential Services Commission of South Australia Essential Media 2012, ‘Essential Report – Federal Politics Voting Intention’ viewed on 15 June 2013, <http://essentialvision.com.au/category/essentialreport/page/27>. Essential Services Commission of South Australia 2008, ‘2008-09 Regulated electricity price adjustment impact on residential & small business customers’ Essential Services Commission of South Australia, viewed 20 August 2013, <http://www.escosa.sa.gov.au/library/080624-RegulatedElectricityPriceAdjustment_2008-09-ImpactOnCustomers.pdf>. -- 2009, ‘2009-10 Regulated electricity price adjustment impact on residential & small business customers’, Essential Services Commission of South Australia, viewed 20 August 2013, <http://www.escosa.sa.gov.au/library/090609-ElectricityPriceAdjustment-ImpactOnCustomers_2009-10.pdf>. -- 2011, ‘1 August 2011 electricity standing contract price adjustment’, Essential Services Commission of South Australia, viewed 15 August 2013, <http://www.escosa.sa.gov.au/library/110704-1August_2011-31July_2012-RPM-MediaRelease.pdf>. -- 2012, ‘1 July 2012 Electricity standing contract price adjustment’, Essential Services Commission of South Australia, viewed 22 May 2013, <http://www.escosa.sa.gov.au/library/120607-ElectricityStandingContractPriceAdjustment-FactSheet.pdf>. FaHCSIA, see Department of Families, Housing, Community Services and Indigenous Affairs Fan, S & Hyndman, R 2010, ‘The price elasticity of electricity demand in South Australia’, Energy Policy, vol. 39, no. 6, pp. 3709-19. Ferguson, M 2012a, ‘Media release: Contract for closure negotiation extended’, Department of Resources, Energy and Tourism, viewed 10 December 2013, <http://www.ret.gov.au/media-archive/Pages/contract-closure-negotiations-extended.aspx>.

59
Ferguson, M 2012b, ‘Media release: Contract for closure negotiations cease’, Department of Resources, Energy and Tourism, viewed 10 December 2013, <http://www.ret.gov.au/media-archive/Pages/cfc-cease.aspx> Filippini, M 1999, ‘Swiss residential demand for electricity’, Applied Economics Letters, vol. 6, pp. 533–538.
Frontier Economics 2013a, Client briefing: post hoc ergo propter hoc, Frontier Economics, Melbourne. Frontier Economics 2013b, ‘Review of AEMO’s 2013 National Electricity Forecasts’, A report prepared for the Australian Energy Market Operator. Garnaut, R 2008, Garnaut climate change review, Cambridge University Press, Melbourne. -- 2011a, ‘Transforming the electricity sector’ speech to the Melbourne recital centre, Melbourne 29 March, <http://www.garnautreview.org.au/update-2011/events-speeches/transforming-electricity-sector-transcript.html>. -- 2011b, Garnaut climate change review 2011: Australia in the global response to climate change, Cambridge University Press, Melbourne. Gullen Range Wind Farm 2014, ‘Community update 3’, Gullen Range Wind Farm, viewed on 30 April 2014, <http://www.gullenrangewindfarm.com/wp-content/uploads/2014/04/140416_GRWF_Newsletter.pdf> Hatfield-Dodds, S 2011, Assessing the effects of using a share of carbon price revenues for targeted tax reform: A report to the Garnaut Review 2011 update, CSIRO Energy Transformed Flagship, Canberra. Hatfield-Dodds, S, Feeney, K, Shepherd, L, Stephens, J, Garcia, C & Proctor, W 2011, The carbon price and the cost of living: assessing the impacts on consumer prices and households: A report to the Climate Institute, AECOM & CSIRO, Sydney, viewed 23 May 2013, <http://www.climateinstitute.org.au/verve/_resources/csiroaecom_carbonpriceandcostofliving_report_nov2011.pdf>. Hill, C & Cao, K 2013, ‘Energy use in the Australian manufacturing industry: An analysis of energy demand elasticity’, Australian Bureau of Statistics analytical services branch, viewed online 10 March 2014 < http://www.murdoch.edu.au/School-of-Management-and-Governance/_document/Australian-Conference-of-Economists/Energy-use-in-the-Australian-manufacturing-industry.pdf>
Hydro Tasmania 2011, ‘Work to start on $400m Musselroe wind farm’, Hydro Tasmania, viewed 10 February 2014, <http://www.hydro.com.au/about-us/news/2011-12/work-start-400m-musselroe-wind-farm>. -- 2013, Hydro Tasmania Annual Report 2013, Hydro Tasmania, Tasmania. -

60
Independent Competition and Regulatory Commission Australian Capital Territory 2007, ‘Final report retail prices for franchise electricity customers 2007-–8’ viewed 19 August 2013, <http://www.icrc.act.gov.au/wp-content/uploads/2013/02/2007report07_web1.pdf>. -- 2008, ‘Final report Retail prices for franchise electricity customers 2008-9’ viewed 19 August 2013, <http://www.icrc.act.gov.au/wp-content/uploads/2013/02/Final_Report_No_4_08-06-20_TFT.pdf>. -- 2009, ‘Final Decisions: Retail prices for non-contestable electricity customers 2009-10’ viewed 19 August 2013, <http://www.icrc.act.gov.au/wp-content/uploads/2013/02/Report_3_of_2009_5_Jun_2009_Web.pdf>. -- 2010, ‘Final report retail prices for franchise electricity customers 2010-–12’ viewed 19 August 2013, <http://www.icrc.act.gov.au/wp-content/uploads/2013/03/Report_7_of_2010_11_June_2010.pdf>. -- 2011, ‘Final Decision: Retail prices for non-contestable electricity customers 2011-2012’ viewed 19 August 2013, <http://www.icrc.act.gov.au/wp-content/uploads/2013/03/2011-12_Electricity_Rpt3_of_2011_20June11.pdf>. -- 2012, ‘Final report retail prices for franchise electricity customers 2012–14’ viewed 22 May 2013, <http://www.icrc.act.gov.au/wp-content/uploads/2013/03/Report_4_of_2012_June_2012.pdf>. -- 2013, ‘Final report retail prices for franchise electricity customers 2013–14’ viewed 17 May 2014, <http://www.icrc.act.gov.au/wp-content/uploads/2013/02/Report-4-of-2013-June-2013.pdf>.
Independent Pricing and Regulatory Tribunal of New South Wales 2007, ‘Overview of final report and determination on electricity retail prices in NSW’, Independent Pricing and Regulatory Tribunal, viewed on 15 August 2013, <http://www.ipart.nsw.gov.au/Home/Industries/Electricity/Reviews/Retail_Pricing/Review_of_Regulated_Retail_Tariffs_in_NSW_-_1_July_2007_to_30_June_2010>. -- 2009, ‘Annual Review of market-based electricity price purchase cost allowances’, Independent Pricing and Regulatory Tribunal of New South Wales, viewed 22 May 2013, <http://www.ipart.nsw.gov.au/Home/Industries/Electricity/Reviews/Retail_Pricing/2009_Annual_Review_of_market-based_electricity_price_purchase_cost_allowances>. -- 2010, ‘Review of regulated retail tariffs and charges for electricity 2010-2013’, Independent Pricing and Regulatory Tribunal, viewed 20 May 2013, <http://www.ipart.nsw.gov.au/Home/Industries/Electricity/Reviews/Retail_Pricing/Review_of_regulated_electricity_retail_tariffs_and_charges_for_small_customers_2010_to_2013>. -- 2012a, Final report: changes in regulated electricity retail prices from 1 July 2012, Independent Pricing and Regulatory Tribunal of New South Wales, Sydney.

61
-- 2013, Review of regulated retail prices for electricity 2013-2016 – final report, Independent Pricing and Regulatory Tribunal, Sydney.
Infigen 2013, ‘Wind energy FAQ’, Infigen, viewed 20 January 2014 <http://www.infigenenergy.com/renewable-energy/faq.html> IPART, see Independent Pricing and Regulatory Tribunal of New South Wales Jordan, T 2013a, ‘The Carbon Column April 26’, Deutsche Bank Market Research, viewed 20 May 2013, <http://pull.db-gmresearch.com/cgi-bin/pull/DocPull/530-F306/89719141/0900b8c086aed393.pdf>. -- 2013b ‘The Carbon Column April 12’, Deutsche Bank Market Research, viewed 20 May 2013, <http://pull.db-gmresearch.com/cgi-bin/pull/DocPull/4-35F6/58647264/0900b8c086a01091.pdf>. -- 2013c, ‘The Carbon Column June 14’, Deutsche Bank Market Research, viewed 15 June 2013, <http://pull.db-gmresearch.com/cgi-bin/pull/DocPull/527-38E7/12300594/0900b8c086e685b4.pdf>. Jotzo, F 2012, ‘Australia’s carbon price’, Nature Climate Change, vol.2, p.2. -- Jordan, T & Fabian, N 2012, ‘Policy uncertainty about Australia’s carbon price: expert survey results and implications for investment’, The Australian Economic Review, vol. 45, no. 4, pp. 395-409. Jotzo, F, Skarbek, A, Denis, A, Jones, A, Kelly, R, Ferraro, S, Kautto, N, Graham, P, Hatfield-Dodds, S, Adams, P 2014, ‘Australia’, in Sachs et al, Pathways to deep decarbonization: interim 2014 report, SDSN and IDDRI. King, CS & Chatterjee S 2003, ‘Predicting California demand response’, Public Utilities Fortnightly, vol. 141, pp. 27-32.
Lambley, R & Mills, T 2012, ‘Media release: getting power and water back on track’ Northern Territory Government newsroom, viewed 10 November 2013, <http://www.newsroom.nt.gov.au/index.cfm?fuseaction=viewRelease&id=10057&d=5>. Lawrie, D 2012, ‘Media release: carbon price adds $2.61 to average weekly PowerWater bill’, Northern Territory Government newsroom, viewed 10 November 2013, <http://newsroom.nt.gov.au/www.newsroom.nt.gov.au/index2cc6.html?fuseaction=viewRelease&id=9490&d=5>. Macquarie Generation 2013, Macquarie Generation 2012-13 Annual Report, Macquarie Generation, New South Wales. McLennan Magasanik Associates 2008, ‘Impacts of the carbon pollution reduction scheme on Australia’s electricity markets’, Department of Treasury, viewed on 10 January 2014, <http://archive.treasury.gov.au/lowpollutionfuture/consultants_report/downloads/Electricity_Sect

62
or_Modelling_Report_updated.pdf>. Melbourne Energy Institute 2012, ‘The future of electricity demand in Australia’, transcript from The future of electricity demand in Australia event, Melbourne on 22 August. Meridian 2013, ‘Mt Mercer wind project’, Meridian, viewed 10 February 2014, <http://www.meridianenergy.co.nz/about-us/generating-energy/our-generation-projects/mt-mercer-wind-project/> Molland, Halvor 2012, ‘Twitter account statement on impact of carbon tax 26 May 2012’ viewed 10 January 2014, <https://twitter.com/HalvorMolland/status/206313438530641920> National Emissions Trading Taskforce 2006. ‘Possible design for a national greenhouse gas emissions trading scheme’, Council for the Australian Federation, viewed 10 January 2014 <http://www.caf.gov.au/Documents/nett-discussion-paper.pdf>. National Australia Bank 2013, ‘CPI preview December 2012’, National Australia Bank, viewed 4 December 2013, <http://business.nab.com.au/wp-content/uploads/2013/01/cpi-preview-december-quarter-2012.pdf>. National Institute of Economic and Industry Research 2007, The own price elasticity of demand for electricity in NEM regions, report prepared for National Electricity Market Management Company.
NATSEM, see National Centre for Social and Economic Modelling. NERA Economic Consulting 2013, Projections of wholesale energy costs, report to the Australian Energy Market Commission, Sydney. Norsk Hydro 2012a, ‘Hydro is considering full curtailment of the Kurri Kurri aluminum plant in Australia’ Norsk Hydro, viewed 15 June 2013, <http://www.hydro.com/en/Press-room/News/Archive/2012/Hydro-is-considering-full-curtailment-of-the-Kurri-Kurri-aluminium-plant-in-Australia>. -- 2012b, ‘Hydro will close the Kurri Kurri aluminum plant’, Norsk Hydro, viewed 15 June 2013, <http://www.hydro.com/en/Press-room/News/Archive/Stock-exchange-announcements/2012/Hydro-will-close-the-Kurri-Kurri-aluminium-plant/>. OECD, see Organization for Economic Co-operation and Development OTTER, see Office of the Tasmanian Economic Regulator Office of the Tasmanian Economic Regulator 2012, ‘Media release: approval of 12-13 electricity prices’, Office of the Tasmanian Regulator, viewed 22 May 2013, <http://www.economicregulator.tas.gov.au/domino/otter.nsf/LookupFiles/Media_Release_Approval_of_2012-13_electricity_retail_tariff_22June2012.pdf/$file/Media_Release_Approval_of_2012-

63
13_electricity_retail_tariff_22June2012.pdf>. -- 2013a, ‘Media release: approval of standing offer electricity prices to apply from 1 January 2014’, Office of the Tasmanian Regulator, viewed 17 May 2014, <http://www.energyregulator.tas.gov.au/domino/otter.nsf/LookupFiles/134392_134511_Media_Release_Retail_Electricity_Prices_Apply_From_1_January_2014.PDF/$file/134392_134511_Media_Release_Retail_Electricity_Prices_Apply_From_1_January_2014.PDF>. -- 2013b, ‘Media release: approval of electricity prices to apply from 1 July 2013, Office of the Tasmanian Regulator, viewed 17 May 2014, <http://www.energyregulator.tas.gov.au/domino/otter.nsf/LookupFiles/132032_Web_Version_Media_release_-_approval_of_electricity_prices_to_apply_from_1_July_2013.PDF/$file/132032_Web_Version_Media_release_-_approval_of_electricity_prices_to_apply_from_1_July_2013.PDF>. Organization for Economic Co-operation and Development 2008, ‘Household Behaviour and the Environment: Reviewing the evidence’, OECD: Paris. Origin 2012, Energy for today and tomorrow: Shareholder review 2012, Origin, Sydney. -- 2013, Submission to the Department of the Environment on the carbon tax repeal, Origin, Sydney. OTER, see Office of the Tasmanian Economic Regulator Owen, G 2013 ‘Addressing Peak Demand: Opportunities and Risks for Vulnerable Households’ Research Paper for the Monash Sustainability Institute, Monash University. Pacific Hydro 2013, ‘Carbon Tax Repeal: submission to the carbon tax repeal taskforce’, Pacific Hydro, viewed 10 November 2013, <http://www.pacifichydro.com.au/files/2013/11/20131101_PHSubmission_CarbonRepeal.pdf>. Phillips, B & Taylor, M 2011, ‘Clean energy future plan: household modelling’, The National Centre for Social and Economic Modelling Research Note, no. 11. Pitt & Sherry 2013a, ‘Electricity demand falls as hydro growth continues’, Pitt & Sherry, viewed 19 May 2013, <http://www.pittsh.com.au/index.php?pageid=news&article=169>. -- 2013b, ‘Carbon emissions index’, Pitt & Sherry, viewed 19 May 2013, <http://www.pittsh.com.au/documents/CEDEX_ElectricityUpdateMay2013.pdf>. -- 2013c, ‘Carbon emissions index’, Pitt & Sherry, viewed 15 June 2013, <http://www.pittsh.com.au/cedex/>. -- 2013d, ‘Report: quantitative assessment of energy savings from building energy efficiency measures’, viewed 20 December 2013, <http://www.pittsh.com.au/assets/files/CE%20Showcase/Quantitative%20Assessment%20of%20Buildings%20Measures.pdf>.

64
-- 2014a, ‘Carbon emissions index January 2014’, Pitt & Sherry, viewed 15 February 2014, <http://www.pittsh.com.au/cedex/>. -- 2014b, ‘Carbon emissions index July 2014’, Pitt & Sherry, viewed 3 July 2014, <http://www.pittsh.com.au/assets/files/Cedex/CEDEX%20Electricity%20Update%20July%202014.pdf>. PowerWater Northern Territory 2012a, Annual report, PowerWater Northern Territory, viewed 10 November 2013, <http://www.powerwater.com.au/__data/assets/pdf_file/0016/47311/pwc_annualreport2012.pdf>. -- 2012b, ‘Media release: what the carbon price means for the average NT residential customer’, PowerWater Northern Territory, viewed 22 May 2013, <http://www.powerwater.com.au/__data/assets/pdf_file/0009/42867/cp_table.pdf>. -- 2013, Annual report, PowerWater Northern Territory, viewed 10 November 2013, <http://www.powerwater.com.au/__data/assets/pdf_file/0007/58417/pwc_annualreport2013.pdf>. Productivity Commission 2011, Carbon emission policies in key economies, Research Report, Productivity Commission, Commonwealth of Australia, Canberra. -- 2013, Electricity network regulatory frameworks, Report no. 62, Productivity Commission, Canberra. QCA, see Queensland Competition Authority Queensland Competition Authority 2008, ‘Remade final decision: 2008-09 benchmark retail cost index’, Queensland Competition Authority, viewed 15 August 2013, <http://www.qca.org.au/files/ER-NEP0809-QCA-RemadelDec0609.pdf>. -- 2009, ‘Notified electricity prices 2009-10’, Queensland Competition Authority, viewed 15 August 2013, <http://www.qca.org.au/electricity%2Dretail/NEP/NEP0910/FinalDec.php>. -- 2010, ‘Notified electricity prices 2010-11’, Queensland Competition Authority, viewed 15 August 2013, <http://www.qca.org.au/electricity%2Dretail/NEP/NEP1011/>. -- 2011, ‘Notified electricity prices 2011-12’, Queensland Competition Authority, viewed 15 August 2013, <http://www.qca.org.au/electricity%2Dretail/NEP/NEP1112/>. -- 2013a, ‘Notified electricity prices 2012-13’, Queensland Competition Authority, viewed 15 August 2013, <http://www.qca.org.au/electricity%2Dretail/NEP/NEP1213/>. --2013b, ‘Fact Sheet Residential electricity prices from 1 July 2013, Queensland Competition Authority, viewed 17 May 2014,

65
<http://www.qca.org.au/getattachment/e4f387f6-aba9-46e7-a6c3-0591acbacd6a/Residential-Tariffs.aspx>. The Queensland Government 2012, ‘Carbon price on electricity bills’, Department of Energy and Water Supply, viewed 22 May 2013, <http://www.energy.qld.gov.au/energy/carbon-price-on-electricity-bills.htm>. RATCH-Australia 2013, ‘Collinsville energy Park’, RATCH-Australia, viewed on 22 May 2013, <http://ratchaustralia.com/Collinsville%20Energy%20Park.html>. RBA, see Reserve Bank of Australia Reiss, PC 2005, ‘Household electricity demand revisited’, Review of Economic Studies, vol. 72, no. 3, pp. 853–883.
Reputex 2013a, ‘Power emissions fall to a ten year low as coal output drops’, Insight Article, Reputex, viewed 20 May 2013, <http://www.reputex.com/publications/latest-research/insights-articles/australian-power-emissions-fall-to-10-year-low-as-coal-output-drops/>. -- 2013b, ‘Natural gas fired generation to fall two-third without a carbon price’, Insight Article, Reputex, viewed 20 May 2013, <http://www.reputex.com/publications/gasgentofall/>. -- 2013c, ‘Coal generation: moving out of the crosshairs’, Reputex, viewed 26 December 2013 <http://www.reputex.com/publications/latest-research/coal-fired-generation-out-of-the-crosshairs/>. Reserve Bank of Australia 2012, Statement on Monetary Policy November 2012, Reserve Bank of Australia, Sydney. Reserve Bank of Australia 2013, ‘How electricity prices are set in Australia’, Reserve Bank of Australia, Sydney, viewed 20 January 2014 <http://www.rba.gov.au/foi/disclosure-log/pdf/101115.pdf>. Richardson, D 2013, ‘Electricity and privatisation: what happened to those promises’, The Australia Institute Technical Brief, no. 22, Canberra, viewed 10 August 2013, <http://www.tai.org.au/content/electricity-and-privatisation-what-happened-those-promises> Sachs, J, Tubiana, L, Guerin, E, Waisman, H, Mas, C, Colombier, M, Schmidt-Traub, G 2014, ‘Pathways to deep decarbonization: interim 2014 report’, SDSN and IDDRI. Santos 2013, Santos Submission on the Exposure Draft of the Clean Energy Legislation (Carbon Tax Repeal) Bill 2013 and associated legislative package, Santos, Adelaide. Saddler, H 2013a, ‘Black coal generators suffer as coal consumes get smart (and efficient)’ Renew Economy, 3 December 2013, viewed on 10 December 2013, <http://reneweconomy.com.au/2013/black-coal-generators-suffer-consumers-get-smart-efficient-20903>.

66
-- 2013b, ‘Power Down’, The Australia Institute, Institute Paper No.14, viewed 10 January 2014, <http://www.tai.org.au/content/power-down>. Shell 2012, ‘Media release: Shell to cease refining at Clyde’, Shell Australia, viewed 16 June 2013, <http://www.shell.com.au/aboutshell/media-centre/news-and-media-releases/archive/2011/clyde-cease-refining-27072011.html>. Simshauser, P 2014, ‘Energy Industry – Challenges Ahead’, AGL presentation to the Energy in 2014: More Mines than Fields Lecture, 28 May.
SKM MMA 2012, ‘Benefit of the Renewable Energy Target to Australia’s Energy Markets and Economy’, Report to the Clean Energy Council, SKM MMA, Melbourne. Stanwell Corporation Limited 2012a, ‘Media release: Stanwell to withdraw Tarong Power Station units from service’ Stanwell, viewed 23 May 2013, <http://www.stanwell.com/Files/Stanwell_Media_Release_-_Stanwell_to_withdraw_Tarong_Power_Station_units_from_service_-_11_October_2012.PDF>. -- 2012b, ‘Media release: Swanbank B power station fires up for the last time’, Stanwell, viewed 23 May 2013, <http://www.stanwell.com/Files/Swanbank_B_Power_Station_fires_up_for_the_last_time.pdf>. --2012c, Stanwell Annual Report 2011, Stanwell, Queensland.
--2013a, Stanwell Annual Report 2012-13, Stanwell, Queensland. --2013b, ‘Media release: Stanwell to withdraw Swanbank power station from service’, Stanwell, viewed 5 February 2014, <http://www.stanwell.com/Files/Stanwell_Media_Release_-_Stanwell_to_withdraw_Swanbank_Power_Station_from_service___5_February_2014.PDF>. Steffen, W 2013, The angry summer, Climate Commission Secretariat, Commonwealth of Australia, Canberra.
Synergy 2011, Synergy life winter newsletter, Synergy, viewed 10 May 2014, <http://www.synergy.net.au/docs/Synergy_Life_Winter_2011.pdf>. -- 2012a, Synergy life winter newsletter, Synergy, viewed 10 May 2014, <http://www.synergy.net.au/docs/Synergy_Life_Winter_2012.pdf>. -- 2012b, ‘Synergy releases expected impact of carbon on electricity prices’, Synergy, viewed 10 May 2014, <https://www.synergy.net.au/docs/MR-Synergy-releases-expected-carbon-impact-on-resdential-prices.pdf>.
-- 2013, Synergy frequently asked questions’, Synergy, viewed 10 May 2014, <https://www.synergy.net.au/faq/price_increases.xhtml>.

67
Taylor, T, Schwarz, P & Cochell, J 2005, ‘24/7 hourly response to electricity real-time pricing with up to eight summers of experience‘, Journal of Regulatory Economics, vol. 27, no. 3, pp. 235–262. Treasury, see Department of the Treasury University of Queensland 2013, ‘Solar thermal plans for Collinsville power station’, University of Queensland, viewed on 23 May 2013, <http://www.uq.edu.au/news/index.html?article=25868>. Warren, M 2013, ‘Industry manages expectations ahead of carbon tax repeal’, interview on ABC The World Today, viewed 10 November 2013 <http://www.abc.net.au/worldtoday/content/2013/s3884951.htm>. Westpac 2013a, ‘Westpac Bulletin July 2013’, Westpac, viewed on 4 December 2013, <http://www.westpac.com.au/docs/pdf/aw/economics-research/er20130724BullCPI2013Q2.pdf >. -- 2013b, Submission to the Department of the Environment on the carbon tax repeal, Westpac, Sydney. Wilcox, I 2013, ‘Repeal of the Clean Energy Act and related legislation’, Submission to the Department of Environment, Australian Industry Group, viewed 10 November 2013, <http://www.aigroup.com.au/portal/binary/com.epicentric.contentmanagement.servlet.ContentDeliveryServlet/LIVE_CONTENT/Policy%2520and%2520Representation/Submissions/Environment%2520and%2520Energy/2013/Submission_carbon_price_repeal_November_2013.pdf>. Wild P, Bell, P & Foster, J 2012, ‘Impact of Carbon Prices on Wholesale Electricity Prices, Carbon Pass- Through Rates and Retails Electricity Tariffs in the NEM’, Energy Economics and Management Group Working Paper 5, University of Queensland, viewed 19 May 2013, <http://www.uq.edu.au/eemg/docs/workingpapers/2012-5.pdf>. Wood, T 2013 ‘Energy plans zapped by diving demand’, Business Spectator, 19 March 2013, viewed 15 June 2013, <http://grattan.edu.au/static/files/assets/68b3add3/196_wood_oped_businessspectator_energy.pdf>. Wood, T & Carter, L 2013, ‘Shock to the System: Dealing with Falling Electricity Demand’, Grattan Institute, Report no. 2013-15. World Bank 2012, ‘Electricity production from coal’, World Bank Data, viewed on 5 November, <http://data.worldbank.org/indicator/EG.ELC.COAL.ZS>. Vivid Economics 2013, Analysis of electricity consumption, electricity generation emissions intensity and economy-wide emissions, report prepared for the Climate Change Authority.