Restoring electricity affordability and Australia’s competitive …Electricity... · restore...
398
Restoring electricity affordability and Australia’s competitive advantage Retail Electricity Pricing Inquiry—Final Report June 2018 accc.gov.au
Transcript of Restoring electricity affordability and Australia’s competitive …Electricity... · restore...

Restoring electricity affordability and Australia’s competitive advantage Retail Electricity Pricing Inquiry—Final Report
June 2018
accc.gov.au

ii Retail Electricity Pricing Inquiry—Final Report
ISBN 978 1 920702 34 2
Australian Competition and Consumer Commission 23 Marcus Clarke Street, Canberra, Australian Capital Territory, 2601
© Commonwealth of Australia 2018
This work is copyright. In addition to any use permitted under the Copyright Act 1968, all material contained within this work is provided under a Creative Commons Attribution 3.0 Australia licence, with the exception of:• the Commonwealth Coat of Arms• the ACCC and AER logos• any illustration, diagram, photograph or graphic over which the Australian Competition and Consumer Commission does not hold
copyright, but which may be part of or contained within this publication.
The details of the relevant licence conditions are available on the Creative Commons website, as is the full legal code for the CC BY 3.0 AU licence.
Requests and inquiries concerning reproduction and rights should be addressed to the Director, Content and Digital Services, ACCC, GPO Box 3131, Canberra ACT 2601.
Important notice
The information in this publication is for general guidance only. It does not constitute legal or other professional advice, and should not be relied on as a statement of the law in any jurisdiction. Because it is intended only as a general guide, it may contain generalisations. You should obtain professional advice if you have any specific concern.
The ACCC has made every reasonable effort to provide current and accurate information, but it does not make any guarantees regarding the accuracy, currency or completeness of that information.
Parties who wish to re-publish or otherwise use the information in this publication must check this information for currency and accuracy prior to publication. This should be done prior to each publication edition, as ACCC guidance and relevant transitional legislation frequently change. Any queries parties have should be addressed to the Director, Content and Digital Services, ACCC, GPO Box 3131, Canberra ACT 2601.
ACCC 06/18_1361
www.accc.gov.au

iii Retail Electricity Pricing Inquiry—Final Report
ContentsExecutive summary iv
Recommendations xvii
Abbreviations xxvi
1. Setting the scene 1
Part 1: Boosting competition in generation and retail markets 382. Wholesale market—where are we now? 403. What has been driving wholesale prices? 544. Wholesale market—is intervention required? 885. Contract markets and their impacts 1046. Retail competition 134
Part 2: Lowering supply chain costs 1547. Network costs 1568. Demand response and stand-alone power systems 2009. Environmental costs 21210. Retail costs 221
Part 3: Improving consumer experiences and outcomes 23311. Levels of engagement 23612. Standing offer 24013. Advertising and marketing 25314. Tools to assist consumers in navigating the market 27415. Additional protections for vulnerable consumers 29116. Measuring outcomes and improvements in the market and appropriate tools
for the AER 31817. Is the current regulatory framework fit for purpose? 328
Part 4: Business customers 33318. Improving outcomes for business customers 335
Appendix 1: Terms of reference 355
Appendix 2: Summary of the Inquiry 356
Appendix 3: Relevant consumer protection work by other agencies 358
Appendix 4: Public submissions to the Preliminary Report 364
Appendix 5: Assumptions for achievable savings 366
Appendix 6: HoustonKemp: Investigating wholesale electricity market outcomes—Methodology report
Appendix 7: HoustonKemp: Analysis of NEM events—Final results presentation
Appendix 8: HoustonKemp: Impact of gas powered generation on wholesale market outcomes—Final results presentation
Appendix 9: HoustonKemp: International review of market power mitigation measures in electricity markets
Appendix 10: CSIRO: Residential electricity tariff analyses
Appendix 11: The Brattle Group: International Experiences in Retail Electricity Markets—Consumer issues
Appendix 12: Colmar Brunton: Consumer Outcomes in the National Retail Electricity Market—Final report

iv Retail Electricity Pricing Inquiry—Final Report
Executive summaryAustralia is facing its most challenging time in electricity markets. High prices and bills have placed enormous strain on household budgets and business viability. The current situation is unacceptable and unsustainable.
The approach to policy, regulatory design and promotion of competition in this sector has not worked well for consumers. Indeed, the National Energy Market (NEM) needs to be reset, and this report sets out a plan for doing this.
The ACCC’s package of recommendations is wide ranging, which also reflects the nature of the mandate given to it by the Inquiry’s terms of reference. Some recommendations can be readily implemented within existing market, industry and policy structures. Others are more ambitious and their development and implementation may be challenging in the absence of a commitment by all participants—governments, industry, regulators, policy makers, consumer bodies and consumers themselves—to move away from existing modes of thinking and practices.
These challenges should not prevent, or unduly delay, what we consider are necessary measures to restore affordability and Australia’s competitive advantage in electricity. The ACCC’s final report from the Retail Electricity Pricing Inquiry examines the many causes of problems in the electricity market and sets out 56 recommendations that will bring down prices and restore consumer confidence and Australia’s competitive advantage. These recommendations span the entire supply chain, focusing on four key areas:
1. Boosting competition in generation and retail
2. Lowering costs in networks, environmental schemes and retail
3. Enhancing consumer experiences and outcomes
4. Improving business outcomes.
Removing unnecessary costs for customers is a vital economic reform with at least two important economic benefits. First, it improves equity as low income households pay a much higher share of disposable income on electricity. They should not be paying more for electricity because of poor past decisions or inappropriate market behaviour. Second, our recommendations will boost our overall welfare as we avoid industries closing due to paying unnecessarily high electricity costs.
Significant gains can be made for consumers and businesses if these recommendations are adopted. The NEM1 can be restored to an efficient, fair and competitive market that works in the interests of end users.
The following describes the key issues the ACCC has identified and, in summary form, sets out many of the core recommendations from this report. A full list of recommendations follows at page xix.
How did we get here?There are many causes of the current problems in the electricity market. At all stages of the supply chain decisions have been made over many years by many governments that set the NEM on the wrong course.
In networks, the framework that governs regulation of monopoly infrastructure was loosened, leaving the regulator with limited ability to constrain excess spending by network owners. The limited merits review (LMR) regime allowed network owners to appeal regulatory decisions and recover billions of additional dollars from consumers. It led to significant increases in prices, has drawn out the length of time taken for revenue determinations, and has created significant uncertainty around network pricing. In addition, increased expenditure on networks was driven by reliability standards for some networks that were set too high, without due regard for consumers’ willingness to pay for marginal increases in reliability.
1 The National Energy Market comprises South Australia, Victoria, Tasmania, NSW, the ACT and Queensland.
v Retail Electricity Pricing Inquiry—Final Report
In generation, against ACCC advice, the Queensland and New South Wales (NSW) governments made decisions regarding the operation and ownership of generation assets giving rise to concentrated markets. In Queensland, the government consolidated the generation assets of three businesses into two. In NSW, as one example, both generators owned by Macquarie Generation were sold to AGL, missing an opportunity to deliver a competitive market structure by selling them to separate buyers.
Most state governments put in place excessively generous solar feed-in tariff schemes with a view to encouraging consumers to install solar photovoltaic (PV) systems. Under these schemes, the subsidy paid to consumers for the energy produced by their systems outweighed, by many multiples, the value of that energy. Take up of the schemes exceeded all expectations, in part due to dramatic declines in solar PV installation costs. The substantial cost of the schemes continues to be spread across all electricity users.
The main enduring policy instrument for encouraging low-emissions electricity generation is the Renewable Energy Target. While it has been effective at encouraging wind and solar generation capacity installation, it has also distorted the investment that has occurred in the transition from higher carbon technologies to lower ones. The subsidies received for installing wind and solar made the business case for doing so compelling but did so in a way that was indifferent to the ability to provide energy to the market when demand requires it.
At a time when gas-powered generation has become more important with the exit of large coal-fired plants, the extent of LNG exports from the East Coast and government moratoria on on-shore gas exploration and development have stifled the availability of gas at a low price.
Electricity retailers have also played a major role in poor outcomes for consumers. Retailers have made pricing structures confusing and have developed a practice of discounting which is opaque and not comparable across the market. Standing offers are priced excessively to facilitate this practice, leaving inactive customers paying far more than they need to for electricity. Pay on time discounts, which have emerged as a response to attempts to constrain late payment fees, are excessive and punitive for those customers who fail to pay bills on time.
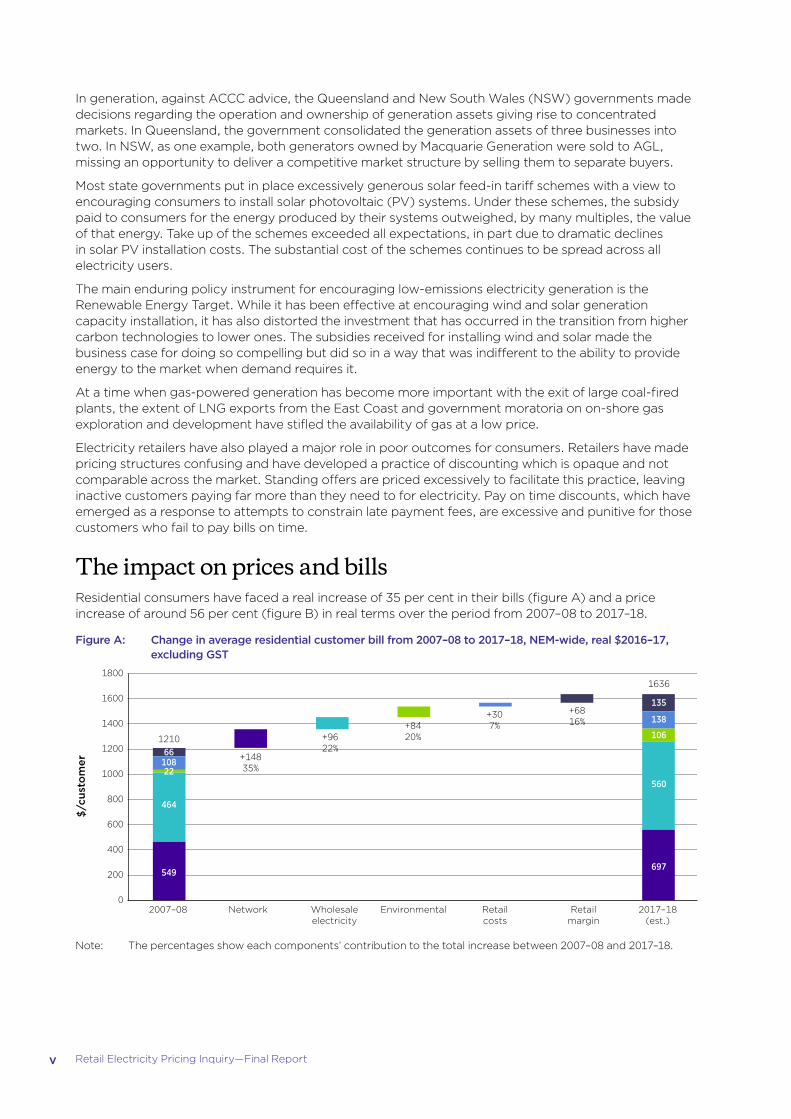
The impact on prices and billsResidential consumers have faced a real increase of 35 per cent in their bills (figure A) and a price increase of around 56 per cent (figure B) in real terms over the period from 2007–08 to 2017–18.
Figure A: Change in average residential customer bill from 2007–08 to 2017–18, NEM-wide, real $2016–17, excluding GST
2017–18(est.)
Retailmargin
Retailcosts
EnvironmentalWholesaleelectricity
Network2007–080
200
400
600
800
1000
1200
1400
1600
1800
+9622%
+8420%
+307%
+6816%
+14835%
$/cu
sto
mer
1636
135
138
106
560
697
121066
10822
464
549
Note: The percentages show each components’ contribution to the total increase between 2007–08 and 2017–18.

vi Retail Electricity Pricing Inquiry—Final Report
Figure B: Change in average residential customer effective prices (c/kWh) from 2007–08 to 2017–18, NEM-wide, real $2016–17, excluding GST
2017–18(est.)
Retailmargin
Retailcosts
EnvironmentalWholesaleelectricity
Network2007–08
c/kW
h
0
5
10
15
20
25
30
35
+2.827%
+1.615%
+0.88%
+1.413%
+4.038%
29.6
2.4
2.5
10.1
1.9
12.6
19.0
1.01.70.4
7.3
8.6
Note: The percentages show each components’ contribution to the total increase between 2007–08 and 2017–18.
The difference between these two increases is due to a 13.3 per cent decrease in average electricity usage from 2007–08 to 2017–18. The decline in average usage is driven by various factors. The primary factor is the increase in the number of consumers with solar PV. The proportion of solar customers in the NEM was less than 0.2 per cent in 2007–08. This has increased to over 12 per cent in 2017–18. These consumers use less grid-sourced electricity than they otherwise would have.
Solar customers are paying, on average, $538 per year less than non-solar customers, suggesting that affordability concerns are most acute for those customers who have not (and possibly cannot) install solar PV.
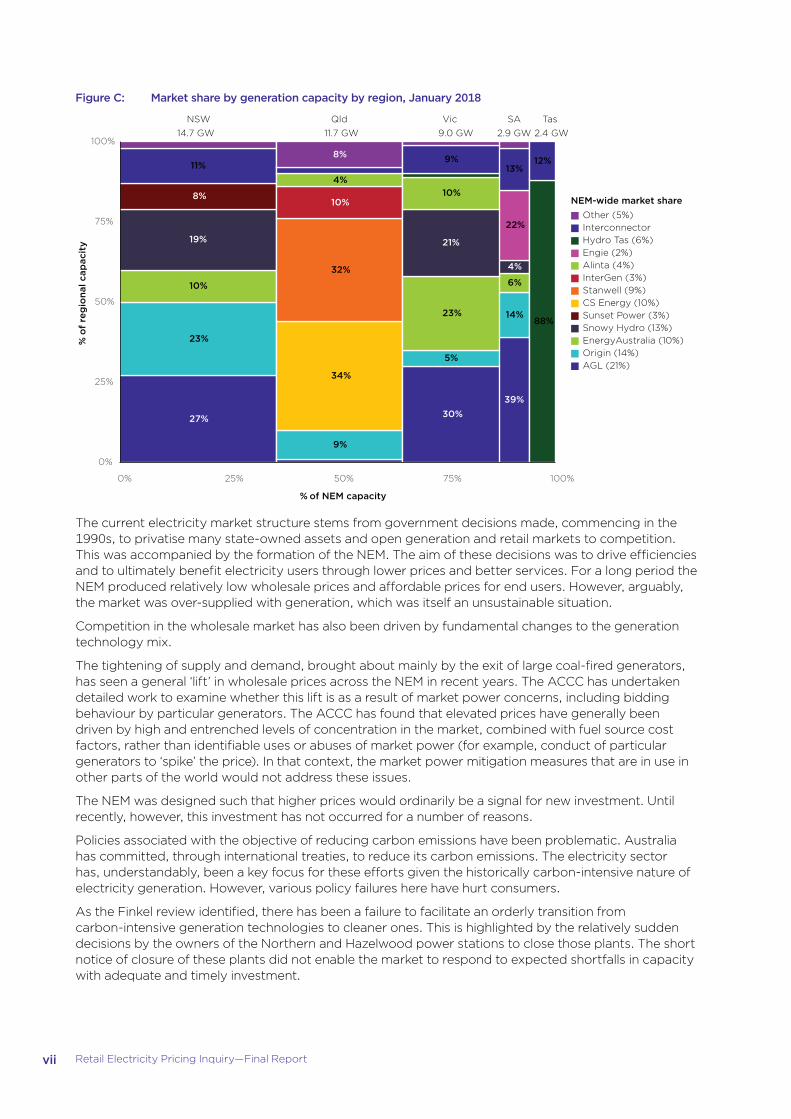
Competition in generationMarket concentration in the NEM has recently increased, through both acquisitions and closures of significant assets (figure C). The NEM is an energy only gross pool for the wholesale bidding and dispatch of electricity. These features of the market design mean that competition in bidding among rival generators is critical for driving efficient prices. Where markets are concentrated this can significantly affect bidding behaviour dramatically and lead to prices above efficient levels.
vii Retail Electricity Pricing Inquiry—Final Report
Figure C: Market share by generation capacity by region, January 2018
27%
23%
10%
19%
8%
11%
9%
34%
32%
10%
4%
8%
39%
14%
6%
4%
22%
13%
88%
12%
30%
5%
23%
21%
10%
9%
NSW Qld SA TasVic14.7 GW 11.7 GW 2.9 GW 2.4 GW9.0 GW
0%
25%
50%
75%
100%
0% 25% 50% 75% 100%
% of NEM capacity
% o
f re
gio
nal c
apac
ity
Other (5%)InterconnectorHydro Tas (6%)Engie (2%)Alinta (4%)InterGen (3%)Stanwell (9%)CS Energy (10%)Sunset Power (3%)Snowy Hydro (13%)EnergyAustralia (10%)Origin (14%)AGL (21%)
NEM-wide market share
The current electricity market structure stems from government decisions made, commencing in the 1990s, to privatise many state-owned assets and open generation and retail markets to competition. This was accompanied by the formation of the NEM. The aim of these decisions was to drive efficiencies and to ultimately benefit electricity users through lower prices and better services. For a long period the NEM produced relatively low wholesale prices and affordable prices for end users. However, arguably, the market was over-supplied with generation, which was itself an unsustainable situation.
Competition in the wholesale market has also been driven by fundamental changes to the generation technology mix.
The tightening of supply and demand, brought about mainly by the exit of large coal-fired generators, has seen a general ‘lift’ in wholesale prices across the NEM in recent years. The ACCC has undertaken detailed work to examine whether this lift is as a result of market power concerns, including bidding behaviour by particular generators. The ACCC has found that elevated prices have generally been driven by high and entrenched levels of concentration in the market, combined with fuel source cost factors, rather than identifiable uses or abuses of market power (for example, conduct of particular generators to ‘spike’ the price). In that context, the market power mitigation measures that are in use in other parts of the world would not address these issues.
The NEM was designed such that higher prices would ordinarily be a signal for new investment. Until recently, however, this investment has not occurred for a number of reasons.
Policies associated with the objective of reducing carbon emissions have been problematic. Australia has committed, through international treaties, to reduce its carbon emissions. The electricity sector has, understandably, been a key focus for these efforts given the historically carbon-intensive nature of electricity generation. However, various policy failures here have hurt consumers.
As the Finkel review identified, there has been a failure to facilitate an orderly transition from carbon-intensive generation technologies to cleaner ones. This is highlighted by the relatively sudden decisions by the owners of the Northern and Hazelwood power stations to close those plants. The short notice of closure of these plants did not enable the market to respond to expected shortfalls in capacity with adequate and timely investment.
viii Retail Electricity Pricing Inquiry—Final Report
While many incumbents have pointed to the lack of an enduring and stable climate change policy as a cause of investment uncertainty and under-investment, at the same time, they have had little incentive to invest in new capacity when they are reaping the benefits of higher spot and futures prices.
The National Energy Guarantee seeks to more clearly link the introduction of lower emissions generation sources to the ability to call on generators to produce energy when it is most needed. To the extent that this policy can encourage investment in capacity from a diverse range of sources, diluting market concentration and promoting competition to supply retailers, the policy should assist in delivering electricity affordability.
It is crucial that the NEG includes safeguards to ensure that the new obligations on retailers do not deliver large incumbents advantages in complying with the scheme, such as those afforded to them through ownership of significant generation portfolios. The Energy Security Board has recognised this risk in the development of the NEG and has sought to address it through mechanisms that will be built into the design of the policy. The ACCC supports the incorporation of such safeguards to improve liquidity and encourage transparency.
Another major factor in wholesale prices has been the significant shortages in competitively priced gas at a time when gas-powered generation would often be the logical source of replacement for lost coal-fired capacity. Gas prices have doubled or tripled in recent years. We estimate that for every $1/GJ rise in gas prices, the wholesale price of electricity rises by up to $11/MWh, depending on regional differences in the NEM. Encouraging increased supply of competitively priced gas is crucial to moderating electricity prices. The ACCC’s Gas Inquiry is continuing efforts to this end.
The ACCC is recommending a number of interventions to deal with concentration in generation markets:
�� There should be a prohibition on acquisitions and other arrangements (other than investment in new capacity) that would limit market shares to 20 per cent in any NEM region and across the NEM as a whole to prevent further harmful concentration (recommendation 1).
�� The Queensland Government should divide its generation assets into three generation portfolios to reduce market concentration in Queensland, with each portfolio separately owned and operated to drive competition in generation markets (recommendation 2).
�� The AER should be given powers to address conduct which has the effect of manipulating the proper functioning of the wholesale market, together with the necessary investigative powers and appropriate remedies (recommendation 3).
�� The Australian Government should operate a program under which it will enter into low fixed-price (for example, $45–$50/MWh) energy offtake agreements for the later years (say 6–15) of appropriate new generation projects which meet certain criteria. In doing so, project developers will be able to secure debt finance for projects where they do not have sufficient offtake commitments from C&I customers for later years of projects. This will encourage new entry, promote competition and enable commercial and industrial customers to access low-cost new generation (recommendation 4).
�� A mechanism should be developed to enable third parties to offer demand response directly into the wholesale market, thereby providing an additional source of competition (recommendation 21).
As noted above, the ACCC also supports the development and implementation of the National Energy Guarantee, incorporating appropriate safeguards for competition in the contract market, as a way to achieve a settled policy framework under which new investment is encouraged in a way that reduces carbon emissions at low-cost while promoting investment in a manner that ensures demand for energy is met (recommendation 5).
ix Retail Electricity Pricing Inquiry—Final Report
Wholesale hedging contractsThe ACCC has also undertaken a detailed review of the hedging contract market. Apart from contracts traded on the Australian Securities Exchange (ASX), the contract market is generally opaque. In certain regions of the NEM, particularly South Australia, the level of liquidity and the advantages enjoyed by vertically integrated retailers make it difficult for new entrants and smaller retailers to compete effectively in the retail market. As noted above, the Energy Security Board is dealing with a related issue in the design of the National Energy Guarantee. However, the circumstances in which requirements will bind under the National Energy Guarantee will only be where reliability shortfalls are identified, which may be infrequent.
The ACCC has identified concerns with transparency of hedge contracting more generally. In particular, the over-the-counter (OTC) contracting market is opaque and this is a source of information asymmetry in the market. Unlike contracts traded on the ASX, there is limited public disclosure of OTC trading, which limits price discovery.
The ACCC is recommending changes to improve transparency and competition in the contract market. First, OTC trades should be reported to a repository administered by the AER and publicly disclosed in a de-identified format (recommendation 6). The requirement should be implemented to align with (or be eligible for) any OTC reporting requirements under the National Energy Guarantee. Second, the AEMC should implement a market making obligation in South Australia whereby generators must offer to buy and sell a certain amount of electricity contracts each day (recommendation 7).
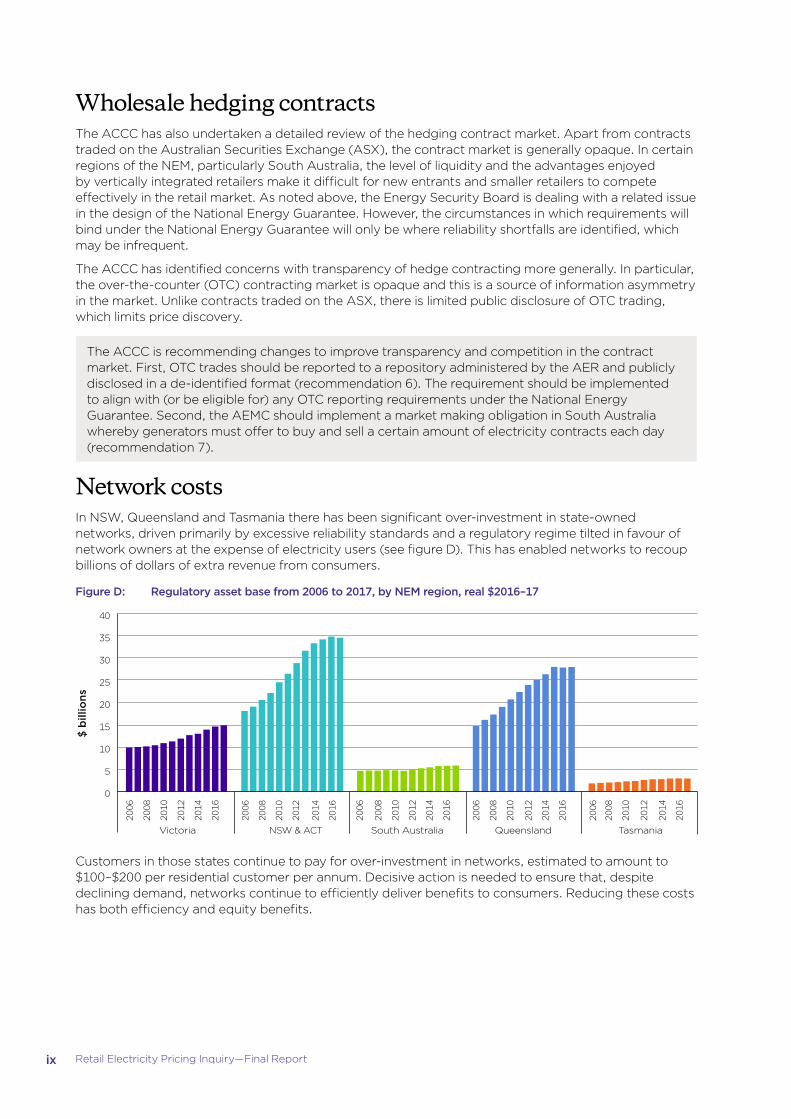
Network costsIn NSW, Queensland and Tasmania there has been significant over-investment in state-owned networks, driven primarily by excessive reliability standards and a regulatory regime tilted in favour of network owners at the expense of electricity users (see figure D). This has enabled networks to recoup billions of dollars of extra revenue from consumers.
Figure D: Regulatory asset base from 2006 to 2017, by NEM region, real $2016–17
2006
2008
2010
2012
2014
2016
2006
2008
2010
2012
2014
2016
2006
2008
2010
2012
2014
2016
2006
2008
2010
2012
2014
2016
2006
2008
2010
2012
2014
2016
NSW & ACT
0
5
10
15
20
25
30
35
40
Victoria South Australia Queensland Tasmania
$ b
illio
ns
Customers in those states continue to pay for over-investment in networks, estimated to amount to $100–$200 per residential customer per annum. Decisive action is needed to ensure that, despite declining demand, networks continue to efficiently deliver benefits to consumers. Reducing these costs has both efficiency and equity benefits.

x Retail Electricity Pricing Inquiry—Final Report
The ACCC is recommending that the governments of Queensland, NSW and Tasmania should take immediate steps to remedy the over-investment of their network businesses in order to improve affordability for consumers (recommendation 11). With appropriate assistance from the Australian government, this can be done:
�� in Queensland, Tasmania and for Essential Energy in NSW, through a voluntary government write-down of the regulatory asset base
�� in NSW, where the assets have since been fully or partially privatised, through the use of rebates on network charges (paid to the distribution company to be passed on to consumers) that offset the impact of over-investment.
The amount of the write-downs and rebates should be made by reference to the estimates of over-investment by the Grattan Institute, and should result in at least $100 a year in savings for average residential customers in those states.
The limited merits review regime, the appeals process that enabled networks to successfully challenge AER determinations on allowable network revenues, was removed in late 2017. This is a welcome step forward that will limit gaming of the regulatory system by network companies and the ACCC recommends limited merits review of AER decisions should not be reinstated in the future (recommendation 10).
Environmental costsSignificant take up of rooftop solar PV has seen both benefits and costs for consumers. State governments implemented very generous solar feed-in tariff schemes that paid consumers many multiples of the value of energy produced by their systems. Take up of the schemes was significantly in excess of expectations, in part due to dramatic declines in solar PV installation costs. The substantial cost of the schemes continues to be spread across all electricity users (figure E).
Figure E: Environmental costs in residential customer bills by state, 20017–18, real $2016–17
$/cu
sto
mer
NEMTasmaniaQueenslandSouth AustraliaNSWVictoria0
20
40
60
80
100
120
140
160
180
SRES StateLRET FiT
93109
170
76
155
106
587
21%
14%
16%
49%
23%
11%
17%
49%
43%
18%
10%
29%
23%
77%
29%
20%
52%
23%
10%
17%
50%
Solar feed-in tariff schemes have also had distributional effects on energy affordability. Those households that have installed solar PV have benefited from the generous solar feed-in tariffs and also received subsidies for the installation of the system itself through the small scale renewable energy scheme (SRES). Solar households have reduced consumption of electricity from the grid significantly. Solar customers are paying, on average, $538 per year less than non-solar customers. Meanwhile, non-solar households and businesses have faced the burden of the cost of premium solar feed-in tariff schemes and the SRES. While premium solar schemes are closed to new consumers, the costs of these schemes are enduring. Reducing these costs will have efficiency and equity benefits.
xi Retail Electricity Pricing Inquiry—Final Report
The ACCC is recommending that any costs remaining from premium solar feed-in schemes should be borne by state governments through their budgets, as Queensland has done, rather than being recovered through charges to electricity users (recommendation 25).
Further, the ACCC is recommending that the SRES should be wound down and abolished by 2021 to reduce its impact on retail prices paid by consumers (recommendation 24).
Consumer outcomes and experiencesIn retail markets, privatisation generally resulted in the transfer of a large customer base to each of a small number of retailers. This has had profound effects on the development of retail competition. Large retailers enjoy significant advantages of scale and their much smaller rivals must spend large sums to attract and acquire customers. Meanwhile, incumbents have benefited from large parts of their customer bases being inactive or disengaged from the competitive market, often remaining on high-priced standing offers. Incumbents are able to make very attractive offers to retain customers, effectively through cross-subsidies paid by their inactive customer cohort. This has enabled incumbents to compete only selectively, and with a disproportionate focus on efforts to retain profitable customers rather than to win new ones. In that environment, new entrants and smaller retailers are competing only for the ‘active’ part of the market which is price sensitive and often low-margin. This model of competition has not delivered a dynamic and competitive market in which many retailers compete vigorously, driving efficiencies and providing innovative products to attract and retain a broad range of customers.
Retail costs, particularly those associated with acquiring customers (such as marketing and commissions paid to third party comparators) are significant and have been growing since markets were opened to competition.
Those customers who have been active in the market, regularly reviewing options and switching between offers, have been the beneficiaries of competition. These customers are likely paying less than the average cost to retailers of supplying electricity. The full extent of costs associated with attracting and retaining customers are therefore borne by inactive or loyal customers and those unable to navigate the complexities of the market. The gap between the best and worst offers in the market has been widening, effectively acting as a tax on disengaged customers, whether a customer is disengaged by choice or because of the unnecessary complexity.
The dominant form of competition among retailers has been the advertisement of large headline ‘discounts’ which retailers have observed are an effective and simple way to connect with price conscious consumers. These discounts are highly problematic for several reasons. Each retailer sets its discounts with reference to its own independently set prices (usually standing offer prices) meaning that there is no easy way to compare the headline discount of one retailer to that of another. In many cases, consumers will be better off with offers that have lower discounts attached to them but which have a lower underlying tariff rate. A further problem with discounting is the common practice of the discount being conditional on the customer paying on time. These discounts are achieved only 56 per cent of the time for payment plan customers and only 42 per cent of the time for hardship customers (see figure F). Customers who do not pay on time are, in effect, paying very large late payment penalties, often amounting to hundreds of dollars per year.

xii Retail Electricity Pricing Inquiry—Final Report
Figure F: Proportion of time customer groups achieve conditional discounts, residential non-solar customers, 2016–17
0%
20%
40%
60%
80%
Residential customersNon-hardshipconcession customers
Payment plancustomers
Hardship customers
% o
f ti
me
cust
om
ers
achi
eve
dis
coun
t
42%
56%
76%73%
These practices create significant confusion for consumers, causing some consumers to make decisions based on simple indicators (such as which headline discount is largest), to use third party comparator services (which add costs to the supply chain through the commissions they charge to retailers) or to disengage altogether.
Protections for vulnerable consumers are not as targeted and effective as they could be and there is more we can do to help these consumers.
The market has evolved in such a way that standing offers, which were originally intended as a default protection for consumers who were not engaged in the market, have been used by retailers as a high-priced benchmark from which their advertised market offers are derived. Many of the protections contained in the standing offer remain important for those consumers who need access to these, for example, customers with poor credit histories and customers who need to access certain billing and payment features.
Consumers facing particular hardship and socioeconomic barriers to effective engagement in the electricity market are unlikely to get all of the benefits that competition can offer in this market.
This is an important opportunity to empower consumers and businesses through greater access to their electricity usage data. Data currently available is of limited use to consumers and also any third party wanting to provide services to a consumer. The application of the Consumer Data Right to the electricity sector will see opportunities for electricity usage data to be made available to consumers and, importantly, agents of consumers where consent is provided. This will then enable consumers themselves to make better use of data and present opportunities for innovation by third parties providing services to consumers in finding the best electricity offer. It should also drive efficiencies in the market more generally as switching becomes more ‘frictionless’ and consumers are more readily able to identify and move to the best offers. This is a significant, albeit longer-term, opportunity to address the significant retail costs that exist in the market as retailers will find they do not get returns on their investments in acquiring customers through means other than competitive pricing and innovative product and service offerings.
Improving the powers and penalties of the AER will also help ensure better outcomes for consumers.

xiii Retail Electricity Pricing Inquiry—Final Report
The ACCC is recommending a package of changes to improve retail outcomes and experiences for consumers:
�� abolishing the standing offer and replacing it with a lower-priced ‘default offer’ which can be priced no higher than a level determined by the AER (recommendation 30)
�� requiring any advertising of discounts by retailers to be unconditional and referenced to the default offer rate (recommendation 32)
�� restricting conditional discounts to be no more than the reasonable savings to the retailer from the condition being met (recommendation 33)
�� pursuing access to data for electricity users through the Consumer Data Right (recommendation 31)
�� a prescribed mandatory code of conduct for third party intermediaries which includes an obligation that any recommended offer is in the best interests of the consumer (rather than on the basis of the intermediary’s commercial relationships) (recommendation 34)
�� clarifying explicit informed consent provisions to make clear that consumers can provide their consent to third party intermediaries to give explicit informed consent (EIC) on their behalf (recommendation 35)
�� improving concession schemes including by applying a means test to ensure they are targeted at those most in need and instituting a hybrid approach to applying energy concessions that is consistent across the NEM, including a fixed dollar amount to offset daily supply charges and a percentage discount to offset variable usage charges (recommendation 37)
�� additional government funding (to a value of $5 per household in each NEM region, or $43 million NEM-wide, per annum) for a grant scheme for consumer and community organisations to provide targeted support to assist vulnerable consumers to improve energy market literacy (recommendation 38)
�� increases in penalties to all civil penalty provisions to the same levels as those to be introduced in the Australian Consumer Law (ACL) ($10 million, three times the benefit gained or 10 per cent of turnover) (recommendation 42).

xiv Retail Electricity Pricing Inquiry—Final Report
Business outcomesIn the small business sector, a large proportion of small businesses remain on standing offers. Small businesses face many of the same challenges as residential consumers, and the ACCC recommends improved and targeted business information for small business from governments and energy agencies, as well as ongoing price reporting of small business outcomes and the effect of progress of reforms on the small business market.
Larger businesses, faced with higher electricity costs, have been doing what they can to lower these costs through formation of buying groups and seeking to self-supply some of their load. There are some examples of these measures being effective, however it appears that more support for these arrangements could further reduce pressure on businesses’ electricity costs.
For example, the investment case and ability to source funding for many new generation projects can be heavily reliant on having customer commitments to off take for up to 10–15 years. This is rarely possible for many businesses that can only commit to a shorter term of contract (for example, up to five years). It is likely that more projects could be undertaken, thereby providing additional sources of competition to existing wholesale competitors and directly helping businesses manage their electricity costs, if government support was provided for the ‘back end’ of suitable projects.
The ACCC is recommending a package of changes to help businesses through lower prices:
�� Many of the recommendations to assist residential customers should be adopted for small businesses (changes to the standing offer and advertising of discounts) (recommendation 50).
�� Governments should fund small business organisations ($10 million over three years) to provide tailored retail electricity market advice (recommendation 52).
As noted above in relation to competition in the generation market, the Australian Government should operate a program under which it will enter into low fixed-price (for example, $45–$50/MWh) energy offtake agreements for the later years (6–15) of appropriate new generation projects which meet certain criteria. In doing so, project developers will be able to secure debt finance for projects where they do not have sufficient offtake commitments from C&I customers for later years of projects. This will encourage new entry, promote competition and enable commercial and industrial customers to access low-cost new generation (recommendation 4).
The future: lower prices, better consumer experiences and business competitivenessThe recommendations outlined above are a subset of the total package of recommendations the ACCC is making. The full list of recommendations is at page xix.
It is important to note there is already some positive progress in the market that is helping with affordability issues. This includes:
�� there have been some small retail price decreases announced by retailers in June 2018
�� network tariffs are generally flat or trending downward (albeit, in an historically low cost-of-capital environment)
�� wholesale spot and futures prices are around 30 per cent lower than their 2017 peak
�� significant work on demand management initiatives at the network, wholesale and retail levels is likely to put downward pressure on prices once implemented
�� a variety of rule changes and guideline enhancements aim to improve the information provided to consumers and enhance competition.
These improvements are a step in the right direction, however much more needs to be done. The ACCC’s recommendations, if implemented, should put downward pressure on electricity prices and go a significant way to resolving Australia’s electricity affordability problem.
Figures G to I demonstrate the achievable savings for residential, small to medium enterprise and commercial and industrial customers by 2020–21 if the ACCC’s recommendations are adopted. An explanation of the calculations for these savings is at appendix 5.

xv Retail Electricity Pricing Inquiry—Final Report
For example, if the ACCC’s recommendations are adopted, an average residential customer in NSW2 should be able to achieve savings of $409 (24 per cent) of annual bills by 2020–21 (see figure G). For other NEM regions achievable savings are estimated to be between $291 and $489 (see table A).
Figure G: Achievable average residential bill savings in NSW by 2020–21
1697
1288
0
200
400
600
800
1000
1200
1400
1600
1800
2017–18 Wholesaleelectricity
Networks Environmental Retail component
2020–21
$/c
usto
mer
-174
-155 -43 -37
Table A: Achievable average annual residential bill savings by 2020–21
Achievable savings ($ per annum)
Region2017–18
Bill Networks Wholesale Enviro Retail Reduction2020–21
Bill % Reduction
Victoria 1457 39 192 34 26 291 1166 20
NSW 1697 174 155 43 37 409 1288 24
South east Queensland 1703 147 192 18 62 419 1284 25
South Australia 1727 13 227 89 42 371 1356 21
Tasmania 1979 113 226 75 — 414 1490 21
For small business customers, similar savings can be made. However, as a larger proportion of small businesses are on standing offers, the recommendation to abolish the standing offer and implement the lower-priced default tariff will have a proportionately greater benefit to small business customers.
The ACCC estimates that small businesses can achieve savings of 24 per cent on 2017–18 prices if ACCC recommendations are adopted (see figure H).3
2 Note: These estimates include savings for standing offer customers that are spread across the entire market and savings for market offer customers getting better market offers also spread across the entire market. In reality, standing offer customers will make significantly greater savings off the retail component of their bill if the ACCC’s recommendations are adopted, while those market offer customers already on low-priced offers will likely not achieve the full extent of savings in the retail component.
3 Note: These estimates include savings for standing offer customers that are spread across the entire market and savings for market offer customers getting better market offers also spread across the entire market. In reality, standing offer customers will make significantly greater savings off the retail component of their bill if the ACCC’s recommendations are adopted, while those market offer customers already on low-priced offers will likely not achieve the full extent of savings in the retail component.

xvi Retail Electricity Pricing Inquiry—Final Report
Figure H: Achievable average SME savings (c/kWh) (NEM average) by 2020–21
26.5
20.1
-0.8 -0.6
0
5
10
15
20
25
30
c/kW
h
2017–18 Wholesale
-3.4
electricity
-1.5
Networks Environmental Retail component
2020–21
The achievable savings for commercial and industrial customers are estimated to be 26 per cent (see figure I). This is because wholesale costs make up a proportionately larger share of their prices so the significant savings to the wholesale component have a bigger impact for these customers.
Figure I: Achievable average C&I savings (c/kWh) (NEM average) by 2020–21
15.7
11.7
-0.7 -0.0
c/kW
h
0
2
4
6
8
10
12
14
16
18
2017–18
-2.5
Wholesaleelectricity
-0.9
Networks Environmental Retail component
2020–21
As evidenced by table A and figures G to I, the ACCC is confident that there is much that can be done to boost competition, lower costs and improve consumer experiences in the electricity market. In doing so, we can ‘reset’ the NEM to return Australia’s competitive advantage in electricity and restore consumer confidence.

xvii Retail Electricity Pricing Inquiry—Final Report
RecommendationsThis Final Report sets out the ACCC’s recommendations for reducing retail electricity prices and improving consumers’ ability to participate in the retail electricity market.
Boosting competition in generation and retail marketsChapter 41. The NEL should be amended to prevent any acquisition or other arrangement (other than
investment in new capacity) that would result in a market participant owning, or controlling dispatch of, more than 20 per cent of generation capacity in any NEM region or across the NEM as a whole.
The provision should be designed to prevent market participants circumventing the 20 per cent cap, including by way of ownership structure or contractual arrangements.
2. The Queensland Government should divide its generation assets into three generation portfolios to reduce market concentration in Queensland. The three portfolios should be of a similar size with a mix of generation assets to maximise competition in the wholesale market.
Once created, the Queensland Government should ensure that the three portfolios are separately owned and operated to maximise competition in the wholesale electricity market. The sale of any portfolios should be in line with recommendation 1.
3. The NEL should be amended to provide the AER with powers to address behaviour which has the effect of manipulating the proper functioning of the wholesale market, together with the necessary investigation powers and appropriate remedies.
The current market manipulation powers in respect of gas market supply hubs represent a good framework for equivalent powers in respect of the electricity market.
4. The Australian Government should operate a program under which it will enter into low fixed-price (for example, $45–50/MWh) energy offtake agreements for the later years (say 6–15) of appropriate new generation projects which meet certain criteria. In doing so, project developers will be able to secure debt finance for projects where they do not have sufficient offtake commitments from C&I customers for later years of projects. This will encourage new entry, promote competition and to enable C&I customers to access low-cost new generation.
The program should operate for at least a four-year period, with support provided for qualifying projects. To qualify, a project proposal must:
�� have at least three customers who have committed to acquire energy from the project for at least the first five years of operation
�� not involve any existing retail or wholesale market participant with a significant market share (say a share of 10 per cent or more in any NEM region)
�� be of sufficient capacity to serve the needs of a number of large customers
�� be capable of providing a firm product so that it can meet the needs of C&I customers.
5. The National Energy Guarantee seeks to provide a settled policy framework under which new investment is incentivised in a way that enables achievement of the objective of reducing carbon emissions at low-cost while promoting investment in a manner that ensures demand for energy is met.
The ACCC agrees that this is an important policy objective and, with the policy incorporating appropriate safeguards for competition in the contract market, recommends that governments commit to develop and implement the National Energy Guarantee.

xviii Retail Electricity Pricing Inquiry—Final Report
Chapter 56. The NEL should be amended so as to require the reporting of all over-the-counter (OTC) trades to
a repository administered by the AER. Reported OTC trades should then be disclosed publicly in a de-identified format that facilitates the dissemination of important market information without unintentionally revealing the parties involved.
The requirement should be implemented to align with (or be eligible for) any OTC reporting requirements under the NEG.
The AER, AEMC and AEMO should have access to the underlying contract information, including the identity of trading partners.
7. The AEMC should introduce market making obligations in South Australia, which require large, vertically integrated retailers to make offers to buy and sell specified hedge contracts each day, in order to boost hedge market activity. The parameters of a market making obligation should have regard to:
�� the size of the South Australian market
�� the distribution of generation ownership in the region
�� the benefits to market liquidity and efficiency of regular trading activity
�� the burden of the requirements on obligated entities
�� any impact on the incentives of intermittent generators to invest in firming technology.
After an appropriate period of time (for example, after two years) the mechanism should be assessed for its effect on market activity, liquidity and risk to determine if it should be continued, amended or removed in South Australia and, potentially, extended to other NEM regions.
Chapter 68. AEMO amend its rules and procedures so that losing retailers are only given a loss notification on
the actual date of transfer of financial responsibility for the customer to the new retailer. This will limit the opportunity of ‘losing’ retailers to conduct ‘save’ activity before a customer transfer has taken place.
9. The AEMC should make changes to speed up the customer transfer process, for example by enabling customers to use self-reads of their electricity meters. This will ensure that customers move to new offers quickly and will limit the time available for ‘losing’ retailers to conduct ‘save’ activity.
Lowering supply chain costsChapter 710. The ACCC supports the removal by the Australian Government of limited merits review of AER
revenue decisions. Limited merits review of AER decisions should not be reinstated in the future.
11. The governments of Queensland, NSW and Tasmania should take immediate steps to remedy the past over-investment of their network businesses in order to improve affordability of the network. With appropriate assistance from the Australian Government, this can be done:
�� in Queensland, Tasmania and for Essential Energy in NSW, through a voluntary government write-down of the regulatory asset base
�� in NSW, where the assets have since been fully or partially privatised, through the use of rebates on network charges (paid to the distribution company to be passed on to consumers) that offset the impact of over-investment in those states.
Such write-downs would enhance economic efficiency by reducing current distorting price signals. The amount of the write-downs and rebates should be made by reference to the estimates of over-investment by the Grattan Institute, and should result in at least $100 a year in savings for average residential customers in those states.
12. The AER should be given the power to monitor the effect of the write-downs and rebates on network charges effectively faced by retail customers.

xix Retail Electricity Pricing Inquiry—Final Report
13. The National Electricity Rules should explicitly allow for a process whereby network assets may be stranded and the costs of that stranding is shared between users and networks. The AEMC should determine the definition of ‘stranding’ and how the costs of ‘stranding’ can be shared.
14. The ACCC considers that steps should be taken to accelerate the take up of cost-reflective network pricing.
Governments should agree to mandatory assignment of cost-reflective network pricing on retailers, ending existing opt-in and opt-out arrangements.
Mandatory assignment of the network tariff should apply for all customers of a retailer that have metering capable of supporting cost-reflective tariffs (that is, a smart or interval meter).
Retailers should not be obligated to reflect the cost-reflective network tariff structure in their customers’ retail tariffs, but should be free to innovate in the packaging of the network tariff as part of their retail offer.
Given the potential for negative bill shock outcomes from any transition to cost-reflective network tariffs should retailers pass these network tariffs through to customers, governments should legislate to ensure transitional assistance is provided for residential and small business customers. This assistance should focus on maximising the benefits, and reducing the transitional risks, of the move to cost-reflective pricing structures. This includes:
�� a compulsory ‘data sampling period’ for consumers following installation of a smart meter
�� a requirement for retailers to provide a retail offer using a flat rate structure
�� additional targeted assistance for vulnerable consumers.
Demand tariffs, which charge retailers based on their customers’ maximum demand during pre-determined typical system peak times, represent an appropriate structure for the initial mandatorily assigned network tariffs. This tariff structure provides a balance of the objectives of cost reflectivity, simplicity and price certainty.
We note that the extent to which cost-reflective tariffs can be introduced is limited to the extent that a retailer’s customers have smart (or interval) meters. We therefore note the importance of recommendation 15 in achieving outcomes in this area.
Governments should appropriately fund communication campaigns around the benefits of cost-reflective pricing and smart meters to build community acceptance and awareness of individual and community wide benefits, as well as customer awareness of their rights.
15. The ACCC considers that steps should be taken to support the take up of smart meters, and ensure customers receive the benefits of this technology. In particular:
�� governments should regularly audit the rollout of smart meters to ensure:
– the rollout continues at an acceptable pace
– that no gaps emerge in respect of customers’ ability to access meters
– that consumers do not experience problems with the smart meters that are installed.
�� the AER should require retailers, as a part of their market performance reporting, to report on their smart meter community and customer engagement strategy to ensure retailers are delivering the expected customer benefits associated with smart meters, and meeting community expectations in how the rollout is undertaken.
�� the AER should require retailers, as a part of their hardship program, to include policies on how they will support customers with smart meters in payment difficulty through targeted advice or services.
�� jurisdictions should remove regulatory requirements that limit the benefits and full functionality of smart meters.
16. Responsibility for setting network reliability requirements should be placed on the AER or other NEM market body, based on a value of customer reliability (VCR) methodology. The responsible market body must ensure changes to requirements are in line with customer preferences on affordability.

xx Retail Electricity Pricing Inquiry—Final Report
17. The AEMC should:
�� as part of its annual network regulatory framework review, examine areas which can reduce the complexity of the existing framework and the time needed to implement changes
�� in amending any rules, be required to minimise additional complexity in the overall rules framework.
18. To further assist with reducing the complexity of the rules and improving the timely adaptability of the framework, consideration should be given by the AEMC as part of its ongoing reviews of the NER to areas where the NER can be amended to make greater use of AER guidelines, rather than the codification of detailed regulatory assessment methodologies and processes within the NER.
The AER should be able to initiate reviews of its guidelines to ensure they evolve with market developments and best regulatory practice.
This additional flexibility will mean that regulatory proposal assessment methodologies are able to be kept up to date without always needing a rule change process. Guidelines could only be developed within the scope of the rules and in accordance with the processes set out in the rules.
The AEMC could consider the impact on the overall framework of any changed or new guidelines as part of its annual network regulatory framework review.
19. Governments should remove jurisdictional specific costs (taxes) that do not relate to the provision of network services. For example, Victoria should remove the easement land tax included in AusNet Services’ transmission network costs.
20. The NER should be amended to allow the AER more flexibility in undertaking the process of making regulatory determinations. This should allow for streamlined and more efficient assessment of network costs and allow the framework to adapt to the changing role of networks in providing electricity to consumers.
Greater flexibility would allow the AER to better take into account any agreements between customers and networks, and use processes that are better aligned with the quality of the proposal, reducing regulatory burden on businesses and consumers. This in turn will incentivise networks to better engage with their consumers, improving engagement and consumer outcomes.
Chapter 821. In relation to wholesale demand response, a mechanism should be developed for third parties
to offer demand response directly into the wholesale market. Design of the mechanism should commence immediately, building on work undertaken in the AEMC’s Reliability Frameworks Review. The mechanism should:
�� promote competition through allowing the widest range of businesses to directly offer demand response services
�� not allow retailers to limit the ability of their customers to engage a third party demand response provider (to the extent it is not inconsistent with the retail contract)
�� ensure load and generation response are valued appropriately based on the benefit they provide to the wholesale market
�� limit technical requirements placed on the customer that may inhibit take up or scope of these services (for example, requirements for multiple meters at the customer site).
22. In relation to network demand response:
�� The AER, in undertaking the revenue determination process, should include a more explicit focus on assessing the efficient use of non-network expenditure. This should involve a robust assessment of a network business’s actual and proposed non-network expenditure, including a comparison of the overall proportions of non-network expenditures against the network’s capital expenditure, and benchmarking across businesses. Further, consultation by the AER and networks through the process should include engagement with third party demand response providers.
�� Distribution businesses should apply to the AER for early application of the new DMIS (ahead of their next regulatory determination) to bring forward incentives for greater use of demand response. The DMIS and DMIA should also be extended to transmission businesses.

xxi Retail Electricity Pricing Inquiry—Final Report
�� The AEMC should consider in its annual review of the electricity network economic regulatory framework whether network assets are being used efficiently to provide benefits in addition to distribution services (for example, as a substitute for generation in the wholesale, RERT or FCAS markets). This assessment should explore whether:
– clarification is needed of what services can be provided directly by network businesses in contestable markets
– there are any aspects of the existing framework or technical barriers that prevent network assets being used to provide efficient non-distribution services
– the shared asset arrangements provide for a reasonable share of value extracted from the provision of non-distribution services flowing to customers
– it is appropriate for some non-distribution services (such as voltage control) to be obtained from network assets under direction from AEMO rather than procured through competitive markets.
23. In relation to stand-alone systems, immediate work should be undertaken to identify and implement changes to the NEL and NER, and the NERL and NERR, to allow distributors to develop off-grid supply arrangements for existing customers or new connections where efficient. These arrangements should:
�� subject customers under these arrangements to equivalent costs and protections as if they were connected to the grid, including in respect of the obligation to supply, reliability and security of supply
�� be adopted on a consistent basis across the NEM, replacing current state-based regulation of off-grid systems
�� be operated under a contestable framework, with distribution businesses restricted to operating them through ring-fenced entities.
Chapter 924. The small-scale renewable energy scheme should be wound down and abolished by 2021.
25. To reduce the costs associated with premium solar feed-in tariff schemes:
�� any costs remaining from such schemes should be borne by state governments through their budgets, as Queensland has done for the next three years, rather than being recovered through charges to electricity users, and this should be done on a permanent basis
�� where a premium solar FiT scheme has finished, as is the case in NSW, the collection of charges previously used to pay FiTs through network premiums should also end
�� ongoing scheme eligibility rules should be reviewed and tightened to ensure that costs of these schemes are minimised.
Chapter 1026. Victoria should join the National Energy Customer Framework (NECF) to streamline regulatory
obligations on retailers in the NEM and reduce retailers’ costs to serve.
In any interim period before joining the NECF, Victoria should take steps to harmonise its regulatory approach with the NECF.
27. Each NECF jurisdiction should review its derogations from the NECF and unwind any derogations that are not based on jurisdiction-specific characteristics or needs that cannot be met by NECF-wide rules.
28. Future derogations from the NECF should be limited to situations where there are jurisdiction-specific needs that cannot be addressed by a NECF-wide rule change.
xxii Retail Electricity Pricing Inquiry—Final Report
Improving consumer experiences and outcomesChapter 1129. The requirements for notices sent by retailers to customers prior to the end of a contract should be
consistent with the new requirements for expired benefit notices.
Chapter 1230. In non-price regulated jurisdictions, the standing offer and standard retail contract should be
abolished and replaced with a default market offer at or below the price set by the AER.
�� Designated retailers, as defined in the NERL, should be required to supply electricity to consumers under a default offer on request, or in circumstances where the consumer otherwise does not take up a market offer.
�� The default offer should contain simple pricing, minimum payment periods, and access to bill smoothing and paper bills.
�� The AER should be given the power to set the maximum price for the default offer in each jurisdiction. This price should be the efficient cost of operating in the region, including a reasonable margin as well as customer acquisition and retention costs.
�� The default offer should be used by retailers in all circumstances where a standing offer is currently used. This includes circumstances where a consumer has moved into a premises but has not contacted the retailer, where a consumer has not selected a market offer before the expiry of a market contract, and where a consumer is switched through a retailer of last resort event.
Chapter 1331. The application of the consumer data right to the electricity sector should be pursued as a priority
under the consumer data right framework regulated by the ACCC. Consumers and their authorised representatives should have access to at least historical consumption data, product data, meter data and customer data.
32. If a retailer chooses to advertise using a headline discount claim it must calculate the discount from the reference bill amount published by the AER.
�� The AER should publish a reference bill amount for each distribution zone using AER bill benchmarks for medium (2–3 person) households and the price set by the AER for default offers (recommendation 30).
�� Retailers must calculate all discounts off the reference bill, including win-back and retention offers that have discounts attached to them
�� Headline discounts in advertising must only include guaranteed (unconditional) discounts.
33. Conditional discounts should be no higher than the reasonable savings that a retailer expects that it will make if a consumer satisfies the conditions attached to the discount. Retailers should bear the onus of substantiating that the conditional discount is reasonable.
Chapter 1434. The Australian Government should prescribe a mandatory code of conduct for third party
intermediaries, which addresses the issues discussed in chapter 14. For example, offers should be recommended based on price benefit to the consumer rather than the size of the commission received by the third party. The code should contain civil penalty provisions for any breaches.
35. Consumers should be able to provide their consent to third party intermediaries to give EIC on their behalf. The mandatory code (recommendation 34) should outline the process that third party intermediaries must undertake to ensure that they give EIC in a way that satisfies retailers’ obligations under the NERL.
xxiii Retail Electricity Pricing Inquiry—Final Report
36. The Australian Government and Victorian Government should commit to ongoing funding to raise awareness of the government-run comparator websites similar to the approach taken in New Zealand with the ‘What’s My Number’ campaign.
Chapter 1537. COAG should improve concession schemes across the NEM to ensure that, to the extent possible,
there is a uniform, national approach to electricity concessions. Concession schemes should:
�� be means tested to ensure that they are targeted at those most in need
�� include a fixed dollar amount to offset daily supply charges and a percentage discount to offset variable usage charges
�� only require consumers to reapply for concessions where this is necessary for the administration of the concession scheme.
38. In addition to existing funding, the Australian Government and the relevant state or territory government should fund (to a value of $5 per household in each NEM region, or $43 million NEM-wide, per annum) a grant scheme for consumer and community organisations to provide targeted support to assist vulnerable consumers to improve energy literacy. This grant scheme should be modelled on the approach taken by the Queensland Council of Social Services in administering the Switched on Communities program. This targeted support will assist vulnerable consumers to participate in the retail electricity market and choose an offer that suits their circumstances.
39. The hardship rule change, proposed by the AER, should be made. This would allow the AER to issue an enforceable hardship guideline that stipulates what retailers must include in hardship policies, and require retailers to amend their hardship policies to meet the guideline. This new rule should be a civil penalty provision.
Chapter 1640. Retail price monitoring should be streamlined, strengthened and appropriately funded to ensure
greater transparency in the market, reduced costs, and allow governments to more effectively respond to emerging market issues. This should be done by:
�� COAG Energy Council agreeing to streamline price monitoring and reporting to the AER and the AER receiving all the necessary powers to obtain information from retailers
�� COAG Energy Council agreeing to extend price reporting for retail electricity services to small to medium business customers
�� state governments agreeing to close their own price reporting and monitoring schemes in favour of an expanded and strengthened NEM-wide regime
A NEM-wide price reporting and monitoring framework be implemented which includes a combination of price monitoring with full EBITDA data (including standardised costs to serve, attract and retain consumers, and margins), and consumer expenditure surveys. This reporting should be done on a regular basis and include customer expenditure data, based on representative customer surveys and retailer billing and offer data, and be reflective of demographic information.
41. The AER’s wholesale market monitoring should be expanded and appropriately funded to include monitoring, analysing and reporting on the contract market. This should include analysing the data reported to the OTC repository (recommendation 6), ASX data and data gathered directly from generators and retailers (including through the use of compulsory information gathering powers).
42. The COAG Energy Council should adopt all the suggested increased penalties to all civil penalty provisions listed in the consultation paper as a matter of priority, but instead of increasing the amount to $1 million as proposed, increases should be to the same levels as parliament is currently considering for the ACL ($10 million, three times the benefit gained or 10 per cent of turnover). The civil penalties suggested for increase to the maximum level across the NEL, NER, NERL and NERR relate to provisions listed in the consultation paper, such as:
�� information required for projected assessment of system adequacy
�� limitations on generators’ technical parameters—requirements only apply in certain circumstances

xxiv Retail Electricity Pricing Inquiry—Final Report
�� key requirements that generators must meet, regardless of the circumstances of their plant
�� the requirement to advise AEMO if a situation changes, and keep AEMO continuously informed
�� obligations with respect to life support customers
�� wrongful disconnection by a retailer or network service provider
�� requirement to implement hardship policy
�� explicit informed consent requirements for certain transactions.
43. The rebidding rules that currently attract civil penalties of $1 million should also be increased to the new higher level penalties, and that the wholesale provisions arising from the ACCC recommendations 1 and 3 associated with the conduct of participants under the NEL are increased to the same level as well and that these provisions also be subject to disgorgement (ill-gotten gain) penalties.
44. The COAG Energy Council should amend the energy laws in line with the current recommendations before the COAG Energy Council to allow the AER to seek community service orders, probation orders, and adverse publicity orders, as well as enabling the AER to seek that a third party is required to undertake a community service order.
45. The COAG Energy Council should provide the AER with the power to require individuals to give evidence before it.
46. The COAG Energy Council should amend the energy enforcement regime to:
�� permit the AER to issue a new lower level infringement penalty ($5000) for minor breaches of certain provisions for the NERL and NERR in addition to the current $20 000 infringement penalty for current provisions. The COAG Energy Council should identify provisions most suited to lower levels of penalty or provisions directed at smaller market participants like exempt sellers
�� increase penalties for destroying evidence or providing false or misleading information to the AER under its information gathering powers to levels equivalent to the ACL.
Chapter 1747. The COAG Energy Council should develop a set of ministerial principles that inform rule changes
and ministerial decisions relating to consumer protection regulation, including requirements to:
�� reduce regulatory complexity where appropriate and focus regulation on consumer outcomes
�� ensure consumers have access to necessary information and resources to make informed decisions
�� promote fair and reasonable treatment of consumers in day-to-day engagement with market participants
�� reduce the risk of inequity in outcome between consumers in the retail market
�� ensure regulatory flexibility to support technological and market innovation
�� understand the needs of vulnerable consumers and supporting their increased participation in the market.
48. The COAG Energy Council should undertake a review of the effectiveness of the NECF three years after the implementation of the Inquiry recommendations and no later than four years after the release of this report.

xxv Retail Electricity Pricing Inquiry—Final Report
The business experienceChaper 1849. The ACCC’s recommendation to abolish the standing offer and replace it with a ‘default offer’ at or
below a price set by the AER (recommendation 30) should be extended to all generally available offers including offers for SME customers.
50. The ACCC’s recommendation that all discounts must be calculated from a reference bill amount set by the AER (recommendation 32) should be extended to all generally available offers including offers for SME customers. The AER should develop a process for determining a benchmark for representative usage levels for an average SME customer. Similarly, restricting conditional discounts to the reasonable savings that a retailer expects to make if a consumer satisfies the conditions (recommendation 33) should also apply to offers for small business.
51. Governments and market bodies should develop specific electricity market awareness campaigns targeted at small business customers.
As part of these communication campaigns governments and market bodies should look at how it can channel marketing material through departments and agencies that service small business (such as small business representative groups) as well as existing channels of communication for energy.
52. State and territory governments should fund small business organisations to provide tailored retail electricity market advice. The fund should total $10 million over three years and be awarded on a competitive basis to small business representative organisations providing information, tools and advice to small businesses on retail electricity choices. This program could support individualised bill checking services and development of tools to help small businesses make better energy choices.
53. After two years, the COAG Energy Council should review industry efforts to assist small businesses experiencing payment difficulties. The review should take into account metrics like customer satisfaction, disconnection levels and average debt levels for small businesses. The review should determine if industry-led improvements are effective or whether changes to the NERL are necessary to require retailers to have a hardship policy for small businesses.
54. The ACCC’s recommendation in respect of improved and streamlined price reporting (recommendation 40) should include expanded reporting for small to medium business. Price reporting for businesses should be consistent with residential electricity price reporting and retailer cost reporting. The expanded and streamlined reporting process would also allow for disaggregated data on business customer switching trends, reporting on what SMEs are paying, and reporting on the kinds of offers they are on.
55. State and territory governments should provide resourcing toward promoting energy ombudsman schemes as a part of a broader marketing campaign to build small business engagement with retail electricity markets.
56. Governments should make available well targeted assistance programs including energy efficiency audits to assist the businesses most adversely impacted by the transition to more cost network reflective tariffs.

xxvi Retail Electricity Pricing Inquiry—Final Report
AbbreviationsABS Australian Bureau of Statistics
ACCC Australian Competition and Consumer Commission
ACL Australian Consumer Law—schedule 2 to the Competition and Consumer Act 2010 (Cth)
ACL Review the review of the ACL undertaken by Consumer Affairs Australia and New Zealand that concluded in 2017
ACOSS Australian Council of Social Service
ACT Australian Capital Territory
AEMC Australian Energy Market Commission
AEMO Australian Energy Market Operator
AER Australian Energy Regulator
AFMA Australian Financial Markets Authority
AIETF Agricultural Industries Energy Task Force
AMI Advanced Metering Infrastructure
ARENA Australian Renewable Energy Agency
ASX Australian Securities Exchange
BETA Behavioural Economics Team of the Australian Government
big three AGL, Origin and EnergyAustralia
the Brattle Report the research and report undertaken for the ACCC by the Brattle Group
BSO basic service offer
CALC Consumer Action Law Centre
CARC customer acquisition and retention costs
CCA Competition and Consumer Act 2010 (Cth)
CDR Consumer Data Right
CEFC Clean Energy Finance Corporation
CET clean energy target
CESS Capital Expenditure Sharing Scheme
C&I commercial and industrial
CMA Competition and Markets Authority (UK)
CME Carbon + Energy Markets
CNMC Spanish National Commission on Markets and Competition
COAG Council of Australian Governments
the Colmar Brunton survey the consumer survey undertaken for the ACCC by Colmar Brunton
Comparator Code the voluntary Energy Comparator Code of Conduct
CPI consumer price index
CPRC Consumer Policy Research Centre
CSIRO Commonwealth Scientific and Industrial Research Organisation
CTS costs to serve
Current gas inquiry the ACCC’s current gas inquiry 2017–20
DMIA demand management innovation allowance
DMIS demand management incentive scheme
DORC depreciated optimised replacement cost

xxvii Retail Electricity Pricing Inquiry—Final Report
DSNP distribution network service provider
East coast gas inquiry the ACCC inquiry into the competitiveness of the wholesale gas industry (held between 2015 and 2016)
EBIT earnings before interest and tax
EBITDA earnings before interest, tax, depreciation and amortisation
ECA Energy Consumers Australia
EIC explicit informed consent
EIS Emissions Intensity Scheme
EMTPT Energy Market Transformation Project Team
ENA Energy Networks Australia
ERCOT Electric Reliability Council of Texas
ESB Energy Security Board
ESCOSA Essential Services Commission of South Australia
ESC Victoria Essential Services Commission Victoria
ESOO AEMO Electricity Statement of Opportunities
EU European Union
EWON Energy and Water Ombudsman NSW
EWOSA Energy and Water Ombudsman South Australia
EWOV Energy and Water Ombudsman Victoria
FCAS frequency control ancillary services
FERC US Federal Energy Regulatory Commission
Finkel Review Independent Review into the Future Security of the National Electricity Market
FiT Feed in Tariff
Hornsdale Power Reserve Hornsdale Power Reserve Battery Energy Storage System
GW gigawatt
GJ gigajoule
GST goods and services tax
GWh gigawatt hour
Inquiry the ACCC’s current inquiry into retail electricity pricing
IPART Independent Pricing and Regulatory Tribunal
ISDA International Swaps and Derivatives Association
kVa kilovolt amp
kW kilowatt
kWh kilowatt hour
LGC large-scale generation certificate
LMR limited merits review
LNG liquefied natural gas
LRET large-scale Renewable Energy Target
MEU Major Energy Users Inc.
MREP Melbourne’s Renewable Energy Project
MSATS Market Settlement and Transfer Solutions
MW megawatt
MWh megawatt hour
NECF National Energy Customer Framework

xxviii Retail Electricity Pricing Inquiry—Final Report
NEG National Energy Guarantee
NEFR AEMO National Electricity Forecasting Report
NEL National Electricity Law—a schedule to the National Electricity (South Australia) Act 1996 (SA)
NEM National Electricity Market
NER National Electricity Rules—made under National Electricity (South Australia) Act 1996 (SA)
NERL National Energy Retail Law—a schedule to the National Energy Retail Law (South Australia) Act 2011 (SA)
NERR National Energy Retail Rules—made under National Energy Retail Law (South Australia) Act 2011
NGL National Gas Law—National Gas (South Australia) Act 2008 (SA)
NGR National Gas Rules—made under the National Gas (South Australia) Act 2008 (SA)
NEO National Electricity Objective
NSW New South Wales
NZ Code New Zealand Electricity Industry Participation Code 2010
OECD Organisation for Economic Co-operation and Development
Ofgem Office of Gas and Electricity Markets (Great Britain)
Opex operating expenditure
OTC over-the-counter
OTTER Office of the Tasmanian Economic Regulator
Parer Review COAG Independent Review of Energy Market Directions
PC Productivity Commission
PIAC Public Interest Advocacy Centre
PJ petajoule
PJM Pennsylvania, New Jersey, Maryland
PPA power purchase agreement
Preliminary Report ACCC’s Retail Electricity Pricing Inquiry Preliminary Report
PV photovoltaic
QCA Queensland Competition Authority
QCOSS Queensland Council of Social Service
QEUN Queensland Energy Users Network
QLD Queensland
QPC Queensland Productivity Commission
RAB regulatory asset base
RBA Reserve Bank of Australia
REMIT Regulation on Wholesale Energy Market Integrity and Transparency
RET renewable energy target
RIT Regulatory Investment Test
RPIG AER Retail Pricing Information Guidelines
SA South Australia
SACOME South Australian Chamber of Mines and Energy
SA Concession Offer the discount offer for SA concession customers offered by Origin Energy as a result of a tender process with the South Australian Government
SME small and medium enterprise

xxix Retail Electricity Pricing Inquiry—Final Report
solar PV solar photovoltaic generation system
SRES small-scale Renewable Energy Scheme
STC small-scale Technology Certificates
STP Small-scale Technology Percentage
SRMC short run marginal cost
TAS Tasmania
TasCOSS Tasmanian Council of Social Service Inc.
TCR tariff comparison rate
Totex total expenditure
ToU Time of Use
TSS Tariff Structure Statement process
TW terawatt
TWh terawatt hour
The data taskforce Data Availability and Use Taskforce
The Tribunal Australian Competition Tribunal
UK United Kingdom

1 Retail Electricity Pricing Inquiry—Final Report
1. Setting the sceneIn September 2017, the ACCC released its Preliminary Report for this Inquiry in which we set out the affordability problem facing Australian residential and business consumers:
�� Large increases in electricity prices in the past decade have not been matched by price increases in other areas of the economy, or by wage growth.
�� Consumers on low incomes are finding it increasingly difficult to absorb electricity price increases and are often limited in what they can do to reduce their energy costs.
�� Electricity prices for businesses are also increasing rapidly, threatening their viability. Recent increases in wholesale prices are driving small and large business to reduce costs through investments in energy efficiency or distributed generation (solar PV), or reducing other costs across their business including wages.
�� The international competitiveness of Australian manufacturers has diminished over the past decade due to electricity price increases.
The Preliminary Report also examined the drivers of increases in prices through the use of data collected from retailers about their input costs. In this chapter, we update that analysis to incorporate more recent information from retailers, and refinements to our analytical methodology.
Accordingly, this chapter examines the different components of the retail price for electricity, and their contribution to the overall increase in retail electricity prices. The ACCC has made this assessment using the four common categories of costs that are typically identified in analysis of this issue, namely:
�� wholesale costs
�� network costs (transmission and distribution)
�� environmental (green) scheme costs
�� retail costs and margins.
The primary source for the information presented and analysed in this chapter is data obtained from retailers by the ACCC pursuant to its compulsory information gathering powers.4 The ACCC’s Inquiry can be distinguished in this regard from work undertaken by other organisations. Generally, outside of state regulatory price-setting processes, other organisations have had limited access to data directly from retailers as to the costs that they incurred for the above four cost categories, having instead to model or infer costs from publicly available information sources.
In this chapter, we present the ‘cost stack’ analysis that breaks down the relative impacts of the cost components on the overall prices paid for retail electricity, on both a NEM-wide and state-by-state basis. The following sections then examine each of the relevant cost components in more detail.
The second main source was additional information obtained from some retailers about the variety of offers that they make available to their residential and small business customers, including on the revenues, numbers and usage of customers on different offers, the tenure of those customers, and information on the achievement of conditional discounts.
The third main source of data was based on actual billing data obtained from retailers which we matched to demographic and socioeconomic data of individual NEM customers. More detail on this data is at part 3 of this report.
Where relevant, this chapter also draws on findings from public information and information provided by other stakeholders. The ACCC has used such information to check and corroborate its data, as well as inform it as to trends in its own data.
4 Competition and Consumer Act 2010 (Cth), s. 95ZK.

2 Retail Electricity Pricing Inquiry—Final Report
Box 1.1: The ACCC’s cost stack data and methodologyData
The ACCC sought cost information from 18 current retailers covering six years of actual data—2007–08, 2010–11, 2013–14, 2014–15, 2015–16 and 2016–17—and forecast information for 2017–18.5 These retailers provided electricity to over 98 per cent of residential customers across the NEM in the first quarter of 2017–18.
Broadly, retailers were required to provide information on their revenue and usage, wholesale costs, network costs (transmission and distribution), environmental (green) scheme costs, and retail costs and margins. Various break-downs of these categories were provided although not all retailers were able to provide the exact same sub-categories.
The ACCC sought information for three different customer types—residential, small to medium enterprise (SME) and commercial and industrial (C&I). Generally speaking, the ACCC found that data in relation to residential customers was more complete, but it has been able to draw some findings in relation to business customers.
Some retailers found data in relation to the two older time periods, particularly 2007–08, to be difficult to obtain and provide.
Some retailers did not record certain categories of costs on a state-by-state basis and adopted allocation methodologies to estimate costs.
A number of retailers with generation assets provided information on their wholesale costs using a ‘transfer price’ methodology that reflected market prices for wholesale energy, rather than their actual generation costs. The ACCC has used these provided costs, but separately examines wholesale profits in part 1 of this report.
Due to data quality issues, the results presented in charts in this chapter exclude information about the Australian Capital Territory (ACT), and Queensland data only covers the south east part of Queensland which is open to competition.
In relation to network costs, the ACCC also obtained information from distribution companies as to the amounts paid by retailers, as well as other information.
Methodology
The ACCC examined and ‘cleaned’ the returned data for inconsistencies or potential errors, and checked it against other data sources such as public data from the AER or the information provided by network companies. The ACCC engaged with retailers to clarify identified inconsistencies and errors. For this Final Report, the ACCC also re-examined its methodology from the Preliminary Report. In doing so, we discovered an issue with our approach that affected in particular results relating to retail costs, as discussed further in section 1.2.4.
For its ‘cost stack’ analysis, the ACCC used retailer revenue, cost and usage data to obtain measures of the overall ‘cost stacks’ for retailers.
A ‘dollar per customer’ measure was derived by dividing revenue and costs by numbers of customers. This can be considered a proxy for the annual amount that an average customer would pay for electricity. However, it is only a general representation due to significant usage differences between geographic regions, time periods and customer types.
A ‘cents per kWh’ measure was derived by dividing revenue and costs by usage. This can be considered a proxy for the effective price faced by an electricity user for a unit of electricity. It does not take into account usage differences between customers which can vary dramatically. Retail tariffs are often structured with a fixed fee component, which in this case is averaged over the usage.
5 Certain retailers provided data on a calendar year basis.

3 Retail Electricity Pricing Inquiry—Final Report
We note that our measure of the average customer refers to the mean rather than the median or ‘typical’ customer used in some other studies. The distribution of residential electricity usage is positively skewed—that is, the average customer uses more than the ‘typical customer’. This is a result of a small number of customers with much higher than average electricity usage. Accordingly, some of the bills presented in the ACCC’s analysis may be higher than some bills in other studies.
Unless otherwise stated, the ACCC has presented real (inflation adjusted) numbers in this report, in 2016–17 dollars. NEM-wide graphs are volume-weighted by usage or customer numbers as relevant. GST is not included in the graphs presented.
The ACCC’s analysis covers the 2007–08 to 2017–18 time period for which the ACCC collected data. Trends may have been different for subsets of this time or over a longer period. However, we note that this time period broadly matches the period of rapid growth in retail electricity prices that has led to this Inquiry.
While the costs of premium feed-in tariffs are typically recovered through network charges, the ACCC has adjusted the data to attribute these costs to the ‘environmental’ cost category, rather than network costs.
Percentage values in graphs may not sum to 100 due to rounding. Other values may similarly not sum due to rounding.
Box 1.2: The ACCC’s customer offer data and methodologyData
The ACCC also obtained information from a smaller subset of eight retailers concerning the offers their customers were on. The ACCC sought information for the 2016–17 year. These retailers provided electricity to around 92 per cent of residential customers across the NEM in the first quarter of 2017–18.
The ACCC sought information from retailers concerning several aspects of their customer base:
�� the revenues, usage and customer numbers for customers on standing offers and several ‘categories’ of discount for market offers (for example, 5 per cent to less than 10 per cent discount, 10 per cent to less than 15 per cent, etc.)
�� available and achieved discounts for those offers
�� customer numbers in several categories of vulnerability
�� tenure of customers on types of offers
�� proportion of available conditional discounts that were actually achieved, and on-time payment by customers
�� tariff types.
The ACCC sought information for three different types of customer—residential non-solar, residential solar and SME. Similarly to the cost stack data, the ACCC found that residential information was more consistent than the SME data.
The ACCC obtained information on Victoria, NSW, South Australia, south east Queensland, and the Australian Capital Territory (ACT).
Methodology
The ACCC examined and ‘cleaned’ returned data for potential errors, and engaged with retailers to clarify potential errors in the data. All retailers provided amended information or clarification in response to these questions.
The ACCC then examined this information for use in this Inquiry. Results are presented in this chapter as well as throughout the report.

4 Retail Electricity Pricing Inquiry—Final Report
1.1 Cost stacks: what are the components of retailers’ costs?
At a simple level, a ‘cost stack’ represents the different cost and margin components that go into making up the amounts charged by retailers to their customers. That is, it shows the contribution that each of the following components make to the overall level of costs:
�� wholesale costs of purchasing electricity from the NEM (or of generation as relevant in the case of vertically integrated gentailers), and of managing hedging and price exposure (rather than simply the cost of electricity on the spot market)
�� costs charged by transmission and distribution network operators for the transmission of electricity
�� cost of complying with environmental (green) schemes6
�� the costs of running a retail business, such as billing, marketing and customer assistance costs
�� a measure of profitability. The ACCC has used earnings before interest, tax, depreciation and amortisation (EBITDA) in the analysis in this chapter.
This section examines the changes in these cost stacks, between 2007–08 and 2017–18. Section 1.2 then examines each individual cost component further, detailing the reasons for changes in each cost stack component.
Where relevant, the ACCC has also drawn on the customer offer information to provide a further level of analysis.
Given that the results achieved are different for different customer types, the ACCC has divided its analysis in this section into discussion of results for residential and business customers. Retailers will not always have a clear distinction between customer types for all categories of costs—for example, a retailer may buy all of its wholesale energy for its portfolio on a combined basis. However, the evidence available to the ACCC suggests that there are differences in the way that a number of costs are accounted for by retailers.
1.1.1 Residential customersThis section firstly examines the cost components, and changes in those components, on a NEM-wide basis, before examining regional differences.
NEMFigure 1.1 shows the estimated7 average cost stack breakdown for 2017–18, of the average revenue per customer received by all retailers, for residential customers.8
6 This includes the costs of complying with the RET, state-based certificate and efficiency schemes, and state-based premium feed-in-tariff schemes.
7 To arrive at 2017–18 forecast figures, we have used actual 2016–17 data provided by the retailers, and then applied forecast information provided by retailers to obtain figures for 2017–18.
8 The ACCC has based its calculations on the mean revenue figures provided by retailers for each year of data that was requested. The average revenue figures are somewhat different to estimates based on constructing a ‘representative customer bill’ as used by some other recent estimates which are based on median electricity usage.

5 Retail Electricity Pricing Inquiry—Final Report
Figure 1.1: Components of an average residential customer bill across the NEM, 2017–18, $ per customer, real $2016–17, excluding GST
Retail margin
Retail costs
Environmental
Wholesale electricity
Network
0
200
400
600
800
1000
1200
1400
1600
1800
$/c
usto
mer
1636
8%
8%
6%
34%
43%
Source: ACCC analysis based on retailers’ data.
Figure 1.1 is an aggregated summary of retailer costs that incorporates information across a number of different retailer and residential customer types, and across geographic regions. It should therefore be considered to represent a generalised NEM-wide view of the drivers of retailer costs, and therefore customer bills, for 2017–18.
Figure 1.1 demonstrates that, in 2017–18, the largest component of the residential bill was the cost incurred for transmitting electricity over transmission and distribution networks. This makes up around 43 per cent of the overall bill. Wholesale energy costs made up 34 per cent. Retailer’s costs of operations made up 8 per cent, green scheme costs made up 6 per cent and the remaining 8 per cent is attributed to retailer EBITDA margin.9 This EBITDA margin reflects a level of return on the retailer’s operations and should in theory reflect the risks faced by retailers due to their operating and regulatory environment.10 The retailer EBITDA does not include margins for other parts of the supply chain such as wholesale generation.
Both the overall amount and the proportions of overall costs that can be attributed to particular cost components have changed over time.
Figure 1.2 shows the changes in the average revenue per customer achieved by retailers that can be attributed to particular components over the period from 2007–08 to 2017–18.
Figure 1.3 shows the equivalent information on a cent per kWh basis. As noted above in box 1.1, figure 1.2 incorporates the effect of changes in usage over time (where decreases in usage may offset some of the increases in bills) while figure 1.3 represents a proxy for the effective price changes for a unit of energy over the period.
Figure 1.2 shows that, on an annual dollars per customer basis, retailers’ data indicates that there was an overall real increase of 35 per cent in the amounts charged by retailers over the period from 2007–08 to 2017–18. Figure 1.3 shows that, on a cent per kWh basis, the price increase was around 56 per cent in real terms.
The difference between these two increases is due to a 13.3 per cent decrease in average electricity usage from 2007–08 to 2017–18. The decline in average usage is driven by various factors. The primary factor is the increase in the number of consumers with solar PV. The proportion of solar customers in the NEM was less than 0.2 per cent in 2007–08. This has increased to over 12 per cent in 2017–18. These consumers use less grid-based electricity than they otherwise would have.
9 EBITDA may overstate the ‘true’ margin that a retailer obtains as it looks at returns before depreciation, amortisation, interest and tax are accounted for. To the extent that these are significant costs, their return will be lower than 8 per cent. Ideally, an assessment of return on capital should also be made, but the ACCC did not have information on capital employed for this report.
10 These risks may change over time. See for example, AGL, Submission to ACCC Issues Paper, July 2017, p. 13; EnergyAustralia, Submission to ACCC Issues Paper, 30 June 2017, p. 26.
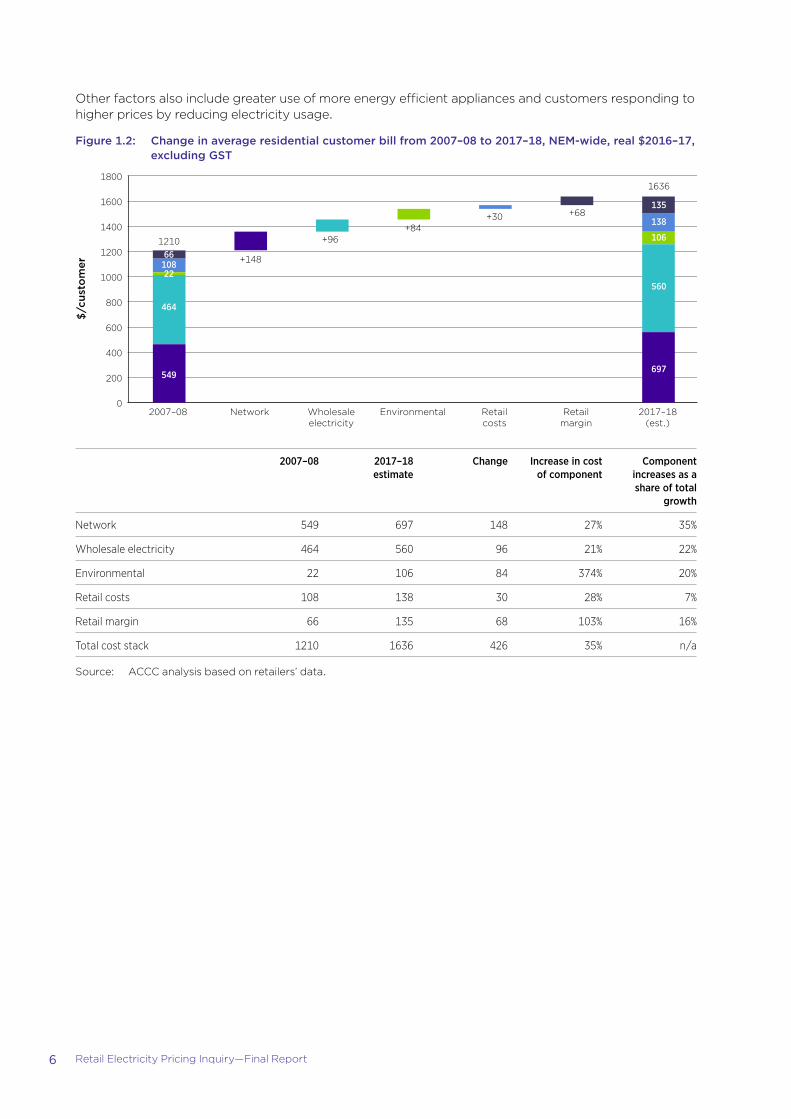
6 Retail Electricity Pricing Inquiry—Final Report
Other factors also include greater use of more energy efficient appliances and customers responding to higher prices by reducing electricity usage.
Figure 1.2: Change in average residential customer bill from 2007–08 to 2017–18, NEM-wide, real $2016–17, excluding GST
2017–18(est.)
Retailmargin
Retailcosts
EnvironmentalWholesaleelectricity
Network2007–080
200
400
600
800
1000
1200
1400
1600
1800
+96+84
+30 +68
+148
$/cu
sto
mer
1636
135
138
106
560
697
121066
10822
464
549
2007–08 2017–18 estimate
Change Increase in cost of component
Component increases as a share of total
growth
Network 549 697 148 27% 35%
Wholesale electricity 464 560 96 21% 22%
Environmental 22 106 84 374% 20%
Retail costs 108 138 30 28% 7%
Retail margin 66 135 68 103% 16%
Total cost stack 1210 1636 426 35% n/a
Source: ACCC analysis based on retailers’ data.
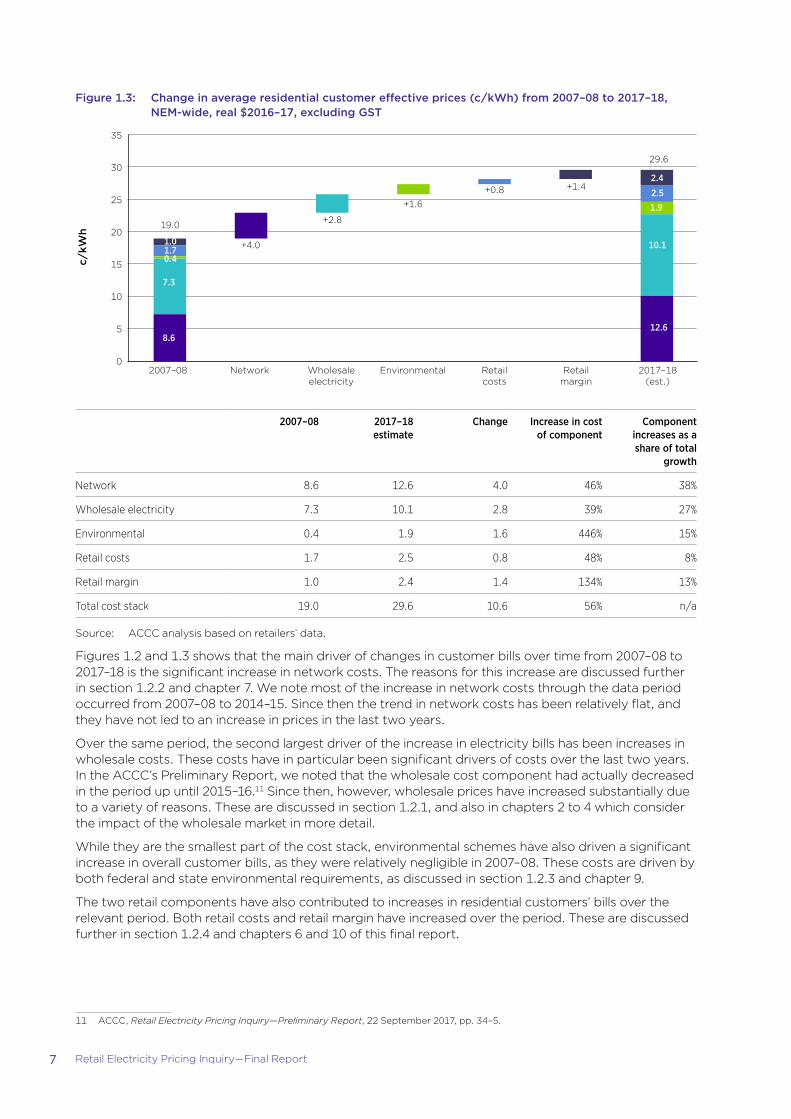
7 Retail Electricity Pricing Inquiry—Final Report
Figure 1.3: Change in average residential customer effective prices (c/kWh) from 2007–08 to 2017–18, NEM-wide, real $2016–17, excluding GST
2017–18(est.)
Retailmargin
Retailcosts
EnvironmentalWholesaleelectricity
Network2007–08
c/kW
h
0
5
10
15
20
25
30
35
+2.8
+1.6
+0.8 +1.4
+4.0
29.6
2.4
2.5
10.1
1.9
12.6
19.0
1.01.70.4
7.3
8.6
2007–08 2017–18 estimate
Change Increase in cost of component
Component increases as a share of total
growth
Network 8.6 12.6 4.0 46% 38%
Wholesale electricity 7.3 10.1 2.8 39% 27%
Environmental 0.4 1.9 1.6 446% 15%
Retail costs 1.7 2.5 0.8 48% 8%
Retail margin 1.0 2.4 1.4 134% 13%
Total cost stack 19.0 29.6 10.6 56% n/a
Source: ACCC analysis based on retailers’ data.
Figures 1.2 and 1.3 shows that the main driver of changes in customer bills over time from 2007–08 to 2017–18 is the significant increase in network costs. The reasons for this increase are discussed further in section 1.2.2 and chapter 7. We note most of the increase in network costs through the data period occurred from 2007–08 to 2014–15. Since then the trend in network costs has been relatively flat, and they have not led to an increase in prices in the last two years.
Over the same period, the second largest driver of the increase in electricity bills has been increases in wholesale costs. These costs have in particular been significant drivers of costs over the last two years. In the ACCC’s Preliminary Report, we noted that the wholesale cost component had actually decreased in the period up until 2015–16.11 Since then, however, wholesale prices have increased substantially due to a variety of reasons. These are discussed in section 1.2.1, and also in chapters 2 to 4 which consider the impact of the wholesale market in more detail.
While they are the smallest part of the cost stack, environmental schemes have also driven a significant increase in overall customer bills, as they were relatively negligible in 2007–08. These costs are driven by both federal and state environmental requirements, as discussed in section 1.2.3 and chapter 9.
The two retail components have also contributed to increases in residential customers’ bills over the relevant period. Both retail costs and retail margin have increased over the period. These are discussed further in section 1.2.4 and chapters 6 and 10 of this final report.
11 ACCC, Retail Electricity Pricing Inquiry—Preliminary Report, 22 September 2017, pp. 34–5.

8 Retail Electricity Pricing Inquiry—Final Report
Regional cost stacksGiven that market conditions, and hence outcomes in average bills and prices, can vary significantly by region within the NEM, the ACCC has also examined changes in components on a regional basis.
Figure 1.4 presents the different cost stacks across the NEM regions in 2017–18.
Figure 1.4: Average residential bills by state, 2017–18, $ per customer, real $2016–17, excluding GST
0
500
1000
1500
2000
2500
Victoria NSW South Australia Queensland Tasmania NEM
$/cu
som
er
Retail costs Retail margin
EnvironmentalWholesale electricityNetwork
Retail component
39% 43% 38%
49% 47%
43%
33%
33% 41% 35%
35%
34% 6%
6% 10% 4%
8%
6% 10%
8% 7% 9%
11%
8% 11%
10% 4% 3%
8% 1457
1697 1727 1703
1979
1636
Source: ACCC analysis based on retailers’ data.
Notes: Average electricity usage drawn from the electricity grid differs from state to state. Usage is highest in Tasmania as it is almost entirely reliant on electricity. Victoria and South Australia have the lowest usage. In Victoria, this is due to a high reliance on gas. In South Australia, it is due to high solar penetration. ACT is not included due to data issues.
Figure 1.5: Average residential customer effective prices, 2017–18, c/kWh, real $2016–17, excluding GST
Victoria NSW South Australia Queensland Tasmania NEM
c/kW
h
0
5
10
15
20
25
30
35
40
Retail costs Retail margin
EnvironmentalWholesale electricityNetwork
Retail component
39% 43% 38% 49% 47% 43%
33% 33%
41% 35%
35% 34%
6% 6%
10%
4%
8% 6%
10% 8%
7%
9% 11%
8%
11% 10%
4%
3% 8%
30.3 28.3
36.5
29.4
26.1
29.6
Source: ACCC analysis based on retailers’ data.
The ACCC notes that changes in the amount of electricity usage can lead to different outcomes for customers, even if costs have not changed significantly. This is reflected in figures 1.4 and 1.5, which show that Tasmania, due to its high usage, has the highest average customer bill despite having the lowest effective c/kWh electricity price.

9 Retail Electricity Pricing Inquiry—Final Report
On a percentage basis, the relativities between the five different cost stack components remain similar across regions. That is, network costs and wholesale charges account for 72–79 per cent of the cost stack. These are then followed by retail costs, retail margin and environmental costs which together contribute 21–28 per cent. While the relativities are generally similar, there are some differences between regions, including:
�� network costs are more significant in Queensland and Tasmania, and are less significant in Victoria and South Australia
�� wholesale costs are more significant in South Australia
�� retail margins are higher in Victoria and NSW
�� retail costs are lowest in Tasmania, and higher in Victoria
�� environmental costs are higher in South Australia and lower in Queensland.
We explore the differences in the cost stack components in the following sections of this chapter.
The overall levels of these components need to be distinguished from the changes over time. The following pages present changes in the cost stack in particular NEM regions over time. For each region, there are charts showing the change in each region’s cost stack from 2007–08 to 2017–18 on both a dollars per customer basis and c/kWh basis. The ACCC has also presented customer offer data that shows the different outcomes for different customers depending on the discount offer that they are on. Further information on customer offer outcomes is also presented in chapter 13.
The regional data provided by retailers indicates that, while there is an overall increase in the cost stacks in all states on a c/kWh basis, the drivers of price changes vary between states. We examine each state in the sections below.
Victoria
From 2007–08 to 2017–18, Victoria had a 29 per cent or $329 increase in the average customer bill. This was the smallest increase across the five states. It also had the lowest percentage increase in effective price of 48 per cent.
The main driver of this price increase was network costs, although this was primarily driven by the costs of the state mandated distributor-led rollout of smart meters (which make up around 17 per cent of network costs in Victoria). The remaining network costs made up of distribution and transmission costs decreased by $1.
If the effect of smart meters is put aside, the largest increase was due to the combined increase in retail costs and margins. Victoria has the highest retail component of the NEM regions, with a combined component of $225 in 2007–08 increasing to $315 in 2017–18. There were also significant increases in the costs of environmental schemes.

10 Retail Electricity Pricing Inquiry—Final Report
Figure 1.6: Change in average Victorian residential customer bill from 2007–08 to 2017–18, $ per customer, real $2016–17, excluding GST
2017–18(est.)
Retailmargin
Retailcosts
EnvironmentalWholesaleelectricity
Network2007–08
+67+85
+50 +40
+88
$/cu
sto
mer
0
200
400
600
800
1000
1200
1400
16001457
163
152
93
478
571
1128
123102
8
411
483
Smartmetering
+89
2007–08 2017–18 estimate
Change Increase in cost of component
Component increases as a share of total
growth
Network (excl. smart meters) 483 482 –1 0% 0%
Smart meters12 0 89 89 n/a 27%
Wholesale electricity 411 478 67 16% 20%
Environmental 8 93 85 1015% 26%
Retail costs 102 152 50 49% 15%
Retail margin 123 163 40 32% 12%
Total cost stack 1128 1457 329 29% n/a
Source: ACCC analysis based on retailers’ data.
12 The 2017–18 cost for smart meters reflects ongoing costs related to metering following the Victorian Government’s mandated advanced metering program. Some costs recovered as part of the Advanced Metering Infrastructure (AMI) program would have also been implemented by distribution networks had there not been an AMI program—for example, meter data management capex and customer information systems. Further, the $89 does not include any benefits of the AMI program that may have resulted in lower network costs, such as the avoided costs of manual meter reads and the replacement of accumulation meters.

11 Retail Electricity Pricing Inquiry—Final Report
Figure 1.7: Change in average Victorian residential effective price (c/kWh) from 2007–08 to 2017–18, real $2016–17, excluding GST
2017–18(est.)
Retailmargin
Retailcosts
EnvironmentalWholesaleelectricity
Network2007–08
c/kW
h
0
5
10
15
20
25
30
35
+2.5+1.8
+1.3+1.2
+3.1
30.3
3.4
3.2
9.9
1.9
11.9
20.5
2.21.90.2
7.5
8.8
+1.9
Smartmetering
2007–08 2017–18 estimate
Change Increase in cost of component
Component increases as a share of total
growth
Network (excl. smart meters) 8.8 10.0 1.2 14% 12%
Smart meters 0.0 1.9 1.9 n/a 19%
Wholesale electricity 7.5 9.9 2.4 33% 25%
Environmental 0.2 1.9 1.7 1177% 18%
Retail costs 1.9 3.2 1.3 71% 13%
Retail margin 2.2 3.4 1.2 51% 12%
Total cost stack 20.5 30.3 9.8 48% n/a
Source: ACCC analysis based on retailers’ data.
Figure 1.8 illustrates the average effective c/kWh price outcomes for Victorian residential non-solar customers on different discount categories of electricity offers, relative to the average retailer cost of 30.3 c/kWh in 2017–18. The vertical lines represent the average cost stack, one including all costs (the black line) and one including only the ‘unavoidable’ costs of wholesale, network and environmental charges, but not the retailer costs and margins that the retailer has influence over (the red line).
Offers are grouped into standing offers and various groups of market offers based on the level of discount available. For a particular offer category, the chart shows the weighted average price outcome for each offer category (for example, the average non-solar residential customer on a standing offer paid 39.2 c/kWh for electricity).13
The figure also presents the average proportion of customers on each offer category, showing that around 6 per cent of customers were on standing offers, while almost half of Victorian customers were on market offers offering a discount of 25 per cent or more.
As expected, the small cohort of Victorian standing offer customers face the worst price outcomes, with an average effective price of 39.2 c/kWh that is around 30 per cent higher than the 30.3 c/kWh average for the Victorian market as a whole. Effective prices generally reduce as the headline discount increases, but there is a broad range of outcomes across all discount groupings, which is discussed further in chapter 13. In contrast, for customers on a discount of over 30 per cent, they are, on average, paying 28 c/kWh, which is below the average price for all customers.
13 These charts present the average effective prices from a group of offers that customers were on over a range of retailers. The pricing outcomes for individual customers on specific offers will therefore be different from these average outcomes.

12 Retail Electricity Pricing Inquiry—Final Report
Figure 1.8: Average effective price outcomes (c/kWh) and average proportion of customers by offer category, Victorian residential non-solar customers, 2017–18 est., real $2016–17, excluding GST
39.2
30.3 23.7
0 10 20 30 40
> 30%
25–30%
20–25%
15–20%
10–15%
5–10%
0–5%
0%
Standing o�ers
Cost stack
c/kWh
Average price
26%
21%
6%
7%
7%
14%
6%
7%
6%
0% 10% 20% 30%
% of customers
Customer breakdown
Mar
ket
o�
er d
isco
unt
tier
s 31.3
37.4
33.5
32.9
32.0
30.4
29.6
28.0
Average price % of customers
Networks Wholesale electricity Environmental Retail costs Retail margin
Total costs (incl. margin)Unavoidable costs
Source: ACCC analysis based on retailers’ data.
Similar charts are presented in the following sections for each state.
NSW
Network costs are the primary driver of cost increases from 2007–08 to 2017–18 in NSW. Retail margins have also increased significantly, although this result was largely driven by one year of negligible margin in 2007–0814, under regulated pricing. NSW also had the highest environmental costs per customer in 2007–08. This meant that the significant increase in this component in other jurisdictions is not reflected in NSW, although the environmental component remains significant overall.
14 In 2007–08 NSW was transitioning to full retail competition. The data we have obtained for NSW in 2007–08 reflects the cost stack of new entrant retailers, which in certain cases had a retail margin of less than zero. New entrant retailers typically have higher retail costs and lower retail margins relative to incumbent retailers. We have set the retail margin in this circumstance to be zero, as a negative net margin does not reflect the average bill that a NSW customer would have paid in 2007–08.

13 Retail Electricity Pricing Inquiry—Final Report
Figure 1.9: Change in average NSW residential customer bill from 2007–08 to 2017–18, $ per customer, real $2016–17, excluding GST
0
200
400
600
800
1000
1200
1400
1600
1800
+47 +12 –4 +170
+142
$/cu
sto
mer
2017–18(est.)
Retailmargin
Retailcosts
EnvironmentalWholesaleelectricity
Network2007–08
1697
170
129
109
560
728
133013397
514
587
2007–08 2017–18 estimate
Change Increase in cost of component
Component increases as a share of total
growth
Network 587 728 142 24% 39%
Wholesale electricity 514 560 47 9% 13%
Environmental 97 109 12 12% 3%
Retail costs 133 129 –4 –3% –1%
Retail margin 0 170 170 n/a 46%
Total cost stack 1330 1697 366 28% n/a
Source: ACCC analysis based on retailers’ data.
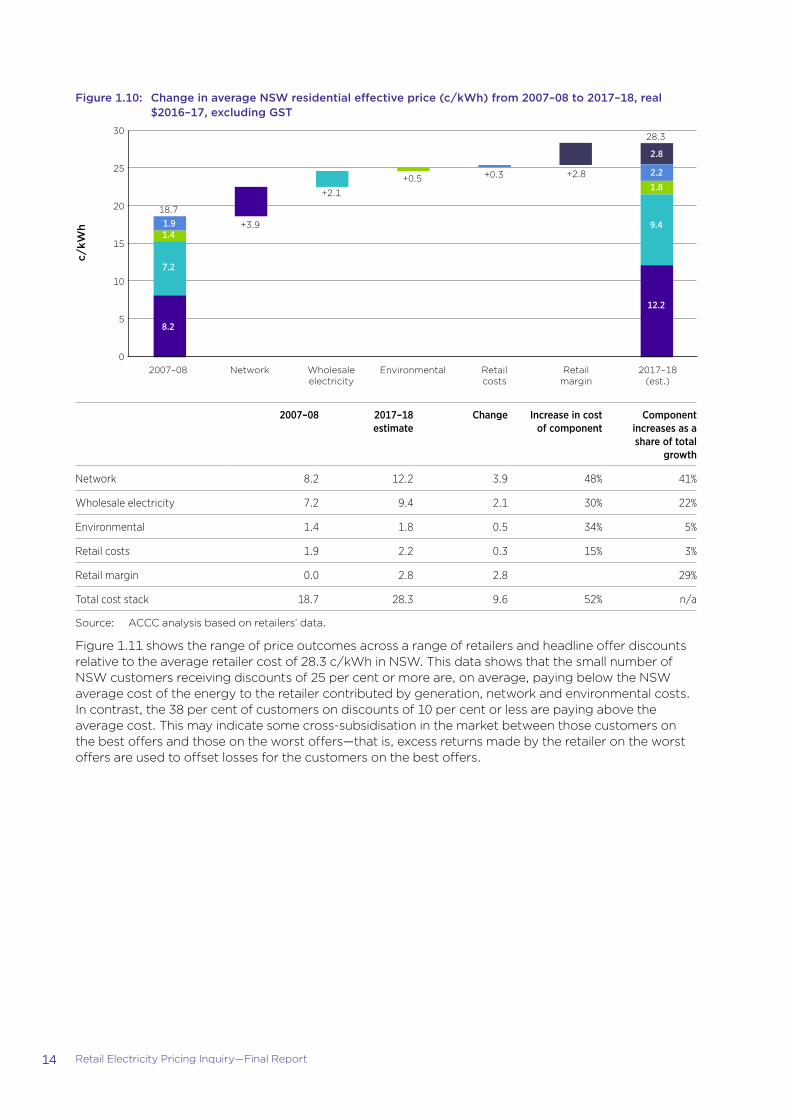
14 Retail Electricity Pricing Inquiry—Final Report
Figure 1.10: Change in average NSW residential effective price (c/kWh) from 2007–08 to 2017–18, real $2016–17, excluding GST
c/kW
h
0
5
10
15
20
25
30
2017–18(est.)
Retailmargin
Retailcosts
EnvironmentalWholesaleelectricity
Network2007–08
+2.1
+0.5 +0.3 +2.8
+3.9
28.3
1.8
9.4
12.2
18.71.91.4
7.2
8.2
2.2
2.8
2007–08 2017–18 estimate
Change Increase in cost of component
Component increases as a share of total
growth
Network 8.2 12.2 3.9 48% 41%
Wholesale electricity 7.2 9.4 2.1 30% 22%
Environmental 1.4 1.8 0.5 34% 5%
Retail costs 1.9 2.2 0.3 15% 3%
Retail margin 0.0 2.8 2.8 29%
Total cost stack 18.7 28.3 9.6 52% n/a
Source: ACCC analysis based on retailers’ data.
Figure 1.11 shows the range of price outcomes across a range of retailers and headline offer discounts relative to the average retailer cost of 28.3 c/kWh in NSW. This data shows that the small number of NSW customers receiving discounts of 25 per cent or more are, on average, paying below the NSW average cost of the energy to the retailer contributed by generation, network and environmental costs. In contrast, the 38 per cent of customers on discounts of 10 per cent or less are paying above the average cost. This may indicate some cross-subsidisation in the market between those customers on the best offers and those on the worst offers—that is, excess returns made by the retailer on the worst offers are used to offset losses for the customers on the best offers.

15 Retail Electricity Pricing Inquiry—Final Report
Figure 1.11: Average effective price outcomes (c/kWh) and average proportion of customers by offer category, NSW residential non-solar customers, 2017–18 est., real $2016–17, excluding GST
29.0
28.323.4
0 10 20 30
> 30%
25–30%
20–25%
15–20%
10–15%
5–10%
0–5%
0%
Standing o�ers
Cost stack
c/kWh
Average price
1%
12%
2%
31%
17%
11%
8%
4%
15%
0% 10% 20% 30%
% of customers
Customer breakdown
Mar
ket
o�
er d
isco
unt
tier
s
29.7
29.2
28.3
26.4
26.3
25.2
23.0
23.3
Average price % of customers
Networks Wholesale electricity Environmental Retail costs Retail margin
Total costs (incl. margin)Unavoidable costs
Source: ACCC analysis based on retailers’ data.
South Australia
The primary drivers of cost increases in South Australia have been wholesale costs and environmental costs. These components increased average bills by $171 and $158 respectively from 2007–08 to 2017–18. There was also a decrease in retail margin of $12 per customer during this time period.
South Australia overall had the highest increase in effective prices of 14.6 c/kWh.

16 Retail Electricity Pricing Inquiry—Final Report
Figure 1.12: Change in average South Australia residential bill per customer from 2007–08 to 2017–18, $ per customer, real $2016–17, excluding GST
$/cu
sto
mer
0
200
400
600
800
1000
1200
1400
1600
1800
2000
2017–18(est.)
Retailmargin
Retailcosts
EnvironmentalWholesaleelectricity
Network2007–08
+171
+158
+39 –12
+49
1321
1727
170
12371
709
654
8483
11
538
650
2007–08 2017–18 estimate
Change Increase in cost of component
Component increases as a share of total
growth
Network 605 654 49 8% 12%
Wholesale electricity 538 709 171 32% 42%
Environmental 11 170 158 1399% 39%
Retail costs 84 123 39 46% 10%
Retail margin 83 71 –12 –14% –3%
Total cost stack 1321 1727 405 31% n/a
Source: ACCC analysis based on retailers’ data.
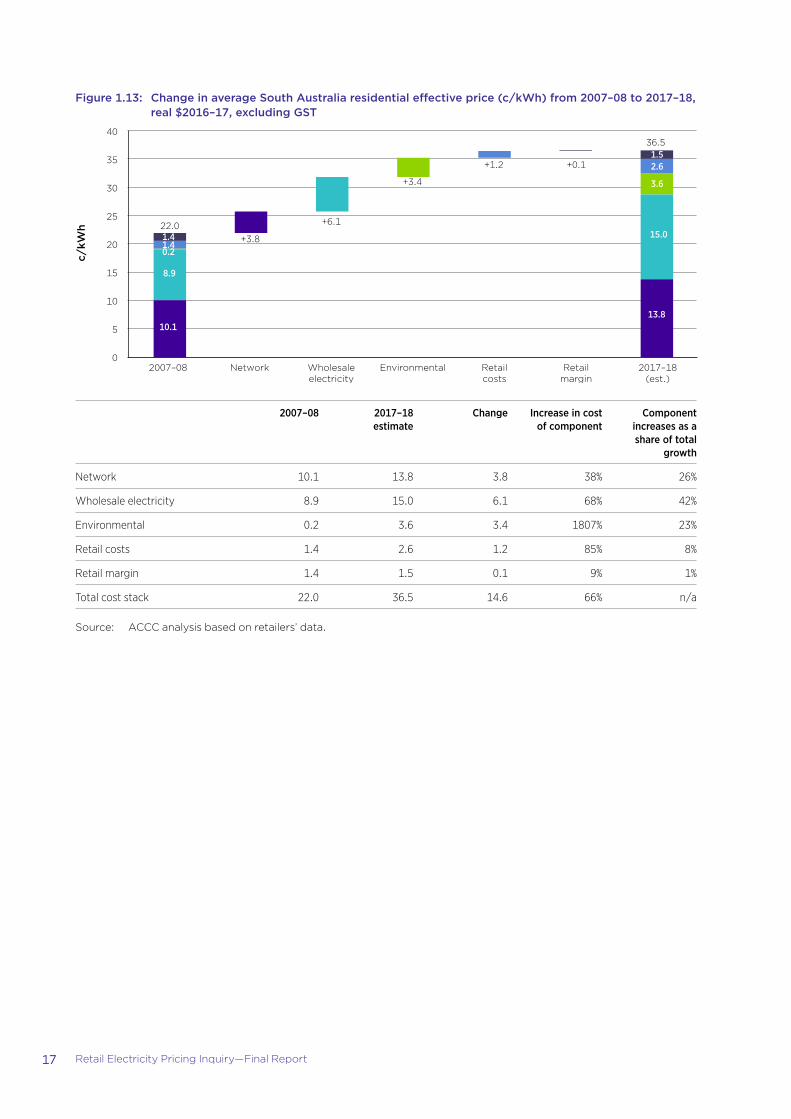
17 Retail Electricity Pricing Inquiry—Final Report
Figure 1.13: Change in average South Australia residential effective price (c/kWh) from 2007–08 to 2017–18, real $2016–17, excluding GST
c/kW
h
0
5
10
15
20
25
30
35
40
2017–18(est.)
Retailmargin
Retailcosts
EnvironmentalWholesaleelectricity
Network2007–08
+6.1
+3.4
+1.2 +0.1
+3.8
36.5
2.61.5
3.6
15.0
13.8
22.01.41.40.2
8.9
10.1
2007–08 2017–18 estimate
Change Increase in cost of component
Component increases as a share of total
growth
Network 10.1 13.8 3.8 38% 26%
Wholesale electricity 8.9 15.0 6.1 68% 42%
Environmental 0.2 3.6 3.4 1807% 23%
Retail costs 1.4 2.6 1.2 85% 8%
Retail margin 1.4 1.5 0.1 9% 1%
Total cost stack 22.0 36.5 14.6 66% n/a
Source: ACCC analysis based on retailers’ data.

18 Retail Electricity Pricing Inquiry—Final Report
Figure 1.14 compares the average retailer cost of 36.5 c/kWh against price outcomes for South Australian residential customers by various offer categories.
Figure 1.14: Average effective price outcomes (c/kWh) and average proportion of customers by offer category, South Australian residential non-solar customers, 2017–18 est, real $2016–17, excluding GST
40.0
36.532.4
0 10 20 30
> 30%
25–30%
20–25%
15–20%
10–15%
5–10%
0–5%
0%
Standing o�ers
Cost stack
c/kWh
Average price
2%
4%
4%
23%
18%
18%
11%
5%
16%
0% 10% 20% 30%
% of customers
Customer breakdown
Mar
ket
o�
er d
isco
unt
tier
s
40.0
39.2
36.8
35.5
35.3
32.9
31.2
30.2
Average price % of customers
Networks Wholesale electricity Environmental Retail costs Retail margin
Total costs (incl. margin)Unavoidable costs
40
Source: ACCC analysis based on retailers’ data.
Customers in South Australia on standing offers and on offers with discounts of up to 5 per cent are paying around 12–13 per cent higher prices for electricity than average customers in South Australia.
Similar to NSW, this data shows that the small proportion of customers receiving discounts of 25 per cent or more are, on average, paying below the cost of the energy to the retailer contributed by generation, network and environmental costs. The 50 per cent of customers on less than 10 per cent discounts are, by contrast, paying more than the retailer’s average costs. Again, this may suggest some cross-subsidisation in the market between those customers on the best offers and those on the poorer offers.
South east Queensland
The primary drivers of cost increases in south east Queensland were network costs and wholesale costs. These components increased average bills by $250 and $139 respectively from 2007–08 to 2017–18.
Overall, in 2017–18 south east Queensland had the lowest environmental costs. This was largely driven by the removal of premium feed in tariff charges from recovery through network charges. South east Queensland also had the lowest retail margin.

19 Retail Electricity Pricing Inquiry—Final Report
Figure 1.15: Change in average south east Queensland residential bill per customer from 2007–08 to 2017–18, $ per customer, real $2016–17, excluding GST
$/cu
sto
mer
0
200
400
600
800
1000
1200
1400
1600
1800
2017–18(est.)
Retailmargin
Retailcosts
EnvironmentalWholesaleelectricity
Network2007–08
+139
+50 +22+3
+250
1238
1703
7614745
598
837
12542
26
458
587
2007–08 2017–18 estimate
Change Increase in cost of component
Component increases as a share of total
growth
Network 587 837 250 43% 54%
Wholesale electricity 458 598 139 30% 30%
Environmental 26 76 50 190% 11%
Retail costs 125 147 22 18% 5%
Retail margin 42 45 3 7% 1%
Total cost stack 1238 1703 465 38% n/a
Source: ACCC analysis based on retailers’ data.
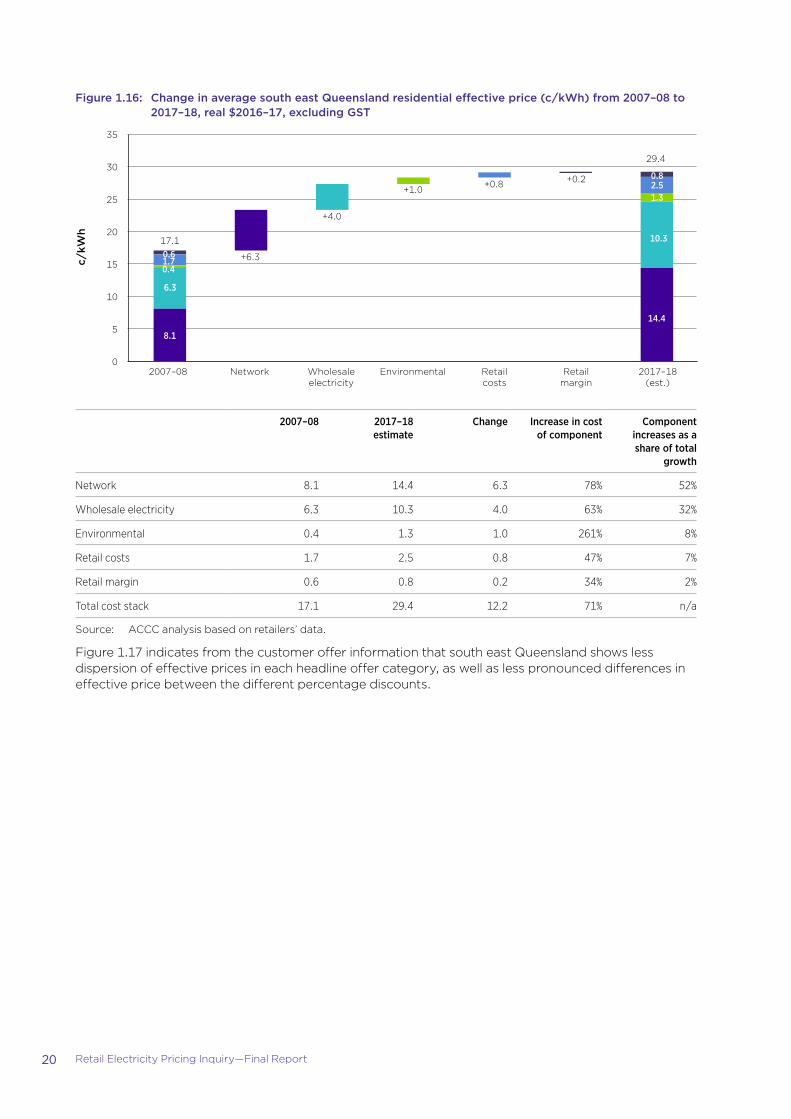
20 Retail Electricity Pricing Inquiry—Final Report
Figure 1.16: Change in average south east Queensland residential effective price (c/kWh) from 2007–08 to 2017–18, real $2016–17, excluding GST
c/kW
h
0
5
10
15
20
25
30
35
2017–18(est.)
Retailmargin
Retailcosts
EnvironmentalWholesaleelectricity
Network2007–08
+4.0
+1.0 +0.8 +0.2
+6.3
29.4
0.8
1.32.5
10.3
14.4
17.10.61.70.4
6.3
8.1
2007–08 2017–18 estimate
Change Increase in cost of component
Component increases as a share of total
growth
Network 8.1 14.4 6.3 78% 52%
Wholesale electricity 6.3 10.3 4.0 63% 32%
Environmental 0.4 1.3 1.0 261% 8%
Retail costs 1.7 2.5 0.8 47% 7%
Retail margin 0.6 0.8 0.2 34% 2%
Total cost stack 17.1 29.4 12.2 71% n/a
Source: ACCC analysis based on retailers’ data.
Figure 1.17 indicates from the customer offer information that south east Queensland shows less dispersion of effective prices in each headline offer category, as well as less pronounced differences in effective price between the different percentage discounts.

21 Retail Electricity Pricing Inquiry—Final Report
Figure 1.17: Average effective price outcomes (c/kWh) and average proportion of customers by offer category, south east Queensland residential non-solar customers, 2017–18 (est.), real $2016–17, excluding GST
29.426.0
31.2
0 10 20 30
> 30%
25–30%
20–25%
15–20%
10–15%
5–10%
0–5%
0%
Standing oers
Cost stack
c/kWh
Average price
0%
1%
0%
6%
29%
31%
14%
8%
12%
0% 10% 20% 30% % of customers
Customer breakdown
Mar
ket
o�
er d
isco
unt
tier
s
30.7
29.4
28.3
27.6
26.7
25.4
22.8
22.9
Average price % of customers
Networks Wholesale electricity Environmental Retail costs Retail margin
Total costs (incl. margin)Unavoidable costs
Source: ACCC analysis based on retailers’ data.
Similar to NSW and South Australia, this data shows that customers receiving discounts of 20 per cent or more (only around 1 per cent in south east Queensland) are, on average, paying below the cost of the energy to the retailer contributed by generation, network and environmental costs. This may indicate some cross-subsidisation between customers. However, given the more limited price dispersion in south east Queensland, the evidence is less strong than for NSW and South Australia.
Tasmania
Tasmania had the highest increase in average customer bill of $557.
The primary drivers of cost increases in Tasmania were network costs and environmental costs. These components increased average bills by $256 and $142 respectively from 2007–08 to 2017–18.
Tasmanian data largely reflects Aurora Energy’s financial data, in particular data prior to 2014 when retail competition was introduced.15 For confidentiality reasons, we have combined retail costs and retail margin for Tasmania.
We note the Office of the Tasmanian Economic Regulator (OTTER) regulates Aurora Energy’s standing offer and sets the retail cost and retail margin. For 2016–17, OTTER set the retail margin for residential customers at 5.7 per cent.16
15 Prior to 2014, Aurora Energy operated as a combined distribution and retail energy business.16 OTTER, Investigation to determine maximum standing offer prices for small customers on mainland Tasmania, Final Report,
May 2016, p. ix.

22 Retail Electricity Pricing Inquiry—Final Report
Figure 1.18: Change in average Tasmania residential bill per customer from 2007–08 to 2017–18, $ per customer, real $2016–17, excluding GST
2017–18(est.)
Retailcomponent
EnvironmentalWholesaleelectricity
Network2007–08
$/cu
sto
mer
0
500
1000
1500
2000
2500
+57 +142+102
+256
1422
1979
212
686
155
927
629
12110
671
2007–08 2017–18 estimate
Change Increase in cost of component
Component increases as a share of total
growth
Network 671 927 256 38% 46%
Wholesale electricity 629 686 57 9% 10%
Environmental 12 155 142 1139% 26%
Retail component 110 212 21 93% 19%
Total cost stack 1422 1979 557 39% n/a
Source: ACCC analysis based on retailers’ data.

23 Retail Electricity Pricing Inquiry—Final Report
Figure 1.19: Change in average Tasmanian residential effective price (c/kWh) from 2007–08 to 2017–18, real $2016–17, excluding GST
2017–18(est.)
Retailcomponent
EnvironmentalWholesaleelectricity
Network2007–08
c/kW
h
0
5
10
15
20
25
30
+1.8
+1.9+1.5
+4.5
26.11.3
2.0
1.5
9.1
12.2
16.31.30.1
7.2
7.7
2007–08 2017–18 estimate
Change Increase in cost of component
Component increases as a share of total
growth
Network 7.7 12.2 4.5 59% 46%
Wholesale electricity 7.2 9.1 1.8 26% 19%
Environmental 0.1 2.0 1.9 1326% 19%
Retail component 1.3 2.8 0.4 122% 15%
Total cost stack 16.3 26.1 9.8 60% n/a
Source: ACCC analysis based on retailers’ data.
There is no equivalent chart regarding customer offers for Tasmania given the lack of generally available market offers from competing retailers.
Box 1.3: International comparisonsAustralian electricity prices, gross margins and net margins are among the highest in the world.
We engaged VaasaETT to compare Australian states and territories against international markets, using a sample of available offers in each jurisdiction.17
South Australia has amongst the highest electricity prices in the world. It is comparable to Denmark and Germany which have substantial green taxes. NSW, Victorian and Queensland prices are also high compared to prices overseas.
The averaged NEM price is higher than the average across the EU. This underscores the electricity affordability issues facing Australian energy users.
In our Preliminary Report we identified that Australia’s position in terms of electricity prices deteriorated from the fourth cheapest in the OECD in 2004 to the 10th cheapest in 2016. The updated 2018 prices in figure 1.20 indicate that this trend has continued, such that Australia has the fourth highest prices among the countries shown.
17 VaasaETT’s price data collection methodology is different to that of the ACCC’s data, including the inclusion of GST, a different sample period, and a different range of firms. Accordingly, there are some discrepancies between the ACCC’s effective price data in this chapter and the data presented in figure 1.20.

24 Retail Electricity Pricing Inquiry—Final Report
Figure 1.20: 2018 nominal international prices c/kWh, including GST
0 10 20 30 40 50 60
Average AUS (NEM)
Average EU
Bulgaria
Lithuania
Hungary
Malta
Romania
Finland
Estonia
Croatia
Slovakia
ACT
Poland
Slovenia
Latvia
Tasmania
Sweden
Greece
Luxembourg
Netherlands
Austria
France
Cyprus
Italy
Belgium
Western Australia
Great Britain
Czech Republic
Queensland
Victoria
Ireland
Portugal
NSW
Spain
South Australia
Germany
Denmark
Energy Network Environmental/Taxes VAT/GST
Energy Network Environmental/Taxes VAT/GST
c/kWh (AUD)
50.2
49.3
47.8
39.0
38.6
37.3
37.2
36.0
35.1
33.1
33.1
33.1
32.6
31.6
30.9
30.7
30.5
30.0
29.3
28.4
27.1
26.0
25.6
24.8
23.8
23.5
23.5
23.4
22.1
21.2
19.5
19.3
18.1
17.4
34.1
37.4
24.8
Source: VaasaETT data provided to ACCC.

25 Retail Electricity Pricing Inquiry—Final Report
Gross retail margins (as shown in figure 1.21) are less notably high compared to overseas jurisdictions, although the Victorian gross margin is towards the top of the compared jurisdictions. The average NEM gross margin is actually lower than the EU average, perhaps suggesting that the retail component of costs is less of an issue in Australia than other cost components.
Figure 1.21: Gross margins, 2016–17, c/kWh, Australian states and overseas
0 2 4 6 8 10 12
Average AUS (NEM) Average EU
Hungary Slovakia Estonia
Portugal Denmark Belgium Finland
Czech Republic Sweden
Western Australia Austria
Tasmania France
ACT Queensland Netherlands
Poland South Australia
Spain NSW Italy
Victoria Great Britain
Ireland Germany
International jurisdictions Australian jurisdictions
c/kWh (AUD)
Source: VaasaETT data provided to ACCC, ACCC analysis based on retailers’ data.
Finally, figure 1.22 shows that retail margins in Victoria and NSW as a percentage of total electricity bill are higher than all the international regions in VaasaETT’s sample. The NEM-wide average, which is dominated by these states, is also very high. Tasmania and South Australia are similar to the non-Australian average and Queensland is the lowest.
This suggests that a larger proportion of the retail component is made up of retail margin than retail costs for NSW and Victoria compared to the EU average.

26 Retail Electricity Pricing Inquiry—Final Report
Figure 1.22: International retail net margin (EBITDA), % of customer total bill (excl. GST), 2015–17, Australian states and international regions
0% 2% 4% 6% 8% 10% 12%
Average AUS (NEM)
Average Non-AUS
Average EU
Queensland
Central Eastern Europe (Czech Republic, Hungary, Romania,
North West Europe (GB and Ireland)
Southern Europe and Iberia (Italy, Portugal, Spain)
South Australia
Balkan (Croatia, Slovenia)
Benelux (Belgium, Netherlands)
Nordic (Denmark, Finland, Norway, Sweden)
Tasmania
Central Northern Europe (Austria, Germany)
Texas
New Zealand
NSW
Victoria
% of total revenue
Australian jurisdictions International jurisdictions
Source: VaasaETT data provided to ACCC.
Note: Australian states other than Tasmania are 2016–17 margins from ACCC analysis based on retailer’s data. Tasmanian retail margin reflects OTTER’s 2016–17 regulated retail margin of 5.7 per cent.
Box: 1.4: Solar and non-solar customer comparisonThe preceding cost stack analysis includes average results across a range of residential customers. However, different customers will experience different bills over time depending on their particular circumstances. One notable distinction between customer types is access to solar PV panels.
Data provided by retailers indicate that, on average, solar customers and non-solar customers use a similar amount of electricity from the grid.18 However, households with solar are typically larger than non-solar households which also include a larger proportion of consumers who live in apartments. This indicates that solar customers on average use more electricity than non-solar households, but this increased usage is offset by their solar PV generation.
Solar customers also receive a rebate for electricity generated by their solar panels that is fed back into the NEM. This results in solar customers paying significantly less for electricity than non-solar customers.
Higher solar penetration appears to be an important driver of the fall in average residential electricity usage, drawn from the NEM, over the period the ACCC has examined. In figure 1.23 we compare the cost outcomes for average solar and non-solar households in each NEM jurisdiction, after feed-in tariffs are accounted for. The grey bar represents the amount that solar customers will pay after they have received feed-in tariff payments. Across the NEM, the data available to the ACCC indicates that an average customer pays around $1636 for electricity from the grid. However, a solar customer will receive a payment of $538 for the electricity they feed back in, which means that they are reducing their overall bill by about a third.
18 This outcome differs from information available to the ACCC at the time of the Preliminary Report, and reflects additional information provided by retailers in response to additional information notices. The demographics of solar and non-solar customers are different. Solar customers will typically own their own home while non-solar customers may include households which cannot install solar such as apartments.
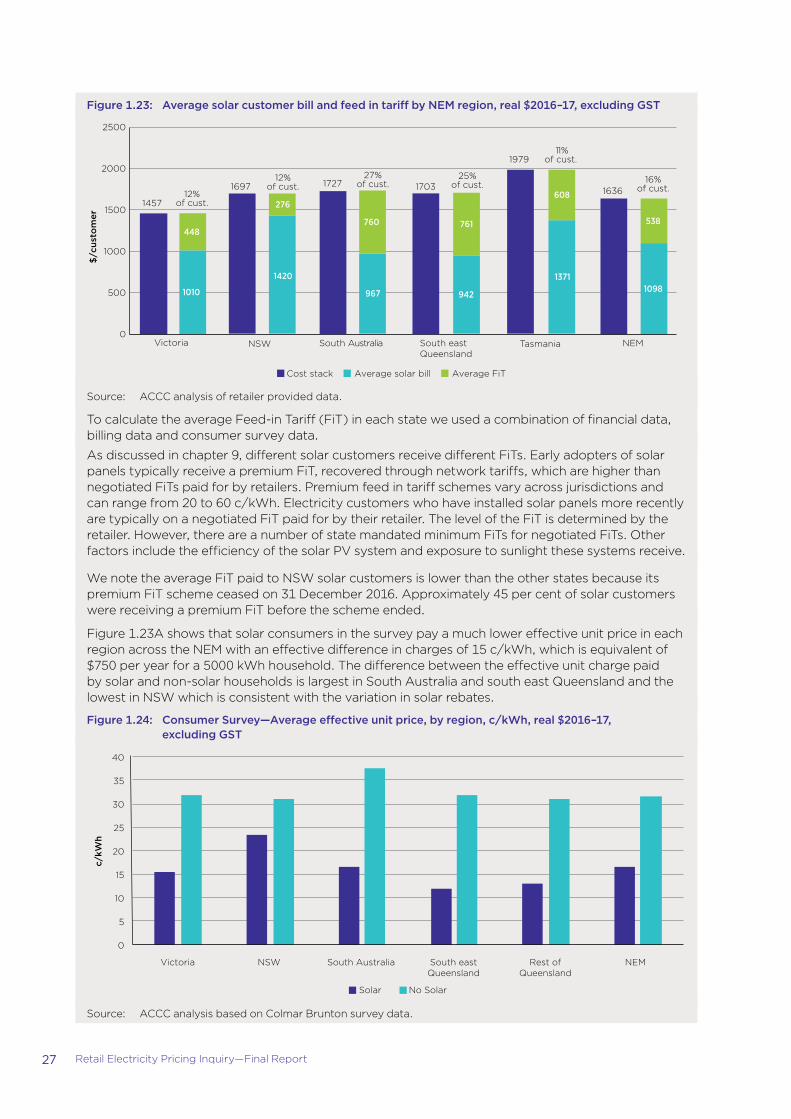
27 Retail Electricity Pricing Inquiry—Final Report
Figure 1.23: Average solar customer bill and feed in tariff by NEM region, real $2016–17, excluding GST
967 942
1371 1098
760 761
608
538
1457
1697 1636
1010
448
12% of cust.
27% of cust.
25% of cust.
11% of cust.
16% of cust.
0
500
1000
1500
2000
2500
Victoria NSW
1727
South Australia
1703
South east Queensland
1979
1420
276
12% of cust.
Tasmania NEM
$/c
usto
mer
Cost stack Average solar bill Average FiT
Source: ACCC analysis of retailer provided data.
To calculate the average Feed-in Tariff (FiT) in each state we used a combination of financial data, billing data and consumer survey data.
As discussed in chapter 9, different solar customers receive different FiTs. Early adopters of solar panels typically receive a premium FiT, recovered through network tariffs, which are higher than negotiated FiTs paid for by retailers. Premium feed in tariff schemes vary across jurisdictions and can range from 20 to 60 c/kWh. Electricity customers who have installed solar panels more recently are typically on a negotiated FiT paid for by their retailer. The level of the FiT is determined by the retailer. However, there are a number of state mandated minimum FiTs for negotiated FiTs. Other factors include the efficiency of the solar PV system and exposure to sunlight these systems receive.
We note the average FiT paid to NSW solar customers is lower than the other states because its premium FiT scheme ceased on 31 December 2016. Approximately 45 per cent of solar customers were receiving a premium FiT before the scheme ended.
Figure 1.23A shows that solar consumers in the survey pay a much lower effective unit price in each region across the NEM with an effective difference in charges of 15 c/kWh, which is equivalent of $750 per year for a 5000 kWh household. The difference between the effective unit charge paid by solar and non-solar households is largest in South Australia and south east Queensland and the lowest in NSW which is consistent with the variation in solar rebates.
Figure 1.24: Consumer Survey —Average effective unit price, by region, c/kWh, real $2016–17, excluding GST
0
5
10
15
20
25
30
35
40
Victoria NSW South Australia South eastQueensland
Rest ofQueensland
NEM
Solar No Solar
c/kW
h
Source: ACCC analysis based on Colmar Brunton survey data.

28 Retail Electricity Pricing Inquiry—Final Report
Box 1.5: Customer offer informationAs discussed above, the ACCC has collected relevant information about the electricity offers that customers are on. The following charts present some high-level summary information that informs the discussion in section 1.1.1.
First, the ACCC has collected information on the distribution of customers between different categories of offer in different jurisdictions. This informs the figures above showing the range of outcomes for effective price across offer bands—for instance the market offers with a greater than 25 per cent discount are almost half of customers in Victoria, but almost none in Queensland.
Figure 1.25: Proportion of residential non-solar customers by offer category in each region, as at 30 June 2017
Market o�ersStanding o�ers
% o
f cu
sto
mer
s
0%
5%
10%
15%
20%
25%
30%
35%
SO
0
%
0–5
%
5–10
%
10–1
5%
15–2
0%
20
–25%
25
–30
%
>3
0%
SO
0
%
0–5
%
5–10
%
10–1
5%
15–2
0%
20
–25%
25
–30
%
>3
0%
SO
0
%
0–5
%
5–10
%
10–1
5%
15–2
0%
20
–25%
25
–30
%
>3
0%
SO
0
%
0–5
%
5–10
%
10–1
5%
15–2
0%
20
–25%
25
–30
%
>3
0%
Victoria NSW South Australia South eastQueensland
Discount tier (supply and usage)
Source: ACCC analysis based on retailers’ data.
Secondly, the next figure illustrates the tenure periods for customers on market and standing offers, and compares the outcomes for the big three (AGL, EnergyAustralia and Origin) and other retailers. It can be seen that the big three typically have customers for significantly longer periods of time, and that their standing offer customers in particular are very long-held. The profitability of these customers is also much higher.
Figure 1.26: Offer tenure of residential non-solar customers by standing and market offer for the big three and other retailers, as at 30 June 2017
> 4 years 2–4 years 1–2 years < 1 year
12%26%
10% 9%
14%
43%
10% 6%
52%
23%
27%
14%
22% 8%
54%
70%
0%
20%
40%
60%
80%
100%
Market o�ers Standing o�ers Market o�ers Standing o�ers Big three Other retailers
% o
f cu
sto
mer
s
Source: ACCC analysis based on retailers’ data.
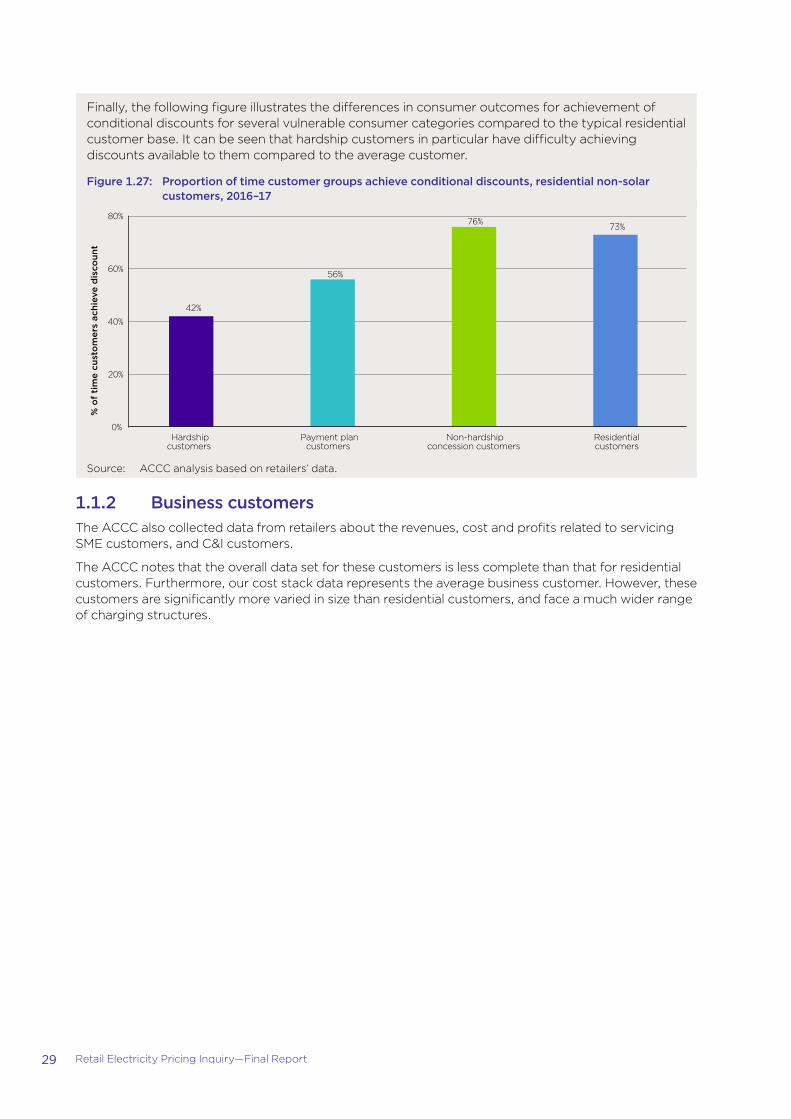
29 Retail Electricity Pricing Inquiry—Final Report
Finally, the following figure illustrates the differences in consumer outcomes for achievement of conditional discounts for several vulnerable consumer categories compared to the typical residential customer base. It can be seen that hardship customers in particular have difficulty achieving discounts available to them compared to the average customer.
Figure 1.27: Proportion of time customer groups achieve conditional discounts, residential non-solar customers, 2016–17
42%
56%
76% 73%
0%
20%
40%
60%
80%
Hardshipcustomers
Payment plancustomers
Non-hardshipconcession customers
Residentialcustomers
% o
f ti
me
cust
om
ers
achi
eve
dis
coun
t
Source: ACCC analysis based on retailers’ data.
1.1.2 Business customersThe ACCC also collected data from retailers about the revenues, cost and profits related to servicing SME customers, and C&I customers.
The ACCC notes that the overall data set for these customers is less complete than that for residential customers. Furthermore, our cost stack data represents the average business customer. However, these customers are significantly more varied in size than residential customers, and face a much wider range of charging structures.
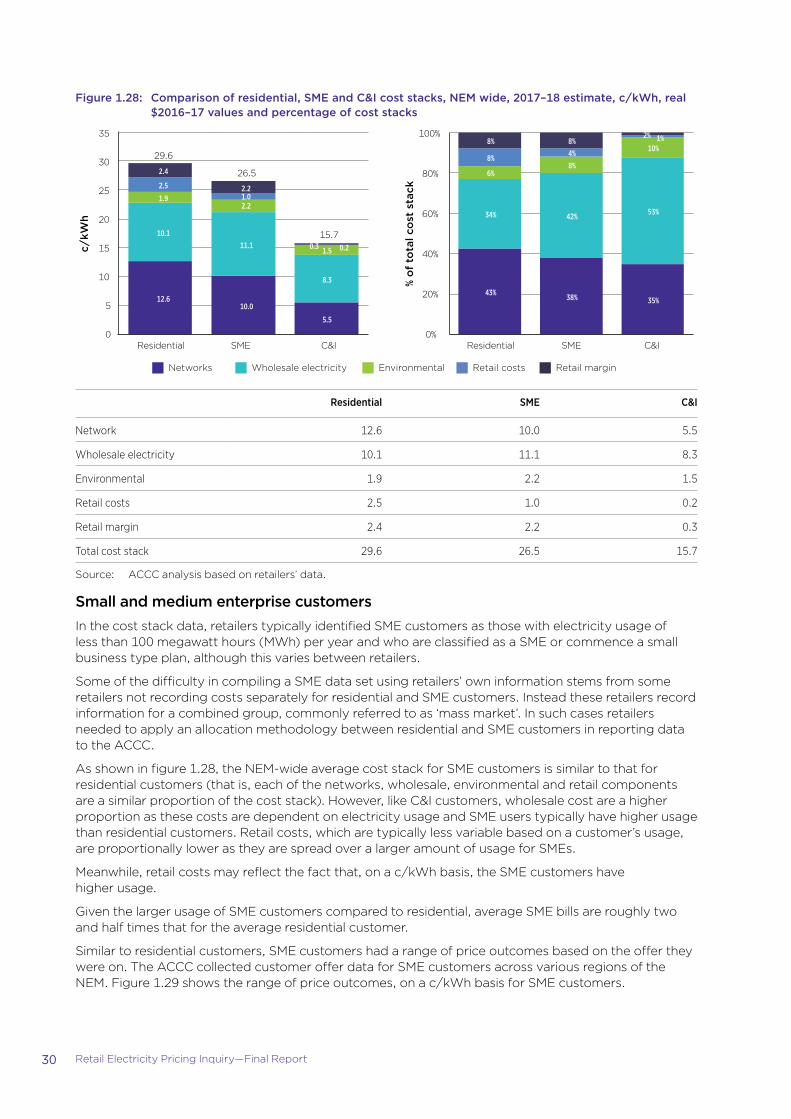
30 Retail Electricity Pricing Inquiry—Final Report
Figure 1.28: Comparison of residential, SME and C&I cost stacks, NEM wide, 2017–18 estimate, c/kWh, real $2016–17 values and percentage of cost stacks
0%
20%
40%
60%
80%
100%
Residential SME C&IResidential SME C&I0
5
10
15
20
25
30
35
c/kW
h
% o
f to
tal c
ost
sta
ck
5.5
8.3
1.50.3 0.2
10.0
11.1
2.21.02.2
12.6
10.1
1.9
2.5
2.4
29.6
26.5
15.7
43%38%
34% 42%
6%8%
8% 4%
8% 8% 2%
35%
53%
10% 1%
Networks Wholesale electricity Environmental Retail costs Retail margin
Residential SME C&I
Network 12.6 10.0 5.5
Wholesale electricity 10.1 11.1 8.3
Environmental 1.9 2.2 1.5
Retail costs 2.5 1.0 0.2
Retail margin 2.4 2.2 0.3
Total cost stack 29.6 26.5 15.7
Source: ACCC analysis based on retailers’ data.
Small and medium enterprise customersIn the cost stack data, retailers typically identified SME customers as those with electricity usage of less than 100 megawatt hours (MWh) per year and who are classified as a SME or commence a small business type plan, although this varies between retailers.
Some of the difficulty in compiling a SME data set using retailers’ own information stems from some retailers not recording costs separately for residential and SME customers. Instead these retailers record information for a combined group, commonly referred to as ‘mass market’. In such cases retailers needed to apply an allocation methodology between residential and SME customers in reporting data to the ACCC.
As shown in figure 1.28, the NEM-wide average cost stack for SME customers is similar to that for residential customers (that is, each of the networks, wholesale, environmental and retail components are a similar proportion of the cost stack). However, like C&I customers, wholesale cost are a higher proportion as these costs are dependent on electricity usage and SME users typically have higher usage than residential customers. Retail costs, which are typically less variable based on a customer’s usage, are proportionally lower as they are spread over a larger amount of usage for SMEs.
Meanwhile, retail costs may reflect the fact that, on a c/kWh basis, the SME customers have higher usage.
Given the larger usage of SME customers compared to residential, average SME bills are roughly two and half times that for the average residential customer.
Similar to residential customers, SME customers had a range of price outcomes based on the offer they were on. The ACCC collected customer offer data for SME customers across various regions of the NEM. Figure 1.29 shows the range of price outcomes, on a c/kWh basis for SME customers.
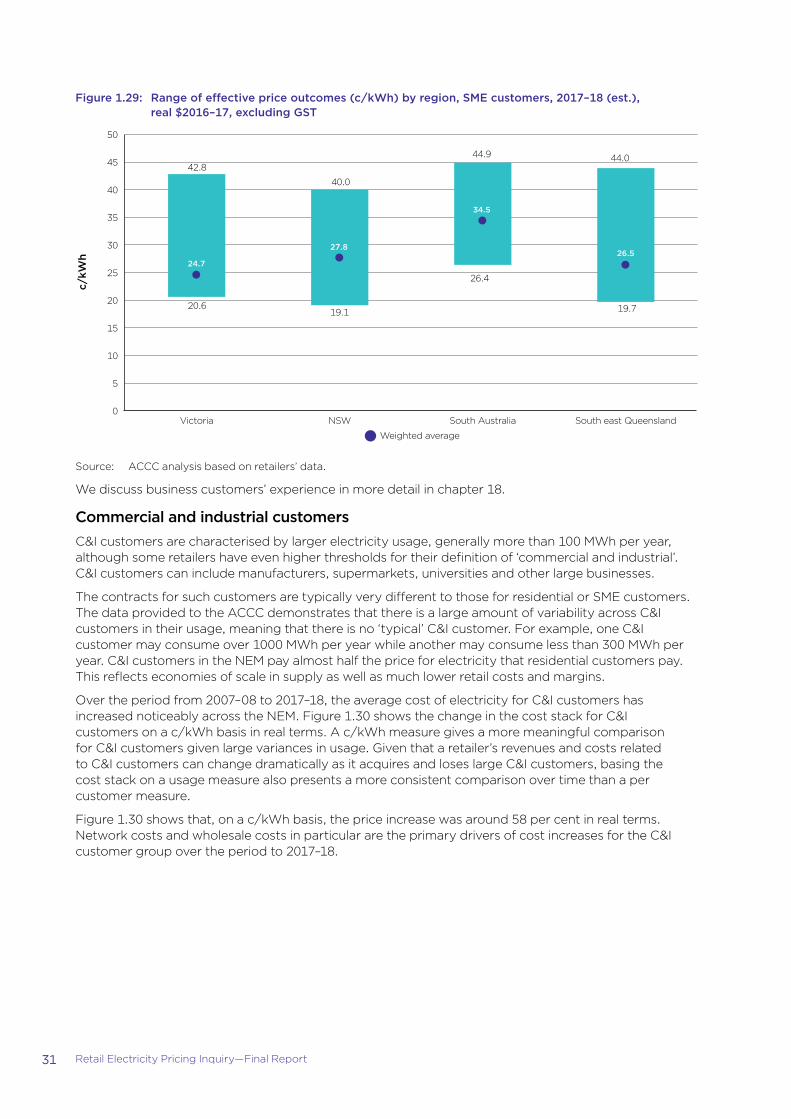
31 Retail Electricity Pricing Inquiry—Final Report
Figure 1.29: Range of effective price outcomes (c/kWh) by region, SME customers, 2017–18 (est.), real $2016–17, excluding GST
South East QueenslandSouth AustraliaNSWVictoria
0
5
10
15
20
25
30
35
40
45
50
South east QueenslandSouth AustraliaNSWVictoria
c/kW
h
20.6
24.7
27.8
34.5
26.5
19.1
26.4
19.7
Weighted average
42.8
40.0
44.9 44.0
Source: ACCC analysis based on retailers’ data.
We discuss business customers’ experience in more detail in chapter 18.
Commercial and industrial customersC&I customers are characterised by larger electricity usage, generally more than 100 MWh per year, although some retailers have even higher thresholds for their definition of ‘commercial and industrial’. C&I customers can include manufacturers, supermarkets, universities and other large businesses.
The contracts for such customers are typically very different to those for residential or SME customers. The data provided to the ACCC demonstrates that there is a large amount of variability across C&I customers in their usage, meaning that there is no ‘typical’ C&I customer. For example, one C&I customer may consume over 1000 MWh per year while another may consume less than 300 MWh per year. C&I customers in the NEM pay almost half the price for electricity that residential customers pay. This reflects economies of scale in supply as well as much lower retail costs and margins.
Over the period from 2007–08 to 2017–18, the average cost of electricity for C&I customers has increased noticeably across the NEM. Figure 1.30 shows the change in the cost stack for C&I customers on a c/kWh basis in real terms. A c/kWh measure gives a more meaningful comparison for C&I customers given large variances in usage. Given that a retailer’s revenues and costs related to C&I customers can change dramatically as it acquires and loses large C&I customers, basing the cost stack on a usage measure also presents a more consistent comparison over time than a per customer measure.
Figure 1.30 shows that, on a c/kWh basis, the price increase was around 58 per cent in real terms. Network costs and wholesale costs in particular are the primary drivers of cost increases for the C&I customer group over the period to 2017–18.
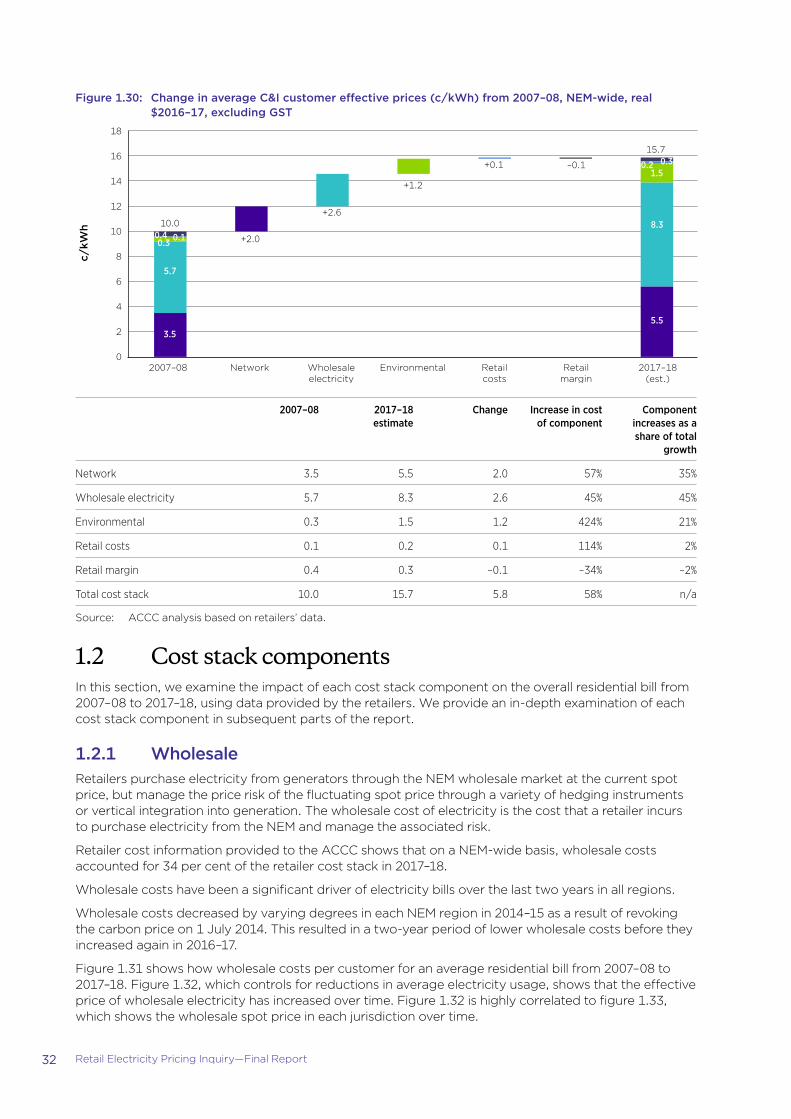
32 Retail Electricity Pricing Inquiry—Final Report
Figure 1.30: Change in average C&I customer effective prices (c/kWh) from 2007–08, NEM-wide, real $2016–17, excluding GST
c/kW
h
0
2
4
6
8
10
12
14
16
18
2017–18(est.)
Retailmargin
Retailcosts
EnvironmentalWholesaleelectricity
Network2007–08
+2.6
+1.2
+0.1 –0.1
+2.0
15.70.3
1.50.2
8.3
5.5
10.00.4 0.10.3
5.7
3.5
2007–08 2017–18 estimate
Change Increase in cost of component
Component increases as a share of total
growth
Network 3.5 5.5 2.0 57% 35%
Wholesale electricity 5.7 8.3 2.6 45% 45%
Environmental 0.3 1.5 1.2 424% 21%
Retail costs 0.1 0.2 0.1 114% 2%
Retail margin 0.4 0.3 –0.1 –34% –2%
Total cost stack 10.0 15.7 5.8 58% n/a
Source: ACCC analysis based on retailers’ data.
1.2 Cost stack componentsIn this section, we examine the impact of each cost stack component on the overall residential bill from 2007–08 to 2017–18, using data provided by the retailers. We provide an in-depth examination of each cost stack component in subsequent parts of the report.
1.2.1 WholesaleRetailers purchase electricity from generators through the NEM wholesale market at the current spot price, but manage the price risk of the fluctuating spot price through a variety of hedging instruments or vertical integration into generation. The wholesale cost of electricity is the cost that a retailer incurs to purchase electricity from the NEM and manage the associated risk.
Retailer cost information provided to the ACCC shows that on a NEM-wide basis, wholesale costs accounted for 34 per cent of the retailer cost stack in 2017–18.
Wholesale costs have been a significant driver of electricity bills over the last two years in all regions.
Wholesale costs decreased by varying degrees in each NEM region in 2014–15 as a result of revoking the carbon price on 1 July 2014. This resulted in a two-year period of lower wholesale costs before they increased again in 2016–17.
Figure 1.31 shows how wholesale costs per customer for an average residential bill from 2007–08 to 2017–18. Figure 1.32, which controls for reductions in average electricity usage, shows that the effective price of wholesale electricity has increased over time. Figure 1.32 is highly correlated to figure 1.33, which shows the wholesale spot price in each jurisdiction over time.

33 Retail Electricity Pricing Inquiry—Final Report
We note that there is some delay between changes in the spot price and wholesale costs in retailers’ cost stacks. This is because many retailers will hedge their wholesale costs to reduce volatility. The increases in wholesale costs appear to occur about one to two years after increases in spot prices.
We discuss the wholesale market in more detail in chapters 2 to 5.
Figure 1.31: Average wholesale cost of electricity by region $ per customer 2007–08 to 2017–18, real $2016–17
0
100
200
300
400
500
600
700
800
200
7–0
8
200
9–1
0
2011–
12
2013
–14
2015
–16
2017
–18
200
7–0
8
200
9–1
0
2011–
12
2013
–14
2015
–16
2017
–18
200
7–0
8
200
9–1
0
2011–
12
2013
–14
2015
–16
2017
–18
200
7–0
8
200
9–1
0
2011–
12
2013
–14
2015
–16
2017
–18
200
7–0
8
200
9–1
0
2011–
12
2013
–14
2015
–16
2017
–18
200
7–0
8
200
9–1
0
2011–
12
2013
–14
2015
–16
2017
–18
NSW South Australia South east Queensland
Tasmania NEM
$/c
usto
mer
Victoria
Source: ACCC analysis based on retailers’ data.
Figure 1.32: Average wholesale cost of electricity by region 2007–08 to 2017–18, $/MWh, real $2016–17
0
20
40
60
80
100
120
140
160
200
7–0
8
200
9–1
0
2011–
12
2013
–14
2015
–16
2017
–18
200
7–0
8
200
9–1
0
2011–
12
2013
–14
2015
–16
2017
–18
200
7–0
8
200
9–1
0
2011–
12
2013
–14
2015
–16
2017
–18
200
7–0
8
200
9–1
0
2011–
12
2013
–14
2015
–16
2017
–18
200
7–0
8
200
9–1
0
2011–
12
2013
–14
2015
–16
2017
–18
200
7–0
8
200
9–1
0
2011–
12
2013
–14
2015
–16
2017
–18
NSW South Australia South east Queensland
Tasmania NEM
$/M
Wh
Victoria
Source: ACCC analysis based on retailers’ data.

34 Retail Electricity Pricing Inquiry—Final Report
Figure 1.33: Annual electricity spot prices by NEM region 2006–07 to 2017–18, $/MWh, $nominal
0
20
40
60
80
100
120
140
2006–07 2007–08 2008–09 2009–10 2010–11 2011–12 2012–13 2013–14 2014–15 2015–16 2016–17 2017–18 (YTD)
$/M
Wh
Victoria NSW South Australia Queensland Tasmania
Source: ACCC analysis, AEMO data.
Notes: Volume-weighted average prices. 2017–18 (YTD) covers the period 1 July 2017 to 1 June 2018.
1.2.2 NetworksRetailers’ cost information provided to the ACCC shows that on a NEM-wide basis network costs accounted for 43 per cent of the retailer cost stack in 2017–18.
We have separated network cost data provided by the retailers into distribution, transmission and metering for 2016–17 and 2017–18. Distribution costs make up a majority of network costs followed by transmission and then metering.19 Metering in particular is a significant cost component in Victoria, where a mandatory distributor-led rollout occurred. These metering costs are not comparable to metering costs in other states. As noted in figure 1.6, the metering component includes the total cost of the smart meter program but does not include the associated reduction in network costs as a result of avoided costs, such as manual meter reads, and efficiency benefits to network operators.
We also note that on 1 December 2017, competition opened up for metering services which has resulted in a market-led deployment of smart meters in other states. This means that non-Victorian customers will have to purchase smart meters on the open market.
Figure 1.34 shows that network costs were a significant driver of increasing electricity bills from 2007–08 to 2014–15. Since then network costs have declined in each NEM region and are now below their peak.
We discuss the drivers of network cost trends in more detail in chapter 7.
19 We have not included the cost of premium FiT schemes recovered through network charges. Since these costs are related to jurisdictional environmental policy, we have included them in environmental costs.

35 Retail Electricity Pricing Inquiry—Final Report
Figure 1.34: Average network costs per customer 2007–08 to 2017–18, by state, real $2016–17
0
200
400
600
800
1000
1200 20
07-
08
20
09
-10
2011-
12
2013
-14
2015
-16
2017
-18
200
7-0
8
200
9-1
0
2011-
12
2013
-14
2015
-16
2017
-18
200
7-0
8
200
9-1
0
2011-
12
2013
-14
2015
-16
2017
-18
200
7-0
8
200
9-1
0
2011-
12
2013
-14
2015
-16
2017
-18
200
7-0
8
200
9-1
0
2011-
12
2013
-14
2015
-16
2017
-18
200
7-0
8
200
9-1
0
2011-
12
2013
-14
2015
-16
2017
-18
NSW South Australia South east Queensland
Tasmania NEM
$/c
usto
mer
Distribution Transmission Metering
Victoria
Source: ACCC analysis based on retailers’ data.
Note: Network proportions for distribution, transmission and metering were provided by distribution operators. We note metering costs, with the exception of Victoria, reflect 2016–17.
1.2.3 EnvironmentalFederal and state governments have introduced environmental policies to encourage greater uptake of renewable generation, promote energy efficiency measures and reduce carbon emissions. The majority of these schemes impose costs on retailers that flow through to a consumer’s electricity bill, unless funded from the tax base.
Environmental costs have been a significant contributor to average electricity bills since 2007–08. For 2016–17 and 2017–18, we have separated environmental costs into the two national schemes, the large-scale renewable energy target (LRET) and the small-scale renewable energy scheme (SRES), jurisdictional schemes and premium FiT schemes.
Retailers’ cost information provided to the ACCC shows that on a NEM-wide basis, environmental costs accounted for 6 per cent of the retailer cost stack in 2017–18.
Figure 1.35 shows that the national schemes contribute a similar cost on a c/kWh basis. Differences between each state reflect jurisdictional specific schemes and differences in take up of solar PV usage. South Australia has the highest environmental costs, which are driven by higher jurisdictional specific costs borne by electricity retailers (such as the Retailer Energy Efficiency Scheme) and high costs of premium FiT schemes recovered through network costs paid to solar PV households.
For 2017–18, Queensland had the lowest environmental costs. This is because the Queensland Government stopped recovering costs related to premium FiT schemes from network charges for a period of three years and funded the scheme through the tax base.
We discuss environmental costs in detail in chapter 9.
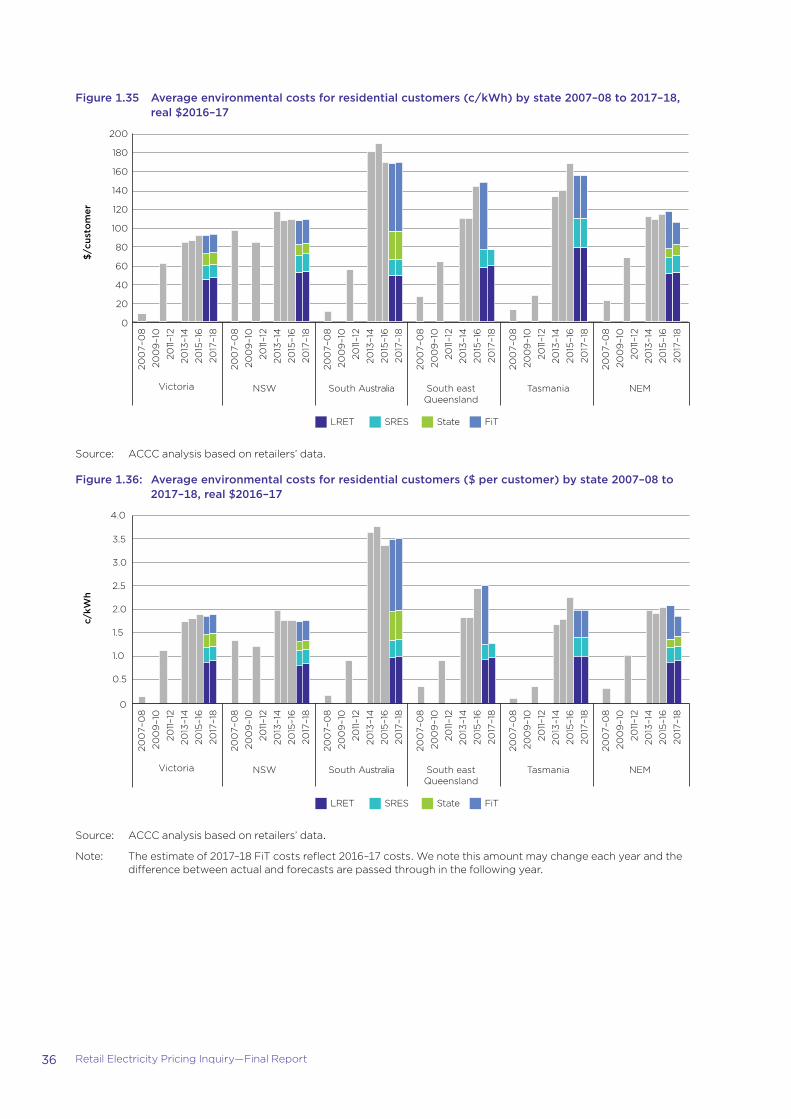
36 Retail Electricity Pricing Inquiry—Final Report
Figure 1.35 Average environmental costs for residential customers (c/kWh) by state 2007–08 to 2017–18, real $2016–17
0
200
7–0
8
200
9–1
0
2011–
12
2013
–14
2015
–16
2017
–18
200
7–0
8
200
9–1
0
2011–
12
2013
–14
2015
–16
2017
–18
200
7–0
8
200
9–1
0
2011–
12
2013
–14
2015
–16
2017
–18
200
7–0
8
200
9–1
0
2011–
12
2013
–14
2015
–16
2017
–18
200
7–0
8
200
9–1
0
2011–
12
2013
–14
2015
–16
2017
–18
200
7–0
8
200
9–1
0
2011–
12
2013
–14
2015
–16
2017
–18
NSW South Australia South east Queensland
Tasmania NEM
$/c
usto
mer
Victoria
LRET SRES State FiT
20
40
60
80
100
120
140
160
180
200
Source: ACCC analysis based on retailers’ data.
Figure 1.36: Average environmental costs for residential customers ($ per customer) by state 2007–08 to 2017–18, real $2016–17
0
200
7–0
8
200
9–1
0
2011–
12
2013
–14
2015
–16
2017
–18
200
7–0
8
200
9–1
0
2011–
12
2013
–14
2015
–16
2017
–18
200
7–0
8
200
9–1
0
2011–
12
2013
–14
2015
–16
2017
–18
200
7–0
8
200
9–1
0
2011–
12
2013
–14
2015
–16
2017
–18
200
7–0
8
200
9–1
0
2011–
12
2013
–14
2015
–16
2017
–18
200
7–0
8
200
9–1
0
2011–
12
2013
–14
2015
–16
2017
–18
NSW South Australia South east Queensland
Tasmania NEM
c/kW
h
Victoria
0.5
1.0
1.5
2.0
2.5
3.0
3.5
4.0
LRET SRES State FiT
Source: ACCC analysis based on retailers’ data.
Note: The estimate of 2017–18 FiT costs reflect 2016–17 costs. We note this amount may change each year and the difference between actual and forecasts are passed through in the following year.

37 Retail Electricity Pricing Inquiry—Final Report
1.2.4 Retail costs and marginAt the retail level, a retailer will attempt to recover its costs of operation, and obtain a level of profit margin.20 The costs of operation and the profit margin together are referred to as the ‘gross margin’, while the profit margin alone is sometimes referred to as the ‘net margin’. Increases in gross margin could potentially be due to increases in costs or profits, or both.
Data provided by retailers has indicated that, on average across the NEM in 2017–18, the retailer gross margin was 16 per cent of the total cost stack, with this being made up of an 8 per cent retail cost component and an 8 per cent EBITDA net margin component.
Figure 1.37 shows the retail gross margin in dollar terms, as reported by retailers, broken up between the costs component and the EBITDA component.
Since 2007–08, retail costs have increased across the NEM, but peaked in 2013–14 and have since been gradually declining. Generally retail costs on a per customer basis do not vary significantly by state. This is because, for retailers operating across multiple states, costs related to servicing customers are not state specific, but rather spread over the whole customer base.
The ACCC’s estimates of the size of the retail costs component have declined significantly from the estimates in the ACCC’s Preliminary Report. This reflects several effects, including correction of a data methodology error, new and updated information from retailers and changes in the general trends in other components (notably wholesale).
We discuss retail costs in more detail in chapter 10.
Retail margin varies significantly by state. Victoria and NSW have the highest retail margins. Meanwhile, South Australia and Queensland have the lowest margins.
We discuss EBITDA in more detail in section 6.3.
As noted in section 1.1.1, for confidentiality reasons we have combined Tasmania’s retail cost and retail margin components.
Figure 1.37: Comparison of retail costs and retail EBITDA margins for residential customers ($ per customer) by state 2007–08 to 2017–18, real $2016–17
0
50
100
150
200
250
300
350
400
2007
–08
2009
–10
2011
–12
2013
–14
2015
–16
2017
–18
2007
–08
2009
–10
2011
–12
2013
–14
2015
–16
2017
–18
2007
–08
2009
–10
2011
–12
2013
–14
2015
–16
2017
–18
2007
–08
2009
–10
2011
–12
2013
–14
2015
–16
2017
–18
2007
–08
2009
–10
2011
–12
2013
–14
2015
–16
2017
–18
2007
–08
2009
–10
2011
–12
2013
–14
2015
–16
2017
–18
Victoria NSW South Australia South east Queensland
Tasmania NEM
$/cu
sto
mer
Retail costs Retail component (Tas)Retail margin (EBITDA)
Source: ACCC analysis based on retailers’ data.
Note: Retailers reported negative margin for NSW in 2007–08. As noted above, the ACCC considers that this reflects a new entrant retail margin and is unlikely to be reflective of the overall cost stack during this period.
20 There are a number of possible accounting measures that can be used to assess net margin, including EBITDA, earnings before interest and tax (EBIT) and net profit after tax. The ACCC has concentrated on EBITDA in its analysis. Ideally, an assessment of return on capital should also be made, but the ACCC did not have information on capital employed for this report.

01Boosting competition in generation and retail markets

39 Retail Electricity Pricing Inquiry—Final Report
Key points�� Competition in the wholesale (generation) and retail parts of the supply chain is not working as
well as it could, and this has affected electricity affordability. In part 1 of this report we explore in detail the way in which the wholesale, retail and contracts markets are working in the NEM.
�� Wholesale prices have been a key contributor to increases in residential and business customers’ bills over the past two years as spot and futures prices reached record levels. In chapter 2 we look at the fundamental changes to the wholesale market as it undergoes a transition with older thermal generation technologies being replaced by new renewable technologies. We also detail the high profits achieved by wholesale businesses in that time.
�� In chapter 3 we look at the drivers of high wholesale electricity prices including higher fuel costs, the exit of some low-cost generation plants, high levels of market concentration and a tightening of the supply–demand balance. Together these factors have led to a lack of competitive constraint on market participants.
�� Wholesale prices (and expectations of future prices) have started to ease and that trend is expected to continue as new capacity enters the market. That said, we consider it is important that market and policy settings promote competition and lower prices. In chapter 4 we make recommendations to promote competitiveness in the wholesale market including tackling market concentration by capping market shares and breaking up generation assets in Queensland, optimising market rules and associated penalties, and encouraging new investment in generation (through stable and integrated energy policy and by addressing barriers to accessing investment financing).
�� In chapter 5 we consider the ways in which both generators and retailers manage risk in the market, including through vertical integration and the use of hedging contracts, both ASX and bilateral (or ‘over-the-counter’ (OTC)) products. The chapter includes an analysis of the transfer prices vertically integrated businesses use to allocate electricity costs between their retail and wholesale businesses, which suggests that wholesale profit is currently prioritised over retail competitiveness. To ensure sufficient liquidity in the South Australian contract market, the ACCC is recommending the introduction of market making obligations. This chapter also provides in-depth analysis of the opaque OTC market. That analysis has prompted the ACCC to make a recommendation that steps be taken to improve transparency of these products through publication of key information in a central repository open to market participants.
�� Finally, in chapter 6 we identify reasons why we have not seen competition deliver the benefits that were anticipated when retail markets were deregulated, even after the entry of many new electricity retailers in recent years. One key finding is that the three largest retailers have advantages that continue to flow from their acquisition of large customer bases at the time of deregulation, which makes it challenging for smaller retailers to compete effectively. The ACCC considers that the consumer-focused recommendations set out in part 3 of this report will serve to break down some of the barriers to expansion that we have identified. This chapter also identifies some specific recommendations to improve competition in the retail market by eliminating advance notice to retailers of the loss of a customer and speeding up the customer transfer process.

40 Retail Electricity Pricing Inquiry—Final Report
2. Wholesale market—where are we now?
The wholesale electricity market is undergoing unprecedented change. New generation technologies continue to emerge, and the cost of generation from these technologies is falling. This has resulted in an ongoing shift in the type of investment in generation in the NEM—most recently seen in the expansion of wind and solar PV generation. At the same time, we have seen some large coal generators retiring from the market and the cost and availability of key fuels, such as coal and gas, have changed. Consumers are starting to take a more active role in their energy use, including by installing solar PV and battery storage systems, and demand response is occurring more frequently. This transition presents challenges for the NEM and the market framework in which it operates.
Unprecedented high wholesale prices and increased price volatility in recent years are concerning. The Inquiry’s Preliminary Report identified increases in wholesale electricity prices as a key contributor to increases in retail electricity costs, particularly in the past two to three years.
2.1 Market design and operationUnderstanding the wholesale market design is critical to understanding the evolution of the market and the current market outcomes.
The NEM is a wholesale spot market that covers five regions—Queensland, NSW, Victoria, South Australia and Tasmania. The ACT falls within the NSW region. Over 300 registered generators sell electricity into the NEM,21 with the output of these generators matched to customer demand in real time. Prices may increase or decrease in response to supply and demand conditions.
Box 2.1: Bidding in the NEM—how are prices set?Generators submit offers to supply the market the day before dispatch occurs. These offers include specified volumes for every five minutes at up to 10 different prices. Offers can be adjusted at any time up to the point of dispatch.
From all the bids offered, the Australian Energy Market Operator (AEMO) decides which generators will be dispatched. The cheapest bids are selected first, then progressively more expensive bids until enough electricity can be dispatched to meet demand. The final bid needed to meet demand sets the ‘dispatch price’.
A dispatch price is determined every five minutes. Every 30 minutes, the six dispatch prices for that period are averaged to determine the ‘spot price’.
The 30-minute spot price is paid to all generators for their dispatched electricity during that period, regardless of how they bid. A separate spot price is determined for each of the five NEM regions every 30 minutes.22 Spot prices are capped at a maximum of $14 200/MWh.23 A price floor of –$1000/MWh also applies.
The NEM is an ‘energy-only’ market. In an energy-only market, generators are only paid for the energy they produce. When an energy-only market is operating effectively, generators will offer their capacity into the market at a price where they can cover their fuel and operating costs (short run marginal costs). They then rely on (typically short) periods of spot price volatility (high prices) to cover fixed costs and make returns on capital investment.
21 AER, State of the Energy Market, May 2017, p. 43.22 On 28 November 2017, the AEMC made a final rule to change the settlement period from 30 minutes to five minutes, commencing on
1 July 2021. This rule change aligns operational dispatch and financial settlement at five minutes to provide a better price signal for investment in fast response technologies, such as batteries, new generation gas peaking plants and demand response. See: https://www.aemc.gov.au/rule-changes/five-minute-settlement.
23 This is the market price cap threshold value for 2017–18. From 1 July 2018, it changes to $14 500/MWh.

41 Retail Electricity Pricing Inquiry—Final Report
The NEM is designed to incentivise new entry or expansion through price signals in the spot market. Frequent or persistent high prices indicate a scarcity of generation capacity and provide a market signal and incentives for new investment. A price cap is set at $14 200/MWh to place a limit on exposure to extremely high prices, but high enough to encourage new investment. Conversely, if demand decreases relative to supply, this will put downward pressure on prices which in turn should prompt high-cost generators to exit, temporarily or permanently, from the market.
In contrast, many overseas electricity markets operate ‘capacity’ markets. Under a capacity market design, generators are paid both for the energy they produce and the capacity they provide to the market. The amount of capacity required in the market is centrally planned. Generators are often required to bid physical output into the market at the cost of production, while separate capacity payments are designed to support new investment. This means that high price events are not required for generators to recover their fixed costs. A key risk of capacity markets is that conservative estimates by central planners end up being paid for by consumers, regardless of whether the capacity is actually needed.
Day-ahead markets, where participants commit to buy and sell positions the day before physical dispatch of the electricity, can be applied to both energy-only and capacity market designs.24 A real-time market is still required to balance actual electricity production and consumption with the day-ahead positions.
Given the potential for price volatility in an energy-only market, financial contracting (hedging) markets operate in parallel to the spot market to allow participants to manage this price risk. Hedge markets also provide a signal to future prices (as contracts are typically traded up to two to four years into the future) and assist investors in locking in returns needed to support new investment. Forward prices reflect both the general level of wholesale prices, and the degree of price volatility.
As prices in the wholesale and hedge markets increase, we would expect to see new investment in an energy-only market provided that:
�� prices are high enough to incentivise the investment
�� there are no significant barriers to entry or expansion.
A lack of effective competition is a key risk to the market producing efficient price signals and to the market delivering low prices for consumers. Real-time price setting to match supply and demand, with generators able to adjust their bids right up to the point of dispatch, creates the potential for the exercise of market power. Combined with a high price cap, even short periods of the exercise of market power can significantly increase average market costs. For example, five hours of prices at the market price cap of $14 200/MWh would raise average annual prices by around $8/MWh.
2.2 Changes in the wholesale marketThere have been significant changes in the NEM in recent years. In particular there have been changes in:
�� the balance between supply and demand
�� the level of concentration in generation
�� generation technology.
These are discussed in turn below.
2.2.1 Supply–demand balanceHistorically the NEM has had an over-supply of generation, although this varied across regions. New investment maintained a similar trajectory to increases in maximum demand from market start to around 2009 (figure 2.1). Investment in new plant continued from 2009 to 2012 based on an expectation that demand growth would continue, however demand actually fell over this period. This saw a large increase in the amount of surplus capacity across the market.
24 The AEMC is currently reviewing the need for a day-ahead market in the NEM following a recommendation in the Independent Review into the Future Security of the National Electricity Market (Finkel review). See: https://www.aemc.gov.au/markets-reviews-advice/reliability-frameworks-review. Some examples of overseas day-ahead markets are described in section 4.2.

42 Retail Electricity Pricing Inquiry—Final Report
While demand has been relatively stable since that time, the market responded to the oversupply through a reduction in generation capacity. Over 5500 MW of generation capacity was retired or mothballed between 2012 and 2017,25 with less than 3000 MW of new investment over this same period. This has resulted in a re-tightening of the supply–demand balance. One generation business described the transition (at the end of 2016) as:
[t]he concept of a grossly oversupplied generation market has disappeared almost overnight following the closure of Alinta’s Flinders power station in SA in May 2016, the announcement of a March 2017 Hazelwood closure and the reduced availability of economic gas supply. Spot price volatility this year has revealed a market much more finely balanced than anticipated, exacerbated by the increasing incidence of planned and unplanned outages as the generation fleet ages.
Figure 2.1 also shows that the proportion of generation capacity by renewable technology has been increasing over time. Investment in renewables has largely been driven by incentives under the Australian Government’s LRET. The LRET is discussed in section 2.2.3.
Together with reductions in coal and gas generation capacity, the growth in intermittent renewables has meant that generation availability is now more variable. This has added to the tightness of supply on some occasions when wind and solar output have been low.
Figure 2.1: NEM capacity and demand by fuel type from 2002–03 to 2017–18 (YTD)
10
20
30
40
50
60
GW
Black coal Brown coal Gas Hydro Wind Solar Other
NEM peak demand NEM average demand
200
2–0
3
200
3–0
4
200
4–0
5
200
5–0
6
200
6–07
2007
–08
200
8–0
9
200
9–10
2010
–11
2011
–12
2012
–13
2013
–14
2014
–15
2015
–16
2016
–17
2017
–18
(YTD
)
Source: ACCC analysis of AEMO data.
Note: 2017–18 (YTD) covers the period 1 July 2017 to 1 June 2018.
2.2.2 ConcentrationMarket concentration in the NEM has always been high. The ability for this to impact on market outcomes was noted in the Council of Australian Governments (COAG) Independent Review of Energy Market Directions (Parer review) in 2002. The Parer review noted the decisions by the NSW and Queensland governments to create portfolios of generation assets, in contrast to the Victorian and South Australian governments that established most generation plants as separate businesses:
The nature of generating units controlled by portfolio generators may strengthen the potential for them to exercise market power. For example, a portfolio generator that owns peaking and base-load generation would have greater potential to implement a bidding strategy (e.g possibly including economic withdrawal of capacity) to drive spot prices higher during periods when the supply and demand balance tightens.26
25 AER, State of the Energy Market, May 2017, p. 40.26 COAG, Towards a Truly National and Efficient Energy Market, December 2002, p. 112.

43 Retail Electricity Pricing Inquiry—Final Report
Since that time, we have seen significant horizontal re-aggregation of generation assets across the NEM, with concentration of assets among a limited number of players.
Figures 2.2 and 2.3 show market shares by region by generation capacity installed (in January 2018) and generation dispatched (in the year to April 2018) respectively. The installed capacity data likely overstates the market share of businesses that have mostly peaking generators (such as Origin in Queensland and Victoria), or fuel-constrained hydro plants (such as Snowy Hydro), that may have a lot of generation capacity but typically only run for short bursts at peak times. The capacity dispatched data shows that the market share of peaking and fuel-constrained generators is noticeably lower (for example, this can be seen by comparing the Snowy Hydro figures in each chart). However, figure 2.3 likely understates the significance of generators that supply electricity when demand is highest, thereby mitigating the potential for price spikes.
Figure 2.2: Market share by generation capacity by region, January 2018
27%
23%
10%
19%
8%
11%
9%
34%
32%
10%
4%
8%
39%
14%
6%
4%
22%
13%
88%
12%
30%
5%
23%
21%
10%
9%
NSW Qld SA TasVic14.7 GW 11.7 GW 2.9 GW 2.4 GW9.0 GW
0%
25%
50%
75%
100%
0% 25% 50% 75% 100%
% of NEM capacity
% o
f re
gio
nal c
apac
ity
Other (5%)InterconnectorHydro Tas (6%)Engie (2%)Alinta (4%)InterGen (3%)Stanwell (9%)CS Energy (10%)Sunset Power (3%)Snowy Hydro (13%)EnergyAustralia (10%)Origin (14%)AGL (21%)
NEM-wide market share
Source: ACCC analysis of AEMO data.
Note: Percentages in the chart represent the percentage share within the region; percentages in the legend represent the total NEM-wide market share for each company.
Data for South Australia excludes around 350 MW of capacity controlled by the South Australian Government (70 MW of battery storage, and 276 MW of temporary diesel/gas generation). This capacity does not compete in the market and is expected to be used only in emergency situations.

44 Retail Electricity Pricing Inquiry—Final Report
Figure 2.3: Market share by generation dispatched by region, year to April 2018
38%
29%
16%
12%
4%
36%
36%
16%
7%
33%
23%
24%
15%
100%
40%
26%
5%
20%
5%
131.5 GWh 121.8 GWh 25.6 GWh 21.6 GWh90.8 GWhNSW Qld SA TasVic
0%
25%
50%
75%
100%
0% 25% 50% 75% 100%
% of NEM dispatch
% o
f re
gio
nal d
isp
atch
Other (5%)Hydro Tas (6%)Engie (2%)Alinta (5%)InterGen (5%)Stanwell (11%)CS Energy (11%)Sunset Power (4%)Snowy Hydro (2%)EnergyAustralia (11%)Origin (13%)AGL (25%)
NEM-wide market share
Source: ACCC analysis of AEMO data.
Note: Percentages in the chart represent the percentage share within the region; percentages in the legend represent the total NEM-wide market share for each company.
As figure 2.2 and figure 2.3 illustrate, all regions of the NEM are highly concentrated. In each NEM region the current combined market shares of the three most significant generators is close to or in excess of 70 per cent on the capacity measure, and over 80 per cent on the dispatched energy measure. In Tasmania, Hydro Tasmania is effectively the only generator, but Tasmania has access to mainland generation through the Basslink interconnector.
In all NEM regions, a single generation business accounted for more than 30 per cent of dispatched energy in the year to April 2018. AGL in particular accounted for close to 40 per cent in each of NSW and Victoria, and over 30 per cent in South Australia. In Queensland, the state-owned CS Energy and Stanwell Corporation facilities together account for over 70 per cent of electricity generated.
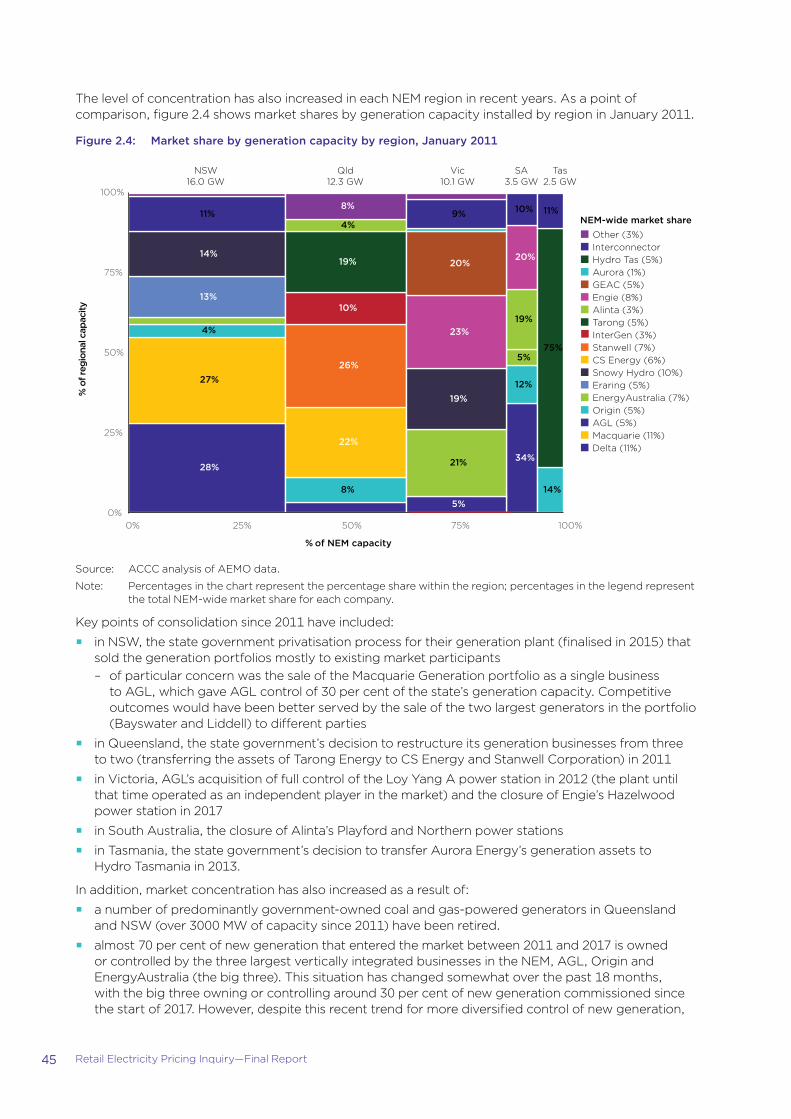
45 Retail Electricity Pricing Inquiry—Final Report
The level of concentration has also increased in each NEM region in recent years. As a point of comparison, figure 2.4 shows market shares by generation capacity installed by region in January 2011.
Figure 2.4: Market share by generation capacity by region, January 2011
28%
27%
4%
13%
14%
11%
8%
22%
26%
10%
19%
4%
8%
34%
12%
5%
19%
20%
10%
14%
75%
11%
5%
21%
19%
23%
20%
9%
0%
25%
50%
75%
100%
0% 25% 50% 75% 100%
% of NEM capacity
% o
f reg
iona
l cap
acity
Other (3%)InterconnectorHydro Tas (5%)Aurora (1%)GEAC (5%)Engie (8%)Alinta (3%)Tarong (5%)InterGen (3%)Stanwell (7%)CS Energy (6%)Snowy Hydro (10%)Eraring (5%)EnergyAustralia (7%)Origin (5%)AGL (5%)Macquarie (11%)Delta (11%)
NSW16.0 GW
Qld12.3 GW
Vic10.1 GW
SA3.5 GW
Tas2.5 GW
NEM-wide market share
Source: ACCC analysis of AEMO data.
Note: Percentages in the chart represent the percentage share within the region; percentages in the legend represent the total NEM-wide market share for each company.
Key points of consolidation since 2011 have included:
�� in NSW, the state government privatisation process for their generation plant (finalised in 2015) that sold the generation portfolios mostly to existing market participants – of particular concern was the sale of the Macquarie Generation portfolio as a single business
to AGL, which gave AGL control of 30 per cent of the state’s generation capacity. Competitive outcomes would have been better served by the sale of the two largest generators in the portfolio (Bayswater and Liddell) to different parties
�� in Queensland, the state government’s decision to restructure its generation businesses from three to two (transferring the assets of Tarong Energy to CS Energy and Stanwell Corporation) in 2011
�� in Victoria, AGL’s acquisition of full control of the Loy Yang A power station in 2012 (the plant until that time operated as an independent player in the market) and the closure of Engie’s Hazelwood power station in 2017
�� in South Australia, the closure of Alinta’s Playford and Northern power stations
�� in Tasmania, the state government’s decision to transfer Aurora Energy’s generation assets to Hydro Tasmania in 2013.
In addition, market concentration has also increased as a result of:
�� a number of predominantly government-owned coal and gas-powered generators in Queensland and NSW (over 3000 MW of capacity since 2011) have been retired.
�� almost 70 per cent of new generation that entered the market between 2011 and 2017 is owned or controlled by the three largest vertically integrated businesses in the NEM, AGL, Origin and EnergyAustralia (the big three). This situation has changed somewhat over the past 18 months, with the big three owning or controlling around 30 per cent of new generation commissioned since the start of 2017. However, despite this recent trend for more diversified control of new generation,

46 Retail Electricity Pricing Inquiry—Final Report
the big three have expanded their combined market share of generation capacity (either through ownership or control of plant output) from 17 per cent in 2011 to around 45 per cent in 2018 (see figures 2.2 and 2.4).
2.2.3 Changes in technologyAs noted above, the wholesale market is undergoing a significant transition. In particular, the proportion of generation produced by renewable technology is increasing—see figure 2.1. Of around 2500 MW of new generation investment over the past six years, well over 90 per cent has been in renewables. Since 2013, no material thermal generation has been added to the market. The last such investment was Origin’s increase in capacity at its Eraring coal plant in NSW.27 While some new thermal plant is being considered, this is driven primarily by major existing generators investing in replacement generation assets for some of their aging plant, for example:
�� AGL’s Barker Inlet will replace parts of its Torrens Island A station.28
�� AGL has announced plans to build gas generation as part of its plans to replace the capacity from Liddell when it is retired in 2022.29
This increasing penetration of renewables is set to continue. Figure 2.5 shows the level of accredited, committed and probable large scale of renewable investment announced over the past two years.
Figure 2.5: Renewable energy project developments from January 2016 to April 2018
Accredited Committed Probable
0
8000
MW
January 2016–April 2018
6000
4000
2000
Source: Clean Energy Regulator.
As at March 2018, nearly 90 per cent of the 4400 MW of committed generation investment coming into the NEM is either wind (2032 MW) or solar PV (1877 MW).30 A similar percentage of the 45 000 MW of proposed projects in the NEM are also renewables (39 per cent wind, 38 per cent solar and 11 per cent hydro), with the remainder mostly gas plant.31 A further 2500 MW of existing coal and gas plant is also expected to retire in the next four years.32
27 AER, State of the Energy Market, May 2017, p. 38.28 AGL, AGL announces development of $295m power station in SA, Media Release, 6 June 2017.29 AGL, AGL announces plans for Liddell Power Station, Media Release, 9 December 2017.30 Data sourced from AEMO, Generation Information Page (last updated in March 2018), viewed 12 June 2018, http://www.aemo.org.
au/Electricity/National-Electricity-Market-NEM/Planning-and-forecasting/Generation-information.31 Data sourced from AEMO, Generation Information Page (last updated in March 2018), viewed 12 June 2018, http://www.aemo.org.
au/Electricity/National-Electricity-Market-NEM/Planning-and-forecasting/Generation-information.32 Data sourced from AEMO, Generation Information Page (last updated in March 2018), viewed 12 June 2018, http://www.aemo.org.
au/Electricity/National-Electricity-Market-NEM/Planning-and-forecasting/Generation-information.

47 Retail Electricity Pricing Inquiry—Final Report
A key driver of investment in renewable generation has been the LRET.33 Under that scheme, new renewable generation has not had to rely on market prices alone to underpin investment, but instead could rely on the separate revenue stream available through the sale of Large-scale Generation Certificates (LGCs).
Although the LRET was introduced in its current form in 2009, the level of renewable generation investment has only markedly picked up recently. This followed changes to the LRET in 2015 that received bipartisan support, providing certainty that the scheme was likely to continue until 2030. The spot prices for LGCs have traded sharply higher since 2015, currently trading at over $80 (compared to under $50 until 2015). The LRET is discussed further in chapter 9.
Our discussions with market participants make it clear that revenue under the LRET scheme has been a significant factor in their investment decisions for renewable generation projects.
There is expected to be sufficient new renewable generation in the market by 2020 to meet the LRET, which will reduce prices of certificates under the scheme and dampen the incentive for investment in renewable capacity.34 However, should it be introduced, the National Energy Guarantee (NEG) is expected to encourage investment in generation capacity (both renewables and other generation more broadly). Unlike the LRET, which provided a flat incentive for all renewable development, the draft NEG design is focused on creating incentives to invest in capacity that can be supplied to the market when the demand requires it.35
As technology costs continue to fall, and the larger market participants make a stated shift towards renewable generation, we expect that future investment is likely to favour renewable plant even in the absence of direct policy intervention to support renewable technologies.
In addition, the increasing use of demand response (where customers adjust their usage or change their use of on-site generation or storage in response to price signals) is a further area where technological developments are providing opportunities to reduce costs and promote competition in the wholesale market.
While technology has been available for some time for large commercial and industrial customers to employ demand response, more recent innovations allow for aggregation of demand response from smaller customers. However, there are still regulatory and commercial barriers to the effective use of this demand response in the wholesale market. This is discussed further in chapter 8.
2.3 Changes in price outcomesThe changes in market conditions and structure described above have seen a significant shift in price outcomes.
2.3.1 Recent high spot and contract pricesOne generator remarked in February 2017 ‘we are facing an unprecedented upward price spiral for the next 6–12 months, with great uncertainty after that.’ What followed was a period of record average prices.
The highest average quarterly prices were seen in the first half of 2017. Prices have since eased somewhat in Queensland and NSW, but remain elevated in Victoria, South Australia and Tasmania (table 2.1).
33 The LRET is explained in further detail at Clean Energy Regulator, Large-scale Renewable Energy Target, viewed 12 June 2018, http://www.cleanenergyregulator.gov.au/RET/About-the-Renewable-Energy-Target/How-the-scheme-works/Large-scale-Renewable-Energy-Target.
34 On 11 May 2018, the Clean Energy Regulator announced that ‘there is now enough new renewable energy project capacity under construction or already built to meet the 2020 Renewable Energy Target.’ (Clean Energy Regulator, Enough capacity under construction or already built to meet the Renewable Energy Target, Media Release, 11 May 2018).
35 COAG Energy Council Energy Security Board, National Energy Guarantee: High Level Design Document, 20 April 2018, p. 6.

48 Retail Electricity Pricing Inquiry—Final Report
Table 2.1: Wholesale spot prices by region ($/MWh nominal), average from 2008 to 2014 and annual averages for 2015 to 2018 (to June 2018)
Queensland NSW Victoria South Australia Tasmania
Average 2008 to 2014 $46 $45 $44 $66 $42
2015 $58 $41 $36 $56 $48
2016 $72 $62 $52 $90 $93
2017 $112 $102 $97 $120 $99
2018 (to June) $70 $75 $104 $128 $86
Source: ACCC analysis of AEMO data.
Note: Prices are volume-weighted spot prices.
Forward prices indicate that the market expects spot prices to continue to ease gradually over the next two years. However, prices are not expected to return to historical lows seen in the period up to 2015. Based on the forward curve in June 2018, the market is forecasting prices to stabilise at around $65/MWh in Queensland, around $70–75/MWh in NSW and Victoria, and $85/MWh in South Australia (figure 2.6). This represents an increase from average prices seen over 2008–2014 of between 40 per cent (Queensland) and 60 per cent (NSW and Victoria).
Recent modelling for the Australian Energy Market Commission (AEMC) and the Energy Security Board (ESB) presents a different picture of wholesale prices over the next few years. Modelling by Frontier Economics for the AEMC’s 2017 Residential Electricity Price Trends Report forecast spot prices in Queensland, NSW and Victoria to fall below $60/MWh by 2020.36 South Australian prices were forecast to fall to around $65/MWh.37 Modelling undertaken for the proposed NEG in November 2017 forecast that wholesale prices under business as usual assumptions would fall to almost $40/MWh in 2021 and 2022.38 The ESB stated that the steep decline from current prices reflects the high volume of committed renewable capacity that will come online over the next few years.39 Under the modelling, prices beyond 2022 were expected to rise following the exit of the Liddell power station in NSW, stabilising at around $50/MWh.40
Renewables have negligible marginal cost to operate and are typically bid in at low prices to ensure dispatch. This bidding behaviour places downward pressure on wholesale prices (when the plant is operating). However, the levelised (long run) costs of renewable plant are still currently higher than much of the installed thermal plant.
The market itself appears to be placing lower expectations on the price impact of low-price offers by new renewables expected to come online in the next few years. Forward prices appear to instead be an estimate of the new (higher) average cost of supply associated with the ongoing shift in generation mix as aging low-cost coal generation retires. In the short term, any loss in supply from these generators is expected to be met by other (higher-cost) generators in the market.
36 Frontier Economics, 2017 Residential Electricity Price Trends Report, A report prepared for the Australian Energy Market Commission (AEMC), December 2017, p. 56.
37 Frontier Economics, 2017 Residential Electricity Price Trends Report, A report prepared for the Australian Energy Market Commission (AEMC), December 2017, p. 56.
38 COAG Energy Council Energy Security Board, Advice: The National Energy Guarantee, 20 November 2017, pp. 12–13.39 COAG Energy Council Energy Security Board, Advice: The National Energy Guarantee, 20 November 2017, p. 12.40 COAG Energy Council Energy Security Board, Advice: The National Energy Guarantee, 20 November 2017, p. 13.

49 Retail Electricity Pricing Inquiry—Final Report
Figure 2.6: Futures prices at June 2018 by region
0
20
40
60
80
100
120
140 20
18 Q
2
2018
Q3
2018
Q4
2019
Q1
2019
Q2
2019
Q3
2019
Q4
2020
Q1
2020
Q2
2020
Q3
2020
Q4
2021
Q1
2021
Q2
2021
Q3
2021
Q4
2022
Q1
2022
Q2
$/M
Wh
Queensland NSW Victoria South Australia
Source: ACCC, based on ASX data.
Note: Prices for base contracts for each quarter as at 1 June 2018.
2.3.2 Wholesale costs for retailersIn the course of the Inquiry we have seen the impact this change in wholesale and forward prices has had on retailers. Wholesale costs faced by retailers are set out in figure 2.7.
These figures represent the cost of purchasing electricity from the NEM and of managing hedging and price exposure (rather than simply the cost of electricity on the spot market). For vertically integrated businesses, these costs partially represent the transfer price imposed on internal generation used to support their retail operations.
The wholesale costs faced by retailers in 2017–18 were forecast to be substantially higher than at any point over the previous 10 years, noting that the prices in 2013–14 included a component relating to the carbon price that was in effect that year. Costs in 2017–18 were forecast to be around a third higher than the previous year, and around 60 per cent higher than in 2015–16.

50 Retail Electricity Pricing Inquiry—Final Report
Figure 2.7: Average wholesale cost of electricity paid by retailers by region 2007–08 to 2017–18, $/MWh, real $2016–17
0
20
40
60
80
100
120
140
160 20
07–
08
200
9–1
0
2011–
12
2013
–14
2015
–16
2017
–18
200
7–0
8
200
9–1
0
2011–
12
2013
–14
2015
–16
2017
–18
200
7–0
8
200
9–1
0
2011–
12
2013
–14
2015
–16
2017
–18
200
7–0
8
200
9–1
0
2011–
12
2013
–14
2015
–16
2017
–18
200
7–0
8
200
9–1
0
2011–
12
2013
–14
2015
–16
2017
–18
200
7–0
8
200
9–1
0
2011–
12
2013
–14
2015
–16
2017
–18
NSW South Australia South east Queensland
Tasmania NEM
$/M
Wh
Victoria
Source: ACCC analysis based on retailers’ data.
Note: This is internal wholesale cost data provided by retailers which would incorporate their hedging and related costs. For many vertically integrated retailers, the wholesale cost is based on an internal transfer price. See chapter 5 for further detail.
2.3.3 Flow-on impact on profitability of generation businessesIncreases in wholesale prices have led to very high profits for many generation businesses. In early 2017, one generation business noted that ‘there is a very strong possibility that we will exceed $[…] million EBITDA this financial year, which, for those of us who were around four years ago, was a highly aspirational ‘dream’ target.’
The ACCC obtained wholesale revenue and profitability figures for the years 2014–15 to the first half of 2017–18 from eight of the largest generation businesses across the mainland regions of the NEM.
Figure 2.8 shows aggregate revenues and earnings before interest and tax (EBIT) reported by seven of those businesses.41 The chart illustrates the dramatic increase in overall earnings in 2016–17 and in the six months to the end of 2017. Between 2015–16 and 2016–17, aggregate EBIT almost doubled from just over $1.5 billion to almost $3 billion.
Analysis of generators’ EBIT margins (that is, EBIT as a percentage of revenue) indicates that the weighted average EBIT margin for these generation businesses ranged from 19 per cent to 20 per cent in 2014–15 and 2015–16, to 22 per cent in 2016–17 with a number of generators having EBIT margins over 30 per cent in 2016–17.
In 2014–15 there were significant differences between generation businesses with some businesses earning relatively low (and even negative) wholesale margins while others had larger earnings. By the first half of 2017–18, all generation businesses reported EBIT margins of 14 per cent or higher.
41 One of the eight businesses did not provide EBIT information. Some businesses’ data included their gas operations.

51 Retail Electricity Pricing Inquiry—Final Report
Figure 2.8: Generation businesses’ wholesale related revenue and EBIT, 2014–15 to HY 2017–18
0
0.5
1.0
1.5
2.0
2.5
3.0
3.5
2014–15 2015–16 2016–17 2017–18
$ b
illio
ns
EBIT
0
2
4
6
8
10
12
14
2014–15 2015–16 2016–17 2017–18
$ b
illio
ns
Revenue
1.25
1.57
2.95
1.72
5.78
7.76
12.10
7.79
Source: ACCC analysis of data provided by generation businesses.
Note: Data presented in the above charts are based on seven generators which provided comparable figures.
2017–18 refers to the period 1 July 2017 to 31 December 2017.
The information collected by the ACCC is consistent with publicly available information. AGL publically reports its financial results for various segments of its business, including its wholesale business. Figure 2.9 shows consistent growth in AGL’s EBIT from wholesale operations (which includes its gas operations) from 2009–10. AGL reports that the principal driver of its first half of 2017–18 results was the strong margin growth in its Wholesale Markets segments driven by higher wholesale electricity prices.42
Figure 2.9: AGL EBIT from wholesale operations, 2009–10 to HY 2017–18
0
200
400
600
800
1000
1200
20
09
–10
20
10–1
1
20
11–1
2
20
12–1
3
20
13–1
4
20
14–1
5
20
15–1
6
20
16–1
7
20
17–1
8
$ m
illio
ns
386 378477
753 750
946 986
1142
794
1400
Source: ACCC analysis of AGL’s public financial results.
Note: Wholesale operations include electricity and gas and are defined as AGL’s Merchant segment (excluding Business Customers) for years 2009–10 to 2012–13 and AGL’s Wholesale Markets and Group Operations segments for years 2013–14 to HY 2017–18.
2017–18 refers to the period 1 July 2017 to 31 December 2017
AGL’s broad portfolio is likely to be a key factor behind such results. AGL owns brown coal, hydro and gas generators in Victoria, black coal generators in NSW and gas generators in South Australia. It also controls the output of a mix of other generation across the NEM. Higher electricity prices are particularly favourable for low-cost generation, such as brown and black coal. As examples, figures 2.10 and 2.11 show the stark increase in spot revenues per unit of electricity produced by brown coal generators in Victoria, and black coal generators in NSW.
42 AGL, Half-year Report, 8 February 2018, p. 10.

52 Retail Electricity Pricing Inquiry—Final Report
Figure 2.10: Victorian brown coal generators, spot unit revenue and total sent out energy, 2015 to 2017
33 46
88
0
10
20
30
40
50
0
20
40
60
80
100
120
2015 2016 2017
tera
wat
t ho
ur (
TW
h)
$/M
Wh
Spot unit revenue (LHS) Sent out energy (RHS)
60
Source: ACCC analysis of AEMO data.
Figure 2.11: NSW and Queensland black coal generators, spot unit revenue and total sent out energy, 2015 to 2017
39
59
96
51
66
100
0
10
20
30
40
50
60
0
20
40
60
80
100
120
2015 2016 2017 2015 2016 2017
NSW Queensland
TW
h
$/M
Wh
Spot unit revenue (LHS) Sent out energy (RHS)
Source: ACCC analysis of AEMO data.
Queensland black coal generators also reported strong earnings in 2016–17, with profits from Stanwell Corporation and CS Energy increasing from $379 million in 2014–15 to $658 million in 2016–17.43 The increase in earnings is attributed to higher-priced generation and stable operating expenses.44
While these increases were substantial, it should be noted that Stanwell Corporation and CS Energy had not consistently earned such high profits. Indeed public reporting suggests the two generation businesses experienced low (or negative) returns from 2008–09 to 2012–13.45
43 Queensland Audit Office, Energy: 2016–17 results of financial audits Report 9: 2017–18, February 2018, p. 9.44 Queensland Audit Office, Energy: 2016–17 results of financial audits Report 9: 2017–18, February 2018, p. 3.45 Queensland Audit Office, Results of audit: Energy sector entities 2012–13 Report to Parliament 9: 2013–14, p. 25.

53 Retail Electricity Pricing Inquiry—Final Report
2.4 Overall market trendsDespite significant investment in renewables, new investment has not fully offset the reduction in supply from the closure of (predominantly low-cost) coal and gas plant over recent years. The intermittent nature of wind and solar plant means that there are periods where these generators are producing little output, tightening the supply–demand balance. A similar effect occurs through the operation of hydro plant, with the output of this plant limited by the volume of water reserves available. During periods where water supplies are being conserved, this reduces the effective level of supply. Some of this supply gap has therefore needed to be filled by higher-cost generation, and has resulted in this higher-cost plant setting the wholesale price more often (see chapter 3 for more detail).
The cost of supply from some existing thermal generators has also changed substantially over the past two years due to increases in gas and coal prices. These plants have also faced challenges in managing their fuel supplies. Supply issues for some plants, and the relatively short notice provided for the closure of the Hazelwood power station, meant that these generators did not necessarily have arrangements in place to manage an increase in required output.
In time, the growth in renewable capacity should increase the level of generation offered into the market at low prices. At times when intermittent generation is available, this will put competitive pressure on the bidding of coal and gas generators. That dynamic will, however, ebb and flow over the longer-term as we see the exit of further major coal generators from the market. Figure 2.12 from the AEMC’s 2017 Residential Electricity Price Trends Report illustrates this effect.46
Figure 2.12: Effect of medium-term dynamics in the NEM
Investment driven by the LRET increases competition putting downward pressure on prices
Competition increases as prices rise putting downward pressure on prices
Long-run marginal cost: increases as higher capital cost renewables comprise an increasing share of generation
Short-run marginal cost: decreases as renewables, which have negligible fuel costs, comprise an increasing share of generation
Fall in prices may influence some thermal generation to withdraw which reduces competition putting upward pressure on prices
Time
Who
lesa
le e
lect
rici
ty s
po
t p
rice
Source: AEMC 2017 Residential Electricity Price Trends Report.
These issues are analysed in further detail in chapter 3, and in chapter 4 we put forward recommendations that will improve wholesale market outcomes.
46 AEMC, 2017 Residential Electricity Price Trends Report, 18 December 2017, p. v.

54 Retail Electricity Pricing Inquiry—Final Report
3. What has been driving wholesale prices?
Chapter 2 highlighted the recent higher levels of wholesale prices experienced in the NEM, with overall prices the highest since the NEM commenced. While spot prices have eased so far in 2018 (particularly in Queensland and NSW), and forward contract prices have also eased, prices remain high compared with historic levels.
Historically, higher demand for electricity has been a catalyst for higher prices. However, over the past two years average demand has remained relatively flat (with the exception of some increase in Queensland).
The ACCC’s analysis indicates that recent high wholesale prices are a result of:
�� a shift in the mix of generators supplying electricity and setting wholesale prices
�� changes in the costs of generation, in particular increases in the costs of gas and black coal
�� the current market structure.
This chapter sets out the ACCC’s analysis and findings regarding each of these factors. To inform parts of this analysis, the ACCC commissioned HoustonKemp to examine:
�� how market structure (and changes to structure) has affected generators’ offers and spot price outcomes in the NEM around key events (HoustonKemp analysis of NEM events)47
�� the impact of gas-powered generation in the NEM (HoustonKemp gas-powered generation analysis).48
3.1 Higher prices offered to the market and changes to marginal generator
As noted in chapter 2, wholesale spot prices are determined based on the prices that generators offer their capacity into the NEM, and the extent to which each generator is required to meet demand. During 2017, many generators’ offer prices were significantly higher than they were in 2015 (when spot price outcomes were at a level similar to long-term averages).
There was also a shift in the mix of generators required to be dispatched to meet demand, with more output from black coal, gas and hydro generators.
3.1.1 Offers by certain generators shifted to higher price bandsFigure 3.1 shows the difference in overall generator offers in mainland NEM regions at July 2015, July 2017 and March 2018.
47 HoustonKemp, Analysis of NEM events, Final results presentation, May 2018 (available at appendix 7). Further details regarding HoustonKemp’s approach is set out in HoustonKemp, Investigating wholesale electricity market outcomes, Methodology report, May 2018 (available at appendix 6).
48 Houston Kemp, Impact of gas powered generation on wholesale market outcomes, Final results presentation, May 2018 (available at appendix 8). Further details regarding HoustonKemp’s approach is set out in HoustonKemp, Investigating wholesale electricity market outcomes, Methodology report, May 2018 (available at appendix 6).
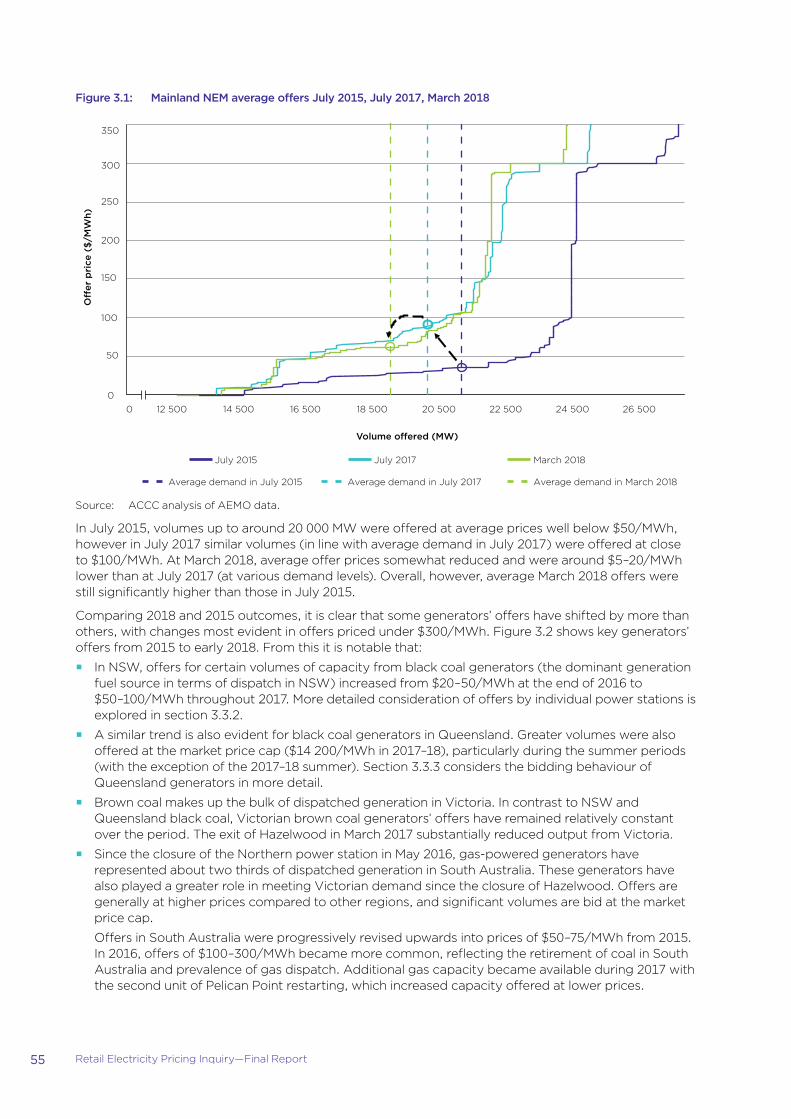
55 Retail Electricity Pricing Inquiry—Final Report
Figure 3.1: Mainland NEM average offers July 2015, July 2017, March 2018
0
50
100
150
200
250
300
350
12 500 14 500 16 500 18 500 20 500 22 500 24 500 26 500
O�
er p
rice
($
/MW
h)
Volume o�ered (MW)
July 2015 July 2017 March 2018
Average demand in July 2015 Average demand in July 2017 Average demand in March 2018
0
Source: ACCC analysis of AEMO data.
In July 2015, volumes up to around 20 000 MW were offered at average prices well below $50/MWh, however in July 2017 similar volumes (in line with average demand in July 2017) were offered at close to $100/MWh. At March 2018, average offer prices somewhat reduced and were around $5–20/MWh lower than at July 2017 (at various demand levels). Overall, however, average March 2018 offers were still significantly higher than those in July 2015.
Comparing 2018 and 2015 outcomes, it is clear that some generators’ offers have shifted by more than others, with changes most evident in offers priced under $300/MWh. Figure 3.2 shows key generators’ offers from 2015 to early 2018. From this it is notable that:
�� In NSW, offers for certain volumes of capacity from black coal generators (the dominant generation fuel source in terms of dispatch in NSW) increased from $20–50/MWh at the end of 2016 to $50–100/MWh throughout 2017. More detailed consideration of offers by individual power stations is explored in section 3.3.2.
�� A similar trend is also evident for black coal generators in Queensland. Greater volumes were also offered at the market price cap ($14 200/MWh in 2017–18), particularly during the summer periods (with the exception of the 2017–18 summer). Section 3.3.3 considers the bidding behaviour of Queensland generators in more detail.
�� Brown coal makes up the bulk of dispatched generation in Victoria. In contrast to NSW and Queensland black coal, Victorian brown coal generators’ offers have remained relatively constant over the period. The exit of Hazelwood in March 2017 substantially reduced output from Victoria.
�� Since the closure of the Northern power station in May 2016, gas-powered generators have represented about two thirds of dispatched generation in South Australia. These generators have also played a greater role in meeting Victorian demand since the closure of Hazelwood. Offers are generally at higher prices compared to other regions, and significant volumes are bid at the market price cap.
Offers in South Australia were progressively revised upwards into prices of $50–75/MWh from 2015. In 2016, offers of $100–300/MWh became more common, reflecting the retirement of coal in South Australia and prevalence of gas dispatch. Additional gas capacity became available during 2017 with the second unit of Pelican Point restarting, which increased capacity offered at lower prices.

56 Retail Electricity Pricing Inquiry—Final Report
Figure 3.2: NSW and Queensland black coal, Victorian brown coal and South Australian gas generator offers and average output, Q3 2014 to Q1 2018
NSW black coal generators
0
1 000
2 000
3 000
4 000
5 000
6 000
7 000
8 000
9 000 20
14 Q
3
2014
Q4
2015
Q1
2015
Q2
2015
Q3
2015
Q4
2016
Q1
2016
Q2
2016
Q3
2016
Q4
2017
Q1
2017
Q2
2017
Q3
2017
Q4
2018
Q1
MW
< $0 $0–20 $20–50 $50–75
$75–100 $100–150 $150–300 $300–1000
$1000–5000 > $5000 Average output
Queensland black coal generators
0
2014
Q3
2014
Q4
2015
Q1
2015
Q2
2015
Q3
2015
Q4
2016
Q1
2016
Q2
2016
Q3
2016
Q4
2017
Q1
2017
Q2
2017
Q3
2017
Q4
2018
Q1
MW
1000
2000
3000
4000
5000
6000
7000
8000
< $0 $0–20 $20–50 $50–75
$75–100 $100–150 $150–300 $300–1000
$1000–5000 > $5000 Average output
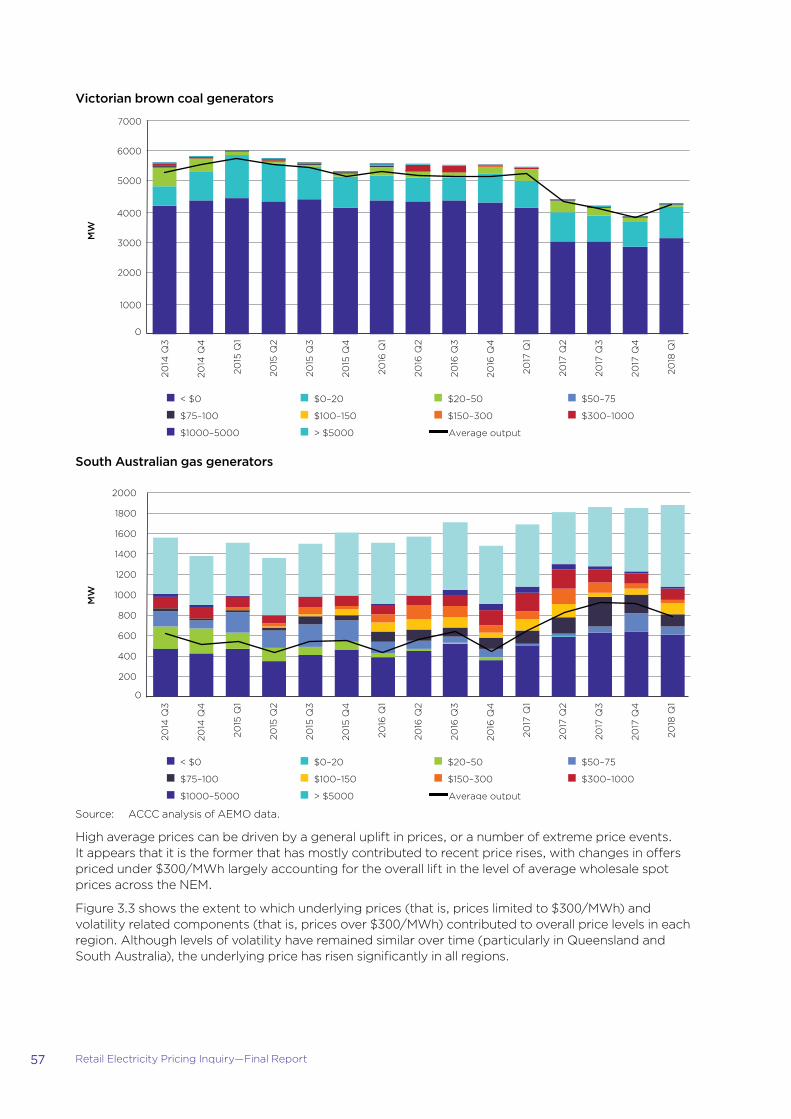
57 Retail Electricity Pricing Inquiry—Final Report
Victorian brown coal generators
0
2014
Q3
2014
Q4
2015
Q1
2015
Q2
2015
Q3
2015
Q4
2016
Q1
2016
Q2
2016
Q3
2016
Q4
2017
Q1
2017
Q2
2017
Q3
2017
Q4
2018
Q1
MW
1000
2000
3000
4000
5000
6000
7000
< $0 $0–20 $20–50 $50–75
$75–100 $100–150 $150–300 $300–1000
$1000–5000 > $5000 Average output
South Australian gas generators
0
2014
Q3
2014
Q4
2015
Q1
2015
Q2
2015
Q3
2015
Q4
2016
Q1
2016
Q2
2016
Q3
2016
Q4
2017
Q1
2017
Q2
2017
Q3
2017
Q4
2018
Q1
MW
200
400
600
800
1000
1200
1400
1600
1800
2000
< $0 $0–20 $20–50 $50–75
$75–100 $100–150 $150–300 $300–1000
$1000–5000 > $5000 Average output
Source: ACCC analysis of AEMO data.
High average prices can be driven by a general uplift in prices, or a number of extreme price events. It appears that it is the former that has mostly contributed to recent price rises, with changes in offers priced under $300/MWh largely accounting for the overall lift in the level of average wholesale spot prices across the NEM.
Figure 3.3 shows the extent to which underlying prices (that is, prices limited to $300/MWh) and volatility related components (that is, prices over $300/MWh) contributed to overall price levels in each region. Although levels of volatility have remained similar over time (particularly in Queensland and South Australia), the underlying price has risen significantly in all regions.

58 Retail Electricity Pricing Inquiry—Final Report
Figure 3.3: Annual average wholesale spot prices by underlying (limited to $300/MWh) and volatility (>$300/MWh) components, 2006 to 2018 (to June 2018)
20
40
60
80
100
120
2006 2007 2008 2009 2010 2011 2012 2013 2014 2015 2016 2017 2018
20
40
60
80
100
120
20
40
60
80
100
120
Ave
rag
e sp
ot
pri
ce (
$/M
Wh)
20
40
60
80
100
120
Que
ensl
and
NSW
20
40
60
80
100
120 V
icto
ria
20
40
60
80
100
120
Sout
h A
ustr
alia
Tasm
ania
NE
M
Underlying Volatility
Source: ACCC analysis of AEMO data.
Table 3.1 shows wholesale spot prices by the average contribution of underlying (limited to $300/MWh) and volatility (greater than $300/MWh) price components in each region. In the period between 2008 and 2014, the average underlying component was $36–40/MWh (depending on the region). By 2017, the underlying component contribution more than doubled to $85–97/MWh, while the volatility component (with the exception of Queensland) either remained around the same or decreased.

59 Retail Electricity Pricing Inquiry—Final Report
Table 3.1: Wholesale spot prices by underlying (limited to $300/MWh) and volatility (>$300/MWh) components, 2008 to 2014 average, 2016, 2017 and 2018 (to June 2018)
2008 to 2014 2016 2017 2018 (to June)
$/MWh and proportion of price by component
Queensland Underlying $37 (86%) $61 (90%) $85 (83%) $68 (98%)
Volatility $6 (14%) $7 (10%) $17 (17%) $1 (2%)
NSW Underlying $37 (90%) $58 (98%) $90 (95%) $76 (98%)
Volatility $4 (10%) $1 (2%) $5 (5%) $1 (2%)
Victoria Underlying $36 (91%) $46 (97%) $92 (100%) $82 (88%)
Volatility $4 (9%) $1 (3%) $0 (0%) $11 (12%)
South Australia Underlying $40 (75%) $66 (82%) $97 (92%) $89 (83%)
Volatility $13 (25%) $15 (18%) $8 (8%) $18 (17%)
Tasmania Underlying $38 (92%) $92 (96%) $97 (99%) $83 (97%)
Volatility $3 (8%) $4 (4%) $1 (1%) $3 (3%)
Source: ACCC analysis of AEMO data.
As noted above, there has still been a degree of volatility in wholesale prices in Queensland and South Australia. Figure 3.4 illustrates that, over the past three to four years, prices in these regions have been above $300/MWh much more often than other regions.
Compared to the longer-term trend, prices in NSW and Victoria were not above $300/MWh much more often in 2017 (when average prices increased significantly) than they were in previous years, indicating that it is not volatility driving high average prices in those states. In 2016, there was a peak in times when South Australian prices were above $300/MWh, similarly for Tasmania. Section 3.3 considers several events across South Australia and Queensland where there have been high price outcomes.
Figure 3.4: Number of hours spot prices exceeded $300/MWh, by region, 2008 to 2018 (to June 2018)
0
50
100
150
200
250
2008 2009 2010 2011 2012 2013 2014 2015 2016 2017 2018
Ho
urs
whe
re p
rice
> $
300
/MW
h
NSW QueenslandSouth Australia TasmaniaVictoria
Source: ACCC analysis of AEMO data.

60 Retail Electricity Pricing Inquiry—Final Report
The AER noted similar findings, in terms of higher underlying price levels, in its review of the NSW wholesale electricity market in 2017. The AER noted a ‘step change’ in prices offered under $300/MWh, where from October 2016 into 2017 capacity that was previously offered at lower prices ($0–50/MWh) was increasingly being offered at $50–150/MWh, with little change in offers at extreme prices (such as close to the market price cap).49
3.1.2 Changes in the marginal generatorIn addition to increases in generators’ offers, a related impact on price outcomes in the market has been a shift in which fuel type is setting wholesale prices.
In the NEM, a mix of generators offer to supply electricity to the market at any one time at a range of prices. The generator with the highest-priced offer required to meet demand ultimately sets the dispatch price in that region (which all dispatched generators receive). That generator is known as the ‘marginal generator’.
The interconnected structure of the NEM allows a generator located in one region to be the marginal generator in other regions. For example, a generator in NSW may set the price in Victoria.
The exit of the Hazelwood power station in March 2017 resulted in a large withdrawal of low-cost supply, which was replaced by output from more expensive existing generation (such as black coal, gas and hydro). The closure was especially significant given Hazelwood’s size, supplying around 5 per cent of total output across the NEM.50
From mid- to late 2016 to the equivalent period a year later, black coal generators in NSW and Queensland together increased output by approximately 6 per cent. Gas-powered generation increased output by around 37 per cent, with the most significant increases from the Victorian and South Australian gas generators.51 Output from the remaining Victorian brown coal generators remained relatively consistent, given that these generators were already operating near capacity.
The larger role of more expensive sources of generation means they are more often the marginal generator and setting wholesale prices. Brown coal generators now rarely set the price in any region because even at full dispatch, there is insufficient brown coal capacity to meet demand at most times of the day (except potentially during overnight lows).
Figure 3.5 shows the changes in which generator fuel sources set prices in each region from July 2013 to March 2018.
Figure 3.5: Marginal generation fuel in each region over time—July 2013 to March 2018
NSW
0%
20%
40%
60%
80%
100%
Jul2013
Nov2013
Mar2014
Jul2014
Nov2014
Mar2015
Jul2015
Nov2015
Mar2016
Jul2016
Nov2016
Mar2017
Jul2017
Nov2017
Black coal Brown coal Gas Hydro Wind
% o
f ti
me
whe
re f
uel t
ype
is m
arg
inal
49 AER, AER electricity wholesale performance monitoring NSW electricity market advice, December 2017, p. 15.50 AER, AER electricity wholesale performance monitoring Hazelwood advice, March 2018, pp. 9, 19.51 AER, AER electricity wholesale performance monitoring Hazelwood advice, March 2018, p. 10.

61 Retail Electricity Pricing Inquiry—Final Report
Queensland
Jul2013
Nov2013
Mar2014
Jul2014
Nov2014
Mar2015
Jul2015
Nov2015
Mar2016
Jul2016
Nov2016
Mar2017
Jul2017
Nov2017
Black coal Brown coal Gas Hydro Wind
0%
20%
40%
60%
80%
100%
% o
f ti
me
whe
re f
uel t
ype
is m
arg
inal
Victoria
Jul2013
Nov2013
Mar2014
Jul2014
Nov2014
Mar2015
Jul2015
Nov2015
Mar2016
Jul2016
Nov2016
Mar2017
Jul2017
Nov2017
Black coal Brown coal Gas Hydro Wind
0%
20%
40%
60%
80%
100%
% o
f ti
me
whe
re f
uel t
ype
is m
arg
inal
South Australia
Jul2013
Nov2013
Mar2014
Jul2014
Nov2014
Mar2015
Jul2015
Nov2015
Mar2016
Jul2016
Nov2016
Mar2017
Jul2017
Nov2017
Black coal Brown coal Gas Hydro Wind
0%
20%
40%
60%
80%
100%
% o
f ti
me
whe
re f
uel t
ype
is m
arg
inal

62 Retail Electricity Pricing Inquiry—Final Report
Tasmania
Jul2013
Nov2013
Mar2014
Jul2014
Nov2014
Mar2015
Jul2015
Nov2015
Mar2016
Jul2016
Nov2016
Mar2017
Jul2017
Nov2017
Black coal Brown coal Gas Hydro Wind
0%
20%
40%
60%
80%
100%
% o
f ti
me
whe
re f
uel t
ype
is m
arg
inal
Source: HoustonKemp gas-powered generation analysis.
Note: HoustonKemp’s approach to determining the marginal generator is set out in its methodology document supporting its analysis, available at appendix 6.
On average, black coal generators set the wholesale price in NSW and Queensland 65–70 per cent of the time from July 2013 to March 2018. Hydro and gas generators increasingly became the marginal generation source in mid-2014, mid-2016 and early 2017. Brown coal generators have not played a significant role in setting prices in either of these regions since 2015.
Victoria shows stark changes since the closure of Hazelwood. Prior to the closure, brown coal generators set the price around 26 per cent of the time since July 2013. Almost immediately following the closure this reduced to around 4 per cent as hydro, gas and black coal (mostly located in regions outside Victoria) generators more often set Victorian wholesale prices.
In South Australia, gas generators play a more significant role in setting prices. Following the closure of the Northern power station in May 2016, gas generators set the price 23–53 per cent of the time, depending on the time of year. Brown coal generators continued to play a role in setting South Australian wholesale prices (through imports from Victoria), but this also reduced to around 3 per cent after Hazelwood closed.
In Tasmania, hydro generators set the price about 65 per cent of the time over the period. During the Basslink outage in the first half of 2016, hydro generators were the only price setters. Since the exit of Hazelwood, gas and black coal generators have each set the price around 20 per cent of the time.
The individual power stations that most often set prices in each region are presented in figure 3.6. It further demonstrates that more recently, wholesale prices in Victoria and South Australia were being set by generators with more expensive fuel sources and by a wider variety of stations located across the NEM.
For example, Victorian prices were set by generators located in Victoria around 36 per cent of the time in 2014–15, falling to about 28 per cent in 2017–18 (the majority of which was Snowy Hydro’s Victorian Murray hydro power station, setting the price 15 per cent of the time). Apart from the Murray hydro station, Victorian prices in 2017–18 were most often set by the NSW Bayswater black coal station (AGL), South Australia’s Torrens Island gas power station (AGL) and the NSW Eraring black coal station (Origin).

63 Retail Electricity Pricing Inquiry—Final Report
Figure 3.6: Marginal generator in each region by generator location, generator and fuel—2014–15 and 2017–18 (to April 2018)
NSW
0% 5% 10% 15% 20% 25% 0% 5% 10% 15% 20% 25%
Loy Yang A—Brown coal (AGL)
Loy Yang B—Brown coal (Engie)
Gordon—Hydro (Hydro Tas)
Torrens Island B—Gas (AGL)
2014–15 2017–18 (to April 2018)
Stanwell—Black coal (Stanwell)
Poatina—Hydro (Hydro Tas)
Tarong—Black coal (Stanwell)
Gladstone—Black coal (CS Energy)
Liddell—Black coal (AGL)
Tumut—Hydro (Snowy Hydro)
Mt-Piper—Black coal (EnergyAustralia)
Murray—Hydro (Snowy Hydro)
Vales Point B—Black coal (Delta)
Bayswater—Black coal (AGL)
Eraring—Black coal (Origin)
Pelican Point—Gas (Engie)
Newport—Gas (EnergyAustralia)
Gordon—Hydro (Hydro Tas)
Poatina—Hydro (Hydro Tas)
Tumut—Hydro (Snowy Hydro)
Torrens Island B—Gas (AGL)
Stanwell—Black coal (Stanwell)
Mt-Piper—Black coal (EnergyAustralia)
Tarong—Black coal (Stanwell)
Gladstone—Black coal (CS Energy)
Vales Point B—Black coal (Sunset Power)
Murray—Hydro (Snowy Hydro)
Eraring—Black coal (Origin)
Bayswater—Black coal (AGL)
Tallawarra—Gas (EnergyAustralia)
% of time where plant is marginal
NSWVictoria QueenslandSouth Australia TasmaniaGenerator location:
Queensland
0% 5% 10% 15% 20% 25% 0% 5% 10% 15% 20% 25%
Poatina—Hydro (Hydro Tas)
Torrens Island B—Gas (AGL)
Braemar—Gas (Alinta)
Callide Power Plant—Black coal (CS Energy/InterGen)
Mt-Piper—Black coal (EnergyAustralia)
Liddell—Black coal (AGL)
Tumut—Hydro (Snowy Hydro)
Braemar 2—Gas (Arrow)
Murray—Hydro (Snowy Hydro)
Vales Point B—Black coal (Delta)
Tarong—Black coal (Stanwell)
Stanwell—Black coal (Stanwell)
Bayswater—Black coal (AGL)
Gladstone—Black coal (CS Energy)
Eraring—Black coal (Origin)
Tallawarra—Gas (EnergyAustralia)
Gordon—Hydro (Hydro Tas)
Darling Downs—Gas (Origin)
Poatina—Hydro (Hydro Tas)
Torrens Island B—Gas (AGL)
Tumut—Hydro (Snowy Hydro)
Mt-Piper—Black coal (EnergyAustralia)
Vales Point B—Black coal (Sunset Power)
Murray—Hydro (Snowy Hydro)
Eraring—Black coal (Origin)
Stanwell—Black coal (Stanwell)
Tarong—Black coal (Stanwell)
Bayswater—Black coal (AGL)
Gladstone—Black coal (CS Energy)
Callide B—Black coal (CS Energy)
2014–15 2017–18 (to April 2018)
% of time where plant is marginal
NSWVictoria QueenslandSouth Australia TasmaniaGenerator location:

64 Retail Electricity Pricing Inquiry—Final Report
South Australia
Gladstone—Black coal (CS Energy)
Gordon—Hydro (Hydro Tas)
Liddell—Black coal (AGL)
Pelican Point—Gas (Engie)
Tumut—Hydro (Snowy Hydro)
Mt-Piper—Black coal (EnergyAustralia)
Poatina—Hydro (Hydro Tas)
Northern—Brown coal (Alinta)
Vales Point B—Black coal (Delta)
Loy Yang B—Brown coal (Engie)
Loy Yang A—Brown coal (AGL)
Bayswater—Black coal (AGL)
Murray—Hydro (Snowy Hydro)
Torrens Island B—Gas (AGL)
Eraring—Black coal (Origin)
Tarong—Black coal (Stanwell)
Stanwell—Black coal (Stanwell)
Tumut—Hydro (Snowy Hydro)
Mt-Piper—Black coal (EnergyAustralia)
Newport—Gas (EnergyAustralia)
Pelican Point—Gas (Engie)
Vales Point B—Black coal (Sunset Power)
Gladstone—Black coal (CS Energy)
Poatina—Hydro (Hydro Tas)
Gordon—Hydro (Hydro Tas)
Eraring—Black coal (Origin)
Bayswater—Black coal (AGL)
Murray—Hydro (Snowy Hydro)
Torrens Island B—Gas (AGL)
Loy Yang A—Brown coal (AGL)
0% 5% 10% 15% 20% 25% 0% 5% 10% 15% 20% 25%
2014–15 2017–18 (to April 2018)
% of time where plant is marginal
NSWVictoria QueenslandSouth Australia TasmaniaGenerator location:
Victoria
Loy Yang A—Brown coal (AGL)
Eraring—Black coal (Origin)
Murray—Hydro (Snowy Hydro)
Loy Yang B—Brown coal (Engie)
Bayswater—Black coal (AGL)
Vales Point B—Black coal (Delta)
Poatina—Hydro (Hydro Tas)
Mt Piper—Black coal (EnergyAustralia)
Tumut—Hydro (Snowy Hydro)
Torrens Island—Gas (AGL)
Gordon—Hydro (Hydro Tas)
Liddell—Black coal (AGL)
Gladstone—Black coal (CS Energy)
Northern—Brown coal (Alinta)
Tarong—Black coal (Stanwell)
Murray—Hydro (Snowy Hydro)
Bayswater—Black coal (AGL)
Torrens Island B—Gas (AGL)
Eraring—Black coal (Origin)
Poatina—Hydro (Hydro Tas)
Gordon—Hydro (Hydro Tas)
Gladstone—Black coal (CS Energy)
Vales Point B—Black coal (Sunset Power)
Newport—Gas (EnergyAustralia)
Mt Piper—Black coal (EnergyAustralia)
Loy Yang A—Brown coal (AGL)
Tumut— Hydro (Snowy Hydro)
Stanwell—Black coal (Stanwell)
Tarong—Black coal (Stanwell)
Mortlake—Gas (Origin)
0% 5% 10% 15% 20% 25% 0% 5% 10% 15% 20% 25%
2014–15 2017–18 (to April 2018)
% of time where plant is marginal
NSWVictoria QueenslandSouth Australia TasmaniaGenerator location:

65 Retail Electricity Pricing Inquiry—Final Report
Tasmania
Gladstone—Black coal (CS Energy)
Liddell—Black coal (AGL)
Vales Point B—Black coal (Delta)
Tumut—Hydro (Snowy Hydro)
Reece—Hydro (Hydro Tas)
Mt Piper—Black coal (EnergyAustralia)
Loy Yang B—Brown coal (Engie)
Loy Yang A—Brown coal (AGL)
Torrens Island B—Gas (AGL)
Bayswater—Black coal (AGL)
Murray—Hydro (Snowy Hydro)
John Butters—Hydro (Hydro Tas)
Eraring—Black coal (Origin)
Gordon—Hydro (Hydro Tas)
Poatina—Hydro (Hydro Tas)
Tarong—Black coal (Stanwell)
John Butters—Hydro (Hydro Tas)
Mortlake—Gas (Origin)
Tumut—Hydro (Snowy Hydro)
Loy Yang A—Brown coal (AGL)
Vales Point B—Black coal (Sunset Power)
Newport—Gas (EnergyAustralia)
Gladstone—Black coal (CS Energy)
Eraring—Black coal (Origin)
Bayswater—Black coal (AGL)
Torrens Island B—Gas (AGL)
Murray—Hydro (Snowy Hydro)
Gordon—Hydro (Hydro Tas)
Poatina—Hydro (Hydro Tas)
Reece—Hydro (Hydro Tas)
30%25%20%15%10%5% 30%25%20%15%10%5%0% 0%
2014–15 2017–18 (to April 2018)
% of time where plant is marginal
NSWVictoria QueenslandSouth Australia TasmaniaGenerator location:
Source: HoustonKemp gas-powered generation analysis.
In South Australia, the Torrens Island power station was the most frequent price setter in 2017–18, setting the price 14 per cent of the time. Other gas and hydro generators (including from outside South Australia) have increasingly been setting the South Australian price.
NSW prices are mostly set by the Eraring and Bayswater black coal stations in the state, although some Queensland black coal stations (Tarong, Gladstone and Stanwell, owned by the Queensland Government) set prices more often in 2017–18 compared to 2014–15. Victorian brown coal generators used to have a small role in setting prices in NSW, but did not play a role at all in 2017–18. Queensland prices are mostly set by a combination of Queensland and NSW black coal generators.
The AER recently reported similar trends in the change of Victorian price-setting generators in its Hazelwood advice provided to the COAG Energy Council.52 Analysis by AEMO also highlighted similar shifts in price-setters in Victoria between the end of 2016 and the end of 2017.53
52 AER, AER electricity wholesale performance monitoring Hazelwood advice, March 2018, p. 17.53 AEMO, AEMO Insights, Quarterly Energy Dynamics—Q4 2017, March 2018, p. 10.

66 Retail Electricity Pricing Inquiry—Final Report
3.1.3 Combined impact: higher-priced offers setting the price more often
Recent changes in the marginal generator across regions, largely driven by the retirement of Hazelwood and a tighter supply–demand balance, have coincided with higher-priced offers (described earlier in section 3.1.1) which are setting prices more often across the NEM. Another outcome has been wholesale prices that are more aligned across the NEM. As noted in the AER’s Hazelwood analysis, interconnector constraints have become less frequent, facilitating higher price alignment rates from 2017.54
The change in marginal generator reflects the changing generation fleet. This is driven by climate policy, aging plant and the economics of new entry for different technologies. However, these factors do not explain the change in offers from existing plant, which instead reflect movements in underlying market conditions.
The ACCC has focused, therefore, on examining the uplift in generators’ offers throughout the NEM, and the extent to which it is explained by underlying costs or other factors. The ACCC’s findings are set out in the following sections.
3.2 Developments in generators’ fuel costsThe AER’s report into the NSW electricity market during 2017 highlighted fuel cost increases, particularly for NSW black coal and gas generators, as a factor behind higher-priced offers. The AER noted increases in international export prices for key fuel inputs (thermal coal and natural gas) at a similar time.55
Any impact from higher fuel costs has broader implications, given these generators are more often setting the price across the NEM. During the second half of this Inquiry, the ACCC sought data from a range of black coal generators and gas generators across the NEM to examine their fuel costs and fully understand the impact of any recent changes. The ACCC has also considered the role of hydro generation as the other major generation source setting the wholesale price.
3.2.1 Black coalGenerators source black coal using a mix of long- and short-term contracts. To the extent that contractual terms are linked or benchmarked to export prices, or longer-term contracts are negotiated in times of rising international prices, generators’ costs will likely be affected. International prices for thermal coal (based on the Newcastle export price) rose sharply from an average of $76/tonne in 2015 to around $115/tonne in 2017. Average prices in the first quarter of 2018 were higher still at around $130/tonne (table 3.2).
Black coal generators in NSW and Queensland provided the ACCC with data on their actual fuel costs (including transportation costs) on a quarterly basis from 2015 to the end of 2017 (and forecasts for the first six months of 2018). Weighted average fuel costs for both regions calculated from this data are shown in table 3.2 alongside average Newcastle export coal prices.
54 AER, AER electricity wholesale performance monitoring Hazelwood advice, March 2018, p. 21.55 AER, AER electricity wholesale performance monitoring NSW electricity market advice, December 2017, pp. 2, 17–19.
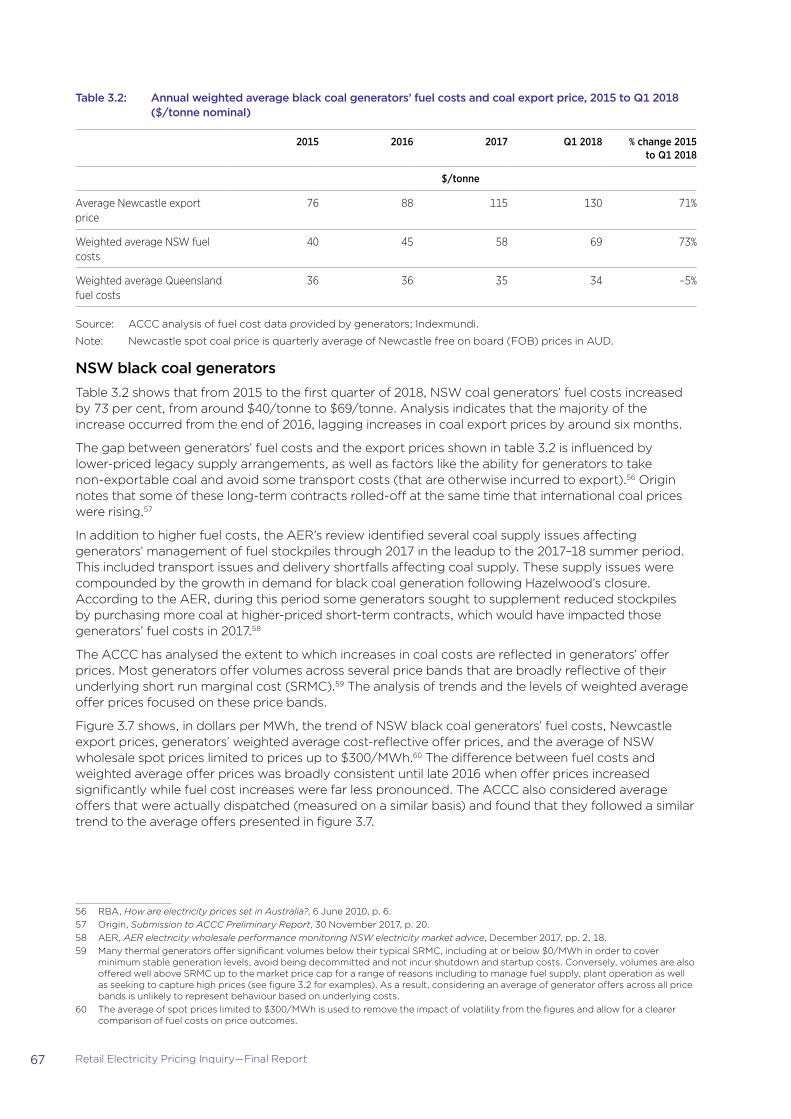
67 Retail Electricity Pricing Inquiry—Final Report
Table 3.2: Annual weighted average black coal generators’ fuel costs and coal export price, 2015 to Q1 2018 ($/tonne nominal)
2015 2016 2017 Q1 2018 % change 2015 to Q1 2018
$/tonne
Average Newcastle export price
76 88 115 130 71%
Weighted average NSW fuel costs
40 45 58 69 73%
Weighted average Queensland fuel costs
36 36 35 34 –5%
Source: ACCC analysis of fuel cost data provided by generators; Indexmundi.
Note: Newcastle spot coal price is quarterly average of Newcastle free on board (FOB) prices in AUD.
NSW black coal generatorsTable 3.2 shows that from 2015 to the first quarter of 2018, NSW coal generators’ fuel costs increased by 73 per cent, from around $40/tonne to $69/tonne. Analysis indicates that the majority of the increase occurred from the end of 2016, lagging increases in coal export prices by around six months.
The gap between generators’ fuel costs and the export prices shown in table 3.2 is influenced by lower-priced legacy supply arrangements, as well as factors like the ability for generators to take non-exportable coal and avoid some transport costs (that are otherwise incurred to export).56 Origin notes that some of these long-term contracts rolled-off at the same time that international coal prices were rising.57
In addition to higher fuel costs, the AER’s review identified several coal supply issues affecting generators’ management of fuel stockpiles through 2017 in the leadup to the 2017–18 summer period. This included transport issues and delivery shortfalls affecting coal supply. These supply issues were compounded by the growth in demand for black coal generation following Hazelwood’s closure. According to the AER, during this period some generators sought to supplement reduced stockpiles by purchasing more coal at higher-priced short-term contracts, which would have impacted those generators’ fuel costs in 2017.58
The ACCC has analysed the extent to which increases in coal costs are reflected in generators’ offer prices. Most generators offer volumes across several price bands that are broadly reflective of their underlying short run marginal cost (SRMC).59 The analysis of trends and the levels of weighted average offer prices focused on these price bands.
Figure 3.7 shows, in dollars per MWh, the trend of NSW black coal generators’ fuel costs, Newcastle export prices, generators’ weighted average cost-reflective offer prices, and the average of NSW wholesale spot prices limited to prices up to $300/MWh.60 The difference between fuel costs and weighted average offer prices was broadly consistent until late 2016 when offer prices increased significantly while fuel cost increases were far less pronounced. The ACCC also considered average offers that were actually dispatched (measured on a similar basis) and found that they followed a similar trend to the average offers presented in figure 3.7.
56 RBA, How are electricity prices set in Australia?, 6 June 2010, p. 6.57 Origin, Submission to ACCC Preliminary Report, 30 November 2017, p. 20.58 AER, AER electricity wholesale performance monitoring NSW electricity market advice, December 2017, pp. 2, 18.59 Many thermal generators offer significant volumes below their typical SRMC, including at or below $0/MWh in order to cover
minimum stable generation levels, avoid being decommitted and not incur shutdown and startup costs. Conversely, volumes are also offered well above SRMC up to the market price cap for a range of reasons including to manage fuel supply, plant operation as well as seeking to capture high prices (see figure 3.2 for examples). As a result, considering an average of generator offers across all price bands is unlikely to represent behaviour based on underlying costs.
60 The average of spot prices limited to $300/MWh is used to remove the impact of volatility from the figures and allow for a clearer comparison of fuel costs on price outcomes.

68 Retail Electricity Pricing Inquiry—Final Report
Figure 3.7: Weighted average quarterly NSW black coal generators’ fuel costs, coal export prices, weighted average offer prices and average NSW wholesale prices, Q3 2014 to Q1 2018 ($/MWh nominal)
0
20
40
60
80
100
120 20
14 Q
3
2014
Q4
2015
Q1
2015
Q2
2015
Q3
2015
Q4
2016
Q1
2016
Q2
2016
Q3
2016
Q4
2017
Q1
2017
Q2
2017
Q3
2017
Q4
2018
Q1
$/M
Wh
Average spot price (limited to $300/MWh) Weighted average o�ers
Newcastle export price Weighted average fuel costs
Source: ACCC analysis of fuel cost data provided by generators; Indexmundi; AEMO data.
Note: Weighted average offer prices are for offers of $1–150/MWh; Newcastle FOB thermal coal prices converted to $/MWh using an appropriate calorific value and heat rate; NSW wholesale prices are the average of spot prices limited to $300/MWh.
The ACCC considers that while fuel costs increased for NSW black coal generators, those cost increases appear to only explain a small increase in generators’ offers, and there are likely to be other factors at play.61 Issues affecting coal supply provide some further explanation of NSW generators’ higher offers during this period, as some generators sought to limit dispatch so that sufficient coal reserves could be maintained for the peak summer period.
The AER in its work verified that various generators’ fuel stockpiles were lower than historic levels during 2017.62 AGL highlighted in a submission to the ACCC that it bid at prices to ration coal from October 2016 until at least the third quarter of 2017 due to coal supply concerns.63 The AER also noted that EnergyAustralia faced supply issues with uncertainty regarding the future of the coal mine supplying its Mt Piper power station64, due to planning and environmental litigation.65
While these factors may go some way to explaining the uplift in prices, the ACCC would expect that after these issues were resolved (largely by the end of 2017), generators’ average offers should reduce.
As shown in figure 3.7, although coal costs increased, they averaged at around $30/MWh in the first quarter of 2018 and were still well below the export price.
Figure 3.7 indicates that by the first quarter of 2018, while offers had reduced they averaged at around $59/MWh, showing a larger gap between fuel costs and weighted average offers compared to 2015–16. Average offers were around $15/MWh higher than fuel costs in the first quarter of 2015, while in the first quarter of 2018 the difference between average offers and fuel costs was almost double, at around $29/MWh.
61 See also AER, AER electricity wholesale performance monitoring NSW electricity market advice, December 2017, pp. 2, 18.62 AER, AER electricity wholesale performance monitoring NSW electricity market advice, December 2017, p. 18.63 AGL, Supplementary Submission (NSW Coal Supply) to ACCC Issues Paper, 13 September 2017, pp. 8–9.64 AER, AER electricity wholesale performance monitoring NSW electricity market advice, December 2017, p. 19.65 The NSW Government subsequently passed legislation that intended to ensure that the Springvale mine could continue to supply
the Mount Piper power station (Parliament of New South Wales 2017, Parliamentary debates: Legislative Council: Official Hansard, 11 October 2017).

69 Retail Electricity Pricing Inquiry—Final Report
Queensland black coal generatorsTable 3.2 shows that Queensland black coal generators (which provided data to the ACCC) have not experienced the same changes in their fuel costs as the NSW black coal generators. Over the period from 2015 to early 2018, their average coal costs remained flat at around $35/tonne.
This may be explained by contract positions of various Queensland black coal generators, meaning that they were not exposed to rolling off contracts and renegotiations linking contracts to the export price.
Similar to the above analysis, the ACCC has compared Queensland black coal generators’ cost-reflective offers alongside average coal costs reported to the ACCC. Figure 3.8 shows that average offers have increased steadily from 2015, departing from average fuel costs, and tend to track closely with average export prices.
The increase in Queensland black coal generators’ offers was more subdued compared to the NSW experience. However, by early 2018 average cost-reflective offers for black coal generators in both regions were around $50–60/MWh, up from $20–30/MWh throughout 2015. The ACCC also considered average dispatched offers in Queensland and observed that they also increased and departed from fuel costs, although not quite to the same extent as the average offers shown in figure 3.8.
Figure 3.8: Weighted average quarterly Queensland black coal generators’ fuel costs, coal export prices, weighted average offer prices and average Queensland wholesale prices, Q3 2014 to Q1 2018 ($/MWh nominal)
0
20
40
60
80
100
120
2014
Q3
2014
Q4
2015
Q1
2015
Q2
2015
Q3
2015
Q4
2016
Q1
2016
Q2
2016
Q3
2016
Q4
2017
Q1
2017
Q2
2017
Q3
2017
Q4
2018
Q1
$/M
Wh
Average spot price (limited to $300/MWh) Weighted average o�ers
Newcastle export price Weighted average fuel costs
Source: ACCC analysis of fuel cost data provided by generators; Indexmundi; AEMO data.
Note: Weighted average offer prices are for offers in price ranges of $1–150/MWh; Newcastle FOB thermal coal prices converted to $/MWh using and appropriate calorific value and heat rate; Queensland wholesale prices are the average of spot prices limited to $300/MWh.
The ACCC considers that the overall widening between NSW and Queensland black coal generators’ offer prices and their fuel costs is likely to be a product of a lack of competitive constraint and the highly concentrated market structure in Queensland.
As a low-cost competitor in Hazelwood has exited the market (which used to contribute to electricity imports into NSW)66, the level of competitive pressure on the higher-cost black coal generators has weakened. Additionally, while more imports of electricity into NSW have come from Queensland following Hazelwood’s closure, the ACCC has seen evidence that suggests the level of competitive constraint from this is relatively weak (as Queensland generators have also moved capacity to higher prices despite no increase in fuel costs).
66 AER, AER electricity wholesale performance monitoring Hazelwood advice, March 2018, pp. 19–21; AEMO, AEMO Insights, Quarterly Energy Dynamics—Q4 2017, March 2018, p. 12.

70 Retail Electricity Pricing Inquiry—Final Report
The ACCC understands that some black coal generation businesses look to the bidding of other (higher cost) generation and bid their capacity up to those price levels. One generation business noted that a main driver for higher spot prices in the first quarter of 2017 was ‘ .… [b]lack coal bidding at higher prices—shadowing gas with volume that was bid at $40-$50/MWh in 2016 now at $70–$100/MWh.’
Additionally, a coal generation business noted in the first half of 2017 that ‘[g]eneration from gas fired generators remained low given the higher SRMC and continues to be profiled towards times of high risk. This incentivises coal fired participants to offer their volume at prices slightly below the gas fired generators [sic] prices. These conditions are expected to continue in the future, are positive for […], but subject to regulatory risk (of interventions to increase gas availability).’
Further, a bidding strategy document from that same generator noted that its intention was, after its contract position was covered, to ‘bid our remaining coal generation at the staggered prices that ensure full dispatch at the highest possible price before gas generators start.’
3.2.2 GasIn the Preliminary Report, the ACCC noted the importance of gas as a fuel source for electricity generation, particularly as existing coal generators are retired. As noted in section 3.1.2, gas is increasingly setting the wholesale price across various regions. The effect of gas setting the wholesale price more often is material as gas-powered generation is generally a higher-cost source of generation than black and brown coal.
Higher gas prices have been well documented over recent years, largely due to a ramp-up of liquefied natural gas (LNG) exports linking domestic gas to international prices, declining traditional sources of domestic gas supply and government moratoria and environmental controls preventing and inhibiting new gas supply being brought to the domestic market. While gas prices eased in the latter half of 2017 and early 2018, they remain at higher levels relative to three years ago.67
Gas-powered generators across Victoria, NSW, South Australia and Queensland provided the ACCC with data on their fuel costs (including transportation costs) over the period from 2015 to the end of 2017 (and forecasts for the first six months of 2018). Gas generators’ fuel costs typically represent a weighted average of longer-term contract costs and gas purchases from the spot market.
Figure 3.9 shows how weighted average actual gas costs across the four mainland NEM regions have moved compared to spot gas prices (as measured by average short-term trading prices across various regions).
67 ACCC, Inquiry into the east coast gas market, April 2016, pp. 35, 65; ACCC, Gas inquiry 2017-2020, Interim Report, 27 April 2018, pp. 9, 10, 16, 17.
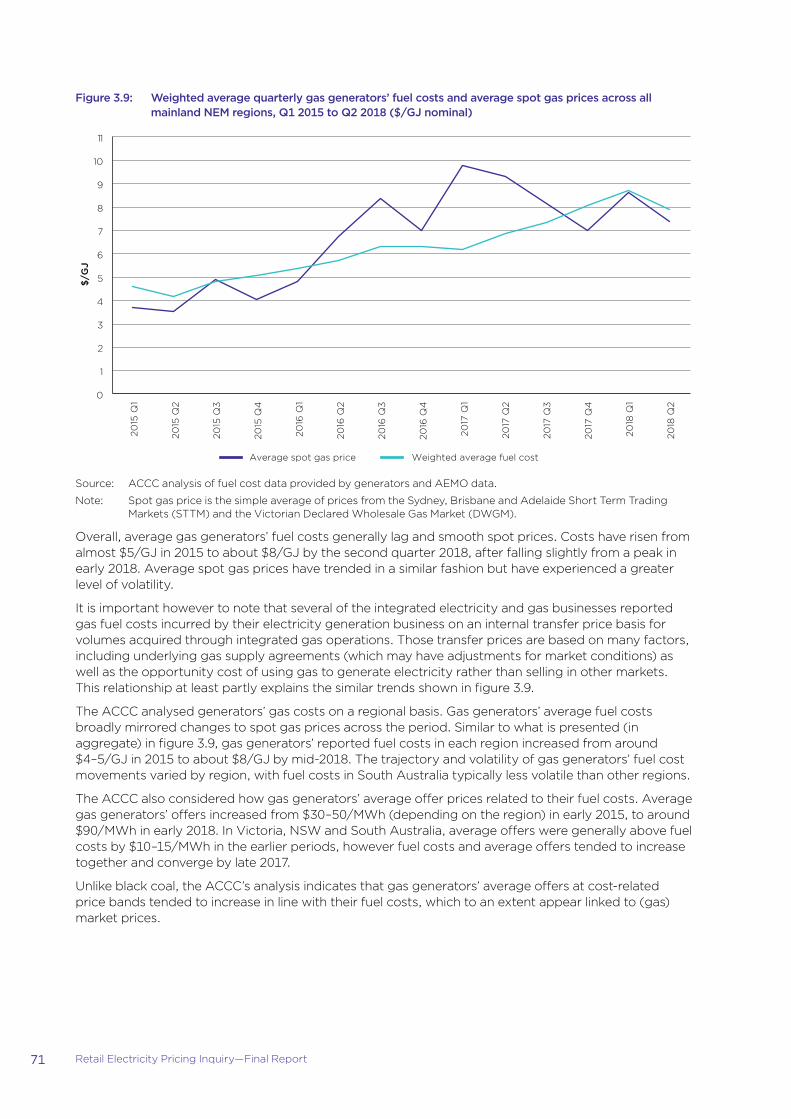
71 Retail Electricity Pricing Inquiry—Final Report
Figure 3.9: Weighted average quarterly gas generators’ fuel costs and average spot gas prices across all mainland NEM regions, Q1 2015 to Q2 2018 ($/GJ nominal)
0
1
2
3
4
5
6
7
8
9
10
11 20
15 Q
1
2015
Q2
2015
Q3
2015
Q4
2016
Q1
2016
Q2
2016
Q3
2016
Q4
2017
Q1
2017
Q2
2017
Q3
2017
Q4
2018
Q1
2018
Q2
$/G
J
Average spot gas price Weighted average fuel cost
Source: ACCC analysis of fuel cost data provided by generators and AEMO data.
Note: Spot gas price is the simple average of prices from the Sydney, Brisbane and Adelaide Short Term Trading Markets (STTM) and the Victorian Declared Wholesale Gas Market (DWGM).
Overall, average gas generators’ fuel costs generally lag and smooth spot prices. Costs have risen from almost $5/GJ in 2015 to about $8/GJ by the second quarter 2018, after falling slightly from a peak in early 2018. Average spot gas prices have trended in a similar fashion but have experienced a greater level of volatility.
It is important however to note that several of the integrated electricity and gas businesses reported gas fuel costs incurred by their electricity generation business on an internal transfer price basis for volumes acquired through integrated gas operations. Those transfer prices are based on many factors, including underlying gas supply agreements (which may have adjustments for market conditions) as well as the opportunity cost of using gas to generate electricity rather than selling in other markets. This relationship at least partly explains the similar trends shown in figure 3.9.
The ACCC analysed generators’ gas costs on a regional basis. Gas generators’ average fuel costs broadly mirrored changes to spot gas prices across the period. Similar to what is presented (in aggregate) in figure 3.9, gas generators’ reported fuel costs in each region increased from around $4–5/GJ in 2015 to about $8/GJ by mid-2018. The trajectory and volatility of gas generators’ fuel cost movements varied by region, with fuel costs in South Australia typically less volatile than other regions.
The ACCC also considered how gas generators’ average offer prices related to their fuel costs. Average gas generators’ offers increased from $30–50/MWh (depending on the region) in early 2015, to around $90/MWh in early 2018. In Victoria, NSW and South Australia, average offers were generally above fuel costs by $10–15/MWh in the earlier periods, however fuel costs and average offers tended to increase together and converge by late 2017.
Unlike black coal, the ACCC’s analysis indicates that gas generators’ average offers at cost-related price bands tended to increase in line with their fuel costs, which to an extent appear linked to (gas) market prices.
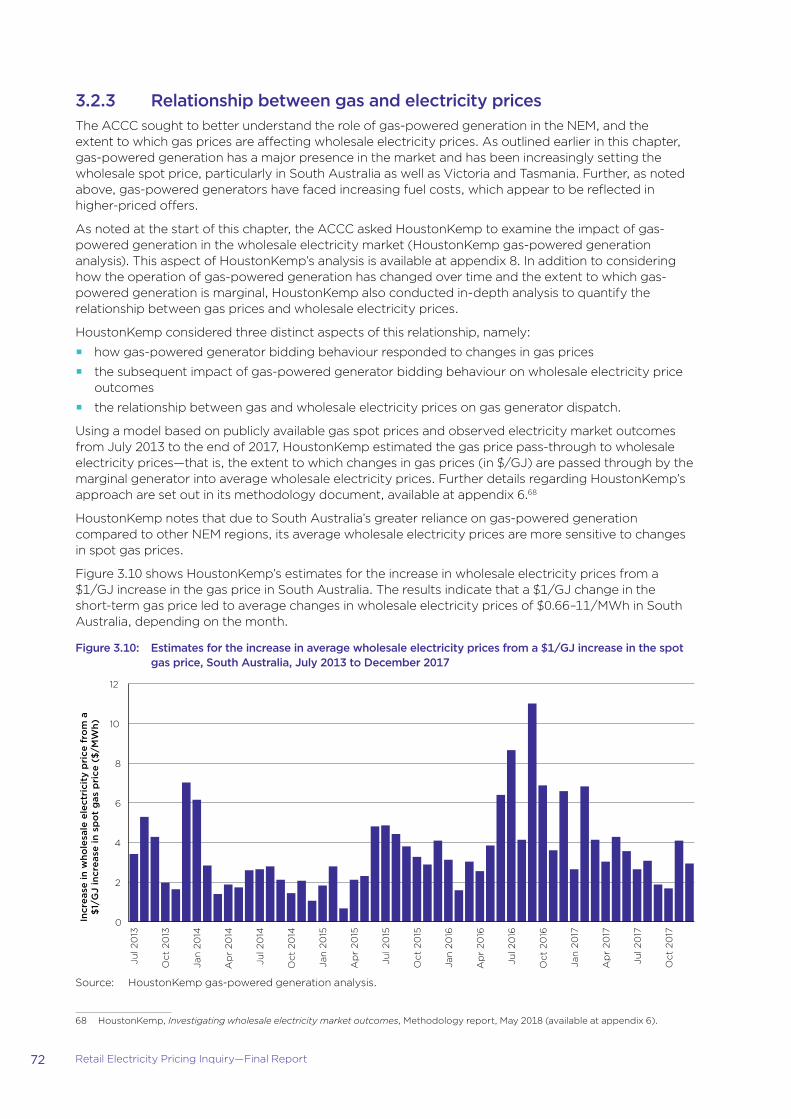
72 Retail Electricity Pricing Inquiry—Final Report
3.2.3 Relationship between gas and electricity pricesThe ACCC sought to better understand the role of gas-powered generation in the NEM, and the extent to which gas prices are affecting wholesale electricity prices. As outlined earlier in this chapter, gas-powered generation has a major presence in the market and has been increasingly setting the wholesale spot price, particularly in South Australia as well as Victoria and Tasmania. Further, as noted above, gas-powered generators have faced increasing fuel costs, which appear to be reflected in higher-priced offers.
As noted at the start of this chapter, the ACCC asked HoustonKemp to examine the impact of gas-powered generation in the wholesale electricity market (HoustonKemp gas-powered generation analysis). This aspect of HoustonKemp’s analysis is available at appendix 8. In addition to considering how the operation of gas-powered generation has changed over time and the extent to which gas-powered generation is marginal, HoustonKemp also conducted in-depth analysis to quantify the relationship between gas prices and wholesale electricity prices.
HoustonKemp considered three distinct aspects of this relationship, namely:
�� how gas-powered generator bidding behaviour responded to changes in gas prices
�� the subsequent impact of gas-powered generator bidding behaviour on wholesale electricity price outcomes
�� the relationship between gas and wholesale electricity prices on gas generator dispatch.
Using a model based on publicly available gas spot prices and observed electricity market outcomes from July 2013 to the end of 2017, HoustonKemp estimated the gas price pass-through to wholesale electricity prices—that is, the extent to which changes in gas prices (in $/GJ) are passed through by the marginal generator into average wholesale electricity prices. Further details regarding HoustonKemp’s approach are set out in its methodology document, available at appendix 6.68
HoustonKemp notes that due to South Australia’s greater reliance on gas-powered generation compared to other NEM regions, its average wholesale electricity prices are more sensitive to changes in spot gas prices.
Figure 3.10 shows HoustonKemp’s estimates for the increase in wholesale electricity prices from a $1/GJ increase in the gas price in South Australia. The results indicate that a $1/GJ change in the short-term gas price led to average changes in wholesale electricity prices of $0.66–11/MWh in South Australia, depending on the month.
Figure 3.10: Estimates for the increase in average wholesale electricity prices from a $1/GJ increase in the spot gas price, South Australia, July 2013 to December 2017
0
2
4
6
8
10
12
Incr
ease
in w
hole
sale
ele
ctri
city
pri
ce f
rom
a$
1/G
J in
crea
se in
sp
ot
gas
pri
ce (
$/M
Wh)
Jul 2
013
Oct
20
13
Jan
20
14
Ap
r 20
14
Jul 2
014
Oct
20
14
Jan
20
15
Ap
r 20
15
Jul 2
015
Oct
20
15
Jan
20
16
Ap
r 20
16
Jul 2
016
Oct
20
16
Jan
20
17
Ap
r 20
17
Jul 2
017
Oct
20
17
Source: HoustonKemp gas-powered generation analysis.
68 HoustonKemp, Investigating wholesale electricity market outcomes, Methodology report, May 2018 (available at appendix 6).
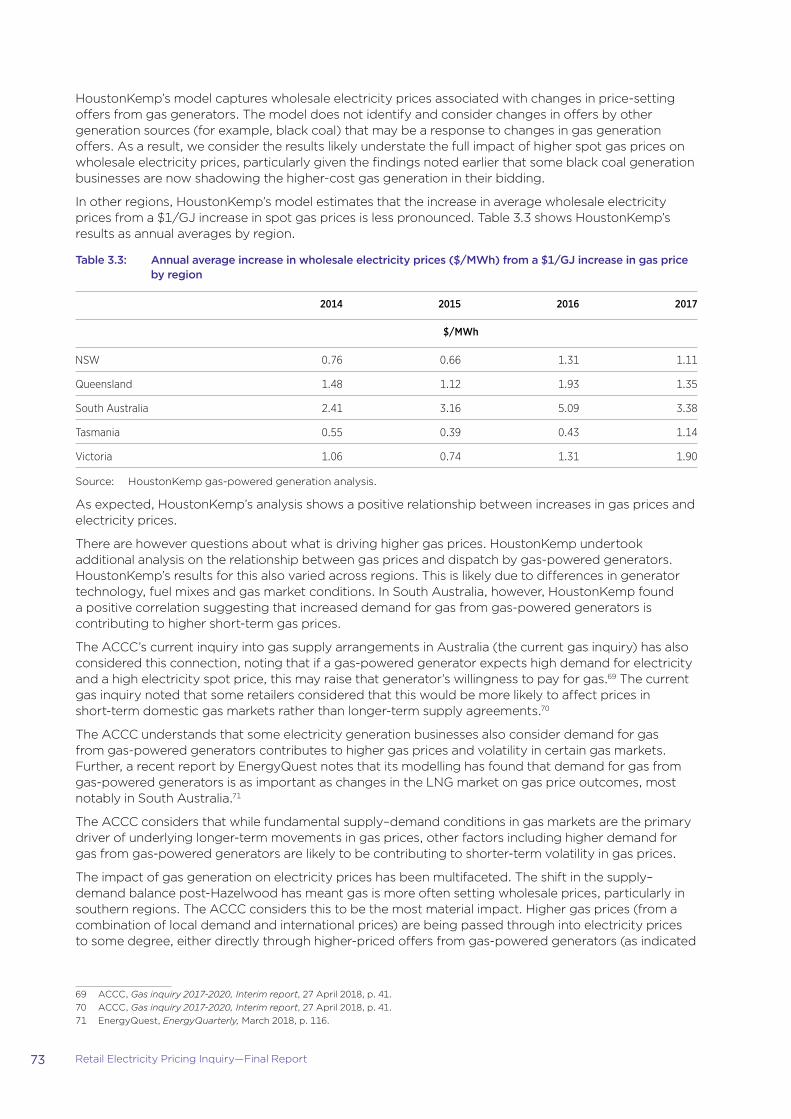
73 Retail Electricity Pricing Inquiry—Final Report
HoustonKemp’s model captures wholesale electricity prices associated with changes in price-setting offers from gas generators. The model does not identify and consider changes in offers by other generation sources (for example, black coal) that may be a response to changes in gas generation offers. As a result, we consider the results likely understate the full impact of higher spot gas prices on wholesale electricity prices, particularly given the findings noted earlier that some black coal generation businesses are now shadowing the higher-cost gas generation in their bidding.
In other regions, HoustonKemp’s model estimates that the increase in average wholesale electricity prices from a $1/GJ increase in spot gas prices is less pronounced. Table 3.3 shows HoustonKemp’s results as annual averages by region.
Table 3.3: Annual average increase in wholesale electricity prices ($/MWh) from a $1/GJ increase in gas price by region
2014 2015 2016 2017
$/MWh
NSW 0.76 0.66 1.31 1.11
Queensland 1.48 1.12 1.93 1.35
South Australia 2.41 3.16 5.09 3.38
Tasmania 0.55 0.39 0.43 1.14
Victoria 1.06 0.74 1.31 1.90
Source: HoustonKemp gas-powered generation analysis.
As expected, HoustonKemp’s analysis shows a positive relationship between increases in gas prices and electricity prices.
There are however questions about what is driving higher gas prices. HoustonKemp undertook additional analysis on the relationship between gas prices and dispatch by gas-powered generators. HoustonKemp’s results for this also varied across regions. This is likely due to differences in generator technology, fuel mixes and gas market conditions. In South Australia, however, HoustonKemp found a positive correlation suggesting that increased demand for gas from gas-powered generators is contributing to higher short-term gas prices.
The ACCC’s current inquiry into gas supply arrangements in Australia (the current gas inquiry) has also considered this connection, noting that if a gas-powered generator expects high demand for electricity and a high electricity spot price, this may raise that generator’s willingness to pay for gas.69 The current gas inquiry noted that some retailers considered that this would be more likely to affect prices in short-term domestic gas markets rather than longer-term supply agreements.70
The ACCC understands that some electricity generation businesses also consider demand for gas from gas-powered generators contributes to higher gas prices and volatility in certain gas markets. Further, a recent report by EnergyQuest notes that its modelling has found that demand for gas from gas-powered generators is as important as changes in the LNG market on gas price outcomes, most notably in South Australia.71
The ACCC considers that while fundamental supply–demand conditions in gas markets are the primary driver of underlying longer-term movements in gas prices, other factors including higher demand for gas from gas-powered generators are likely to be contributing to shorter-term volatility in gas prices.
The impact of gas generation on electricity prices has been multifaceted. The shift in the supply–demand balance post-Hazelwood has meant gas is more often setting wholesale prices, particularly in southern regions. The ACCC considers this to be the most material impact. Higher gas prices (from a combination of local demand and international prices) are being passed through into electricity prices to some degree, either directly through higher-priced offers from gas-powered generators (as indicated
69 ACCC, Gas inquiry 2017-2020, Interim report, 27 April 2018, p. 41.70 ACCC, Gas inquiry 2017-2020, Interim report, 27 April 2018, p. 41.71 EnergyQuest, EnergyQuarterly, March 2018, p. 116.
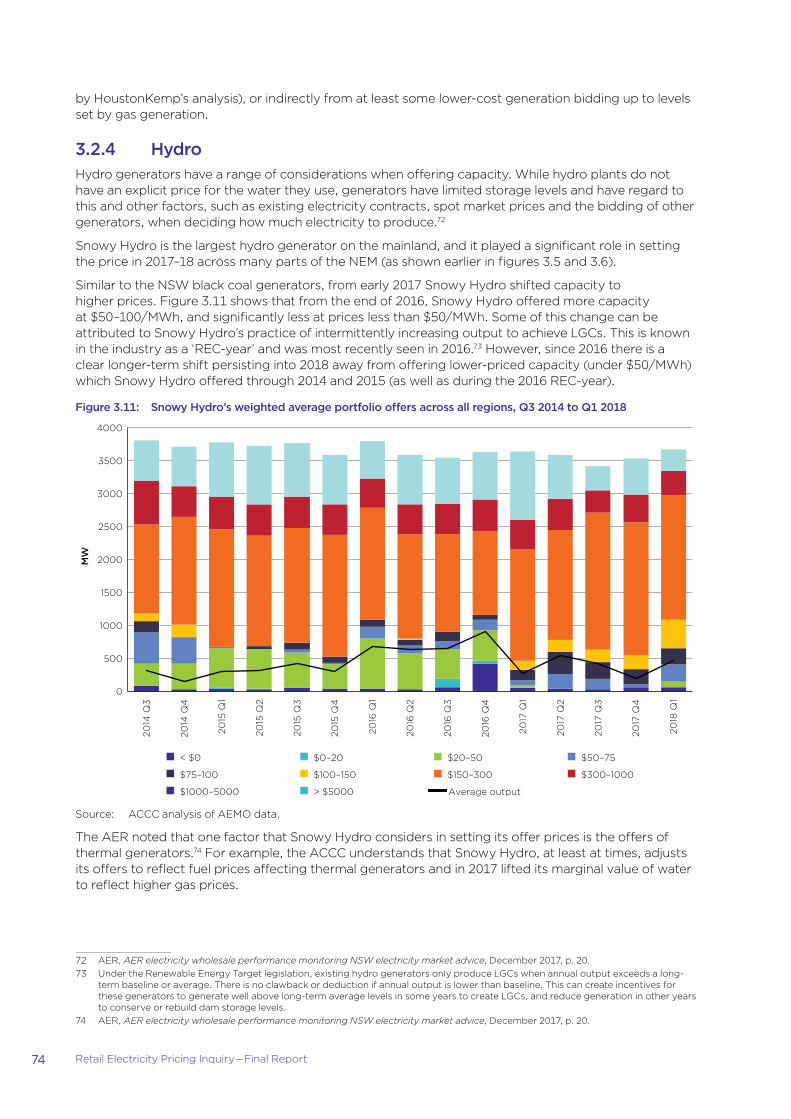
74 Retail Electricity Pricing Inquiry—Final Report
by HoustonKemp’s analysis), or indirectly from at least some lower-cost generation bidding up to levels set by gas generation.
3.2.4 HydroHydro generators have a range of considerations when offering capacity. While hydro plants do not have an explicit price for the water they use, generators have limited storage levels and have regard to this and other factors, such as existing electricity contracts, spot market prices and the bidding of other generators, when deciding how much electricity to produce.72
Snowy Hydro is the largest hydro generator on the mainland, and it played a significant role in setting the price in 2017–18 across many parts of the NEM (as shown earlier in figures 3.5 and 3.6).
Similar to the NSW black coal generators, from early 2017 Snowy Hydro shifted capacity to higher prices. Figure 3.11 shows that from the end of 2016, Snowy Hydro offered more capacity at $50–100/MWh, and significantly less at prices less than $50/MWh. Some of this change can be attributed to Snowy Hydro’s practice of intermittently increasing output to achieve LGCs. This is known in the industry as a ‘REC-year’ and was most recently seen in 2016.73 However, since 2016 there is a clear longer-term shift persisting into 2018 away from offering lower-priced capacity (under $50/MWh) which Snowy Hydro offered through 2014 and 2015 (as well as during the 2016 REC-year).
Figure 3.11: Snowy Hydro’s weighted average portfolio offers across all regions, Q3 2014 to Q1 2018
0
500
1000
1500
2000
2500
3000
3500
4000
2014
Q3
2014
Q4
2015
Q1
2015
Q2
2015
Q3
2015
Q4
2016
Q1
2016
Q2
2016
Q3
2016
Q4
2017
Q1
2017
Q2
2017
Q3
2017
Q4
2018
Q1
MW
< $0 $0–20 $20–50 $50–75
$75–100 $100–150 $150–300 $300–1000
$1000–5000 > $5000 Average output
Source: ACCC analysis of AEMO data.
The AER noted that one factor that Snowy Hydro considers in setting its offer prices is the offers of thermal generators.74 For example, the ACCC understands that Snowy Hydro, at least at times, adjusts its offers to reflect fuel prices affecting thermal generators and in 2017 lifted its marginal value of water to reflect higher gas prices.
72 AER, AER electricity wholesale performance monitoring NSW electricity market advice, December 2017, p. 20.73 Under the Renewable Energy Target legislation, existing hydro generators only produce LGCs when annual output exceeds a long-
term baseline or average. There is no clawback or deduction if annual output is lower than baseline. This can create incentives for these generators to generate well above long-term average levels in some years to create LGCs, and reduce generation in other years to conserve or rebuild dam storage levels.
74 AER, AER electricity wholesale performance monitoring NSW electricity market advice, December 2017, p. 20.
75 Retail Electricity Pricing Inquiry—Final Report
While hydro generators need to consider other factors when offering capacity at certain prices, such as water availability and minimum release requirements, the practice of shadowing thermal generators raises questions about the level of competitive constraint from hydro. If hydro generators are often and regularly reflecting the offers of gas-powered generation, they are unlikely to be placing a strong constraint on the relatively lower-cost black coal generators.
3.2.5 ACCC findings on the impact of fuel costsFrom the analysis conducted by the ACCC, it is clear there has been an impact of generators’ fuel costs on electricity prices, both in terms of higher black coal costs in NSW and higher gas costs. These fuels are also now setting wholesale prices more often.
However, the cost increases alone do not account for the higher prices offered by various generators. While increases in gas offers appear to be generally in line with increases in gas fuel costs, increases in black coal offers in both NSW, but particularly in Queensland, have significantly exceeded the fuel cost changes that we have observed.
This appears to be due to a lack of competitive constraint in the market, which was exacerbated following the closure of Hazelwood. Evidence considered by the ACCC indicates that a weaker competitive environment has allowed lower-cost generation sources such as black coal and hydro to offer certain capacity at higher prices, up to the next highest fuel cost (gas). Evidence also shows that several generators have adopted such strategies which, although commercially rational, have contributed to higher prices for consumers.
3.3 Is market structure and participant behaviour contributing to price outcomes?
The ACCC also considered in more detail the extent to which other factors may be influencing wholesale price outcomes. One such factor is the role of the market structure and how that contributes to price outcomes in the NEM, particularly given the relatively concentrated nature of the market. As noted in chapter 2, market concentration has increased over time.
To further understand the impact of market structure, the ACCC commissioned HoustonKemp to analyse publicly available market data to investigate how structure (including changes to structure) has affected generators’ offered prices and spot price outcomes in the NEM (HoustonKemp analysis of NEM events). In undertaking this analysis, HoustonKemp examined data and trends before, during and after key events that have occurred in the market over the past five years.
These events included:
�� the closure of the Hazelwood power station in March 2017
�� the return of the Pelican Point power station to full capacity in June 2017
�� the closure of the Northern power station in May 2016
�� Snowy Hydro’s ‘REC-year’ strategy in 2016
�� the outage of the Basslink interconnector between Victoria and Tasmania from December 2015 to June 2016
�� the acquisition of the Macquarie Generation assets by AGL in September 2014.
HoustonKemp also considered any impact from changes in bidding rules and conduct prompts to generators, including:
�� the Queensland Government’s direction to Stanwell Corporation effective July 2017 to place downward pressure on wholesale prices
�� the change to the bidding in good faith rule (good faith rule change) effective July 2016.75
75 The rebidding reforms strengthened the requirement for generators to have genuine intent to honour their bids. To do so, they prohibit offers, bids and rebids that are false, misleading or likely to mislead, require rebids to be made as soon as practicable after a generator or market participant becomes aware of the changed material conditions or circumstances that prompted the rebid, and require participants to maintain a contemporaneous record of the circumstances surrounding late rebids. These reforms involved amendments to chapter 3 of the NER (see https://www.aemc.gov.au/rule-changes/bidding-in-good-faith).

76 Retail Electricity Pricing Inquiry—Final Report
HoustonKemp considered a range of public NEM data relating to price and demand, generator dispatch, bidding quantities, rebidding timing and quantities, rebidding impacts on price, proportion of time as marginal generator, contract trading volumes and ancillary services prices (where relevant). HoustonKemp’s full analysis of NEM events as well as a description of the methodology it applied to undertake the analysis is available on the ACCC’s website at appendices 7 and 6 respectively.
3.3.1 Price outcomesFigure 3.12 shows monthly average spot prices for each NEM region from July 2013 to February 2018, indicating the timing of most events considered by HoustonKemp. Note that the timing of the Basslink outage (December 2015 to June 2016) and Snowy Hydro’s REC-year (2016 calendar year) are not highlighted in the figure.
The figure indicates that there were considerable changes in price outcomes following most of these events:
�� Prices across all regions increased around the time of the Hazelwood closure, which was announced in November 2016 (when prices began trending upwards). The behaviour of certain generators following the closure is considered below in section 3.3.2.
�� After Pelican Point returned to full capacity, prices reduced temporarily in South Australia, Victoria and Tasmania.
�� South Australian prices increased dramatically in the months following the closure of the Northern power station. Other factors such as the Victoria – South Australia Heywood interconnector upgrade occurred at a similar time which likely contributed to price outcomes. These are explored further in section 3.3.2.
�� The Basslink outage had a large impact on Tasmanian prices in the first half of 2016.
�� Price impacts following the good faith rule change and direction to Stanwell Corporation are less obvious. However, the higher summer prices experienced in Queensland in 2014–15, 2015–16 and 2016–17 were not repeated in 2017–18 (after the direction to Stanwell Corporation), despite tighter supply–demand conditions. These are considered further in section 3.3.3.
Figure 3.12: Monthly average spot prices by NEM region, July 2013 to February 2018, ($/MWh nominal)
Hazelwoodclosure
Pelican Pointunit returned
Northernclosure
Good faithrule change
StanwellDirection
AGL acquisition ofMacquarie Generation
0
25
50
75
100
125
150
175
200
225
250
275
$/M
Wh
Tasmania NSW Queensland Victoria South Australia
Jul 2
013
Oct
20
13
Jan
20
14
Ap
r 20
14
Jul 2
014
Oct
20
14
Jan
20
15
Ap
r 20
15
Jul 2
015
Oct
20
15
Jan
20
16
Ap
r 20
16
Jul 2
016
Oct
20
16
Jan
20
17
Ap
r 20
17
Jul 2
017
Oct
20
17
Jan
20
18
Source: HoustonKemp analysis of NEM events.

77 Retail Electricity Pricing Inquiry—Final Report
3.3.2 Participant behaviour following changes in market structureKey findings from events related to shifts in market structure and large changes in the supply–demand balance are set out below.
Hazelwood closureAs noted earlier in this chapter, the Hazelwood power station closed in March 2017. The most significant change following the closure was the shift by NSW and Queensland black coal generators to offer capacity at higher prices. Figures 3.13 to 3.16 illustrate how four major black coal power stations offered capacity before and after the Hazelwood closure. The behaviour of each power station is slightly different in the timing and pricing of offers throughout 2017 and in early 2018.
AGL (through its Bayswater station) began shifting significant capacity previously bid at less than $30/MWh to higher prices of $30–50/MWh in December 2016. It moved that capacity to $60–70/MWh from March 2017, and then to some higher price bands in August and September 2017 when dispatch declined by around a quarter. From October 2017 through to early 2018, large volumes of capacity were consistently offered at $50–60/MWh and dispatch volumes returned to around 2000 MW.
Total capacity offered and dispatched by AGL’s Liddell power station declined significantly over the same period, but amounts of capacity were not generally shifted into alternative (higher) price bands. AGL noted several operational problems at the Liddell plant with two of its four units out of service in the later part of 2017.76
Origin (through its Eraring power station) similarly shifted significant capacity into higher price bands from December 2016. In April 2017, Origin offered large volumes of capacity at $50–70/MWh (slightly lower than that of Bayswater) and in August to October 2017 offered capacity at a range of higher prices up to $150/MWh. From November 2017, Origin’s offers for a significant amount of capacity were progressively repriced downwards, mostly to $30–50/MWh. During this time, Origin increased output from its Eraring station77, which added lower-priced supply to the market and also allowed Origin to capitalise on higher wholesale prices.78
76 AGL, Liddell Unit 2 Unplanned Outage, blog post, 29 September 2017.77 Origin, Opening remarks to the NSW Legislative Council’s Select Committee on Electricity Supply, Demand and Prices in NSW,
statement by John Briskin, EGM Retail, 8 May 2018.78 See Origin, 2017 Full Year Results, Full year ended 30 June 2017, 16 August 2017, p. 11 and Origin, 2017 Investor Day, 28 November
2017, pp. 6 and 14.
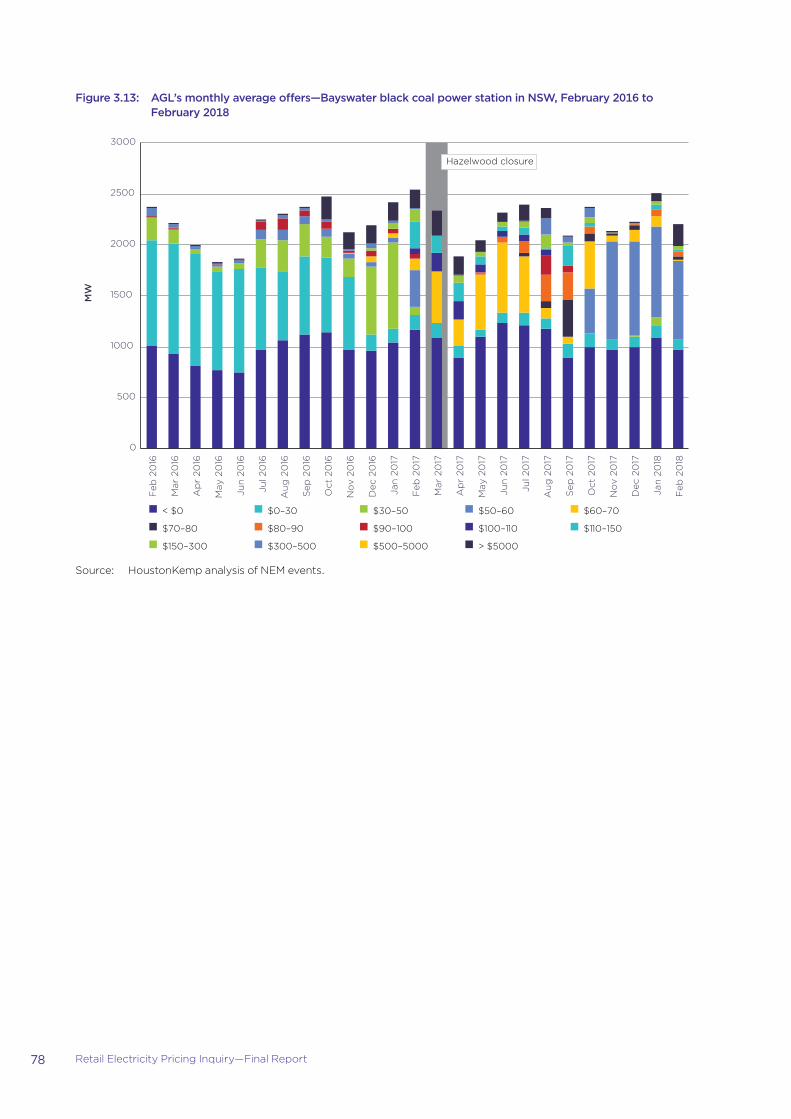
78 Retail Electricity Pricing Inquiry—Final Report
Figure 3.13: AGL’s monthly average offers—Bayswater black coal power station in NSW, February 2016 to February 2018
0
500
1000
1500
2000
2500
3000 F
eb 2
016
Mar
20
16
Ap
r 20
16
May
20
16
Jun
20
16
Jul 2
016
Au
g 2
016
Sep
20
16
Oct
20
16
No
v 20
16
Dec
20
16
Jan
20
17
Feb
20
17
Mar
20
17
Ap
r 20
17
May
20
17
Jun
20
17
Jul 2
017
Au
g 2
017
Sep
20
17
Oct
20
17
No
v 20
17
Dec
20
17
Jan
20
18
Feb
20
18
MW
Hazelwood closure
< $0 $0–30 $30–50 $50–60 $60–70
$70–80 $80–90 $90–100 $100–110 $110–150
$150–300 $300–500 $500–5000 > $5000
Source: HoustonKemp analysis of NEM events.

79 Retail Electricity Pricing Inquiry—Final Report
Figure 3.14: Origin’s monthly average offers—Eraring black coal power station in NSW, February 2016 to February 2018
0
500
1000
1500
2000
2500
3000 F
eb 2
016
Mar
20
16
Ap
r 20
16
May
20
16
Jun
20
16
Jul 2
016
Au
g 2
016
Sep
20
16
Oct
20
16
No
v 20
16
Dec
20
16
Jan
20
17
Feb
20
17
Mar
20
17
Ap
r 20
17
May
20
17
Jun
20
17
Jul 2
017
Au
g 2
017
Sep
20
17
Oct
20
17
No
v 20
17
Dec
20
17
Jan
20
18
Feb
20
18
MW
Hazelwood closure
< $0 $0–30 $30–50 $50–60 $60–70
$70–80 $80–90 $90–100 $100–110 $110–150
$150–300 $300–500 $500–5000 > $5000
Source: HoustonKemp analysis of NEM events.
Other NSW black coal generators (EnergyAustralia’s Mt Piper station and Sunset Power’s Vales Point B station) have less capacity—approximately 1500 MW—and as shown earlier in figure 3.6, are marginal less often. Both power stations also shifted capacity to higher prices, however there were some differences to AGL and Origin.
EnergyAustralia reduced total capacity significantly in September and October 2017 (likely due to outages and the uncertainty over its coal supply, as noted in section 3.2.1). EnergyAustralia continued to offer smaller volumes at relatively lower prices of $0–30/MWh throughout 2017 and into 2018. By February 2018, its offer profile was quite different to a year earlier, with nearly 1000 MW offered at less than $0, and the remainder offered at prices over $60/MWh.
Sunset Power’s offers show a more gradual transition into higher price bands, beginning in late 2016. Similar to EnergyAustralia, Sunset Power offered more capacity at less than $0 in early 2018.
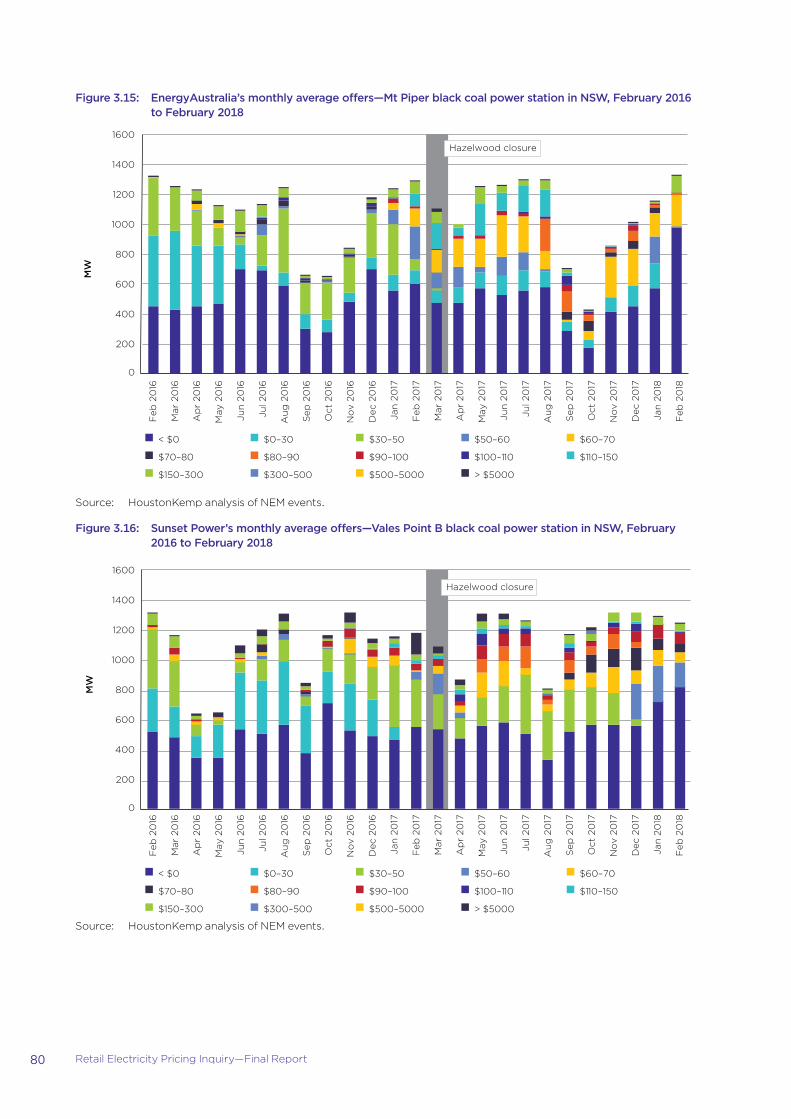
80 Retail Electricity Pricing Inquiry—Final Report
Figure 3.15: EnergyAustralia’s monthly average offers—Mt Piper black coal power station in NSW, February 2016 to February 2018
0
Feb
20
16
Mar
20
16
Ap
r 20
16
May
20
16
Jun
20
16
Jul 2
016
Au
g 2
016
Sep
20
16
Oct
20
16
No
v 20
16
Dec
20
16
Jan
20
17
Feb
20
17
Mar
20
17
Ap
r 20
17
May
20
17
Jun
20
17
Jul 2
017
Au
g 2
017
Sep
20
17
Oct
20
17
No
v 20
17
Dec
20
17
Jan
20
18
Feb
20
18
MW
< $0 $0–30 $30–50 $50–60 $60–70
$70–80 $80–90 $90–100 $100–110 $110–150
$150–300 $300–500 $500–5000 > $5000
Hazelwood closure
200
400
600
800
1000
1200
1400
1600
Source: HoustonKemp analysis of NEM events.
Figure 3.16: Sunset Power’s monthly average offers—Vales Point B black coal power station in NSW, February 2016 to February 2018
0
Feb
20
16
Mar
20
16
Ap
r 20
16
May
20
16
Jun
20
16
Jul 2
016
Au
g 2
016
Sep
20
16
Oct
20
16
No
v 20
16
Dec
20
16
Jan
20
17
Feb
20
17
Mar
20
17
Ap
r 20
17
May
20
17
Jun
20
17
Jul 2
017
Au
g 2
017
Sep
20
17
Oct
20
17
No
v 20
17
Dec
20
17
Jan
20
18
Feb
20
18
MW
Hazelwood closure
200
400
600
800
1000
1200
1400
1600
< $0 $0–30 $30–50 $50–60 $60–70
$70–80 $80–90 $90–100 $100–110 $110–150
$150–300 $300–500 $500–5000 > $5000
Source: HoustonKemp analysis of NEM events.

81 Retail Electricity Pricing Inquiry—Final Report
Victorian brown coal generators offered most capacity throughout 2017 and in early 2018 at prices less than $0 and almost all the remaining capacity at $0–30/MWh (as shown in aggregate earlier in figure 3.2).
The only notable shift was in relation to AGL’s Loy Yang A power station. Prior to Hazelwood exiting, Loy Yang A offered small amounts of capacity at prices over $300/MWh. This ceased after the Hazelwood closure. Brown coal generators had limited ability to increase output as they were already operating near capacity. As such they have been able to earn significantly higher spot revenues without any significant change to their bidding strategies simply because the higher-priced black coal, gas and hydro generators were setting the price.
To offset the loss of capacity following Hazelwood’s exit, certain gas generators increased output. As noted in the AER’s recent Hazelwood advice to COAG, gas generators in Victoria, particularly Origin’s Mortlake power station, increased output throughout 2017.79 Also, the second unit of the South Australian Pelican Point power station returned to service in mid-2017, providing approximately 350 MW of additional capacity.
Figure 3.17 shows the return of Pelican Point to full capacity and demonstrates that most of its capacity was offered at relatively low prices, which almost immediately contributed to lower wholesale prices in South Australia.
Figure 3.17: Engie’s monthly average offers—Pelican Point gas power station in South Australia, February 2016 to February 2018
MW
Hazelwood closure
0
50
100
150
200
250
300
350
400
450
500
Feb
20
16
Mar
20
16
Ap
r 20
16
May
20
16
Jun
20
16
Jul 2
016
Au
g 2
016
Sep
20
16
Oct
20
16
No
v 20
16
Dec
20
16
Jan
20
17
Feb
20
17
Mar
20
17
Ap
r 20
17
May
20
17
Jun
20
17
Jul 2
017
Au
g 2
017
Sep
20
17
Oct
20
17
No
v 20
17
Dec
20
17
Jan
20
18
Feb
20
18
Pelican Point unit returned
< $0 $0–30 $30–50 $50–60 $60–70
$70–80 $80–90 $90–100 $100–110 $110–150
$150–300 $300–500 $500–5000 > $5000
Source: HoustonKemp analysis of NEM events.
Northern closureThere were a number of changes impacting the South Australian market around the time of the closure of Alinta’s Northern coal power station in May 2016. These included:
�� additional constraints on interconnector flows between South Australia and Victoria due to the Heywood interconnector upgrade
�� the short-term mothballing of Engie’s Pelican Point gas generator in South Australia which limited its ability to respond
79 AER, AER electricity wholesale performance monitoring Hazelwood advice, March 2018, pp. 10–11.
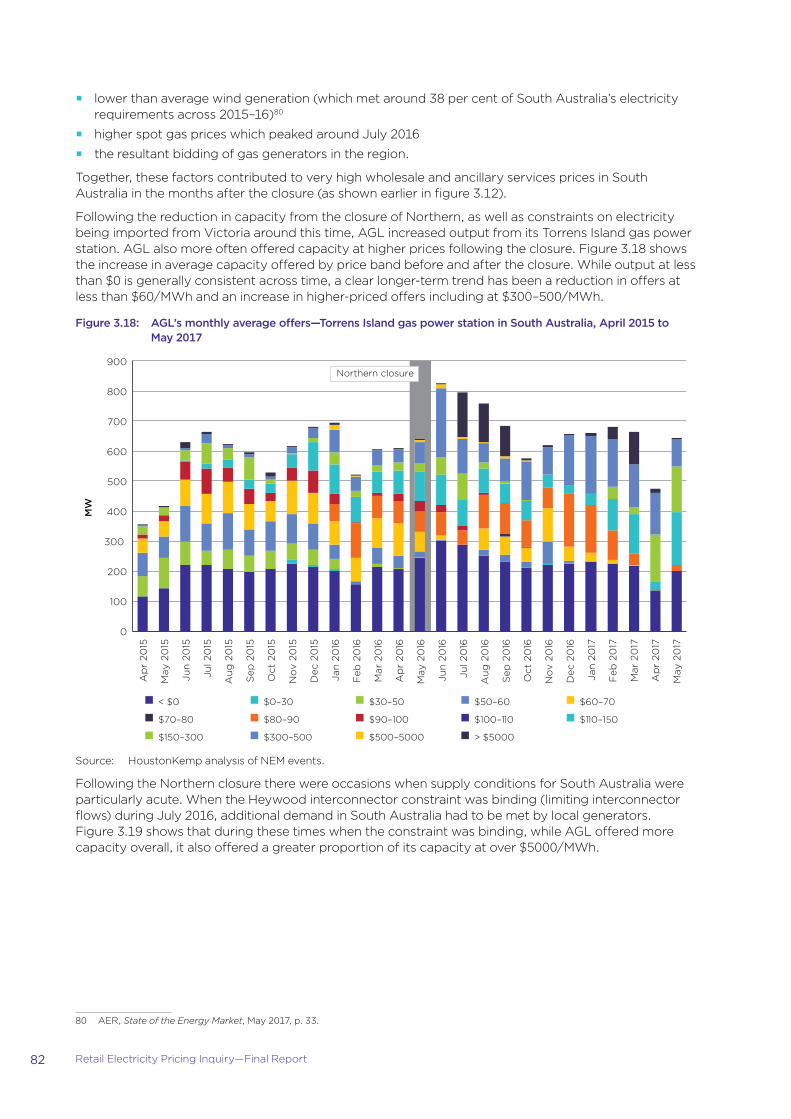
82 Retail Electricity Pricing Inquiry—Final Report
�� lower than average wind generation (which met around 38 per cent of South Australia’s electricity requirements across 2015–16)80
�� higher spot gas prices which peaked around July 2016
�� the resultant bidding of gas generators in the region.
Together, these factors contributed to very high wholesale and ancillary services prices in South Australia in the months after the closure (as shown earlier in figure 3.12).
Following the reduction in capacity from the closure of Northern, as well as constraints on electricity being imported from Victoria around this time, AGL increased output from its Torrens Island gas power station. AGL also more often offered capacity at higher prices following the closure. Figure 3.18 shows the increase in average capacity offered by price band before and after the closure. While output at less than $0 is generally consistent across time, a clear longer-term trend has been a reduction in offers at less than $60/MWh and an increase in higher-priced offers including at $300–500/MWh.
Figure 3.18: AGL’s monthly average offers—Torrens Island gas power station in South Australia, April 2015 to May 2017
MW
0
100
200
300
400
500
600
700
800
900
Ap
r 20
15
May
20
15
Jun
20
15
Jul 2
015
Au
g 2
015
Sep
20
15
Oct
20
15
No
v 20
15
Dec
20
15
Jan
20
16
Feb
20
16
Mar
20
16
Ap
r 20
16
May
20
16
Jun
20
16
Jul 2
016
Au
g 2
016
Sep
20
16
Oct
20
16
No
v 20
16
Dec
20
16
Jan
20
17
Feb
20
17
Mar
20
17
Ap
r 20
17
May
20
17
Northern closure
< $0 $0–30 $30–50 $50–60 $60–70
$70–80 $80–90 $90–100 $100–110 $110–150
$150–300 $300–500 $500–5000 > $5000
Source: HoustonKemp analysis of NEM events.
Following the Northern closure there were occasions when supply conditions for South Australia were particularly acute. When the Heywood interconnector constraint was binding (limiting interconnector flows) during July 2016, additional demand in South Australia had to be met by local generators. Figure 3.19 shows that during these times when the constraint was binding, while AGL offered more capacity overall, it also offered a greater proportion of its capacity at over $5000/MWh.
80 AER, State of the Energy Market, May 2017, p. 33.

83 Retail Electricity Pricing Inquiry—Final Report
Figure 3.19: AGL’s average offers when the Heywood interconnector constraint was binding—Torrens Island gas power station in South Australia, July 2016
0 100 200 300 400 500 600 700 800 900
Binding
Not Binding
< $0 $80–90 $90–100 $110–150 $150–300 $300–500 $500–5000 > $5000
Source: HoustonKemp analysis of NEM events.
While AGL’s behaviour during this period could be seen as opportunistic, it could to some extent reflect changes in underlying generation costs at this time (given high gas prices, particularly in July 2016). It is also important to note that the NEM design is based around prices increasing at times of supply scarcity. Higher prices at these times provide a signal for new generation investment (or, as we have seen in the case of Pelican Point, the re-entry of mothballed plant).
The effects of tight supply–demand conditions in South Australia were also felt in the frequency control ancillary services (FCAS) market. As an example, from October 2015, AEMO required some FCAS to be sourced locally whenever a region could credibly be islanded from the rest of the NEM. But the diminished availability of plant in South Australia allows available generators to rebid FCAS capacity into high price bands whenever this risk arises. During the month in which the change was introduced, FCAS prices rose above $5000/MW several times. This pattern recurred frequently in FCAS markets in 2016 and 2017.81
Figure 3.20 shows average FCAS recovery rates paid by generators and customers in South Australia from December 2014 to April 2018.82 Recovery rates have regularly spiked above $10/MWh, particularly following the closure of Northern, adding to the already higher cost of wholesale supply in South Australia. The figure also illustrates that the recent introduction of the Hornsdale Power Reserve Battery Energy Storage System (Hornsdale Power Reserve), as well as the opening of the FCAS market to demand response (see chapter 8), has likely contributed improved outcomes in the South Australian FCAS market from late 2017.83
81 AER, State of the Energy Market, May 2017, p. 54.82 Recovery rates are the total costs of FCAS services recovered from generators and customers, divided by their total production/
consumption respectively.83 AEMO, Quarterly Energy Dynamics, Q1 2018, p. 14.

84 Retail Electricity Pricing Inquiry—Final Report
Figure 3.20: Average ancillary services recovery rates in South Australia, December 2014 to April 2018 ($/MWh nominal)
0
5
10
15
20
25
30
Dec
20
14
Feb
20
15
Ap
r 20
15
Jun
20
15
Au
g 2
015
Oct
20
15
Dec
20
15
Feb
20
16
Ap
r 20
16
Jun
20
16
Au
g 2
016
Oct
20
16
Dec
20
16
Feb
20
17
Ap
r 20
17
Jun
20
17
Au
g 2
017
Oct
20
17
Dec
20
17
Feb
20
18
Ap
r 20
18
$/M
Wh
Generator recovery rates Customer recovery rates
Northern closure Hornsdale batterycommenced
Source: HoustonKemp analysis of NEM events.
3.3.3 Participant behaviour following conduct promptsThe key conduct prompts that were considered by HoustonKemp in its analysis were the Queensland Government’s direction to Stanwell Corporation in July 2017 and the good faith rule change a year earlier around July 2016.
Direction to Stanwell CorporationAnalysis of Queensland black coal generators, principally Stanwell Corporation, shows a stark difference before and after the Queensland Government directed Stanwell Corporation to place downward pressure on wholesale prices from mid-2017. In the lead-up to that time, prices in Queensland had risen considerably. One market participant’s internal documents observed in February 2017 that the Queensland market was ‘perilously close to overheating and becoming unsustainable in terms of affordability.’
As shown earlier in figure 3.12, wholesale prices in Queensland were significantly lower during the summer of 2017–18 following the direction, despite record demand. Stanwell Corporation’s bidding is likely to be a key driver of this. Figure 3.21 shows Stanwell Corporation’s average capacity offered by price band from July 2015 to February 2018.

85 Retail Electricity Pricing Inquiry—Final Report
Figure 3.21: Stanwell Corporation’s monthly average offers—Stanwell and Tarong power stations, July 2015 to February 2018
0
500
1000
1500
2000
2500
3000
3500 Ju
l 20
15
Au
g 2
015
Sep
20
15
Oct
20
15
No
v 20
15
Dec
20
15
Jan
20
16
Feb
20
16
Mar
20
16
Ap
r 20
16
May
20
16
Jun
20
16
Jul 2
016
Au
g 2
016
Sep
20
16
Oct
20
16
No
v 20
16
Dec
20
16
Jan
20
17
Feb
20
17
Mar
20
17
Ap
r 20
17
May
20
17
Jun
20
17
Jul 2
017
Au
g 2
017
Sep
20
17
Oct
20
17
No
v 20
17
Dec
20
17
Jan
20
18
Feb
20
18
MW
Good faith rule change Stanwell Direction
< $0 $0–30 $30–50 $50–60 $60–70
$70–80 $80–90 $90–100 $100–110 $110–150
$150–300 $300–500 $500–5000 > $5000
Source: HoustonKemp analysis of NEM events.
A clear change after July 2017 is a marked reduction in capacity offered at high price bands of more than $5000/MWh. In the summer periods of 2015–16 and 2016–17, Stanwell Corporation offered significant quantities at those high price levels, which coincided with very high wholesale prices during those summer periods.
Queensland experienced relatively high demand in 2015–16 and 2016–17, which may have partially contributed to higher prices in those years. The combined output of the two power stations (Stanwell and Tarong) was higher in those summer periods, reaching over 2500 MW in several months. In those years most of that additional capacity was offered by Stanwell Corporation at prices above $5000/MWh. There were also occasions, however, in those summer periods when capacity that was previously offered at lower prices ($0–50/MWh) was shifted to considerably higher price levels.
While the level of demand likely had an influence on Stanwell Corporation’s behaviour, the ACCC does not consider that demand alone explains the extent of behaviour by Stanwell Corporation. In 2017–18, Queensland demand was at record levels, and following the direction to Stanwell Corporation, Queensland wholesale prices were considerably lower.
Analysis of CS Energy’s bidding behaviour (another government-owned generator, not subject to the direction) shows that it also offered significant capacity at its Gladstone generator at high prices prior to the direction to Stanwell Corporation. Similar to Stanwell Corporation, after the direction was issued the amount of capacity it offered at high prices reduced.

86 Retail Electricity Pricing Inquiry—Final Report
Bidding in good faith rule changeIn July 2016, the AEMC introduced a revised bidding in good faith rule with the aim of mitigating the number of false or misleading bids made by market participants.
The rule change request was submitted by the South Australian Government following a Federal Court decision handed down in August 2011 in relation to proceedings the AER took against Stanwell Corporation. As noted in the AEMC’s final determination on the revised rule, the South Australian Government was concerned that the Federal Court decision had introduced uncertainty around the operation of the bidding in good faith provisions and highlighted issues in relation to the implementation of the original policy intent.84
Given this background, HoustonKemp’s analysis focused on the behaviour of Stanwell Corporation which appeared to have altered its approach to rebidding following the rule change.
Before the change, Stanwell Corporation tended to shift offered capacity from low price bands to high price bands close to dispatch, a strategy that would tend to lead to higher prices. After the rule change, Stanwell Corporation tended to do the reverse, shifting capacity to lower price bands during trading intervals that have already recorded early high prices, to ensure continued dispatch for the higher-priced interval.
This trend is illustrated in figure 3.22 which shows the monthly average changes in Stanwell Corporation‘s coal generators’ quantity offered in certain price bands between penultimate and final bids. The figure represents average changes in bidding at the end of trading intervals. Negative values indicate where less quantity is offered at certain price bands as final bids (relative to penultimate bids), and positive values indicate where more quantity is offered at certain price bands as final bids (relative to penultimate bids). During February and March 2016 in particular, Stanwell Corporation rebid quantities from low price bands to higher price bands of over $5000/MWh during the trading interval. From February 2017 (until the time of the direction in July 2017), Stanwell Corporation tended to do the opposite.
84 AEMC, Final Rule Determination: National Electricity Amendment (Bidding in Good Faith) Rule 2015, 10 December 2015, p. 1.

87 Retail Electricity Pricing Inquiry—Final Report
Figure 3.22: Stanwell Corporation’s monthly average change in quantity offered between penultimate and final bids—Stanwell and Tarong power stations, July 2015 to February 2018
-100
-80
-60
-40
-20
0
20
40
60
80
100Ju
l 20
15
Au
g 2
015
Sep
20
15
Oct
20
15
No
v 20
15
Dec
20
15
Jan
20
16
Feb
20
16
Mar
20
16
Ap
r 20
16
May
20
16
Jun
20
16
Jul 2
016
Au
g 2
016
Sep
20
16
Oct
20
16
No
v 20
16
Dec
20
16
Jan
20
17
Feb
20
17
Mar
20
17
Ap
r 20
17
May
20
17
Jun
20
17
Jul 2
017
Au
g 2
017
Sep
20
17
Oct
20
17
No
v 20
17
Dec
20
17
Jan
20
18
Feb
20
18
Mo
nthl
y av
erag
e ch
ang
e in
qua
ntit
y o
�er
ed (
MW
)
< $0 $0–300 $300–5000 > $5000
Good faith rule change Stanwell Direction
Source: HoustonKemp analysis of NEM events.
While the good faith rule change appears to have influenced Stanwell Corporation’s behaviour, it does not appear to have placed any downwards-pressure on Queensland wholesale prices. As noted earlier, prices in Queensland were very high in the 2016–17 summer period, and it was only following the direction to Stanwell Corporation that it moved to an overall more conservative bidding strategy. These outcomes suggest that, at least in Queensland, while behaviour changed after the good faith rule change, it does not seem to have had a material effect on market outcomes.
3.3.4 ACCC findings on generator behaviourOverall, the ACCC considers the analysis conducted on specific generators’ behaviour around key events supports the findings noted in section 3.2.
Following the closure of Hazelwood, the behaviour of particular NSW black coal generators appears to be a result of both increases in fuel costs (and fuel supply issues in parts of 2017) and outcomes from an environment where generators can and appear to have acted in a relatively unconstrained manner. This lack of competitive pressure is of concern to the ACCC, particularly given the critical need for a sufficient level of competition in this market to drive affordable electricity prices.
The concentrated nature of the South Australian market has clearly contributed to high price outcomes in that region, particularly when supply conditions in the region have been tight. When supply has been improved, through the return of Pelican Point as well as the introduction of the Hornsdale Power Reserve, there has been downward pressure on prices in the region.
In terms of the Queensland black coal generators, the ACCC considers that analysis of the available information indicates that, in the absence of the direction by the Queensland Government to place downward pressure on wholesale prices, there is very limited constraint on the bidding behaviour of Queensland’s black coal generators.

88 Retail Electricity Pricing Inquiry—Final Report
4. Wholesale market—is intervention required?
As highlighted in chapters 2 and 3, the NEM wholesale market has been a key source of higher prices for Australian consumers over the past two years. While wholesale prices are currently trending down, the ACCC considers it is critical to ensure a competitive wholesale market in the NEM to deliver affordable electricity in the future. This chapter includes recommendations to help achieve that goal.
This chapter considers the need for intervention in relation to:
�� market structure (section 4.1)
�� rules to address the exercise of market power or market manipulation (section 4.2)
�� barriers to investment (section 4.3)
�� fuel costs (section 4.4).
4.1 Market structureAs we have identified in chapters 2 and 3, the current wholesale market structure is not conducive to vigorous competition. In an energy-only bidding market, it is particularly important that there is sufficient competition between generators to deliver efficient prices.
Ownership is concentrated, not only within specific NEM regions but also across the NEM. It is evident from internal documents obtained during the Inquiry that generation businesses seek to optimise their portfolios both within NEM regions and across the NEM. It is commercially rational to do so. In many cases the business is simply covering its own retail or contracted load, such as in cases of a unit outage. In other cases, the purpose is to drive up prices in such a way as to advantage an entire portfolio. Concentration may also alter investment incentives for existing players given that new investment is likely to lead to lower market prices for their existing output.
The impacts of concentration are exacerbated by the tight supply–demand balance, particularly in South Australia and Victoria. While the supply–demand balance will change as the committed and proposed new generation referred to in chapter 2 enters the market, in the absence of further generation capacity coming into the market, it is likely to tighten again as we see the further retirement of coal generation over the coming years.
4.1.1 Addressing concentration across the NEMWhile all regions of the NEM are highly concentrated, there are differences between regions. In Queensland and Tasmania, concentration is a result of government ownership of significant generation assets. In the other NEM regions, it is commercial generation businesses together with government-owned Snowy Hydro which have the majority of generation capacity.
The ACCC’s analysis in chapter 3 illustrates the impact of high concentration, particularly leading to higher prices in Queensland and South Australia.
In the Preliminary Report, we flagged that the Inquiry would consider the need for constraints on the further consolidation of generation ownership given the existing high levels of concentration in the market identified in chapter 2.
Broadly, there are two options that could be considered to limit market concentration:
�� a mechanism to force divestiture of assets or market share in particular circumstances, or
�� restrictions on further concentration beyond certain levels.
89 Retail Electricity Pricing Inquiry—Final Report
Divestiture mechanismRequiring the divestiture of privately owned assets is an extreme measure to take in any market, including the electricity market.
While the way in which concentration has developed in the wholesale market is clearly contributing to current high prices, the ACCC considers that the other recommendations made in this report will, if implemented, be a better means to restore competition to a level which serves consumers well.
For these reasons, other than the unique circumstances in Queensland discussed in section 4.1.2, the ACCC does not believe it would be appropriate to intervene to unwind the way in which the market has evolved across the NEM.
Restrictions on further concentration by way of acquisitionAs noted above, in a bidding market like the NEM, competition between market participants is crucial to achieving efficient prices. Market concentration, and factors that tend to increase concentration, work against the fundamental design of the NEM.
Although the ACCC is not recommending interventions to unwind existing levels of concentration, the ACCC is concerned to limit further consolidation. Accordingly, another option the ACCC has considered as part of the Inquiry is preventing market participants increasing their market share above a certain point by way of acquisition. As highlighted in chapter 2, much of the concentration in the market has come about as a result of acquisition, rather than through new investment.
The ACCC can seek to prevent any mergers or acquisitions under s. 50 of the Competition and Consumer Act 2010 (Cth) (CCA) which have the effect or likely effect of ‘substantially lessening competition’.85 An acquisition that lessens competition, but not substantially, is not prohibited. This means that, in an already concentrated market, s. 50 may not be able to prevent acquisitions of generation capacity by the large incumbent generation businesses. Recent acquisitions of this nature have contributed to the higher levels of concentration we have today. Under the current framework, further acquisitions have the potential to lessen competition even more in a market in which competition is critical to delivering affordable electricity prices for Australian consumers. As noted above, competition is critical to delivering affordable prices in an energy-only market.
In the ACCC’s recent press release in relation to EnergyAustralia’s proposed acquisition of Ecogen Energy (the owner of the Newport and Jeeralang gas-powered generation plants in Victoria), the ACCC stated:
The ACCC has concerns about competition in wholesale electricity markets and this acquisition will effectively entrench existing concentration and vertical integration. However, while we consider this acquisition will lessen competition, it is unlikely to result in a substantial lessening of competition which is the test we must apply.86
A number of submissions to the Inquiry touched on the question of limiting concentration. Some were supportive of intervention, with ERM Power noting it was ‘encouraged’ that the ACCC was considering ‘constraining further consolidation of ownership of existing generation assets’.87 Others were more sceptical, with Alinta warning such a measure may have ‘unintended consequences on reliability and supply and should therefore only be considered as an extreme measure.’88
International experienceLimits on the market share of electricity generation businesses are not unique. Such limits can be found in other jurisdictions around the world. For example, two other energy-only markets which have restrictions of this nature are Texas in the United States and Alberta in Canada.
85 CCA, s. 50.86 ACCC, ACCC won’t oppose proposed acquisition of Ecogen Energy, Media Release, 21 December 2017.87 ERM Power, Submission to ACCC Preliminary Report, 17 November 2017, p. 4.88 Alinta, Submission to ACCC Preliminary Report, 17 November 2017, p. 6.

90 Retail Electricity Pricing Inquiry—Final Report
In Texas, the relevant rules provide that if a company owns and controls more than 20 per cent of the installed generation capacity located in, or capable of delivering electricity to a power region, it must file a market power mitigation plan. In the market power mitigation plan, a company has a number of options including:
�� the sale of generation assets to an unaffiliated person
�� the exchange of generation assets with an unaffiliated person located in a different power region
�� the auctioning of generation capacity entitlements as part of a capacity auction
�� the sale of the right to capacity to an unaffiliated person for at least four years, or
�� any reasonable method of mitigation.89
In Alberta, a market participant is prohibited from controlling more than 30 per cent of the trading rights of generation capacity in the state of Alberta. A market participant is said to control a generation unit where it can determine the price and quantity of offers made to the power pool for all or a portion of the maximum capacity of the unit. The limit covers all dispatchable generation, including that held by entities that are affiliated with the participant.90
Restrictions in other Australian marketsSector specific rules to limit market concentration in Australia are not unprecedented. Several other sectors of the economy have similar limits in place which are administered by the relevant sector regulator. These may seek to address competition or other issues. For example:
�� In airports there is a 15 per cent limit on cross-ownership between certain airports. Specifically, a person cannot hold a stake of more than 15 per cent in Sydney airport at the same time as a stake of more than 15 per cent in any of Brisbane, Melbourne or Perth airports.91 Tighter limits apply to the ability for airlines to have an ownership share of airports.92
�� Separate rules also apply to the media sector that limit acquisitions. The Broadcasting Services Act 1992 (Cth) limits a person controlling more than one commercial television broadcasting licence or more than two commercial radio broadcasting licences in the same area.93 It also includes media diversity rules which prevent media acquisitions (commercial television, commercial radio and associated newspapers) that would result in fewer than five independent media operators in a metropolitan licence area or four in a regional area.94
�� In banking, the ‘four pillars’ policy has been in place for number of years, preventing any merger between the four major banks.
Mechanism to limit further concentrationThe NEM market design relies heavily on there being sufficient competitive pressure to deliver efficient outcomes. Accordingly, special measures are warranted in the wholesale electricity market to limit further concentration. The ACCC does not typically favour market share caps as a means to protect competition, and recognises their limitations in most contexts. However, the ACCC considers that the NEM is a special case and there is merit in adopting a cap on future acquisitions of generation capacity.
The objective of a cap is to limit acquisitions that would result in a market participant acquiring ownership, or controlling the dispatch, of more than 20 per cent of generation capacity in any NEM region or across the NEM as a whole, or extending any market share already above that level by way of acquisition.
While introducing caps on concentration may not have an immediate impact on the market, it is an important safeguard for the future, especially in this period of major market transition.
Such a provision would operate in addition to s. 50 of the CCA and would work to constrain greater levels of concentration. In doing so, the provision would assist in promoting a more competitive market, a key principle underpinning the NEM’s design.
89 Texas Administrative Code, Title 16, Part 2, §25.90.90 Alberta, Fair, Efficient and Open Competition Regulation 159/2009, s. 5.91 Airports Act 1996 (Cth), ss. 49–50, note ‘airport’ refers to either the airport-lessee or airport-management company.92 Airports Act 1996 (Cth), s. 44.93 Broadcasting Services Act 1992 (Cth), ss. 53–54.94 Broadcasting Services Act 1992 (Cth), Division 5A.
91 Retail Electricity Pricing Inquiry—Final Report
Firms owning (or controlling the dispatch of) more than 20 per cent of capacity at the commencement of the provision should not be forced to sell down to a level below the threshold. The provision should only apply to prohibit such firms acquiring control over additional generation capacity (through ownership or other means).
The ACCC is also of the view that current and future investment in new generation capacity should be encouraged. Accordingly, the provision should not apply to increases in a firm’s market share as a result of new investment.
The provision should also have an exception to allow for cases where a market participant with a share of more than 20 per cent is the subject of a takeover offer by (or seeks to sell all of its generation capacity to) a person without any NEM generation capacity at the time of the acquisition.
The ACCC considers that the provision should be drafted based on the following principles:
�� following commencement of the provision, a market participant may not acquire generation capacity that would mean it owns or controls dispatch of (in aggregate) more than 20 per cent of ‘capacity’ in any NEM region or across the NEM as a whole
�� the calculation of ‘capacity’ should: – be based on the nameplate capacity of thermal/dispatchable generation units. For other types
of generation where maximum capacity is infrequently achieved (including renewable solar and wind), that capacity should have an adjustment based on some measure of average dispatch. Similarly, capacity subject to power purchase agreements (PPAs) should have an adjustment based on some measure of average purchases
– account for a market participant’s capacity that is available in adjoining NEM regions, adjusted for interconnector limits across regions
– include the capacity owned or controlled by affiliated entities.
The AER should have responsibility for enforcement of the provision. Its assessment should extend only to whether or not a proposed acquisition (or contractual arrangement) results in the threshold being exceeded. That is, the AER should not undertake an assessment of competition in order to determine a breach of the cap.
Section 50 of the CCA should continue to apply as it does now. In particular, the new provision should not preclude the ACCC from considering (and potentially objecting to) any acquisitions that fall below the 20 per cent threshold under s. 50 of the CCA.
The ACCC considers that the 20 per cent threshold is appropriate in the context of the market structure of the NEM. It should limit the scope for further consolidation involving larger market participants, but not inhibit small players from expanding by way of acquisition, to ensure that there are a sufficient number of generators to deliver competitive outcomes. A higher threshold under this provision (such as 30 per cent) would be undesirable as it would not address the concerns identified with the current levels of concentration in the NEM, including the potential for generators to exercise market power.
To enforce the provision, the AER should have the appropriate investigative powers, and be able to seek injunctions, declarations and divestiture as appropriate to prevent or unwind any such acquisitions. Penalties should apply in line with the highest available penalties under the National Electricity Law (NEL), once increased in line with recommendation 43 (see chapter 16 for further detail on proposed increases to NEL penalties).
Recommendation 1The NEL should be amended to prevent any acquisition or other arrangement (other than investment in new capacity) that would result in a market participant owning, or controlling dispatch of, more than 20 per cent of generation capacity in any NEM region or across the NEM as a whole.
The provision should be designed to prevent market participants circumventing the 20 per cent cap, including by way of ownership structure or contractual arrangements.
92 Retail Electricity Pricing Inquiry—Final Report
4.1.2 Concentration in QueenslandA clear example of market concentration is in Queensland, where the state government owns over 65 per cent of the generation capacity in the region95, through its ownership of the two major generation businesses Stanwell Corporation and CS Energy.
The ramifications of this market structure were demonstrated in the analysis in chapter 3 which showed that Stanwell Corporation in particular has been relatively unconstrained in its bidding and has bid in ways that have had a significant impact on the wholesale price in Queensland.
In recognition of these concerns, and as noted in chapter 3, in July last year the Queensland Government issued a direction to Stanwell Corporation, directing it to change the way in which it bids in the market in order to put downward pressure on wholesale prices. Stanwell Corporation’s response to the direction, as illustrated in chapter 3, saw an immediate reduction in Queensland wholesale prices. Even with record levels of demand over summer 2017–18, spot prices in Queensland were well below the previous summer.
At face value, lower spot prices in Queensland are a good outcome for electricity users. However, the means by which those lower prices were achieved is a temporary behavioural mechanism rather than a sustainable structural one. The current approach to addressing high prices has a number of potential downsides:
�� The change in bidding behaviour occurred suddenly, making it impossible for market participants to prepare for the changes that happened in the spot and hedge market. Retailers and large customers who had purchased hedge contracts prior to the direction would likely have found themselves paying for electricity under contract at much higher contract prices agreed prior to the direction assuming, as was reasonable, that Stanwell Corporation would continue to conduct itself in the market as it had prior to the direction.
�� There has been considerable uncertainty as to the duration of the direction, with no clear timeframe publicly announced, leading to additional uncertainty in the market.
�� The signal from the Queensland Government that it may intervene in the market may also deter future investment. ERM Power noted in its submission to the Preliminary Report that ‘the Queensland Government’s recent decision to direct one of their generators to lower their pricing has had flow on impacts to private generators in the market.’96
The market, including the forward market, relies heavily on market signals to operate effectively. Unpredictable behaviour by a government-owned business disrupts those signals. When prices fell following the direction to Stanwell Corporation, most retail market participants would not have immediately benefited as they would already have been locked in to higher priced contracts. While the low prices that eventuated helped to lower forward contract prices, the uncertainty as to the duration of any direction is problematic and increases the risk associated with these products.
In its submission to the Inquiry’s Preliminary Report, Origin said:
Market concentration in Queensland is at elevated levels following the consolidation of the government owned generators in 2011—a decision that should be reviewed. We note the Queensland Government recently directed its government owned generation business to amend its bidding behaviour. While this appears to have reduced wholesale forward market prices, it is a temporary measure and should not be viewed as a substitute for structural reform.97
The ACCC agrees. A structural solution is clearly preferable for the proper functioning of an energy-only market. Like the government direction, a structural solution will place downward pressure on wholesale prices in Queensland. Unlike the direction, it will not have adverse effects on price signals in the market, and will be enduring in its effect on prices.
Before the direction was made, the Queensland Productivity Commission’s (QPC) 2016 Electricity Pricing Inquiry examined, amongst other things, the impact of different configurations of Queensland generation businesses’ assets on wholesale market prices in Queensland. ACIL Allen modelled a number of scenarios, including allocating the generation assets into three equal sized portfolios which would
95 See figure 2.2 for further details about generation capacity market shares.96 ERM Power, Submission to ACCC Preliminary Report, 17 November 2017, p. 3.97 Origin, Submission to ACCC Preliminary Report, 30 November 2017, p. 11.

93 Retail Electricity Pricing Inquiry—Final Report
result (if created separately from each other) in a decrease in wholesale electricity prices between 2016 and 2024 of about 8.3 per cent.98
The QPC also noted that when the Queensland Government restructured its generation businesses from three to two in 2011, the government indicated that it would refocus the businesses’ corporate strategies from business development and growth to cost and performance efficiency.99 This was intended to provide the private sector with confidence to invest in generation assets.100 However, the QPC found that since the restructure, there has been no private sector investment in new NEM-connected generation capacity in Queensland, and the market share of the government-owned businesses has not fallen as was predicted.101
The current Queensland Government has itself proposed reinstating a third government-owned generation portfolio in Queensland, putting forward the idea that it create a renewable-only portfolio.102 The ACCC agrees that benefits will flow from a third portfolio but does not consider that a third renewable-only portfolio is optimal for competition. The ACCC considers that competition would be best served by the creation of three separate portfolios of a similar size and each with a mix of generation assets. A renewable-only portfolio is unlikely to offer the same level of competitive constraint in the market due to the way renewable generation is typically bid into the market. It will also take time for this third player to build scale in the market if most of its assets are yet to be developed.
Once created, the Queensland Government should ensure that the three portfolios are separately owned and operated by selling at least two of the portfolios. The sale of any portfolios should be in line with recommendation 1. This process should be done with a view to maximising competition in the wholesale and retail electricity markets in Queensland, rather than with a view to maximising the sale price for the Queensland Government. In particular, the portfolios should be sold to different market participants (ideally new entrants) and should not be sold to market participants with significant existing generation capacity in Queensland or NSW.
Should the Queensland Government not proceed with a sale, it should ensure, at a minimum, that the three portfolios are structurally separated and operated on a fully commercial basis, independent from government. That position should be clearly communicated to the market.
Recommendation 2The Queensland Government should divide its generation assets into three generation portfolios to reduce market concentration in Queensland. The three portfolios should be of a similar size with a mix of generation assets to maximise competition in the wholesale market.
Once created, the Queensland Government should ensure that the three portfolios are separately owned and operated to maximise competition in the wholesale electricity market. The sale of any portfolios should be in line with recommendation 1.
4.2 Do market conduct rules need to change?As noted above, in most regions in the NEM, there are no ready solutions available to address high levels of concentration. In order to improve competition in these markets, we need to rely on new entry.
The NEM is somewhat unique by world standards in that it relies heavily on effective competition to deliver lower price outcomes, with a minimal overlay of rules that limit the way in which generators can bid into the market other than the price caps and good faith rebidding rules. Neither of these rules limit participants from using any market power they may have to raise prices in the market.
98 QPC, Final Report: Electricity Pricing Inquiry, 31 May 2016, pp. 90–91.99 QPC, Final Report: Electricity Pricing Inquiry, 31 May 2016, p. 87.100 QPC, Final Report: Electricity Pricing Inquiry, 31 May 2016, p. 87.101 QPC, Final Report: Electricity Pricing Inquiry, 31 May 2016, p. 87.102 Department of Energy and Water Supply (Queensland), Powering Queensland Plan, 5 June 2017.
94 Retail Electricity Pricing Inquiry—Final Report
The market price cap of $14 200/MWh and the cumulative price threshold of $212 800/MWh (a cap on the total market price over seven consecutive days) present an upper limit for customers’ exposure in the market, but do not restrict generator bidding activity.103
The good faith rebidding rules do not seek to restrict the level or price at which generators offer capacity into the market, but rather to ensure that the market is sufficiently transparent to allow for efficient competitive response to expected supply-demand conditions. Revised rebidding rules were introduced in July 2016.104 The revised rules strengthened the requirement for generators to have a genuine intent to honour their bids by replacing the requirement that offers be made in good faith with a prohibition against submitting offers, bids and rebids that are false, misleading or are likely to mislead.105 Any rebids must be made as soon as practicable following a change in conditions that will impact generators’ current offers.106 Generators must also maintain a contemporaneous record of the circumstances surrounding late rebids.107
Electricity markets around the world tend not to rely solely on competition to drive lower price outcomes, but have other mechanisms in place to address market power and market manipulation.
As part of the Inquiry, the ACCC has considered whether the NEM should incorporate additional rules or other mechanisms which seek to mitigate the impact of the exercise of market power in the NEM and address concerns about the potential for market manipulation.
As part of this work, the ACCC asked HoustonKemp to undertake a survey of the different market power mitigation mechanisms and market manipulation rules in key electricity markets around the world (primarily in North America and Europe) (the HoustonKemp international review report).108 This report is available at appendix 9 and on the ACCC’s website.
HoustonKemp’s work reveals that all of the markets it considered do have some form of market power mitigation, and/or market manipulation rules over and above what we see in the NEM. Many of the markets in question are capacity markets where pricing signals in the spot market are not as critical to future investment (and there is therefore less risk in interventions that dilute that price signal), so the comparability to Australia is in many cases limited. However, the energy-only markets considered (New Zealand, Alberta (Canada) and Texas (Electric Reliability Council of Texas (ERCOT)) do have specific mechanisms in place to address market power and/or market manipulation.
The following markets have provisions targeted specifically at mitigating the use of market power:
�� Texas, an energy-only market quite similar to the NEM (but with a day-ahead market as well as a real-time market), has significant regulatory measures in place to control bidder behaviour. This includes the ability to cap bid prices in circumstances where there is a lack of competitive constraint. The lack of competitive constraint is determined based on a combination of the Herfindahl-Hirschman Index (HHI) and whether the generation business is pivotal (that is, whether it is needed to relieve a constraint in the network).109
�� PJM (Pennsylvania, New Jersey and Maryland) operates a capacity market (with both a day-ahead and real-time market). The PJM energy market has a ‘three pivotal supplier test’ which considers whether the level of excess supply in the market results in an adequately competitive market structure. In situations where the test is not met, offers are capped to ensure that the suppliers do not unduly influence the price.110
�� Great Britain operates a capacity market with day-ahead and real-time markets for energy. The Office of Gas and Electricity Markets (Ofgem) has introduced measures to address concerns about generators exploiting periods of transmission constraint to charge excessive prices. The core
103 These are the market price cap and cumulative price threshold values for 2017–18. From 1 July 2018, they change to $14 500/MWh and $216 900/MWh respectively.
104 AEMC, Final Rule Determination: National Electricity Amendment (Bidding in Good Faith) Rule 2015, 10 December 2015. On 10 December 2015, the AEMC made a final rule amending the bidding in good faith provisions in the NER to provide clearer guidance about appropriate generator bidding behaviour. The rule commenced on 1 July 2016.
105 NER, r. 3.8.22A(a).106 NER, r. 3.8.22A(d).107 NER, r. 3.8.22(ca).108 HoustonKemp, International review of market power mitigation measures in electricity markets, a report for the Australian
Competition and Consumer Commission, May 2018 (available at appendix 9).109 HoustonKemp, International review of market power mitigation measures in electricity markets, a report for the Australian
Competition and Consumer Commission, May 2018, pp. 14–15 (available at appendix 9).110 HoustonKemp, International review of market power mitigation measures in electricity markets, a report for the Australian
Competition and Consumer Commission, May 2018, pp. 16–18 (available at appendix 9).
95 Retail Electricity Pricing Inquiry—Final Report
restriction is that a generation business must not obtain an ‘excessive benefit’ from a period in which transmission is constrained. The approach requires prosecution of generators in breach after the event.111
The mechanisms considered by HoustonKemp also include some broad market manipulation powers. Markets with broad market manipulation powers include the following:
�� New Zealand operates an energy-only market like Australia (but with nodal pricing, where separate spot prices are set for each exit or injection point on the grid, and without any price cap). It has rules on undesirable trading situations (UTS) under which the New Zealand Electricity Authority can deem, ex-post, that a UTS has occurred. A UTS is defined as a situation that ‘threatens or may threaten confidence in, or the integrity of the wholesale market’ and cannot be resolved under the New Zealand Electricity Industry Participation Code 2010 (NZ Code).112 This enables the New Zealand Electricity Authority to retrospectively impose administered pricing (among other remedies). Examples of a UTS include manipulative trading activity, trading that is misleading or deceptive, unwarranted speculation and situations that threaten orderly trading. The New Zealand Electricity Authority included in the NZ Code provisions for how the UTS rules will be applied in pivotal supplier situations. These create a ‘safe harbour’ for market participants if they comply with the key principles which include offering all available capacity, and, when the supplier is pivotal, the prices it offers must be no higher than when it is not pivotal. These principles limit the ability of a generator to derive a financial benefit from an increase in price resulting from a change in its bidding behaviour.113
�� Alberta has Fair, Efficient and Open Competition regulations under its Electric Utilities Act 2003 that are tied to more general competition principles (that deal with restricting or preventing competition or a competitive response or market entry by another person), but also has rules to prevent a market participant from ‘manipulating market prices, including any price index, away from a competitive market outcome.’114
�� The European Union (EU) has in place a Regulation on Wholesale Energy Market Integrity and Transparency (REMIT). This regulation is designed to prohibit market manipulation in the EU wholesale electricity markets. In some ways it is similar to the good faith rebidding rules in place in Australia in that it prohibits misleading market behaviour, but it is much more comprehensive. It prohibits a wide range of behaviour that may result in the manipulation of the market, including artificial pricing (which includes physical withholding of capacity) and deliberately buying or selling wholesale products at the close of the market.115
4.2.1 Is there a need for market power mitigation rules in the NEM?The AEMC has previously considered the need for a rule to deal with the use of market power by generators in the NEM, following a rule change request submitted by Major Energy Users Inc. (MEU) in 2010.116 The AEMC, in its final determination of April 2013, rejected the rule change request and instead recommended market monitoring by the AER.117 In doing so the AEMC noted:
A rule as proposed by the MEU, or similar, which seeks to limit occasional price spikes by capping generator dispatch offers is difficult to reconcile with the fundamental features of the NEM. A rule that limits the ability of generators to bid during particular periods in a manner that seeks to recover their efficient costs over time is likely to be detrimental to the NEM investment environment.
111 HoustonKemp, International review of market power mitigation measures in electricity markets, a report for the Australian Competition and Consumer Commission, May 2018, pp. 19–20 (available at appendix 9).
112 New Zealand Electricity Authority, Guidelines for Participants on Undesirable Trading Situations, 20 June 2016, p. 7.113 The New Zealand market manipulation powers are described in more detail in the HoustonKemp international review report at
pp. 9–11 (available at appendix 9).114 Alberta, Fair, Efficient and Open Competition Regulation 159/2009, s. 2(j). The Alberta market manipulation powers are described in
more detail in the HoustonKemp international review report at pp. 11–12 (available at appendix 9).115 The EU market manipulation powers are described in more detail in the HoustonKemp international review report at pp. 21–22
(available at appendix 9).116 MEU, Proposed rule change to enhance generator competition outcomes during high demand periods in the NEM, 15 November 2010. 117 AEMC, Final Rule Determination: Potential Generator Market Power in the NEM, 26 April 2013, p. i.

96 Retail Electricity Pricing Inquiry—Final Report
Even if substantial market power was identified, ex-ante rules like the MEU’s proposed rule would attempt to address the potential ‘symptoms’ rather than the likely causes that have contributed to the situation in which substantial market power could arise, such as the existence of barriers to entry or insufficient competition due to the industry structure. These causes are likely to require solutions that lie beyond the scope of changes to the rules.118
In its evaluation of the proposed rule change, the AEMC determined that its analysis of market outcomes in Queensland, NSW and Victoria did not ‘support a conclusion that there is or has been substantial market power in those regions of the NEM’ at that time.119 For South Australia, the AEMC noted that ‘it is not clear as to whether substantial market power has existed in that region to date’, but accepted that ‘there are some circumstances in which substantial market power could exist and be exercised.’120
The evaluation undertaken by the AEMC, which included an analysis of long-run marginal cost compared to prices, looked at the period 2005–12.121 The market has changed considerably since 2012, with average spot prices reaching record levels in recent years and generator margins trending higher.
The options considered by HoustonKemp indicate that there are many different approaches that can be adopted in an effort to mitigate the impacts of market power in a market. The rule put forward by the MEU involved a capping of offers, which would be quite a blunt instrument.
The ACCC agrees with the AEMC’s assessment that a rule of this nature would address the symptoms rather than the underlying cause of market power. The best solution is to address the underlying structural issues which have resulted in a lack of competitive constraint in the market.
The ACCC has ultimately decided not to recommend the introduction of a market power mitigation rule at this time. The key reason for this conclusion is the ACCC’s finding (from section 3.1.1) that the key cause of higher wholesale prices is less related to discrete instances of market power being used to spike the price and more driven by a subtle and sustained ‘lift’ in prices that can be attributed in part to a lack of competitive constraint. That change in bidding behaviour, especially given it has been adopted by more than one player in the market at the same time, is not readily addressed by the types of mechanism identified by HoustonKemp. The ACCC is also concerned that many of the options identified are likely to be a disincentive to new investment in generation by existing market participants.
Although the ACCC does not consider it appropriate to recommend the introduction of any market power mitigation rule at this time, this question should be revisited periodically, for example once any changes in bidding behaviour can be observed that come about as a result of the move to five-minute settlement in 2021 which will be a major transition in the market.122 The ACCC considers that as part of the AER’s ongoing monitoring of the wholesale market (which we propose be expanded in line with recommendation 41), it is well placed to keep these options under consideration.
4.2.2 Is there a need for market manipulation rules in the NEM?While we do not consider there is a need for a market power mitigation rule to be introduced at this time, the ACCC supports the introduction of a broader market manipulation rule, including powers to prevent businesses from exploiting cross-market positions (across physical and financial markets).
The existing good faith rebidding rule focuses only on the accuracy of information provided in the market and does not address behavioural conduct related to possible manipulation. While clear instances of manipulation are not a major feature in the market today, such a rule is likely to be of increasing importance given the stronger links between the wholesale and contract markets envisioned under the draft design of the NEG.
The AER has broad market manipulation powers in respect of its enforcement of gas market supply hubs. These powers are designed to prevent participant behaviour that is fraudulent, dishonest, misleading or in bad faith, or that is undertaken with the intent of distorting or manipulating prices
118 AEMC, Final Rule Determination: Potential Generator Market Power in the NEM, 26 April 2013, p. v.119 AEMC, Final Rule Determination: Potential Generator Market Power in the NEM, 26 April 2013, p. i.120 AEMC, Final Rule Determination: Potential Generator Market Power in the NEM, 26 April 2013, p. i.121 AEMC, Final Rule Determination: Potential Generator Market Power in the NEM, 26 April 2013, p. iii.122 See chapter 2 for further information about the AEMC five-minute settlement rule change.
97 Retail Electricity Pricing Inquiry—Final Report
(including reported prices).123 The ACCC considers that the current rules in relation to gas market supply hubs represent a good framework on which to base an equivalent rule for the electricity market.
Given the wide scope of conduct which may amount to manipulation, it is not possible to craft a highly specific set of rules. Rather, the rule needs to be principle-based in its application. This is consistent with the rules that apply to the gas supply hubs and to the market power manipulation rules described above. By way of illustration, the following are some examples of cases involving the application of similar such powers around the world:
�� Alberta: in 2015, the Alberta Utilities Commission found that TransAlta, a Canadian electricity company, had timed the discretionary outages of some of its coal-fired plants in a manner that would increase prices in the Alberta wholesale electricity market. These outages could have been timed for off-peak hours but instead occurred during peak periods. In those same periods, TransAlta altered its bidding at its operational power plants (for example, altering a bid from less than C$30/MWh to over C$890/MWh). During one outage, the capacity outage combined with the altered bidding activity led to a marginal price of C$645/MWh. The Alberta Market Surveillance Administrator estimated that this was equivalent to a price increase of 2100 per cent compared with the counterfactual price at the same level of dispatch. TransAlta was found to have engaged in conduct that violated the Fair, Efficient and Open Competition Regulation, including the rule prohibiting ‘manipulating market prices, including any price index, away from a competitive market outcome’. TransAlta agreed to pay an administrative penalty of C$52 million.124
�� Spain (EU): in 2015, the Spanish National Commission on Markets and Competition (CNMC) found that Iberdrola, a Spanish energy company, engaged in a strategy to increase prices in the Spanish wholesale electricity market by withholding capacity from three of its hydroelectric plants over a three-week period, even though it had sufficient water reserves. Iberdrola’s strategy was intended to create an opportunity for in-merit entry by higher-priced gas plants to secure a higher market price than would otherwise have arisen. The CNMC concluded that the market price increased by €7/MWh and the estimated benefit for Iberdrola was around €21.5 million (around 9 per cent of its revenue in the day-ahead market in that period). Iberdrola’s conduct, which led to artificial market prices that did not reflect available production capacity or fundamental market data, constituted market manipulation prohibited by REMIT. The CNMC imposed a fine of €25 million.125
�� United States: in 2016, the US Federal Energy Regulatory Commission (FERC) took enforcement action against Etracom, a financial trading firm for wholesale electricity market products, for cross-market manipulation of California electricity markets. FERC alleged that Etracom submitted uneconomical virtual supply bids to artificially lower the day-ahead pricing and create import congestion into California. Etracom held congestion revenue rights (CRR) which allowed it to earn revenue when there were different prices in different locations due to import or export congestion. Etracom’s conduct therefore enabled it to earn profits on its CRR positions. FERC estimated that Etracom earned US$315 000 from its market manipulation behaviour. The matter was settled in 2018 when Etracom agreed to pay a fine of US$1.9 million.126
Any market manipulation rule would need to be supported by stronger information, investigation and enforcement powers for the AER. As noted in the Preliminary Report, an investigation of market manipulation requires the assessment of the bidding conduct (and the reasons for bidding behaviour) of specific individuals within a generation business. It is therefore important that the AER can access relevant information to make this assessment.
While the AER has investigation powers under the NEL and can require generators to produce documents and provide information in relation to their bidding activities, it does not have the power to require any individual involved in conduct to appear before it and give oral evidence. This is a significant deficiency in the AER’s powers in this context. The ACCC therefore supports COAG’s
123 National Gas Rules, rr. 542–545.124 Market Surveillance Administrator v TransAlta Corporation (27 July 2015), 3110-D01-2015 (Alberta Utilities Commission) and Market
Surveillance Administrator Allegations against TransAlta Corporation et al (Request for Consent Order) (29 October 2015), Decision 3110–D03-2015 (Alberta Utilities Commission). This case is described in more detail in the HoustonKemp international review report at p. 12 (available at appendix 9).
125 Resolución del procedimiento sancionador incoado a Iberdrola Generación, S.A.U. por manipulación fraudulenta tendente a alterar el precio de la energía mediante el incremento de las ofertas de las unidades de gestión hidráulica de Duero, Sil y Tajo, SNC/DE/0046/14. See also, Bird & Bird, Spanish authority fines Iberdrola €25m in first REMIT market manipulation infringement decision, News article, 4 February 2016.
126 ETRACOM & Michael Rosenberg, 155 FERC ¶ 61,284 (2016) and FERC v. ETRACOM, No. 2:16-cv-01945-SB (E.D. Ca.).
98 Retail Electricity Pricing Inquiry—Final Report
proposal to extend the AER’s powers to include the ability to compel oral evidence127, which is set out in recommendation 45. Penalties for breaches under this provision should be the highest available penalties under the NEL (see chapter 16 and recommendation 43 for further detail on proposed increases to NEL penalties).
The AER’s ability to enforce a market manipulation rule, and particularly cross-market behaviour, also requires greater transparency of contract market activity. The ACCC’s recommendation in chapter 5 for a registry of contract market trades is therefore crucial.
Recommendation 3The NEL should be amended to provide the AER with powers to address behaviour which has the effect of manipulating the proper functioning of the wholesale market, together with the necessary investigation powers and appropriate remedies.
The current market manipulation powers in respect of gas market supply hubs represent a good framework for equivalent powers in respect of the electricity market.
4.3 Are signals for investment working effectively?As the NEM is an energy-only market, limited periods of high prices are not unusual and are essential to encourage investment in new generation.
What can be difficult is distinguishing high prices which are simply an efficient signal for new investment, and high prices which persist because the market is not working effectively due to a lack of efficient entry taking place.
The NEM has, until recently, appeared to have operated well in respect of eliciting a market response to signals of an over- or under-supply of generation capacity. For example, generation capacity was added in South Australia after a period of high prices in the first two years of the market operating, and more generally there was a spike in investment across the NEM following high prices in 2006–07 and 2007–08. Likewise, a period of falling demand from 2009 led to an over-supply of capacity and historically low wholesale prices. This saw a number of generators mothball plant or exit the market, resulting in a contraction of supply.
Over the past two years, we have seen wholesale prices rise well above historic levels (see chapter 2). While some of this price rise has been driven by increases in gas and coal fuel costs, supply conditions have also tightened following the closure of a number of generators, including the Northern and Hazelwood power stations (as discussed in chapter 3).
To the extent that higher prices are being driven by a tighter supply-demand balance, and these conditions are forecast to persist, we would expect these price signals to lead to an investment response. If this does not occur, it may indicate there are barriers to entry that pose a risk to effective competition in the wholesale market.
Submissions to the ACCC, our discussions with market participants, and internal documents from generation businesses produced to the ACCC, indicate a range of factors that potential investors in wholesale markets take into consideration, including government policy, regulatory approvals for construction, financing limitations, fuel prices, obligations to meet AEMO requirements, environmental regulations, and safety requirements.
4.3.1 Investment financingNew large-scale generation projects require considerable upfront investment and carry significant risk given the difficulty in predicting future electricity prices. Where such projects are proposed by new entrants without a stable long-term downstream customer base, they are unattractive for traditional financing.
To guarantee funding, financiers of such projects typically require the project developer to find customers who commit to purchasing output from the project at a fixed price for an extended period
127 COAG Energy Council, AER Powers and Civil Penalty Regime Consultation Paper, Senior Committee of Officials, June 2018, p. 8.

99 Retail Electricity Pricing Inquiry—Final Report
(through a PPA or an offtake agreement). This has been an increasingly common model for investment in the NEM, particularly with many large electricity retailers signing up to PPAs. In recent times, smaller retailers and some corporate and industrial customers have also backed new projects. For example, we have seen a range of organisations including Telstra, Australia Post, major banks, universities and local councils signing up to new projects on their own or through a consortium. Very recently we have seen the successful culmination of the South Australian Chamber of Mines and Energy’s (SACOME) process to jointly procure energy on behalf of some of its members through an agreement with SIMEC ZEN Energy.128 We have also seen a solar farm developed by Sun Metals as a means of self-supply begin operation.129 Further examples are set out in chapter 18.
The ACCC welcomes these developments as they are bringing additional generation capacity to the market and enabling these customers to directly benefit from that generation through competitive prices.
Despite this trend, the ACCC has received confidential feedback from a number of market participants (project developers, smaller retailers and large industrial or manufacturing customers) who have indicated that they are constrained in their ability to support new investment. These participants cited an inability of certain customers to commit to a long-term contract (PPAs are usually in the order of 10 years) or insufficient credit-worthiness as the main reasons why they have been unable to finance projects.
These customers are often prepared and able to commit to shorter-term agreements, say five years, but that is typically insufficient to underwrite an electricity generation project. To obtain financing on that basis, the developer would need to charge a much higher price per MWh in order to recoup its investment over the shorter period, and that price would be uncompetitive.
This results in a market failure where some large industrial or manufacturing customers with high electricity needs are unable to invest in, or sponsor, low-cost sources of generation in the same way that major electricity retailers or some large corporate customers have done.
The ACCC believes it is critical to ensure that challenges with project financing do not preclude large industrial and manufacturing customers from gaining access to the benefits of independent new low-cost generation in the market. As well as directly benefitting the business in question, such investment will support the development of a competitive market by introducing additional independent supply and reducing concentration.
Where private sector banks are unwilling to finance projects due to uncertainty about the future of an industrial or manufacturing business, the ACCC considers there is a role for the Australian Government in providing support for such projects in appropriate circumstances. This can be achieved at little cost to government. Specifically, the ACCC proposes the government introduce a program under which it will guarantee offtake from a new generation asset (or group of assets) in the later years of the project (say years 6–10 or 6–15) at a low fixed price sufficient to enable the project to meet financing requirements.
It is intended that the fixed price of the government option would be significantly lower than the price paid by the foundation customers, but at a level that would enable the project to secure debt financing. For example, it may be that the relevant fixed price today would be around $45–50/MWh for dispatchable capacity. The government acting as the offtake customer would be a fallback option and could be supplanted by the asset owner instead selling the capacity to an alternative commercial customer. As the government would only be buying energy at a low price, the owner of the generation facility would be incentivised to continue to seek commercial customers for the later years of output from the project rather than exercise the government option.
Should prices fall significantly, the government may be exposed to a fixed price under the agreement that exceeds the spot price. However, given the low commitment price, that would only happen if spot prices fell to very low levels. In these circumstances, there would be significant benefits to the market as a whole of low wholesale electricity prices.
128 SACOME, SACOME Joint Electricity Purchasing Group awards long-term supply contract to Sanjeev Gupta’s SIMEC ZEN Energy, Media Release, 8 June 2018. The ACCC authorised 27 participating members to establish the SACOME joint electricity purchasing group (ACCC, The South Australian Chamber of Mines and Energy Inc & Ors–Authorisation–A91567 & A91568, 17 May 2017 and varied on 16 August 2017). The SACOME members who ultimately reached an agreement with SIMEC ZEN Energy are: Viterra, Central Irrigation Trust, Hillgrove Resources Limited, Foodland Supermarkets and Adchem (Australia) Pty Ltd.
129 See chapter 18 for further details about the Sun Metals solar farm.

100 Retail Electricity Pricing Inquiry—Final Report
This government support would not be available to all projects. To qualify, a project proposal must:
�� have at least three customers who have committed to acquire energy from the project for at least the first five years of operation
�� not involve any existing retail or wholesale market participant with a significant market share (say a share of 10 per cent or more in any NEM region)
�� be of sufficient capacity to serve the needs of a number of large customers
�� be capable of providing a firm product so that it can meet the needs of C&I customers.
The program should be open to all generation technologies. A key determinant of whether the project receives support should be the offtake price required to support the project and the duration of any government support.
The intention of the program is to provide a means for C&I customers to directly source their full electricity requirements from a party other than an existing retailer. To achieve this, projects must be able to offer firm electricity supply that matches the consumption profile of the relevant customer. That firming could be provided through various forms of generation, storage or through contractual instruments.
The program will need to be administered by an appropriate government agency. In determining an appropriate agency, the government should take into account the need for expertise in energy markets and financing. Other than the program being technology neutral, it may be that the Clean Energy Finance Corporation (CEFC) could be an appropriate choice given its current mandate is to assess and finance a range of projects, including electricity generation projects.130
The program should be open to applications for a limited period (but at least four years). Before the end of that period it should be reviewed for its effectiveness and ongoing need. If no successful applications are made during this period, the project will end without any obligations on the Australian Government.
Recommendation 4The Australian Government should operate a program under which it will enter into low fixed-price (for example, $45–50/MWh) energy offtake agreements for the later years (say 6–15) of appropriate new generation projects which meet certain criteria. In doing so, project developers will be able to secure debt finance for projects where they do not have sufficient offtake commitments from C&I customers for later years of projects. This will encourage new entry, promote competition and enable C&I customers to access low-cost new generation.
The program should operate for at least a four-year period, with support provided for qualifying projects. To qualify, a project proposal must:
�� have at least three customers who have committed to acquire energy from the project for at least the first five years of operation
�� not involve any existing retail or wholesale market participant with a significant market share (say a share of 10 per cent or more in any NEM region)
�� be of sufficient capacity to serve the needs of a number of large customers
�� be capable of providing a firm product so that it can meet the needs of C&I customers.
4.3.2 Need for stable and integrated climate policySubmissions to the ACCC, and the ACCC’s discussions with market participants, have made clear that market participants believe a failure to implement consistent, enduring environmental policy in the electricity sector has resulted in significant investment uncertainty. Policy changes have included the implementation and repeal of a carbon price within two years, three major changes to the target and scope of the RET over the past 10 years and a proliferation of state level initiatives promoting renewable energy projects.
130 CEFC, Corporate Plan 2017–18, pp. 5–6 and 10–11.

101 Retail Electricity Pricing Inquiry—Final Report
For example:
�� ERM Power submitted that ‘policy uncertainty is likely preventing any meaningful new entry into the market. Until a climate and energy policy such as the National Energy Guarantee is finalised and implemented with bipartisan support this is likely to continue. It may also continue if states such as Victoria and Queensland continue to push ahead with their own schemes to support renewable energy.’131
�� Origin submitted that one of the challenges to new investment in the NEM is enduring policy uncertainty and that ‘[e]missions reduction policy has been particularly problematic, with an extended period of uncertainty around the Renewable Energy Target and years of speculation about a carbon price preceding its introduction in July 2012, and removal two years later.’132
�� AGL submitted that ‘ongoing policy uncertainty, particularly in relation to federal and state based environment schemes, has undermined investor confidence in the NEM.’133
�� Alinta submitted that ‘the biggest barrier to investment is the lack of certainty on energy policy which only a bipartisan national energy policy approach could address’.134
�� Momentum Energy submitted that an orderly transition to new generation technologies ‘requires policy certainty and we hope that the National Energy Guarantee will provide this to some degree…’.135
�� The Tasmanian Small Business Council submitted that ‘uncertainty about carbon reduction policy is contributing to investment uncertainty and higher wholesale prices in the NEM, with Tasmania impacted by virtue of its links to the NEM wholesale market’.136
This concern has been raised many times before, including in the Finkel review, which said this uncertainty is ‘undermining investor confidence, which in turn undermines the reliability of supply of electricity and increases costs to consumers’.137
While there may be different views as to how significant policy uncertainty is to investment decisions, there is no question that it is a view widely held by industry. Given that an energy-only market will not produce efficient outcomes where there are barriers to investment, it is an issue that needs to be addressed.
Some policy interventions themselves also have the potential to create additional uncertainty about likely market outcomes that may deter investment. For example (and as discussed below), the LRET provides out-of-market compensation to renewable generators that can distort how those generators participate in the wholesale market. This affects the profitability of all other generators.
The ACCC considers it critical for there to be a stable energy policy in Australia which incorporates the need for Australia to meet its climate policy obligations but at the same time does not distort the way in which new generation capacity enters the market.
The ACCC notes the announcement of the NEG in October 2017 and the subsequent work conducted by the ESB in refining that policy proposal. The NEG aims to align greenhouse gas emissions goals and NEM system reliability targets into a single policy framework.
Since the ESB released more detail in April 2018, market participants have generally supported the NEG as being capable of dealing with policy uncertainty concerns. For example, Meridian Energy in its submission to the ESB noted that:
Provided some sensible safeguards are built in however, it has the potential to break the deadlock and deliver policy stability to the market. This will enable the required investment in new generation and technologies that our evolving market demands.138
131 ERM Power, Submission to ACCC Preliminary Report, 17 November 2017, p. 3.132 Origin, Submission to ACCC Preliminary Report, 30 November 2017, p. 2.133 AGL, Submission to ACCC Preliminary Report, 17 November 2017, p. 11.134 Alinta, Submission to ACCC Preliminary Report, 17 November 2017, p. 6.135 Momentum Energy, Submission to ACCC Preliminary Report, 17 November 2017, p. 4.136 Tasmanian Small Business Council, Submission to ACCC Preliminary Report, November 2017, p. 4.137 Dr Alan Finkel AO, Chief Scientist, Chair of the Expert Panel, Independent Review into the Future Security of the National Electricity
Market, Blueprint for the Future, June 2017, p. 5.138 Meridian Energy, Submission to the ESB on the National Energy Guarantee Draft Design Consultation Paper, 7 March 2018, p. 1.

102 Retail Electricity Pricing Inquiry—Final Report
The key advantage of the NEG is its integration of climate policy within broader energy policy. It will encourage investment in the market to be at a specified level of emissions intensity, but unlike the RET, that generation will need to rely on revenue in the market itself rather than distorting the market through incentives provided by out-of-market compensation. The ACCC considers that provided the NEG is appropriately designed, it has the potential to address policy uncertainty concerns in the market.
Recommendation 5The National Energy Guarantee seeks to provide a settled policy framework under which new investment is encouraged in a way that enables achievement of the objective of reducing carbon emissions at low-cost while promoting investment in a manner that ensures demand for energy is met.
The ACCC agrees that this is an important policy objective and, with the policy incorporating appropriate safeguards for competition in the contract market, recommends that governments commit to develop and implement the National Energy Guarantee.
4.4 Marginal generation and fuel costsAs noted in chapter 3, one of the key factors in recent price increases has been gas generation setting the price in the market more often, alongside the rise in gas prices. This has been particularly evident in South Australia and Victoria. Chapter 3 also noted that in setting their prices, some coal generators are often shadowing the new higher gas prices.
While the significant increase in renewable capacity will help to put some downward pressure on electricity prices, reductions in gas prices would also assist, in particular given the likely significant role of gas generation as a source of firming to complement renewables.
The ACCC acknowledges that in some cases high electricity prices may be driving demand for gas. That is, in an environment where higher electricity prices are persisting, there is an incentive for gas-powered generators to increase output to take advantage of higher prices. To obtain gas to generate more electricity, these generators may be bidding up the price of gas. This is more likely to create a short-term impact on gas prices at times of ‘volatility pricing’.
The ACCC is of the view that further efforts to increase the volume of gas available will contribute to lower gas prices, including for gas-powered generation. Continuing lower gas prices will, as highlighted by the work conducted by HoustonKemp and discussed in chapter 3, lead to lower electricity prices.
As the ACCC has observed in a number of its gas inquiry reports, exploration and development which increase the supply and diversity of supply of lower-cost gas (particularly in southern Australia) will clearly have the biggest impact on the gas market on the East Coast and would be the most effective way of driving gas prices to lower levels.139 In this regard, the ACCC remains firmly of the view that moratoria and regulatory restrictions in Victoria, NSW and Tasmania are impeding or preventing onshore exploration and development of potential gas resources. For this reason, the ACCC echoes the East Coast Gas Inquiry’s recommendations that governments adopt regulatory regimes to manage the risks of individual gas supply projects on a case-by-case basis rather than using blanket moratoria. Governments should take into consideration the significant effects that moratoria and other restrictions may have on gas users.
The recent announcement of the development of an LNG terminal at Port Kembla in NSW is a positive development.140 The new terminal will be able to import up to 100 PJ of gas each year, which is around 70 per cent of total gas needs in NSW.141 In June 2018, AGL has also announced that it has recently executed a number of key agreements in relation to its proposed LNG import jetty at Crib Point in Victoria.142
139 ACCC, Gas Inquiry 2017–2020, Interim Report, 25 September 2017, pp. 69–70; ACCC, Gas Inquiry 2017–2020, Interim Report, 13 December 2017, p. 64.
140 Australian Industrial Energy, Australian Industrial Energy consortium selects Port Kembla, NSW for landmark LNG import terminal and enters feed, Media Release, 4 June 2018.
141 Australian Industrial Energy, Australian Industrial Energy consortium selects Port Kembla, NSW for landmark LNG import terminal and enters feed, Media Release, 4 June 2018.
142 AGL, AGL reaches key milestones for proposed LNG import jetty, Media Release, 12 June 2018.
103 Retail Electricity Pricing Inquiry—Final Report
Such terminals could increase the diversity of and/or volume of gas available for supply in the domestic market, potentially offering gas buyers an alternative supply source to the existing domestic gas producers, LNG producers and gas retailers. However, the price of this gas will be governed by international gas prices (spot or contract) and the shipping and re-gasification costs of bringing the gas to the terminal. They are unlikely to have a significant lowering effect on domestic gas prices. These proposals may, however, act as a cap on domestic gas prices in southern Australia.
In addition, the ACCC’s current gas inquiry is continuing to monitor and identify initiatives to deliver better outcomes in gas markets across Australia which will likely have some flow on benefits for the cost of gas-powered generation.
4.5 ConclusionThe NEM wholesale market is going through a significant transition. The increasing penetration of renewables will continue as will the progressive exit of large coal-fired generation. At the same time, we will see the implementation of recommendations from the Finkel review and major rule changes come into effect, such as the move to five-minute settlement. The NEG, if adopted, will be another significant change in the market.
As a result, there will be a level of ongoing instability that is likely to be reflected in price outcomes in the market for the foreseeable future. While the energy-only market has many benefits, the downside is that it comes with the risk of volatility as prices change in accordance with the supply–demand balance and the levels of investment in the market. That volatility creates challenges for governments and for energy consumers.
As noted above, it is critical that the market receives the right signals for investment to achieve the best outcome from the market design. Given the risks, and likely continuing government, community and business concerns, the AER’s new role in performing ongoing monitoring of the wholesale market is important to ensure that the market is functioning as it should. To facilitate the AER’s role, we also propose that the AER’s functions be expanded in line with recommendation 41.
In the next chapter we will be recommending greater access for the AER, AEMO and AEMC to OTC contract data (see recommendation 6). This will further enhance the AER’s ability to monitor these markets and to bring to light any issues which emerge on the path ahead.
104 Retail Electricity Pricing Inquiry—Final Report
5. Contract markets and their impactsBetween the wholesale electricity market and retail electricity market is a financial contracting market. This contracting (or ‘hedging’) market assists wholesalers and retailers to manage the risk associated with price volatility in the wholesale market. The contracts agreed to in this market influence the overall cost each retailer incurs for wholesale electricity, and therefore retail prices charged to consumers.
NEM contract markets have been the subject of a number of concerns in recent years, including through submissions to this Inquiry. In particular, it has been suggested that:
�� the markets are not working sufficiently well for small and standalone retailers to effectively manage their wholesale risk
�� the markets advantage larger retailers by providing them with cheaper access to wholesale electricity compared to small retailers. This concern is exacerbated by large retailers being vertically integrated and therefore supplying contracts to their retail competitors
�� there is a trend towards vertical integration143, which has reduced liquidity and lessened the ability of participants to effectively manage their risk.
Concerns have also been raised about the ‘over-the-counter’ (OTC) contract market. Activity in this market is not disclosed publicly, which impairs market information regarding price signals and liquidity. The opacity of the OTC market also contributes to concerns about price discrimination against smaller retailers.
The focus on NEM contracting markets has been intensified by the government’s proposed NEG policy. As noted in chapter 4, the NEG aims to align carbon emissions goals and NEM system reliability targets into a single framework that operates through these contracting markets. The effectiveness of these contracting markets will therefore be crucial to achieving the NEG’s aims.
To assess concerns about contract markets, the ACCC sought information from a broad range of retailers in the NEM regarding their hedging activities. The information obtained included internal documents setting out risk management policies and strategies, and copies of contracts for particular types of hedges.
The ACCC also sought data:
�� to understand the degree to which different sized retailers are able to use hedging markets to manage their wholesale risk. The ACCC reviewed the hedging each business has in place (either through vertically integrated generation, ASX trading, or OTC trading), and how this compares to their demand for electricity
�� to shed light on the OTC market and assess market dynamics. The ACCC compiled a data set of all OTC swap and cap trades entered into by these retailers since 1 July 2015
�� to assess the practices of vertically integrated businesses. The ACCC sought transfer price information from most vertically integrated businesses in the NEM.
The ACCC found that small retailers have significantly fewer options for trading hedge contracts. The causes of this disadvantage are complex, but result in some small retailers being limited in their ability to manage wholesale risk effectively (see section 5.2).
For vertically integrated retailers, the ACCC found that transfer prices are generally set to prioritise wholesale profit over retail competitiveness. The ACCC also found some concerning instances of transfer prices set significantly above comparable wholesale cost metrics (section 5.4.2).
The ACCC’s OTC trading data set allows us to provide market summary information and assess dynamics both within the OTC market and in comparison to the ASX market. The prices paid for hedges in the ACCC’s OTC data set are generally lower than ASX prices for comparable products (see section 5.3.3).
143 The line between a vertically integrated ‘gentailer’ and a standalone retailer or generator is not always clear. For example, a large retailer with a very small amount of generation capacity is technically vertically integrated, but faces a risk management problem much closer to that of a standalone retailer. Similarly, a retailer that has PPAs in place with a number of intermittent renewable generators may be hedged with more generation capacity than needed for their retail load, but not have the same risk management certainty and flexibility as the owner of a large thermal plant that can be dispatched on command. In general, this chapter considers vertical integration in the context of retail businesses that own large thermal plants.

105 Retail Electricity Pricing Inquiry—Final Report
The ACCC also found that the big three are, on average, able to achieve lower prices than other retailers in the OTC market. The ACCC did not find a comparable result based on vertical integration alone, which may reflect the presence of a number of smaller vertically integrated players (see section 5.3.4).
Finally, the ACCC sets out some implications of these findings in the context of the NEG, particularly regarding the eligibility of OTC contracts to meet NEG requirements and the proposal to impose market making obligations on vertically integrated players (see section 5.5).
NEM hedging markets are secondary markets. They trade derivative contracts, the value of which is largely determined by competitive dynamics in the primary electricity markets: the wholesale spot market and the retail electricity market. The competitive dynamics of contracting markets are therefore likely to reflect competition in those primary markets. The ACCC notes that the recommendations in this report to improve competitive dynamics in the wholesale and retail markets will have positive flow on effects to contracting markets.
The ACCC is also recommending two contract market-specific recommendations. The first is that OTC trades be reported to a repository and publicly disclosed in a de-identified format (see section 5.3.5). This will provide enhanced information about market liquidity and forward prices to market participants and regulators. The second is that market making obligations be introduced in South Australia (see section 5.4.4). Contract market activity in South Australia has been persistently low for many years. Introducing market making obligations will improve trading activity in South Australia. The effect of the obligations can be reviewed in future to determine if they should remain in place, and possibly be expanded to other NEM regions.
5.1 Overview of contracting in the NEMThe spot price of electricity in each NEM region is set at 30-minute intervals (as the average of six underlying five-minute ‘dispatch’ prices). Most consumers do not pay this variable price. Instead, their electricity retailer plays an important role in managing the risk on behalf of consumers by purchasing large quantities of electricity on the wholesale (NEM) market and charging each customer a fixed price per unit of electricity. The difference between the fixed price that consumers pay and the variable spot price determined every 30 minutes in the NEM creates significant risk for retailers. For example, a retailer may sign up new customers at a particular fixed price but then incur higher-than-expected prices in the wholesale market. Such situations can leave the retailer substantially out of pocket.
Further up the supply chain, generators face a similar but opposing risk. The 30-minute spot price represents a highly volatile and uncertain stream of revenue. Relying solely on this uncertain revenue stream would introduce significant risk when planning business activities and investment decisions.
Both generators and retailers can mitigate these risks by agreeing to contract for wholesale electricity at a set price. These contracts are often referred to as ‘hedges’ and come in many different forms.144 In practice, there are many types of hedge contracts and more participants in hedge trading markets than just generators and retailers. A number of financial institutions buy and sell hedges as speculators or as a service for clients with electricity needs. As market conditions or a participant’s needs change, the participant that bought a hedge may later sell it back into the market rather than hold it to maturity.
There are two main types of wholesale electricity risks that retailers and generators face:
�� price risk, which is described above. NEM spot prices vary significantly and can expose participants to uneconomically high or low prices
�� volume risk, which relates to the quantity of electricity needed.
In practice, volume risk is very difficult to perfectly hedge against. Most hedging contracts are for a fixed volume of electricity with very little ‘shape’ in the contract (that is, the amount of electricity covered by the hedge does not vary during the period of the contract), so a retailer will almost always have residual exposure to spot prices as their demand fluctuates throughout each day.
144 Hedges are financial (as opposed to ‘physical’) agreements; that is, hedges do not determine to which retailer each generator’s electricity actually flows. Hedging contracts balance out the payments made (received) by retailers (generators) in the NEM wholesale market. For example, under a common type of hedging contract known as a ‘swap’, if the relevant NEM spot price is higher than the price agreed under the hedging contract, the generator (who received the high price) would return the difference in prices to the retailer (who paid the high spot price). Balancing payments flow the other way when prices are lower than the agreed price. These balancing payments result in the retailer incurring a fixed cost per unit of electricity, and the generator receiving that fixed price for each unit.
106 Retail Electricity Pricing Inquiry—Final Report
There are a number of strategies retailers can use to manage wholesale risk. The main tools are hedge contracts and vertical integration. Section 5.2.1 sets out how these strategies work in practice.
The most common hedge type, a ‘swap’, is useful for hedging relatively certain or stable loads, whereas a ‘cap’ hedge is more suited to mitigating exposure to sudden spikes in demand and price. The amount of electricity a retailer needs will change over the day. For example, a spike in demand is common in the early evening as residential users return from work. A lull of low demand overnight is also common. Purchasing the right types of contracts to match up with this load profile is an important element of electricity risk management.
Some retailers, especially smaller retailers, opt to use an ‘all-in-one’ hedge called a load-following hedge, in which the price per unit of electricity needed by the small retailer is fixed, but the volume of electricity contracted under the hedge is allowed to vary with the retailer’s needs. Load-following hedges are typically more expensive (per unit of electricity) as the provider of the hedge is exposed to the buyer’s volume risk.
The contract market affects the incentives faced by generators in the NEM spot market. A generator that sells a swap contract has an obligation to pay the buyer of that contract the difference between the spot price and contract price anytime the spot price is higher. The generator therefore has a strong incentive to be dispatched (and receive the spot market price) during the period of the contract. Any compensation payments to the buyer of the contract will be additional costs to the generator. A strong contracting market therefore incentivises generators to bid into the spot market at a price that makes it likely they are dispatched.
Different types of generators are suited to selling different types of hedges: a constant, baseload generator is a natural supplier of swap contracts, whereas peaking generators (which generally only start up when demand, and therefore price, is high) are natural suppliers of caps.
5.1.1 Markets for hedge contractsHedges are bought and sold in two main markets: the ASX and a bilateral contracts market referred to as the OTC market. The ASX is an exchange trading platform that facilitates anonymous trades between parties, through participating central clearinghouses. These characteristics mean it is typically a more active market place for traders but only trades a limited set of relatively homogeneous hedge types. The OTC market is bilateral between businesses, which allows them to trade products that are not on the ASX and to negotiate bespoke contracts. However, in the absence of central clearinghouses, the parties have to manage counterparty risk (for example credit risk) themselves.
By operating as a public trading exchange, the ASX also provides observers and participants with signals about current and future electricity prices. Industry participants are able to ascertain expected future movements in the price of wholesale electricity by monitoring the trading of hedges for current and future periods. This information informs investment decisions and business strategies for retailers, generators, and other stakeholders. A depiction of forward prices derived from ASX trading data is provided in chapter 2 (figure 2.6).
The OTC market on the other hand is opaque. Businesses are not required to disclose their transactions, so market participants only know the details of their own OTC trades. The general dynamics of the OTC market are therefore not transparent to all market participants and observers. As part of the Inquiry, the ACCC used its compulsory information gathering powers to undertake a detailed survey of OTC market activity. The findings of this survey are presented in section 5.3.
5.1.2 Risk management and vertical integrationThe ASX and OTC markets are platforms where retailers and generators can hedge their wholesale price risk using contracts. Another risk management option for sellers and buyers of electricity is to vertically integrate with each other.
For retailers, vertical integration creates a flexible hedge against wholesale prices. So long as the generator is being dispatched in the relevant period, any wholesale price spikes faced by the retailer are offset by the same price spike generating additional revenue for the generator. The degree to which vertical integration mitigates wholesale price risk will depend on the size of the retailer’s load and on the size and type of generation capacity.

107 Retail Electricity Pricing Inquiry—Final Report
Larger retailers with more stable load profiles and with a variety of generation assets can more effectively take advantage of vertical integration as a hedge. However, even these companies are unlikely to have the right mix of generation assets in each NEM region to offset their local customer loads completely. For these reasons, vertical integration is likely to be only one part of a retailer’s risk management strategy.145
The NEM has seen significant vertical integration between retailers and generators. A number of stakeholders have raised concerns about the effect this vertical integration has had on hedging markets. The ACCC’s assessment of these issues is presented in section 5.4.
5.2 The ability of different retailers to hedge their riskA number of submissions suggested that the contracting market is working well in general. Finncorn Consulting noted that the presence of standalone retailers suggests that they are able to use contracts to manage their wholesale risk effectively.146 Origin stated that the volume of traded contracts appears to be sufficient for the non-integrated entities to manage their loads.147 EnergyAustralia noted that there are a number of different risk management strategies that can be used by non-integrated retailers to manage their risk, including vanilla ASX and OTC contracts, tailored contracts, and other instruments such as PPAs.148
Some of these submissions acknowledged that liquidity and activity in these markets have decreased in recent years. Origin noted that decreasing baseload and dispatchable generation capacity and an overall decrease in NEM electricity demand has likely curtailed trading activity. Origin also noted that a number of financial intermediaries have left the market, including JP Morgan, Barclays, Merryl Lynch, and BP Singapore.149
ERM Power noted that the increase in non-dispatchable generation has likely contributed to the decline in contract market activity. ERM Power suggested that increasingly illiquid contract markets have likely contributed to increased retail prices, and that improving contract market liquidity will be crucial in reducing retail prices.150
As part of the Inquiry, the ACCC met with a wide range of small and medium sized retailers to discuss their experiences in the hedging market. A number of these retailers noted that they have trouble hedging. Hedging was identified as a significant differentiator between the relative competitiveness of retailers. Some stakeholders suggested that large, vertically integrated businesses are more able to hedge their wholesale risk effectively, and are able to do so at a lower price.151
To assess these concerns, the ACCC compelled a number of retailers to produce documents relating to their risk management activities. The ACCC also held meetings with small retailers to discuss their risk management strategies. All retailers the ACCC engaged with have risk management policies that set out a strategy for managing wholesale electricity risk. For the vast majority of businesses, these policies included guidelines on calculating and forecasting electricity needs and hedge positions, and set out approved hedge products to be used to maintain compliance with the policy.
However, as noted above, a number of retailers have trouble hedging in practice.
145 For example, AGL, Submission to ACCC Preliminary Report, 17 November 2017, p. 12; Origin, Submission to ACCC Preliminary Report, 30 November 2017, pp. 22–23; Finncorn Consulting Pty Ltd, Submission to ACCC Preliminary Report, 30 November 2017, p. 21; Australian Energy Council, Submission to ACCC Preliminary Report, 24 November 2017, p. 2.
146 Finncorn Consulting, Submission to ACCC Preliminary Report, 6 December 2017, p. 21.147 Origin, Submission to ACCC Preliminary Report, 30 November 2017, p. 23.148 EnergyAustralia, Submission to ACCC Preliminary Report, 30 June 2017, pp. 8–9.149 Origin, Submission to ACCC Preliminary Report, 30 November 2017, p. 25.150 ERM Power, Submission to ACCC Preliminary Report, 17 November 2017, p. 3.151 See, for example, Sumo Power, Submission to ACCC Preliminary Report, 17 November 2017, p. 6.

108 Retail Electricity Pricing Inquiry—Final Report
5.2.1 Risk management strategies in practiceTo observe retailers’ risk management practices, the ACCC required a broad range of retailers to produce data on their ‘net position’ for 2018 and 2019. The net position provides a measure of how each retailer’s expected demand from its customers compares to the hedges it has in place (whether through contracts or vertically integrated generation).
The information obtained from retailers reveals a spectrum of hedging practices. Broadly, retailers can be categorised into four groups:
�� retailers that operate unhedged or largely unhedged for periods, or that are only able to hedge on a short-term basis (for example, from month to month or quarter to quarter)
�� retailers that hedge through load-following hedges
�� retailers that hedge primarily with contracts (though may also own small amounts of generation or have PPAs in place)
�� retailers that are significantly physically hedged with their own generation assets.
Retailers with minimal hedging in placeThe ACCC is aware of retailers that operate without hedging in place, often over a number of quarters. These retailers may focus their efforts on achieving some degree of hedging over peak demand periods. The ACCC also met with retailers that are only able to hedge on a short-term basis.
When these retailers enter into hedges, it may be via options trading rather than committing to hedges up front. These retailers are therefore only able to manage their wholesale price risk to a very limited extent and will be highly vulnerable to price shocks in the wholesale market.
A number of the barriers to hedging identified in section 5.2 apply to these retailers. They may lack counterparties willing to trade with them, not be able to access the ASX, or not be able to find the right products for their needs. For some retailers in this category, the upfront cost of hedging may also be prohibitive.
Retailers on load-following hedgesLoad-following hedges are typically an ‘all-in-one’ risk management product that substitutes for building up a portfolio of diverse hedges. Under a load-following hedge, the price the buyer pays for each unit of electricity is fixed but the volume of electricity contracted under the hedge is allowed to vary with the buyer’s needs. This differs from a typical hedge, where the volume of electricity is also fixed.
Retailers on load-following hedges are fully covered (up to a certain load or number of customers). However, they are vulnerable when recontracting as failing to secure a new load-following hedge would result in them having no hedge cover in place.
Load-following hedges tend to be expensive compared with other types of hedges. For a small retailer though, a load-following hedge may be a cost effective alternative to actively managing their own risk. Managing wholesale risk via a portfolio of contracts requires skilled forecasting and trading capabilities, and sufficient resources to monitor the market, update calculations, undertake trading, and maintain compliance with risk management policies. For a small, start-up retailer these costs may be prohibitive. A load-following hedge may therefore be very attractive.
Sumo Power, for example, submitted that building a portfolio of hedges is uneconomic until a retailer has around 100 000 customers.152
Some market participants have raised concerns that the number of load-following hedge providers has diminished in recent years, making it harder to secure these products.153 Stakeholders that raised concerns about access to load-following hedges noted that they are regularly used by new entrant retailers.154 A reduction in the supply of load-following hedges may therefore imply a potential increase in barriers to entry.
152 Sumo Power, Submission to ACCC Preliminary Report, 17 November 2017, p. 6.153 Sumo Power, Submission to ACCC Preliminary Report, 17 November 2017, p. 6; Origin, Submission to ACCC Preliminary Report,
30 November 2017, p. 25.154 For example, Sumo Power, Submission to ACCC Preliminary Report, 17 November 2017, p. 6.

109 Retail Electricity Pricing Inquiry—Final Report
In response to these concerns, the ACCC sought information on load-following hedges from 20 retailers, including vertically integrated businesses that comprise the majority of generation in the NEM and are therefore potential suppliers of load-following hedges.
In the documents received from retailers, the ACCC observed only a few suppliers of load-following hedges, and most of these suppliers were not vertically integrated players. Based on the contracts observed by the ACCC, the market for load-following hedges appears to be thin.
There may be more parties offering load-following hedges than our survey suggests (the ACCC only captured executed contracts, not all offers). However, our survey suggests that there is a very limited number of suppliers offering competitively priced load-following hedges.
Load-following hedges are a particularly onerous product to sell because they transfer volume risk from the buyer onto the seller, and the seller will not typically have real time information on the buyer’s load. The only likely sellers are generators, gentailers, or intermediaries with fairly large portfolios of generation or hedge contracts within which the risk of volume uncertainty can be diversified.
Vertically integrated businesses, especially those that do not have sufficient generation to cover their own retail load, are less likely to have enough generation capacity to willingly absorb volume risk from third parties. Given the degree of vertical integration in the NEM, it is not surprising that load-following hedge suppliers are uncommon.
Retailers that primarily hedge with a portfolio of contractsA number of retailers manage wholesale risk primarily by building up a portfolio of hedges that, in total, mitigate much of their exposure to wholesale price volatility. These portfolios typically comprise different types of hedges, and are built-up over time.
Most retailers start hedging for a particular period about two years in advance of that period commencing. However, prudently managing forward exposure to prices is a balancing act, with benefits and costs to hedging too far in advance or not far enough. For example, a retailer would not want to enter into hedges to cover their entire (forecast) load two years in advance of a particular period because:
�� their load might change in the intervening two years
�� in two years’ time, contract and spot prices might be lower (and competing retailers may set lower retail prices based on those lower spot/contract prices).
In this sense, contracting too much load too far out might increase the retailer’s exposure to risk.
Similarly, a retailer would prefer not to hedge their entire load just before a particular period commences because such a strategy would mean they are completely exposed to the prevailing spot and contract prices. Their retail prices for the period will be largely locked in already, so any wholesale price increases will negatively impact the retailer’s margins.
By building up a portfolio of contracts over time, a retailer is best able to balance these different risks.
Retailers that pursue this hedging strategy generally do not own generation, or only own small amounts of generation that do not provide adequate protection from wholesale price volatility.
Figure 5.1 below presents ‘net position’ information provided to the ACCC in March 2018 by a number of retailers that hedge through a portfolio of contracts. The retailers provided data aggregated by each quarter of 2018 and 2019. Their data has been combined and averaged in order to present an anonymous ‘typical’ retailer that hedges through contracts. The chart reports:
�� the retailer’s average and maximum forecast demand from customers for each quarter (in MW)
�� the amount of OTC hedges the retailer has in place for each quarter (in MW)
�� the amount of ASX hedges the retailer has in place for each quarter (in MW).
The chart shows that in the first quarter of 2018 (when the data was sampled), the retailer’s portfolio of hedges covers their entire electricity needs (and appears to provide additional coverage for unexpected demand above their forecast maximum). For periods further into the future, the retailer’s portfolio covers less of their forecast needs. As each period approaches, contracts will be added to the portfolio to incrementally cover the retailer’s electricity needs.

110 Retail Electricity Pricing Inquiry—Final Report
Figure 5.1: Representative average net position of a stand-alone retailer, Q1 2018 to Q4 2019
Q1 Q2 Q3 Q4 Q1 Q2 Q3 Q4
2018 2019
MW
Net ASX hedges Net OTC hedges Forecast demand (average) Forecast demand (max)
Source: ACCC analysis of retailers’ information. To better preserve anonymity, the chart has been compiled by averaging the net position of multiple retailers with similar hedging strategies, and across separate NEM regions.
Retailers that hedge substantially through vertical integrationBy market share, the vast majority of NEM retailers manage risk primarily through vertical integration. The big three, Red Energy and Lumo Energy (together ‘Snowy Hydro’), Alinta and Simply Energy155 all own substantial generation assets, often in multiple states.
For the regions in which they own large amounts of generation capacity, these retailers have a significant internal hedge and are therefore well placed to manage wholesale price risk over most timeframes.156 An example of the hedging position of a vertically integrated business is shown in figure 5.2. The data in figure 5.2 has been compiled from a number of vertically integrated businesses and averaged. The chart shows that, on average, these businesses are ‘long’ in generation in the regions that have been sampled for the figure (that is, they have more generation capacity in each particular region than they need for their own retail load).
155 Engie, the parent company of Simply Energy, has recently shut down its Hazelwood power station (March 2017) and sold Loy Yang B (December 2017), which significantly reduced its internal generation assets. Pelican Point in South Australia is now its largest plant.
156 Vertical integration comes with other complications, such as plant downtime for maintenance or unscheduled outages, so even gentailers that are ‘long’ in generation capacity will still need contracts to cover them in particular circumstances. Generation assets degrade over time and are ultimately closed, so maintaining vertical integration requires significant periodic investments.
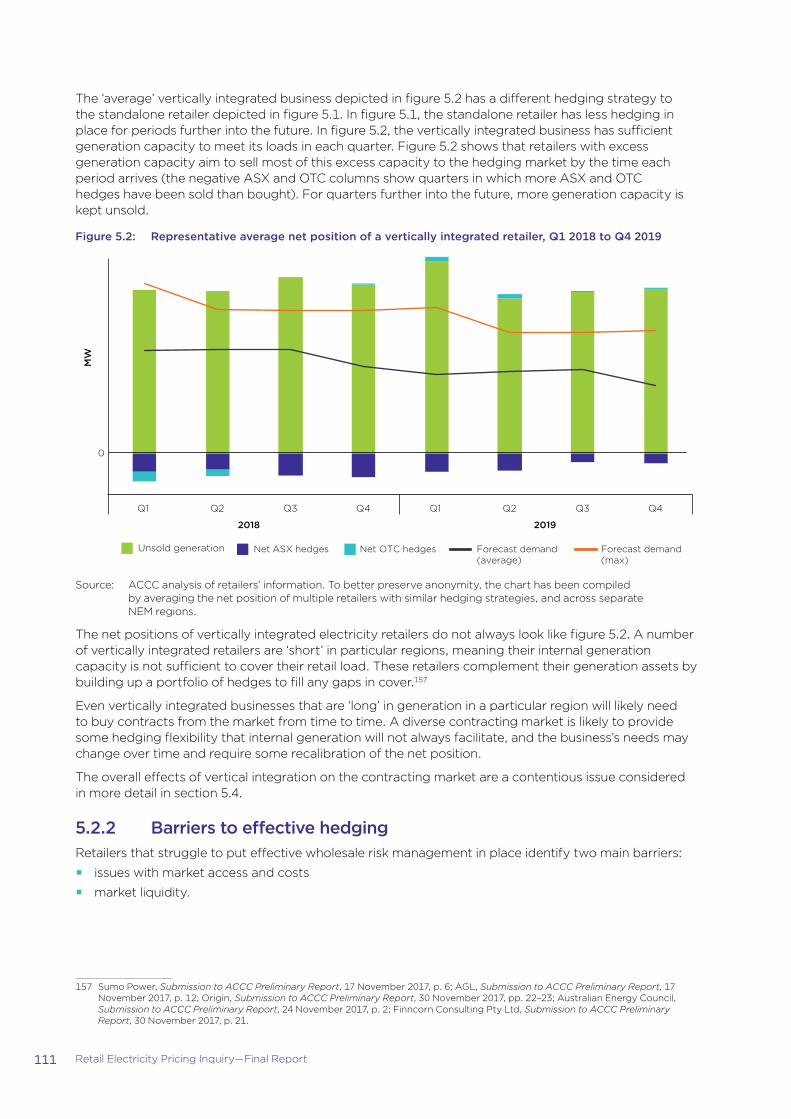
111 Retail Electricity Pricing Inquiry—Final Report
The ‘average’ vertically integrated business depicted in figure 5.2 has a different hedging strategy to the standalone retailer depicted in figure 5.1. In figure 5.1, the standalone retailer has less hedging in place for periods further into the future. In figure 5.2, the vertically integrated business has sufficient generation capacity to meet its loads in each quarter. Figure 5.2 shows that retailers with excess generation capacity aim to sell most of this excess capacity to the hedging market by the time each period arrives (the negative ASX and OTC columns show quarters in which more ASX and OTC hedges have been sold than bought). For quarters further into the future, more generation capacity is kept unsold.
Figure 5.2: Representative average net position of a vertically integrated retailer, Q1 2018 to Q4 2019
2018 2019
Q1 Q2 Q3 Q4 Q1 Q2 Q3 Q4
Unsold generation
0
MW
Net ASX hedges Net OTC hedges Forecast demand (average)
Forecast demand (max)
Source: ACCC analysis of retailers’ information. To better preserve anonymity, the chart has been compiled by averaging the net position of multiple retailers with similar hedging strategies, and across separate NEM regions.
The net positions of vertically integrated electricity retailers do not always look like figure 5.2. A number of vertically integrated retailers are ‘short’ in particular regions, meaning their internal generation capacity is not sufficient to cover their retail load. These retailers complement their generation assets by building up a portfolio of hedges to fill any gaps in cover.157
Even vertically integrated businesses that are ‘long’ in generation in a particular region will likely need to buy contracts from the market from time to time. A diverse contracting market is likely to provide some hedging flexibility that internal generation will not always facilitate, and the business’s needs may change over time and require some recalibration of the net position.
The overall effects of vertical integration on the contracting market are a contentious issue considered in more detail in section 5.4.
5.2.2 Barriers to effective hedgingRetailers that struggle to put effective wholesale risk management in place identify two main barriers:
�� issues with market access and costs
�� market liquidity.
157 Sumo Power, Submission to ACCC Preliminary Report, 17 November 2017, p. 6; AGL, Submission to ACCC Preliminary Report, 17 November 2017, p. 12; Origin, Submission to ACCC Preliminary Report, 30 November 2017, pp. 22–23; Australian Energy Council, Submission to ACCC Preliminary Report, 24 November 2017, p. 2; Finncorn Consulting Pty Ltd, Submission to ACCC Preliminary Report, 30 November 2017, p. 21.

112 Retail Electricity Pricing Inquiry—Final Report
Market access and costsAccessing hedging markets means being able to trade on the ASX or through OTC contracts.
For the ASX, a retailer will need to find an ASX clearinghouse (or a broker with access to a clearinghouse) that is willing to facilitate the retailer’s trades. The retailer will need to satisfy the clearing participant of its creditworthiness and meet the daily margining requirements.158 These margining requirements can be expensive, and the daily updates mean a small business may need to set aside substantial cash reserves to ensure they are able to comply with any sudden changes in the amount of collateral required. ASX margining provisions have recently changed to increase the amount of collateral participants need to provide to their clearinghouse.159 These changes will likely have decreased the ability of small retailers to use the ASX market.
Clearing participants may be acting rationally in rejecting the business of very small retailers who may present an unacceptable credit risk. It is likely that some of these retailers would be able to access the ASX if they were able to set aside sufficient collateral. However, these requirements suggest that there are barriers for small retailers to access one of the main hedging markets. This is likely to inhibit small retailer growth.
Small retailers may also find the minimum trade size (1 MW) of the ASX is a barrier to effective hedging. Small and start-up retailers have very small loads, and may find it difficult to build a portfolio of hedges in 1 MW ‘blocks’. For example, a new retailer that has amassed 5000 customers might have an average load of around 3.5 MW. Trading on the ASX would require the retailer to hedge to 3 MW or 4 MW of coverage, which means the retailer will be around 15 per cent under- or over-covered. Being under-covered exposes the retailer to risk, while being over-covered is wasted cost.
For OTC trades, access is about finding a counterparty that is willing to trade bilaterally. Such a partner can be hard to find and reach acceptable terms with for a small retailer. Bilateral OTC trading is generally undertaken under the umbrella of an International Swaps and Derivatives Association (ISDA) agreement. These are long and complex agreements that can take significant time and cost to put in place. For small retailers (and their potential trading partners) these costs can be prohibitive.
The ACCC required 17 NEM retailers and vertically integrated businesses to provide copies of their ISDAs. Responses suggest that smaller retailers have significantly fewer options to find OTC hedges. The ACCC survey identified 13 very small, standalone retailers with ISDAs in place. However, they had only six counterparties between them. The most counterparties any of the 13 retailers had was five. A number of them had only one ISDA in place. As a point of comparison, the big three each had at least 20 OTC counterparties.160
By surveying all the top and second tier vertically integrated ‘gentailers’, the data captures the vast majority of generation capacity in the NEM. The results reveal that much of this capacity is not directly available to small, standalone retailers. However, access may be available via a standalone generator or an intermediary that trades with both the supplier of the hedges and the small, standalone retailer. Access may also be available through the ASX. However, these avenues are likely to be more expensive and potentially less flexible than directly trading with the generator.
There are a number of explanations for why so few counterparties are willing to trade with these very small retailers. The most obvious is credit risk. As noted above, participants in the OTC market have to manage counterparty credit risks themselves. If one side of a hedge contract defaults, the other party will be left exposed. These very small retailers are often small businesses with little capital and too few customers to earn a reliable stream of revenue. This makes them much riskier trading partners than larger businesses that are more likely to have sufficient cash on hand to pay wholesale costs. In this regard, the ISDAs examined by the ACCC show that generally, smaller retailers face more stringent credit support requirements than larger retailers. Monitoring and managing counterparty credit risk is not core business for most participants in the NEM, so trading with small, riskier counterparties may not be a priority.
158 ‘Margining’ refers to the collateral that participants must deposit in order to minimise the risk of default. For derivative contracts such as electricity futures, the margin required will reflect each participant’s position versus the prevailing market price. The margins update each day to reflect changes in market prices.
159 The changes were set out in an information sheet in December 2017 and came into effect in mid-January 2018. The information sheet is available at: https://www.asxenergy.com.au/newsroom/industry_news/asx-clear-futures-energy-deri-4/asx-energy-market-notice--mar.pdf.
160 Though we note that some counterparties may no longer be regularly active in the market.

113 Retail Electricity Pricing Inquiry—Final Report
The data set shows that medium sized retailers, especially ones backed by a larger parent company, have significantly more counterparties in the OTC market. This supports the idea that counterparty credit risk is the main inhibitor to OTC trading. However, this creates the potential for a scenario in which small parties are not able to secure such hedges until they are sufficiently large but need adequate hedging in order to achieve sufficient size.
The few counterparties willing to engage with these very small retailers provide an important lifeline to new entrants. The data set suggests that this lifeline is already very thin. Without sufficient hedge providers willing to engage with small players, the retail market will have a substantial barrier to entry.
LiquidityThe liquidity of NEM contracting markets has been a contentious issue for some time. No single metric is generally agreed to provide a complete picture of hedge liquidity, and different metrics have their own strengths and weaknesses. The ACCC does not consider it necessary to form a specific view about market liquidity, but broadly agrees with the AEMC’s approach that a liquid wholesale contract market is typically characterised by:
�� no single transaction being likely to move the price excessively
�� individual trades that are able to be easily executed
�� an ability to trade large volumes of energy in a short period of time
�� a market that can recover towards its natural equilibrium after being exposed to a shock.161
Liquidity is very important for electricity risk management. For example, a retailer that commits to a new set of retail prices (or that signs up a new large customer) based on prevailing wholesale prices will want to lock in those wholesale prices (and the margin incorporated into their retail price). Being able to find trades to achieve this quickly and without significantly increasing contract prices in the process is critical to confidently operating in the retail market.
In meetings, retailers generally expressed cautious comfort about liquidity in Victoria, NSW, and Queensland, though a number of retailers commented that liquidity appeared to have worsened in recent years.
A number of submissions also identified South Australia as having a particularly illiquid hedging market. The Energy & Water Ombudsman SA (EWOSA) noted the lack of liquidity and very small volume of trading in general in South Australia, suggesting this is contributing to wholesale price volatility, higher retail prices, higher costs (and barriers to entry) for retailers, and difficulties for large customers to secure affordable electricity supply contracts.162
Origin noted that the high proportion of renewable generation was likely contributing to hedge market illiquidity, as these generation types are less able to supply contracts. Origin also suggested that illiquidity was likely influenced by the relatively concentrated ownership of dispatchable generation assets in South Australia (compared to other NEM states), and that South Australia has traditionally been a net importer of electricity from Victoria.163
As noted in the Preliminary Report, the ACCC is aware of at least one retailer that has chosen not to enter South Australia because of contract market illiquidity and cost.164
This contrast between South Australia and other regions is evident in trading data, including the OTC data set the ACCC compiled in this inquiry (see section 5.3 for more information). Figure 5.3 below compares the quantity of energy traded in flat swaps (the most fundamental and common hedge contract traded on both the OTC and ASX markets) to the demand for electricity in each region.165 The charts show that total trade volumes regularly exceed energy demand in Victoria and Queensland, and NSW trade volumes are close to total demand. Given the extent of vertical integration in Victoria and NSW, the charts suggest substantial trading (and re-trading) of energy.
161 AEMC, 2018 Retail Energy Competition Review Final Report, 14 June 2018, p. 34.162 EWOSA, Submission to ACCC Preliminary Report, 17 November 2017, p. 5.163 Origin, Submission to ACCC Preliminary Report, 30 November 2017, p. 22.164 ACCC, Retail Electricity Pricing Inquiry: Preliminary Report, 22 September 2017, p. 103.165 ‘Flat’ in this context refers to the hours of the day to which the contract relates. A flat contract applies to all 24 hours of the day.
Other contracts may refer to only peak hours of the day (typically 7am through 10pm), or more bespoke windows negotiated by the parties.
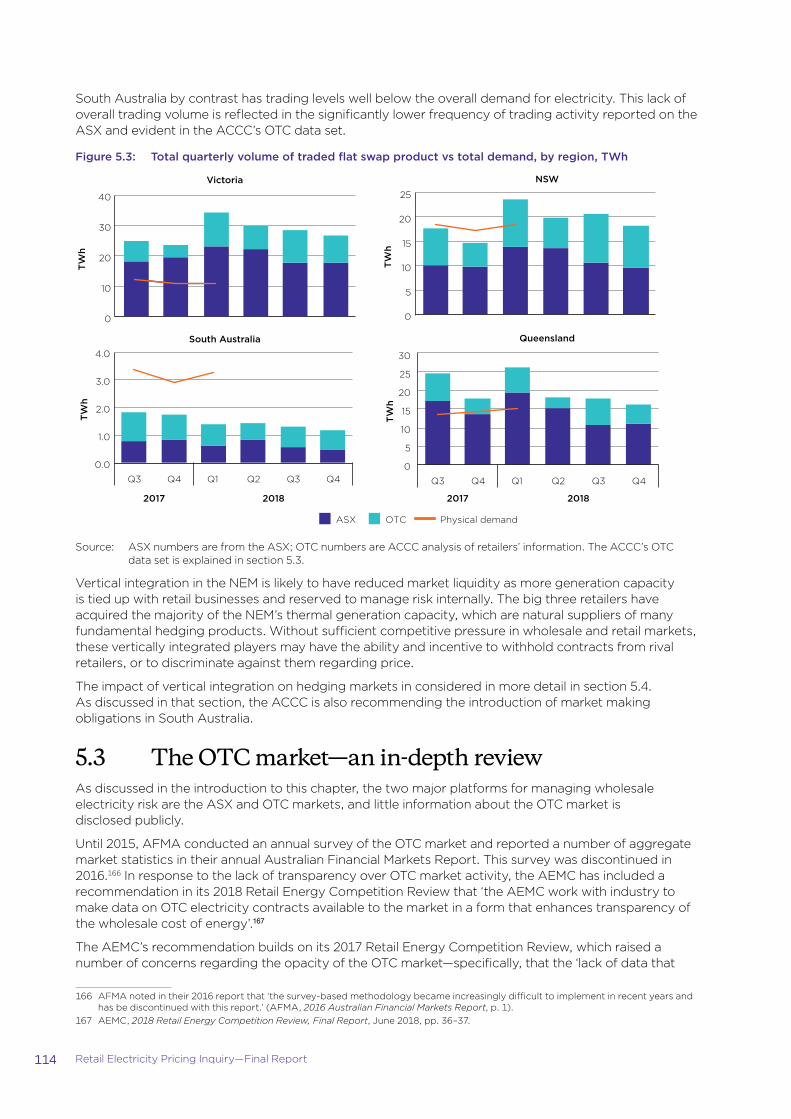
114 Retail Electricity Pricing Inquiry—Final Report
South Australia by contrast has trading levels well below the overall demand for electricity. This lack of overall trading volume is reflected in the significantly lower frequency of trading activity reported on the ASX and evident in the ACCC’s OTC data set.
Figure 5.3: Total quarterly volume of traded flat swap product vs total demand, by region, TWh
0
5
10
15
20
25
30
Q3 Q4 Q1 Q2 Q3 Q4
2017 2018
TW
h
ASX OTC Physical demand
0.0
1.0
2.0
3.0
4.0
Q3 Q4 Q1 Q2 Q3 Q4
2017 2018
TW
h
0
10
20
30
40
TW
h
0
5
10
15
20
25
TW
h
Victoria NSW
South Australia Queensland
Source: ASX numbers are from the ASX; OTC numbers are ACCC analysis of retailers’ information. The ACCC’s OTC data set is explained in section 5.3.
Vertical integration in the NEM is likely to have reduced market liquidity as more generation capacity is tied up with retail businesses and reserved to manage risk internally. The big three retailers have acquired the majority of the NEM’s thermal generation capacity, which are natural suppliers of many fundamental hedging products. Without sufficient competitive pressure in wholesale and retail markets, these vertically integrated players may have the ability and incentive to withhold contracts from rival retailers, or to discriminate against them regarding price.
The impact of vertical integration on hedging markets in considered in more detail in section 5.4. As discussed in that section, the ACCC is also recommending the introduction of market making obligations in South Australia.
5.3 The OTC market—an in-depth reviewAs discussed in the introduction to this chapter, the two major platforms for managing wholesale electricity risk are the ASX and OTC markets, and little information about the OTC market is disclosed publicly.
Until 2015, AFMA conducted an annual survey of the OTC market and reported a number of aggregate market statistics in their annual Australian Financial Markets Report. This survey was discontinued in 2016.166 In response to the lack of transparency over OTC market activity, the AEMC has included a recommendation in its 2018 Retail Energy Competition Review that ‘the AEMC work with industry to make data on OTC electricity contracts available to the market in a form that enhances transparency of the wholesale cost of energy’.167
The AEMC’s recommendation builds on its 2017 Retail Energy Competition Review, which raised a number of concerns regarding the opacity of the OTC market—specifically, that the ‘lack of data that
166 AFMA noted in their 2016 report that ‘the survey-based methodology became increasingly difficult to implement in recent years and has be discontinued with this report.’ (AFMA, 2016 Australian Financial Markets Report, p. 1).
167 AEMC, 2018 Retail Energy Competition Review, Final Report, June 2018, pp. 36–37.

115 Retail Electricity Pricing Inquiry—Final Report
now exists related to electricity OTC trading may pose a barrier to entry for new, smaller retailers who require information on the price and availability of hedging products before they enter the market.’168 The AEMC also noted that without having a general understanding of activity in the OTC market, it is difficult to interpret changes to the ASX market. For example, if trading activity in the ASX is observed to decline then stakeholders will not know if this is an actual overall decline in trading activity or a shift from the ASX to the OTC market.169
The ESB is currently developing the NEG. The NEG is being designed to operate primarily through the electricity contracting markets and the ESB is considering how OTC contracts can be incorporated. These issues are covered specifically in section 5.5.
The OTC market also provides an opportunity to test some of the concerns of industry stakeholders. The bilateral trading element of the market means that participants know whom they are negotiating with (as opposed to most ASX activity, which is anonymous). This increases the potential for participants to discriminate on price between potential counterparties. In particular, some stakeholders raised concerns about the ability of small or non-vertically integrated businesses to access affordable hedges.
For these reasons, in the second phase of the Inquiry the ACCC undertook a significant review of the OTC market. The review incorporated meetings with numerous retailers that use, or want to use, the OTC market, and the compilation of a large data set of OTC trading activity.
5.3.1 The data setThe ACCC issued compulsory notices requiring the production of hedging information to 17 retailers in the NEM. The notices required each retailer to produce the OTC swap and cap trades entered into between 1 July 2015 and early 2018.170 The data set compiled from the retailers’ internal trade records totalled over 20 000 individual trades.
The data set included numerous duplicate entries (trades which were provided by both sides), as well as trades between portfolios within a single overall business. These data points were reviewed for data validation and other purposes but were excluded from the final set.171 The final data set comprised:
�� approximately 5000 unique swap trades
�� approximately 1200 unique cap trades.
The information requests focused on regions that have removed price regulation (Victoria, NSW, south east Queensland, and South Australia) and captured a broad and relatively comprehensive sample of the retailers in each region. By retailer customer numbers, the data set covers the vast majority of retail operations in each of these NEM regions. The exact figures are reported in table 5.1.
168 AEMC, 2017 Retail Energy Competition Review, July 2017, p. 59.169 AEMC, 2017 Retail Energy Competition Review, July 2017, p. 59.170 To simplify the data set, other hedge instruments such as options were excluded on the basis that they are less commonly used than
swaps and caps, and are less straightforward to interpret. To assist the ACCC’s understanding of market activity, some retailers were required to produce a broader range of trades.
171 Because the ACCC requested trading data from multiple retailers who sometimes trade with each other, the dataset included a number of trades that were reported twice (that is, once by each party to the trade). The ACCC has attempted to exclude these duplicates but some may not have been identified due to differences in the way they were reported.

116 Retail Electricity Pricing Inquiry—Final Report
Table 5.1: Proportion of retail customer market share captured in the data set
Residential SME Large
Victoria* 97.0% 95.6% 97.1%
NSW 96.9% 96.5% 97.2%
South east Queensland** 93.5% 94.6% 89.7%
South Australia 98.9% 99.4% 96.0%
Source: ACCC calculations based on AER and ESC Victoria data: Queensland, NSW, South Australia, Tasmania and ACT: AER data, March 2018; Victoria: ESC, Victorian energy market report 2016–17.
Notes: *Victorian data is for June 2017.
**South east Queensland data has been calculated by subtracting Ergon Energy customers from Queensland market share figures and rebasing percentages.
5.3.2 Summary statistics of the data setTable 5.2 compares this data set’s aggregate figures to the last AFMA survey numbers. The ACCC figures suggest that OTC trading has increased somewhat since the 2015 financial year but has not returned to levels of prior years.172 More detailed summary statistics relating to trading activity and participation in the OTC market for 2015–16 and 2016–17 are in table 5.3.
Figure 5.4 breaks down swap contracts traded in each financial year by schedule type (flat, peak, off-peak, other) and shows that the vast majority of swaps transacted in the data set were a flat product. For caps (which are not presented in a figure), 97 per cent of the sample had a flat schedule.
Figure 5.5 breaks down trading activity by participant type. The data set shows that traders (that is, market participants with little or no physical electricity needs) are active in these markets, particularly in Victoria and NSW. The big three are also substantial participants with purchased volumes that are larger than all other retailers combined. Other participants are not significant buyers in our data set.173 Figure 5.5 also shows the relatively low level of trading activity occurring in South Australia and the lack of activity by participants other than retailers.
Table 5.2: Aggregate OTC trading activity in 2012–13 to 2016–17 (MWh)
Swaps Caps Total Source
2012–13 228 900 087 12 721 915 291 179 122 AFMA
2013–14 195 307 462 33 207 439 250 760 166 AFMA
2014–15 68 934 029 14 337 956 87 508 804 AFMA
2015–16 79 752 688 7 482 132 87 234 820 ACCC
2016–17 103 130 146 21 469 380 124 599 526 ACCC
Source: 2012–13 to 2014–15: AFMA Australian Financial Markets Report 2015, p. 50; 2015–16 and 2016–17: ACCC analysis based on retailers’ data.
Note: The AFMA survey included products other than swaps and caps, which are not reported separately in the table. So while the Swaps and Caps columns sum to the Total column for the ACCC data, they do not for the AFMA data.
172 AFMA note that the carbon tax induced significant trading activity to move into the OTC market, where the new obligation could be incorporated into contracts. The repeal of the carbon tax at the beginning of the 2015 financial year reduced activity in the OTC market for that year (AFMA, 2015 Australian Financial Markets Report, p. 48).
173 The volume of electricity purchased by each type of participant should be viewed as a metric of market participation rather than hedging needs. For example, a trader may purchase contracts but, given that they have no physical electricity position that needs to be hedged, they will likely trade out of those contracts at a later point in time.

117 Retail Electricity Pricing Inquiry—Final Report
Table 5.3: Turnover and participation statistics in the OTC market for trading activity in FY16 and FY17, by region and product type
Swaps Caps Total
Number of trades
Total MWh traded
Participants Number of trades
Total MWh traded
Participants Total MWh traded
Victoria 2015–16 424 24 464 380 72 45 888 540 16 25 352 920
2016–17 703 33 412 552 76 209 9 123 675 24 42 536 227
NSW 2015–16 328 23 476 091 57 24 316 632 9 23 792 723
2016–17 417 32 509 573 53 67 5 989 584 14 38 499 157
Queensland 2015–16 271 20 927 899 54 21 617 808 12 21 545 707
2016–17 369 24 790 461 51 47 3 250 162 11 28 040 623
South Australia
2015–16 69 3 320 335 28 100 4 255 632 14 7 575 967
2016–17 88 9 931 125 23 63 3 098 010 13 13 029 135
Source: ACCC analysis based on retailers’ data.
Figure 5.4: Swaps transacted in the OTC market during 2015–16, 2016–17, and 2017–18 (to the end of April), by contract schedule
0
20
40
60
80
100
120
2015–16 2016–17 2017–18 (to April)
TW
h
Flat Opeak Peak Other
Source: ACCC analysis of retailers’ information.

118 Retail Electricity Pricing Inquiry—Final Report
Figure 5.5: Volume of contracts bought in the OTC market by participant type, by quarterly flat swaps
Q3 Q4 Q1 Q2 Q3 Q4
2017 2018
Q3 Q4 Q1 Q2 Q3 Q4
2017 2018
Tra
din
g v
olu
me—
flat
sw
aps
(TW
h)
Big three Other retailers
Victoria NSW
South Australia Queensland
0
2
4
6
8
10
12
0
2
4
6
8
10
12
Traders Other participants
Source: ACCC analysis of retailers’ information.
Limitations of the ACCC’s data setThe ACCC’s OTC data set was compiled from information received from electricity retailers, so the data set does not capture the full extent of trading activity by non-retailers (for example, standalone generators and traders). These other participants were captured only to the degree that they contracted with retailers during the time period sampled by the ACCC. (However, we note that all vertically integrated generators’ trades were captured in the ACCC’s data set).
When looking at overall trading volumes from the data, it is important to recognise that the ACCC only sought information on swaps and caps. Trading of a range of other electricity derivatives was not captured.
For these reasons, the data set likely understates overall OTC market activity.
The ACCC considers that these caveats are relatively minor limitations of the data set. The vast majority of electricity derivatives end up being sold to a retailer that holds the contract to maturity, so the core trading of the market is captured in the data set. The trading dynamics experienced by retailers are also the most relevant for retail competition and therefore of most interest to the ACCC and other stakeholders. The last AFMA survey of OTC market activity reported that 95 per cent of traded energy was in swaps and caps174, so the data set captures by far the two most significant instruments in the market.
5.3.3 Comparing the ASX and OTC markets
Traded volumesFigure 5.6 reports the volume of flat swaps traded on the OTC and ASX market. Flat swaps have been highlighted here given that they make up the majority of trading activity (see figure 5.4) and are a core hedge product that all market participants are likely to use (or want to use). Figure 5.6 sums the volume of electricity traded in flat swaps that relate to each quarter between the third quarter of 2017 and the fourth quarter of 2018. The volumes here do not relate to the timing of execution of each trade but to the quarter for which each flat swap applies (that is, provides hedge cover for).
174 AFMA, 2015 Australian Financial Markets Report, p. 50.

119 Retail Electricity Pricing Inquiry—Final Report
In most states, ASX volumes make up the majority of contract trading in flat swaps. ASX activity also tends to be more constant. OTC trading is more variable, particularly in states that mostly trade through the ASX.
South Australia stands out as the only state in which there is more volume traded in the OTC market than the ASX. Tasmania also has OTC trading (and no ASX trading) but is not presented in figure 5.6 due to the small number of participants in the Tasmanian market.
Figure 5.6: ASX and OTC traded volumes of flat swaps (TWh)
Trad
ing
vo
lum
e—fl
at s
wap
s (T
Wh)
ASX OTC
Victoria NSW
South Australia Queensland
Q3 Q4 Q1 Q2 Q3 Q4
2017 2018
Q3 Q4 Q1 Q2 Q3 Q4
2017 2018
0
5
10
15
20
25
30
35
40
0
5
10
15
20
25
0
0.2
0.4
0.6
0.8
1.0
1.2
1.4
1.6
1.8
2.0
0
5
10
15
20
25
30
Source: OTC figures are ACCC analysis of retailers’ information; ASX figures are ACCC analysis of ASX information.
Note: This chart measures the amount of trading of flat swaps that relate to particular quarters of energy use. The chart starts at Q3 2017, which is two years after the ACCC’s sample of OTC trading activity begins. The chart should therefore capture the majority of OTC trading of the quarters Q3 2017 to Q1 2018. For quarters after Q1 2018, the chart likely understates OTC and ASX trading volumes as some trades will have occurred after the ACCC’s sample period.
Price outcomesFigure 5.7 below compares the prices ($/MWh) for flat swaps in the OTC market to flat swaps in the ASX market. For each market, the volume weighted average price for each quarter for which the swap applies has been calculated.
In general, the average price appears to be lower on the OTC market compared to the ASX. The trend is reasonably consistent for NSW, Victoria, and South Australia. A trend in Queensland is less clear. The differences in average market prices are substantial, with the OTC market regularly $10–20/MWh less than the ASX. Over the period sampled, a business that undertook most of its hedging on the OTC market may therefore have achieved a significantly cheaper overall cost of wholesale electricity.

120 Retail Electricity Pricing Inquiry—Final Report
Figure 5.7: ASX and OTC average contract prices for flat swaps, ($/MWh)
Victoria NSW
South Australia Queensland
Wei
ghte
d av
erag
e st
rike
pric
e ($
/MW
h)
0
20
40
60
80
100
120
0
20
40
60
80
100
0
20
40
60
80
100
120
140
160
0
20
40
60
80
100
120
ASX OTC
2015
Q3
2016
Q1 Q3
2017
Q1 Q3
2018
Q1 Q3
2015
Q3
2016
Q1 Q3
2017
Q1 Q3
2018
Q1 Q3
Source: OTC figures are ACCC analysis of retailers’ information; ASX figures are ACCC analysis of ASX information.
The weighted average for each quarterly swap product is made up of trades that have occurred over a long period of time (some more than two years in advance of the quarter to which the swap applies). Over the period for which the ACCC sampled OTC data (and compiled comparable ASX data), NEM spot prices (and therefore contract prices) generally increased, including significant increases in 2017. A lower average price in one market could therefore reflect the relative timing of trades in each market (for example, if there was a trend that one market was regularly used earlier than the other). The ACCC compared the timing of market activities but found no regular pattern of timing or particularly large differences between markets.
5.3.4 Evidence of price dispersion in the OTC marketGiven the OTC market is based on bilateral trading, a seller may try to charge different prices to different trading partners. For example, a vertically integrated player will know that they are selling to a competing retailer; or a large generator will know they are selling to a small, new entrant. A number of parties raised concerns about the ability of dominant players to charge high prices for contracts.
As is set out in section 5.2.2, the data set shows that very small retailers have significantly fewer potential trading partners in the OTC market (some have only one potential partner). A small retailer in this situation may be particularly vulnerable to being charged higher prices as they are less likely to have alternative options.
However, the need to manage counterparty risk when dealing in the OTC market means that price differentials may be legitimate and represent risk premiums associated with different trading partners. A smaller trading partner may pose greater risk of default, which would require a greater price to compensate the seller for accepting that risk.
Figure 5.8 sets out the volume-weighted average price paid by retailers for each quarterly flat swap product175 between the first quarter of 2016 and the fourth quarter of 2018, by region. The cohort of retailers has been split to isolate the big three and compare their price outcomes to other retailers. The
175 Flat swaps longer than one quarter have been allocated into appropriate quarters.
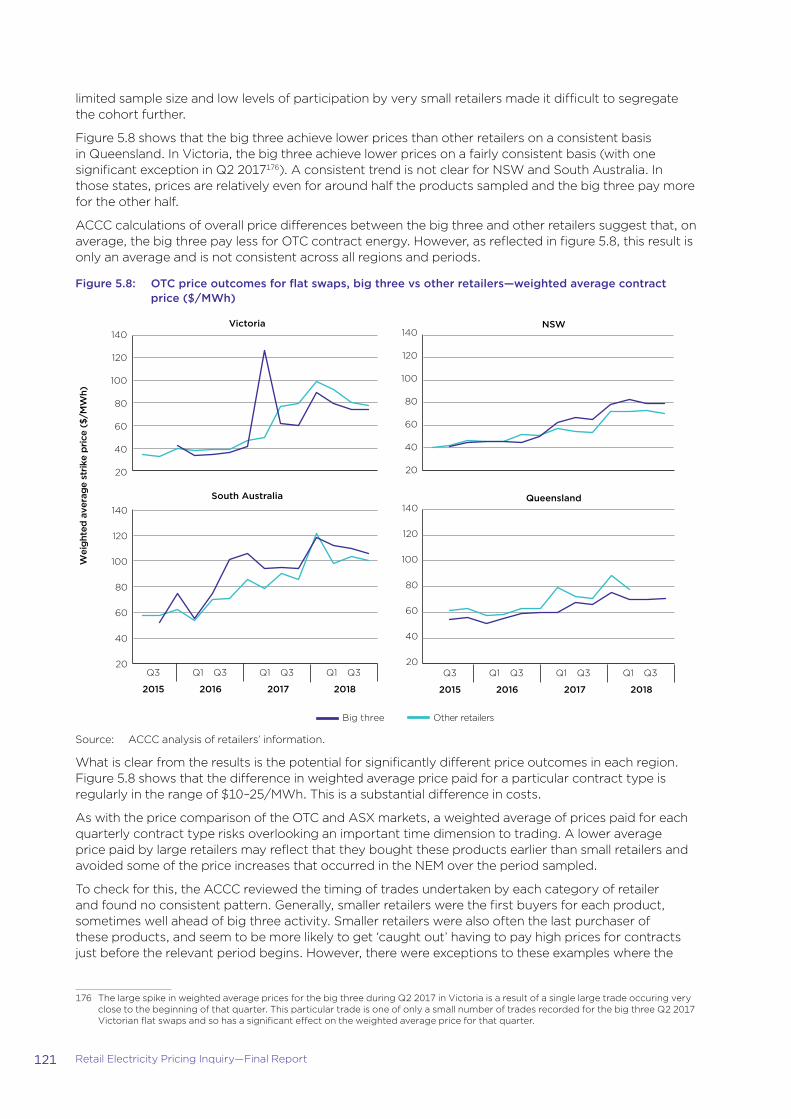
121 Retail Electricity Pricing Inquiry—Final Report
limited sample size and low levels of participation by very small retailers made it difficult to segregate the cohort further.
Figure 5.8 shows that the big three achieve lower prices than other retailers on a consistent basis in Queensland. In Victoria, the big three achieve lower prices on a fairly consistent basis (with one significant exception in Q2 2017176). A consistent trend is not clear for NSW and South Australia. In those states, prices are relatively even for around half the products sampled and the big three pay more for the other half.
ACCC calculations of overall price differences between the big three and other retailers suggest that, on average, the big three pay less for OTC contract energy. However, as reflected in figure 5.8, this result is only an average and is not consistent across all regions and periods.
Figure 5.8: OTC price outcomes for flat swaps, big three vs other retailers—weighted average contract price ($/MWh)
Wei
ght
ed a
vera
ge
strik
e p
rice
($/M
Wh)
Victoria NSW
South Australia Queensland
2015
Q3
2016
Q1 Q3
2017
Q1 Q3
2018
Q1 Q3
2015
Q3
2016
Q1 Q3
2017
Q1 Q3
2018
Q1 Q3
Big three Other retailers
20
40
60
80
100
120
140
20
40
60
80
100
120
140
20
40
60
80
100
120
140
20
40
60
80
100
120
140
Source: ACCC analysis of retailers’ information.
What is clear from the results is the potential for significantly different price outcomes in each region. Figure 5.8 shows that the difference in weighted average price paid for a particular contract type is regularly in the range of $10–25/MWh. This is a substantial difference in costs.
As with the price comparison of the OTC and ASX markets, a weighted average of prices paid for each quarterly contract type risks overlooking an important time dimension to trading. A lower average price paid by large retailers may reflect that they bought these products earlier than small retailers and avoided some of the price increases that occurred in the NEM over the period sampled.
To check for this, the ACCC reviewed the timing of trades undertaken by each category of retailer and found no consistent pattern. Generally, smaller retailers were the first buyers for each product, sometimes well ahead of big three activity. Smaller retailers were also often the last purchaser of these products, and seem to be more likely to get ‘caught out’ having to pay high prices for contracts just before the relevant period begins. However, there were exceptions to these examples where the
176 The large spike in weighted average prices for the big three during Q2 2017 in Victoria is a result of a single large trade occuring very close to the beginning of that quarter. This particular trade is one of only a small number of trades recorded for the big three Q2 2017 Victorian flat swaps and so has a significant effect on the weighted average price for that quarter.

122 Retail Electricity Pricing Inquiry—Final Report
big three contracted earlier or got caught out paying a high price at the last minute. These individual experiences may contribute to the price differentials in figure 5.8.
5.3.5 The need for greater transparency of the OTC marketThe ACCC’s survey of the OTC market shows that there is a substantial amount of risk management activity taking place in the OTC market. In South Australia, more trading of core hedge products (swaps and caps) occurs in the OTC market than the ASX. The survey also suggests that dynamics in the OTC market may be different to the ASX. Finally, the survey shows that the big three are able to achieve lower prices on average than other participants.
The ACCC considers that the lack of transparency in the OTC market impedes the transmission of price signals in the market, and introduces uncertainty for participants and policy makers. This uncertainty could be overcome by a requirement for OTC trades to be reported to a registry and then published in a de-identified format. Publishing contracts in a de-identified format minimises the risk that the registry discloses the commercial activities of individual businesses.
Such a registry would allow all market participants to follow price trends across both electricity contracting markets. It would also minimise uncertainty about changes in trading activity on the ASX, as any substitution of activity to the OTC market would be visible.
The AEMC has made a similar recommendation in its 2018 Retail Energy Competition Review, noting an intention to ‘work with industry to make data on OTC electricity contracts available to the market in a form that enhances transparency of the wholesale cost of energy’.177
The AEMC’s report refers to the New Zealand hedge transaction reporting regime, which the ACCC has also reviewed and considers may provide a good model on which a NEM repository could be based. Under this regime, electricity market participants are required to publish hedge contract information on a freely accessible website (https://www.electricitycontract.co.nz/) within five business days of entering into each contract. The website records the contract type, quantity of electricity, price, region to which the contract relates, and a number of other statistics.178
As discussed in section 5.5.1, the current NEG policy proposal may also require the reporting and disclosure of OTC contracts in certain circumstances. The ACCC considers that any ongoing repository should be designed in such a way as to align with any new requirements under the NEG so as to minimise the additional burden and complexity of these requirements.
The ACCC notes that OTC repositories for other financial products can be complex, may require daily updating of open positions, and may be used to monitor factors beyond the scope of the ACCC’s analysis of electricity contract markets (such as systemic risk). The ACCC has not considered whether other such factors are relevant for electricity OTC contracts. The ACCC’s priority is enhancing transparency over OTC market activity and price trends. For these reasons, the ACCC is recommending a more limited industry-specific repository overseen by the AER.
Recommendation 6The NEL should be amended so as to require the reporting of all OTC trades to a repository administered by the AER. Reported OTC trades should then be disclosed publicly in a de-identified format that facilitates the dissemination of important market information without unintentionally revealing the parties involved.
The requirement should be implemented to align with (or be eligible for) any OTC reporting requirements under the NEG.
The AER, AEMC and AEMO should have access to the underlying contract information, including the identity of trading partners.
177 AEMC, 2018 Retail Competition Review Final Report, June 2018, pp. 36–37.178 To make disclosures anonymous and eliminate commercial sensitivity around individual hedges, the Electricity Authority adjusts each
published hedge price with a location factor. Contract details provided under the regime are also use by the Electricity Authority to detect potential market manipulation.

123 Retail Electricity Pricing Inquiry—Final Report
We note that the ACCC is also recommending expanded wholesale market monitoring powers for the AER, which should include monitoring, analysing and reporting on contract markets including making use of the data reported to the repository (chapter 16, recommendation 41).
5.4 The practices of vertically integrated businesses in the NEM
Vertical integration has become the primary business structure for large electricity retailers in the NEM. AGL, Origin, EnergyAustralia, and Red Energy/Lumo Energy (Snowy Hydro) are all integrated with substantial portfolios of generation assets. Simply Energy (Engie) and Alinta also own major generation assets. These six vertically integrated businesses account for nearly 90 per cent of residential customers across the NEM. In NSW, Victoria and South Australia, they account for around 90 per cent of generation capacity.
A number of smaller retailers are also vertically integrated. Powershop has a portfolio of wind and hydro generation; Momentum Energy is backed by Hydro Tasmania, which owns the vast majority of generation capacity in Tasmania; and recent entrant retailer Tango Energy is backed by Pacific Hydro, which operates around 450 MW of wind and hydro capacity.
Vertical integration may give rise to efficiencies that enhance a firm’s ability to compete against rivals. In response to the Preliminary Report, AGL commissioned a report by NERA, which sets out the following potential efficiencies from vertical integration:
�� reducing transaction costs
�� risk management
�� securing wholesale supply for the retailer (and securing a buyer for the generator’s output)
�� ensuring adequate quality of supply.179
As NERA sets out, the latter two efficiencies (securing supply and ensuring quality of supply) are not likely to be significant in the NEM, where the spot market allocates electricity to meet demand via a merit order based on generation cost (as revealed by generator bids).
The risk management benefits of vertical integration are noted at the outset of this chapter and are depicted in section 5.2.1. In essence, the ability to increase or decrease generation output facilitates a more flexible hedge against the retailer’s change in demand. This flexibility is difficult to achieve through contracts, which typically specify a fixed volume.
The reduction in transaction costs from vertical integration may be significant. Establishing and maintaining a portfolio of contracts is a significant undertaking that requires ongoing management and negotiation. Vertical integration may alleviate these costs. However, vertically integrated retailers continue to participate in contracting markets to some degree, so these costs are not entirely avoided. And, as NERA notes, vertical integration may give rise to its own inefficiencies, such as more complicated management structures that are less effective at directing each individual part of the business.
The trend towards vertical integration in the NEM suggests that, overall, these efficiencies (and any other benefits, such as wholesale market profits) outweigh their costs.
5.4.1 Impact on hedging marketsThe ACCC’s Preliminary Report raised concerns about the degree of liquidity in hedging markets, particularly in South Australia.180 The ACCC noted that vertical integration has increased substantially in the NEM since competition was introduced, and that stakeholders have raised concerns about the effect vertical integration has had on liquidity.181
Vertical integration reduces overall hedging market activity. Generators and retailers that would previously contract with one another are now part of the same business and therefore do not need to
179 NERA Economic Consultants, International Experience of Vertical Integration in the Electricity Sector. A Report for AGL Energy Ltd, 22 November 2017, pp. 4–7.
180 ACCC, Retail Electricity Pricing Inquiry—Preliminary Report, 22 September 2017, pp. 7, 103–104.181 ACCC, Retail Electricity Pricing Inquiry—Preliminary Report, 22 September 2017, pp. 7, 77, 82, 102–103.

124 Retail Electricity Pricing Inquiry—Final Report
participate in hedging markets to the same extent. A number of stakeholders have pointed out that, in theory, vertical integration’s effect on hedging markets is neutral: supply of contracts is reduced when a previously standalone generator aligns with a single retailer, but demand for contracts is also reduced when the retailer is able to access internal generation capacity. These submissions suggest that these two effects counterbalance each other, leaving the hedging market functioning similarly to before.182
Vertically integrated retailers also made submissions that outlined their continuing participation in hedging markets.183 As noted in the introduction to this chapter, vertical integration is rarely a perfect hedge, so vertically integrated businesses will still participate in contracts markets to optimise their risk management.
AGL provided a Frontier Economics report on this issue to the ACCC in the second stage of the Inquiry. Frontier’s report takes two instances of major generation assets becoming vertically integrated (AGL’s acquisitions of Macquarie Generation and Loy Yang A), and compares a particular metric of market liquidity pre- and post-acquisition. Frontier finds that the liquidity metric increases after each acquisition.184
Frontier’s report suggests that, in these two instances, vertical integration removed more supply of contracts than demand for contracts. However, the liquidity metric that is the focus of the report (which compares demand for hedges with hedges sold in the market) still increased.185
While the ACCC accepts the logic of Frontier’s results, the chosen liquidity metric has its own limitations. For example, based on Frontier’s estimate of the effect of vertical integration on supply and demand for contracts, further vertical integration would cause the liquidity metric to continue increasing, even as the amount of contracts supplied into the market diminished. In reality, declining market activity imposes greater risk on all participants, and limits the ability of non-vertically integrated retailers to operate.
Origin also provided a consultant’s report (from Competition Economists Group) on the effect of vertical integration on contract market liquidity. The report argues that liquidity should be thought of as how responsive suppliers of contracts are to changes in prices, and that a liquid market is one in which suppliers respond to an increase in price by significantly increasing their supply into the market. The paper then argues that vertical integration does not affect the incentives of retailers or generators to respond to changes in price, and therefore has no effect on liquidity.
Again, the ACCC understands the rationale behind the paper’s conclusions and accepts that they provide some insight into the behaviour of different suppliers of hedge contracts. However, increases in the price of hedge contracts typically also reflect significant additional risk for retailers exposed to spot prices, and in such circumstances one of the key benefits of vertical integration is the retailer’s preferential access to generation capacity. While this access is efficiency enhancing for the vertically integrated business, it also likely reduces the business’s overall supply of contracts into the market.
The retail market has tended towards a dynamic in which competition primarily takes place between vertically integrated retailers, with standalone retailers mostly being new entrants. The efficiency advantages of vertical integration are likely to be a significant driving force in this trend. However, as noted in section 5.2.2, standalone and new entrants now have very few potential counterparties for some key risk management tools.
By comparison, in mid-2017 CS Energy entered into a wholesale supply arrangement with Alinta that has facilitated Alinta becoming a new, aggressively priced retailer in the south east Queensland market. The ACCC has separate concerns about the Queensland wholesale market (see chapters 3 and 4), but the significant standalone generation in Queensland represents one of the few sources of potential wholesale market support that would facilitate aggressive retail entry and expansion. In other states, such an entrant would need to secure competitive wholesale support from vertically integrated businesses that have their own significant incumbent retail customer bases.
182 See AGL, Submission to ACCC Preliminary Report, 17 November 2017, p.12; NERA, Economic Consultants, International Experience of Vertical Integration in the Electricity Sector. A Report for AGL Energy Ltd, 22 November 2017, pp. 8–9.
183 See AGL, Submission to ACCC Preliminary Report, 17 November 2017; p.12, Origin, Submission to ACCC Preliminary Report, 30 November 2017, p.22; EnergyAustralia, Submission to ACCC Preliminary Report, 28 November 2017, p.16.
184 Frontier Economics, Contract market liquidity in the NEM. A report prepared for Herbert Smith Freehills, May 2018.185 Frontier Economics, Contract market liquidity in the NEM. A report prepared for Herbert Smith Freehills, May 2018, pp.11–12.

125 Retail Electricity Pricing Inquiry—Final Report
5.4.2 Transfer pricesThe way vertically integrated businesses allocate the wholesale electricity produced by their generation arm and used by their retail arm is generally through a transfer price. A transfer price represents the dollar amount per unit of electricity that the generation business produces for the retail business.186
A number of components may go into setting transfer prices, including:
�� the types of generation assets owned by the business
�� the amount of additional hedging the business needs to undertake in each region in order to cover its retail load
�� the volatility of contracting markets in each relevant region
�� fuel costs
�� the strategy of the business.
Transfer prices may also differ across customer types, especially if these segments have different load profiles. For a very large customer, a retailer may calculate an individual transfer price that incorporates that customer’s specific load profile.
Transfer prices are used within vertically integrated businesses for two main purposes:
�� as a cost of wholesale electricity for the retail business to incorporate into its prices
�� as an accounting tool to allocate profit between the wholesale and retail arms of the business.
The majority of vertically integrated businesses calculate a transfer price based on what they could sell the same electricity for in contracts with third parties. In an economic sense, the retail arms of vertically integrated businesses are paying the ‘opportunity cost’ of the business’s generation capacity. The retailer will therefore be incurring a wholesale electricity cost comparable to a standalone retailer contracting through the market. In these circumstances, the economic benefits of vertical integration are largely accruing to the wholesale arm of the business.
There are a number of reasons why a vertically integrated business may choose to apply a transfer price that mimics what a standalone retailer would pay. By setting the transfer price at this level, the business may be better able to assess the performance of the retail arm (for example, by benchmarking against the performance of other retailers). If the retail arm received a lower price than available from the market, it might be more difficult to measure the performance of the retail business against its competitors.
Setting such a transfer price also allows the wholesale business to capture the benefits of increases in wholesale prices. In times of high spot market prices, such as the recent period in the NEM, this approach is likely to maximise the profits of the wholesale business. This may be efficient in that it transmits investment signals to the wholesale business and stimulates the development of new capacity that ultimately reduces spot market prices. However, the trade-off is the retail business having to pass these higher costs through to end consumers.
Whatever the reason for this practice, the documents obtained by the ACCC suggest that consumers are not receiving the direct benefits of vertical integration (that is, lower wholesale electricity costs). This does not mean there is no benefit to consumers from vertical integration. Some indirect benefits may flow through to consumers, such as reducing the risk costs in the business, and encouraging investment in new generation assets.
Transfer price data from vertically integrated businessesTo assess concerns raised about vertical integration, the ACCC sought information on the transfer prices used in each vertically integrated business in the NEM between 1 July 2015 and early 2018. To reduce the volume of data received, this request was limited to transfer prices associated with ‘mass market’ customers (that is, residential and SME customers).
Responses from retailers reveal that most vertically integrated businesses set a single mass market transfer price each year. A few retailers have more intricate practices such as updating their
186 In practice, all electricity produced by the generation business goes through the NEM spot market and is dispatched by AEMO. Retailers, including the vertically integrated business’s retail arm contribute to the demand for electricity in the spot market. In a risk management sense, the transfer price represents the fixed price paid by the retailer (and received by the generator) for any volumes of electricity that the retail arm received from the spot market and the generation arm also dispatched into the spot market.

126 Retail Electricity Pricing Inquiry—Final Report
transfer price more regularly, or applying different prices at different times (for example, peak and off-peak prices).
Transfer prices increased significantly between 2015 and 2018, as shown in figure 5.9. In NSW, Victoria and South Australia, average transfer prices nearly tripled over this period.
Figure 5.9: Average mass market transfer price, by region ($/MWh)
0
20
40
60
80
100
120
140
160
180
200
Victoria NSW South Australia South east Queensland
$/M
Wh
2015 2016 2017 2018
Source: ACCC analysis based on retailers’ data. Calculated as the simple average of transfer prices set during that calendar year.
As a point of comparison to each transfer price, the ACCC identified ASX traded annual swap contracts that match the region and time period that each transfer price was in effect. These contracts are traded regularly in the lead-up to the commencement of each period and provide a good representation of the market’s expectation of wholesale electricity prices for the upcoming year. The weekly closing price in the final week before each period commenced is reported in table 5.4.
Comparing the transfer prices to the relevant forward prices allows us to observe the type of premiums vertically integrated businesses pass through to their retailers. The higher the premium, the less likely the retail business will be able to price competitively in the retail market. A higher premium also suggests that profit is being allocated to the wholesale business.
The minimum, maximum and average transfer price premiums in each state across the sample are presented in figure 5.10. This comparison exercise shows that there is significant dispersion in transfer prices, with some businesses taking an aggressive approach and setting transfer prices below the forward curve while others add substantial premiums above the market expectation of future prices.
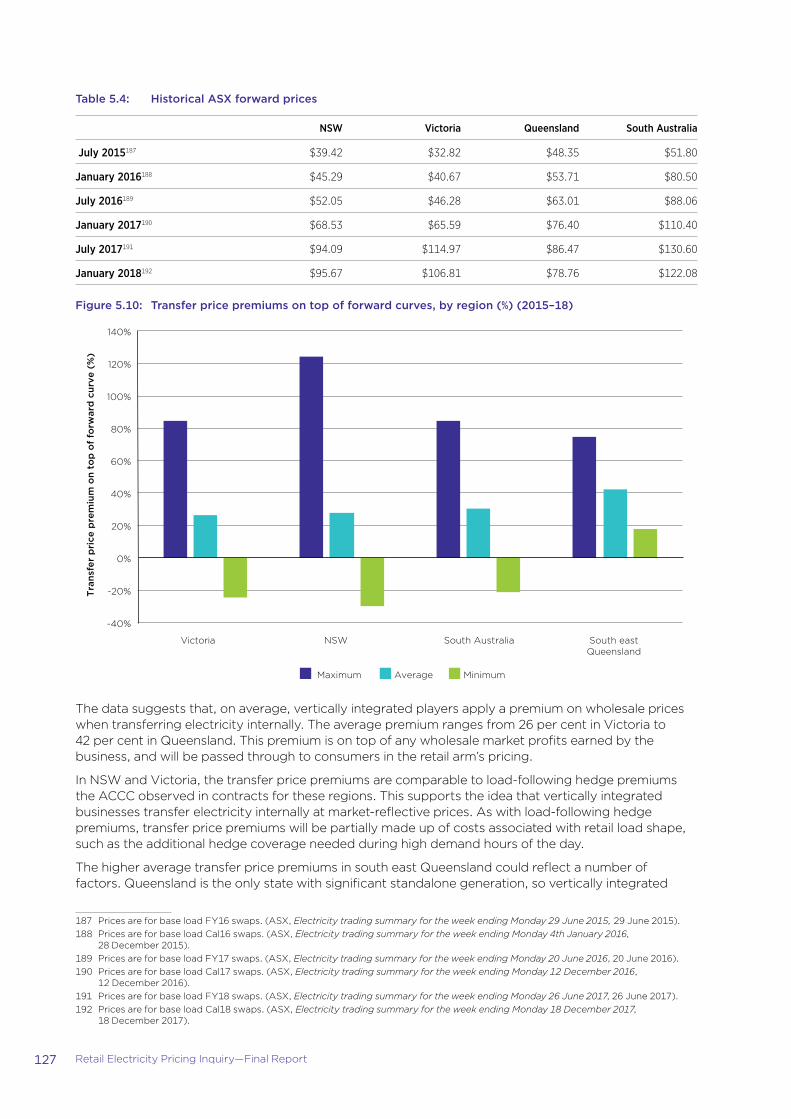
127 Retail Electricity Pricing Inquiry—Final Report
Table 5.4: Historical ASX forward prices
NSW Victoria Queensland South Australia
July 2015187 $39.42 $32.82 $48.35 $51.80
January 2016188 $45.29 $40.67 $53.71 $80.50
July 2016189 $52.05 $46.28 $63.01 $88.06
January 2017190 $68.53 $65.59 $76.40 $110.40
July 2017191 $94.09 $114.97 $86.47 $130.60
January 2018192 $95.67 $106.81 $78.76 $122.08
Figure 5.10: Transfer price premiums on top of forward curves, by region (%) (2015–18)
-40%
-20%
0%
20%
40%
60%
80%
100%
120%
140%
Victoria NSW South Australia South east Queensland
Tra
nsfe
r p
rice
pre
miu
m o
n to
p o
f fo
rwar
d c
urve
(%
)
Maximum Average Minimum
The data suggests that, on average, vertically integrated players apply a premium on wholesale prices when transferring electricity internally. The average premium ranges from 26 per cent in Victoria to 42 per cent in Queensland. This premium is on top of any wholesale market profits earned by the business, and will be passed through to consumers in the retail arm’s pricing.
In NSW and Victoria, the transfer price premiums are comparable to load-following hedge premiums the ACCC observed in contracts for these regions. This supports the idea that vertically integrated businesses transfer electricity internally at market-reflective prices. As with load-following hedge premiums, transfer price premiums will be partially made up of costs associated with retail load shape, such as the additional hedge coverage needed during high demand hours of the day.
The higher average transfer price premiums in south east Queensland could reflect a number of factors. Queensland is the only state with significant standalone generation, so vertically integrated
187 Prices are for base load FY16 swaps. (ASX, Electricity trading summary for the week ending Monday 29 June 2015, 29 June 2015).188 Prices are for base load Cal16 swaps. (ASX, Electricity trading summary for the week ending Monday 4th January 2016,
28 December 2015).189 Prices are for base load FY17 swaps. (ASX, Electricity trading summary for the week ending Monday 20 June 2016, 20 June 2016).190 Prices are for base load Cal17 swaps. (ASX, Electricity trading summary for the week ending Monday 12 December 2016,
12 December 2016).191 Prices are for base load FY18 swaps. (ASX, Electricity trading summary for the week ending Monday 26 June 2017, 26 June 2017).192 Prices are for base load Cal18 swaps. (ASX, Electricity trading summary for the week ending Monday 18 December 2017,
18 December 2017).

128 Retail Electricity Pricing Inquiry—Final Report
businesses will be undertaking a substantial amount of their hedging through contracts. The higher transfer price may therefore reflect inefficiencies that could be overcome by vertical integration. However, the ACCC considers that other factors are likely to be relevant. As noted in chapters 2 and 3, the wholesale market in Queensland is concentrated and has had a history of wholesale market behaviour issues, which resulted in specific government intervention in mid-2017. The higher premiums may reflect this additional risk. South east Queensland also has the fewest vertically integrated businesses in our sample; two of these businesses (Origin and AGL) account for over 70 per cent of the market by themselves, so higher transfer price premiums may reflect less competition at the retail level.
The average premium in South Australia is higher than in NSW and Victoria, but lower than in Queensland. Factors such as the less liquid contracts market are likely to push the premium up. South Australia has more vertically integrated players than Queensland, but fewer than NSW and Victoria.
The data also shows that there is significant dispersion in transfer prices. Some of this dispersion may represent different hedging strategies (or execution of those strategies). For example, a high transfer price might reflect that the business committed to a number of hedging contracts that have turned out to be poor value compared to the market. A low transfer price may also reflect a policy of incorporating historical contract prices into the transfer price when contract prices are rising rapidly.
Some of the dispersion is likely to reflect competitive dynamics. Transfer prices set below contemporary ASX prices may reflect an intention within the vertically integrated business to achieve low retail prices. The ACCC’s analysis reveals few instances of negative premiums, but it is notable that all are from small- to medium-sized businesses.
On the other hand, the high transfer prices raise concerns about the potential for substantial profit to be allocated to the wholesale businesses. The premiums in this analysis are on top of contract prices (which, during the period sampled, are themselves above generation costs), so even the average transfer prices suggest the efficiencies from vertical integration are largely captured as wholesale profit. As noted above, the similarity between average transfer price premiums and load-following hedge premiums suggests that vertically integrated players are incorporating the shape risk of retail loads into their transfer prices. This likely reflects the opportunity cost approach to transfer pricing that was identified in the introduction of this section.
However, the size of the largest transfer prices in the data set raises concerns about the ability of vertically integrated businesses to shift substantial profit into the wholesale business. As one vertically integrated player put it in an internal document, ‘there will always be a goal for owners of generation to maximise returns from their assets in a market where retail is effectively a wholesale pass through in terms of pricing.’
In a competitive retail market, it is difficult to see how the very high transfer prices identified above could be passed through to consumers without inducing significant substitution away from that retailer. The ACCC considers that these transfer prices provide further evidence of ineffective competition between retailers.
5.4.3 ACCC findings regarding vertical integrationThe impact of vertical integration on contracting markets is complex but, generally, vertical integration results in an overall decrease in contract market activity by that business. The degree of vertical integration in the NEM may also be limiting the ability of standalone retailers to aggressively win customers as any significant expansion of retail market share will require securing wholesale supply from a competitor.
ACCC analysis of internal documents from vertically integrated businesses suggest that these businesses set their transfer prices on an ‘opportunity cost’ basis. This means that the retail arms of these businesses are receiving wholesale electricity at a price comparable to a standalone retailer.
ACCC analysis of transfer price data from vertically integrated businesses broadly supports the opportunity cost approach, with most transfer prices set at a premium above ASX contract markets that is comparable to the premium on ‘all-in-one’ hedging products such as load-following hedges.
The ACCC also found instances of very low transfer prices in the data, which may suggest attempts to sacrifice wholesale margin in order to compete more vigorously in the retail market.

129 Retail Electricity Pricing Inquiry—Final Report
On the other hand, transfer price data included some examples of very high transfer prices. This raises concerns about the degree to which vertically integrated businesses are constrained by retail competition.
The analysis of vertically integrated businesses shows that they are able to allocate profit between their retail and wholesale arms. It is important to keep this in mind when assessing the retail margins or profitability of the retail business by itself. An apparently uncompetitive retail business may in fact be connected to a very profitable wholesale operation.
5.4.4 Policy options regarding vertical integrationThe ACCC’s findings regarding vertical integration (and on risk management practices more generally) suggest that vertical integration has had a mixed impact on wholesale and retail competition in the NEM. Vertically integrating has allowed generators and retailers to more efficiently manage their wholesale price risk while providing additional financial stability to invest and compete. However, the decline in standalone generation has limited other market participants’ ability to manage their wholesale market risk and may be creating a substantial barrier to expansion (and more vigorous competition) in the retail market.
The ACCC has considered two potential interventions regarding vertical integration:
�� market making obligations on vertically integrated businesses
�� requiring vertically integrated retailers to operate at ‘arm’s length’ from their wholesale arm (essentially, a ‘functional separation’ of the generation and retail businesses).
Market making obligationsMarket making obligations require the owners of generators to make offers to buy and sell hedge contracts at regular intervals (typically during a specified time window each day). Obligated entities are required to post prices at which they are willing to trade particular hedge products. Each entity will generally be required to make offers for a minimum quantity of each product type. Offers are posted on a trading exchange so market participants are able to observe them and quickly act if they wish to engage in trading. To ensure posted prices are not set well above competitive levels for offers to sell (or well below competitive levels for offers to buy), the spread between the two prices is typically restricted.
Market making arrangements aim to create a baseline level of market activity and provide counterparties for participants seeking hedges. They are therefore particularly beneficial in markets that are characterised by infrequent trading and dominated by a few, large businesses. Market making obligations tend to be applied to vertically integrated businesses that may otherwise not be incentivised to participate in trading markets (or at least, not participate enough to foster an active market that other participants can use to effectively manage their risk). Market making obligations of this type exist in a number of jurisdictions internationally, including Great Britain and New Zealand.193
In New Zealand, market making was introduced in 2010. New Zealand’s four large gentailers post prices for each day for a 30-minute period. Initially market making was only for quarterly baseload (flat) contracts but now includes monthly baseload contracts. Market making for cap contracts has been identified as a next step. Minimum volumes are specified: 3 MW on each side (that is, available to buy and sell) for the quarterly baseload contracts and 2 MW for the monthly baseload futures. For the New Zealand market, the default ASX trade size is 0.1 MW (compared to 1 MW in Australia), so up to 30 quarterly and 20 monthly contracts may be traded under the minimum volumes.
In Great Britain, market making obligations were introduced in 2014 and apply to Great Britain’s six large gentailers. Each day, for two 60-minute windows, these six businesses must post prices at which they will buy and sell contracts. Prices for contracts up to two years into the future must be posted. 194
193 In New Zealand, these obligations take the form of an agreement between certain large, vertically integrated businesses and the ASX, rather than prescribed under regulation. These agreements were encouraged by local regulators.
194 As part of the Inquiry, the ACCC commissioned HoustonKemp to undertake an international review of market power mitigation measures, which includes a case study on Great Britain’s market making obligations (Case Study 7): HoustonKemp, International review of market power mitigation measures in electricity markets, a report for the Australian Competition and Consumer Commission, May 2018 (available at appendix 9).

130 Retail Electricity Pricing Inquiry—Final Report
The level of trading activity in Victoria, NSW, and Queensland is high enough that market making obligations may not noticeably improve the level of market activity. However, we consider that South Australia has significant potential to benefit from market making obligations.
In a relatively small and concentrated (in both wholesale and retail markets) region like South Australia, market making obligations would likely enhance contract market liquidity and reduce risk management costs for non-obligated participants. Improving retailers’ access to risk management products would likely boost competition in the retail market.
Such an intervention would involve risks. The burden of market making would likely fall on the few owners of dispatchable generation capacity in South Australia. South Australia’s wholesale prices are particularly volatile and market making costs may be substantial during periods of volatility. However, this volatility is one of the impediments to effective contracting in South Australia, which reinforces the potential benefits of market making.
Given the persistent low levels of activity in the South Australian contracting market, the ACCC considers that market making obligations are warranted in the region. The potential benefits of market making in South Australia are significant, and any improvements to contract market activity will flow through to the retail market.
The ACCC is therefore recommending that the AEMC introduce market making obligations in South Australia. The AEMC should review the mechanism after an appropriate period of time (for example, after two years) to assess its effect on market activity, liquidity and risk to determine if it should be continued, amended or removed in South Australia. At that time, consideration should be given to whether the mechanism should, based on market conditions at the time, be extended to other NEM regions.
The ACCC notes that the ESB is considering a market making-type obligation as part of the design of the NEG (the ESB’s mechanism is referred to as a ‘Market Liquidity Obligation’, and is discussed in section 5.5.2). The ACCC’s market making obligations in South Australia should be designed in such a way as to ensure that the two mechanisms can work together.
Recommendation 7The AEMC should introduce market making obligations in South Australia, which require large, vertically integrated retailers to make offers to buy and sell specified hedge contracts each day, in order to boost hedge market activity. The parameters of a market making obligation should have regard to:
�� the size of the South Australian market
�� the distribution of generation ownership in the region
�� the benefits to market liquidity and efficiency of regular trading activity
�� the burden of the requirements on obligated entities
�� any impact on the incentives of intermittent generators to invest in firming technology.
After an appropriate period of time (for example, after two years) the mechanism should be assessed for its effect on market activity, liquidity and risk to determine if it should be continued, amended or removed in South Australia and, potentially, extended to other NEM regions.
Requiring vertically integrated retailers to operate at arm’s length from their wholesale businessesAnother option for dealing with vertical integration is to require vertically integrated retailers to be functionally separated so that they are not able to set aside internal generation capacity to meet their own retail load. Instead, any allocation of capacity between the wholesale business and retail business would need to be supplied on an arm’s length basis.
Restricting vertically integrated retailers from undertaking wholesale electricity risk management internally would mean these retail businesses would need to secure hedging contracts for the entirety of their needs from contracting markets. The wholesale arm of vertically integrated players would

131 Retail Electricity Pricing Inquiry—Final Report
therefore be incentivised to source secure streams of income for their generation from contracting markets as well. These contracting arrangements would substitute for the allocations of retail load and wholesale generation usually undertaken within the vertically integrated business.
Such an intervention would likely boost trading activity in hedging markets. Significantly more retail load would need to be hedged through contracts (in place of internal transfers used currently), and much of the generation capacity that is currently reserved for internal risk management would be sold into contracting markets in order to meet demand. This greater market activity would likely enhance the ability of small and standalone retailers to manage their risk. An enhanced contracting market may also provide more accurate price information to the electricity sector, especially in regions that are currently illiquid, such as South Australia.
However, by negating many of the benefits of vertical integration, such an intervention may increase overall costs in the industry and raise prices. Restricting the ability of vertically integrated businesses to manage risk internally would likely increase their exposure to wholesale price risk, which may also inhibit investment in new generation, or increase the cost of any investments.
The goal of any intervention must be to improve outcomes for end consumers. While there are potential benefits to requiring vertically integrated players to functionally separate, we must also have regard to potential costs.
The ACCC accepts that the market trend towards vertical integration likely reflects competitive advantages of such a business structure, and that vertical integration therefore has the potential to be pro-competitive. Indeed, a number of small and medium sized retailers are vertically integrated, or are pursuing vertical integration.
The ACCC remains concerned about the current combination of vertical integration and market concentration (both in the wholesale and retail markets), and considers that such a combination reduces the likelihood that vertical integration is enhancing competition in these markets. Vertical integration reduces contract market activity, which makes it harder for other retailers to manage their wholesale price risk. The lack of liquidity in contract markets has the potential to become a barrier to entry and expansion for retailers in the NEM (and is already operating as such a barrier in South Australia).
However, given that the ACCC is recommending:
�� the introduction of market making obligations in South Australia (discussed above)
�� significant reforms in the wholesale market to lessen concentration (see chapter 4)
�� improvements to retail pricing and consumers’ ability to compare and select offers (see chapter 6 and part 3)
we consider it would be premature to recommend that vertically integrated players be required to operate on an arm’s length basis.
Vigorous competition in the wholesale and retail sectors is likely to drive positive outcomes for consumers regardless of whether these sectors are predominantly characterised by standalone generators and retailers, or by vertically integrated gentailers. However, if the industry continues to trend towards vertical integration, contract market liquidity is likely to remain a concern and the ability of smaller retailers to capture market share from the big three is likely to continue to be limited. In such a situation, the advantages that large, vertically integrated players have in the retail market may become further entrenched. Should competitive outcomes for consumers not improve, further direct intervention regarding vertical integration may need to be revisited particularly by considering extending market making obligations.
5.5 Implications for the National Energy GuaranteeAs noted in chapter 4, in October 2017 the ESB provided the COAG Energy Council with advice on changes to the NEM regarding system reliability and electricity sector emissions reductions. The proposals are known as the NEG. The NEG has two main mechanisms:
�� a ‘reliability requirement’
�� an ‘emissions requirement’.
132 Retail Electricity Pricing Inquiry—Final Report
Together these two requirements aim to incentivise investment in generation assets (and other technologies) to simultaneously improve the reliability of the NEM and meet Australia’s international emissions reductions commitments.
Under the NEG, retailers will need to demonstrate that they have certain contracts in place that comply with NEG requirements. At the time of publishing this report, the exact form of these contracts has not been determined, but the ESB’s Draft Detailed Design Consultation Paper (June 2018) suggests that:
�� for reliability, ‘any wholesale contract with a direct link to the electricity market which a liable entity uses to reduce exposure to high spot prices should qualify’, subject to certain firmness tests195
�� for emissions, a repository of emissions will be created in which each retailer will be allocated emissions from generation that is associated with their electricity load. NEM participants will be able to negotiate the transfer of emissions allocations in order to meet the NEG emissions requirement.
The NEG will therefore have significant implications for contract markets in the NEM, and will rely on the existence of effective contracting markets in order to operate efficiently.
In consultation on the NEG, a number of stakeholders (including the ACCC196) raised concerns about imposing contracting requirements on retailers when a significant proportion of the market is vertically integrated. Vertically integrated participants are able to access their own generation to meet NEG requirements, and may have the ability or incentive to restrict access to third parties. In such a situation, an unintended consequence of the NEG could be to create substantial new barriers to entry and expansion in electricity retailing.
In response to these concerns, the ESB’s Draft Detailed Design Consultation Paper (June 2018) proposes that large, vertically integrated retailers would be subject to a ‘Market Liquidity Obligation’ during periods in which the reliability requirement has been triggered.197
As set out in this chapter, the ACCC is making two recommendations on NEM contracting markets:
�� a repository of OTC trades (see section 5.3.5, recommendation 6)
�� market making obligations in South Australia (see section 5.4.4, recommendation 7).
These two recommendations seek to address issues that overlap with issues the ESB is considering in the design of the NEG. The potential interrelation between each ACCC recommendation and the NEG is discussed below.
5.5.1 OTC contracts and the NEGThe ESB is considering how OTC contracts can be incorporated into the NEG. As OTC contracts are business-to-business, the NEG regulator may not be able to easily verify the authenticity of OTC contracts. The ESB has identified a repository of OTC contracts as an option for improving transparency over OTC activity.
The ESB considered excluding OTC contracts from NEG eligibility and instead only allowing centrally cleared contracts to be eligible. However, the ESB has noted limitations to only allowing centrally cleared contracts. In particular:
�� limiting flexibility through use of only standardised contracts
�� reducing innovation by hindering new product development
�� increased prudential, margining and transaction costs that could disproportionately harm smaller participants
�� creating an illusion of liquidity while volumes can continue to be traded through off-market trading mechanisms.198
The ACCC shares these concerns and supports the ESB’s intention to allow OTC contracts to be eligible for the purposes of the NEG.
195 ESB, National Energy Guarantee: Draft Detailed Design Consultation Paper, 15 June 2018, p. 39.196 ACCC, Letter to Dr Kerry Schott AO re: National Energy Guarantee—draft design consultation paper, 8 March 2018.197 ESB, National Energy Guarantee: Draft Detailed Design Consultation Paper, 15 June 2018, p. 41.198 ESB, National Energy Guarantee: Draft Detailed Design Consultation Paper, 15 June 2018, p. 40.

133 Retail Electricity Pricing Inquiry—Final Report
The ACCC’s survey of the OTC market reveals that, while the OTC market is smaller than the ASX in terms of volumes traded and market activity, there is still a significant amount of risk management being undertaken via OTC contracts.
The OTC market also facilitates a number of important risk management activities that are not available via the ASX. Some of these activities, such as load-following hedges, are particularly valued by new entrant retailers. The flexibility of bilateral contracting is likely to reduce the cost of risk management for participants with particular needs. This flexibility may be particularly valuable in periods of transition or innovation, before new trading products have been standardised and accepted. The triggering of the NEG’s reliability requirement, and the subsequent need to find eligible contracts, may give rise to such a period of transition.
The ACCC is also aware of a number of small retailers that participate in the OTC market but have not succeeded in meeting the requirements of ASX clearinghouses. Without the OTC market, these retailers would have limited ability to meet NEG reliability requirements.
For these reasons, including OTC contracts in the NEG is likely to reduce the cost of any NEG reliability requirements on the retail market.
As noted above, to provide better price information in the market, the ACCC is recommending a requirement that OTC trades be reported to a repository administered by the AER and then published in a de-identified format. The repository should be designed in such a way that it can also serve as a repository for the purposes of the NEG.
5.5.2 Vertical integration under the NEGGiven the extent of vertical integration in the NEM, vertically integrated businesses will have substantial obligations under the NEG in the event the reliability requirement is triggered. They will also have internal access to much of the generation capacity needed to meet NEG requirements, which raises concerns about smaller retailers’ ability to access the necessary contracts to comply with the NEG.
For these reasons, the ESB is proposing that large, vertically integrated retailers be subject to a ‘Market Liquidity Obligation’. The ESB’s Market Liquidity Obligation appears to contemplate the same type of market making arrangement that the ACCC is recommending be introduced in South Australia (see section 5.4.4, recommendation 7).
While the final design of the Market Liquidity Obligation (and the NEG more broadly) is yet to be determined, the ACCC considers the Market Liquidity Obligation should improve market activity and give small retailers more opportunities to find the contracts needed to comply with the NEG.
Under the NEG, the Market Liquidity Obligation will only be imposed in the event that the reliability requirement is triggered. Once triggered, vertically integrated retailers to which the Market Liquidity Obligation applies would be required to post bids and offers for contracts that cover the period for which there is a forecast shortfall in generation. The NEG’s Market Liquidity Obligation is therefore likely to be an intermittent feature of the NEM that will only cover specific time periods.
To minimise disruption to contract markets when the NEG Market Liquidity Obligation is triggered, the market making obligations the ACCC is recommending be introduced in South Australia should be interoperable with the NEG’s Market Liquidity Obligation. The ACCC’s market making obligation in South Australia is intended to be ongoing (at least so long as it is necessary for market liquidity purposes) and so should already be in place during any NEG reliability event in South Australia. In the event of the NEG’s reliability requirement being triggered in South Australia, interoperability between the ACCC’s market making obligation and the NEG’s Market Liquidity Obligation would mean the existing market making mechanisms could remain operating as usual, with contracts relating to the reliability requirement being added as needed.

134 Retail Electricity Pricing Inquiry—Final Report
6. Retail competitionIn the Inquiry’s Preliminary Report we identified that the big three continue to hold a very significant share of retail customers in the NEM despite the entry of a number of other players in recent years. This chapter explores the current state of competition in the retail market and considers ways in which competition could be improved to benefit consumers.
The introduction of retail competition is still relatively recent, commencing in most NEM regions in the early- to mid-2000s. Price controls were removed only in 2009 (Victoria), 2013 (South Australia), 2014 (NSW), and 2016 (south east Queensland).
As illustrated in chapter 1, over the past 10 years customer bills have increased significantly. Retail price announcements for the second half of 2018 suggest prices may fall by a small amount or remain flat as the recent surge in wholesale prices eases, although prices are likely to remain significantly elevated compared to earlier years.
While there have been some positive signs, the results of opening retail electricity markets up to competition have largely fallen short of expectations. Most significantly, retailer costs have increased, particularly the costs dedicated to acquiring customers (see chapter 10). These costs are passed on to consumers through higher prices. This was not the intention of reforms designed to create lean, efficient retailers and to reduce electricity prices.
As set out in chapter 1, the retail component of the supply chain is responsible for around 16 per cent of the average residential bill. It is the third largest component behind networks (43 per cent) and wholesale (34 per cent).
Effective competition between retailers is crucial for maintaining downward pressure on costs throughout the supply chain, and for passing through the benefits of cost reductions to consumers. Retail competition in the NEM has evolved substantially since the sector was deregulated, generally trending towards a concentrated, vertically integrated market. The ACCC has identified a number of factors that raise concerns about the way retail competition has developed in this market.
First, the retail landscape is concentrated. This is primarily the result of the way in which the customer bases of the publicly owned electricity providers were sold. These customer bases were largely acquired by AGL, Origin, and EnergyAustralia, which continue to hold by far the largest market shares today.
Second, flowing on from the market structure, are the advantages that these large retailers have over their smaller rivals and new entrants. In particular, the large customer bases that the big three purchased include inactive customers, who have rarely (if ever) changed retailers or deals. This has given the big players a stable and valuable revenue stream not available to new entrants and smaller retailers. Other advantages include economies of scale and a greater ability to take advantage of vertical integration.
Finally, the retail market has developed in a manner that is not conducive to consumers being able to make efficient and effective decisions about the range of available retail offers in the market. As set out in chapter 13, the focus on discounts has become counter-productive, with consumers unable to effectively compare and rank offers or have a clear idea of what price they will be paying. This leads to both inflated costs (because retailers ‘compete’ in inefficient ways to attract and retain customers), poor outcomes for individual consumers and an inability for smaller retailers to put significant competitive pressure on larger retailers when confusion prevails in the market.
These factors are explored further in this chapter.

135 Retail Electricity Pricing Inquiry—Final Report
6.1 Update on competitive landscapeIn the Inquiry’s Preliminary Report, we pointed to high levels of concentration in the competitive retail electricity markets. Updated information on the residential customer market shares of retailers in the NEM is illustrated in figure 6.1.
Figure 6.1: Retail electricity market share (residential customers), March 2018
0%
20%
40%
60%
80%
100%
Other
Simply
Aurora
Snowy
ActewAGL
EnergyAustralia
Click
AGL
Alinta
Origin
NEMACTTasmaniaSouth AustraliaVictoria NSW South eastQueensland
% of
cus
tom
ers
Source: Queensland, NSW, South Australia, Tasmania and ACT: AER data, March 2018; Victoria: ESC Victoria, Victorian energy market report 2016–17.
Notes: * Victorian data is for June 2017.
** South east Queensland data has been calculated by subtracting Ergon Energy customers from Queensland market share figures and rebasing percentages.
The retail landscape across the NEM is largely unchanged since the publication of our Preliminary Report, with the big three retailers maintaining an aggregate market share of over 70 per cent. The dominance of the big three is particularly significant in NSW, where their combined market share is approximately 85 per cent, and south east Queensland, where Origin and AGL alone account for almost 75 per cent of residential customers. In Victoria, Red Energy and Lumo Energy (combined as ‘Snowy Hydro’ in figure 6.1) have achieved a comparable market share to any of the big three. Simply Energy also has a significant foothold in both the Victorian and South Australian markets.
Figure 6.1 also shows that the prevalence of new entrants into the retail market in recent years has not resulted in substantial erosion of market shares. The ‘Other’ category in figure 6.1, which comprises up to 18 retailers in some states, has not yet reached a 10 per cent market share in any state, and is still below 5 per cent across the NEM.
Tasmania and the ACT, where regulated prices remain, are still dominated by the local incumbents (Aurora Energy and ActewAGL respectively). Regional Queensland, which is not included in figure 6.1, also retains regulated pricing and is dominated by incumbent Ergon Energy.
The focus of this chapter is on the regions which have moved to full retail competition and unregulated pricing, namely Victoria, NSW, South Australia and south east Queensland.
The market shares of the big three are slowly falling. In the Preliminary Report, we noted that the big three had lost 7.5 per cent of their combined market share since 2012. Updated figures, reported in table 6.1, show that by March 2018 this loss had increased to around 9.2 per cent.

136 Retail Electricity Pricing Inquiry—Final Report
Table 6.1: Market share won/lost in the NEM since 2012, small customers
March 2018 market share %* 2012 market share % Change %
Origin 27.1 32.2 –5.1
AGL 22.1 22.5 –0.3
EnergyAustralia 17.4 21.2 –3.8
Other 33.4 24.2 9.2
Source: Queensland, NSW, South Australia, Tasmania and ACT: AER data, March 2018; Victoria: ESC Victoria, Victorian energy market report 2016–17.
Notes: * Victorian data is for June 2017.
We expect that the biggest shift in that period has been the growth of Alinta, particularly in south east Queensland but also in other states. Snowy Hydro (under the Red Energy and Lumo Energy brands) has also grown significant market share.
In August 2017, Alinta formed a joint venture with CS Energy (a Queensland Government-owned generator) and the joint venture (under the Alinta brand) began offering a market leading, low-price offer in Queensland.199 At the end of January 2018, Alinta announced that since entering Queensland, it had already won over 100 000 south east Queensland electricity customers.200 We note that Alinta’s entry into Queensland has been facilitated by the presence of a large, standalone generator willing to partner with a new entrant retailer.
Even with Alinta’s aggressive entry into Queensland, the change in market share won by Tier 2 and 3 retailers since 2012 (from 7.5 per cent at the time of the Preliminary Report to 9.2 per cent now) is broadly in line with the general trend since 2012. So while the market share of the big three is being eroded, it is not happening quickly and does not appear to be gathering pace. This is consistent with the view of one of the big three retailers who noted in an internal document on its financial year 2017 outlook that ‘[n]iche players continue to enter but long lead times to winning share so no impact in the shorter-term’.
It is also notable that AGL has essentially maintained its market share over this six-year stretch, with almost all of the decline in market share being experienced by Origin and EnergyAustralia.
6.2 How is competition playing out in the market?In NSW, Victoria and south east Queensland, there are now more than 20 retailers offering electricity to residential customers, and around 40 across all customer types. South Australia has experienced more limited entry but still has close to 20 retailers.
In their submissions to the Inquiry’s Preliminary Report, large retailers were of the view that competition in the market was mostly working well, but some acknowledged that further improvements are needed:
�� AGL’s view was that competition between AGL, EnergyAustralia and Origin is ‘vigorous’.201
�� Alinta disagreed with the ACCC’s contention that there are significant issues with the operation of the retail electricity market.202
�� EnergyAustralia did not believe that the retail market is on the wrong trajectory although acknowledged that further improvements to encourage competition are necessary.203
�� ERM Power considered that, overall, competition has brought benefits to the retail segment but submitted that ongoing market scrutiny is needed.204
The signs of a competitive market are certainly present. For example, many retailers have entered the market in recent years and there is a proliferation of offers in the market, high levels of churn and extensive electricity marketing.
199 Alinta, Alinta Energy and CS Energy Help South East Queenslanders Save on Energy Bills, Media Release, 13 August 2017.200 Alinta, Canstar Blue: 5-star Alinta Energy has the most satisfied customers in Queensland, Media Release, 29 January 2018.201 AGL, Submission to ACCC Preliminary Report, 17 November 2017, pp. 5–6.202 Alinta, Submission to ACCC Preliminary Report, 17 November 2017, p. 2.203 EnergyAustralia, Submission to ACCC Preliminary Report, 28 November 2017, pp. 1–2.204 ERM Power, Submission to ACCC Preliminary Report, 17 November 2017, p. 2.

137 Retail Electricity Pricing Inquiry—Final Report
Retailers’ internal documents obtained by the ACCC in the course of the Inquiry also support the view that in many ways the market is competitive, with retailers very closely monitoring and carefully analysing the behaviour of their competitors. Internal documents suggest that the key focus has been on price competition, and, in particular, discounting, with retailers closely comparing the discounts they are offering into the market.
That said, there are significant concerns that the market is not delivering benefits for consumers.
6.2.1 Development of retailers in the marketThe ACCC’s analysis of the market suggests that the way in which the market has developed over time is significantly impacting the effectiveness of competition.
Energy Consumers Australia (ECA) provided a report from Finncorn Consulting that characterises retail electricity as a market with three distinct tiers of competitors:
�� Tier 1 (AGL, EnergyAustralia and Origin)—extensively vertically integrated and have strong balance sheets and substantial customer bases through which they can achieve economies of scale.
�� Tier 2 (for example, the Snowy Hydro retail brands, Red Energy and Lumo Energy, and a handful of other medium sized retailers)—typically are partially vertically integrated and have reasonably strong balance sheets, and sufficient customer numbers to achieve moderate economies of scale.
�� Tier 3 (the rest of the market)—have little or no generation assets, constrained balance sheets, and small or very small customer numbers.
Finncorn Consulting submitted that, instead of vigorously competing on price themselves, the Tier 1s allow the less efficient Tier 3 competitors to set the market price. The Tier 1s then match the Tier 3 price. Finncorn Consulting suggested that Tier 2s are most likely to be able to effectively constrain Tier 1s if they can continue to expand to achieve greater efficiencies.205
As discussed in section 6.3.1, margin information obtained by the ACCC supports this assessment of the market. The big three generally have much higher EBITDA than other retailer groups (though in 2013–14 and 2016–17 respectively, Tier 2 retailers have had comparable and even higher EBITDA figures). Small, Tier 3 retailers generally operate on thin margins.
To understand how the market has developed in this way, it is instructive to consider the historical development of the major retailers in the market. Box 6.1 sets out information about the history of all retailers in the NEM with more than 100 000 customers (together with ERM Power, a business-only retailer with the fourth largest load in the NEM206).
205 Finncorn Consulting Pty Ltd, Submission to ACCC Preliminary Report, 30 November 2017, pp. 5–6, 25–27.206 This figure is self-reported by ERM Power at https://www.ermpower.com.au/about-us/our-story/ (visited 25 May 2018).

138 Retail Electricity Pricing Inquiry—Final Report
Box 6.1: A survey of the medium to large retailers in the NEM
Retailer (approx. NEM electricity customers)207
History and key information
Origin (> 2 million)
Started as part of the major construction materials company, Boral.
In 2001–02, acquired the retail assets of Powercor and CitiPower in Victoria (two of the five formerly government-owned retailers).
In 2006, purchased Sun Retail (800 000 electricity customers) from the Queensland Government.
In 2011, purchased Integral Energy and Country Energy (combined 1.6 million electricity and gas customers) from the NSW Government.
Owns approximately 6000 MW of generation capacity in the NEM.
AGL (> 2 million)
Started as Australian Gas Light in Sydney in 1835 and grew to become the major natural gas supplier in NSW.
In 2000, purchased the retail component of the (formerly government-owned) Electricity Trust of South Australia and thereby acquired the vast majority of customers in the state.
In 1998 and 2002, purchased Solaris Energy and Pulse Energy respectively. These businesses represented two of the five formerly government-owned retailers and gave AGL approximately 42 per cent of the Victorian retail electricity market (and 36 per cent of the gas market) at that time.
Owns around 10 000 MW of generation capacity in the NEM.
EnergyAustralia (1.5–2 million)
Formerly TRUenergy and Texas Utilities (TXU). Now owned by CLP Group in Hong Kong. Owns over 5000 MW of generation capacity in the NEM.
In 1995, entered the Australian market by purchasing Eastern Energy, one of the five government-owned retailers in Victoria.
In 2010, purchased EnergyAustralia from the NSW Government (1.5 million electricity and gas customers).
Snowy Hydro (Red Energy and Lumo Energy) (700 000–1 000 000)
Snowy Hydro is government-owned and operates over 5000 MW of generation capacity in the NEM.
Red Energy was started by New Zealand’s largest energy company, Contact Energy, but was acquired by Snowy Hydro in late 2004. Snowy Hydro has grown the business from around 3000 electricity customers to 500 000 electricity customers today.
Lumo Energy was started by New Zealand infrastructure investor Infratil, which grew the business organically—primarily in Victoria. Snowy Hydro purchased Lumo Energy in 2014, acquiring over 500 000 electricity and gas customers and a small amount of diesel generation in South Australia. Following some migration of customers to Red Energy, Lumo Energy retains over 200 000 electricity customers today.
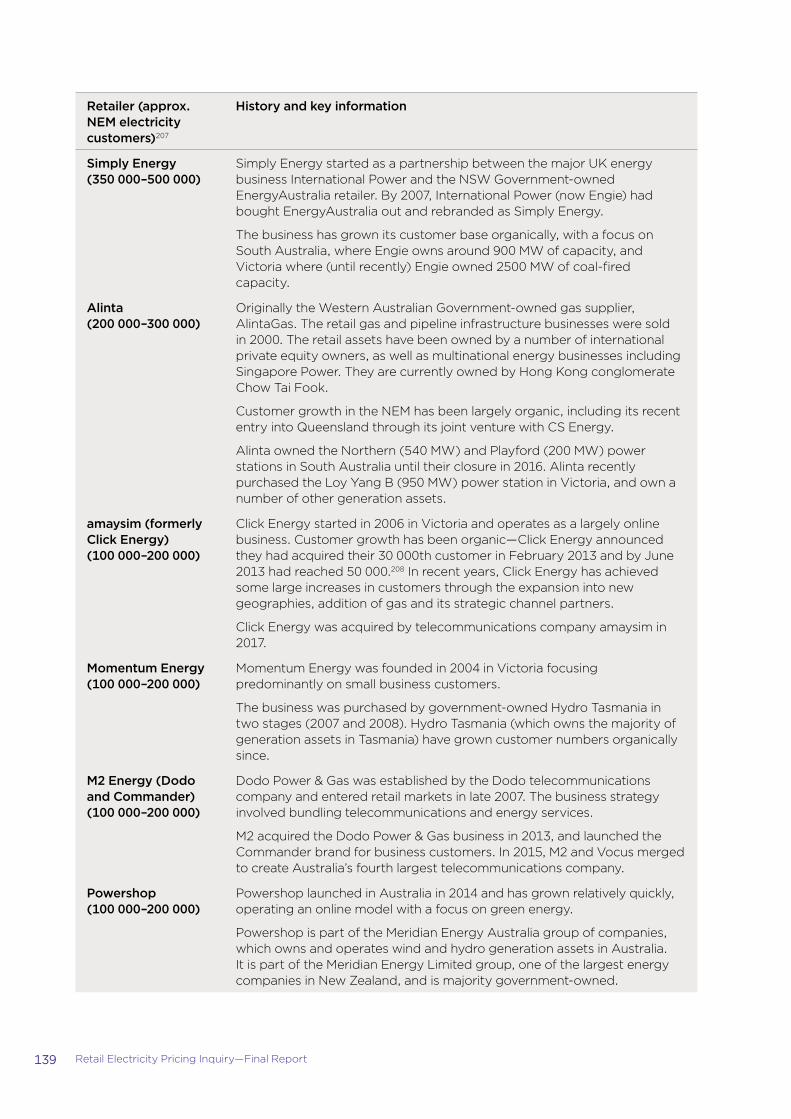
139 Retail Electricity Pricing Inquiry—Final Report
Retailer (approx. NEM electricity customers)207
History and key information
Simply Energy (350 000–500 000)
Simply Energy started as a partnership between the major UK energy business International Power and the NSW Government-owned EnergyAustralia retailer. By 2007, International Power (now Engie) had bought EnergyAustralia out and rebranded as Simply Energy.
The business has grown its customer base organically, with a focus on South Australia, where Engie owns around 900 MW of capacity, and Victoria where (until recently) Engie owned 2500 MW of coal-fired capacity.
Alinta (200 000–300 000)
Originally the Western Australian Government-owned gas supplier, AlintaGas. The retail gas and pipeline infrastructure businesses were sold in 2000. The retail assets have been owned by a number of international private equity owners, as well as multinational energy businesses including Singapore Power. They are currently owned by Hong Kong conglomerate Chow Tai Fook.
Customer growth in the NEM has been largely organic, including its recent entry into Queensland through its joint venture with CS Energy.
Alinta owned the Northern (540 MW) and Playford (200 MW) power stations in South Australia until their closure in 2016. Alinta recently purchased the Loy Yang B (950 MW) power station in Victoria, and own a number of other generation assets.
amaysim (formerly Click Energy) (100 000–200 000)
Click Energy started in 2006 in Victoria and operates as a largely online business. Customer growth has been organic—Click Energy announced they had acquired their 30 000th customer in February 2013 and by June 2013 had reached 50 000.208 In recent years, Click Energy has achieved some large increases in customers through the expansion into new geographies, addition of gas and its strategic channel partners.
Click Energy was acquired by telecommunications company amaysim in 2017.
Momentum Energy (100 000–200 000)
Momentum Energy was founded in 2004 in Victoria focusing predominantly on small business customers.
The business was purchased by government-owned Hydro Tasmania in two stages (2007 and 2008). Hydro Tasmania (which owns the majority of generation assets in Tasmania) have grown customer numbers organically since.
M2 Energy (Dodo and Commander) (100 000–200 000)
Dodo Power & Gas was established by the Dodo telecommunications company and entered retail markets in late 2007. The business strategy involved bundling telecommunications and energy services.
M2 acquired the Dodo Power & Gas business in 2013, and launched the Commander brand for business customers. In 2015, M2 and Vocus merged to create Australia’s fourth largest telecommunications company.
Powershop (100 000–200 000)
Powershop launched in Australia in 2014 and has grown relatively quickly, operating an online model with a focus on green energy.
Powershop is part of the Meridian Energy Australia group of companies, which owns and operates wind and hydro generation assets in Australia. It is part of the Meridian Energy Limited group, one of the largest energy companies in New Zealand, and is majority government-owned.

140 Retail Electricity Pricing Inquiry—Final Report
Retailer (approx. NEM electricity customers)207
History and key information
Ergon Energy (~700 000), Aurora Energy (~275 000), ActewAGL (~200 000)
Ergon Energy, Aurora Energy and ActewAGL are government-owned (or a public-private joint venture in the case of ActewAGL) former local monopolies that operate in regions with continued price regulation. They have had limited exposure to competition from other retailers.
ERM Power (20 000 business customers)
By load, ERM Power is the fourth largest retailer in the market. It was founded in the 1980s as an energy consultancy before developing gas powered generation assets between 2000 and 2007. In 2008, it launched its retail business servicing C&I customers and extended its offering to SME customers in 2013.
ERM Power holds electricity generation interests in Queensland and Western Australia, and has a US electricity retailing business based out of Houston. The company also has an energy solutions business focused on C&I customers.
Box 6.1 demonstrates that there are few examples of retailers beginning as independent, privately-owned entities and growing to a substantial size through organic customer acquisition (as opposed to purchasing existing customer bases). Click Energy (now owned by amaysim) is the only apparent example of a retailer achieving such growth, but it operated on less than 50 000 customers for its first seven years. There are a couple of examples of (largely) stand-alone retailers growing with the backing of medium sized companies, such as Lumo Energy (before it was acquired by Snowy Hydro) and Dodo/M2 Energy. Powershop, which is backed by the New Zealand Government but entered Australia on a commercial basis, has managed to win over 100 000 customers and develop a portfolio of renewable generation assets in a few years of operation. Larger companies that made complementary investments in generation assets have been able to grow medium sized retailers such as Alinta and Simply Energy. The rest of the retailers in box 6.1 are either still government-owned or acquired the large customer bases of formerly government-owned retailers (and in some cases were the incumbent gas provider in a state).209
Box 6.1 presents retailers with more than 100 000 customers but this figure has not been chosen as an indicator of efficient scale. We note that 100 000 customers equates to a NEM market share of around 1 per cent. This level of scale is unlikely to allow a retailer to achieve the same efficiencies as a retailer with over one million customers, and they will therefore be operating with some degree of cost and other disadvantages as discussed further below.
While the growth of retailers such as Click Energy, Powershop, Simply Energy and Red Energy show it is possible to organically win customers, these retailers have not been able to match the retail customer growth achieved by buying up large customer bases from formerly public retail operations. And as shown in table 6.1, the market share acquired from government privatisations has been slow to erode.
There are close to 30 retailers operating in the NEM that are not represented in box 6.1. Very few of these small retailers have more than 20 000 customers (though some of the other business-focused retailers may have energy loads comparable to the retailers in box 6.1). The presence of these small retailers is a positive sign that barriers to entry in the retail electricity market are low. But, as box 6.1 shows, there appear to be substantial barriers to expansion.
In retrospect, the creation of three very large retailers was not the best starting point for a competitive market. That said, we are confident that the recommendations included in this report will, if implemented, improve competition in the market over time.
207 Many of the listed retailers also have gas customers.208 Click Energy, Click Energy Passes the 50 000 Customer Milestone, Media Release, 12 June 2013.209 Box 6.1 does not include some retailers that achieved substantial growth but were then acquired by larger players, such as Australian
Power & Gas (APG). APG had around 350 000 gas and electricity customers when AGL purchased it in 2013.

141 Retail Electricity Pricing Inquiry—Final Report
6.2.2 Advantages of incumbencyIn order to understand how the market is currently operating, it is necessary to understand the advantages of incumbency.
In one of its submissions to the Inquiry, Momentum Energy made the following statement:
Despite the strong rate of customer switching in the market, retailers with an incumbent base have the luxury of ‘sticky’ customers who are not price sensitive and can be relied upon to provide a dependable revenue stream. Customers who have switched to a second tier retailer have demonstrated a willingness to seek out a better electricity deal and are likely to do so again if their new retailer does not meet their needs.210
Due to the way in which the big three retailers acquired their market shares, many of their customers are still likely to be customers who have never switched. Data obtained by the ACCC supports the view that the big three retailers tend to have more customers with very long tenures than other retailers. This is illustrated in figure 6.2, which shows that the big three combined have over 1.7 million customers with a tenure of two years or more, compared to all other retailers combined who have just over 200 000 customers in the same category.
Figure 6.2: Residential customer tenure (non-solar) as at 30 June 2017, NEM-wide
486 097
250 825
106 263 1 503
571 476
411 971
109 950 1 070
2 120 961
217 296
292 379
2 447
881 745 77 244
591 585
11 861
0%
20%
40%
60%
80%
100%
Market o�ers Standing o�ers Market o�ers Standing o�ers
Big 3 Other retailers
% o
f cu
sto
mer
s
> 4 years 2–4 years 1–2 years < 1 year
Source: ACCC analysis based on retailers’ data.
Note: As the ACCC’s information is based on a subset of retailers, the total customer numbers above are lower than total NEM residential customers.
In general, the big three retailers have a much higher proportion of their customer base on standing offers. On average, 19 per cent of the big three’s customers (almost one million customers) are on standing offers compared to less than 2 per cent of customers with other retailers (around 17 000 customers). Standing offers are typically the most expensive offers in the market, and the ACCC’s analysis (see chapter 12) indicates these customers are likely to be highly profitable. As one of the big three put it in a board document:
This segment [of customers] is being targeted mainly for retention. It has the highest proportion of customers still on standard tariff and therefore at no discount, providing a high gross margin to [the business].
In its recent work, the AEMC noted that:
Only around 20 to 40 per cent of customers that have been with Big 3 retailers for more than three-to-four years, are on discount levels similar to those customers that have just joined.211
210 Momentum Energy, Submission to ACCC Issues Paper, 30 June 2017, p. 6.211 AEMC, 2018 Retail Energy Competition Review—National information sheet, June 2018, p. 2.

142 Retail Electricity Pricing Inquiry—Final Report
Revenue data from retailers obtained by the ACCC reinforces our understanding of this advantage. The average revenue per residential customer is almost 10 per cent higher for the big three compared to other retailers. This is nearly $150 per customer of additional revenue each year. The substantial additional revenue earned by the big three, combined with their significant cost advantages (set out in chapter 10), contribute to the higher margins accruing to the big three compared to other players (as set out in section 6.3.1 below).
In combination, these factors give the big three an important advantage over smaller players and we see this advantage playing out in their behaviour in the market.
6.2.3 Impact of incumbency in the market
Aggressive retention activityThe stable and profitable nature of their customer bases gives the big three a very strong incentive to retain and maintain their existing customer bases.
The significance of retention offers is apparent from information published by Origin in its 2017 annual report. In financial year 2016–17, across both its electricity and gas customers, Origin retained 1 509 000 customers, almost three times the number of customers it acquired in the same year (552 000).212 That activity (acquisition and retention) came at a cost of $114 million dollars.213
As noted in our Preliminary Report, a key concern raised with the ACCC has been the extent of aggressive retention activity in the market—often referred to as ‘saves’ and ‘win-backs’.214 A ‘save’ describes the situation where a customer cancels their switch to another retailer before it is completed, thereby maintaining supply from their existing retailer. A ‘win-back’ occurs when a customer is induced to re-contract with the losing retailer days, weeks or months after their switch away has been completed.
Numerous retailers reported that new customers are regularly switching back to their previous retailer after being offered very aggressively priced retention deals, including offers priced well below what is available publicly.
The result of this activity is that smaller and new retailers:
�� have significant ‘wasted’ acquisition costs which have to be recouped through higher prices across their customer base
�� find it very difficult to amass a substantial customer base
�� tend to acquire a higher proportion of ‘lower value’ customers as the larger players do not make an effort to retain these customers.
In meetings and submissions, smaller retailers identified this retention conduct as a key reason for their limited ability to grow in the market.215 While this experience is common among all retailers216, it obviously has a disproportionate impact on smaller retailers as it creates higher costs which are in turn spread across their smaller customer bases through comparatively higher per customer prices.217 The accumulation of substantial wasted costs can make them less competitive overall.
Smaller retailers disclosed to the ACCC that saves and win-backs affect a large proportion of new acquisitions, with a number of retailers estimating that around 20 per cent of newly acquired customers are lost to saves or win-backs.218
212 Origin, Annual Report 2017, p. 28.213 Origin, Annual Report 2017, p. 28.214 ACCC, Retail Electricity Pricing Inquiry—Preliminary Report, 22 September 2017, pp. 106–7.215 Sumo Power, Submission to ACCC Preliminary Report, 17 November 2017, pp. 3–4; Sumo Power, Submission to ACCC Issues Paper,
30 June 2017, p. 5.216 The AEMC has noted that all retailers it interviewed carried out win-back activity, including smaller retailers, AEMC, 2018 Retail
Energy Competition Review Final Report, June 2018, p. 32.217 See for example, ERM Power, Submission to ACCC Preliminary Report, 17 November 2017, p. 4.218 The spectrum ranged from around 7 or 8 per cent to around 30 per cent.

143 Retail Electricity Pricing Inquiry—Final Report
It appears that large retailers have the financial means to offer such aggressive retention offers by cross-subsidising these offers from the higher profits they are earning from their significant number of sticky high value customers. In its submissions to the AER Retail Pricing Information Guidelines (RPIG) review, Origin noted that save offers:
…are usually at a lower price because they only apply to a limited number of customers. For commercial reasons, it is not viable for retailers to make these offers available to all customers.219
An internal document of one of the big three retailers reveals that it had some offers that would not return a positive margin to the retailer in the first year, and most of those offers were estimated to generate less than $40 of net present value in the first year.
Retention offers are also generally secret offers made directly to the customers in question and are otherwise not publicly disclosed by retailers. This makes it hard for other players to ascertain the competitive dynamics in a market. For example, a retailer may decide to enter a region based on an assessment of the publicly available prices on offer in that region, and then discover that their competitors are actually willing to offer significantly lower prices that they cannot match.
Larger retailers defended retention activity in their submissions. Origin and AGL emphasised that the opportunity to make counter-offers to save or win-back a customer is a critical element of a well-functioning market because the customer is presented with greater choice and the opportunity to achieve the best possible deal.220 RBB Economics submitted that clamping down on save or win-back activity would put upward pressure on prices.221
Other stakeholders, such as the Public Interest Advocacy Centre (PIAC), the Agricultural Industries Energy Task Force (AIETF) and Sumo Power, questioned whether aggressive retention offers by large retailers were in the long-term interests of consumers.222
In the AEMC’s recent 2018 Retail Energy Competition Review, it noted that ‘win-back offers have become increasingly prevalent in the industry and almost act as a ‘disloyalty discount’ where customers are encouraged to shop around and switch.’223
In a well-functioning market, the ACCC considers that retention activity is likely to be pro-competitive. In the market in question, however, the ACCC agrees that there are questions as to whether the activity is in the best interests of consumers as a whole. The revenue advantages from their base of ‘sticky’ and profitable customers enable the big three to offer very low (and potentially below cost) prices to retain customers. The effectiveness of these retention activities reduces the need for big retailers to proactively give their loyal customers financial and/or other inducement(s) to stay. If anything, customer loyalty is likely penalised with higher prices. This is discussed below.
Competing only for ‘valuable’ customersNot all existing customers are offered the same level of inducement to stay. Some are not offered any inducement at all. Retention activity is targeted with the goal of increasing the overall value of the customer base (that is, holding on to high value customers and losing customers deemed by the retailer to be low value).
Internal documents show that retailers deploy significant resources to segment existing and potential customers into different categories, identify high value customers amongst these categories, and target them with attractive offers (for example, by offering higher discounts or rebates). For example, the ACCC reviewed documents from one large retailer that engaged consultants to analyse their existing customer base and categorise them into six different types of energy user. The consultant then assessed which types were most valuable (that is, used the most electricity and were least sensitive to price increases). The next phase of the project involved identifying regions of major Australian cities with demographics that suggested a large proportion of households would be ‘high value’. This assessment included identifying and mapping characteristics such as average wealth, dwelling size and
219 Origin, Submission to the Draft Retail Pricing Information Guidelines—Version 5, January 2018, 16 March 2018, p. 2.220 Origin, Submission to ACCC Preliminary Report, 6 December 2017, p. 7; AGL, Submission to ACCC Preliminary Report, 17 November
2017, p. 7.221 RBB Economics, Submission to ACCC Preliminary Report, 21 November 2017, p. 4.222 PIAC, Submission to ACCC Issues Paper, 5 July 2017, pp. 15–16; AIETF, Attachment to Submission to ACCC Issues Paper, July 2017,
p. 59; Sumo Power, Submission to ACCC Issues Paper, 3 July 2017, p. 5.223 AEMC, 2018 Retail Energy Competition Review Final Report, June 2018, p. 56.

144 Retail Electricity Pricing Inquiry—Final Report
average occupancy, swimming pool ownership, and many other factors. Finally, specific products were developed that would appeal to these types of customers.
This strategy of segmenting the customer base and targeting high value customers was presented to the board of the company. The board paper included a chart that showed that during the period in focus, the business’s customer numbers had declined but that overall customer value had remained relatively steady (and that average customer value had increased).
Other retailers’ internal documents show that it is common practice for retailers to assess which types of customers should be given retention offers and how good those offers should be. This is a commercially rational strategy that smaller retailers also adopt, but the size of the retail customer base of the big three mean that they have a much greater advantage.
The big three also have a significant information advantage, as they are incumbent retailers for most of the inactive, highly profitable customers. When one of these customers initiates a switch to another retailer, the incumbent will deploy more resources to win them back knowing that they are particularly valuable. These valuable customers therefore are less likely to switch retailers.
Customers who receive these retention inducements are usually getting a good offer. However, the benefits may only be temporary. A document from one of the big three reveals that, according to rules to be implemented at the relevant time, the vast majority of customers on high discounts would have their discounts reduced at each recontracting event (that is, when the customer’s current discount period expires). The document notes that analysis has been done which shows that ‘churn is relatively low until the discount decrease is 6% or more for electricity’.
For inactive or ‘loyal’ customers, retailers appear willing to intentionally increase their prices and use the customer’s loyalty against them. For example, a strategy document referring to the disengaged (passive) customer segment, comprising 87 per cent of that big three retailer’s customers, contemplates that ‘[t]he aim is to increase customer value to this passive group via increased margin’.
The same document sets out a possible strategy for communicating with these customers to minimise the chance that the customer is prompted to enquire about a better deal, stating that ‘[a] new communication will be succinct and written in a friendly tone but worded to limit customer responses’. The ACCC understands these strategies were never implemented.
Some retailers also demonstrate a willingness to intentionally increase the prices paid by ‘low value’ customers with the aim of either turning them into more valuable customers or prompting them to switch to another retailer. As noted in the Preliminary Report, one major retailer noted that they had to be willing to ‘fire the customer’ if the customer was not sufficiently valuable.224 Another retailer’s document sets out that for low value customers, it was considering a strategy to ‘reduce the discount to 0%’ and ‘increase customer value via targeted cross sells and/or increased margin’.
It may be commercially rational for retailers to direct their efforts in this manner, and it may be a response to competitive pressure. But it is not clear that such competitive efforts improve outcomes for consumers. It is likely that many customers on high-price offers would prefer to switch to a better offer but have encountered barriers to doing so.
The ACCC considers that increasing the ability of consumers to compare prices in the electricity market and increasing the transparency of offers available to consumers will assist consumers, including some of these inactive consumers, to engage with the market. Doing so should lessen the efficacy of the retention-focused strategies of the big three, and share the benefits of competition more evenly across all customers.
One consequence of this may be that some of the lowest offers available now will no longer be accessible, and consumers who seek out those offers may end up paying more for electricity. However, the consumers who are benefiting today from these very aggressive retention offers may be doing so at the expense of other consumers who are paying too much.
224 ACCC, Retail Electricity Pricing Inquiry—Preliminary Report, 22 September 2017, p. 127.

145 Retail Electricity Pricing Inquiry—Final Report
6.2.4 Other advantages of the big three (and other large retailers)
Scale advantages over smaller retailersThe big three, and some of the other large retailers, have considerable scale advantages. As noted in box 6.1, there are few retailers that have achieved customer numbers that allow them to take advantage of any substantial economies of scale. Many of a retailer’s operational costs are incurred regardless of customer size—for example, investments in billing systems or the need to comply with complex regulatory requirements which apply whether a retailer has only a handful of customers or a million customers.
Smaller retailers have fewer customers over which to spread these fixed costs. This is discussed further in chapter 10 and is best summarised by figure 10.5, which shows the big three’s per-customer ‘cost to serve’ is around half that of smaller retailers—a full $70 difference in cost per customer. This is a significant cost disadvantage for smaller retailers.
Retailers with smaller customer numbers have greater variability in their electricity demand as well as their revenues, as changes in behaviour by customers are more likely to materially impact a smaller retailer’s aggregate energy needs and revenue flows. This increases both their physical (energy) risk and their financial risks. As discussed in chapter 5, larger retailers have substantial hedging in place a long time into the future (including in the form of generation) and through their vertical integration likely have lower hedging costs.
Smaller retailers are also less likely to have taken advantage of economies of scope to the same degree as large players. Almost all the retailers in box 6.1 offer gas, with the big three having similarly dominant market shares in retail gas as in electricity. This gives them the ability to offer two complementary products as a bundle, and an even greater ability to spread fixed costs over large numbers of customers.
Access to wholesale electricityAs set out in chapter 5, smaller retailers typically have fewer options for managing their wholesale risk. They may have trouble accessing key trading platforms (particularly the ASX), have significantly fewer potential trading partners in the OTC market (especially if they want to use bespoke hedging products such as load-following hedges), may pay more for the contracts that they enter and face more expensive credit requirements. For these reasons, smaller players are more likely to be exposed to wholesale price volatility, which places upward pressure on their retail prices.
6.3 What are the outcomes for competition?As set out so far in this chapter, the dynamics in this market clearly favour the large incumbent retailers at the expense of the growth of smaller retailers. This impact can be seen through the stunted growth of smaller retailers in the market, but it can also be observed through the development of margins and innovation.
6.3.1 Retail pricing and marginsLooking at the impact of competition on retail prices is complicated by the significant changes in the costs incurred by retailers over time. We would expect, however, to see that with an increase in competition, there would be some downward pressure on retail margins.
As shown in figure 6.3, for residential customers, EBITDA margins in Victoria, South Australia and south east Queensland have broadly remained flat in the period 2007–08 to 2017–18, with margins increasing significantly in NSW. The only clear downward trend was in south east Queensland for the period 2014–15 to 2016–17, but even then the decline in margins eased towards the end of the period. The highest margins in the NEM were in Victoria, which is considered to be the most mature of the competitive markets and margins in Victoria have been increasing over recent years.

146 Retail Electricity Pricing Inquiry—Final Report
Figure 6.3: EBITDA as a percentage of revenue over time by state, 2007–08 to 2016–17, residential customers
2007
–08
2009
–10
2011
–12
2013
–14
2015
–16
2007
–08
2009
–10
2011
–12
2013
–14
2015
–16
2007
–08
2009
–10
2011
–12
2013
–14
2015
–16
0%
2%
4%
6%
8%
10%
12%
14%
16%
18%
2007
–08
2009
–10
2011
–12
2013
–14
2015
–16
South east QueenslandSouth AustraliaNSWVictoria
EB
ITD
A a
s a
% o
f re
venu
e
Source: ACCC analysis based on retailers’ data.
Note: Retailers reported negative margin for NSW in 2007–08. As noted in Chapter 1, the ACCC considers that this reflects a new entrant retail margin.
As highlighted in chapter 1 (see figure 1.22), retail margins in Victoria and NSW are some of the highest around the world.
Figure 6.4 shows the same time period but on a NEM-wide basis and split between the big three retailers, mid-tier retailers and the other retailers in the market. With the exception of a spike in 2010–11, there was a clear upwards movement in the average EBITDA across the big three in the period 2013–14 to 2016–17. Smaller players had much lower EBITDA in all years under examination, with the exception of 2013–14, where mid-tier EBITDA was within 1 per cent of that of the big three and 2016–17, where it was higher.
Figure 6.4: NEM-wide EBITBA as a percentage of revenue over time, by retailer, 2007–08 to 2016–17, residential customers
0%
2%
4%
6%
8%
10%
12%
2007–08 2008–09 2009–10 2010–11 2011–12 2012–13 2013–14 2014–15 2015–16 2016–17
Big three Mid tier Other retailers
EB
ITD
A a
s a
% o
f re
venu
e
14%
Source: ACCC analysis based on retailers’ data.
There are some limitations to an examination of the EBITDA trends of retail businesses given that the big three and a number of the other retailers are vertically integrated. The EBITDA for a vertically integrated retailer is likely to be largely dependent on the price at which it buys wholesale electricity from its wholesale division. However, as set out in chapter 5, the majority of vertically integrated players set a transfer price well above the market expectation of average NEM prices. So the consistent trend of higher margins for the big three is likely to represent a real advantage they have over smaller rivals.

147 Retail Electricity Pricing Inquiry—Final Report
In the context of significant recent retail price increases across the NEM, we have seen in internal documents evaluations done by the big three in order to determine the level of their price increases. When considering options for mid-2017 retail price adjustments, the analysis of one of the big three refers to a risk that one of their vertically integrated competitors might ‘look to absorb some of the wholesale increase’ but ultimately this risk does not appear to impact any final decision on pricing. Rather, when considering a number of options for this mid-2017 price review, the retailer selected one of the largest price increases under consideration, being one that would enable it to earn additional margin. And for a region in which this retailer is an incumbent, its analysis suggests that it ‘should look to price in-line with or slightly higher than our key tier 1 competitors’.
Tier 2 retailers are the most likely threat to the big three. Tier 2 retailers are vertically integrated and are more able to take advantage of scale economies than smaller retailers (though not to the same degree as the big three). Tier 2 retailers are therefore most able to undercut the big three and attempt to win customers. However, aggressively undercutting the big three does not always appear to be a key focus of these businesses’ competitive strategies. One Tier 2 retailer noted that ‘pricing where possible is set to better tier one advertised rates….[t]ariffs and products are benchmarked against tier one competitors to ensure maximum possible margins are being extracted from each segment, whilst still maintaining a slight discount to ensure products are deemed competitive at point of offer.’
As noted in chapter 5, the way in which the vertically integrated retailers set their transfer prices, that is the price at which their business buys electricity from their wholesale business, is also instructive. While not universally the case, based on information provided to the ACCC, most vertically integrated players have more focus on the costs that a prudently hedged competitor would have in the open market than they do on their own costs when setting transfer prices. Generally, this appears to be significantly above the actual costs of generation.
The combination of relatively high retail margins for the big three and a persistent ability to set transfer prices above generation costs suggests that the retail market is not imposing a significant competitive constraint on the big three. The margins for smaller retailers are much lower, which appears to be a result of having a less ‘valuable’ customer base (that is, customers more willing to switch for a better deal), and higher per-customer costs (as discussed in chapter 10).
As discussed above, the big three’s advantages include having the vast majority of sticky customers that accept higher prices, an information advantage used to develop strategies to retain valuable customers when they initiate a switch, and scale and scope economies from having a very large customer base and dual fuel offering.
6.3.2 Innovation in retail electricityAnother sign of a competitive market is innovation. The thrust of the submissions on innovation in the retail sector were mixed. The Independent Pricing and Regulatory Tribunal (IPART) observed generally that ‘[t]here has been a substantial increase in the range of products and services available to electricity customers since price deregulation in NSW’ and that retailers are ‘increasingly using non-price features to attract and retain customers.’225 EnergyAustralia submitted that ‘innovation and market development is extremely healthy’226 and Origin said that ‘[t]he levels of customer service and innovation have increased significantly over the past few years.’227 Submissions received by the ACCC pointed to the following developments as examples of innovation in the retail electricity market:
�� the roll out of apps to help consumers monitor their electricity usage, costs, pay bills and receive energy savings tips228
�� the emergence of new technologies such as solar PV, digital metering and battery storage and retailers identifying opportunities for consumers to add solar and/or battery storage with associated tailored plans229
225 IPART, Submission to ACCC Issues Paper, 19 June 2017, p. 3.226 EnergyAustralia, Submission to ACCC Issues Paper, 30 June 2017, p. 21.227 Origin, Submission to ACCC Issues Paper, 30 June 2017, p. 4.228 Origin, Submission to ACCC Preliminary Report, 30 November 2017, pp. 8–9; Origin, Submission to ACCC Issues Paper, 30 June 2017,
p. 32; IPART, Submission to ACCC Issues Paper, 19 June 2017, p. 3.229 EnergyAustralia, Submission to ACCC Issues Paper, 30 June 2017, p. 19. Origin, Submission to ACCC Preliminary Report,
30 November 2017, p. 9; Origin, Submission to ACCC Issues Paper, 30 June 2017, pp. 4, 30–32; IPART, Submission to ACCC Issues Paper, 19 June 2017, p. 3.

148 Retail Electricity Pricing Inquiry—Final Report
�� increased digitalisation to increase efficiency and accuracy of service provision and customer interactions230
�� a range of alternative pricing structures for consumers, such as pre-payment, zero discount plans, ‘guaranteed discounts’, capped plans, free day/month promotions, bundled energy and dual fuel discounts and bill smoothing between periods.231
Other stakeholders pointed to an apparent lack of innovation: ‘[a] most notable feature of the retail market has been the lack of innovation in the service itself.’232 These submissions noted that:
�� The marketing of retailers’ homogenous product offerings is largely focused on pay-on-time discounts as a selling point.233 AGL submitted that its attempts to engage with consumers on alternative tariff structures other than discounts have proven to be largely unsuccessful, given that consumers are most receptive to discount based marketing.234
�� Differences in prices or price structures are not innovative.235
�� The basic structure of retail electricity pricing has not changed for some time.236
�� There are few examples of retailers innovating in ways to reduce their customers’ usage.237
The NSW Farmers Association submitted that the only ‘real’ innovations—for example, FiTs and renewable energy—have been driven by government programs or public policy.238
Electricity is a homogenous product, with little ability for product differentiation. Generation technology (for example, thermal versus renewable) is likely a differentiator for consumers, but the origin of an individual customer’s electricity cannot actually be controlled by their retailer (except self-generation such as rooftop solar). Innovation in retail electricity will therefore be more non-price based and focused on enhancing consumer convenience and product offerings such as solar PV and battery storage, or providing information so the consumer can make more informed consumption decisions, or simply providing better service.
As noted recently by the AEMC, some innovation around pricing and billing has occurred.239 For example, some retailers offer a model under which the consumer pays a fixed fee upfront and then pays cost-price for each unit of electricity they consume.240 Much of the innovation, particularly around more bespoke solar PV options or demand response, is coming from small retailers in the market.
These types of innovation are a positive sign, however their limited impact so far raises questions about the value consumers place on this type of innovation. It is notable that the fastest growing retailer over the past year has been Alinta241, which has achieved its growth with traditional offers incorporating high discounts. So while innovation is positive, most consumers appear to simply prefer a low price.
230 Origin, Submission to ACCC Preliminary Report, 30 November 2017, p. 9; Origin, Submission to ACCC Issues Paper, 30 June 2017, pp. 1, 4.
231 AGL, Submission to ACCC Preliminary Report, 17 November 2017, p. 9; CALC, Submission to ACCC Issues Paper, 5 July 2017, p. 8; IPART, Submission to ACCC Issues Paper, 19 June 2017, p. 3.
232 ECA, Submission to ACCC Preliminary Report, 12 December 2017, p. 7.233 CALC, Submission to ACCC Issues Paper, 5 July 2017, pp. 8–9.234 AGL, Submission to ACCC Preliminary Report, 17 November 2017, p. 8.235 NSW Farmers Association, Submission to ACCC Issues Paper, 28 June 2017, p. 4.236 ECA, Submission to ACCC Preliminary Report, 8 December 2017, p. 7.237 ECA, Submission to ACCC Preliminary Report, 8 December 2017, pp. 8, 19.238 NSW Farmers Association, Submission to ACCC Issues Paper, 28 June 2017, p. 4.239 AEMC, 2018 Retail Energy Competition Review—National information sheet, June 2018, p. 1.240 For example, Mojo Power and Energy Locals have offers of this type.241 As discussed above, Alinta has gained over 100 000 customers (5 per cent market share) in south east Queensland in less than
six months.

149 Retail Electricity Pricing Inquiry—Final Report
6.4 How can we improve competition in the retail market?
A key question for the ACCC’s Inquiry has been—if competition is not leading to significant pressure on prices and margins, or driving the kind of innovation in the market that customers value, how can we improve it? There are no easy answers, and jurisdictions around the world have faced the same challenges. There are, however, some steps that should be taken to improve overall retail competition in the NEM.
6.4.1 Market structure challengesAs set out in this chapter, the retail markets in the NEM remain very concentrated and the market shares of the incumbents are slow to erode.
Some barriers to entry have been identified by smaller retailers. While these are unlikely to be broadly impeding market entry, they have limited or prevented the entry of some players in some NEM jurisdictions. One example is the recent experience of some smaller retailers who were unable to obtain a retail licence from the Essential Services Commission of Victoria (ESC Victoria) to serve retail customers in Victoria even though those retailers had obtained authorisation from the AER to operate in the rest of the NEM.242
As set out in more detail in chapter 10, unlike the other NEM states and the ACT, Victoria has not joined the NECF and retains its own regulatory framework and licensing process. Our recommendation in chapter 10 that Victoria join the NECF would address any concerns in this regard, as the AER would then become a one-stop-shop for the authorisation of retailers across the NEM.
On the whole, however, we have seen significant entry into the market following the commencement of retail competition, which strongly suggests that barriers to entry in this market are not significant.
In NSW, Victoria, and south east Queensland, there are now more than 20 retailer brands offering electricity to residential customers, and around 40 across all customer types. South Australia has experienced more limited entry but still has close to 20 retailers. A number of these retailers are very small operations with low levels of capital. These figures reinforce the view that barriers to entry in the market are relatively low. One small retailer estimated that a ‘bare bones’ entry into the retail market (excluding Victoria) would cost around $2.5 million.
Beyond ensuring that more significant barriers to entry do not emerge, there is little direct action that can be taken to directly tackle the market structure that has emerged. Promoting other measures to assist effective competition is the best path to help drive an effective market structure.
6.4.2 Improving consumer engagementAs we have highlighted in this chapter, the big three retailers have significant advantages over smaller retailers which stem from their profitable base of sticky customers. While we acknowledge that some of these customers may have decided not to participate in the market as the search and transaction costs outweigh the benefits of switching (see chapter 11), it is clear that many customers have difficultly engaging with the market. In many cases this arises from the complexity of the market and the difficulties that consumers face in being able to easily and accurately compare the value of different electricity offers. As outlined in chapter 15, some vulnerable customers may face difficulties regardless of any steps taken to reduce offer complexity and may require additional government assistance to participate in the retail electricity market.
In part 3 of this report we make a range of recommendations which are designed to improve consumer engagement. If implemented, these recommendations serve to ensure that more of the ‘sticky’ customers engage with the market and either move to a new retailer, or at least to a better offer with their current retailer. Over time, this increased participation will serve to unwind the big three’s incumbency advantages and foster a more even playing field among retailers.
242 For example, Energy Locals, Submission to ACCC Issues Paper, 30 June 2017, p. 17.

150 Retail Electricity Pricing Inquiry—Final Report
The ACCC’s recommendations to reduce complexity and encourage greater participation in the market include:
�� A requirement for all advertised discounts to be calculated from a reference bill amount set by the AER. This will help eliminate the confusion caused by the practice of retailers to advertise using high headline discounts off inflated rates, and enable customers to easily consider two discount offers and determine which offer is likely to lead to lower electricity bills. This recommendation will likely improve consumer confidence and trust in the retail electricity market and encourage those consumers who are unsure of the benefits of switching to choose a new offer. Further detail on this recommendation is in chapter 13.
�� A mandatory code for commercial third party intermediaries such as comparison websites, connection services, automated switching services, and energy brokers. The code should ensure that offers are recommended based on benefit to the consumer rather than the size of the commission received by the third party. The introduction of the code will lead to improved consumer confidence and more consumers choosing lower priced offers.
�� Amendments to the NERL to clarify that third party intermediaries are able to give explicit informed consent on behalf of consumers, along with improved access to consumer consumption and tariff data (see chapter 13). This will enable more third parties to enter and expand in the NEM, placing downward pressure on the amount of commissions charged by commercial comparators. Further detail on this recommendation is at chapter 14.
�� Continued funding for awareness raising and education campaigns in relation to government-run comparator websites. These campaigns, combined with the improvements to the AER’s Energy Made Easy website that are scheduled to be released in August 2018, will encourage more consumers to visit a government-run comparator to check whether they could save money by choosing a new offer. This will also encourage more consumers to use government-run comparator websites, which will ultimately lead to reduced commissions and acquisition costs because these websites do not charge commissions. Further detail on this recommendation is at chapter 14.
6.4.3 Access to wholesale marketsAs discussed in chapter 5, effective and efficient hedging markets are a crucial tool for all types of retailers. Hedging markets have helped facilitate the entry of numerous new retailers in the NEM. However, a number of these entry pathways are becoming less accessible to small retailers. In particular, the cost of access to the ASX has increased, and there are now very few suppliers of load-following hedges. Smaller retailers may therefore find it harder to enter and expand, which will have impacts for competition.
The ACCC considers that there are few direct interventions that could be made in hedging that would not have other distortionary effects. For example, while some small stakeholders have suggested that government-owned generators could provide low cost wholesale electricity to new entrants, the ACCC’s view is that both retail and wholesale markets are likely to function better in the long term if market forces continue to set prices.
However, the ACCC considers that the combination of vertical integration and concentration in the NEM has reduced contract market liquidity and is making it harder for all parties to effectively manage their wholesale price risk. The issue is most acute in South Australia, where contract market activity is infrequent and dispatchable generation sources are limited. The ACCC is therefore recommending market making obligations be introduced in South Australia in order to boost market activity and provide access to trading partners for smaller retailers (recommendation 7). This recommendation is discussed in section 5.4.4. Should these market making obligations prove to be highly effective in South Australia, they may be expanded to include other NEM regions if liquidity concerns are identified.

151 Retail Electricity Pricing Inquiry—Final Report
6.4.4 Reducing the focus on save and win-back activityWe have engaged closely with a large number of market participants on their concerns about aggressive save and win-back activity and the impact this has on their ability to grow their customer base generally, and to attract high value customers. There is no doubt that this conduct is significantly affecting the ability of smaller retailers to gain scale in the market, and that the ability for the big three to engage in such aggressive activity is to a significant extent funded by their inherited customer bases. It is also clear that this activity leads to an increase in overall customer acquisition and retention costs and in ‘wasted’ acquisition costs. The retailer who has temporarily ‘won’ a customer fails to make a return on their investment, and the retailer who has saved or won-back the customer to some extent duplicates the same costs with their retention activity.
A number of market participants have suggested that we recommend action to curb the aggressive save and win-back activity in the market and have put forward a wide range of options including:
�� banning retailers from engaging in save and/or win back activity243
�� restricting or limiting the extent to which, or manner in which retention offers can be made to customers (for example, limiting how many times a retailer can call a customer)244
�� ensuring that retention offers are deemed ‘generally available’, so that these offers must be published on, for example, the Energy Made Easy website, creating transparency in relation to these offers for customers and competing retailers245
�� speeding up the transfer process and/or eliminating the advance notification process to reduce the opportunity for save activity.
The ACCC has considered these options carefully. Save and win-back activity is one way in which competition is playing out in the retail electricity market, but as highlighted above, we do not consider that competition is occurring on a level playing field.
Any action to prohibit save or win-back activity would be a significant regulatory intervention and one that may have unexpected and unintended consequences. As noted in our Preliminary Report, the New Zealand Electricity Authority in January 2015 introduced a scheme which bans retailers who opted in to the scheme from engaging in save activity. The scheme led to an increase in win-back activity (in place of saves) and no overall improvement in competition in the market.246 On the basis of these results, together with concerns about making such significant intervention on a competitive dynamic to the market, the ACCC does not recommend that retailers be banned from engaging in save or win-back activity.
The ACCC also considers that any efforts to specifically regulate retailer behaviour around save and win-back activity would add regulatory burden and complexity, which would have cost impacts on consumers, and would be difficult to enforce. Based on the work of the Inquiry, we do not think regulatory intervention of this type is appropriate.
The possibility of making save and win-back offers ‘generally available’ and therefore transparent through Energy Made Easy was considered recently by the AER in its latest review of the RPIG. The AER recognised the transparency advantages that would flow from making these offers widely available but elected not to include them in the definition of ‘generally available’. This was primarily due to concerns that doing so could create confusion among consumers using the current version of Energy Made Easy due to the proliferation of searchable offers and consumers having ‘sub-optimal experiences if they tried to switch to a plan that was not available to them.’247
The AER noted that it remains of the view that ‘increased consumer visibility of these ‘under the counter” plans will assist customers understand their options’248 and indicated that it ‘will continue to develop [its] understanding of how retailers are using these plans….and will consider what future interventions may be effective.’249
243 PIAC, Submission to ACCC Issues Paper, 5 July 2017. p. 4; Sumo Power, Submission to ACCC Issues Paper, 30 June 2017, pp. 2, 8; Sumo Power, Submission to ACCC Preliminary Report, 17 November 2017, pp. 1 and 4.
244 Sumo Power, Submission to ACCC Issues Paper, 30 June 2017, p. 8.245 Mojo Power, Submission to ACCC Issues Paper, 3 July 2017, p. 3.246 New Zealand Electricity Authority, Post implementation review of saves and winbacks, Final Report, 29 August 2017.247 AER, Notice of Final Instrument: AER Retail Pricing Information Guidelines, Version 5, April 2018, pp. 33–34.248 AER, Notice of Final Instrument: AER Retail Pricing Information Guidelines, Version 5, April 2018, p. 33.249 AER, Notice of Final Instrument: AER Retail Pricing Information Guidelines, Version 5, April 2018, p. 34.

152 Retail Electricity Pricing Inquiry—Final Report
The ACCC shares the AER’s view that increased visibility of save and win-back offers would benefit customers and also considers it would benefit the market overall. The ACCC acknowledges the challenges in finding a way to achieve this, in particular to design a requirement that achieves transparency and cannot be readily circumvented while at the same time avoiding significant customer confusion. The ACCC supports the AER’s proposal to consider possible future interventions.
We do, however, consider that a number of interventions can be made now in relation to the customer transfer process which may serve to limit or reduce current levels of save and win-back activity. Specifically we consider that the current advance notification to a losing retailer should be removed and the transfer process itself should be accelerated. These recommendations are discussed below. These interventions would facilitate a faster, more efficient switching process and reduce the effectiveness of current save strategies by limiting the time for such activity before a switch takes place.
Ending the advance loss notification and speeding up the transfer processWhen an electricity customer signs up with a new retailer, that retailer lodges a ‘change request’ with AEMO to re-allocate the customer’s electricity meter(s) to the new retailer.250 AEMO in turn sends a notification to the customer’s existing retailer informing them of the change request.251
The change is only effective from the ‘actual change date’, which is the date of the final meter reading.252 The transfer could be delayed considerably if the new retailer does not elect to obtain a special meter read, given that in some cases manual meter reads only take place every three months. Both the advance notification process and the delay in meter reading provide the existing retailer with information and opportunity for save activity.
Loss notification
We are not persuaded that there remains a need to notify the ‘losing’ retailer in advance of the transfer process being completed. The ACCC understands that this information is typically used by retailers primarily for the purpose of engaging in retention activity. In fact, one retailer’s internal documents show that it conducted a digital retention campaign labelled the ‘CR1000 Campaign’ (being the Code used in AEMO’s system to denote a customer who is switching retailers) targeting customers who were switching.
Instead of receiving the notification from AEMO when the transfer request is lodged, the existing retailer could be notified of the switch when the next meter reading takes place. It would then issue a final bill to the customer. That will ensure that the switch takes place before or at the same time as notification of the completion of the switch to the ‘losing’ retailer.
There are arguments that the current notification process is important for preventing fraudulent or erroneous transfers as it can enable these to be identified before a switch is completed (likely in the process of customer retention efforts).
The number of erroneous transfers is not significant. Recent work by the AEMC using AEMO data suggests that rates are less than 2 per cent and have fallen significantly in recent years.253 Many of these are not identified until after a transfer has taken place. Since a rule change came into effect on 3 August 2017, there are specific obligations on retailers to resolve transfers that occurred without the customer’s explicit informed consent.254
250 AEMO, MSATS Procedures – CATS Procedure Principles and Obligations, 1 December 2017, s. 3.4(a).251 Specifically, s. 3.5(g) of the MSATS Procedures—CATS Procedure Principles and Obligations provides that notifications of a
requested (that is, AEMO validated) customer transfer are sent to all relevant participants. In turn, s. 7.9, known as the ‘Change Request Status Notification Rules’, specifies that the customer’s existing and new retailer are notified of a ‘requested’ customer transfer (and other status changes).
252 AEMO’s first validation of the new retailer’s ‘change request’ on MSATS will check that a meter read type to assist the transfer has been selected, that is, ‘Consumer Read’, ‘Existing Remotely Read Interval Meter’, ’Estimated Read’, ‘Next Schedule Read Date’, ‘Previous Read Date’, ‘Next Read Date’ or ‘Special Read’ (MSATS Procedures—CATS Procedure Principles and Obligations, ss. 3.6(a)(i) and 4.13, table 4-M). The party taking the meter read notifies MSATS of the actual change date. If a manual meter reading has been done, the ‘actual change date’ must be the date of the meter reading (MSATS Procedures – CATS Procedure Principles and Obligations, s. 2.4(f) & (l)).
253 AEMC 2017, Final Rule Determination: Improving the accuracy of customer transfers, 2 February 2017, p. 36, where it is noted ‘according to AEMO data on the use of the code ‘Transferred in Error’ and as set out in the table below, in recent years the number of erroneous transfers has fallen significantly, from 50 227 in 2013 to 25 147 in 2015.’
254 AEMC 2017, Final Rule Determination: Improving the accuracy of customer transfers, 2 February 2017.

153 Retail Electricity Pricing Inquiry—Final Report
Another concern is that the original process was put in place to deal with outstanding debts on transferring accounts. The ACCC does not consider that delaying a transfer prevents any subsequent debt collection efforts by a customer’s previous retailer.
Recommendation 8AEMO should amend its rules and procedures so that losing retailers are only given a loss notification on the actual date of transfer of financial responsibility for the customer to the new retailer. This will limit the opportunity for ‘losing’ retailers to conduct save activity before a customer transfer has taken place.
Speeding up the transfer process
In addition, the ACCC remains concerned about the time needed for a switch to take effect, both from the perspective of enabling save activity but also from the perspective of customers who remain on potentially uncompetitive offers for up to several months while waiting for a manual meter read. Over time the roll-out of smart meters will eliminate the need for manual meter reads and speed up this process.
Work by the AEMC in 2017 based on AEMO data on transfer times for small electricity customers who remained at the same property (in-situ transfers) identified that transfer times are improving, but the average transfer time in the NEM (excluding Victoria) remained at just over 30 calendar days in 2015, although a clear majority are now completed in less than 30 days.255 The ACCC acknowledges that in 2017, the AEMC considered a rule change that proposed that the efficiency of customer transfers be improved by using an estimated read as the basis for in-situ transfer.256 Factors that influenced the AEMC’s decision to reject the proposal included the significant reductions in transfer times observed to 2015 and the strong impact of the continuing smart meter roll-out on further reducing transfer times.257 The AEMC also considered that implementation of the measures would be unavoidably complex and that consumer uptake of the estimated read option may be low as customers are likely to choose the certainty of a special read and not an estimate if offered at a similar price.258
The ACCC considers, however, that transfer times must be improved in order to promote more vibrant competition and enable customers to obtain the benefits of switching more quickly. The ACCC notes that the AEMC is currently considering a rule change request in relation to self-reading of meters by non-transferring customers to assist in the accuracy of estimated bills.259 The ACCC considers that the AEMC should explore ways to enable the use of self-reads to facilitate faster transfer times (and as a less costly process than arranging for a special read) when a person is remaining at the same property, but switching retailers. This could, for example, involve a simple process such as giving the customer the option to enter the meter read into a website or the new retailer’s phone application or send a current photo of the meter to the new retailer for verification purposes.
Recommendation 9The AEMC should make changes to speed up the customer transfer process, for example by enabling customers to use self-reads of their electricity meters. This will ensure that customers move to new offers quickly and will limit the time available for ‘losing’ retailers to conduct ‘save’ activity.
255 AEMC, Final Rule Determination: Using estimated reads for customer transfers, 2 February 2017, p. 24.256 AEMC, Final Rule Determination: Using estimated reads for customer transfers, 2 February 2017.257 AEMC, Final Rule Determination: Using estimated reads for customer transfers, 2 February 2017, p. ii.258 AEMC, Final Rule Determination: Using estimated reads for customer transfers, 2 February 2017, p. ii.259 AEMC, Estimated meter reads, Consultation Paper, 17 May 2018.

02Lowering supply chain costs

155 Retail Electricity Pricing Inquiry—Final Report
Key points�� Network, environmental and retail supply chain costs all make a significant contribution to the
electricity bills and prices faced by consumers. The ACCC is making recommendations in all three areas that should lead to a reduction in the prices paid for consumers.
�� Network costs are, on average, the largest part of the average NEM customer bill and have also been the largest factor in the increase in bills over the last 10 years. Key steps that should be taken to address these costs are:
– permanent removal of limited merits review (LMR) of AER decisions – voluntary writedowns by government owners of the value of particular networks – increased rollout of cost reflective tariffs, through mandatory assignment of demand tariffs on
retailers in conjunction with important transitional protections for consumers – amending the networks regulatory framework to be less complex and more flexible.
�� Demand management is a crucial tool to reduce costs across the networks and wholesale markets. Steps need to be taken to encourage greater take up of demand management across the supply chain.
�� Environmental schemes have important public policy objectives, but can lead to increased costs for consumers. While the costs of the LRET may be winding down naturally, steps should be taken to address the costs of the SRES and the overly generous FiT payments to owners of rooftop solar PV systems.
�� Retailer costs to serve, acquire and retain their customers have increased over the last 10 years, driven in particular by the costs of competing for customers. A number of steps could help to address these costs.
Part 2 of this report focuses on ways to assist affordability by lowering the costs of provision of electricity in the different parts of the supply chain.
It contains the following chapters:
�� Chapter 7 deals with network costs
�� Chapter 8 examines demand response, which affects both network costs and the wholesale market
�� Chapter 9 looks at environmental costs
�� Chapter 10 covers retail costs.

156 Retail Electricity Pricing Inquiry—Final Report
7. Network costs
7.1 BackgroundElectricity networks carry electricity from generators to customers. Transmission networks transmit power at high voltages from generators to major demand centres. Distribution networks then step down electricity to lower voltages and carry it to businesses and homes (and may also carry electricity back from those businesses and homes).
The costs of transmission and distribution are unavoidable for retailers.
As noted in chapter 1, network costs are, on average across the NEM, the largest component of the overall bills paid by electricity consumers. The ACCC’s estimates based on retailers’ cost information are that, for 2017–18, the network costs make up 43 per cent of the overall costs. Network costs have also been responsible for the largest part of the increase in those overall amounts between 2007–08 and 2017–18, making up 35 per cent of the increase. The contribution to costs by networks differs by state, being highest in Queensland and lowest in Victoria.
Given the significance of these charges to the customer bill, the ACCC considers that it is important to identify ways to bring down the network component of the bill.
There are five state-based transmission networks in the NEM and 13 major distribution networks. The ACT, South Australia and Tasmania each have one major distribution network. Queensland, NSW and Victoria each have multiple distribution networks. The networks have a variety of ownership structures, with Victorian and South Australian networks having been privatised, Tasmanian and Queensland networks being government-owned, the ACT network being partly privatised, and NSW having a mixture of government-owned, partly-privatised and fully-privatised networks.
Electricity transmission and distribution networks display strong natural monopoly characteristics that mean competition is unlikely to arise. As such, all networks are subject to regulation to ensure that they do not exploit their monopoly power.
Significantly, the costs of the network tend to be driven by the peak demand on the network, as opposed to the amount of usage over time. That is, the brief maximum spikes in usage due, for example, to the use of air conditioning during a heat wave, will drive a large part of the investment.260
7.1.1 Regulatory system for network pricingThe AER determines the maximum revenue that a network is able to recover from customers each year, based on a level of return (determined by the rate of return—calculated by the weighted average cost of capital (WACC)) on the regulatory asset base (RAB), an allowance for depreciation, operating costs and tax. Charges to customers are set by the network, based on expected utilisation of the network, but the revenue derived from those charges cannot exceed the revenue cap.
The revenue cap approach means that the risks of lower demand are faced by customers rather than network businesses—that is, network charges may increase to cover a shortfall compared to forecast demand even if utilisation decreases. This approach taken to setting prices has developed over time. The ACCC from 1999, and then AER from 2005, initially had the role of regulating transmission networks only. The AER then gradually took over the regulation of distribution businesses from state regulators over a period from 2008. A number of these state regulators had used weighted average price caps, but over time the regulatory model has moved to the use of revenue caps.261
260 The PC in 2013 cited several examples of estimates that it had been provided with:�� around 20−30 per cent of the $60 billion of electricity network capacity in the NEM is used for less than 90 hours a year�� capital expenditure to accommodate ‘peak load growth’ accounts for around 45 per cent of approved total expenditures in the distribution network, and slightly more than 50 per cent in the transmission network�� around 25 per cent of retail electricity bills in NSW reflect the cost of system capacity that is used for less than 40 hours a year (or under 1 per cent of time).
PC, Electricity Network Regulatory Frameworks, 9 April 2013, p. 337.261 PC, Electricity Network Regulatory Frameworks, 9 April 2013, pp. 466–479.

157 Retail Electricity Pricing Inquiry—Final Report
Both revenue caps and price caps have advantages and disadvantages, and the choice between mechanisms involves a variety of trade-offs. The Productivity Commission (PC) examined these in its 2013 report and concluded that ‘the choice between revenue caps and [price caps] is not clear cut’.262 It noted:
[Price caps] theoretically provide network businesses with an incentive to set cost reflective network prices, although it is unclear the extent to which this might translate into efficient pricing decisions in practice. They also provide network businesses with an ability to over-recover revenue, which will result in transfers from customers to network businesses and weaken the incentive for network businesses to control their expenditure.
Revenue caps remove the ability of network businesses to over-recover revenue and provide them with a more stable source of long-term profits. They are more compatible, than [price caps], with demand management options … Revenue caps are also less reliant on accurate demand forecasts than [price caps].
In the [PC’s] view, the major consideration is whether the incentives to set prices efficiently under a [price cap] are sufficient to compensate for the additional revenue that can be recovered under the cap. While there may be some efficiency gains associated with [price caps], they are likely to be small compared with the increased revenue that can be recovered. Therefore, the [PC] agrees with the AER, that on balance, revenue caps are the more appropriate control mechanism for distribution businesses.263
The ACCC agrees that the choice between the two approaches involves trade-offs, but considers that the debate has been largely resolved over the period since the PC’s report. As such, it has not revisited the choice of revenue versus price cap regulation during this Inquiry.
The regime used for the regulation of networks by the ACCC and then AER has changed on a number of occasions. In particular, the approach taken to the way that capital expenditure and the RAB are treated has evolved.
Initially, the regulatory framework applied by the ACCC to transmission networks contained broad scope for different approaches to the RAB. The ACCC initially expressed a view that it would seek to apply a depreciated optimised replacement cost (DORC) methodology whereby the value of assets were revised from time to time to reflect the depreciated cost of assets of the system as if it had been reconfigured so as to minimise the forward looking costs of service delivery.264 It also proposed that only capital expenditure deemed to be prudent expenditure of a network operator ‘acting efficiently in accordance with good industry practice and to achieve the lowest sustainable cost of delivering services’ could be rolled into the asset base.265 It proposed to review expenditure at the end of the regulatory period.
The ACCC subsequently in 2004 revised its view on the use of the DORC methodology, preferring a mechanism that did not use periodic revaluations. It instead preferred an approach whereby the RAB was ‘locked in’ at the end of a regulatory period and carried forward to the next period.266 It also preferred an approach whereby actual capital expenditure was rolled into the asset base, rather than a deemed efficient amount of expenditure, along with the use of incentives to encourage efficient capital expenditure.267
In 2006, the AEMC reviewed the regulatory regime, and formalised a number of aspects of the ACCC’s 2004 approach, including the use of the ‘lock-in’ approach to the RAB.268 It also decided not to allow for any ex post review of capital expenditure. Other changes were made that affected the AER’s ability to review or revise expenditure proposals from businesses.
262 PC, Electricity Network Regulatory Frameworks, 9 April 2013, pp. 466–479.263 PC, Electricity Network Regulatory Frameworks, 9 April 2013, pp. 478–479.264 ACCC, Draft statement of principles for the regulation of transmission revenues, 27 May 1999, p. 53, 63; ACCC, Overview: Draft
statement of principles for the regulation of transmission revenues, 27 May 1999, p. 5, 6.265 ACCC, Draft statement of principles for the regulation of transmission revenues, 27 May 1999, p. 63; ACCC, Overview: Draft statement
of principles for the regulation of transmission revenues, 27 May 1999, p. 6.266 ACCC, Statement of principles for the regulation of transmission revenues-background paper, 8 December 2004, p. 42.267 ACCC, Statement of principles for the regulation of transmission revenues-background paper, 8 December 2004, p. 62.268 AEMC, Rule Determination—National Electricity Amendment (Economic Regulation of Transmission Services) Rule 2006
No 18, 16 November 2006, pp. 97–98.

158 Retail Electricity Pricing Inquiry—Final Report
In 2011, the AER submitted a rule change proposal to the AEMC in relation to the electricity network rules that had been made in 2006. The AER argued in relation to the 2006 rules that:269
[The] detailed codification of the methodology of economic regulation has hindered the AER’s ability to appropriately regulate natural monopoly electricity networks. It has restricted the AER’s ability to ensure that the regulated electricity networks invest efficiently and earn appropriate commercial returns. It has also hindered the AER’s capacity to respond to changing circumstances. As a result, consumers are paying more than is necessary to maintain a reliable and secure power system.
In particular, the AER considered that ‘the current framework goes beyond affording a reasonable opportunity to recover efficient costs. Indeed, it invites upwardly biased expenditure forecasts and provides the regulator with limited ability to interrogate and amend forecasts proposed by [network service providers]’.270
The AER noted a number of issues with the existing regime. Firstly, the AER argued that the rule that required the AER to accept expenditure proposals if it was satisfied that they ‘reasonably reflect’ efficient, prudent and realistic expenditure allowed networks to put forward the highest possible forecast and put the burden on the AER to show that the forecast did not ‘reasonably reflect’ efficient, prudent and realistic expenditure.271 Significantly, the AER was unable to have regard to an alternative lower possible expenditure that was efficient, prudent and realistic. Other issues, around the requirement for the AER to only amend the forecast to the minimum extent necessary and base substitute forecasts on the original proposal, exacerbated the effect of this rule. The AER proposed instead an approach whereby the AER would determine a forecast expenditure bounded by the NEL and guided by a list of expenditure factors.
The AER also proposed a change to the rule that all actual expenditure was rolled into the RAB automatically, instead proposing that only the forecast expenditure would be rolled into the RAB automatically. Amounts above the forecast would only be partially added into the asset base. Other changes were proposed in relation to the consistency of approaches taken to the WACC (and to the debt allowance in particular), to the regulatory process and involvement of stakeholders in determinations, and other issues.272
Following the AEMC’s consideration of this rule change proposal, significant changes were made to the regime in November 2012.273 The AEMC’s revised rules did not adopt all of the AER’s original proposal, but did go a significant way in addressing the overly permissive 2006 rules that had allowed excessive investment and revenues to be recovered by network businesses. While the rules retained the ‘reasonably reflects’ language, the changes introduce a revised framework for the AER to assess network revenues, allowing it to more robustly assess the costs proposed by electricity network businesses. They also provided for a greater focus on incentive regulation and improved stakeholder consultation processes. The benefits arising from these new rules, including new incentive schemes (Capital Expenditure Sharing Scheme (CESS), Demand Management Incentive Scheme (DMIS)), a focus on economic benchmarking, and changes to assessing debt and setting the rate of return/WACC, have been seen in AER network determinations undertaken since 2014. However, the AER has acknowledged that further work is required, particularly in relation to engagement with both consumers and network operators.274
The Australian Government also passed legislation on 16 October 2017 (with retrospective effect from 21 June 2017) to remove the ability of networks to seek limited merits review (LMR) by the Australian Competition Tribunal of AER revenue decisions.275 LMR was initially brought in by the Energy Council in 2008, and then reviewed in 2012 following significant increases in electricity prices resulting from
269 AER, Executive Briefing—Energy network regulation reform—Promoting efficient investment—protecting consumers from paying more than necessary, September 2011.
270 AER, Rule change proposal—Economic regulation of transmission and distribution network service providers—AER’s proposed changes to the National Electricity Rules, September 2011, p. 18.
271 AER, Rule change proposal—Economic regulation of transmission and distribution network service providers—AER’s proposed changes to the National Electricity Rules, September 2011, p. 18–19.
272 AER, Rule change proposal—Economic regulation of transmission and distribution network service providers—AER’s proposed changes to the National Electricity Rules, September 2011.
273 AEMC, Rule Determination—National Electricity Amendment (Economic Regulation of Network Service Providers) Rule 2012 and National Gas Amendment (Price and Revenue Regulation of Gas Services) Rule 2012, 29 November 2012.
274 ECA, AER and ENA, New Reg: Towards consumer-centric energy network regulation, March 2018.275 Parliament of Australia, House of Representatives, Competition and Consumer Amendment (Abolition of Limited Merits Review) Bill
2017, Explanatory Memorandum, pp. 3, 9.

159 Retail Electricity Pricing Inquiry—Final Report
Tribunal decisions.276 Following that review, and amendments to the LMR regime in 2013277, 12 of 20 AER gas and electricity decisions were subject to review by the Tribunal.278 The 12 network businesses sought to increase their revenue by $7 billion over five years.279 The ACCC supports the decision to abolish LMR as it will help to ensure that network pricing is moderated in future. The ACCC considers that LMR led to significant increases in prices, has drawn out the length of time taken for regulatory determinations, and has created significant uncertainty around network pricing. It notes that the 2012 review also concluded that the LMR arrangements did not lead to positive price outcomes. The ACCC also notes that merits review of certain ACCC decisions in telecommunications was similarly removed in 2010, in order to promote regulatory certainty and timely decision-making.280
Recommendation 10The ACCC supports the removal by the Australian Government of limited merits review of AER revenue decisions. Limited merits review of AER decisions should not be reinstated in the future.
7.1.2 Current and predicted trends in networks pricesAs noted above, network electricity prices have been a significant part of the increase in retail prices since 2007–08, and were the main historic driver of price increases over the 10 years examined by the ACCC. In particular, network charges increased significantly in real terms, across the NEM, in the period up to their peak in 2015.281 Following this, they have started to moderate in recent years.
The increases in network prices up to 2015 reflected a strong growth in the RABs for a number of networks. The NEM-wide RAB increased in real terms by 75 per cent from $50 billion in 2006 to $87 billion in 2017 (in 2017 dollars).282 Reasons for this investment included investments to replace ageing assets, meeting stricter reliability and bushfire safety standards, and responding to forecasts at the time of rising peak demand. These large investments also occurred during a time of instability in financial markets which increased financing costs and hence the required rate of return (or WACC), resulting in high network revenue growth across the NEM.
The increases in RABs across the NEM were not uniform. In particular, the RABs in Queensland, NSW and to a lesser extent Tasmania grew at a much greater rate than in South Australia and Victoria.
Figure 7.1: Regulatory asset base from 2006 to 2017, by NEM region, real $2016-17
2006
2008
2010
2012
2014
2016
2006
2008
2010
2012
2014
2016
2006
2008
2010
2012
2014
2016
2006
2008
2010
2012
2014
2016
2006
2008
2010
2012
2014
2016
NSW & ACT
0
5
10
15
20
25
30
35
40
Victoria South Australia Queensland Tasmania
$ b
illio
ns
Source: AER economic benchmarking, Regulatory Information Notice responses.
276 Yarrow, G, Egan, M and Tamblyn, J, Review of the Limited Merits Review Regime—Stage 2 Report, September 2012.277 See announcement in Standing Council on Energy and Resources, Bulletin—Energy Market Reform, Bulletin 21, December 2013.278 A 13th application—by AusNet Services in relation to its transmission network—was also filed but subsequently withdrawn.279 COAG Energy Council, Review of the Limited Merits Review Regime Consultation Paper, 6 September 2016, p. 4.280 Parliament of Australia, House of Representatives, Telecommunications Legislation Amendment (Competition and Consumer
Safeguards) Bill 2010, Explanatory Memorandum, p. 5.281 AER, Annual Benchmarking Report, Electricity distribution network service providers, November 2017, p. 6.282 AER economic benchmarking, Regulatory Information Notice responses.

160 Retail Electricity Pricing Inquiry—Final Report
Relevantly, the AEMC has noted in relation to the period from 2009 to 2016 that:
Overall, the broad trend [was] for capital expenditure to decrease, with a fall in augex [augmentation expenditure] partially offset by an increase in repex [replacement expenditure]. However, investment in capex including augex is ongoing and substantial. As a result, the value of the RAB has increased in real terms for all DNSPs over the past 10 years. This does not appear to reflect the trend of declining or flatlining maximum demand.283
In this context, the ACCC notes that the AER’s most recent economic benchmarking analysis shows that the relative efficiency of electricity networks has decreased overall over time (although there was a slight increase in distributor efficiency in 2016).284 Arguably, this suggests that customers were getting decreasing value for money from networks over the same period that the significant investment was taking place.
Network RABs, revenue allowances and prices across regions were driven by different policies in each state. In NSW and Queensland, changes in network reliability standards in 2005 were a significant cost driver. In Victoria the rollout of mandatory smart meters from 2009 was a major driver of network cost increases. There also appears to be significant differences between the growth in RABs and revenue allowances for the privately owned networks in Victoria and South Australia compared to the state-owned networks in NSW and Queensland.285
Network costs can, at a high level, be broken up into three different components:
�� transmission costs
�� distribution costs
�� metering costs.
The contribution of each of these to the cost stack varies between states and depends on the nature of the different networks, cost recovery approaches, and the different policies in each state. On average across the NEM, distribution charges in 2017–18 made up between 70 per cent and 80 per cent of total network costs and transmission charges between 12 per cent and 25 per cent. Metering is generally less than 5 per cent other than in Victoria, where 17 per cent of the network costs are due to the government-mandated distributor rollout of smart meters.
As submitted by parties in response to the ACCC’s Preliminary Report286, these different components have increased at different rates over the period examined by the ACCC. Data from retailers and networks indicates that the Victorian metering program was responsible for most of the increase in the network cost component in that state over the period examined by the ACCC. Other states had different drivers of costs—for example the primarily retailer-led rollout of smart meters in those states will mean those costs manifest differently in the customer bill. A significant example is that large cost increases in NSW and Queensland were due to the imposition of high network reliability standards on distributors in those states, as discussed further in section 7.2. Transmission costs tend to be driven by large lumpy investments.
As noted above, network prices are currently moderating, although the price trends depend on the specific network.287 In a number of networks, network prices over the next five years are forecast to stay relatively flat or decrease. This is for a variety of reasons. The historically low cost of capital is a particularly important factor. The relaxing of network reliability standards and changes to the regulatory regime since 2012 to address issues with the previous permissive regulatory framework, as discussed above, are other contributing factors. This has meant that network tariffs are not the driver of recent retail price rises. Instead, as chapter 1 sets out, increases in wholesale electricity costs have driven the main element of price rises over the last two years.
283 AEMC, Electricity Network Economic Regulatory Framework Review—2017 Report, 18 July 2017, p. 42.284 AER, Annual Benchmarking Report—Electricity distribution network service providers, November 2017, p. 7, AER, Annual
Benchmarking Report—Electricity transmission network service providers, November 2017, p. 6.285 Three of the four NSW networks were only recently fully (Transgrid) or partly (Endeavour, Ausgrid) privatised. Essential Energy
remains owned by the NSW Government.286 Transgrid, Submission to ACCC Preliminary Report, 17 November 2017, p. 5; Spark Infrastructure, Submission to ACCC Preliminary
Report, 24 November 2017, p. 3; Victorian Electricity Network Businesses, Submission to ACCC Preliminary Report, 17 November 2017, pp. 2–3.
287 See, for example, AER, AER approves 2018 network tariffs for Victorian electricity customers, Media Release, 10 November 2017; AER, Electricity network charges in the ACT and NSW from 1 July 2017, Open Letter, 19 April 2017; South Australia Power Networks, Pricing Proposal 2017–18, May 2017, Energex, Annual Pricing Proposal, 1 July 2017 to 30 June 2018, 4 May 2017.
161 Retail Electricity Pricing Inquiry—Final Report
The forecast of flat network prices are sensitive to a number of potential changes. The recent removal of LMR of AER decisions should help to moderate future price increases (once the remaining immediate remittals are dealt with288). However, there are potential factors that could lead to prices increasing. Most obviously, this includes the possibility of the cost of capital increasing from the current historic lows, leading to increases in the rate of return on capital that networks receive. Another important factor is the continued decrease in overall electricity usage and potential for inefficient switching away from the grid. While network costs are forecast to moderate (due to improvements in operating expenditure), the ACCC notes that RABs are still forecast to increase over this period.289 This introduces the possibility that network costs could increase in future if the operating environment, particularly the cost of capital, changes.
As such, while the flattening or decline in network costs is welcome, network costs remain a significant part of the bill and still have the potential to increase in future. This poses some clear threats to affordability. The ACCC’s focus in the Inquiry is therefore on additional ways to place downward pressure on costs and to remove inefficient cross subsidies between customers. There are four major areas that are central to reducing network costs, and thereby improving electricity affordability outcomes:
�� valuation of network assets (discussed in section 7.2)
�� cost reflective pricing and tariff reform (discussed in section 7.3)
�� flexibility and adaptability of the regulatory framework (discussed in section 7.4)
�� alternatives to traditional network investment (discussed in chapter 8), including demand management and stand-alone systems.
These matters address both the level and the structure of network prices. Reducing current prices, or preventing the prices from increasing in the future, is obviously a matter that directly assists affordability of electricity (although it may have trade-offs with reliability and service quality). However, the ACCC considers that the structure of prices is equally important—that is, customers should face efficient price signals in their use of electricity, and one group of customers should not be inefficiently cross-subsidising another.
To a significant extent, while the four issues identified by the ACCC will all separately help to address certain aspects of affordability, they are also inter-related and address both the level and structure of network tariffs. For example, cost reflective pricing will help to give signals to customers to reduce their usage at periods of higher peak network use, but also help to stop existing cross-subsidies in favour of certain customers such as solar PV users. Likewise, addressing network asset valuations will most obviously help bring overall levels of prices down, but will also help ensure that there is not an inefficient switching to alternative forms of supply. Equally, demand management will, like greater cost reflectivity in pricing, help to bring down peak usage.
The discussion about the regulatory framework also highlights overarching ways that the complex processes that are used in network price setting can be more successfully managed.
7.2 Network asset valuesAs noted above, the network cost component faced by consumers is largely driven by the value of the RAB for the relevant transmission and distribution networks. Over half of the revenue allowance for firms comes from either the return on or of the RAB (that is, the cost of capital and depreciation allowances). Accordingly, the value of the RAB is central to the question of the affordability of network prices.
This has meant that there has been considerable discussion over the issue of the current level of the RAB for electricity networks, and whether these should be ‘adjusted’, ‘written down’ or ‘optimised’ in some way. All else being equal, a reduction in the RAB of electricity networks will lead to lower network charges for customers, and hence lower retail prices (assuming that these are passed through to end users).
288 The remittal for Essential Energy was finalised on 31 May 2018—AER, Final Decision–Essential Energy 2014–19 electricity distribution determination, May 2018.
289 E.g. Tasnetworks, Tasmanian Transmission Revenue and Distribution Regulatory Proposal, 31 January 2018, p. 161; Ausgrid, Ausgrid’s Regulatory Proposal—1 July 2019 to 30 June 2024, April 2018, p. 52–3; Endeavour Energy, Regulatory Proposal—1 July 2019 to 30 June 2024, April 2018, p. 81; Essential Energy, 2019–2024 Regulatory Proposal, April 2018, p. 107.

162 Retail Electricity Pricing Inquiry—Final Report
7.2.1 Asset values under the regulatory regimeThe current regulatory regime for electricity network assets does not allow the regulator to optimise the value of network assets. The AER sets the network’s capital expenditure allowance for each five-year regulatory period, based on its assessment of the efficiency and prudency of the capital expenditure. The return on capital is earned on the RAB for the relevant regulatory period.
However, this AER-determined allowance is not the amount of capital expenditure that is added or rolled into the RAB for the next regulatory period. Instead, the network’s RAB is increased by the amount of actual capital expenditure that is made by the business over the previous five years. The AER also does not review the overall level of the asset base when setting the forward looking capital expenditure or overall revenue allowances for networks, except to the extent it forms the base for the rollover of the RAB for the next regulatory period.
As set out in section 7.1, historically there was scope for optimisation of the asset base (that is, periodic adjustment of the overall RAB value) in the network regulatory regime through the DORC approach to network assets. However, the ACCC preferred a ‘lock-in’ approach to the RAB in 2004, as subsequently formalised by the AEMC in 2006, on the basis that it provided a significant disincentive for investment by network companies.290 Subsequently, the general approach has been that all actual investment is rolled into the RAB, with a focus on applying incentives that encourage an efficient level of investment.
That said, changes to the framework in 2012 included a limited ability to review the efficiency of actual investment.291 This allowed the AER to review the efficiency of any capital expenditure above the capital expenditure allowance, and to prevent this being rolled into the RAB for the next regulatory period if it was found to be inefficient. However, this only applies to the incremental amount of capex above the allowed amount. As this mechanism was only recently introduced (and a full reset period needs to occur before it can be used), the AER has not yet reviewed any capital expenditure under this provision.
As a comparison, the National Gas Law (NGL) requires that any capital expenditure rolled into the RAB from the previous period is ‘conforming capital expenditure’, which is defined as capital expenditure that ‘would be incurred by a prudent service provider acting efficiently, in accordance with accepted good industry practice, to achieve the lowest sustainable cost of providing services’.292 However, the AER has limited discretion in how it assesses capex. This means in practice it is difficult to make adjustments, particularly in the case of expenditure to meet regulatory obligations.293 The regime also contains provision for the value of assets that ‘cease to contribute in any way to the delivery of pipeline services’ to be removed from the RAB.294
The ACCC understands that, in practice, while the conforming capex test is conducted by the AER at each reset, the AER has not typically written down actual capital expenditure using this rule. The redundant asset test likewise has not been used—although relevantly it applies to the entire asset base. Beyond these two provisions, the gas regime does not include a general ability to optimise a network’s entire RAB.
The ACCC notes that any writedown of assets would only deal with existing RAB values. It is important that other forward-looking changes continue to be progressed, such as cost reflective pricing, demand response and changes to the regulatory framework.
290 ACCC, Statement of principles for the regulation of transmission revenues-background paper, 8 December 2004; AEMC, Rule Determination—National Electricity Amendment (Economic Regulation of Transmission Services) Rule 2006 No. 18, 16 November 2006. Subsequent applications for rule changes to reinstate an ability to optimise the asset base were rejected—see, for example, AEMC, Rule Determination: Optimisation of Regulatory Asset Base and the Continued Use of Fully Depreciated Assets, 13 September 2012.
291 See, for example, AEMC, Economic Regulation of Network Service Providers, and Price and Revenue Regulation of Gas Services, Final Position Paper, 29 November 2012.
292 National Gas Rules, rr. 77(2), 79.293 AER, AER submission—Review into the scope of economic regulation applied to covered pipelines, August 2017, pp. 11–12.294 National Gas Rules, r. 85.

163 Retail Electricity Pricing Inquiry—Final Report
7.2.2 Evidence of and reasons for over-investment in networksThe level of any ‘over-investment’ or ‘over-valuation’ in the RABs of network distribution and transmission companies is difficult to assess. Estimates will inevitably depend on methodology and contain a level of subjectivity.
The Finkel review noted the potential for voluntary writedowns of RABs by asset owners to reduce prices for consumers, although it considered that compulsory writedowns would be problematic.295
Most recently, in March 2018, a Grattan Institute report estimated that $20 billion out of a total $40 billion investment in certain transmission and distribution networks in the NEM in the period from 2005 to 2017 could be considered as ‘excessive’, compared to a measure of network usage.296 Grattan recommended that there be a writedown of the values of particular publicly-owned networks, and rebates for customers of some recently privatised networks. Grattan considered that this would help to manage the affordability of the network and put it on a more sustainable long-term footing. Grattan also recommended that a number of other, more forward-looking changes be made to the regulatory framework.
The issue is not, however, just a recent one. The appropriateness of RAB valuations has been regularly debated since the growth in network usage and peak demand slowed at the end of the 2000s.
Other recent papers have also examined the extent of investment in Australian networks, and potential approaches to manage cost implications for customers;
�� Simshauser has considered this issue in two main papers. An earlier paper identified evidence of rapidly increasing RABs, and noted the potential for voluntary asset writedowns prior to any privatisation of government-owned assets in NSW and Queensland.297 A later paper considered 10 principles for managing stranded assets, concluding that there was no serious argument for either zero recovery or full recovery of stranded asset values, and recommending an approach based on causation of over-investment.298 The paper did not, however, take a view on whether (or to what extent) there were currently stranded assets in the NEM.
�� Crawford, from Energy Networks Australia, considered that writedowns of the asset base would actually lead to higher network tariffs, due to increased cost of capital requirements associated with higher investment risk that comes with the potential for some capital expenditure not being recovered, and increase the likelihood of users inefficiently switching away from grid-supplied electricity.299
�� Network asset values were also an issue in the 2017 Queensland election, where the LNP opposition promised to write down the value of Energy Queensland’s asset base by $2 billion to reduce network charges.300
A large number of other papers and government reviews have also examined the issue, with both lower and higher estimates of the extent of any over-investment.301
As noted above, the recent Grattan Institute report argued that up to $20 billion of investment in electricity networks was excessive.302 That is, it argued that, while the value of network RABs grew from $50 billion in 2005 to around $90 billion today, around half of that investment may have been larger than is now needed. Grattan makes this argument primarily on the basis of capital investment having significantly outgrown usage over the same period. It argues that a useful exercise is to compare
295 Dr Alan Finkel AO, Chief Scientist, Chair of the Expert Panel, Independent Review into the Future Security of the National Electricity Market–Blueprint for the Future’, June 2017, p. 136.
296 Wood, T, Blowers, D and Griffiths, K (Grattan Institute), Down to the Wire: A sustainable electricity network for Australia, March 2018.297 Simshauser, P, ‘From First Place to Last: The National Electricity Market’s Policy-Induced ‘Energy Market Death Spiral’’, The Australian
Economic Review, vol. 47(4), 2014, pp. 540–562.298 Simshauser, P, ‘Monopoly regulation, discontinuity & stranded assets’, Energy Economics vol. 66, 2017, pp. 384–398.299 Crawford, G (Energy Networks Association), Written-down value? Assessing proposals for electricity network write-downs, August
2014. A later paper examined five main alternative options to recover the cost of assets, concluding that flexible depreciation techniques may be most useful. See: Crawford, G ‘Network depreciation and energy market disruption: Options to avoiding passing costs down the line’, Economic Analysis and Policy, vol. 48, 2015, pp. 163–171.
300 O’Brien, C, ‘Queensland election: LNP pledges power bill savings of $160, scraps renewable energy subsidies’, ABC, 5 November 2017, viewed 9 May 2018, http://www.abc.net.au/news/2017–11–05/lnp-power-prices-election-promise-cost-of-living/9119994.
301 See for example, Grant, H, Assets or Liabilities? The need to apply fair regulatory values to Australia’s electricity networks, Energy Consumers Australia, 5 May 2016; CME, Write-downs to address the stranded assets of electricity networks in the National Electricity Market: evidence and argument, April 2015; Senate Environment and Communications References Committee, Performance and management of electricity network companies, Interim Report, April 2015, p. 71–5.
302 Wood, T, Blowers, D and Griffiths, K (Grattan Institute), Down to the Wire: A sustainable electricity network for Australia, March 2018.
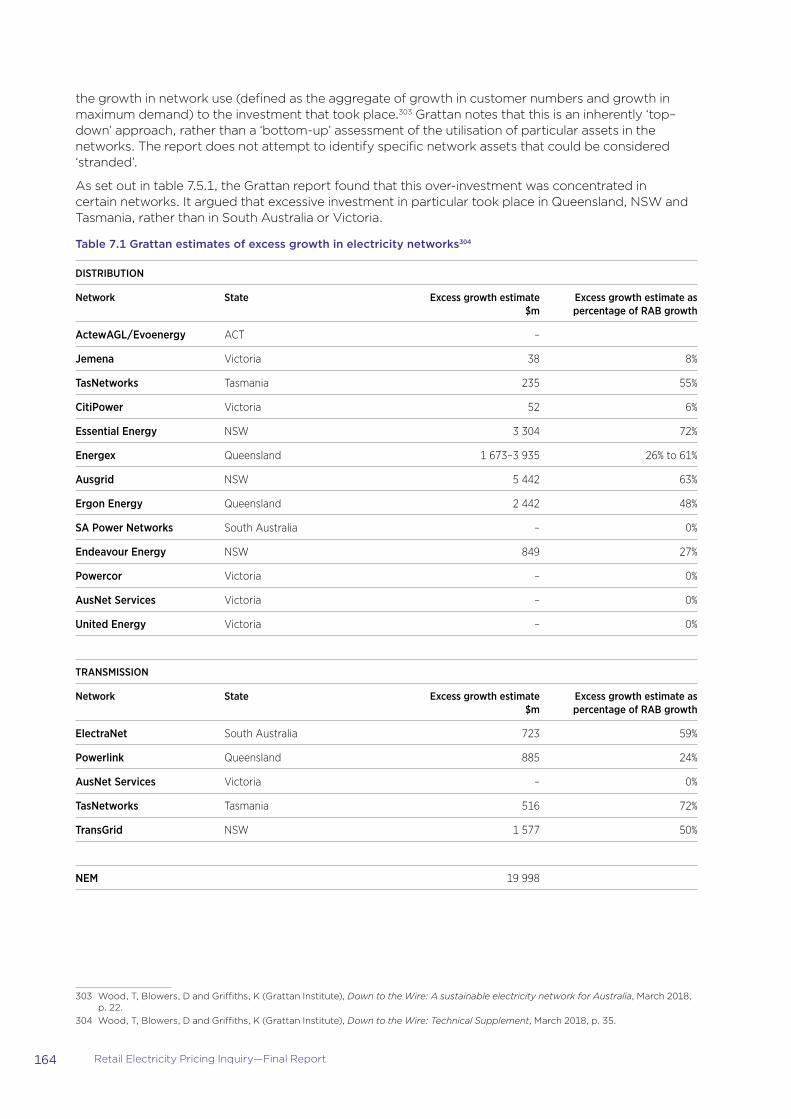
164 Retail Electricity Pricing Inquiry—Final Report
the growth in network use (defined as the aggregate of growth in customer numbers and growth in maximum demand) to the investment that took place.303 Grattan notes that this is an inherently ‘top–down’ approach, rather than a ‘bottom-up’ assessment of the utilisation of particular assets in the networks. The report does not attempt to identify specific network assets that could be considered ‘stranded’.
As set out in table 7.5.1, the Grattan report found that this over-investment was concentrated in certain networks. It argued that excessive investment in particular took place in Queensland, NSW and Tasmania, rather than in South Australia or Victoria.
Table 7.1 Grattan estimates of excess growth in electricity networks304
DISTRIBUTION
Network State Excess growth estimate $m
Excess growth estimate as percentage of RAB growth
ActewAGL/Evoenergy ACT –
Jemena Victoria 38 8%
TasNetworks Tasmania 235 55%
CitiPower Victoria 52 6%
Essential Energy NSW 3 304 72%
Energex Queensland 1 673–3 935 26% to 61%
Ausgrid NSW 5 442 63%
Ergon Energy Queensland 2 442 48%
SA Power Networks South Australia – 0%
Endeavour Energy NSW 849 27%
Powercor Victoria – 0%
AusNet Services Victoria – 0%
United Energy Victoria – 0%
TRANSMISSION
Network State Excess growth estimate $m
Excess growth estimate as percentage of RAB growth
ElectraNet South Australia 723 59%
Powerlink Queensland 885 24%
AusNet Services Victoria – 0%
TasNetworks Tasmania 516 72%
TransGrid NSW 1 577 50%
NEM 19 998
303 Wood, T, Blowers, D and Griffiths, K (Grattan Institute), Down to the Wire: A sustainable electricity network for Australia, March 2018, p. 22.
304 Wood, T, Blowers, D and Griffiths, K (Grattan Institute), Down to the Wire: Technical Supplement, March 2018, p. 35.

165 Retail Electricity Pricing Inquiry—Final Report
The ACCC considers that the numbers derived using the Grattan methodology represent a reasonable way to go about estimating the potential over-investment in electricity networks. However, those numbers, as with any others, depend on the assumptions and methodology used, including the definitions of excess growth used and data limitations.305 In consultation with the ACCC during this review, network companies submitted that there were significant reasons why the Grattan numbers were overestimates. These included:
�� questioning whether the Grattan usage measure accurately reflected network value to consumers, for example noting that customers may have valued reliability improvements, that distribution networks now allow for two-way flows of electricity facilitated by distributed energy resources306, or that money spent on interconnectors had considerable benefit in the wholesale market
�� noting that replacement of assets at the end of their lives would necessarily lead to increases in the RAB, due to increases in the costs of labour and assets at rates higher than the CPI
�� noting that basing the assessment of ‘excess growth’ on utilisation and the amount of investment implied that there was a straight line relationship between investment and usage, whereas the ‘lumpy’ nature of investment means this is not the case
�� highlighting the relevance to the assessment of the time period examined, in that investment may have been necessary to ‘catch up’ with a prior period of low investment (and that the time periods used varied between networks)
�� noting that a focus on total network usage does not reflect that investment is largely driven by localised constraints within a network.
The ACCC considers that the issues raised above highlight the challenges in undertaking the task of estimating over-investment. The extent of each particular issue will vary between networks and between transmission and distribution. There are many legitimate reasons for investment to take place that may not be fully captured in the top-down comparison between investment and utilisation used by Grattan. The Grattan report itself describes its numbers as a ‘sense-check’ rather than definitive.307
To the extent concerns raised by network businesses are valid (and to assess all of the various issues would likely require detailed historical usage and investment information), this may mean that the Grattan estimate of any over-investment is too large. However, the ACCC equally notes that some of Grattan’s assumptions may have led to an underestimation of the amount of excess growth. For example the acceptance of the DORC methodologies used to initially value networks.308 As noted above, other estimates have also been made of potential over-investment in networks, with varying approaches and estimates of the extent of the problem.309
Three main drivers of over-investment in networks are often identified as:
�� an increase in network reliability standards in Queensland and NSW following outages in 2004 (these were subsequently changed once found to be overly cautious, but investment had occurred to meet them while in place)
�� incentives in the regulatory framework, particularly those incentives where the rule structure and a high rate of return relative to actual financing costs faced by the businesses may encourage greater investment (also known as a ‘capex bias’)310
�� public ownership of networks in Queensland and Tasmania and (until recently) NSW, that may have led to higher costs.311
305 Wood, T, Blowers, D and Griffiths, K (Grattan Institute), Down to the Wire: Technical Supplement, March 2018, pp. 5, 22.306 For example, as discussed in CSIRO and ENA, Electricity Network Transformation Roadmap: Final Report, April 2017.307 Wood, T, Blowers, D and Griffiths, K (Grattan Institute), Down to the Wire: Technical Supplement, March 2018, p. 22.308 Wood, T, Blowers, D and Griffiths, K (Grattan Institute), Down to the Wire: A sustainable electricity network for Australia, March 2018,
pp. 10, 25.309 Grant estimated that the asset base of networks in the NEM should be written down by about $38bn—see Grant, H, Assets or
Liabilities? The need to apply fair regulatory values to Australia’s electricity networks, 5 May 2016, p. 82. CME estimated that the regulatory asset values in NSW, Queensland and Tasmania would be $14.7 billion lower at 30 June 2013 had capital expenditure per connection occurred at the same rate as in Victoria and South Australia—CME, Write-downs to address the stranded assets of electricity networks in the National Electricity Market: evidence and argument, April 2015, p. 42.
310 KPMG, Optimising network incentives a report for the Energy Market Transformation Project Team, January 2018, Frontier Economics, Total Expenditure Frameworks a report prepared for the Australian Energy Market Commission, December 2017: CEPA, Incentives Faced by Network Service Providers Australian Energy Market Commission, 16 April 2018.
311 Wood, T, Blowers, D and Griffiths, K (Grattan Institute), Down to the Wire: A sustainable electricity network for Australia, March 2018, pp. 10, 25–26, 31.

166 Retail Electricity Pricing Inquiry—Final Report
The ACCC considers that the above factors seem to be the most likely reasons for excess investment during the period examined. The increased reliability standards (as discussed in box 7.1) most directly led to specific cost claims by networks in those two states. They were also subsequently changed, indicating that they are now not valued by both government and customers. As such, the investment can be more clearly seen in retrospect as excessive.
Box 7.1: Reliability standards in NSW and QueenslandChanged reliability standards in NSW and Queensland in 2005 led to significant additional costs for networks in both jurisdictions.
The NSW Government introduced highly prescriptive standards that were deterministic and focused on the input standards that TransGrid should achieve in planning the network, rather than the outputs of reliability that should be achieved.312 Prior to the introduction of the licence conditions, the individual NSW DNSPs were responsible for determining the appropriate level of reliability for their customers. The Transmission Standard meant that the criteria are set by reference to an N-x requirement—for example, N-2 means that the network must build sufficient redundancy into the network to ensure supply if two elements of the network fail.
In Queensland, reliability standards were set that required incremental improvements in network reliability over time, by reference to a Minimum Service Standard specified in the legislation.313 Again, these standards were prescriptive and had a strong focus on inputs rather than outcomes.314
As discussed in section 7.4, while difficult to quantify, there is arguably a bias within the existing regulatory framework towards encouraging more capital expenditure, particularly prior to more recent framework changes such as the capital expenditure sharing scheme (CESS) introduced in 2013. For example, the 2006 regulatory framework changes that helped to ensure that actual capital expenditure was rolled into the RAB encouraged companies to overspend the allowance given to them by the AER.
While the effect of public ownership is less easily quantified, there is evidence that RABs and tariffs increased significantly more in publicly-owned networks than in private networks. Public ownership may, for a variety of reasons, impose a range of non-commercial obligations on network companies that lead them to over-invest and not constrain costs.315 More generally, governments are averse to the political risks of outages, or may become reliant on profits from publicly-owned firms that are less transparently collected than taxes and rates.
Ultimately the ACCC considers that there is unlikely to be a single objectively correct measure of network over-investment, even in a full bottom-up modelling exercise. However, estimates from sources such as Grattan or others give a useful starting point for consideration of possible levels of over-investment.
7.2.3 Solutions to over-investmentThe ACCC considers that there are two possible solutions to network over-investment:
�� in the short term, a one-off, voluntary writedown of asset values in those networks where over-investment has occurred, leading to a reduction in the RAB, and in turn revenues and prices
�� in the longer term, an amendment to the regulatory regime to allow for greater scrutiny of potential stranded assets or the efficiency of investments made by networks.
The ACCC considers each of these in turn below.
312 AEMC, NSW workstream, Review of Distribution reliability outcomes and standards, Final Report, 31 August 2012; IPART, Electricity transmission reliability standards-an economic assessment, Final Report, August 2016.
313 QCA, Final Decision–Review of Minimum Service Standards and Guaranteed Service Levels to apply in Queensland from 1 July 2015, June 2014.
314 Independent Review Panel on Network Costs, Electricity Network Costs Review Final Report, 2013, p. vii.315 PC, Electricity Network Regulatory Frameworks, 9 April 2013, pp. 263–294.

167 Retail Electricity Pricing Inquiry—Final Report
Asset writedownsAs noted above, the potential for writedowns of network assets has been considered at both a theoretical and empirical level in a number of recent papers. Numerous submissions in response to the ACCC’s Preliminary Report also addressed the issue, both in favour of and against the idea, or noting practical difficulties.316
The value of network asset bases is a direct determinant of the amounts paid by electricity users for network charges, and hence directly affects electricity affordability. A RAB writedown would, all else being equal, lead to reduced network costs.
Who should pay for high asset values?
Currently, consumers are effectively paying for any overvaluation of network assets—that is, the higher RAB leads to higher prices. The case from an affordability point of view for writedowns is, in one sense, fairly simple. A lower network asset base leads, all else being equal, to lower revenues, which in turn lead to lower prices for consumers. That said, there would likely be other ramifications, which could lead to price increases, were a writedown not carefully executed.
Furthermore, a writedown of electricity network asset values has the potential to help limit the costs arising from consumers defecting from grid-supplied electricity (for part or all of their load) to other forms of supply when this is inefficient from a network perspective. While potentially rational from the perspective of the individual consumer, such defection can in turn raise costs for those customers unable to switch, and in the extreme case can lead to what has been termed a potential electricity ‘death spiral’. This is discussed further in box 7.2.
Box 7.2: Effects on consumption and use of alternative supply from inefficiently high pricesOver-investment in networks will lead to higher costs, as network companies recover their return on and of capital based on a higher than efficient RAB. A writedown would, conceptually, reduce the RAB to an efficient level, and hence reduce costs (and the amounts that networks can charge to recover those costs) to a lower level.
Over-investment is an issue because high prices for electricity (above an efficient level) have the potential to make customers change their electricity consumption from an efficient level of usage. This is known as a ‘dead-weight loss’ and may take a number of forms—customers may forego consumption that they would otherwise have valued, switch to alternative supply, or invest unnecessarily in demand reducing technologies.
Previously, where demand for electricity was growing, and where there was limited substitutes to grid-supplied electricity, the amount of dead-weight loss may have been fairly small (that is, consumption choices may not have changed much). In such a case, it may have been relatively efficient, or at least not significantly distorting, to recover costs of over-investment from consumers through network charges. This was arguably the case until around 10 or 15 years ago.
However, the slowing down of demand growth since the late 2000s, and the increasing availability of alternatives to grid-supplied electricity in rooftop solar PV and batteries, mean this is now unlikely to be true. In particular, consumers may face inefficient signals (from the point of view of network costs) to invest in solar PV, exacerbated by the subsidisation of that technology in both installation costs (through the SRES) and generous premium FiTs. More recently, solar PV installations have been driven by decreases in the costs of installation of such systems. Solar PV users have also benefited from incentives introduced by the existing structure of network and retail tariffs (in particular the high variable usage charges that, in part, recover some fixed costs). However, this rapid take up of solar PV is not clearly efficient from a system-wide perspective.
316 PIAC, Submission to ACCC Preliminary Report, 4 December 2017, p. 16; EnergyAustralia, Submission to ACCC Preliminary Report, 4 December 2017, p. 5; CALC, Submission to ACCC Preliminary Report, 7 December 2017, p. 5; CCIQ, Submission to ACCC Preliminary Report, 4 December 2017, p. 2, RBB Economics, Submission to ACCC Preliminary Report, 4 December 2017, pp. 10–12; IFM/AusSuper, Submission to ACCC Preliminary Report, 4 December 2017; Transgrid, Submission to ACCC Preliminary Report, 17 November 2017, pp. 13–14; Victorian Electricity Network Businesses, Submission to ACCC Preliminary Report, 17 November 2017, p. 5; Spark, Submission to ACCC Preliminary Report, 24 November 2017, p. 5; ECA, Submission to ACCC Preliminary Report, December 2017, pp. 16–18; ENA, Submission to ACCC Preliminary Report, 17 November 2017, pp. 10–11.
168 Retail Electricity Pricing Inquiry—Final Report
Instead, there is a risk that a combination of current factors, including price levels, structures and subsidies, is driving this.
Solar PV users will use less grid-supplied electricity, and hence contribute less towards network costs (at least under traditional daily supply plus flat-rate usage network tariffs that the majority of small customers are on). This decreased contribution from solar PV users in turn leads to an increase in costs for other customers (as total network revenues are recovered over a smaller number of customers), incentivising them to also switch away from the use of grid-supplied electricity, which in turn increases costs further. At a certain point, when the costs become unsustainable, this reinforcing cycle can become what has been referred to as the ‘death spiral’. The term refers to the problem where lowering demand for a service leads to asset costs being spread over a smaller number of customers, increasing the costs per customer. This in turn increases the incentives on customers to cease using the service, leading to even fewer customers, and the problem becomes self-perpetuating.
The size of the dead-weight loss and incentive to switch, and hence potential for the ‘death spiral’, will be related to both the structure and level of charges, and any subsidies in place that reduce the cost of alternatives to grid-supplied electricity. The ACCC discusses issues related to the structure of charges below in section 7.3. However, the level of charges is directly related to questions around writedowns—as a writedown of the RAB and hence reduction in charges may reduce or limit the size of the dead-weight loss. We discuss the size of the potential decreases below.
The ACCC notes, however, that the extent of inefficient behaviour is not just related to the network charges, as consumers respond to the level of the total retail charges they face.
As identified by various commentators317, the alternatives to consumers paying for the costs of any over-investment are that either the network businesses pay (in that the government could simply legislate for network RABs to be reduced), or the government pays through the use of general taxation or rates.
Stakeholders have raised concerns that the ‘business pays’ approach may lead to problems for the broader regulatory regime. Most obviously, any writedown by governments of the RABs of privately owned businesses would have a significant risk of introducing the perception of sovereign risk by investors in electricity networks (or more broadly) in Australia. They may require a material increase in the rate of return (as calculated by the WACC) as a result. As noted above, ENA has argued that this would in fact lead to higher overall costs for end-users.318 The extent of such an increase in the WACC may be more limited if this was seen as a clear one-off event. However, the ACCC considers that there would be clear regulatory risk introduced by a general writedown. In any case, the evidence of over-investment in private networks is not as clear.
The other alternative is that the government pays for the cost of overvaluations. Grattan identifies this happening in two ways—through a voluntary writedown by state government owners of the value of the RAB for networks that remain publicly owned, or through a rebate to customers on the three NSW networks that were only recently privatised.319 The ACCC considers that this approach is a relatively attractive one over consumers continuing to pay for over-investment for a number of reasons.
First, by ensuring that the writedown (or rebate payment) is a voluntary one by the government owners, there should be limited concern about broader sovereign risk issues for investors. Some stakeholders did raise concerns that even a voluntary writedown may lead to investors more generally requiring a higher rate of return. However, the ACCC considers that as long as the writedown is voluntary and clearly a one-off event, this is unlikely to be the case.
Secondly, the ACCC considers that a voluntary writedown by government will better reflect the reasons for the over-investment (the ‘causer pays’ principle). Given that government reliability standards, the effects of public ownership and the regulatory regime appear to be significant drivers of the high investment, it is appropriate that the government, rather than consumers, pay to remedy this.
317 Wood, T, Blowers, D and Griffiths, K (Grattan Institute), Down to the Wire: A sustainable electricity network for Australia, March 2018, p. 33; Simshauser, P, ‘Monopoly regulation, discontinuity & stranded assets’, Energy Economics vol. 66, 2017, pp. 384–398.
318 Crawford, G (Energy Networks Association) Written-down value? Assessing proposals for electricity network write-downs, August 2014.
319 Wood, T, Blowers, D and Griffiths, K (Grattan Institute), Down to the Wire: A sustainable electricity network for Australia, March 2018, pp. 33–7.

169 Retail Electricity Pricing Inquiry—Final Report
Thirdly, this reduction in prices will help spread the costs over a broader base of taxation. While there are of course also inefficiencies attributable to taxation, the ACCC considers that this inefficiency is likely to be less than that of continuing to have consumers face high network charges, given the concerns about the consumption effects that can be introduced by higher-than-efficient prices. To the extent that certain rates and taxation are more progressive (for example, Federal income tax or state land taxes), it may also be relevant that the costs of the writedown are recovered from individuals with a greater capacity to pay.
Given that, under current charging structures, users with access to solar PV are able to avoid contribution to the network costs, governments paying the cost of writedowns should also be more equitable in that all users will pay contributions through taxes (rather than just those with high usage of grid-supplied electricity). The current user-pays approach will tend to favour those users who are able to benefit from solar PV, which has implications for the ongoing efficiency of the network.
Finally, paying for over-valuation out of taxation now, rather than ongoing fees, is also more transparent about how costs are being recovered.
However, the ACCC does note that, to an extent, governments writing down asset bases using taxation is just moving costs—in that government owners will receive lower profits from their ownership of the network assets. To that extent, it may limit the extent to which governments could pay rebates such as the Queensland Government’s $50 a year ‘electricity asset ownership dividend’320, or other non-electricity schemes. This is an assessment that government owners will have to explicitly make. However, the ACCC considers that from an electricity standpoint there are clear affordability and efficiency gains to be made from an explicit writedown made now.
ACCC view on writedowns
The ACCC considers that, significantly, a writedown of an asset does not necessarily mean that wrong decisions were made by asset owners. For example, networks did not have a choice other than to meet state government reliability standards, and estimates of demand that were too high may have been based on the best information at the time.
Instead, a writedown should be viewed as a way of limiting the extent to which customers continue to pay for investment that has turned out to not be useful, and of improving economic efficiency. The amounts that customers pay for network costs has a direct impact on affordability, with potential ongoing ramifications for the long-term efficient use of the network and alternative forms of supply. A writedown can help to curtail the potential for ongoing affordability problems that are concentrated on particular customers, and avoid, in the extreme case, the electricity ‘death spiral’. The ACCC considers that the strong investment in solar PV to date is compelling evidence that there are long-term issues with the pricing of networks and grid-supplied electricity.
Given that there is evidence that the greatest over-investment has taken place in government-owned networks, the ACCC recommends that government owners review the value of their networks and impose appropriate writedowns of the network asset base in order to improve the affordability of the network tariff component of electricity charges. The ACCC also recommends that the NSW Government, which has only recently privatised networks (and in the case of distributors retains an ownership interest), conduct a similar exercise to identify an appropriate customer rebate for customers of those networks. The ACCC considers that the potential need to raise the cost of capital is a good reason against any broader mandated writedowns for privately-owned networks.
The exact amount of a writedown or rebate is of course a central consideration. The ACCC notes the breadth of estimates mentioned above, and the difficulty in establishing a ‘correct’ number. We consider that the Grattan report approach provides a valid starting point to assess the relative cost and benefits customers have received from network investments. High levels of network investment have exceeded the continuing benefit in usage that those customers receive in some jurisdictions.
We note that there are concerns with elements of the Grattan methodology. As such, it is not clear that the Grattan estimates are necessarily the ‘correct’ numbers for an asset writedown. However, the estimates present the most considered estimates available and as such should be used by governments in the absence of alternatives.
320 Queensland Government, Electricity asset ownership dividend, 26 April 2018, viewed 13 May 2018, https://www.qld.gov.au/community/cost-of-living-support/asset-ownership-dividend.
170 Retail Electricity Pricing Inquiry—Final Report
The estimates may need to be supplemented by careful assessment of specific scenarios and asset values for the relevant network. The ACCC has not, in this inquiry, sought to undertake such an assessment, given that it would require detailed network investment and operational information, considerable time, and a clear set of assessment criteria for measuring customer benefit. It is also unclear, given its difficulty, that a detailed assessment of this type would be a useful step, given that any assessment would likely be subject to its own error and delay the benefits to customers.
As guidance, we note that Grattan estimated that writedowns in the order of those estimated would lead to reductions in the companies’ revenue by the following percentages:321
�� Queensland – Powerlink—10 per cent – Ergon Energy—16 per cent – Energex—14 per cent
�� NSW – Transgrid—20 per cent – Essential—29 per cent – Ausgrid—30 per cent – Endeavour—9 per cent
�� Tasmania – TasNetworks transmission—26 per cent – TasNetworks distribution—10 per cent.
The particular price outcomes that would result from these decreases in revenues would depend on whether the same pricing structures were maintained, and would be different in different distribution networks. The revenue decreases could be shared evenly between all tariffs and customer types (in effect reducing all prices consistently by the percentages above). Alternatively, they may be directed towards particular customers in these states or with a greater proportion of savings directed to variable charges.
The effect on end-user prices would also depend on the extent to which transmission price and distribution price decreases were passed on to customers by retailers.
However, the ACCC considers that, if the same percentage reductions in revenue requirements (or equivalent rebates) were then carried through proportionally to retail prices and bills, the overall network component in an average residential customer bill for each state would decrease by:
�� Queensland—$110 per year
�� NSW—$164 per year
�� Tasmania—$120 per year.322
The ACCC notes that these results suggest that, even if some of the concerns raised by network companies in relation to the Grattan numbers are correct, writedowns and rebates that can save residential customers in these states in the order of at least $100 per year should be achievable.
Network costs are also incurred to serve all customers using grid-supplied electricity. Business customers would also achieve similar proportional reductions in their network bills, although again the exact amounts depend on the way that revenue reductions were passed on into network tariffs and then retail prices for these customers.
Finally, the ACCC considers that writedowns would provide a greater level of certainty than rebates, and should be the preferred option of government owners. That said, reductions in prices charged, or rebates, would also provide benefit to consumers of electricity, but would be less ‘hard-wired’ in for future periods. For example, the ACCC notes that the Queensland Government’s existing ‘electricity asset ownership dividend’ is only guaranteed for two years.
321 Wood, T, Blowers, D and Griffiths, K (Grattan Institute), Down to the Wire: A sustainable electricity network for Australia, Technical Supplement, March 2018, p. 17.
322 The ACCC notes that these amounts are based on the ACCC data from retailers and would be sensitive to assumptions about how cost reductions are passed through to and shared between customer types.

171 Retail Electricity Pricing Inquiry—Final Report
The ACCC recommends that any rebate is embedded into network electricity prices and be assessed by the AER as part of its revenue assessments and annual price setting processes. That is, the rebate should not come separately from state governments directly to households.
A ‘causer pays’ approach suggests that state governments should foot a significant part of the bill of any writedown or rebate—because reliability standards and public ownership are the role of state government and appear to be significant drivers of over-investment. However, the ACCC considers that there is a role for the Australian Government to contribute to writedowns or rebates paid to the extent that the broader regime is at fault (for example, by encouraging over-investment due to incentives in the regime).323
Recommendation 11The governments of Queensland, NSW and Tasmania should take immediate steps to remedy the past over-investment of their network businesses in order to improve affordability of the network. With appropriate assistance from the Australian Government, this can be done:
�� in Queensland, Tasmania and for Essential Energy in NSW, through a voluntary government write-down of the regulatory asset base
�� in NSW, where the assets have since been fully or partially privatised, through the use of rebates on network charges (paid to the distribution company to be passed on to consumers) that offset the impact of over-investment in those states.
Such write-downs would enhance economic efficiency by reducing current distorting price signals. The amount of the write-downs and rebates should be made by reference to the estimates of over-investment by the Grattan Institute, and should result in at least $100 a year in savings for average residential customers in those states.
Recommendation 12The AER should be given the power to monitor the effect of the write-downs and rebates on network charges effectively faced by retail customers.
Amendments to the regulatory regimeIn the longer term, the regulatory regime could be altered to more explicitly deal with the potential for asset stranding on an ongoing basis. The ACCC considers that this could take three main forms:
�� amend the regulatory regime to allow for greater scrutiny over the efficiency of actual capital investment, perhaps taking cues from the gas laws
�� amend the regulatory regime to have an explicit process for future stranded assets, how this is assessed, and how it is to be shared between businesses and users
�� introduce a depreciated optimised replacement cost (DORC) methodology.
As noted above, under the electricity regime, the AER reviews actual capex only to the extent that the electricity network’s actual capital expenditure was greater than forecast. The AER can examine this incremental overspend for efficiency, and potentially not include it in the subsequent reset period’s RAB. In comparison, under the gas regime, the AER can adjust the RAB to ensure that only efficient actual capex is included in the RAB, regardless of whether actual capex was greater or less than forecast. However, the AER under the gas regime is also more limited in its ability to substitute its own estimate of the efficient level of capex. The ACCC accepts that the differences between the two approaches may stem from broader differences between the two regulatory regimes and the nature of the assets, but considers that an increased ability to review capital expenditure may help to limit future over-investment. That said, extending the ability to review the amount of capital expenditure to be rolled into the next period’s RAB only allows for an evaluation of the most recent five years of expenditure (and, for example, capex overspend has not been such an issue in the most recent set of regulatory resets). It would not allow for addressing issues with the overall level of RABs.
323 In the case of rebates, this contribution would be straightforward—the Commonwealth would contribute to the amounts paid. In the case of writedowns, where the cost to the state government owner would be a lower asset RAB leading to ongoing lost revenues, the contribution could compensate the state government over time, or be an equivalent one-off payment.

172 Retail Electricity Pricing Inquiry—Final Report
The ACCC considers that, given the introduction of schemes such as the CESS, there may be limited need for expanding the review function beyond its current form. A CESS, as a mechanism that rewards network operators for capital efficiency gains and penalises them for capital efficiency losses, should help provide similar incentives for efficient investment to those of a more fulsome ex-post review of capital expenditure, and help to limit the risk of excess future investment in the RAB.
The second potential change noted above echoes that identified by commentators including Grattan and Simshauser as a necessary future change to address stranding risk and prevent a significant overvaluation issue in future due to unused assets.324 That change is that the regulatory regime should explicitly allow for the risk that assets may become no longer useful, and specify how the recovery of the value of those assets is split between business and users. This would require triggers or periodic evaluations to identify and value stranded assets, and adjustments to the RAB. As Grattan notes, an explicit process such as this would be contentious and complex, but may provide a strong incentive on businesses to minimise the risk of assets being stranded. The ACCC considers that amendments along these lines will be necessary at some point given the take up of solar PV and increased potential for stand-alone systems. Again, the ACCC notes that the gas laws do seem to more explicitly identify the potential for asset stranding.
Overall, the ACCC considers that the introduction of rules that explicitly deal with the risk of asset stranding needs to take place. Consideration may need to be given to whether existing assets are dealt with differently to future investments under these rules.
An alternative form of treating assets differently could include explicit different rates of return for different assets or asset classes—a lower WACC on sunk assets, with a higher WACC for future efficient investment that aims to capture some of the uncertainty presented by stranding risk. Such a system would need to be carefully considered to ensure that appropriate incentives were created by the returns from the differing rates of return.
The third option identified above would be a more direct adoption of a DORC methodology, in that the network would be periodically revalued and updated. The ACCC considers that there are significant difficulties with this approach, and does not consider it should be adopted. First, the approach would introduce greater regulatory risk for investors given the uncertainty it would introduce and the potential for under-compensation of investment—and would likely mean that the savings from a lower RAB may be offset by the increased cost of capital. Secondly, this would require a significant and detailed assessment process to identify DORC valuations of all assets. Thirdly, given increases in other costs, it is far from clear that a DORC methodology for the entire network would lead to a decrease in network values and improvement in affordability. Fourthly, it is unclear how upgrades would be treated, potentially threatening future investment, as an optimised network may be cheaper to upgrade than the actual legacy network. Overall, this would be a major change from the existing regime, would fundamentally alter the current incentive schemes and regulatory approach, and has significant issues.
Recommendation 13The National Electricity Rules should explicitly allow for a process whereby network assets may be stranded and the costs of that stranding is shared between users and networks. The AEMC should determine the definition of ‘stranding’ and how the costs of ‘stranding’ can be shared.
324 Wood, T, Blowers, D and Griffiths, K (Grattan Institute), Down to the Wire: A sustainable electricity network for Australia, March 2018, p. 39; Simshauser, P, ‘Monopoly regulation, discontinuity & stranded assets’, Energy Economics vol. 66, 2017, pp. 384–398.

173 Retail Electricity Pricing Inquiry—Final Report
7.3 Cost reflective network tariffsCost reflective pricing is the concept that the charges paid by users of the network should reflect the underlying costs of that network in providing the service to the customer. The existing structure of charging for many small customers, based on a large flat rate usage charge with a smaller fixed component, does not do this.
As noted earlier in this chapter, network costs make up almost half of a customer’s overall electricity bill. Making sure that these costs are kept as low as possible, and are allocated fairly across all customers, is therefore a key element of improving energy affordability. Cost reflective network pricing could help to achieve these objectives by:
�� providing incentives on customers to minimise the overall peak usage on the network (the main driver of increases in network costs)
�� allocating network charges to customers based on the impact of that customer on current and future network costs, therefore more fairly distributing costs between customers.
These potential benefits of greater cost reflectivity in pricing have been advocated for a long period of time. For example, the Parer review in 2002 noted that:
Benefits result from retailers being able to more accurately charge consumers according to their time-of-day usage. Consumers would then potentially have the price signals available to them to engage more actively in load reduction, perhaps through energy efficiency measures and load shifting into cheaper periods for discretionary power uses.325
Despite this, the progress of tariff reform to provide greater cost reflectivity has been slow. New rules introduced by the AEMC, requiring network businesses to make cost reflective tariffs available to their small customers from 2017, provide the framework for the required changes. However, change is likely to remain too slow without greater commitment to reform by government and market participants.
7.3.1 What are cost reflective tariffs?Network costs are, to a large extent, driven by the value of network assets, which reflects the need to meet electricity demand on the network at peak times that happen for only a few days each year. The PC, for example, found that peak demand events in NSW occur for less than 40 hours per year (or less than 1 per cent of the time) yet account for around 25 per cent of retail electricity bills.326 It is, therefore, expectations about customers’ use of electricity during those network peaks (rather than overall usage) that has driven the majority of the network cost increases over the past decade.
Cost reflective tariffs are charges that reflect the fact that peak usage drives costs. They could help reduce peak demand by providing customers with a price signal that reduces the customer’s use at the busiest times, and in turn reduce the need for future cost increases.
To do this, electricity charges should ideally provide efficient signals to customers about when they should use electricity, in addition to how much electricity they should use. They could also signal whether customers should source their electricity from the grid or alternative sources. These decisions not only affect the individual customer, but impact the overall level and efficiency of electricity costs for all customers at a system level and into the future.
There are a range of options for designing tariffs, with different strengths of signal about the cost of supplying customers at times of peak network demand (see box 7.3). The different options lie on a spectrum that typically involves a trade-off between simplicity and cost reflectivity, from flat tariffs to critical peak pricing. Simplicity is a key consideration in eliciting behaviour change from smaller customers, due to their typically low level of engagement with their electricity supply. However, an element of cost reflectivity in network tariffs is needed to encourage behavioural change.
325 COAG, Towards a Truly National and Efficient Energy Market, Final Report, December 2002, p. 181.326 PC, Electricity network regulatory frameworks, Inquiry report, Volume 1, April 2013, p. 16.

174 Retail Electricity Pricing Inquiry—Final Report
The traditional flat rate tariff is currently used for the majority of residential customers. This tariff structure provides incentives for customers to reduce the total volume of electricity they consume from the grid (for example, through energy efficiency measures, behaviour change or self-generation), but not to consider the timing of their usage. This means that there is limited incentive on customers to reduce their usage at time of peak demand. It also means that some customers who contribute more to costs at those times of peak demand are effectively subsidised by other customers.
Network tariffs are charged to retailers. It is up to the retailer to package the network charge with other costs of supply in developing the retail tariff that the customer pays. Retailers have freedom in how they do this. Retailers may choose to offer their customers retail charges that largely pass through any cost reflective signals in the network charge. Alternatively, the retailer may choose to offer retail charges that, to an extent, hide the impact of varying network tariffs (in a similar way to how small customers are not typically exposed to the variations in the wholesale spot price).
Where the retailer passes through a cost reflective network tariff, the customer will have a direct incentive to adjust their behaviour to minimise their electricity bills. Where the signal is not passed through to customers in the retail tariff, the retailer will have an incentive to take action to reduce the peak usage of its customers. For example, the retailer may offer a different retail tariff structure to the underlying network structure, and manage the risks from network tariffs through other charges to signal the cost of peak usage, or options such as load control or rebates for demand reduction.
Box 7.3: Common network tariff structuresA number of different tariff structures may be employed by networks to charge for use of their assets. They may also use a combination of the structures below (for example, a fixed daily supply charge, a volume-based charge and a demand charge).
As noted, these charges will be imposed on the customer’s retailer, who chooses how to pass on the cost to the customer in the retail charges (in the same way that it must manage the overall risk of the wholesale market or other costs).
Flat tariffs
These tariffs, which are used today for the majority of residential customers, include a fixed daily supply charge, and a variable charge reflecting the volume in kWh of electricity consumed. Usage charges do not vary by time of day, but may change based on overall consumption in a period (block tariffs) or the time of the year (seasonal tariffs). There may also be different rates for a particular separately metered part of a customer’s load.
Under a flat tariff, a customer can only reduce their bills by reducing consumption. The tariff provides no signal to reduce demand during peak times. As the usage charges reflect an average cost across peak and off-peak periods, customers with low peak demand subsidise those customers with high peak demand.
For customers without a smart or interval meter, this is the only charging structure that can be imposed.
Time of use (or flexible) tariffs
Time of use (ToU) pricing applies different charges to electricity usage in kWh at different times of the day (or week). Days are commonly split into peak and off-peak (and sometimes shoulder) periods. Peak periods are intended to correspond to the times the network faces high demand, but in practice are wide periods that cover much of the day. These tariffs also include a fixed daily supply charge.
ToU tariffs provide a price signal for reducing consumption during the defined peak period of the day (as defined by the network). However, the effective ‘penalty’ for consuming at times the network is operating near capacity is low (with higher charges limited to that specific consumption).

175 Retail Electricity Pricing Inquiry—Final Report
Demand tariffs
In contrast to both flat rate and ToU pricing, which are based on kWh usage, a demand tariff differs in that it is based on the maximum point in time demand (in kW or kVa) of a customer during pre-defined ‘peak windows’. The windows are set by reference to the usual peak network demand. Usage outside of the relevant pre-defined period does not contribute to the demand charge component (although usage charges and fixed charges may still apply).
Customers in effect pay an ongoing charge for the maximum level of network capacity they use during the network peak. For example, in Victoria this is assessed as the highest demand in a half-hour period during the peak window (from 3 pm to 9 pm on weekdays) on any day over the previous month. As noted, demand tariffs may also have fixed and usage components. If customers have low demand during the peak window, they can avoid much or all of the demand charge, reflecting the fact that they are not contributing to stress on the network during the peak period.
Properly designed demand tariffs should better reflect the demand that particular customers place on the network, and so both allocate costs more equitably between customers than consumption-based tariffs, as well as incentivise customers to shift consumption away from peak periods to reduce bills. As with ToU tariffs, whether demand tariffs provide an efficient signal to customers to reduce their peak demand will depend on the extent to which the ‘peak window’ (where the demand charge applies) corresponds with the actual peak use of the network.
A demand tariff is likely to lead to more variability in electricity charges over time than a consumption-based tariff. For example, a customer who has unusually high demand in the peak window, even if only briefly, will then be charged a higher amount for the whole month (or other period over which demand is assessed).
Capacity tariffs
Similar to demand tariffs, capacity tariffs contain a charge based on the maximum demand required by a customer during peak network periods. However, under a capacity tariff, capacity limits are agreed in advance, with customers facing additional charges if they go over the agreed capacity.
Critical peak tariffs (or critical peak rebates)
Critical peak tariffs include a low electricity usage charge for most of the year, but much higher tariffs during a few, short ‘critical peaks’ each year—the periods where electricity networks are operating at or near full capacity. Network businesses have a limited number of days per year for which they can apply the critical peak prices. Customers are given forewarning of the higher tariff applying on a particular day.
A critical peak rebate targets the same critical peak periods, but offers customers a rebate if they voluntarily reduce their consumption during the specified times. It can be applied in addition to any underlying tariff structure.
Critical peak tariffs provide the strongest signal for customers to reduce demand during the periods when the network can most benefit. But the success of these tariffs depends on the ability to accurately forecast the timing of these peaks, and to communicate the timing of the higher tariffs to customers. There is also a greater risk of bill shock under this tariff structure where a customer cannot reduce their usage during a critical peak event.
7.3.2 Current situationAs noted above, the potential benefits of cost-reflective network pricing have been noted for some time. Large electricity customers typically have access to a range of tariff structures that include a peak consumption signal, including demand tariffs and critical peak pricing. Large customer tariffs may also be complemented by demand response elements.
However, the more cost reflective network tariff structures are currently not applied to most small customers, for a variety of reasons. Time of use and demand tariffs are available in some areas, but have only been adopted in small volumes. Tariffs for the vast majority of small customers are largely flat tariffs based on a customer’s overall usage, regardless of when that electricity is used.

176 Retail Electricity Pricing Inquiry—Final Report
Role of smart meters, and use of fixed chargesA prerequisite for being able to charge cost reflective network tariffs is metering that can record usage by a customer at different times of the day. As such, cost reflective network tariffs can only be applied to a retailer for those customers who have a smart or interval meter installed. While networks know their own overall load profile, without smart meters they cannot identify how a particular retailer (in aggregate) or their customers contribute to network demand at different times. Networks are therefore limited to charging the retailer based on a customer’s overall usage. The rollout of smart meters is discussed further in section 7.3.5, but the key point is that the limited rollout of smart metering to small customers to date has been a key barrier to the introduction of cost reflective pricing. This means that, outside Victoria, there is currently a limited number of small customers who could potentially face cost reflective tariffs.
Without widespread availability of smart meters, some networks have increased the proportion of network costs recovered through fixed charges, and reduced the proportion recovered through variable charges. This approach provides the networks with more certainty in recovery of their network costs, and to some extent reallocates network charges more fairly between customers with and without solar PV systems. Customers with solar PV systems are able to reduce their overall usage from the grid, and so are less exposed to network charges when these charges are largely variable and linked to usage. Higher fixed charges mean that solar PV customers are not able to avoid these costs to the same extent.
However, while flat tariffs with a high fixed component may better match the cost profile of network businesses, they are not cost reflective and may even result in worse incentives on customers. By reducing the variable charge, customers have less incentive to manage their overall consumption (including at peak times), which may lead to overall increases in future network costs. These tariffs also fail to deal with cross-subsidies in favour of customers who use a larger proportion of electricity at peak times (and may in fact worsen the cross-subsidy where high peak period users are also high overall users of electricity).
Existing rollout of ToU and demand tariffsThe AEMC cost reflective tariff rule change required network businesses to make cost reflective tariffs available to their small customers from 2017.327 However, even for those customers with smart meters, the take up of cost reflective tariffs has been slow. This is partly due to the approach taken by state governments and network businesses to transitioning customers to new tariff structures. The basic options for transitioning customers are set out in box 7.4.
Box 7.4: Approaches to transitioning customers to cost reflective tariffsThe following options refer to how the retailer makes the decision to take up a cost reflective network tariff.
Opt-in: Under this approach, a customer will remain on a flat network tariff structure unless the retailer decides to switch them to a new network tariff structure. In practice, a retailer is likely to only elect to change a customer’s network tariff where the customer chooses a retail tariff that is linked to that network tariff structure.
Opt-out: Under this approach, cost reflective tariffs are applied to all customers from the application date, but the customer’s retailer has the option to revert to a flat network tariff structure. A retailer may opt out of a cost reflective network tariff where their customers are unwilling to face a cost reflective retail tariff, or where the retailer cannot otherwise efficiently manage the network price risk.
Mandatory assignment: Under this approach a retailer faces cost reflective network charges for all of its customers that have suitable metering in place. The retailer is free to pass through the price signals in the network tariff to its customers, or manage the price risk itself and offer simpler tariffs to their customers.
327 AEMC, National Electricity Amendment (Distribution Network Pricing Arrangements) Rule 2014, 27 November 2014.

177 Retail Electricity Pricing Inquiry—Final Report
In the initial round of network pricing proposals after the AEMC rule change, all networks provided cost reflective tariffs to existing customers on an opt-in basis (where the decision to opt in made by the customers’ retailers). Most networks also applied an opt-in approach for new customers. However, cost reflective tariffs have been introduced on an opt-out basis for new customers in the ACT, NSW (from 1 July 2018), and in Ergon Energy’s network in Queensland.328
Demand tariffs have been applied in all networks except those in NSW, where only ToU tariffs apply. Arrangements are broadly similar for small business customers. Currently only around 12 per cent of all small customers are on a network tariff other than a flat rate, with most of those on ToU structures.329
As customers are not directly exposed to the network tariffs that underpin their electricity supply, the success of an opt-in framework is heavily dependent on retailers taking the lead to translate the network tariff into a cost reflective retail offer that customer’s value. However, retailers have limited incentive to design and market cost reflective tariffs under an opt-in structure because:
�� the limited rollout of smart meters to residential and small business customers (other than in Victoria) limits the size of the customer base to whom the tariffs could apply
�� cost reflective tariffs are more complex, and expose the customer to greater price risk, so it is more difficult to communicate the benefits to customers
�� customers do not have easy access to the tools and data needed to effectively compare more complex offers
�� there has been limited technology and innovation by retailers and third parties with services that assist customers to manage their use to reduce their risks
�� cost reflective prices require more sophisticated billing and service systems
�� they encourage customers to be more savvy in their use and potentially reduce their energy demand.
Current network tariffs may also not be sufficiently cost reflective to offer sufficient incentives to retailers to take these underlying network tariffs and then design and market equivalent retail tariffs. That is, the potential for customers to benefit from reduced bills by moving to these tariffs, either through their current usage patterns or their ability to shift usage, is minimal. To examine this, the CSIRO undertook analysis for the ACCC of the impact of current network and retail tariff structures on customers’ bills in the Powercor network in Victoria (discussed below).
There has been ongoing work by industry to progress reforms in this area since the 2017 tariff structure proposals were implemented. Network businesses have established collaborative forums where they have tested approaches to tariff design with customer groups and retailers to feed into the next round of tariff approvals. A second round of proposed tariffs have been submitted to the AER by networks in NSW, the ACT, Tasmania and the Northern Territory. An AER decision on these proposals is due in April 2019. Proposals for the remaining networks will be received by the AER by 30 June 2019.
The electricity rules also allow for network businesses to trial innovative tariffs outside of the formal tariff structure statement (TSS) approval process.330 Trial tariffs have been introduced in South Australia, Victoria, Queensland and Tasmania.331
CSIRO analysis of retail and network tariffs in VictoriaThe ACCC commissioned research from CSIRO to explore the impact of different electricity tariff structures on a range of customer types.332
CSIRO used energy and demographic data, collected as part of the Energy Use Data Model333 project, to estimate retail bills and underlying network charges for a sample of Victorian energy customers
328 In the ACT and NSW, these tariffs will also apply on an opt-out basis for existing customers that install a smart meter.329 ACCC calculations based on data provided voluntarily by network businesses to the Inquiry.330 NER, r. 6.18.1C.331 See, for example, Energex’s ‘residential lifestyle tariff’ available from 1 July 2018: Energex, Annual pricing proposal, Distribution
Services for 1 July 2018 to 30 June 2019, March 2018, pp. 55–58.332 CSIRO (Gardner, J, O’Neil, L and Berry, A), Residential electricity tariff analyses—report extract, May 2018. Available at accc.gov.au/
electricityinquiry, further details available upon request.333 The Energy Use Data Model is a data set operated by CSIRO that includes customer data around consumer usage profiles as well as
other complementary social and economic data profiling household characteristics like energy use patterns, building and appliance trends and personal characteristics like income, age and household makeup. The dataset employs consumer survey information, economic modelling, and real customer meter data to identify market trends in energy demand and usage patterns.
178 Retail Electricity Pricing Inquiry—Final Report
under a range of published tariffs. It used this data to explore the impact on a customer’s retail and network charges of differences in load shape, total energy consumption, income, vulnerability and solar uptake. Due to data limitations, all findings are based on the assumption that customers have no ability to change their usage or behaviour in response to different tariff structures.
Tariff data included the best available market offers, as well as standing offers, for a selection of retailers in the Powercor supply area at March 2018.334 Market offers included both flat and flexible (ToU) structured tariffs for each retailer. Standing offers included flat, flexible and demand structured tariffs. Demand tariff based market offers were not collected due to a lack of available offers. Equivalent published network tariffs were also collected. Each retail and network tariff was applied to a year of metered energy consumption (based on consumption in 2016) for the sample of around 1000 customers.335
The sample customers were subdivided into clusters according to load shape, annual consumption, presence of solar panels, presence of gas, or vulnerability.
CSIRO’s key findings from the study include336:
�� For the tariffs included in the study, tariff structure consistently has no significant impact on the average retail cost of the sample customers in each cluster. Where tariff structure choice is meaningful, a flat structure is marginally cheaper. That is to say that the choice of tariff structure is generally immaterial and, when it is material, there is typically a minor bill increase in moving away from traditional flat-rate tariffs.
�� These average results by cluster conceal potentially much larger impacts for individual customers in moving to a different retail tariff structure. For example, the difference in cost to a customer between the worst tariff structure presented by a retailer to the offer that serves them best was typically between 4 per cent and 8 per cent (depending on retailer). This overstates the likely impact on customers who will typically be moving from a flat rate structure to a more cost reflective structure, but even then, there are some customers who will likely have large price impacts. Moving from flat tariffs to demand tariffs sees impacts on individual households range from a 40 per cent bill increase to a 15 per cent bill decrease.
�� Solar customers have consistently lower bills than those without solar installed, but the presence of solar does not change the finding that tariff structure consistently has no significant impact on the average retail cost (although solar customers would typically lose more than non-solar customers when switching from flat to demand rate retail offers).
�� Looking at network charges only, current demand structures are consistently significantly more expensive than alternative structures, with the Powercor demand structure only being preferable to flat and flexible structures for high consuming high income households from the cohort.
�� For low income vulnerable customers (or customers who would spend a large proportion of their household income on electricity), choice of retail tariff structure has no significant impact on bills. At a network level, however, demand charges are statistically significantly higher for such customers. For customers in the sample spending a large proportion of their income on electricity, flexible network tariffs are significantly less expensive than flat tariffs. The impact appears to be largely driven by generally low usage levels for these customers.
�� Potentially vulnerable low income customers spend a significantly higher proportion of their income on retail electricity bills than other customers.
�� Retail and underlying network tariffs are very highly correlated across retailers, indicating that network tariff structures are generally passed through in retail tariffs. However, this relationship is weaker for demand tariffs. In particular, while network demand charges are frequently significantly more expensive than alternative structures, that trend is rarely seen at the retail level.
334 The Powercor distribution network was chosen as CSIRO consumer household data is drawn from surveys conducted in the CitiPower and Powercor supply areas.
335 The survey group expressed some sample biases including over representation of people over 50, people who owned their own home, households with no children, and households with solar PV. The survey does represent all income groups based on 2011 census data but notes over sampling in low and high income households.
336 CSIRO (Gardner, J, O’Neil, L and Berry, A), Residential electricity tariff analyses – report extract, May 2018, pp. 2–3. Available at accc.gov.au/electricityinquiry, further details available upon request.
179 Retail Electricity Pricing Inquiry—Final Report
7.3.3 Why are cost reflective tariffs needed?Greater cost reflectivity in network pricing could both help reduce overall peak usage and costs, but also more fairly distribute costs between customers. Cost reflective pricing would do this by helping customers understand that the cost of the network is related to their usage in peak periods, rather than overall usage, and give them incentives to reduce that peak period usage.
For example, Energeia modelled the potential reduction in network costs from the adoption of cost reflective tariffs as part of the CSIRO/ENA Electricity Network Transformation Roadmap process. Assuming all residential customers were allocated to cost reflective tariffs by 2021, Energeia found that network costs could be reduced by 10 per cent in 2026, relative to 2016 levels.337
In November 2012 governments committed, in principle, to shifting towards a more cost reflective pricing model for network costs338 and an AEMC rule change to require networks to move towards cost reflective pricing for all customers took effect in 2014.339 However, subsequent progress toward effective tariff reform has been slow and largely ineffective. In the ACCC’s view, the need for reform has also become more urgent for a number of reasons:
�� The pattern of electricity consumption is changing: There has been rapid take up of technology that impacts on the amount and timing of electricity consumption across the network. This has been reflected in the recent trend of falling overall network consumption, but without an equivalent fall in peak demand, so that overall productivity of the networks has fallen. Air conditioners (which typically add more demand for electricity at peak times) and installation of rooftop solar PV systems (that reduce overall consumption but have a more limited impact on peak consumption) have been significant contributors to this change. The full impact of the use of these technologies in contributing to future network operation and investment needs is not captured under current flat tariff structures, and consumers with these products obtain an advantage under the existing tariffs.
�� Growing inequity in the allocation of network costs: The relationship between a customer’s overall and peak consumption has decoupled, meaning that some people are paying more than they should and others not enough, relative to the costs that they impose on the network. In particular, flat tariff structures result in customers who consume a relatively large proportion of electricity during peak times being subsidised by those with a flatter consumption profile (where use is spread more evenly across the day). This issue is also largely linked to the take up of air conditioning and solar PV systems, with the owners of these systems being the main beneficiaries of large cross-subsidies across customers inherent in current tariffs. According to modelling conducted for the AEMC in 2014, installing an air conditioner adds $1000 to annual network costs, but the household using the system only pays $300 of this through higher bills. Similarly, the modelling found that a customer using an average-size north-facing solar PV system will save about $200 a year in network charges, but will only reduce network costs by $80. The remaining cost in both cases is met through higher charges on other users.340 Box 7.5 sets out a further estimate of the impact of air conditioning on network costs by the Grattan Institute.
�� New tools are available to limit future network investment requirements: Tools such as demand response (discussed further in chapter 8) and batteries (which are rapidly becoming more affordable) are not receiving appropriate signals about their potential benefit under current tariffs and so may not be being adopted at efficient levels.
�� Disruption to the role of networks: The long-term role of the network remains uncertain and technology is likely to further disrupt the role of networks. This disruption may not occur efficiently without the right price signals. For example, inefficient signals under flat tariff structures may see some customers deciding to completely disconnect from the grid despite the cost to serve them under self-supply being higher than continued grid supply. This would put more pressure on costs for those remaining on the grid. This issue is examined in the discussion about asset values above in box 7.2.
337 Energeia, Network Transformation Roadmap: Work Package 5—Pricing and Behavioural Enablers, Network Pricing and Incentives Reform, October 2016, p. 7.
338 COAG Energy Council, Electricity Council Reform—Putting Consumers First, November 2012, p. ii.339 AEMC, National Electricity Amendment (Distribution Network Pricing Arrangements) Rule 2014, 27 November 2014.340 AEMC, Rule Determination: National Electricity Amendment (Distribution Network Pricing Arrangements) Rule 2014,
27 November 2014, p. vi.

180 Retail Electricity Pricing Inquiry—Final Report
Box 7.5: Grattan Institute modelling of air conditioning costs during summer and at peak times (network costs vs actual network charge)341
Cost to networks of use of a 5 kW air conditioner at peak times:
�� Cost per additional kW to distribution networks $159–220/kW
�� Cost per additional kW to transmission networks $90/kW
�� Total investment cost for power networks $1200–1550
Payments to networks by customers for using a 5 kW air conditioner in summer:
�� Payment per kWh to distribution networks $0.10/kWh
�� Average hours of summer air conditioner use 107 hours
�� Total payment to power networks $54.40/year
The above factors mean that there is a risk that, if left unchecked, the incentives under current tariff structures will result in higher network charges for all customers as networks are required to undertake potentially avoidable investment. These networks costs may also need to be recovered over a smaller volume of total electricity consumption due to incentives on customers to minimise their consumption (including through the installation of solar PV systems). These additional costs will be borne disproportionately by those customers unable to access new technology or services to manage and reduce their electricity supply.
In the short term, adoption of cost reflective pricing should lead to a fairer distribution, rather than a reduction, in overall electricity costs. This will include some customers paying more than under current tariffs. However, there are inherent inequities in current pricing structures as well, with some customers already paying more than they should because of the cross-subsidies in current tariffs. Cost reflective pricing would mean that existing cross-subsidies in favour of high peak usage customers are unwound. As such, more cost reflective tariff structures should lead to fairer outcomes, as those paying more will be doing so because of the demands they place on the network.
Over the longer term, all customers should see some benefit from tariff reform due to avoiding higher than necessary network costs by:
�� supporting behaviour change, including demand response, that reduces the need for further network investment
�� signalling the efficient mix of supply from the grid and self-generation.
As such, the ACCC considers that tariff reform has the potential to both reduce the total costs of the network and makes charges more equitable.
The extent to which tariff reform achieves the above goals depends on whether the end customer responds to the price signals in the network tariff. Under the current framework, how the customer is exposed to this price signal is ultimately a decision for retailers. If the network tariff signal is passed through into retail tariffs, there should be an incentive for the customer to manage their price exposure. This approach will also minimise cross-subsidies across customers. However, the retailer may be better placed to manage these price risks, and so maintain simpler (but less cost reflective) retail tariff structures for its customers but introduce other mechanisms to reduce customers’ peak usage (such as payments to encourage decreases in usage at peak times).
There are also other ways of managing peak network demand. In particular, network businesses have the ability to act directly to minimise these peaks through programs that allow them some control over parts of their customers’ load (like hot water or air conditioning), or that provide incentives to their customers outside of their network tariff (for example, through a rebate payment linked to a short-term reduction in usage). These ‘demand response’ programs, discussed in chapter 8, are likely to provide a more immediate impact on managing network demand. Networks should therefore be incentivised to
341 Wood, Tony and Carter, Lucy, Fair pricing for power, July 2014, p. 9. Note: The ‘price per kWh of electricity paid to the network’ is the usage component of the network tariff. It excludes fixed charges and charges that relate to other parts of the power system, such as the price paid to retailers or power stations. Sources: AEMC (2013a), Appliances Online (2014), PC (2013), CitiPower Pty (2012) Jemena (2012) Powercor Australia Limited (2012), SP AusNet (2012), United Energy (2012), Roy Morgan (2008).

181 Retail Electricity Pricing Inquiry—Final Report
explore further opportunities in this area while the transition to greater cost reflectivity in network tariffs is taking place.
Demand response, however, does not address the issue of equity in allocation of network cost. It is therefore a complementary measure, rather than an alternative, to cost reflective pricing. A fairer distribution of network charges can only be achieved by linking these charges to the underlying drivers of network costs, meaning that users which contribute more to network costs will pay more than those which contribute less.
7.3.4 Achieving effective tariff reformThe ACCC considers that steps should be taken to improve the cost reflectivity of network charges—and is of the view that mandatory assignment (on retailers, for all customers with appropriate metering) should be adopted.
Mandatory assignmentThe ACCC supports moves to accelerate the transition of small customers onto more cost reflective network tariffs. This is best achieved through mandatory assignment of cost reflective network tariffs on retailers under the next stage of tariff reform, for all customers with a smart or interval meter. With the retailer facing the cost reflective tariff, it is up to them to decide whether, and how, they pass those signals through to customers in retail tariffs.
Various stakeholders have expressed support for retailers to be the primary focus of network tariff reform.342 The ACCC agrees that retailers are best placed to manage the price risk of more dynamic network charges. It is critical that tariffs are designed in a way that sends clear signals to retailers, and that retailers cannot choose to avoid these signals.
Without mandatory assignment, the move to cost reflective tariffs is likely to remain too slow. Stakeholders have questioned whether retailers have sufficient incentives to pass through or otherwise reflect cost reflective network pricing in retail offers, particularly when offered on an opt-in basis.343 Retailers have an incentive to maintain simpler network tariffs, allowing them to maintain simple retail offerings without facing network price risk. Retailers also face other disincentives to move to cost reflective network tariffs, including the costs associated with supporting customers on these tariffs with better energy management tools and billing systems. Equally, cost reflective tariffs may incentivise customers to use less than under current structures, reducing the overall energy volume being sold by retailers. Because of this, opt-in arrangements for cost reflective network tariffs are unlikely to encourage sufficient uptake to enable successful tariff reform.
CSIRO research performed for this Inquiry did find that some retailers in Victoria have designed retail tariffs that largely pass through cost reflective network price signals. But these demand-based designs are generally only available under standing offers, meaning that they are not competitive with the best structured offers attached to flat or flexible rates. The lack of promotion of these new offer structures is likely to reflect the opt-in arrangement to cost reflective tariffs currently mandated in Victoria (despite the fact that Victoria is the only jurisdiction with widespread use of smart meters that would enable cost reflective tariffs). Given customers’ preference for simpler tariff options, retailers have had limited incentive to develop and promote cost reflective tariffs, given the time and cost required to do so.
Opt-out arrangements face similar issues. If the power to opt-out is held by the retailer, they have an incentive to do so and minimise their exposure to cost reflective tariffs, for the same reasons as identified above. This risk is avoided under a customer-based opt-out arrangement, but there are likely to be practical difficulties associated with this approach. In practice, a customer would only have a signal to opt-out where their retailer offered different retail packages based on the customer’s underlying network tariff. This may lead to excessive complexity in messaging to the customer about which tariffs they can currently access, and the process for switching to a different network tariff. Customers could be shielded from this by retailers having each retail tariff linked to a specific network tariff (so that by choosing a particular retail tariff, the customer is in effect making the choice for the underlying network tariff). A risk of this approach is that retailers would just focus on promoting those
342 Electricity Networks Australia, Submission to ACCC Issues paper, July 2017, pp. 1–2; PIAC, Submission to ACCC Preliminary Report, December 2017, pp. 17–18.
343 PIAC, Submission to ACCC Preliminary Report, December 2017, pp. 17–18; Electricity Networks Australia, Submission to ACCC Preliminary Report, December 2017, p. 9.

182 Retail Electricity Pricing Inquiry—Final Report
tariffs underpinned by a flat network tariff, so that the outcome is similar to that achieved under an opt-in framework. Potentially one option would be that, if an opt-out framework is implemented, tariffs could be set to tilt people towards not opting out, and supported by information programs and other incentives.
Mandatory assignment of cost reflective tariffs to retailers would force retailers to manage the network price risk, either through reflecting the network tariff in the retail tariff, or by development of more innovative methods of signalling to customers to reduce usage at peak times. In a competitive retail market, we expect that customers would be able to access cost reflective retail tariffs that pass through the network signal if these are appropriate for them, but would also have access to more traditional tariff structures (with the retailer managing network price risk through other means).
Innovative methods for retailers to manage network price risk could include incentive payments to their customers to alter behaviour (critical peak rebates), or some form of direct load control of their customers’ appliances. Incentive payment trials were undertaken by both retailers and network businesses over summer 2017–18.344 These trials were focused on encouraging customers to lower their consumption during periods of expected high demand. Customers typically receive an alert the day ahead of when the incentive would operate. Direct load control has also been implemented by some retailers and network businesses.345 These arrangements allow the retailer or network business to control the amount of electricity supplied to specific appliances at the customer’s premises, and no customer involvement is required. Typical appliances subject to direct load control include electricity hot water systems, air conditioners and pool pumps. As noted earlier, the use of demand response and cost reflective pricing should be seen as complementary measures to manage network costs.
Form of cost reflective tariffThe ACCC notes that mandatory assignment could be to a range of more cost reflective tariffs, ranging from ToU, through demand tariffs, to critical peak pricing. As noted above, these trade off simplicity with the strength of cost reflectivity and potential to effect behavioural change. All these options have positives and negatives that need to be considered. The ACCC considers that critical peak pricing, while appropriate for large business and industrial users, is too significant a change for small customers. Equally, ToU pricing is unlikely, in the ACCC’s view, to lead to significant changes in customer behaviour at times of peak demand. However, to the extent that the ToU tariffs are passed on to retail customers, they would be useful in familiarising customers with the idea of greater cost reflectivity, and could be a useful first step. The ACCC notes that there has been some roll out of ToU network and retail tariffs to date, indicating that they can be used for small customers.
While more complex than existing flat rate or ToU tariffs, demand tariffs represent a good balance of cost reflectivity, simplicity and price stability for an initial process of mandatory assignment:
�� In terms of simplicity, demand tariffs include a ‘two-part tariff’ structure (being the demand charge and the usage charge) that is broadly similar to current tariff structures, although the variability of the demand charge will need to be effectively communicated to customers. The introduction of these tariffs in most regions in the first round of tariff reform also means that the risks and opportunities should be well understood.
�� Cost reflectivity is achieved by linking network charges to usage during times of peak network demand. While the ‘peak window’ (where the demand charge applies) is likely to cover a much broader period than the actual peak use of the network, and an individual’s peak demand within that window may not often coincide exactly with the network peak, the charging structure emphasises the relationship between network cost and demand, rather than with usage.
�� While a move to demand tariffs will potentially lead to more variability in customers’ charges than under a flat tariff, this tariff structure provides more price stability than more cost reflective models such as critical peak pricing. This is because charges related to use of the network at peak times are smoothed over the year rather than charged on the few specific occasions of peak network usage.
344 For example: United Energy’s summer saver program (https://customer-web.prd.prod.clddc.ue.com.au/) and Powershop’s curb your power program (https://www.powershop.com.au/demand-response-curb-your-power/).
345 For example: Energy Queensland’s PeakSmart appliance program (https://www.energex.com.au/home/control-your-energy/positive-payback-program/positive-payback-for-households/air-conditioning-rewards) and Pooled Energy’s DM&M trial (https://www.pooledenergy.com/blog/pooled-energy-moves-into-the-big-time-with-a-2-5m-grant-from-the-australian-renewable-energy-authority-arena/).
https://www.energex.com.au/home/control-your-energy/positive-payback-program/positive-payback-for-ho
https://www.energex.com.au/home/control-your-energy/positive-payback-program/positive-payback-for-ho
https://www.pooledenergy.com/blog/pooled-energy-moves-into-the-big-time-with-a-2-5m-grant-from-the-a

183 Retail Electricity Pricing Inquiry—Final Report
The development of the exact form of a demand tariff should be left to distribution companies as part of the AER’s TSS process.
Locational pricing and exit chargesA further potential element of tariff reform is the extent to which network tariffs vary by location. A network’s costs and available capacity are not consistent across the network. The cost differences may be ongoing (such as for rural parts of the network) or temporary (where part of the network is constrained and so requires augmentation without some form of demand response). Efficient network prices should therefore in theory signal these differences in cost to encourage customer response at locations where this is most valuable.
However, in practice, networks currently take their total costs and apply a common charge to all similar customers regardless of their location (known as postage-stamp pricing). There has been broad community support for this approach, particularly to avoid rural and regional customers paying much higher electricity charges.346
The ACCC does not consider that the theoretical benefits of locational network pricing are compelling enough, given the significant implementation difficulties and potential costs, that they should be introduced at this stage.
A move to cost reflective tariffs, even without a locational signal, will see a fairer allocation of network costs across customers with different usage profiles. However, postage-stamp prices would dilute any signal designed to defer future network investment. It also presents a risk that some customers will face inefficient signals to source their electricity (or a portion of it) other than from the grid. This and current regulatory gaps associated with stand-alone systems (discussed in chapter 8) reduce the potential for more cost effective non-grid solutions for remote and regional customers.
Critical peak rebates (or other network-led demand response activities) are an option for providing more specific locational signals on top of broad-based cost reflective tariffs, but do not address issues with inefficient signals regarding grid- or alternatively-sourced electricity.
Another option raised to address inequity of cost allocation includes an ‘exit charge’ for customers moving to self-supply, to reflect the impact of their past usage on ongoing network costs. However, this option penalises customers for taking action that is in their personal interest given current market arrangements. Considering the equity issues and the complexities of designing such charges, the ACCC considers a better approach is accelerating cost reflective pricing, and incentivising these customers to maintain some form of grid connection by allowing them to gain value from the benefits to the grid of self-generation (including access to new service models like peer to peer trading).
7.3.5 Managing the transitionTariff reform towards more cost reflective tariffs is a major change for small users and, while it will lead to benefits for most customers over the longer term, there is the potential for ‘bill shock’ in any transition. As such, there is an important question as to whether, and how, those customers most affected should be assisted to manage the removal of existing network cross-subsidies. This question is particularly important for customers that have limited or no capacity to change their usage patterns and face some form of vulnerability. This may include customers on low incomes or some form of income support, and renters with limited ability to make energy efficiency improvements to their home (or appliances).
Equally, consideration should be given to the ability of retailers to manage price risks.
Risks to consumersGiven that mandatory assignment to cost reflective tariffs would be a significant change in the existing network tariff regime, the ACCC considers that the risks to consumers need to be carefully assessed.
In particular, while retailers may choose to manage the risk of network demand tariffs themselves, mandatory assignment of cost reflective network tariffs may equally see these network tariffs passed
346 For regions that have more than one distribution network (Queensland, NSW and Victoria), customers on those networks servicing rural and regional customers will face higher network costs than customers on networks servicing metropolitan areas. However, charges for these customers are still not reflective of the specific costs of servicing different groups of customers within the network.

184 Retail Electricity Pricing Inquiry—Final Report
through to the end customer’s retail tariffs in full, without effective options for the customer to manage the associated risk. This effectively passes on the risk to consumers. The ECA, for example, found that retailers in AusGrid’s NSW network are typically reflecting the underlying network structure in their retail tariffs.347
The ACCC recognises that some customers will have limited or no capacity to change their behaviour in response to price signals. Some customers will benefit from tariff reform even without any associated behaviour response, but others (those currently benefiting from cross-subsidies from other customers) may be exposed to a large increase in their electricity costs.
For example, CSIRO found that, even with limited price signals in current Victorian demand tariffs, certain customers could be up to 40 per cent worse off under a demand tariff than a flat tariff (based on their current consumption profile).348 However, the report did not identify specific characteristics of customers that would make them more likely to be negatively impacted during a tariff transition. CSIRO’s analysis grouped customers based on load profile, total energy consumption, whether or not the household had a solar PV system and vulnerability. As a whole, none of these groupings were significantly impacted under a tariff change, although as noted above there were some individual households that did deviate from these findings. The report did not assess the ability of these different customer groups to respond to price signals. Additional analysis is required to understand how these impacts would vary once customers actually received and could respond to a cost reflective tariff.
The Clean Energy Council has also expressed concern that customers may not adapt their behaviour in response to the new tariffs, and that smart demand response technology is not yet sufficiently available and affordable for customers to manage exposure to tariffs without changes to their behaviour.349
The ACCC considers that these concerns are legitimate, but should not be an enduring obstacle to reform in this area. Deferring action on tariff reform risks all customers being worse off due to total future network costs being higher than necessary. While a move to cost reflective tariffs will create short-term winners and losers, current tariffs also do this, favouring high peak usage customers, and customers that can minimise their overall consumption (such as those with solar PV). Cost reflective tariffs, in comparison, will send customers more appropriate signals about how their electricity use impacts the network.
The ACCC also considers that mandatory assignment to cost reflective tariffs may prompt the market to further develop tools to reduce impacts on negatively affected customers (including direct load control and energy management tools).
Some options to mitigate the risks faced by customers during the transition to cost reflective network pricing are discussed below.
Risks to retailersThe transition to cost reflective pricing poses some risks to retailers as well as customers. Retailer risks are centred on the need to manage network price risk, to the extent that these prices are not passed through to customers in the retailer’s retail tariff. Retailers, however, should be in a position to manage the initial transition of customers to these network tariffs without the need to reassign all customers to equivalent retail tariffs. For example, retailers could offer products or services in addition to the basic tariff that encourage their customers to reduce their peak consumption, or they could charge a premium on their flat rate retail offer that reflects the additional risk.
The impact on retailers is also likely to be manageable because:
�� the price risk faced by the retailer will be diluted due to varying load profiles across their customer base
�� other than in Victoria, only a small proportion of customers for each retailer are likely to currently have metering to support more cost reflective tariffs. The extent of any price risk, at least initially, should therefore be limited for most retailers. While most Victorian customers have smart meters, Victorian retailers typically also operate in other NEM regions and so will not be exposed to cost
347 ECA, Submission to ACCC Preliminary Report, December 2017, p. 19.348 CSIRO (Gardner, J, O’Neil, L and Berry, A), Residential electricity tariff analyses—report extract, May 2018. Available at accc.gov.au/
electricityinquiry, further details available upon request.349 Clean Energy Council, Submission to the Energy Queensland Network Tariffs 2020–25 Customer Consultation Issues Paper, May 2018,
p. 6.

185 Retail Electricity Pricing Inquiry—Final Report
reflective network tariffs for their entire customer base. The early introduction of smart metering in Victoria should also mean that retailers have access to extensive data on their customers’ consumption to help develop their approach to the transition.
Distribution businesses should be required to work closely with all relevant retailers in developing their tariff proposals, so that retailers have sufficient time to assess and respond to the associated price risks. This could be modelled on the consultation currently being conducted by the Victorian distribution businesses with retailers, regulators and customer representative groups in relation to their next regulatory determinations, and the ‘New Reg’ process being trialled by the AER for AusNet Services (discussed in section 7.4.2).
As with the risks to consumers, risks faced by retailers under a move to cost reflective pricing should not be an obstacle to reform in this area.
Options for customer support during transition to cost reflective pricesGiven that a transition to mandatory assignment is a major one, the ACCC considers that a key element of such a move is the availability of transitional measures to assist customers or a subset of customers. Targeted transitional assistance should be provided to those most at risk of detriment and with no capacity to adjust to changed price signals. Noting the findings from the CSIRO research above, further work is required to identify particular household characteristics that increase the risk of adverse price outcomes for individual customers. Options for assistance are discussed below, including the potential for customers to access a flat retail tariff (but without a change to the underlying network tariff).
The ACCC considers that any transitional measures to support the more rapid introduction of cost reflective tariffs should be well targeted, and to the extent possible should limit any dilution of price signals passed through to retailers. In particular, there should be limited ability (or incentive) for customers or retailers to opt out of being exposed to a cost reflective network tariff. Support should focus on improving the ability of the customer to manage any change in price risk they face.
Various stakeholders have suggested a phased approach to the introduction of cost reflective tariffs. Options suggested to the Inquiry and in other contexts include:
�� having customers assigned to demand tariffs with an opt-out option that is limited to reverting to ToU tariffs only, rather than to flat rate tariffs
�� applying the tariffs initially to a subset of customers (for example, new customers350 or customers with solar PV systems) then gradually expanding to all customers
�� starting with a weak cost reflective signal that is strengthened over time.351
The ACCC notes that phased approaches may help consumers to manage their immediate bill impact, but equally are likely to delay benefits flowing from reforms and do not assist individual customers to manage the tariff transition. In particular, retailers may not be motivated to manage network price risk until a critical mass of its customers are captured or a sufficiently strong price signal is introduced.
Applying tariffs initially just to customers with solar PV systems would assist in removing a current source of cross-subsidisation in the market and help to avoid risks to vulnerable customers (who are less likely to have these systems installed). The ACCC agrees that solar PV customers should face a greater degree of cost reflectivity than under current flat rate tariffs. However, solar PV customers are just one subset of customers that are benefiting from cross-subsidies in current tariffs, and there are more appropriate ways to support vulnerable customers without limiting the scope or pace of tariff reform.
An alternative form of phased approach would be to introduce cost reflective tariffs at both the retail and network level to all customers on a trial basis so that they can gauge their appropriateness.352 Customers could then be given the opportunity to move to a less cost reflective retail and network tariff structure without penalty if desired (a delayed opt-out approach). These reversionary tariffs should not necessarily be flat rate tariffs, but could be a ToU tariff so that some cost reflective pricing signal is still being received. For example, the opt-out approach currently used in the ACT by Evoenergy sees retailers being able to opt out their customers from a demand tariff and be placed instead on a ToU
350 ECA, PIAC, Total Environment Centre, and Groom, E, Consumer Challenge Panel 10 Pricing Directions Paper: A stakeholder perspective, April 2018, p. 4. Unpublished working paper.
351 PIAC, Submission to ACCC Preliminary Report, December 2017, p. 17.352 Hobman, E, Frederiks, E, Stenner, K, and Meikle, S, ‘Uptake and usage of cost reflective electricity pricing: Insights from psychology
and behavioural economics’, Renewable and Sustainable Energy Reviews, May 2016, vol. 57, p. 457.
186 Retail Electricity Pricing Inquiry—Final Report
tariff. The ACCC considers that such an approach would not be ideal as it would delay the benefits from greater cost reflectivity, but it may be a workable option if used only for a short time period.
Overall, the ACCC does not favour a phased approach over other possible approaches.
Discussed below are three options to support the transition to cost reflective pricing under mandatory assignment, and help to limit any bill shock for customers. These options, which could be introduced separately or together, will only be required to the extent that retailers are expected to pass cost reflective network tariffs through to their customers in the design of retail tariffs:
�� a ‘data sampling period’ to allow customers to understand the likely impact of the change in tariff structure
�� a requirement on retailers to offer a basic retail tariff structure on customers’ request
�� targeted assistance to those customers who are worse off in the short run.
Regardless of which of these transitional measures are adopted, tariff reform should be supported by strong communication to customers of the changes that will be applied, and the options available to them to manage their energy costs. A coordinated approach to communication from network businesses, retailers, the AER and governments should be considered through the tariff development process.
A ‘data sampling period’ between the installation of a smart meter and the reassignment of the customer to a cost reflective network tariff
A key risk for retailers and customers in managing the transition to cost reflective tariffs is a lack of data relating to their consumption profile. This data is unable to be obtained until the customer has a period of consumption with a smart or interval meter in place.
If customers are allocated to cost reflective tariffs at the time a smart meter is installed, they will be unable to know the likely impact of the tariff on their electricity costs, or understand their ability to adjust their usage to ameliorate the impact. A data sampling period may enable the retailer to provide targeted information to support a customer’s transition, or market new offers to the end customer which are better matched to their personal circumstances. The end customer will then have an opportunity to amend their usage to reduce costs under the new pricing structure.
A delay period of 12 months from installation of the smart meter before tariff reassignment occurs should provide for sufficient usage information to support informed customer choices.
Deferral of tariff reassignment is most likely to be appropriate when a meter upgrade is not as a result of a choice by the customer (for example, replacement of a faulty accumulation meter). Where a customer elects to install a new meter, or it occurs as part of a change to their connection arrangement (for example, the installation of a solar PV system), it may be appropriate to immediately reassign that customer to a cost reflective tariff. The customer can be made aware of the need for tariff reassignment, and the costs and benefits of doing so, in deciding to make the relevant change to their connection agreement.
A requirement on retailers to offer a basic retail tariff structure on request
As discussed above, a competitive retail market should result in choices for customers about the level of network price risk they are exposed to. However, there is a risk that retailers will simply pass through any network tariff structure into all retail tariffs. This could require the customer to bear the full network price risk.
To protect certain customers that are unable to respond to network price signals and are worse off under a more cost reflective tariff structure, retailers could be required to continue to offer a flat (or other less cost reflective) retail tariff option to customers in designated circumstances (that is, the customer would face a flat rate tariff, while the retailer would continue to pay a mandatory demand network tariff). This should not impose any significant burden on retailers, as they will likely maintain a flat rate market offer for those customers who have yet to install a smart meter. Retailers will also be required to maintain a flat rate tariff for the purposes of the default offer as recommended in chapter 12.
This basic retail tariff structure could be available to any customer on request, or limited to vulnerable customers (for example, customers receiving concessions or on hardship programs). Where a customer

187 Retail Electricity Pricing Inquiry—Final Report
has been placed on a cost reflective retail tariff by their retailer, clear information would need to be provided to the customer on their right to (or the circumstances where they can) elect to revert to a flat rate retail tariff.
While allowing customers to remain on a flat rate retail tariff reduces the direct incentives faced by the customer, retailers should still be incentivised to provide assistance to customers on these tariffs to manage their consumption, as a way of managing the associated network price risk that will be imposed on the retailer. Retailers would also have an incentive to create and market innovative retail offers that these customers may benefit from, as they would wish to manage their underlying costs from the network tariff. This could include payments to customers for reducing usage at key times, which has been trialled by some retailers to date.353
In jurisdictions that still have regulated retail prices, this basic retail structure offer would likely be under the regulated price. In price de-regulated markets the basic retail structure offer could be nominated by the retailer subject to certain guidelines set by the regulator.
Targeted assistance to those customers who are worse off in the short run
Network tariff reform should result in all customers benefiting from a reduction in future network costs. However, in the short term, network tariffs reform will see some customers pay more for their electricity. This is not a problem to the extent that customers can use the signals in new tariff structures to change how much and when they use electricity. For those customers that are unable to shift consumption, the ACCC supports targeted assistance that helps them adapt to new tariff structures (for example, through energy efficiency measures). The ACCC talks about the use of targeted assistance for vulnerable customers more generally in chapters 15 and 18 of this report.
The option of targeted assistance could be combined with either option above. A data sampling period, for example, would provide an indication of those customers who are likely to be worse off under a more cost reflective tariff. These customers could also be placed on a basic retail offer for a period of time to allow for any measures that can improve their ability to respond to network price signals.
A related aspect may be the need for government communication campaigns, in conjunction with retailers and networks, to provide the community with information about the benefits of cost-reflective pricing, minimise concerns and explain to consumers how they can manage the potential impacts of the change.
Recommendation 14The ACCC considers that steps should be taken to accelerate the take up of cost reflective network pricing.
Governments should agree to mandatory assignment of cost reflective network pricing on retailers, ending existing opt-in and opt-out arrangements.
Mandatory assignment of the network tariff should apply for all customers of a retailer that have metering capable of supporting cost reflective tariffs (that is, a smart or interval meter).
Retailers should not be obligated to reflect the cost reflective network tariff structure in their customers’ retail tariffs, but should be free to innovate in the packaging of the network tariff as part of their retail offer.
Given the potential for negative bill shock outcomes from any transition to cost reflective network tariffs should retailers pass these network tariffs through to customers, governments should legislate to ensure transitional assistance is provided for residential and small business customers. This assistance should focus on maximising the benefits, and reducing the transitional risks, of the move to cost reflective pricing structures. This includes:
�� a compulsory ‘data sampling period’ for consumers following installation of a smart meter
�� a requirement for retailers to provide a retail offer using a flat rate structure
�� additional targeted assistance for vulnerable consumers.
353 For example: Powershop’s curb your power program (https://www.powershop.com.au/demand-response-curb-your-power/).
188 Retail Electricity Pricing Inquiry—Final Report
Demand tariffs, which charge retailers based on their customers’ maximum demand during pre-determined typical system peak times, represent an appropriate structure for the initial mandatorily assigned network tariffs. This tariff structure provides a balance of the objectives of cost reflectivity, simplicity and price certainty.
We note that the extent to which cost reflective tariffs can be introduced is limited to the extent that a retailer’s customers have smart (or interval) meters. We therefore note the importance of recommendation 15 in achieving outcomes in this area.
Governments should appropriately fund communication campaigns around the benefits of cost reflective pricing and smart meters to build community acceptance and awareness of individual and community wide benefits, as well as customer awareness of their rights.
7.3.6 Need for smart metersSmart or interval meters are a prerequisite for a cost reflective price to be applied to a customer. This means that effective cost reflective pricing cannot be introduced while accumulation meters remain widespread. However, to date, only Victoria has widespread smart meters in place for all customers.
As already discussed, for time sensitive pricing to work, customers need to be connected to the network through real time metering and ideally have access to technologies that help manage their use and reduce their call on energy at peak times. This includes dynamic billing like that being offered by some retailers, and other services like direct load control. Access to usage data is also critical for customers to choose the right tariff structure.
Managing the rollout of smart meters is a complex undertaking that requires both concerted effort to ensure economic efficiency and technical requirements are reached, as well as effective customer engagement that builds community understanding of the market and confidence in the benefits they may receive from the technology. Recent experience in the NEM and overseas has demonstrated that customers need to be provided with clear benefits and incentives for them to support the rollout of smart meters.

189 Retail Electricity Pricing Inquiry—Final Report
Box 7.6: Victorian roll out of smart metersOnly Victoria has nearly all of its customers attached by a smart meter to the network. In 2006, the Victorian Government mandated the rollout of electricity smart meters to all households and small businesses across Victoria under the Advanced Metering Infrastructure (AMI) program. The rollout was completed between 2009 and 2015, with the cost of the meters recovered from electricity customers through an uplift in distribution network charges.
Following significant community concern arising from the smart meter rollout process, the Victorian Government announced a moratorium on the introduction of ToU pricing for customers with smart meters. The moratorium was introduced in March 2010 and remained in place until September 2013.354
The Victorian Auditor General reviewed the mandated process in 2015. The Auditor General’s review found that customers were not effectively engaged as a part of the process and many saw no direct link between their smart meter and saving money on their energy bills.355 It was also found that benefits achieved through increased network efficiency and subsequent saving on customer bills detailed in AMI program estimates fell short of the proposed network benefits.356 Following on from the Auditor General’s review, the Victorian Government announced it would allow customers to opt in to flexible pricing, and has since allocated further funding to ensure customers can access data from their smart meters.357 Due to the initial problems with the rollout of smart meters and ongoing issues, low customer take up of cost reflective network tariffs has meant that many of the benefits of smart meters are yet to materialise.
On 1 December 2017, new rules supporting the competitive rollout of smart meters took effect.358 Under these rules, all new and replacement meters must be smart meters, but customers choose whether to upgrade their meter in all other circumstances. The new rules require retailers to appoint a metering coordinator that will be responsible for the provision of metering services. Unlike the mandatory rollout of smart meters in Victoria, the distribution network does not have a direct role engaging with the customer on the installation or management of metering services. A competitive approach to smart meter deployment was hoped to avoid the pitfalls associated with a mandated rollout of smart meters, by reducing the risk of customers facing unexpected metering installation costs, and by linking smart meters to additional customer facing energy management services provided by retailers.359
At present there are around 500 000 smart meter users in NSW, South Australia, Queensland and Tasmania (around 5 per cent of customers), many of these being solar PV customers. A further 6 per cent of customers have manually read interval meters that are potentially capable of cost reflective pricing (with most of these being in NSW), but may not offer the same potential for customer response to price signals.360 The UK commenced a competitive rollout of smart meters in November 2016, with all homes and small business sites to be offered smart meters by their energy company by the end of 2020. At March 2018 only 6.1 million smart electricity meters had been installed (24 per cent of customers).361 The UK regulator has faced resistance from the community due to poor awareness of the benefits, issues with in-home displays, and some customers facing switching barriers between providers that have differing metering standards.362 Issues associated with metering standards and switching have been considered in the competitive metering framework in the NEM and consultation in the lead-up to the adoption of the new framework endeavoured to eliminate switching barriers.
354 Michael O’Brien, Greater pricing choice for Victorian energy consumers, Media Release, 27 September 2012.355 Victorian Auditor General, Realising the benefits of smart meters, September 2015, p. xiv.356 Victorian Auditor General, Realising the benefits of smart meters, September 2015, p. xi.357 Information on flexible pricing is available at: https://www.victorianenergysaver.vic.gov.au/bills-pricing-and-meters/flexible-
pricing#IntNav16; Department of Environment, Land, Water and Planning (Victoria), Victorian Government Interim Response: bipartisan independent review of the electricity and gas retail markets in Victoria, March 2018, p. 4.
358 AEMC, National Electricity Amendment: Expanding competition in metering and related service rule change, 26 November 2015, p.vi.359 AEMC, National Electricity Amendment: Expanding competition in metering and related service rule change, 26 November 2015,
p. xiii.360 Unpublished AEMO data, as at June 2018.361 Department for Business, Energy and Industrial Strategy, Smart Meters, Quarterly Report to end March 2018, Great Britain, May 2018,
p. 10.362 Helm, D, Cost of Energy Review, October 2017, p. 63.

190 Retail Electricity Pricing Inquiry—Final Report
Customers do not see smart meters as essential to their participation in electricity markets, and need to be effectively engaged to see the benefits of smart meters. At this stage, education and communication around smart meters and new cost reflective pricing is largely left to market participants to deliver. Customers are currently getting mixed messages on smart meters and cost reflective pricing, and they also see few retail products promoted in the market associated with these emerging technology services. While some retailers are starting to provide some services around this market, it is unclear whether the uptake will be any faster than the UK (which has lagged behind initial government expectations).There is a risk that certain customer segments will not see any or all of the full benefits of smart meters for an extended period of time, if retailers do not see benefits of promoting smart meters to these customers and they are limited to receiving a smart meter through the replacement of the existing meter at the end of its life.
A key risk of linking tariff reform with the introduction of smart metering is the potential to further delay the speed of the rollout. That is, if customers are not engaged on the benefits of tariff reform, this may see a low voluntary take up of smart meters by customers in order to avoid being exposed to cost reflective tariffs. Retailers may also avoid promoting smart meters to segments of customers they consider have load profiles that carry more risk.
Considering the potential benefits of both smart meters and cost reflective pricing to the long-term interests of customers, it is therefore important that the rollout of smart meters progresses at a suitable pace, and any issues with uptake are identified quickly. The ACCC therefore recommends regular auditing of the smart meter rollout that considers progress of the rollout by region and by socio-economic characteristics (to ensure there are no groups being disadvantaged by the competitive process). The audit process should also measure whether customers are receiving direct benefits from smart meters to avoid the concerns arising through the Victorian mandatory rollout process. Further, the audit should consider the consumer experience in the rollout, to ensure that community expectations are being met.
If the smart meter rollout does not occur at a suitable pace, further government intervention may be required to prompt customers to consider voluntary installation of a meter. Options to support greater take up of smart metering could include one-off customer rebates for installation of a smart meter, or a temporary discount on network charges paid by the customer. Any incentive should be directed at the customer rather than the retailer, to prevent retailers from delaying the rollout in order to later benefit from any intervention.
The pace of the smart meter rollout may also be encouraged through the removal of regulatory barriers to the benefits of these meters being captured. For example, in NSW, retailers must perform a physical site visit to perform a disconnection, even where there is a smart meter installed. However, consideration would need to be given to the reasons for such requirements (for example, the consumer protection goals of the NSW requirement).
Recommendation 15The ACCC considers that steps should be taken to support the take up of smart meters, and ensure customers receive the benefits of this technology. In particular:
�� governments should regularly audit the rollout of smart meters to ensure:
– the rollout continues at an acceptable pace – that no gaps emerge in respect of customers’ ability to access meters – that consumers do not experience problems with the smart meters that are installed.
�� the AER should require retailers, as a part of their market performance reporting, to report on their smart meter community and customer engagement strategy to ensure retailers are delivering the expected customer benefits associated with smart meters, and meeting community expectations in how the rollout is undertaken.
�� the AER should require retailers, as a part of their hardship program, to include policies on how they will support customers with smart meters in payment difficulty through targeted advice or services.
�� jurisdictions should remove regulatory requirements that limit the benefits and full functionality of smart meters.

191 Retail Electricity Pricing Inquiry—Final Report
7.4 Regulatory frameworkThe ACCC considers that an important element in keeping future network costs down relates to the flexibility, adaptability and responsiveness of the regulatory framework governing network revenues and costs. A flexible regulatory framework that can keep up with ongoing innovation in electricity supply is important to ensuring the long-term affordability of network services.
Arguably, the current regulatory framework is not achieving this.
In the ACCC’s view, this stems from the fact that the current regulatory framework was initially developed for electricity flowing in one direction, from generators to consumers through the transmission and distribution networks. The framework is complex and prescriptive, and to make changes to it requires an extensive AEMC rule change process and consultation. This type of framework works best when technological change is slow—since network investments are long lived, the regulatory framework provides certainty to network operators. However, the rapid take up of new distributed energy technologies, such as solar PV and batteries, as well as the potential for an increased role for demand response, now require networks to adapt more rapidly.
As such, the regulatory framework needs to be flexible enough to support regulatory and technological innovation and adoption of best practice approaches. The regulatory framework should be subject to regular review to ensure that network affordability and efficiency are in line with electricity customer expectations. While the five-year reset process may mean that changes in the regulatory framework are not immediately reflected in the regulatory determinations for networks, the ACCC considers it important that the regulation is up to date.
We note that the Finkel review also considered the regulatory framework would benefit from reduced complexity and expediting the rule change process.363
This section is broadly divided into two topics:
�� the general complexity of and timeliness of changes to the regulatory framework
�� more specific additional changes that should be implemented.
7.4.1 Complexity and timelinessThe regulatory framework sets out the process by which network revenues are determined as well as the roles and responsibilities of the energy market bodies. The regulatory framework has a large impact on network investment decisions and, ultimately, the prices customers pay.
The current regulatory frameworkThe regulatory framework includes the National Electricity Rules (NER) set by the AEMC. The rules set out how the network operators propose and the AER assesses the amount of revenue that network operators are allowed to recover from customers in accordance with rules set by the AEMC.
Over time, new rules are added or amended as part of the AEMC’s rule change process. However, we have concerns that over time the rules have become too complex and the rule change process is too slow to respond to economic and technological developments. While the regulatory framework has been subject to many reviews over time, it could benefit from reviews with a greater explicit focus on affordability and efficiency of prices.
The National Electricity Objective (NEO) is ‘to promote efficient investment in, and efficient operation and use of, electricity services for the long-term interests of consumers of electricity with respect to:
�� price, quality, safety and reliability and security of supply of electricity
�� the reliability, safety and security of the national electricity system.’
The NEO has inherently competing objectives. Reliability, safety and security requirements, for example, come at a cost which impacts affordability. The introduction of more onerous requirements relating to these three factors was a significant factor in increased customer bills over the last 10 years. Although safety, reliability and security of supply are related, these are separate objectives as part of
363 The Finkel review set out the current NEM governance arrangements within Australia’s federal system of government and how this relates to the market bodies the AEMC, AEMO, AER and ESB (Dr Alan Finkel AO, Chief Scientist, Chair of the Expert Panel, Independent Review into the Future Security of the National Electricity Market—Blueprint for the Future, June 2017, pp. 172 and 175).

192 Retail Electricity Pricing Inquiry—Final Report
the NEO. For example, security relates to the stability of the power system, while reliability relates to providing sufficient capacity to meet consumer demand.364
COAG Energy Council has established the Energy Market Transformation Project Team (EMTPT) to examine the issues related to shifting to a decentralised electricity system.365 Similarly, following the Finkel review, COAG Energy Council has requested the AEMC to undertake annual reviews of the network economic regulatory framework.
We support these reviews into the regulatory framework. We note that these reviews so far have been focused largely on the incentives placed on network operators. We consider reviews of the regulatory framework should also examine the cost to networks of meeting reliability obligations, and whether these outcomes are in line with consumer preferences.
The Vertigan review also noted the importance of cost-benefit analysis in the AEMC’s decision-making processes and welcomed greater transparency in how potential quantifiable and non-quantifiable effects are taken into account.366
The ACCC notes the importance of expenditure on safety and security requirements, and that these need to be considered objectively. However, we consider that reliability standards should be informed by deep understanding of consumer preferences and the careful examination of the costs and benefits of particular standards or changes to those standards. They should be approached consistently across the NEM.
We note that the AEMC has recently initiated a rule change amendment to address this issue with respect to reliability standards. If made, the amendment will establish a mechanism for the AER to develop a methodology for the calculation of the value of customer reliability (VCR) and to update and review the VCR on an ongoing basis.367 This will assist the AER in its monitoring roles, assessment of regulatory proposals and making regulatory determinations. It will also improve jurisdictional arrangements for setting reliability standards.368
As noted above in section 7.2, differences in reliability standards have resulted in different investment decisions across each jurisdiction. We support the proposed rule change for the AER to be responsible for calculating and updating VCR.
However, as reliability standards are still set by each jurisdiction, there is still a risk that reliability standards which are not in line with the long-term interests of consumers could be imposed on networks. Therefore we consider a NEM market body should be responsible for setting reliability standards. The ESB provides whole of system oversight for energy security and reliability. The AEMC’s reliability panel reviews the reliability standard to ensure that there is sufficient generation and transmission interconnection supplied to the NEM. The AEMC also developed frameworks to help jurisdictions set levels of transmission and distribution reliability.369 There may be synergies in either of these two bodies also developing a national reliability standard for network operators.
Recommendation 16Responsibility for setting network reliability requirements should be placed on the AER or other NEM market body, based on a value of customer reliability (VCR) methodology. The responsible market body must ensure changes to requirements are in line with customer preferences on affordability.
364 AEMC, Fact sheet: What is reliability?, 30 March 2017, p. 1.365 COAG Energy Council, Energy Market Transformation Bulletin No 05—Work program update, 3 August 2017, viewed 7 June 2018,
http://www.coagenergycouncil.gov.au/publications/energy-market-transformation-bulletin-no-05-%E2%80%93-work-program-update.
366 Dr Michael Vertigan AC, Chair of the Expert review panel, Review of Governance Arrangements for Australian Energy Markets, October 2015, p. 54.
367 AEMC, Consultation paper National Electricity Amendment (Establishing values of customer reliability) Rule 2018, 10 May 2018, p. 1.368 AEMC, Consultation paper National Electricity Amendment (Establishing values of customer reliability) Rule 2018, 10 May 2018, p. 3.369 AEMC, Fact sheet: What is reliability?, 30 March 2017, p. 4.

193 Retail Electricity Pricing Inquiry—Final Report
Examine the complexity and timeliness of the regulatory frameworkConsistent with the Vertigan and Finkel reviews into the regulatory framework, we consider that decreasing the complexity of the NER and increasing the timeliness of rule changes would assist the functioning of the regulatory framework.
The Vertigan review recommended that changes should be made to the AEMC rule change process to increase timeliness, and that changes should also be made to streamline the AEMC’s interaction with COAG Energy Council. The Vertigan review also recommended a comprehensive review of the rules to help inform strategic direction and priorities for COAG Energy Council.370 The Finkel review agreed with the Vertigan review’s recommendations to speed up the rule change process.371
We note that currently it can take several years from when an issue with the NER is identified to when a solution is implemented. Box 7.7 shows the timeline on demand management related rule changes from when an AEMC review process was initiated in 2011 to the AER publishing its new demand management incentive scheme in December 2017.
Box 7.7: Timelines for the demand management incentive schemeThis box provides an example of the length of time it can take from when an issue is identified to when a solution is implemented and the time it takes for further amendments.
On 29 March 2011, the Ministerial Council on Energy (now COAG Energy Council) directed the AEMC as part of its Power of Choice review to identify market and regulatory arrangements that would enable the participation of both supply and demand side options in achieving an economically efficient demand/supply balance in the electricity market.372
On 30 November 2012, the AEMC published its recommendation to amend the NER to provide better network incentives to use efficient demand management.373 In December 2012, COAG agreed to progress the AEMC’s Power of Choice recommendations.
On 19 February 2015, the AEMC commenced consultation to progress the rule change to reform the demand management incentive scheme. The AEMC then made the final rule change on 20 August 2015, which provided clearer objectives and principles to guide the AER in developing and applying an effective incentive scheme.374
On 20 September 2016, the AER commenced consultation to develop the new demand management incentive scheme. On 14 December 2017, it published the finalised scheme.
On 3 April 2018, the AEMC made a rule change to allow early application of the new demand management incentive scheme commencing on 10 April 2018. Unless a network applies for early application, the new DMIS will start applying to the networks from the commencement of the next regulatory period. The earliest this will take place will be in mid-2019, more than eight years after the start of this process. It could also take several more years for the scheme to have an impact on network investment decisions.
The period from the identification of the issue to implementation in a rule took seven years. It involved extensive stakeholder consultation. While robustness of consultation is a key strength of the regulatory framework, it comes at the cost of flexibility. Given the potential currently for rapidly changing technology to disrupt traditional network operations, a more flexible regulatory framework is required. Since network investments are long-term decisions, a seven-year period in which networks may not have been receiving the right incentives to undertake more efficient demand management activities is sub-optimal.
370 Dr Michael Vertigan AC, Chair of the Expert review panel, Review of Governance Arrangements for Australian Energy Markets, October 2015, p. 40.
371 Dr Alan Finkel AO, Chief Scientist, Chair of the Expert Panel, Independent Review into the Future Security of the National Electricity Market–Blueprint for the Future’, June 2017, p. 175.
372 AEMC, Power of Choice—Stage 3 DSP review, viewed 7 June 2018, https://www.aemc.gov.au/markets-reviews-advice/power-of-choice-stage-3-dsp-review.
373 AEMC, Final Report Power of Choice review—giving consumers options in the way they use electricity, 30 November 2012, p. 205.374 AEMC, Demand management incentive scheme, undated, viewed 7 June 2018, https://www.aemc.gov.au/rule-changes/demand-
management-embedded-generation-connection-i.

194 Retail Electricity Pricing Inquiry—Final Report
The Finkel review also noted that the NER is complex and has grown in length and detail over time. It accordingly recommended the AEMC or a suitable market body should conduct a comprehensive review of the NER with a view to streamlining them in light of changing technologies and conditions.375 However, the Finkel review noted that such a review would need to be carefully managed to avoid creating uncertainty.
We agree with the recommendations set out in the Finkel and Vertigan reviews. Speeding up the rule change process, and reducing unnecessary complexity in the rules, would be consistent with a more flexible regulatory framework that can adapt to changes in technology and new expenditure assessment techniques without the need for a lengthy rule change process which may take several years to assess and implement.
We note that the Finkel recommendation was accepted by COAG Energy Council and the AEMC has commenced annual reviews of the framework. Since a comprehensive review of the whole network regulatory framework would be a lengthy process, we consider that the AEMC’s annual review should examine specific areas of the framework with a view to reducing complexity and enhancing adaptability of the rules. This is consistent with the AEMC’s current process for the annual framework review, where it identifies focus areas for review.
Similarly, we consider that, in conducting rule change processes, the AEMC should have an overarching objective in the NEL of reducing the complexity of the current roles.
Recommendation 17The AEMC should:
�� as part of its annual network regulatory framework review, examine areas which can reduce the complexity of the existing framework and the time needed to implement changes
�� in amending any rules, be required to minimise additional complexity in the overall rules framework.
7.4.2 Specific amendments to the regulatory frameworkWe consider there is also potential to look at specific amendments that alter the regulatory framework to allow for a more flexible regulatory determination process. These include:
�� greater use of guidelines, rather than codifying regulatory processes in the NER, and targeted reviews of specific components that make up a network’s revenue requirement
�� improving the determination process, including greater customer involvement and more use of voluntary agreements between network operators and customers
�� whether operating and capital expenditure should be combined into a total expenditure (totex) methodology.
Each of these issues is discussed below.
Guidelines and targeted reviewsWe consider the regulatory determination process can be improved with:
�� regular reviews of specific components of expenditure that make up the network’s revenue requirement
�� greater use of guidelines, as distinct from detailed codification of regulatory tools and methods, in the NER.
It is important to review each component of the revenue requirement to assess how these assessment methodologies have performed and if there is scope for improvement.
The AER’s last extensive review of the methodology to assess network proposals was the 2013 Better Regulation program. This followed the AEMC’s November 2012 Economic Regulation of Network Service Providers rule change which improved the strength and capacity of the AER to determine
375 Dr Alan Finkel AO, Chief Scientist, Chair of the Expert Panel, Independent Review into the Future Security of the National Electricity Market—Blueprint for the Future, June 2017, p. 172.

195 Retail Electricity Pricing Inquiry—Final Report
network prices.376 To provide sufficient time for the AER to develop and apply its new guidelines, the AEMC delayed the final regulatory determinations for several networks.377
Due to the ongoing nature of regulatory determinations across each jurisdiction, there is no clear window for the AER to review all aspects of the revenue requirement as it did for its Better Regulation program. We do not consider delaying determinations each time the AER reviews its methodology is a practical approach. Instead, reviews of aspects of the revenue requirement can run in parallel with regulatory determinations. Reviews of the rate of return guideline, and of the tax component, are currently being conducted in this parallel way.
The AER, in its role as the market regulator, should review components of its expenditure assessment regularly to ensure they reflect current market conditions and best regulatory practice. It is important that the AER be able to improve its expenditure assessment processes in a timely way. The development of guidelines, in relation to the technical detail of components of the revenue requirement, provides an adaptive and flexible way to achieve this. In general, the ACCC considers that the economic regulator is best placed to conduct such assessments. This additional flexibility will mean that the AER can ensure that its regulatory proposal assessment methodologies are up to date without the need for an involved AEMC rule change process for incremental changes.
This is consistent with our recommendation 17 above to reduce complexity in the NER. Greater use of AER guidelines, within the scope of regulation and broader assessment framework set out by the AEMC, would be in line with reducing complexity in the NER. This would also allow the AER to adapt its regulatory assessment approach in line with market developments, without the need for a rule change process on all matters, but still with clear boundaries within the framework set out in the NER by the AEMC.
In the discussion below, we identify areas already under review by the AER and other potential areas of review.
Current cost of capital and tax reviews
On 31 July 2017, the AER commenced its review of its 2013 rate of return guideline. Following direction from the COAG Energy Council378, the rate of return (WACC) guideline will serve as the basis for a binding rate of return instrument.379 Given the technical nature of rate of return determination, the ACCC considers that the rate of return guideline process represents a more appropriate approach to considering the estimation of the rate of return than in highly prescriptive rules.
More recently, on 15 May 2018, the AER released an issues paper on the review of the tax that network operators pay, in response to a ministerial direction. This is a targeted review to examine whether the tax allowance in the revenue requirement exceeds the amount of tax network operators pay. If this is the case, then customers may be paying more for electricity than they need to.380
We support these targeted reviews of the way the AER determines the revenue requirement for regulated networks, which can improve the AER’s regulatory approach. If necessary, other reviews could also be initiated, including of existing expenditure models.
Incentives
One potential area for further AER review relates to incentive schemes. The network businesses are subject to several incentive schemes, including those directed to reliability, expenditure and demand management activities.381 We consider a holistic review of the incentive schemes, including schemes currently in operation and potential new schemes, could ensure that network operators receive the appropriate incentives to adapt to an energy sector in transition.
376 AEMC, Economic regulation of network service providers, undated, viewed 7 June 2018, https://www.aemc.gov.au/rule-changes/economic-regulation-of-network-service-providers.
377 AEMC, Rule Determination: National Electricity Amendment (Economic regulation of network service providers) Rule 2012, 29 November 2012, pp. xi–x.
378 COAG Energy Council Senior Committee of Officials, Bulletin binding rate of return guideline, October 2017.379 AER, Position paper—Review of the rate of return guideline—process for guideline review, November 2017, p. 9.380 AER, Issues paper—review of regulatory tax approach, May 2018.381 Current incentives schemes implemented by the AER include the service target performance incentive scheme, demand
management incentive scheme, innovation allowance scheme, Victoria F-factor scheme, capital expenditure sharing scheme and the efficiency benefit sharing scheme.
196 Retail Electricity Pricing Inquiry—Final Report
A review of incentive schemes would also ensure that existing schemes are functioning properly and have the right incentive power. A holistic review of incentives is important to identifying how different incentives work together. This includes how schemes may interact with parts of the revenue requirement—for example, the interaction between the cost of capital that a network faces and the capital expenditure sharing scheme.
Jurisdictional specific costs
A second potential area for further AER review relates to jurisdictional specific costs. Regulatory obligations are a significant driver of costs, and vary across jurisdictions. For example, the discussion in section 7.2 above identified how differences in reliability standards across jurisdictions resulted in significant differences in the level of investment.
It could be argued that jurisdictional differences may make it difficult to apply comparisons between networks, which is essential to economic benchmarking. For this reason, the AER commenced a review of operating environment factors to identify whether and how jurisdictional differences impact on expenditure in its operating expenditure economic benchmarking analysis.382 The ACCC supports the AER’s assessment of whether jurisdictional differences are significant to the operating expenditure benchmarking process.
The ACCC also considers that a broader review of the impact of jurisdictional differences on all aspects of the revenue requirement could assist in identifying whether there are material factors imposed on electricity networks which result in additional costs that are not efficient or equitable.
In addition to differences in reliability, safety and security of supply obligations across jurisdictions, there are some costs that are treated as pass-throughs that are exogenous to the way the network operates. For example:
�� The costs incurred for premium feed in tariff schemes are recovered through network charges. How these costs are recovered varies across each jurisdiction and can add significantly to the revenue requirement. These costs are discussed further in chapter 9.
�� In Victoria, the AusNet Services transmission network pays an annual easement land tax ($136 million in 2018–19).383 This cost comprises approximately 50 per cent of AusNet Services’ operating expenditure.384 This is a cost that other transmission networks do not incur, and makes up more than half of AusNet Services’ annual operating expenditure. The easement land tax was originally levied in order to allow for payment of subsidies to Alcoa for the electricity costs of the operation of certain aluminium smelters. However, there is now evidence that the money being paid under the scheme is significantly lower than the subsidies being paid.385 The annual easement land tax increases the annual residential customer bill in Victoria by around $17.
Other non-pass-through government policies may also have a large impact on the revenue requirement. For example, in 2006 the Victorian Government mandated a roll out of advanced metering infrastructure for household and small business customers. The Victorian electricity distributors spent a total of $2543 million on installing this infrastructure of which $2351 million was recovered through regulatory determinations. In other jurisdictions, electricity smart meters will be provided to customers under a competitive framework (as discussed in section 7.3).
We consider a review of costs in network revenue requirements related to jurisdictional policy decisions will provide greater transparency, and allow consumers to better identify whether the costs are in line with their preferences.
In any case, we also consider consumers should not bear jurisdictional costs and taxes that do not relate to the provision of network services. As such, we consider that the levy currently imposed on Victorian energy users through AusNet Services’ easement tax should be abolished, which could save the average Victorian residential consumer around $17 from their annual electricity bill by 2021.
382 Sapere research group, Independent review of Operating Environment Factors used to adjust efficient operating expenditure for economic benchmarking, December 2017, p. 1.
383 AER, Determination easements tax change event pass-through for 2018–19 regulatory year AusNet Services, March 2018, p. 3.384 AER, Determination easements tax change event pass-through for 2018–19 regulatory year AusNet Services, March 2018, p. 3.385 Potter, Ben, ‘Victorian government under pressure over $111m ‘Alcoa levy’, Australian Financial Review, 18 Jan 2017, viewed 18 May
2018, http://www.afr.com/news/victorian-government-under-pressure-over-111m-alcoa-levy-20170118-gttokv.

197 Retail Electricity Pricing Inquiry—Final Report
Greater consumer involvementThe long-term interests of electricity consumers is at the heart of the NEO. The regulatory framework should therefore encourage processes to inform consumers and allow them to contribute early in the determination process.
The complexity of the regulatory framework provides a significant barrier for consumer engagement. Reducing the complexity may facilitate greater use of outcomes where informed consumers and network companies reach agreements on key costs. It will also be beneficial to obtain more data on consumer preferences, such as the value they place on reliability.
The Consumer Challenge Panel (CCP), established following the AER’s Better Regulation Guidelines, assists the AER in regulatory determinations by providing a consumer perspective on a range of issues, both during the development of regulatory proposals and after their formal submission to the AER.
Earlier consumer engagement can provide an opportunity for consumers and network operators to agree on specific issues before the network operators finalise their regulatory proposals.
The AER, ENA and ECA have collaborated to develop a draft process called ‘New Reg’ which involves negotiation to enable customer perspectives to be reflected in regulatory proposals in advance of lodgement with the AER.386
We note that AusNet Services is trialling this new process of direct negotiation with customers to develop its 2021–25 regulatory proposal with support from consumer advocates and the AER.387 This trial is operating within the current rule framework and will supplement, not replace, the AER’s assessment process.
We consider that the regulatory framework should be amended to remove any impediments to the AER being able to appropriately take into account outcomes that have been developed through considered engagement between informed customers and networks. The current Ausnet Services’ trial and the AER/ENA/ECA collaborative process will provide information on how the framework might be improved through increasing incentives and opportunities for improved customer involvement in revenue decisions and then ensuring this is able to be reflected through the assessment process by the AER.
It is important that the AER should not leave the negotiation process to be purely between customers and networks, given the information asymmetries between the parties. The AER would need to ensure that areas of agreement are in the long-term interests of consumers and consider the proposal put forward by the network on its merits.
Significantly, the ACCC considers that it would not be beneficial to have the approach taken to greater consumer engagement to be too heavily prescribed by the rules. We consider that, given the range of potential approaches to customer consultation, and the need for this to develop quickly, that any process under the rules should be enabling, with additional detail provided in AER guidelines.
Scope for more and earlier agreement between customers and networks will provide the opportunity for more streamlined assessments by the AER and encourage early engagement by network operators with consumers.
There may also be other areas where the AER is able to use more flexible processes in undertaking the regulatory determination process. These may enable the AER to use processes that are better aligned with the quality of the proposal to reduce regulatory burden.
386 ECA, AER, ENA, New Reg: Towards Consumer-Centric Energy Network Regulation —Approach Paper, March 2018.387 AusNet Services, Customer forum, viewed 7 June 2018, https://www.ausnetservices.com.au/en/Misc-Pages/Links/About-Us/
Charges-and-revenues/Electricity-distribution-network/Customer-Forum.

198 Retail Electricity Pricing Inquiry—Final Report
Total expenditure frameworkThe regulatory framework currently has different rules and assessment methodologies for capex and opex. Ongoing AEMC and COAG Energy Council reviews have explored investment incentives and whether a total expenditure (totex) framework would be better than separate capex and opex assessments.388
The key focus of these reviews is whether there is a bias towards capex over opex. We support these reviews, but note that there has been significant changes to the regulatory framework to address incentive issues in recent years. In particular, the AEMC introduced a capital expenditure sharing scheme (CESS) under which the AER has set the incentive to be equal to the benefits in its opex efficiency benefit sharing scheme (EBSS). The introduction of a demand management incentive scheme further encourages networks to explore non-network solutions to network augmentation. It will take time to assess the performance of these schemes. For example, the CESS was first introduced for the 2014–19 regulatory period for NSW distribution networks, but rewards or penalties under the scheme will not be applied until the 2019–24 regulatory period following an assessment of the capex from 2014 to 2019. It may also take more than one regulatory period of the CESS to identify long-term changes in expenditure trends.
Amendments to the rules to allow for a totex assessment would also require the AER to change the way it assesses proposals. For example, the AER’s revealed cost approach389 to assessing opex in conjunction with the EBSS is a key part to the AER’s incentive-based network regulation390, but is unlikely to be applicable under a totex approach.
The recent Frontier Economics review commissioned by the AEMC similarly noted that the implementation of a totex framework would likely require the AER to undertake considerable development work.391
If there are any changes to the incentive framework, the timeframe for implementation should allow the AER sufficient time to develop its assessment tools. The framework should also allow sufficient discretion for the AER to apply and update its assessment tools in an effective way.
Recommendation 18To further assist with reducing the complexity of the rules and improving the timely adaptability of the framework, consideration should be given by the AEMC as part of its ongoing reviews of the NER to areas where the NER can be amended to make greater use of AER guidelines, rather than the codification of detailed regulatory assessment methodologies and processes within the NER.
The AER should be able to initiate reviews of its guidelines to ensure they evolve with market developments and best regulatory practice.
This additional flexibility will mean that regulatory proposal assessment methodologies are able to be kept up to date without always needing a rule change process. Guidelines could only be developed within the scope of the rules and in accordance with the processes set out in the rules.
The AEMC could consider the impact on the overall framework of any changed or new guidelines as part of its annual network regulatory framework review.
Recommendation 19Governments should remove jurisdictional specific costs (taxes) that do not relate to the provision of network services. For example, Victoria should remove the easement land tax included in AusNet Services’ transmission network costs.
388 KPMG, Optimising network incentives a report for the Energy Market Transformation Project Team, January 2018, Frontier Economics, Total Expenditure Frameworks a report prepared for the Australian Energy Market Commission, December 2017, and CEPA, Incentives Faced by Network Service Providers, 16 April 2018.
389 The revealed cost is the AER’s preferred light handed approach to determining the opex forecast. The approach uses a base year opex based on actual opex in the current regulatory period to use as the basis for the opex in the forecast period. This approach relies on the EBSS to provide a continuous incentive to reduce opex. Initially the network operator receives the benefit of any efficiency gains before they are passed onto consumers after a five year period.
390 AER, Overview of the Better Regulation reform package, April 2014, p. 5, p. 8.391 Frontier Economics, Total expenditure frameworks a report prepared for the Australian Energy Market Commission, December 2017,
p. 80.

199 Retail Electricity Pricing Inquiry—Final Report
Recommendation 20The NER should be amended to allow the AER more flexibility in undertaking the process of making regulatory determinations. This should allow for streamlined and more efficient assessment of network costs and allow the framework to adapt to the changing role of networks in providing electricity to consumers.
Greater flexibility would allow the AER to better take into account any agreements between customers and networks, and use processes that are better aligned with the quality of the proposal, reducing regulatory burden on businesses and consumers. This in turn will incentivise networks to better engage with their consumers, improving engagement and consumer outcomes.

200 Retail Electricity Pricing Inquiry—Final Report
8. Demand response and stand-alone power systems
Technology innovations and declining costs are creating opportunities to expand the use of non-traditional methods of reducing peak electricity demand. Key technologies such as embedded (local) generation, battery storage and load control, when coupled with accurate information on customer load provided through smart meters, allow customers to take control of the volume and timing of their electricity use.
As noted in chapter 7, demand response and cost reflective pricing are complementary offerings that assist in managing the reduction of the peak load of the network, and hence in reducing overall network costs. Greater use of demand response also presents an opportunity for reductions in the cost of electricity supply at other levels of the supply chain, including the wholesale market.
8.1 Relevance of demand response8.1.1 What is demand response?Demand response involves customers reducing or changing the timing of their usage of electricity (or changing their use of on-site generation or storage) in response to short-term price signals or changing market conditions. Demand response can be behavioural, in that consumers manually switch off or do not use certain devices, or automated, for example, load control devices allow for consumers to participate with little or no active engagement. Examples of demand response include customers using a local generator or battery to supply electricity to the market when there are supply constraints, or having their load automatically reduced at these times through a device in their air conditioner or pool pump that reduces the power consumption for a short period. While the main focus of demand response to date has been directed to large industrial customers, recent technological, market and regulatory developments have made it easier for a wider range of smaller commercial and residential customers to access such services, and for those smaller loads to be aggregated and exposed to market signals.
These opportunities provide a new source of competition across the supply chain. Demand response can be deployed in the wholesale market to manage (or limit) price spikes, and can also be used by networks to manage system constraints. These products and services can also reduce or defer the need for new investment in both network and large scale generation.
Demand response was raised in the Finkel Review as a currently underutilised and potentially cost effective way to improve system reliability.392 Submissions to the Inquiry raised greater use of demand response as an option for improving electricity affordability, particularly in respect of network costs.393
The technological developments providing the opportunity for greater uptake of demand response are also creating the potential for efficient voluntary defection of some customers from the network. Stand-alone power systems offer significant potential to reduce overall network costs, particularly for customers on the edge of the grid. The benefits of stand-alone systems are discussed in section 8.5.
392 Dr Alan Finkel AO, Chief Scientist, Chair of the Expert Panel, Independent Review into the Future Security of the National Electricity Market—Blueprint for the Future, June 2017, p. 101.
393 EnergyAustralia, Submission to ACCC Preliminary Report, 28 November 2017, p. 6; ERM Power, Submission to ACCC Preliminary Report, 17 November 2017, p. 6; ENA, Submission to ACCC Preliminary Report, 17 November 2017, p. 7; PIAC, Submission to ACCC Preliminary Report, 17 November 2017, p. 14; NSW Farmers, Submission to ACCC Preliminary Report, November 2017, p. 24.

201 Retail Electricity Pricing Inquiry—Final Report
8.1.2 Relationship to affordability Stakeholders in consultation during this Inquiry identified a key issue preventing more rapid growth in this area as the difficulty of any one party in commercialising and coordinating demand response across the supply chain. The design of the regulatory framework means that any barriers to efficient use of demand response at each level of the supply chain must be addressed separately. However, consideration of any intervention to improve outcomes in a particular segment of the market must recognise the flow-on impacts to the rest of the supply chain.
The more significant benefits of demand response in moderating electricity costs are likely to only be seen over the longer term through the avoidance or deferral of investment. Short-term benefits from demand response are likely to arise where there is price volatility across the day in wholesale markets that allow for short-term responses from load or local generation to avoid or reduce exposure to the high price periods, or where there are current or anticipated constraints in distribution networks. However, current wholesale market conditions are relatively stable (with high average prices rather than high volatility). There is also substantial underutilised network capacity across many networks (despite some localised constraints), and little overall demand growth expected in the near future.
In any event, changes flagged for the market are likely to see an expanded role for demand response, including:
�� in meeting any reliability requirement under the NEG394
�� as a fast-response option to capture price benefits under five minute settlement.395
There have been significant recent changes to the regulatory framework for providing demand response, particularly as an alternative to network investment. These changes include the introduction by the AER of a new Demand Management Incentive Scheme (DMIS) and enhanced Demand Management Innovation Allowance (DMIA), and changes to the Regulatory Investment Test (RIT) for distribution and transmission that require exploration of non-network solutions as an alternative to major asset replacements. Further, there are multiple ongoing reviews to assess the viability of further interventions to support greater use of demand response in the wholesale market (and related ancillary service and emergency response markets). These changes and reviews recognise the important and growing role that demand response is likely to play in electricity supply.
8.2 Types of demand responseThere are four main services that demand response can provide:
�� network demand response—employed to manage peak demand within a particular transmission or distribution network, or localised part of a network
�� wholesale demand response—used to reduce the quantity of electricity bought in the wholesale market, either to reduce prices, to help market participants manage their contract market positions, or defer investment in new generation capacity
�� ancillary services demand response—sourced by the system operator to maintain grid frequency within its technical operating range
�� emergency demand response—sourced by the system operator when there are predicted supply shortfalls to avoid involuntary load shedding.396
Customers offering demand response have had the ability for some time to participate directly (or through third party aggregators) in markets for network or emergency demand response. Recent amendments to the regulatory framework have also allowed third party aggregators of demand
394 The reliability guarantee component of the NEG is expected to allow retailers to use demand response to meet their peak demand requirements.
395 The better alignment of price with dispatch under five minute settlement is expected to encourage greater use of options such as demand response that can react quickly to changing price signals.
396 Emergency response services are currently acquired by AEMO on an ad hoc basis through the Reliability and Emergency Reserve Trader mechanism. It requires the provider to offer firm capacity (either generation or load response) that can be called on in the event of a shortfall in scheduled generation capacity.

202 Retail Electricity Pricing Inquiry—Final Report
response to participate in frequency control ancillary service markets.397 Wholesale market demand response can at present only be offered through a wholesale market customer (generally a retailer) on behalf of the end-user providing the service. This limitation exists because there is no explicit price paid for demand response offered to the wholesale market. Market customers such as retailers can, however, get a financial benefit from offering demand response as it offsets their exposure to wholesale prices.
Although the potential benefits of demand response are well recognised, there is ongoing debate about the extent to which the regulatory framework supports an efficient level of demand response in the market. The elements required to support greater uptake of demand response have been extensively explored in recent reviews, including those by the ENA and CSIRO398, Finkel399 and the AEMC.400 These elements include market signals to potential providers of these services. The important role of cost reflective tariffs and smart meters in providing these signals is discussed in chapter 7. The following discussion explores elements of the regulatory framework that can support uptake of non-network services.
The AEMC is undertaking and has undertaken multiple reviews that include a focus on ensuring the energy framework allows for the efficient use of demand response:
�� The Reliability frameworks review (final report due mid-2018) includes consideration of whether a new mechanism is needed to allow aggregators to offer demand response directly into the wholesale electricity market.401 The AEMC outlined three options to provide for this in its draft report, which are outlined further below.
�� The AEMC previously considered the issue in 2016 as part of a rule change request from COAG.402 In that process, the AEMC considered that ‘the proposed [demand response] mechanism is costly and adds little benefit to consumers, because the benefits of demand side participation can, and already are, accessible under current arrangements’.403 The AEMC also found no evidence of ‘market failure that would prevent the current demand side participation arrangements in the market’404 or a lack of incentives on retailers to offer demand response services, noting that third parties can already partner with retailers to provide services. The review also stated that the AEMC does not consider there to be any regulatory barriers to the use of ancillary services, emergency, or network demand response in the NEM.
�� The Frequency control frameworks review (final report due mid-2018) explores regulatory barriers to distributed energy resources providing FCAS or other system security services.405 It identified some barriers to efficient use of demand response and provides draft recommendations on ways in which these barriers could be addressed. A significant barrier identified was that the recent change to the rules to allow third parties to offer demand response into FCAS markets was limited to offers of aggregated load. Small-scale generation cannot be aggregated and offered by these parties.
�� The Distribution market model project (final report released August 2017) explored what is required to optimise and coordinate the use of demand response across various markets.406
397 The AEMC finalised the Demand Response Mechanism and Ancillary Services Unbundling rule change in November 2016. The rule provided for a new category of market participant—a market ancillary service provider—to offer customers’ loads into the frequency control ancillary services (FCAS) markets. EnerNOC submitted to the Energy Security Board in March 2018 that following the rule change ‘new-entrant independent aggregators have increased the amount of [demand response] participating in the FCAS markets by approximately 5X, whilst carving out a 5–6 per cent market share from incumbent suppliers (and growing)’ (EnerNOC, Letter to Energy Security Board: Response from EnerNOC to the Energy Security Board’s National Energy Guarantee Draft Design Consultation Paper, 8 March 2018, p. 3.)
398 ENA and CSIRO, Electricity network transformation roadmap, Final Report, April 2017. 399 Dr Alan Finkel AO, Chief Scientist, Chair of the Expert Panel, Independent Review into the Future Security of the National Electricity
Market—Blueprint for the Future, June 2017.400 AEMC, 2017 Report, Electricity Network Economic Regulatory Framework Review, 18 July 2017.401 AEMC, Reliability Frameworks Review, Directions paper, 17 April 2018. The AEMC’s consideration of the need for a wholesale demand
response mechanism was recommended by the Finkel panel (recommendation 6.7).402 AEMC, Final Rule Determination: National Electricity Amendment (Demand Response Mechanism and Ancillary Services Unbundling)
Rule 2016, 24 November 2016. 403 AEMC, Final Rule Determination: National Electricity Amendment (Demand Response Mechanism and Ancillary Services Unbundling)
Rule 2016, 24 November 2016, pp. 6–7. 404 AEMC, Final Rule Determination: National Electricity Amendment (Demand Response Mechanism and Ancillary Services Unbundling)
Rule 2016, 24 November 2016, pp. 6–7. 405 AEMC, Frequency Control Frameworks Review, Draft Report, 20 March 2018.406 AEMC, Distribution market model, Final Report, 22 August 2017.

203 Retail Electricity Pricing Inquiry—Final Report
�� The Electricity network economic regulatory framework review (final report released July 2017) found the framework provides a number of incentives and obligations for network businesses and other stakeholders to use non-network solutions where it is efficient to do so.407 But it noted some stakeholders have raised concerns there is an inherent bias for network businesses to prefer capital expenditure over operating expenditure. The review also noted the need for further pricing reform. The incentive issue is being addressed in the Electricity network economic regulatory framework review 2018.
The following discussion focuses on the provision of wholesale and network demand response. These are the areas that represent the largest cost of electricity supply and were identified in submissions, and comments received through consultation as potentially benefiting from further reform. Increased participation in the two markets may also be complementary; however, there are coordination issues to consider in optimising the use of demand response across different markets. In particular, wholesale peaks will not necessarily coincide with local network constraints, and use of demand response from customers within a distribution network may impose costs on the network to manage changes in electricity flows.
Stakeholders did not note any barriers to offering demand response into emergency demand response and ancillary service markets. However, we note the AEMC’s current work program in ensuring demand response can be used more efficiently in these two markets. Effective access to these markets will provide an additional revenue stream for demand response resources and potentially support deployment in the primary wholesale market through providing for scale and scope for third party providers. The design of the National Energy Guarantee is also considering how to integrate demand response in the reliability mechanism.
8.3 Wholesale demand responseDemand response can be used in the wholesale market by market customers (generally retailers) to reduce exposure to high wholesale prices. As there is no independent value placed on demand response beyond this reduction in market exposure, it is ‘difficult for third parties to capture the value associated with wholesale demand response under the current framework’.408 Essentially, a demand response provider can only benefit by offering its services to a retailer to manage the load of the customers of that retailer. Third party providers of demand response have noted that there are commercial barriers to developing these partnerships with retailers.409 In consultation during the Inquiry, and in submissions to the AEMC’s current rule change process, third party providers of demand response considered that direct participation in the wholesale market would simplify their business model and allow them to be more competitive.410
The AEMC in previous reviews has determined that there are no barriers in the NER to demand side participation. It has considered that the benefits of demand response can be achieved without the need for a regulatory mechanism in the wholesale market. It found ‘at least 21 businesses capable of providing a variety of [demand response] products and services [outside the wholesale market], with a presence across all major jurisdictions in the NEM’.411 For large customers in particular, it considered that ‘demand side management service providers and retailers already compete to provide wholesale price risk management services’.412
This same opportunity does not exist, however, for smaller customers that do not face a wholesale price signal. These customers are reliant on their retailer to offer value from potential demand response. That is, the retailer can reward the customer for changes in consumption that reduce the retailer’s exposure to high wholesale prices. A key question raised through recent reviews of demand response is whether there are sufficient incentives on retailers to use demand response to hedge against the wholesale
407 AEMC, 2017 Report, Electricity Network Economic Regulatory Framework Review, 18 July 2017, p. vi.408 AEMC, Reliability Frameworks Review, Directions Paper, 17 April 2018, p. 114.409 See, for example, EnerNOC, Response from EnerNOC to the Commission’s Reliability Frameworks Review—Directions Paper dated
17 April 2018, 18 May 2018, pp. 2, 4 which identifies issues relating to a lack of certainty about customers’ length of contract.410 EnerNOC, Response from EnerNOC to the Commission’s Reliability Framework Review—Directions Paper dated 17 April 2018,
18 May 2018. 411 AEMC, Final Rule Determination: National Electricity Amendment (Demand Response Mechanism and Ancillary Services Unbundling)
Rule 2016, 24 November 2016, Summary, pp. 6–7.412 AEMC, Final Rule Determination: National Electricity Amendment (Demand Response Mechanism and Ancillary Services Unbundling)
Rule 2016, 24 November 2016, Summary, p. 7.

204 Retail Electricity Pricing Inquiry—Final Report
price rather than other forms of hedging, such as investing in more generation assets or using hedging contracts.413
As demand response is provided through bilateral contracts between market participants rather than offered into the market, it is unclear how much demand response there currently is in the NEM. Efforts by retailers to date to capture the benefits of demand response from smaller customers appear limited to a number of small retailers partnering with demand response providers, or to trials supported by ARENA (such as the AGL and Simply Energy ‘virtual power plants’ in South Australia, Powershop’s behavioural trial and Pooled Energy’s trial of pool control systems).414 To some extent, this may just reflect the limited penetration of enabling technology, including smart meters. However, some stakeholders have also suggested that retailers with generation interests could face a lower incentive to utilise demand response from smaller customers, where they are also capturing the benefits of higher wholesale market prices.415 PIAC argued in its submission that “Demand Response is greatly underutilised in the NEM”, highlighting the lack of response in South Australia that led to involuntary load shedding in 2016–17.416
The AEMC, in its Reliability frameworks review, is currently exploring ways in which the value of demand response could more easily be captured by third parties, noting that some mechanisms may come at considerable cost to consumers. It presented three models for how a mechanism could work. Two models are focused on providing a price signal to specialist demand response providers (but differ in relation to how the provider is exposed to the wholesale market and contracts with customers, and the impact on the role of a customer’s retailer), and the third is focused on providing additional incentives for retailers to offer demand response products.
The ACCC supports development of a mechanism for third parties to offer demand response directly into the wholesale market, given its potential to constrain the pricing of generation businesses, limit the need for additional generation and lead to lower prices. It is important to provide these participants with direct access to the wholesale market, as:
�� specialist demand response providers are better placed than retailers to identify and respond to market opportunities in this area
�� although difficult to quantify, it appears that retailers are not employing demand response at an efficient level. It may be they do not have sufficient incentives to use demand response to manage risk, given the availability of other tools with which they are more familiar, such as hedging through vertical integration and financial contracts. These tools, however, do not encourage an efficient combination of generation and load reduction
�� direct control by specialist demand response providers of how they offer services into the wholesale market will also likely leave them better placed to identify and coordinate opportunities to offer services across the supply chain, including to network businesses. Combined with our recommendations to expand the use of demand response in managing networks (section 8.4), this should improve the ability of demand response providers to maximise the benefits of their products and services.
The ACCC does not consider that interventions to further improve retailer incentives to provide demand response services would be sufficient to encourage the efficient use of demand response. Such incentives may also distort wholesale market signals. While greater retailer use of demand response to manage load and demand is desirable, retailers already have the opportunity, and incentive, to use demand response in wholesale markets. A movement towards more cost reflective network pricing (see section 7.3) may also see retailers take a greater interest in the potential for demand response by their customers, as they will be able to leverage the demand response to manage risk in multiple markets.
Opening the wholesale market to third parties that specialise in the provision of these services and have identified market opportunities without the need for incentive payments is more likely to result in an efficient level of these services being provided. The ACCC also notes that retailers would still be able to develop demand response products themselves or partner with third party providers if they wished.
413 The AEMC summarised stakeholder views on this issue in its Reliability Frameworks Review, Directions Paper, 17 April 2018, pp. 115–119.
414 Details of these trials, and others related to demand response, can be found on ARENA’s website: https://arena.gov.au/projects/?project-value-start=0&project-value-end=500000000.
415 See, for example, ARENA, Submission in response to the Reliability Frameworks Review Interim Report, 6 February 2018, p. 5.416 PIAC, Submission to ACCC Preliminary report, December 2017, pp. 11–12.
205 Retail Electricity Pricing Inquiry—Final Report
Recommendation 21In relation to wholesale demand response, a mechanism should be developed for third parties to offer demand response directly into the wholesale market. Design of the mechanism should commence immediately, building on work undertaken in the AEMC’s Reliability Frameworks Review. The mechanism should:
�� promote competition through allowing the widest range of businesses to directly offer demand response services
�� not allow retailers to limit the ability of their customers to engage a third party demand response provider (to the extent it is not inconsistent with the retail contract)
�� ensure load and generation response are valued appropriately based on the benefit they provide to the wholesale market
�� limit technical requirements placed on the customer that may inhibit take up or scope of these services (for example, requirements for multiple meters at the customer site).
8.4 Network demand responseDemand response can complement existing network services by relieving points of congestion in the grid. The use of non-network solutions appears to be increasing within both transmission and distribution networks. However, the uptake remains small relative to ongoing network investment.
Much of the use of demand response to date has occurred through programs provided directly by network businesses themselves, rather than commercially procured services from third parties. As the market matures, the role of network businesses in providing these services directly will need to be reviewed. Programs have largely been trials of innovative methods of eliciting demand response, rather than to address a specific identified network constraint.417 This may reflect that incentives provided through the regulatory framework have, until recently, focused on trials rather than business as usual projects (as discussed further below).
As noted in earlier sections of this chapter, the market for demand response provided by smaller customers is still also in its early stages of development. This reflects the current limited penetration of technology to support these services, and tools to enable effective large-scale aggregation of small customers. In consultation during the Inquiry, stakeholders identified commercial difficulties in developing viable proposals for a demand response to network constraints, which typically require a highly localised solution (which could be within a single suburb), without a pre-existing technology or customer base to leverage. It may therefore not be feasible for network demand response to develop on any scale without providers of these services having other revenue streams for their services (for example, where a third party already has demand response customers in that localised area which it uses to participate in the FCAS or wholesale markets). The other barrier for providers is accessing smaller customers without a partner that can readily facilitate the provider’s relationship with customers, which generally speaking would be the retailer.
Reducing transaction costs to develop the necessary scale, through processes such as the rollout of smart meters providing customers with efficient price signals, and developing effective consumer engagement channels, will be key to expanding this market.
However, stakeholders did not identify significant barriers within the regulatory framework itself as a potential impediment to the provision of network demand response, either by networks themselves or through third parties.
8.4.1 Appropriate incentives for use of demand responseA barrier to greater uptake of network demand response noted by stakeholders in consultation during the Inquiry was a business culture within network businesses that preferred traditional network investment solutions, and acted as a barrier to the take up of demand side solutions, particularly for
417 For example: United Energy’s summer saver program (https://customer-web.prd.prod.clddc.ue.com.au/) and Energy Queensland’s PeakSmart appliance program (https://www.energex.com.au/home/control-your-energy/positive-payback-program/positive-payback-for-households/air-conditioning-rewards).

206 Retail Electricity Pricing Inquiry—Final Report
smaller projects. As noted in chapter 7, the regulatory framework may lead network businesses to prefer less efficient network asset expenditure over demand response. Network businesses may be reluctant to fully embrace non-network expenditure because:
�� financial incentives in the framework reward network businesses for capital expenditure over operating expenditure. The AEMC is exploring any bias towards capital expenditure in its Electricity network economic regulatory framework review 2018, as discussed in section 7.4
�� system benefits associated with demand reduction are largely captured by customers (through reduced costs) rather than the network businesses
�� a lack of direct control by the network over contracted services, either because of the role of the intermediate third party or the reliance on sufficient customer participation, means that they are more difficult to manage operationally, and are less reliable, than in-house assets.
Ring-fencing rules may also reinforce the network cultural bias away from non-network solutions (discussed further).
Stakeholders noted, however, that very recent changes to the framework to better incentivise networks to consider demand management services, including the introduction of a new DMIS and DMIA, and information requirements, were still untested. The new DMIS and revised DMIA were introduced by the AER in December 2017 to counter potential disincentives on network businesses to use demand response.418
The DMIS provides electricity distribution businesses with additional revenue for efficient expenditure on non-network options relating to demand management (removing network constraints). In assessing demand response options, the DMIS allows the network to consider the value of the response across the supply chain. This is an important step in ensuring that demand response is deployed efficiently. However, achieving these benefits requires effective coordination of the demand response by a party other than the network business (due to ring-fencing requirements). Additionally, while these wider benefits can be considered in the assessment of options for projects, the additional revenue the network can receive is limited to the amount by which network costs are reduced. The DMIA provides distributors with funding for R&D in demand management projects.
As the scheme has yet to be applied, the ACCC cannot assess whether it will be effective in driving a greater uptake of demand response. However, the new scheme offers greater incentives for the implementation of efficient demand response than the previous scheme. The new DMIS provides incentive payments of up to one per cent of allowed revenue per annum, in addition to innovation funding under the DMIA. In contrast, the previous scheme provided an innovation allowance with no recognition of ongoing savings. Accordingly, this should provide an increased incentive on network companies to use demand response.
On the other hand, the DMIS, by limiting additional network revenue to savings in network costs, may reduce incentives on network businesses to identify and develop opportunities for demand response that have wider system benefits. Third party suppliers of these services should, however, be able to capture these wider benefits. It is therefore essential that the scheme is operated in a way that maximises the ability of third parties to offer demand response services.
The AEMC made a new rule change in April 2018 allowing distribution companies to request that the DMIS be applied ahead of their next determination period. If distribution companies do not take up that option, the new incentive scheme will not apply until mid-2019 at the earliest. The ACCC encourages distribution businesses to apply to the AER for early application of the new DMIS (ahead of their next regulatory determination) to bring forward incentives for greater use of demand response.
There may also be benefits from extending the scheme to transmission businesses. However, the scale of projects at the transmission level means that a greater proportion are likely to be already captured under the RIT process.
418 AER, Demand management incentive scheme, 14 December 2017; AER, Demand management innovation allowance mechanism, 14 December 2017.
207 Retail Electricity Pricing Inquiry—Final Report
8.4.2 Effective signalling and information requirementsProviders of non-network solutions need to have visibility of future opportunities in the market for their products or services. These businesses are reliant on the quality and timeliness of information provided by network operators.
The requirements under the NER for network businesses to identify the most efficient solution to an emerging constraint on the network have gradually evolved and broadened over time. In particular, the range of projects on which the network operators must consult, and the process they must undertake, have been expanded to provide more opportunity for non-network solutions to be considered.
Most recently, the RIT was expanded in 2017 to apply to decisions regarding investment in replacement assets (rather than just augmentation investment).419 Additional obligations have also been imposed on network businesses regarding the information that must be included in annual planning and system limitations reports.420 These reports identify the location and timing of forecast network constraints, as well as containing information to help providers of non-network solutions estimate the size of any required solution and the amount that network businesses would be willing to pay. These disclosure and consultation requirements are supported by a Demand side engagement strategy setting out how a network will engage with non-network providers and consider non-network options.421
As most of these requirements were first applied in 2017422, it is too early to assess their effectiveness in supporting greater uptake of non-network solutions. However, it is encouraging to note that some network businesses are going beyond regulated information requirements in voluntarily providing future constraint information to stakeholders, including through ARENA’s ‘network opportunities mapping’ project.423
Some stakeholders have raised concerns that the tools available for identifying opportunities and assessing projects did not support getting smaller projects off the ground. Of particular concern is that the cost threshold to trigger the RIT requirements—$5 million for distribution projects and $6 million for transmission projects—is too high to capture many projects that would benefit from a non-network response.424
It is unlikely to be efficient to extend the detailed RIT consultation requirements to significantly smaller projects. However, the identified bias of network businesses to traditional network solutions requires some form of oversight to assess whether efficient market outcomes are being achieved. This could include a robust assessment of network businesses’ actual and proposed non-network expenditure as part of the revenue determination process. This assessment should compare the overall proportions of non-network expenditures against the network’s capital expenditure, and include benchmarking across businesses. The AER should also ensure consultation by networks and itself through the regulatory determination process includes engagement with third party demand response providers.
Retailers are also a source of potential demand response for network businesses to draw from. In addition to responding to information provided by network businesses on network constraints, retailers can receive signals about the need for demand response through the network tariffs imposed on them. As discussed above, a movement towards more cost reflective network pricing may see retailers take a greater interest in the potential for demand response by their customers, particularly to the extent they are restricted by transitional measures or competition from simply passing cost reflective network tariffs through into retail charges.
419 AEMC, Rule Determination, National Electricity Amendment (Replacement expenditure planning arrangements) Rule 2017, 18 July 2017.
420 AEMC, National Electricity Amendment (Local Generation Network Credits) Rule 2016, 8 December 2016.421 As required NER, r. 5.13.1 since August 2013.422 The reporting requirements were first applied in annual planning reports for most distribution networks released in December 2017,
and the RIT requirements commenced September 2017. The AER released the system limitation report template in June 2017. 423 Data for the ARENA project is available at: https://www.nationalmap.gov.au/renewables/.424 Simply Energy, Submission to ACCC Preliminary Report, 17 November 2017, p. 2.
208 Retail Electricity Pricing Inquiry—Final Report
8.4.3 Opportunity to participateRecent changes to the electricity network framework have clarified the extent to which network businesses can participate in new markets. These changes have been underpinned by the principle that network businesses should not own or operate assets in markets that are potentially contestable, to provide greater scope for entry by third party demand response providers. The ENA raised concerns that these restrictions on the operation of network businesses will expose some customers to higher costs without a clear benefit, and may result in some customer benefits being forgone.425 The current framework distinguishes between:
�� assets that form part of the distribution network and those located ‘behind the meter’ of the customer
�� the use of assets to manage the network (including through demand response), and the use of assets in other markets (for example, the wholesale or FCAS markets).
The framework does not prevent network businesses from using network assets, or contracting for use of ‘behind the meter’ assets, to provide network demand response. It also allows network assets to be used to provide services in competitive markets, but restricts the role of the network business in directly offering these services (rather than through a ring-fenced entity).
The ACCC supports the general principle of limiting direct participation of network businesses in competitive markets. These markets are most likely to develop efficiently where third parties can enter on an even footing with the incumbent business. However, the framework should not limit the ability to deploy network assets in competitive markets. The framework should also recognise that network businesses may be best placed to use existing network assets or demand response tools to manage network constraints, and encourage networks to make full use of their existing assets in this way.
Separation or operation of network services and participation in competitive markets also supports the additional objective of unlocking the full value of new products and services. Batteries, embedded generation and load response all offer potential value across the supply chain. Businesses offering these products and services can optimise how they participate in multiple markets. These benefits may not be fully realised if the products and services are controlled by network businesses.
The AEMC’s contestability of network services rule change426 restricts distribution businesses from owning assets ‘behind the meter’ of the customer. These assets do not form part of the distribution network and there is no strong argument for why distribution businesses would need to own them. Network businesses are not prevented from undertaking demand response using assets on the customer’s side of the connection point, but must source these services from third parties rather than provide these services themselves. The cost of these services can be recovered through their operating expenditure allowance. There are successful examples of demand response programs being run by distribution networks using ‘behind the meter’ assets owned by third parties.427
The AER’s ring-fencing guideline428 focuses on the use of network assets to provide services in contestable markets (non-distribution services). Distribution businesses are not prevented from participating in these markets, but may have to do so through an affiliated business rather than directly. A key risk addressed through this approach is that network businesses may cross-subsidise services provided in contestable markets through regulated revenues, or may impede other companies from offering services. While it is important that the framework protect against this risk, it should not impede the use of network assets in other markets where this is efficient and can provide a benefit to consumers through lower system costs.429 In particular there may be transactional or operational barriers to network assets being used to provide non-network services, even where it would be efficient for this to occur.
425 ENA, Submission to ACCC Preliminary Report, December 2017, p. 10.426 AEMC, Rule Determination, National Electricity Amendment (Contestability of energy services) Rule 2017, 12 December 2017.427 For example, Energy Queensland’s PeakSmart appliance program (https://www.energex.com.au/home/control-your-energy/
positive-payback-program/positive-payback-for-households/air-conditioning-rewards), and various ‘virtual power plant’ trials that are being run jointly by network businesses and third parties.
428 AER, Ring-fencing Guideline Version 2, October 2017.429 For example, AEMO contracted with United Energy to use voltage control devices installed at its substations to provide demand
response over summer 2017–18 (AEMO, Summer operations report 2017–18, November 2018, p. 27).

209 Retail Electricity Pricing Inquiry—Final Report
The ACCC considers that the overall framework as it stands balances the ability of networks to offer services to competitive markets, and allowing for these markets to further develop. However, while these services may result in lower cost electricity supply, they were not envisaged at the time the definition of a distribution service was determined in the NEL and detailed rules and guidelines were developed. It is unclear whether the detailed rules and guidelines applying to these arrangements accommodate these new services appropriately, providing an environment where network assets can be employed efficiently, and allow for distribution customers to receive a fair share of any benefits achieved. Citipower/Powercor/United Energy and AusNet Services have argued in a submission to the AER that the regulations and restrictions around the usage of network assets in a competitive market need to be considered carefully.430 They argued that there are a number of circumstances where it is in customers’ interests for a network to use network control equipment to offer services into competitive market.
It is beyond the scope of this Inquiry to resolve all of these questions around the opportunity to participate in demand response in different markets. However, the AEMC’s annual network framework review provides an opportunity for these issues to be considered in more detail.
Recommendation 22In relation to network demand response:
�� The AER, in undertaking the revenue determination process, should include a more explicit focus on assessing the efficient use of non-network expenditure. This should involve a robust assessment of a network business’s actual and proposed non-network expenditure, including a comparison of the overall proportions of non-network expenditures against the network’s capital expenditure, and benchmarking across businesses. Further, consultation by the AER and networks through the process should include engagement with third party demand response providers.
�� Distribution businesses should apply to the AER for early application of the new DMIS (ahead of their next regulatory determination) to bring forward incentives for greater use of demand response. The DMIS and DMIA should also be extended to transmission businesses.
�� The AEMC should consider in its annual review of the electricity network economic regulatory framework whether network assets are being used efficiently to provide benefits in addition to distribution services (for example, as a substitute for generation in the wholesale, RERT or FCAS markets). This assessment should explore whether: – clarification is needed of what services can be provided directly by network businesses in
contestable markets – there are any aspects of the existing framework or technical barriers that prevent network
assets being used to provide efficient non-distribution services – the shared asset arrangements provide for a reasonable share of value extracted from the
provision of non-distribution services flowing to customers – it is appropriate for some non-distribution services (such as voltage control) to be
obtained from network assets under direction from AEMO rather than procured through competitive markets.
430 Citipower/Powercor/United Energy, Submission to service classification and asset exemption guidelines issues paper, 16 March 2018; Ausnet Services, Submission to service classification and asset exemption guidelines issues paper, 16 March 2018.

210 Retail Electricity Pricing Inquiry—Final Report
8.5 Standalone power systemsAs noted above, technology developments that are providing the opportunity for greater uptake of demand response are also creating the potential for efficient voluntary defection of some customers from the network.
Standalone power systems offer significant potential to reduce overall network costs. For example, Western Power conducted a 12 month trial of six households supplied through stand-alone power systems.431 The trial sites were selected on the basis that they were more than 50 per cent cheaper to supply through a standalone system compared to a traditional network connection. Western Power identified more than 3000 sites in its network area that could benefit from a standalone system. Likewise, Energeia, in modelling for the CSIRO/ENA electricity network transformation roadmap, found that almost $700 million could be saved by supplying 27 000 new rural connections between now and 2050 through individual power systems rather than a network connection.432
However, outside of trials, standalone systems for these customers are unlikely to be provided without a framework to support their development by network businesses. The high cost of serving remote customers is generally not reflected in network pricing for those customers, given that geographically averaged (postage stamp) network prices are typically applied. Without a locational pricing signal, commercially-led proposals are unlikely to develop.433 Submissions to an AEMC rule change process in 2017 identified widespread resistance to locational pricing on the basis of equity and broader social impacts.434 In this environment, network businesses will be required to identify opportunities for implementation of standalone systems based on avoided network costs. Given that the cost of a standalone system will represent the full electricity supply chain (generation and delivery of electricity), assessments of opportunities for efficient use of these systems should consider the costs of the standalone system against the full value of avoided costs associated with grid-supplied electricity (not just avoided network costs).
Western Power submitted a rule change request to support distributor-led development of standalone systems where it is the lowest cost option for meeting customer demand. The rule change proposal allowed for distributors to provide off-grid supply (through individual power systems or microgrids) to remote consumers in place of replacing or maintaining a grid connection, and to recover the costs of these systems through regulated revenues. The AEMC supported the intent of the rule change proposal, but found that the rule could not be introduced without wider reforms to the national laws.435
Given this finding, the AEMC recommended a package of law amendments to be considered by the COAG Energy Council to support the development of standalone systems. The COAG Energy Council has yet to respond to the recommendations. Given the potential for cost savings from standalone systems, the ACCC considers that this work needs to take place immediately. Importantly, however, such customers on standalone systems need to not suffer adverse outcomes in availability, reliability and security of supply as a result of being moved off-grid, and it is important that any framework ensures they are not disadvantaged. Protections should also be consistent across the NEM, in the same way that current protections are provided. Finally, the ACCC considers that it is important that the provision of such services is contestable, in order to ensure that the most cost-effective method of provision is adopted.
431 Western Power, Stand Alone power system trial—stage 1, viewed on 9 June 2018, https://westernpower.com.au/energy-solutions/projects-and-trials/stand-alone-power-system-trial/.
432 ENA and CSIRO, Electricity network transformation roadmap, final report, April 2017, p. 42. 433 One example of a community-led proposal to reduce grid supply (rather than to go fully off-grid) that relies on a locational price
signal is in relation to the town of Newstead in Victoria. To support the town’s goal of 100 per cent renewable energy, a special network tariff was introduced by the local distribution network, Powercor, to encourage customers to shift to community solar generation. The tariff, to apply from 1 July 2018 on an opt-in basis, was supported by the project coordinators.
434 AEMC, Final Rule Determination, National Electricity Amendment (Alternatives to grid-supplied network services) Rule 2017, 19 December 2017, pp. 47–48.
435 AEMC, Final Rule Determination, National Electricity Amendment (Alternatives to grid-supplied network services) Rule 2017, 19 December 2017.

211 Retail Electricity Pricing Inquiry—Final Report
Recommendation 23In relation to standalone systems, immediate work should be undertaken to identify and implement changes to the NEL and NER, and the NERL and NERR, to allow distributors to develop off-grid supply arrangements for existing customers or new connections where efficient. These arrangements should:
�� subject customers under these arrangements to equivalent costs and protections as if they were connected to the grid, including in respect of the obligation to supply, reliability and security of supply
�� be adopted on a consistent basis across the NEM, replacing current state-based regulation of off-grid systems
�� be operated under a contestable framework, with distribution businesses restricted to operating them through ring-fenced entities.

212 Retail Electricity Pricing Inquiry—Final Report
9. Environmental costsVarious governments have introduced environmental policies to encourage greater uptake of renewable generation, to encourage businesses and households to become more energy efficient, and to reduce carbon emissions in line with Australia’s international commitments. While these objectives are well intentioned, environmental schemes have typically imposed costs that have added to electricity bills.
As set out in chapter 1, the data available to the ACCC indicates that environmental schemes make up about 6 per cent of an average customer bill in the NEM in 2017–18, although this percentage varies from 4 per cent in Queensland (which recently decided to fund its solar bonus scheme from taxation) to 10 per cent in South Australia (which has a very high take up of rooftop solar PV systems).
While environmental costs make up a relatively small portion of the overall customer bill compared to networks or wholesale costs, it is notable that these costs have increased significantly over the last 10 years. In 2007–08 there was a much smaller level of environmental scheme costs, making up about 2 per cent of the overall customer bill.
9.1 What are environmental costs?Broadly speaking, environmental costs fall into four categories:
�� National schemes – LRET – SRES
�� State schemes – State certificate and efficiency schemes – Premium feed-in tariff (FiT) schemes.
These are discussed below.
9.1.1 National schemesA national renewable energy scheme, the renewable energy target (RET), has been in place since 2001. It is designed to incentivise investment in renewable energy generation by requiring an increasing proportion of electricity generation each year to be sourced from renewable energy. The current version of the scheme, which commenced in 2011, comprises the LRET and the SRES.
The scheme requires the purchase (or self-creation) of renewable energy certificates by retailers from renewable generation sources. These then need to be surrendered by the retailer to the government in proportion to the overall amount of energy consumed by the retailer’s customers. The large-scale generation certificates (LGCs) under the LRET are created based on the volume of electricity generated by accredited renewable energy sources, while the small-scale technology certificates (STCs) under the SRES reflect the installation of and generation by eligible solar hot water or small generation (rooftop solar PV) units. The prices of certificates under both schemes are effectively capped—retailers are able to pay a ‘shortfall charge’ of $65 instead of acquiring LGCs (a tax adjusted value of around $90), and can buy STCs from a central clearing house for a fixed price of $40. Prices under both schemes have been at or near these caps since 2016. Before this time, the price of LGCs was lower—generally being in a band between $25 and $45 from 2010 to 2015, then rapidly increasing over the course of 2015 towards the cap. As shown in figure 9.2 below, the price of STCs has been mostly around the $40 cap for a longer period, since the start of 2013. Prior to that point the STC price did, during 2011, fall as low as $20.

213 Retail Electricity Pricing Inquiry—Final Report
9.1.2 State schemesStates introduced a number of their own environmental policies, either using a similar certificate-based system to the LRET and SRES, or other means. These policies had a variety of goals such as encouraging energy efficiency436, investment in gas powered generation437 or investment in rooftop solar PV.
Premium FiT schemes were the most significant of these state schemes and were implemented by state governments to encourage the uptake of rooftop solar panels. This was done by providing households with payments for the electricity generated from the solar panels above the market value of this electricity. Households and businesses receive payments from their distributor, who recovers these costs through increases in distribution network prices charged to all customers.438 These costs increased as a growing number of households and businesses participated in the schemes and received payments.
In many cases, the initial premium FiT schemes were extremely generous, with the c/kWh amounts paid to households significantly above the wholesale and retail rates for electricity at the time. These schemes are summarised in table 8.2, as well as detailing current arrangements for new solar PV, in each of the NEM states. In all cases, the premium schemes are now closed to new entrants. However, most jurisdictions have at least one scheme where households and businesses that joined before they were closed, and maintain their eligibility, can continue to receive these feed-in tariffs.439 The exception is NSW, where premium tariffs ended in 2016. Benefits under these schemes run until as late as 2031 depending on the jurisdiction.
Schemes were offered on either a ‘net’ or ‘gross’ basis. In a gross scheme, the household received the relevant payment for all electricity generated by the solar panel, including amounts that it used itself. In a net scheme, the household only received payments for amounts that it exported to the grid. The gross schemes were extremely generous to the solar PV owner, as they were, in effect, being paid for the energy generated from their rooftop that they were themselves using.
436 For example, the Victorian Energy Efficiency Target; NSW Energy Saving Scheme; SA Retailer Energy Efficiency scheme; or ACT Energy Efficiency Improvement Scheme.
437 Between 2005 and 2014, Queensland required retailers to source a proportion of their electricity from gas-powered generators (Queensland State Development, Infrastructure and Industry Committee, Energy and Water Legislation Amendment Bill 2013: Report 29, August 2013).
438 As discussed below, Queensland changed this approach for the 2017–18, 2018–19 and 2019–20 financial years, where it instead funded its Solar Bonus Scheme from the state budget.
439 Eligibility can be lost for a variety of reasons, depending on the details of the state scheme. These may include, for example, the selling of the house by the installing owner, or the installation of a new solar panel.

214 Retail Electricity Pricing Inquiry—Final Report
Table 9.1: Premium FiT schemes, and current arrangements
Premium schemes440 Current arrangements
State Type FiT End date
Victoria Net Three net schemes60 c/kWh25 c/kWh1-for-1441
31 Dec 202431 Dec 201631 Dec 2016
Mandatory retail FiT set by ESC Victoria (currently 11.3 c/kWh net)
NSW Gross Now finished, but offered 20 c/kWh or 60 c/kWh
31 Dec 2016 Voluntary benchmark solar FiT set by IPART (currently 11.9 to 15 c/kWh net)
Queensland Net 44 c/kWh 2028 No regulation in SEQ.Mandatory FiT in regional Queensland set by QCA based on retailers’ avoided cost (currently 10.012 c/kWh net)
South Australia
Net 44 c/kWh16 c/kWh (now finished)
30 June 202830 September 2016
ESCOSA monitors minimum retailer payments but no price set
Tasmania Net 1-for-1 1 January 2019 Retailer minimum FiT set by OTTER (currently 8.929 c/kWh net)
ACT Gross Five premium FiT rates (30.16 c/kWh–50.05 c/kWh depending on capacity)ActewAGL’s 1-for-1
20 years2020
No government pricing
The values of the feed-in tariffs available under some of the premium schemes greatly exceed the wholesale and even the retail price of electricity in the relevant jurisdiction. There are a significant number of customers signed up under many of these schemes. For example, the 88 000442 Victorian Premium FiT scheme participants that entered the scheme before 29 December 2011 will continue to receive a 60 c/kWh tariff until 2024443, while 148 000 systems were connected under the NSW scheme444 and there are currently 240 000 customers on the Solar Bonus Scheme in Queensland.445
The costs of the premium FiT schemes have been higher than expected at the time of their implementation, due to the rapid take up of solar PV. For example, as noted in chapter 7, the combined cost to Ergon Energy and Energex in 2014–15 for payments related to the Queensland solar bonus scheme was $319 million, greatly exceeding the initial forecast of $15 million.446
9.1.3 Effect of the schemesThere are important policy reasons for all of the different environmental schemes, such as promoting cleaner sources of energy or encouraging the take-up of energy efficient devices. It is also the case that, all else being equal, renewable generation sources have a near zero marginal cost which puts downward pressure on electricity spot prices when these generation sources are bid into the market (or, for small-scale systems, through a reduction in overall demand for electricity).447 Also, customers that have been the beneficiaries of premium FiT schemes are paying much lower electricity bills than they would otherwise have been, and so have had significant assistance in managing electricity affordability. As noted in chapter 1, the ‘average’ solar residential customer in the NEM, which reflects an average of
440 Eligibility for the different schemes within each state depended on the date of application. For example, the SA 44 c/kWh schemes were available to participants who received permission by no later than 30 September 2011, and connected to the grid by no later than 30 January 2012. The 16 c/kWh scheme was available to people who did not receive permission prior to 1 October 2011 and connected between that date and 30 September 2013.
441 1-for-1 means that the rate of the feed-in tariff was set at the same rate as the retail tariff for grid-supplied electricity.442 Department of Environment, Land, Water and Planning (Victoria), Premium feed-in tariff, undated, viewed 14 August 2017, https://
www.energy.vic.gov.au/renewable-energy/victorian-feed-in-tariff/premium-feed-in-tariff.443 Department of Environment, Land, Water and Planning (Victoria), Closed feed-in tariff schemes, undated, viewed 14 August 2017,
https://www.energy.vic.gov.au/renewable-energy/victorian-feed-in-tariff/closed-feed-in-tariff-schemes.444 NSW Government, NSW Climate Change Fund Annual Report 2016–17, November 2017, p. 27.445 Electricity and Other Legislation (Batteries and Premium Feed-in Tariff) Amendment Bill 2018 (Qld), Explanatory Notes, p. 1.446 AER, Final decision Energex cost pass through Qld Solar Bonus Scheme 2014–15, December 2015, p. 6; AER, Final decision Ergon
cost pass through Qld Solar Bonus Scheme 2014–15, December 2015, p. 6.447 The ACCC notes, however, that prices may rise and fall over time as we see the further exit of major coal generators from the market.

215 Retail Electricity Pricing Inquiry—Final Report
customers on premium and retail FiT schemes, receives $538 off their bill in FiTs each year, and also saves on the energy they do not need to purchase from the grid.
However, it needs to be recognised that government decisions on the design of environmental policy, including the way that environmental schemes have been funded, have a direct impact on affordability by raising prices.
In 2016–17, the data obtained by the ACCC indicates that the environmental scheme part of the customer bill was made up of the following schemes’ costs:
�� LRET—44 per cent
�� Premium FiT schemes—33 per cent
�� SRES—15 per cent
�� Other state schemes—10 per cent.
On a state-by-state basis, these costs are represented in figure 9.1. It should be noted that these vary significantly between states, primarily due to the differing penetration of rooftop solar PV.
Figure 9.1: Environmental costs in residential customer bills by state, 2017–18, real $2016–17
$/cu
sto
mer
NEMTasmaniaQueenslandSouth AustraliaNSWVictoria0
20
40
60
80
100
120
140
160
180
SRES StateLRET FiT
93109
170
76
155
106
587
21%
14%
16%
49%
23%
11%
17%
49%
43%
18%
10%
29%
23%
77%
29%
20%
52%
23%
10%
17%
50%
Source: ACCC analysis based on retailers’ and networks’ data.
9.2 Lowering environmental costsThe rise in environmental costs as a component of customer bills since 2007–08 has been driven by factors including:
�� increases in the prices of LGCs under the LRET
�� commencement of energy efficiency schemes like the Victorian Energy Efficiency Target (VEET) and the NSW Energy Saving Scheme (ESS) in 2009
�� the rapid uptake of rooftop solar PV, which has increased both the number of STCs that must be surrendered under the SRES, and the total value of payments under the premium FiT schemes.
The ACCC considers that there are several steps that could be taken to address the affordability issues from environmental costs.
9.2.1 National schemesIn relation to the LRET, this scheme has introduced costs into the customer bill, making up a significant portion of environmental costs for retailers. The ACCC noted in part 1 that the LRET has incentivised the building of additional renewable generation, but without regard to the ability of that generation to supply electricity to the market when demanded. However, as noted, the NEG may, if appropriately designed, help to lower carbon emissions at lowest cost while promoting investment in a manner that ensures demand for energy is met.

216 Retail Electricity Pricing Inquiry—Final Report
Under current proposals, the LRET will continue to operate in parallel with the NEG until 2030. However, the cost of large-scale generation certificates under the LRET should decrease, as the amount of renewable energy built or under construction is capable of generating certificates in excess of the volume needed to meet the 2020 RET, with other projects also likely.448 The timing of this cost approaching zero is unclear, although forward trading prices of certificates at the time of this report indicate a price of around $30 by 2020 compared to current spot prices of over $80.449 The ACCC also understands that projects will have been signed with long-term agreements for purchasing LGCs which may mean that LRET costs remain even after there are excess certificates available. Equally, the ACCC understands that the price for certificates purchased under PPAs is generally much lower than the market price.
Given that the design of the LRET scheme means that its costs should start to decrease significantly by or shortly after 2020, when the amount of renewable energy built should exceed the RET, the ACCC does not propose any action in relation to LRET costs.
In relation to the SRES, the ACCC notes that the costs of this scheme are relatively smaller in the cost stack than the LRET but have increased significantly at times, including for 2018. The design of the SRES, whereby new certificates are generated by the new installations each year, and retailers must redeem those certificates each year (or the next), means that its costs are likely to continue until the end of the scheme in 2030.
Most recently, investment in small-scale renewable energy systems in 2017 was well above forecasts. This has meant that the 2018 Small-scale Technology Percentage (STP) (which determines the amount of certificates that need to be redeemed) has increased to 17.08 per cent to account for the significant excess of certificates in the market. This is a significant increase over the 7.01 per cent in 2017 and a level not seen since the period leading up to 2013 (which was driven in large part by the premium FiTs available at the time, and the use of certificate multipliers). There was a slight decrease in the prices of certificates in early 2018 as a result of the surpluses, although this did not persist.450 This mirrored the decreased prices in 2011 and 2012, after which prices returned to the cap.
Figure 9.2: Small-scale Technology Certificate prices, 2011 to 2018, $/MWh
2011 2012 2017 20182013 2014 2015 2016
$/M
Wh
0
5
10
15
20
25
30
35
40
45
Source: Clean Energy Regulator.
448 Clean Energy Regulator, Large-scale generation certificate market update - May 2018, 11 May 2018.449 For example, prices published by Mercari indicated that the forward price of LGCs for 2019 was $76.50, decreasing to $29.23 for
2020, $28.18 for 2021 and $23.90 for 2022. Mercari, LGC closing rates, viewed 13 June 2018, http://lgc.mercari.com.au/.450 Clean Energy Regulator, Small-scale technology certificate market update - May 2018, 14 June 2018.

217 Retail Electricity Pricing Inquiry—Final Report
This fairly consistent price means that the costs of the SRES are largely driven by the STP. The recent increase in the STP means that liable retailers must obtain more than two and a half times the number of certificates in 2018 per MWh than they were required to do in 2017. While clearing house certificate prices did come down slightly, this was only temporary and retailers will still likely need to spend significantly more in total compared to 2017 to meet their SRES obligations. This will lead to an increase in the bills faced by all consumers in the short term.
The number of certificates per installation (which are provided up-front for deemed generation over the period of the scheme) will continue to decline as the scheme end date in 2030 approaches. This will lead to the ongoing costs of the scheme reducing slowly over time for future installations (in contrast to the relatively rapid decline expected for the LRET once the RET is met).
At this stage, the Clean Energy Regulator is forecasting a decrease in the STP for the next two years, which should reduce the SRES costs.451 However, a surplus of certificates is expected to continue in the near term.452
If there are significant ongoing increases in the numbers of installations in small-scale renewable energy systems, the costs of the SRES to all consumers may increase in future (although this will be offset by the declining number of certificates generated). The annual cost of the scheme is difficult to estimate based on public information, as the cost of certificates under long-term supply arrangements is likely lower than the $40 clearing house price cap, and the costs vary each year. However, data provided by retailers suggests a total cost of the scheme of around $130 million for 2016–17.
The SRES was designed at a time when installation of solar PV on household rooftops was much more expensive than it is now. In 2007, the pre-subsidy cost of installation of a 1.5 kW system (the typical system size at the time) was around $18 000.453 By 2014, a 3 kW system cost less than half of that amount to install454 and today, a similar system is around $5000 before any subsidy.455 Modelling for the Clean Energy Regulator suggests that STCs would account for around 32.6 per cent of the costs of a 5 kW system in 2020.456
In light of the dramatic reduction in solar PV installation costs, the ACCC considers the case for a subsidy for small-scale solar installations is now weak, and is of the view that the SRES should be ended earlier than its currently scheduled end date in 2030. Removing the SRES would save an average residential customer in the NEM $15–30 per year depending on state. This could be done by stating that certificates would no longer be created by new installations, or required to be redeemed by retailers, after a certain time.
Action to reduce the cost of the scheme will make solar PV more expensive for customers looking to install new systems. The ACCC acknowledges the potential inequity of this. Those households that have installed solar PV already have been able to access a significant subsidy which has for many years been funded by non-solar customers. Now that the cost of solar PV is much lower, and arguably within reach of more households, removing the SRES would leave new installers to fund the full cost of any installation. However, this is less of a concern now given that the overall cost of solar systems has decreased significantly in recent years.457 As a result, the payback period on systems is much lower than previously. Depending on location, size of the system and consumption patterns, the payback period
451 Calculated from the $12/W figure in table 6 in Australian PV institute, National Survey Report of PV Power Applications in Australia 2016, July 2017, p. 2.
452 Calculated from the $2.77/W figure in table 6 in Australian PV institute, National Survey Report of PV Power Applications in Australia 2016, July 2017, p. 2. The Clean Energy Regulator estimated that the cost of a 1.5 kW system in 2014 was $3792, and a 3 kW system was $5883 (although these prices included the SRES subsidy)—Clean Energy Council, Why the small-scale renewable energy scheme should be retained, August 2014, p. 2.
453 Calculated from the $12/W figure in table 6 in Australian PV institute, National Survey Report of PV Power Applications in Australia 2016, July 2017, p. 2.
454 Calculated from the $2.77/W figure in table 6 in Australian PV institute, National Survey Report of PV Power Applications in Australia 2016, July 2017, p.2. The Clean Energy Regulator estimated that the cost of a 1.5 kW system in 2014 was $3792, and a 3 kW system was $5883 (although these prices included the SRES subsidy)—Clean Energy Council, Why the small-scale renewable energy scheme should be retained, August 2014, p. 2.
455 Green Energy Markets, Final Report to the Clean Energy Regulator, Small-scale technology certificates Data modelling for 2018–2020, January 2018, p. 20.
456 Green Energy Markets, Final Report to the Clean Energy Regulator, Small-scale technology certificates Data modelling for 2018–2020, January 2018, p. 20.
457 Green Energy Markets, Final Report to the Clean Energy Regulator, Small-scale technology certificates Data modelling for 2018–2020, January 2018, p. 20.

218 Retail Electricity Pricing Inquiry—Final Report
on a solar PV system currently can be as low as three and a half years (although this is including the existing subsidy and would increase if it was removed).458
In any event, for as long as the subsidy persists there are some customers for whom installation of solar PV is not an option (due to cost or housing arrangements) who will subsidise those who are able to install them.
The removal of the SRES could happen in a number of ways. The scheme could be abolished straight away, or maintained for two or three years in its current form and then abolished. Another option is to reduce (over time) the $40 price per certificate through the Clean Energy Regulator clearing house (the effective cap price of the certificates).459 The Minister has the power to change this price under relevant legislation, with ‘the impact of the clearing house price … on the electricity market, including on electricity prices’ being one of the relevant factors to consider.460 That said, this step may not address the costs of certificates already being sold under any existing long-term agreements. Alternatively, steps could be taken to more rapidly reduce the number of certificates that new eligible systems create.
The ACCC considers that removing the SRES by 2021 would achieve two things. Firstly, it would match the time that LRET costs are expected to decline significantly. This would largely remove the effect of the RET from the average consumer bill, and any incentives for renewable energy investment would come from the NEG. This date would also allow for a period under which new users planning a solar PV installation could access the scheme which others have been able to benefit from, potentially helping to address the inequity point noted above.
Recommendation 24The SRES should be wound down and abolished by 2021.
9.2.2 State schemesThe ACCC considers that there should be changes made to the approach used to recover costs under the state-based schemes, in particular the premium FiT schemes that make up the bulk of the state-imposed costs.
The ACCC considers that the funding of premium FiTs through distributor charges is inherently inequitable. Firstly, the premium FiTs are significantly more generous than the wholesale cost of electricity, which means that the solar PV owners get a benefit significantly higher than the benefit to the NEM as a whole. Secondly, these generous payments are funded by all other users, who must pay for these amounts in increased charges. The current structure of network tariffs means that consumers with solar PV systems also avoid paying a reasonable share of broader network costs. Finally, vulnerable customers are less likely to have solar PV systems installed, meaning that the scheme operates as a regressive cross subsidy from those less able to afford it. For example, the Colmar-Brunton survey, discussed further in detail in part 3, found that respondents in public rental properties, low income households and sole parents have significantly lower rates of solar uptake than average. This system of recovery is also not transparent, as the costs of the payments are spread across the entire customer base.
The ACCC notes also that the various premium FiT schemes have all been significantly more popular than expected, meaning that the size of the payments is much more substantial than was contemplated when the schemes were designed. While the schemes are now closed to new entrants, there are significant costs that will continue to be incurred for the life of the schemes.
In the case of the NSW Solar Bonus Scheme, which ceased premium tariff payments at the end of 2016, the ACCC notes that funds are still being collected by distributors and paid to the NSW Government’s Climate Change Fund. For example, in 2015–16, the last full year of the Solar Bonus Scheme, the Climate Change Fund collected $309 million in revenue directly from the three NSW distributors.461
458 Payback period relates to a 20 kW system for a small business in South Australia, Green Energy Markets, Final Report to the Clean Energy Regulator, Small-scale technology certificates Data modelling for 2018–2020, January 2018, p.29.
459 Clean Energy Regulator, STC clearing house, 19 February 2016, viewed 16 May 2018 http://www.cleanenergyregulator.gov.au/OSR/REC/STC-clearing-house.
460 Renewable Energy (Electricity) Act 2000 (Cth), s. 30LA.461 NSW Government, NSW Climate Change Fund Annual Report 2015–16, September 2016, p. 5.
219 Retail Electricity Pricing Inquiry—Final Report
In the same year, $193 million of expenditure was related to the now-ended Solar Bonus Scheme.462 However, the revenue received by the fund in 2016–17 did not decrease by a commensurate amount to reflect the FiT payments no longer being made in the second half of the year.463 This emphasises concerns about the transparency of amounts collected through distributor charges. The NSW Government also consulted in 2016 on a Draft Strategic Plan for the Climate Change Fund.464 While the goals in this plan might be appropriate, as it stands it is unclear what the amounts collected from NSW electricity users through their electricity charges are being used for. The ACCC considers that the amounts collected for funding of previous premium FiTs should cease to be collected by the NSW Government.
The ACCC notes the Queensland Government decision in 2017 to fund its Solar Bonus Scheme to the value of $771 million in its budget for three years, rather than from consumers through distributor charges.465 This move is welcome as it has had a positive effect on the affordability of retail electricity, with an average saving on electricity bills of around $72 per customer in 2017–18. The ACCC considers that this approach should be adopted by other state governments to reduce bills, allocate costs more equitably amongst energy customers and provide more transparency about the cost of premium FiT schemes. The Queensland Government should also make its current funding arrangement permanent.
This would have the effect of removing the following amounts from the average residential customer bill:
�� Victoria—$19 per year
�� NSW—$25 (by either stopping the collection of the money through distributor charges or taking the funding of the climate change fund directly on budget)
�� Queensland—zero compared to 2017–18, as the scheme is currently on budget (but the cost would otherwise be about $72)
�� South Australia—$72
�� Tasmania—$45.
As similarly noted in chapter 6, governments taking these schemes on budget is to some extent just moving costs and could cost electricity users in other ways. For example, government could recover these amounts from other rates or taxes, or be less able to pay rebates such as the Queensland Government’s $50 a year ‘electricity asset ownership dividend’466 or other government schemes.
For this reason, in addition to taking these schemes on budget, it is also essential to limit the overall cost of premium FiT schemes. Previous studies have recommended that consideration should be given to the early ending of premium FiT schemes.467 While existing users on these schemes may suffer a financial penalty as a result of ending the scheme, the ACCC notes again that studies indicate that the payback period for many customers would have been reached already.468 Nevertheless, the ACCC does not favour ending these schemes earlier than planned as solar customers made investments on the basis of the FiT arrangements that were available when their decision was made.
However, the ACCC does support ensuring that eligibility rules are appropriately tightened to ensure costs of the schemes to taxpayers are minimised. The Queensland Government has recently proposed tightening of rules around eligibility of its scheme to limit the potential for costs to rise.469 In particular, the changes were introduced to address potential uses of additional generation or battery storage, which were not anticipated in the existing rules, in ways that might lead to costs of the scheme increasing. These ways might include ‘oversizing’ of generators, or using batteries such that the battery is supplying energy to the household at the same time that the solar PV system is exporting to the
462 NSW Government, NSW Climate Change Fund Annual Report 2016–17, November 2017, p. 27.463 NSW Government, NSW Climate Change Fund Annual Report 2016–17, November 2017, p. 4.464 NSW Government, Climate Change Fund Draft Strategic Plan 2017 to 2022, undated. 465 Queensland Government, Budget 2017–18, Powering Queensland Plan.466 Queensland Government, Electricity asset ownership dividend, viewed 13 May 2018, https://www.qld.gov.au/community/cost-of-
living-support/asset-ownership-dividend.467 QPC, Electricity Pricing Inquiry Final Report, 31 May 2016, p. 164.468 See, for example, KPMG, Residential PV—Customer Experiences and Future Developments, December 2016, pp. 22–36.469 For example, Department of Natural Resources, Mines and Energy (Queensland), Queensland Solar Bonus Scheme Policy Guide,
February 2018, p. 6; Electricity and Other Legislation (Batteries and Premium Feed-in Tariff) Amendment Bill 2018 (Qld), introduced to parliament on 15 February 2018.

220 Retail Electricity Pricing Inquiry—Final Report
grid.470 The Explanatory Notes to a previous version of the Bill estimated that these uses might increase the costs of the Solar Bonus Scheme by up to 25 per cent.471
Recommendation 25To reduce the costs associated with premium solar feed-in tariff schemes:
�� any costs remaining from such schemes should be borne by state governments through their budgets, as Queensland has done for the next three years, rather than being recovered through charges to electricity users, and this should be done on a permanent basis
�� where a premium solar FiT scheme has finished, as is the case in NSW, the collection of charges previously used to pay FiTs through premiums should also end
�� ongoing scheme eligibility rules should be reviewed and tightened to ensure that costs of these schemes are minimised.
470 Electricity and Other Legislation (Batteries and Premium Feed-in Tariff) Amendment Bill 2018 (Qld), Explanatory Notes, p. 3.471 Electricity and Other Legislation (Batteries and Premium Feed-in Tariff) Amendment Bill 2018 (Qld), Explanatory Notes, p. 3.
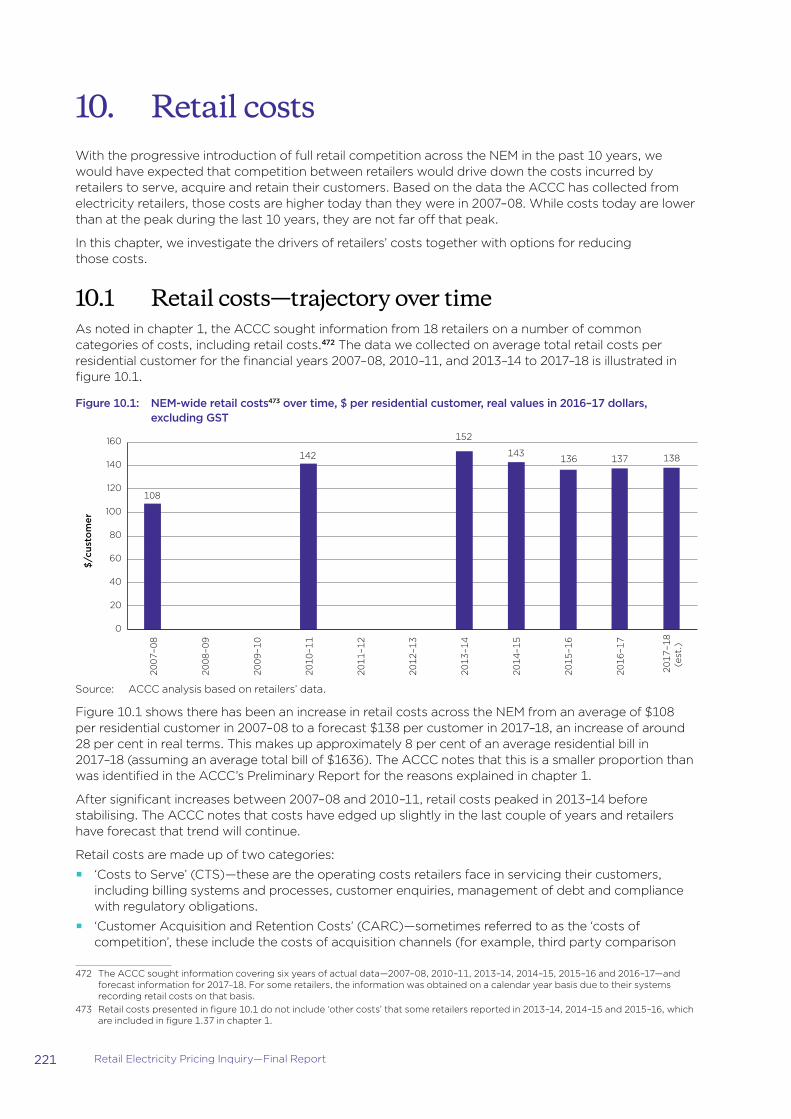
221 Retail Electricity Pricing Inquiry—Final Report
10. Retail costsWith the progressive introduction of full retail competition across the NEM in the past 10 years, we would have expected that competition between retailers would drive down the costs incurred by retailers to serve, acquire and retain their customers. Based on the data the ACCC has collected from electricity retailers, those costs are higher today than they were in 2007–08. While costs today are lower than at the peak during the last 10 years, they are not far off that peak.
In this chapter, we investigate the drivers of retailers’ costs together with options for reducing those costs.
10.1 Retail costs—trajectory over timeAs noted in chapter 1, the ACCC sought information from 18 retailers on a number of common categories of costs, including retail costs.472 The data we collected on average total retail costs per residential customer for the financial years 2007–08, 2010–11, and 2013–14 to 2017–18 is illustrated in figure 10.1.
Figure 10.1: NEM-wide retail costs473 over time, $ per residential customer, real values in 2016–17 dollars, excluding GST
108
142
152
143 136 137 138
0
20
40
60
80
100
120
140
160
2007
–08
2008
–09
2009
–10
2010
–11
2011
–12
2012
–13
2013
–14
2014
–15
2015
–16
2016
–17
2017
–18
(est
.)
$/cu
sto
mer
Source: ACCC analysis based on retailers’ data.
Figure 10.1 shows there has been an increase in retail costs across the NEM from an average of $108 per residential customer in 2007–08 to a forecast $138 per customer in 2017–18, an increase of around 28 per cent in real terms. This makes up approximately 8 per cent of an average residential bill in 2017–18 (assuming an average total bill of $1636). The ACCC notes that this is a smaller proportion than was identified in the ACCC’s Preliminary Report for the reasons explained in chapter 1.
After significant increases between 2007–08 and 2010–11, retail costs peaked in 2013–14 before stabilising. The ACCC notes that costs have edged up slightly in the last couple of years and retailers have forecast that trend will continue.
Retail costs are made up of two categories:
�� ‘Costs to Serve’ (CTS)—these are the operating costs retailers face in servicing their customers, including billing systems and processes, customer enquiries, management of debt and compliance with regulatory obligations.
�� ‘Customer Acquisition and Retention Costs’ (CARC)—sometimes referred to as the ‘costs of competition’, these include the costs of acquisition channels (for example, third party comparison
472 The ACCC sought information covering six years of actual data—2007–08, 2010–11, 2013–14, 2014–15, 2015–16 and 2016–17—and forecast information for 2017–18. For some retailers, the information was obtained on a calendar year basis due to their systems recording retail costs on that basis.
473 Retail costs presented in figure 10.1 do not include ‘other costs’ that some retailers reported in 2013–14, 2014–15 and 2015–16, which are included in figure 1.37 in chapter 1.

222 Retail Electricity Pricing Inquiry—Final Report
websites, door-to-door sales, telemarketing), other marketing spend, retention teams and related costs.
By analysing these two components separately, we gain a better understanding of what is driving increases in retail costs over time. Figure 10.2 shows the changes in CTS (for residential customers) over the financial years 2007–08, 2010–11, and 2013–14 to 2017–18.
Figure 10.2: NEM-wide CTS, $ per residential customer, real values in 2016–17 dollars, excluding GST
75
107
115
99
90 90 90
0
20
40
60
80
100
120
2007
–08
2008
–09
2009
–10
2010
–11
2011
–12
2012
–13
2013
–14
2014
–15
2015
–16
2016
–17
2017
–18
(est
.)
$/cu
sto
mer
Source: ACCC analysis based on retailers’ data.
Figure 10.2 shows that CTS followed a similar trend to overall retail costs with increases in CTS from 2007–08 to 2013–14, which have eased to current levels. The forecast cost of $90 per customer in 2017–18 is still an increase of around 20 per cent in real terms on 2007–08 CTS. CTS makes up approximately 6 per cent of an average residential bill in 2017–18. In section 10.2, we consider the drivers of CTS in more detail.
Figure 10.3 illustrates the changes in CARC over the financial years 2007–08, 2010–11, and 2013–14 to 2017–18.
Figure 10.3: NEM-wide CARC, $ per residential customer, real values in 2016–17 dollars, excluding GST
33 35
37 44
46 48 48
0
10
20
30
40
50
200
7–0
8
200
8–0
9
200
9–1
0
2010
–11
2011–
12
2012
–13
2013
–14
2014
–15
2015
–16
2016
–17
2017
–18
(est
.)
$/cu
sto
mer
Source: ACCC analysis based on retailers’ data.
Figure 10.3 shows that we have seen an overall increase in CARC from $33 per customer in 2007–08 to a forecast $48 per customer in 2017–18, an increase of around 45 per cent in real terms. This makes up approximately 3 per cent of an average residential bill in 2017–18.
While only a small percentage of an average residential bill, it is significant that on average each customer in the NEM is paying $48 each year to cover retailers’ acquisition and retention costs. It is also significant that these costs have risen steadily over time, and continue to rise, even if now at a slower rate. In section 10.3, we consider the drivers of CARC in more detail.

223 Retail Electricity Pricing Inquiry—Final Report
10.2 Cost to Serve (CTS)A fundamental principle of competition theory is that, with low barriers to entry, promoting competition should drive efficiencies in supply that will be passed through to customers. On that basis, we would expect that after the electricity markets transitioned to full retail competition, CTS should reduce over time as retailers seek to achieve efficiencies in the face of growing competition. Consistent with this theory, it is apparent from retailers’ public reporting that they are seeking to reduce CTS by implementing more efficient business processes.474 Despite these efforts, current CTS are 20 per cent higher than in 2007–08. As costs remain higher than they were 10 years ago despite most jurisdictions having many years of retail contestability, it is important to identify why these costs remain high and ways in which they can be reduced.
To analyse CTS, we have considered:
�� the differences in CTS between states
�� the differences in CTS between different types of retailers
�� a break-down of the eight largest categories of CTS provided by each relevant retailer for 2016–17 for further insights.
To complement this quantitative analysis, we considered submissions from retailers and met with a large number of retailers to understand their perspectives. Our findings and recommendations are set out below.
10.2.1 CTS on a state-by-state basisFigure 10.4 illustrates the variation in CTS by state for the mainland NEM regions for 2016–17, with South Australia ($81 per customer) having the lowest CTS compared to south east Queensland with the highest costs ($100 per customer).
Figure 10.4: CTS by state, 2016–17, $ per residential customer, excluding GST
92
84 81
100
90
0
20
40
60
80
100
120
Victoria NSW South Australia
South eastQueensland
NEM
$/cu
sto
mer
Source: ACCC analysis based on retailers’ data.
474 For example, AGL, Annual Report 2016, pp. 23 – 24; Origin, Annual Report 2017, pp. 25 and 28.

224 Retail Electricity Pricing Inquiry—Final Report
It is somewhat surprising that CTS in South Australia are the lowest in the NEM. Retail competition in South Australia is more muted given the difficulties in accessing hedging products to manage wholesale price risk and the small size of the market. A number of retailers operating in NSW, Victoria or Queensland have told the ACCC that they have decided not to enter South Australia.475 Accordingly, rather than being driven by competitive pressure, the lower costs in South Australia are likely to be driven by the lower number of smaller retailers in the market and the scale efficiencies of the larger retailers (who operate in South Australia), as discussed in section 10.2.2.
10.2.2 CTS by tier of retailerFigure 10.5 illustrates the variation in CTS by tier of retailer in the NEM for 2016–17, with the big three ($75 per customer) having the lowest costs compared to other retailers ($146 per customer). State retailers, namely Aurora Energy in Tasmania, Ergon Energy in regional Queensland and ActewAGL in the ACT, sit in the middle, with costs closer to those of the big three.
Figure 10.5: NEM-wide CTS by retailer tier, 2016–17, $ per residential customer
75 88
146
0
20
40
60
80
100
120
140
160
Big three State retailers Other retailers
$/c
usto
mer
Source: ACCC analysis based on retailers’ data.
Note: The ‘State retailers’ figure includes data from Ergon Energy and ActewAGL that is not included in other figures within this report.
The difference between the CTS of the big three and the ‘Other retailers’ is very significant. The figures are presented on a per customer basis, so to the extent that a retailer can spread many of its costs (for example, billing system and IT costs) across a larger customer base, its costs per customer will be lower. This goes some way to explaining the big three retailers’ significantly lower CTS.
The comparatively low CTS of the state retailers may also reflect their scale. Ergon Energy has over 600 000 customers and ActewAGL and Aurora Energy each have over 200 000 customers.
That said, retailer-by-retailer data does not tell a consistent story.476 There is significant variation within the costs of the big three and within the ‘Other retailers’ category. Some results are surprising. For example, some small retailers have much lower CTS per customer than some of their much larger competitors (including some of the big three).
Accordingly, in determining what measures would be effective to reduce CTS, it is important to consider the drivers of CTS.
475 In the AEMC’s 2018 retailer survey, retailers identified liquidity in the wholesale contracts market as the biggest competitive issue in South Australia, with many citing the limited access to competitively priced risk management products as a significant barrier to entry or expansion in that state. Some smaller retailers also noted that the South Australian market was too volatile to allow them to trade, due to limited access to competitive hedges (AEMC, 2018 Retail Energy Competition Review—How each state and territory is affected—South Australia Information Sheet, p. 2; AEMC, 2018 Retail Energy Competition Review Final Report, June 2018, p. 41).
476 Retailer-by-retailer data is not included here for confidentiality reasons.
225 Retail Electricity Pricing Inquiry—Final Report
10.2.3 Drivers of CTSTo investigate the drivers of retail costs, we:
�� asked retailers to break down their 2016–17 CTS into the eight largest categories according to quantum (allowing each retailer to specify its own categories)
�� considered submissions which identified drivers of costs
�� held meetings with a large number of retailers
�� reviewed internal documents from a selection of retailers.
In providing the data sought, retailers provided 95 unique categories of cost which broadly fit into the following key groups:
�� labour costs (including salaries and training)
�� debt and debt collection costs
�� IT and billing costs
�� leasing costs
�� customer service (if not included in labour costs)
�� ombudsman schemes and hardship programs
�� advertising and sponsorship
�� other (most retailers had a significant ‘other’ category).
The key insight from this data was the extent and size of costs of debt and debt collection. This issue of customer debt was also raised with us in the course of our meetings with retailers and is discussed further below.
Another very significant cost is labour costs. While this is to be expected, one of the most repeated concerns we have had from retailers related to the extent of costs associated with regulatory compliance, which is a key contributor to labour costs for retailers. This issue is also addressed in more detail below.
Bad debts and debt collectionThe information obtained by the ACCC throughout the Inquiry clearly indicates that the cost of bad debt and debt collection is significant.
Not all retailers provided the costs of bad debt and debt collection as a separate category in the data collected, but based on those that did, the cost of bad debt and debt collection is 22 per cent of their costs to serve, which translates to an annual cost of about $20 on average for each customer in the NEM. The data also showed that the highest debt collection costs are in South Australia.477
This data is consistent with submissions to the Inquiry, with one smaller retailer, Sumo Power, identifying that the bad debt component of every bill is more than 1 per cent of a total bill or around $15 per customer each year.478 EnergyAustralia highlighted that ‘the largest component of retail operating costs is credit costs including bad and doubtful debts.’479
Internal documents (and public reporting in some cases480) revealed that the cost of bad debt is a key concern for retailers; and changes in the level of bad and doubtful debts are a key contributor to increases or reductions in CTS at particular times.
Given the significance of these costs, it is critical that efforts be made to reduce the extent of bad debt costs in the interests of overall affordability.
In chapter 15 of this report, we closely examine the issues faced by vulnerable consumers in the retail electricity market. Those consumers often find themselves faced with debt as a result of a broad range of circumstances. In that chapter, we make specific recommendations to assist vulnerable consumers, which will serve to reduce the levels of bad debt among those consumers.
477 This is consistent with the AER’s finding in its performance reporting that residential customers in South Australia have the highest rates of debt in the NEM (AER, AER Annual Report on Compliance & Performance of the Retail Energy Market 2016–17, p. 28).
478 Sumo Power, Submission to ACCC Issues Paper, 30 June 2017, p. 5.479 EnergyAustralia, Submission to ACCC Issues Paper, 30 June 2017, p. 25.480 AGL, AGL Annual Report 2016, p. 23; AGL Energy Limited and Controlled Entities, Directors’ Report for the half-year ended
31 December 2017, pp. 9, 17–18; Origin Energy, Operating and Financial Review for the half year ended 31 December 2017, p. 13; Origin, Operating and Financial Review for the half year ended 31 December 2015, p. 19.

226 Retail Electricity Pricing Inquiry—Final Report
Importantly, we recommend that state and territory governments restructure concession schemes to ensure that they offset both supply charges and usage charges, and are targeted at those most in need. This will place downward pressure on concession customers’ bills and should flow through to reduce the cost of bad debt.
The ACCC also recommends government funding of a grant scheme for consumer and community organisations to provide targeted support to vulnerable consumers to improve energy literacy. Improved energy literacy will enable vulnerable consumers to choose competitive offers that suit their circumstances, and identify any relevant financial assistance schemes, such as concessions and medical rebates. Enabling consumers to identify and switch to better offers, as well as accessing the financial support that is available to them, will further assist in reducing the bad debt costs of retailers.
The ACCC notes that the AER’s proposed rule change in relation to hardship regulation will further reduce retailers’ bad debt costs, as more consumers will be able to access and benefit from retailer hardship schemes (see chapter 15).
Regulatory costsA key focus of the submissions to the Inquiry and our meetings with retailers was the cost of regulatory compliance. AGL, for example, submitted that the retail cost increases are driven in part by regulatory compliance costs, including costs associated with operating across different regulatory regimes and the significant additional regulatory burden in 2016–17.481 Regulatory costs have also been a key theme in our meetings with smaller retailers.
These costs are not readily quantifiable from the data provided by retailers as retailers typically did not identify regulatory costs as a separate category of costs. Rather, these costs typically form part of the ‘labour’ or ‘other’ categories (which were the two largest cost categories identified by retailers).
The concerns raised around regulatory costs fall into the following groupings:
�� the additional costs that arise as a result of Victoria not having joined the NECF (being the regulatory framework adopted in all of the other NEM states and the ACT)
�� the additional costs that arise as a result of individual states implementing derogations from the NECF and the divergence and duplication of reporting requirements, even within the NECF states
�� constant changes to the regulatory regimes (both in the NECF jurisdictions and in Victoria)
�� the overall complexity and level of prescription of the regulatory regime.
Separate regulatory regime in Victoria
As set out in detail in chapter 17, the introduction of the NECF was intended to align the different state and territory based regulatory regimes to streamline the regulatory process. The NECF involved the transfer of state and territory responsibilities to a new NEM-wide regulatory regime governing the sale and supply of energy to retail customers. The implementation of the NECF was expected to provide efficiencies, including by reducing the regulatory burden for energy businesses operating across various NEM jurisdictions.482
In June 2012, the Victorian Government announced that it had deferred Victoria’s transition to the NECF on the basis that it wished to ensure there was no reduction in key protections for Victorian customers.483 In an effort to address the differences between the Victorian and NECF frameworks, the Victorian Government undertook a harmonisation exercise on its framework, which it completed in late 2014.
We note, however, that there are clear signs Victoria is beginning to move further away from the NECF. For example, the new Victorian Payment Difficulties Framework and the state government’s response to the recent Independent Review into the Electricity and Gas Retail Markets in Victoria (Victorian review) suggest Victoria is increasingly taking a different approach.484
481 AGL, Submission to ACCC Preliminary Report, 19 November 2017, p. 9.482 Department of Environment, Land, Water and Planning Victoria, National Energy Customer framework, viewed 7 May 2018, https://
www.energy.vic.gov.au/legislation/national-energy-customer-framework/the-national-energy-customer-framework-in-victoria.483 ESC Victoria, Harmonisation of Energy Retail Codes and Guidelines with the National Energy Customer Framework, December 2012,
p. 1.484 ESC Victoria, Payment difficulty framework final decision, 10 October 2017; Department of Environment, Land, Water and Planning
Victoria, Victorian Government Interim Response to bipartisan independent review of the Electricity and Gas Retail Markets in Victoria, March 2018.

227 Retail Electricity Pricing Inquiry—Final Report
Retailers operating in Victoria and other NEM states incur additional regulatory costs as a result of Victoria not having joined the NECF. Many retailers pointed to the regulatory divergence between Victoria and the rest of the NEM as being a source of additional operating expenditure. For example, EnergyAustralia pointed out in a submission that ‘costs associated with regulation are greatly exacerbated by having multiple overlapping regulatory regimes in different jurisdictions’ and that the single biggest opportunity to reduce costs and complexity is to fully and uniformly implement a single NECF across the NEM.485 AGL agreed that ‘the divergence of regulatory arrangements from national arrangements and a lack of coordination between jurisdictions are increasing operating and compliance costs for retailers that operate on a national level.’486
In February 2017, the Australian Energy Council anticipated a tipping point where the divergence between Victoria and the other NEM jurisdictions will require retailers to run separate systems, processes and people to comply with the Victorian requirements.487 The key types of cost cited by retailers are additional staffing costs, additional information technology costs and additional licence fees.
In addition to the existing costs associated with regulatory bifurcation, retailers were also very concerned with new proposals in Victoria which suggest that it will diverge further from the NECF in the future. Victoria’s new Payment Difficulties Framework was identified as a key example.
In order to quantify the additional costs to customers that arise from Victoria not having adopted the NECF, we collected information from a number of retailers on estimated costs incurred. While an exact quantification is difficult, the estimates received suggest that the failure of Victoria to adopt the NECF increases retail costs in the NEM by around $25 million each year, equating to about $4 for every customer in the NEM (assuming retailers spread costs across all customers in the NEM) or $11 for each Victorian customer (assuming only Victorian customers incur these costs).488
These figures exclude some of the very significant one-off costs, and the substantial ongoing annual costs, that retailers anticipate will be incurred to comply with Victoria’s new Payment Difficulty Framework which comes into effect on 1 January 2019. One retailer has also indicated that the new Payment Difficulty Framework will lead to dramatically higher bad debt costs in Victoria.489
Recommendation 26Victoria should join the NECF to streamline regulatory obligations on retailers in the NEM and reduce retailers’ costs to serve.
In any interim period before joining the NECF, Victoria should take steps to harmonise its regulatory approach with the NECF.
Other regulatory bifurcation
Retailers also identified a number of other regulatory costs and inefficiencies arising from differences between the NECF jurisdictions. These include:
�� NECF jurisdictions derogating from the NECF: while some derogations are clearly necessary for state specific differences (for example, derogations relating to customers in regional Queensland), others (such as the NSW ban on fees for paper bills or the Queensland ban on credit card surcharges) have no state-specific characteristics to justify any divergence. These add costs, especially when, such as in the case of the ban on fees for papers bills in NSW, they have to be implemented within a very short period
�� state regulators imposing their own reporting requirements over and above what is done by the AER
485 EnergyAustralia, Submission to ACCC Preliminary Report, 28 November 2017, pp. 2, 7. See also Sumo Power, Submission to ACCC Preliminary Report, 17 November 2017, p. 1; Momentum Energy: Submission to ACCC Preliminary Report, 17 November 2017, p. 3.
486 AGL, Submission to ACCC Preliminary Report, 19 November 2017, p. 9.487 Australian Energy Council, Submission to the Department of Environment, Land, Water and Planning—Review of electricity and gas
retail markets in Victoria—Discussion Paper, 28 February 2017, p. 3.488 ACCC estimates based on data gathered from five retailers (both large and small).489 EnergyAustralia, Submission to ACCC Issues Paper, 30 June 2017, p. 21.
228 Retail Electricity Pricing Inquiry—Final Report
�� differences in concession schemes: for example, in a submission, EnergyAustralia reported that it currently administers approximately 19 different concessions across the NEM, adding significant costs to the operation of its customer and billing systems490
�� the different approaches of the jurisdiction-based ombudsmen: ombudsmen schemes remain state-based, even within the NECF jurisdictions, and can vary significantly in their approach
�� different environmental schemes (such as energy efficiency schemes, and feed-in tariff schemes).491 For example, ERM Power pointed to the operational costs to comply with four different state-based energy efficiency schemes because they each have separate reporting, compliance and auditing processes.492
Recommendation 27Each NECF jurisdiction should review its derogations from the NECF and unwind any derogations that are not based on jurisdiction-specific characteristics or needs that cannot be met by NECF-wide rules.
Recommendation 28Future derogations from the NECF should be limited to situations where there are jurisdiction-specific needs that cannot be addressed by a NECF-wide rule change.
In addition:
�� As recommended in chapter 16, state-based regulators should minimise their reporting requirements on retailers and rely on information collected by the AER. Where this is not possible due to restrictions on information sharing, state regulators should consult with the AER to ensure that requests mirror AER requests in format and timing to reduce burden.
�� As recommended in chapter 15, the COAG Energy Council should reform concession schemes to create a uniform, national approach to electricity concessions and to minimise the administrative burden on retailers in processing concession claims.
Ongoing regulatory change
Some retailers have pointed to the rate of regulatory change as a key concern. The rate of regulatory change has led to retailers incurring substantial additional regulatory costs as they seek to manage an ever-changing regulatory environment.493
AGL submitted that the amount of regulatory oversight and inquiries that it was subject to (particularly in 2016–17) was significant and contributed to a substantial increase in AGL’s operational costs.494
One of the changes highlighted by a number of retailers was the ‘Power of Choice’ package of reforms,495 which added significant compliance costs. EnergyAustralia detailed some of the work that needed to be done to comply with Power of Choice, explaining that:
… more than 180 existing work instructions will be updated and 150 new work instructions will be created. Over 2,000 staff are being trained to the appropriate level for their role and a specialist customer service team with direct contact in order to be available to resolve all metering related issues. More than 35 IT applications will change with around 2,000 new requirements being implemented.496
490 EnergyAustralia, Submission to ACCC Preliminary Report, 28 November 2017, p. 19. See also Australian Energy Council, Submission to ACCC Issues Paper, 30 June 2017, p. 3.
491 EnergyAustralia, Submission to ACCC Issues Paper, 30 June 2017, p. 6; Australian Energy Council, Submission to ACCC Issues Paper, 30 June 2017, p. 3.
492 ERM Power, Submission to ACCC Preliminary Report, 17 November 2017, p. 5.493 EnergyAustralia, Submission to ACCC Preliminary Report, 28 November 2017, p. 7; Sumo Power, Submission to ACCC Preliminary
Report, 17 November 2017, pp. 1 and 3.494 AGL, Submission to ACCC Preliminary Report, 19 November 2017, p. 9.495 Power of Choice is a suite of reforms led by the COAG Energy Council and designed by the AEMC. The package is intended
to improve the energy industry’s responsiveness to consumer needs. Amongst other things, the reforms aim to provide more information to consumers via the rollout of smart meters and competitive metering services, and to facilitate consumers being exposed to more direct price signals via cost-reflective network pricing. Major elements of the reforms came into effect in 2017.
496 EnergyAustralia, Submission to ACCC Preliminary Report, 28 November 2017, p. 8.

229 Retail Electricity Pricing Inquiry—Final Report
One retailer indicated that the industry-wide cost of preparing for Power of Choice could be estimated to be over $250 million. Coordinated industry reforms such as Power of Choice may ultimately more than justify the upfront costs incurred by retailers and other parties, but they also demonstrate the cost and the degree of change that the industry undertakes to stay compliant with regulations.
Overall regulatory complexity
Finally, a number of retailers noted that, in general, electricity regulations are unnecessarily complex. Both the NECF and the Victorian Energy Retail Code (Victorian Code) were criticised for being difficult to navigate and confusing to apply, adding further unnecessary costs.
One retailer noted as a specific example that the Victorian Code is often modified by Orders in Council that are released in Special Gazettes. These can override each other and can be difficult to navigate.
As recommended in chapter 12, the standing offer and standard retail contract should be abolished in non-price regulated regions and replaced with a default market offer, priced at or below the level determined by the AER. This will remove some of the rigidity in the regulatory framework, leading to a decrease in regulatory costs.
In addition, as recommended in chapter 17, the COAG Energy Council should undertake a review of the effectiveness of the NECF five years after the implementation of the Inquiry recommendations.
10.2.4 Outcomes for costs to serveThe measures identified above will serve to reduce CTS over time. The ACCC acknowledges that many of these changes are not trivial and will have implementation costs of their own. However, the weight of evidence available to the ACCC suggests that the long-term benefits of such measures would very likely outweigh the significant costs of current regulatory inefficiency.
10.3 Cost to Acquire and Retain (CARC)As with CTS, in order to assess the drivers of CARC, we collected data from retailers to examine the differences in CARC between states and between different retailers. For 2016–17, we obtained information from retailers on their six largest categories of CARC. Again, this analysis has been complemented by submissions from, and meetings with, retailers.
10.3.1 CARC on a state-by-state basisFigure 10.6 illustrates the variation in CARC by state for the mainland NEM regions for 2016–17, with Victoria ($59 per customer) having the highest cost per customer compared to South Australia with the lowest costs ($42 per customer). Figure 10.6 also shows the switching rates for each region. There is a positive correlation between switching rates and CARC, suggesting that high levels of switching result in an overall increase in CARC in a region.
The direction of causation here is likely to be two-directional: more CARC activity may promote more switching, but more switching may also promote efforts by retailers to retain existing customers.

230 Retail Electricity Pricing Inquiry—Final Report
Figure 10.6: Switching rates versus CARC, 2016–17, $ per residential customer, excluding GST
0
5
10
15
20
25
30
0
10
20
30
40
50
60
70
CARC (LHS)
$/c
usto
mer
% o
f cu
sto
mer
s
$42
15%
South Australia
$45
19%
South east Queensland
$46
19%
NSW
$49
20%
Competitive markets
Victoria
$59
26%
Switching rate (RHS)
35
Source: ACCC analysis based on retailers’ data.
Note: ‘Competitive markets’ is the average of Victoria, NSW, south east Queensland, and South Australia.
10.3.2 CARC by tier of retailerFigure 10.7 illustrates the differences in CARC between the big three and other retailers. The very significant difference between the big three and other retailers (in terms of CARC per residential customer) are to be expected given the big three have larger customer bases across which those costs are spread.
The results are, however, reversed when costs are considered on the basis of each acquired customer, with the big three having significantly higher costs than the other retailers. A key driver of this difference is likely to be the very significant investment of the big three in retention activities which are not captured (the data available only considers customer acquisitions, not retentions).497 We would expect that if retention numbers are included, the big three’s costs per residential customer would reduce significantly and may in fact be significantly below the costs of the other retailers.
Figure 10.7: NEM-wide CARC, 2016–17, $ per residential customer and per acquired residential customer, excluding GST
40
87
283
198
0
50
100
150
200
250
300
Big three Other retailers
CARC per customer CARC per acquired customer
$/cu
sto
mer
Source: ACCC analysis based on retailers’ data.
497 See chapter 6 at 6.2.3.

231 Retail Electricity Pricing Inquiry—Final Report
10.3.3 Drivers of CARCAs shown in figure 10.3, over the period from 2007–08 to 2016–17, CARC has increased (in real terms) from $33 to $48 per residential customer, and is forecast to remain at $48 in 2017–18.
In order to better understand the drivers of CARC, we asked retailers to identify their largest categories of CARC costs for 2016–17.498 Retailers reported 50 different categories of CARC costs and while many were similar in nature, there was significant diversity between retailers in the categories reported.
Our key conclusions from the data collected are that:
�� third party channels or aggregators make up a significant proportion of the costs, and a higher proportion in Victoria than elsewhere
�� advertising and marketing costs are also significant, and again these are higher in Victoria than elsewhere.
Based on the data, some retailers are much more heavily reliant on third party acquisition channels than others. It is clear from the data that retailers’ acquisition strategies vary quite significantly.
Third party acquisition channelsIn submissions and meetings, retailers pointed to the costs of third party acquisition channels as being a key driver of the increases in CARC.499 These include commercial comparators, other brokers, door-to-door sellers and other third party acquisition channels.
Energy Locals noted in its submission that it understood ‘some retailers are now paying up to $200 for a single residential electricity customer.’500 This number is consistent with estimates provided by other retailers and internal documents obtained from retailers, with some indicating that a dual fuel (that is, electricity plus gas) customer is considerably more expensive to win through these channels. The information from retailers is also consistent with the reports from commercial comparators themselves. For example, iSelect, one of the largest commercial comparators in Australia, stated in a recent annual report that average revenue in its Energy and Telecommunications division was $210 per sale.501
Commercial comparators remain a popular channel for consumers to seek a new retailer. However, a selection of retailers indicated that the costs have become so high that those acquisitions are close to unprofitable unless the customer remains with the retailer for an extended period (and customers acquired through comparators tend to switch regularly).
Commercial comparator costs in Australia appear to be higher than in other jurisdictions. For example, in 2015 the revenue per switch for commercial comparators in the United Kingdom was in the range of £22–30 ($40–54).502 Anecdotally, we understand that revenues in the United Kingdom remain at similar levels today.
Commissions may in part be lower in the UK as accredited comparators are required to include all available domestic tariffs from all retailers, and must list at least 10 of the cheapest tariffs available.503 This is not the case in Australia for commercial comparators.
10.3.4 Recommendations to reduce CARCThere is an obvious tension when considering ways to reduce CARC while promoting vigorous competition between retailers. Fundamentally, these costs are driven by retailers’ competitive efforts to win and retain customers which ordinarily should be expected to drive efficiencies and lower costs. Indeed, in a submission, AGL identifies ‘[t]he more competitive the market is, the higher the costs a retailer must incur in seeking to effectively retain and grow its customer base.’504
498 We asked retailers to break down their CARC costs into the six largest categories.499 For example, Sumo Power, Submission to ACCC Issues Paper, 30 June 2017, p. 7.500 Energy Locals, Submission to ACCC Issues Paper, 30 June 2017, p. 6.501 iSelect, Investor Briefing Full Year 2017 Results, p. 14.502 Specifically, some comparators received commissions in the range of £22–23, while others received £27–30. House of Commons
Energy and Climate Change Committee, Protecting consumers: Making energy price comparison websites transparent, 28 February 2015, p. 12.
503 Requirement two—Tariffs and price comparisons (A)(i), and Requirement five—Results and filters (A), Revised Ofgem Confidence Code December 2017.
504 AGL, Submission to ACCC Preliminary Report, 19 November 2017, p. 9.

232 Retail Electricity Pricing Inquiry—Final Report
That said, any reduction in acquisition costs will benefit consumers and may enable smaller competitors to compete more vigorously in the market.
The challenge is to identify ways to promote competitive behaviour between retailers, driving lower prices for consumers, while at the same time driving efficiencies in CARC incurred by retailers in undertaking this activity.
Commercial comparators and switching servicesIt is not clear why Australian commercial comparators are so much more expensive for retailer partners than comparators in, for example, the United Kingdom. This cost may be competed down over time, as comparator services vie to entice retailers to use their services, but at this stage commissions remain very high. The ACCC has broader concerns with the conduct of commercial comparators leading to suboptimal outcomes for consumers.
In chapter 14, we outline a number of concerns with the behaviour of commercial comparators and other third party intermediaries, such as automated switching services, connection services and brokers, and recommend that the Australian Government implement a mandatory code to address potential consumer harm.
In chapter 14, the ACCC also recommends changes to the NERL to clarify that third party intermediaries are able to give explicit informed consent for consumers. This, combined with the initiatives outlined in chapter 13 to enhance consumer access to data, will improve the ability of automated switching services to enter and expand across the NEM. Many automated switching services operating in the NEM and other countries charge a subscription fee to switch customers regularly. The ACCC considers that intermediaries operating on a ‘fee for service’ basis are more likely to deliver positive customer outcomes than intermediaries that operate on the basis of commissions paid by retailers. This recommendation is supplemented by a call for sustained funding for awareness raising of government comparator services (see below). These recommendations will help ensure that customers are aware of, and have access to, a full suite of information and services to assist them in navigating the retail electricity market. This is likely to lead to a reduced role for commercial comparators, which will ultimately reduce the amount of commissions charged, thereby reducing CARC.
Limiting wasted acquisition costsA significant amount of CARC could be avoided by reducing save and win-back activity in the market. As discussed in chapter 6, this needs to be a carefully designed intervention because save and win-back offers have a number of pro-competitive, consumer welfare-enhancing aspects. However, much save and win-back activity appears to be a function of a customer base that includes inactive and active customers. Prices paid by inactive consumers tend to be very high while customers who initiate a switch are offered very attractive deals that are not generally advertised in the market. CARC spend is, in effect, duplicated as both the retailer who has temporarily ‘won’ a customer and the retailer who has saved or won back the customer will have incurred costs in this activity.
Reducing these save or win-back events by reducing the viability of this retention-focused strategy should have the effect of limiting this ‘wasted’ CARC spend. As set out in chapter 6, we recommend:
�� removing the advance loss notification to the losing retailer as part of the customer transfer process
�� speeding up the transfer process by enabling a customer to do self-reads when switching retailers.
For the reasons explained in chapter 6, this is likely to reduce retention activity and help to limit CARC spend.
Development of government comparison websitesFinally, sustained funding for advertising and awareness raising campaigns for government comparison websites (as recommended in chapter 14) will increase the use of these websites. This will likely lead to customers switching directly with their preferred retailer, rather than using more expensive channels such as commercial comparators, leading to savings in CARC over time.

Improving consumer experiences and outcomes
03

234 Retail Electricity Pricing Inquiry—Final Report
Key pointsRetail electricity services should be relatively simple for consumers to understand and engage with. However, the behaviour of retailers in marketing and advertising electricity offers has resulted in the market becoming exceptionally complex and impenetrable for many consumers.
In part 3 we outline a number of recommendations to improve the ability for most consumers to engage with the retail electricity market, enabling them to make an informed decision about the electricity retailer and tariff that is best suited to their needs and circumstances.
We have identified six areas where policy changes are necessary:
�� the regulation relating to standing offers and standard retail contracts should be abolished and replaced with an obligation to supply in accordance with an offer (the ‘default offer’) that is priced no higher than a level determined by the AER. The ACCC’s findings on the standing offer are in chapter 12
�� all advertised discounts must be calculated with reference to a common base, to enable consumers to more easily determine which discount offer is likely to lead to lower bills. This common base should be the default offer price set by the AER. Conditional discounts should be no more than the reasonable savings made by the retailer when a consumer meets the conditions. The ACCC’s findings on discounting are in chapter 13
�� consumers must be able to access and, most importantly, authorise third parties to access and use their electricity data on their behalf in order to make informed decisions about electricity services. Access to consumer electricity consumption and tariff data underpins many of the ACCC’s recommendations in part 3. The ACCC’s findings in relation to access to data are in chapter 13
�� the tools that consumers use to navigate the retail electricity market must be improved. Third party intermediaries should be subject to a mandatory code of conduct that ensures good consumer outcomes from the use of these services. The NERL will need to be amended to clarify that third party intermediaries are able to provide explicit informed consent on behalf of consumers. The ACCC’s findings on tools and information that assist consumers to engage with the retail electricity market are in chapter 14
�� support for vulnerable consumers must be improved. Concession and rebate schemes operating across the NEM should be targeted at those most in need, and be consistent across jurisdictions. The Australian Government and the relevant state or territory government should implement sustainable, ongoing funding in each NEM region for consumer and community organisations to provide targeted assistance for vulnerable consumers to improve energy literacy and outcomes. Hardship regulation should be amended to require retailers to proactively engage with consumers. The ACCC’s findings on support for vulnerable consumers are in chapter 15
�� the AER must be given adequate enforcement tools and powers to ensure that it can investigate and deter breaches of energy regulation. At a minimum the COAG Energy Council needs to revise the penalty regimes for the National Energy Laws to bring penalties for provisions that present significant competition impacts or consumer harm to the levels of maximum penalties in the ACL. The ACCC’s findings on market monitoring, and enforcement of energy regulation are in chapter 16.
Implementation of these recommendations, and other recent regulatory changes, should be regularly monitored. Governments should conduct a detailed review of the regulatory framework three years after the ACCC’s recommendations are implemented, and no more than four years after the release of this report, to ensure that they are achieving their intended purposes. The ACCC’s findings on the current regulatory framework are in chapter 17.
In chapter 10 the ACCC recommends that Victoria adopt the NECF to reduce retail costs. As outlined in chapter 17, the ACCC considers that implementing this recommendation will also assist in reducing complexity for consumers across the NEM. If Victoria does not adopt the NECF, the ACCC recommends that the Victorian Government make corresponding changes to the Energy Industry Act 2000 (Vic) and the Victorian Energy Retail Code (Victorian Code) to ensure consistency with the rest of the NEM.

235 Retail Electricity Pricing Inquiry—Final Report
The ACCC has focused on the supply of retail electricity services. However, we note that many of the issues raised in part 3 will apply equally to the sale of retail gas services. Governments should consider the appropriateness of extending the ACCC’s recommendations in chapters 11 to 17 to the supply of retail gas services.
Part 3 of the report focuses on the experience of consumers, or residential customers. Part 4 of this report highlights that small business customers face many of the same challenges and difficulties in comparing offers and engaging with the market, and many of the recommendations in part 3 will benefit any business customers on generally available offers. Where applicable, recommendations in part 3 should be applied to all small customers in the NEM.505
The chapters in part 3 are informed by two pieces of research commissioned by the ACCC:
�� a consumer survey conducted by Colmar Brunton (the Colmar Brunton survey). The ACCC engaged Colmar Brunton to conduct a survey of consumers across the NEM to compare price outcomes for consumers with certain characteristics. The survey collected demographic information in relation to age, income level, household structure, household status, disability, internet usage, and language spoken at home. The survey results were combined with billing data for each respondent that the ACCC obtained from the respondent’s electricity retailers
�� research on energy consumer protection frameworks in other countries undertaken by the Brattle Group (the Brattle report).
The findings from this research are referenced throughout part 3 and the full reports are included as appendix 11 and appendix 12 respectively.
505 The NERL, s. 5, and National Energy Retail Regulations (SA), s. 7 define a small customer as all residential and business customers that consume less than 100MWh per year. Some jurisdictions have a consumption limit for a business customer that differs to the NERL: 40 MWh in Victoria, 150 MWh in Tasmania, and 160 MWh in South Australia. All other states are 100 MWh.

236 Retail Electricity Pricing Inquiry—Final Report
11. Levels of engagementElectricity consumers engage with the retail electricity market in different ways. At one end of the spectrum there are consumers who are actively engaged, regularly seeking out better deals, comparing offers and switching retailers. These highly engaged consumers are more likely to feel confident dealing with retailers to query their bills, ask about products and complain if they are not happy with the service they receive. At the other end of the spectrum are consumers who have not switched retailers, perhaps ever, or for a number of years, and do not actively engage in the market. These consumers are more likely to find it difficult to compare offers and understand the market, and may be less confident in choosing an electricity retailer or offer.
Research for the AEMC’s 2017 Retail Energy Competition Review found that approximately 37 per cent of consumers have not searched for a better offer in the past five years.506 These consumers are likely to be on higher-priced offers than engaged consumers as retailers do not reward loyalty but effectively charge higher prices to consumers who remain with them and do not consider other retailers’ deals (sometimes referred to as a ‘loyalty tax’).
The ACCC’s review of retailer internal documents has indicated that retailers segment consumers based on their level of engagement and understanding of the market, as well as lifestyle, income and type of home and adopt marketing strategies accordingly. For example:
�� one retailer’s internal document sets out a potential strategy for communicating with disengaged consumers to minimise the chance that the customer is prompted to enquire about a better deal: ‘succinct and written in a friendly tone but worded to limit customer responses.’ The ACCC understands this strategy was never implemented.
�� one retailer’s best offers are targeted at high value, dual fuel customers
�� a number of retailers undertake analysis of different postcodes to determine which areas are likely to be high value and focus acquisition strategies in these areas
�� retailers are aware that consumers with certain characteristics engage differently with the electricity market than other consumers (and that certain characteristics tend to indicate which consumers are likely to be higher value)
�� retailers try to adopt strategies to identify how to reach the consumers that are likely to be higher value customers and thus give the retailer the best value
�� retailers are willing to blacklist or ‘fire’ customers if they are likely to lead to more bad debt.
506 Approximately 38 per cent of small business customers have not searched for a new offer in the last five years (Newgate Research, Consumer Research for the Australian Energy Market Commission’s 2017 Retail Competition Review Final Report, April 2017, p. 39).

237 Retail Electricity Pricing Inquiry—Final Report
Figure 11.1: Differing levels of consumer engagement
�
Highly engaged• Considers all modes of advertising• Reviews detail on government comparators to determine underlying rates• Obtains own consumption data to determine best o�er on a regular basis• Most likely to adopt new technology, including solar PV and batteries to reduce costs
�
Relatively engaged• Considers advertising• Considers retailer website information and possibly commercial comparators, cross-checks with government comparators• Intermittently engages with the market
�
Moderately engaged• Considers advertising• Considers retailer information and possibly commercial comparators• Feels confident about making electricity decisions, but may not shop around if they do not consider it worth their time
�
Slightly engaged• Considers advertising only• Generally only engages with the market after seeing marketing or after experiencing bill shock • Unlikely to trust that shopping around will reduce costs
Disengaged• Faces di�culties navigating the market due to social, literacy or other barriers and needs assistance to switch • Has decided that the costs of engaging with the market do not outweigh the benefits of switching
Solar• Generates own electricity—with or without a battery
• May use less electricity than non-solar consumers and generally receives a feed-in tari� from their retailer for any electricity generated by solar panels that isn’t used
• Can fall across all catagories (highly engaged to disengaged)
Source: This is a conceptual overview based on the ACCC’s reading of recent research, submissions and current literature.

238 Retail Electricity Pricing Inquiry—Final Report
There are a number of reasons for consumer disengagement. Consumers may decide that the transaction costs associated with understanding and choosing an electricity offer outweigh the benefits of a lower price. This may be the case for some wealthy individuals and households. Other consumers would like to seek better deals, but find the way that retailers market and describe offers difficult to understand and compare. Some vulnerable consumers, for example those with limited access to the internet or those that face language barriers, may be disengaged because they face difficulties in comparing offers and understanding the information presented by retailers.507
In chapters 12–14, the ACCC outlines recommendations to stop retailers, and intermediaries advertising and marketing on behalf of retailers, from engaging in conduct that creates complexity and confusion to the detriment of consumers. These recommendations will enable many more consumers to make better decisions about the electricity offer that is right for them. In chapter 15, the ACCC outlines recommendations to support vulnerable consumers who face additional barriers to engaging with the retail electricity market.
The ACCC recognises that, regardless of steps taken to improve retailer behaviour and support vulnerable consumers, some consumers will still decide that the costs of engaging with the market do not outweigh the benefits of switching. While the remainder of this report does not focus on those consumers who voluntarily choose to disengage (and can afford to do so), the ACCC’s recommendation to abolish the standing offer and introduce a default tariff that is priced at or below the level set by the AER, will assist these consumers (see chapter 12).
11.1 Strategies to encourage consumer engagementSince the Inquiry commenced, there have been some steps taken to encourage consumers to switch retailers and offers. In particular, in August last year, eight retailers508 made a number of commitments to the Prime Minister to encourage consumer switching. This included a commitment to contact all standing offer and expired benefit customers509 (that were worse off as a result of staying on those offers) to encourage them to switch. Following the meetings between the Prime Minister and retailers, there are approximately 260 000 fewer customers on market contracts with expired benefits.510
The eight retailers also agreed to support a rule change that would require retailers to contact customers prior to a benefit changing or expiring (in a manner similar to the longstanding requirement to contact customers prior to a contract expiring). On 7 November 2017, the AEMC published the final rule,511 and on 18 June 2018, the AER published the final Benefit Change Notice Guidelines512, informed by consumer testing and consumer research. Further detail on this rule and AER guideline are at appendix 3.
While this new rule will assist in encouraging consumers to switch, the end of contract notice requirements are not as detailed or prescriptive as the benefit change notice requirements. Given that these two notices are designed to achieve the same purpose (that is, to encourage consumers to choose a new market offer) the ACCC considers that the same notice should be sent to small customers at both the end of a contract or when a benefit changes. We consider that the efficacy of these two notices should be monitored and measured through enhanced price and market reporting.
Recommendation 29The requirements for notices sent by retailers to customers prior to the end of a contract should be consistent with the new requirements for expired benefit notices.
507 For further detail see Cass Sunstein, ‘Choosing not to choose’, Duke Law Journal, vol 64, 2014, pp. 1–52. On pages 20 to 21 Sunstein states, ‘People might decline to choose for multiple reasons. They might believe that they lack information or expertise. They might fear that they will err. They might not enjoy the act of choosing; they might like it better if someone else decides for them. They might not want to incur the emotional costs of choosing, especially for situations that are painful or difficult to contemplate (such as organ donation or end-of-life care).’
508 The eight retailers are AGL, Alinta, EnergyAustralia, Origin, Momentum Energy, Simply Energy, Red Energy and Lumo Energy.509 Many electricity retailers now offer contracts that continue indefinitely (rather than expiring at the end of a fixed term), but the
discount expires after a ‘fixed benefit period’. Fixed benefit periods are typically 12 or 24 months, but in some cases less.510 Prior to contacting expired benefit customers (that were worse off after the expiry of their benefit), the eight retailers had 643 791
customers. Over time this figure has decreased to just over 375 000.511 AEMC, Rule Determination: National Energy Retail Amendment (Notification of end of fixed benefit period) Rule 2017,
7 November 2017.512 AER, AER Benefit Change Notice Guidelines, 18 June 2018.

239 Retail Electricity Pricing Inquiry—Final Report
Steps taken in Great Britain to encourage switchingOfgem is currently trialling a range of measures to increase market participation in Great Britain, where around 57 per cent of customers with the 10 largest retailers remain on default tariffs (equivalent in concept to standing offers).513 These trials, which have led to small increases in switching rates amongst trial participants514, include:
�� disengaged customer database—a sample of disengaged customers on default tariffs (standing offers) received either one letter from Ofgem showing three cheaper offers or up to six marketing emails from different retailers515
�� cheaper market offers letter trial—consumers with two particular retailers that were on default tariffs either received a letter from Ofgem or from their current retailer that displayed three cheaper tariffs offered by rival retailers (based on their consumption)516
�� check your energy deal—this trial provided the information in the cheaper market offer letter trial digitally. Consumers entered a small amount of information into a website (postcode, address and retailer) and were provided with a small number of cheaper, personalised deals.517
The ACCC has considered Ofgem’s trials, and whether adoption of similar initiatives in the NEM would improve consumer outcomes. While Ofgem’s trials have led to some consumer switching, it is not clear how successful similar measures would be in the NEM, particularly given the relatively low number of consumers on standing offers here. The ACCC considers that both the benefit change and the end of contract notices that retailers are currently required to send to consumers will have a similar impact and therefore does not recommend implementing Ofgem’s measures in the NEM.
513 Ofgem, Standard variable tariffs: Latest trends at September 2017, 20 December 2017, viewed 22 May 2018, https://www.ofgem.gov.uk/publications-and-updates/standard-variable-tariffs-latest-trends-september-2017.
514 The Behavioural Insights Team, BX2018: Helping people save on their energy, viewed 12 June 2018, https://www.behaviouralinsights.co.uk/bx2018/bx2018-helping-people-save-on-their-energy/.
515 Consumers who received a letter from Ofgem had a switching rate of 12.1 per cent. Consumers who received letters from other retailers had a switching rate of 13.4 per cent (Ofgem, Small scale Database trial, November 2017, pp. 3–5).
516 Ofgem, Cheaper Market Offers Letter Trial: Research Results, 24 November 2017, p. 3.517 Ofgem, Private Beta Digital Trial—Early Findings & Insight, February 2018.
https://www.ofgem.gov.uk/publications-and-updates/standard-variable-tariffs-latest-trends-september-
240 Retail Electricity Pricing Inquiry—Final Report
12. Standing offer
Key points�� In non-price regulated jurisdictions, the standing offer and standard retail contract are no longer
fit for purpose. The standard retail contract is not operating as an effective default offer, nor is it delivering essential consumer protections that justify the high price of the offer.
�� In recent times, standing offer prices have often been set at a high level to enable retailers to advertise high headline discounts for market offers.
12.1 Evolution of the standing offerRetailers may offer consumers two types of contracts, a market retail contract and a standard retail contract.
Retailers must publish, on their websites, a standard retail contract for all distribution zones in NEM regions that they operate in.518 Retailers’ standard retail contracts must adopt the model terms and conditions in the National Energy Retail Rules (NERR) or, in the case of Victoria, be approved by the ESC Victoria.519 Each consumer has a designated retailer that is required to offer to supply them under the retailer’s standard retail contract (obligation to supply).520 The concept of a designated retailer is described in detail at section 12.3.1. The obligation to supply applies in relation to all small customers (residential and small business) and is an essential obligation to allow consumers and small businesses to access an offer from at least one retailer. The standing offer is the offer to supply in accordance with the standard retail contract at the price set by the retailer.
Prior to the introduction of competition in the NEM, governments set retail electricity prices. Following privatisation, state and territory governments required incumbent retailers to offer to supply electricity under a regulated standing offer as a transition measure to allow consumers to adjust to the new competitive market.
Governments retained standing offers after price regulation was removed to provide a safety net for consumers who had not engaged in the market, or for consumers who face barriers to accessing a market offer due to credit issues or other reasons. The standing offer was also used as a default offer for consumers who are switched following a retailer of last resort event.521 Given the role of a standing offer as a default safety net offer, the standard retail contract includes some additional consumer protections that are not required in all market retail contracts, such as access to paper billing, minimum periods before bill payment is due, a set period for reminder notices, and no more than one price change every six months.522
518 NERL, s. 25(1); Electricity Industry Act 2000 (Vic), s. 35; Victorian Code, cl. 15A, 15B.519 NERL, s. 25(3); Electricity Industry Act 2000 (Vic), s. 35; Victorian Code, cl. 12.520 NERL, s. 22(1); NERR, r. 16; and Victorian Code, cl. 16.521 A retailer of last resort event (for example, suspension from the wholesale market by AEMO) occurs when there is a retailer failure.
In the event of a retailer failure, provisions in the NERL are designed to ensure customers continue to receive supply by transferring the customers of the failed retailer to the nominated retailer of last resort (NERL, ss. 122, 140; Electricity Industry Act 2000 (Vic), ss. 49(D)(1), 49(D)(5)).
522 Under the NERL and NERR, the standing offer protections include:�� an obligation on the designated retailer to make the standing offer available to eligible customers (NERR, r. 16), retailers may not vary their standing offer tariffs more than once every six months, and must publish the new tariffs on their website and in a newspaper at least 10 days before they take effect (cl. 8.2 of the model terms and conditions, schedule to the NERR)�� the minimum pay by date for a bill can be no earlier than 13 business days from the bill issue date (NERR, r. 26), and the minimum pay by date for a reminder notice can be no earlier than six business days from the issue of the notice (NERR, rr. 108, 109)�� access to bill smoothing arrangements and at least one bill every 100 days (NERR, rr. 23–24), unless the customer agrees to a different billing cycle (NERR, r. 24). Retailers must also provide a customer with a paper copy of the bill�� restrictions on the use of security deposits (NERR, rr. 39–45) and late payment fees in some jurisdictions (cl. 13 of the model terms and conditions, schedule to the NERR).

241 Retail Electricity Pricing Inquiry—Final Report
12.1.1 Standing offer pricesEven though the standing offer is no longer a regulated price ceiling in many NEM regions, it is generally the highest priced offer in the market. This would not be so problematic, especially given that the standard retail contract contains additional consumer protections, if the difference between the lowest price market offer and the standing offer was not so high. The high tariffs associated with such standing offers are sometimes referred to as a ‘loyalty tax’ that is imposed on consumers who remain on, or end up on, a standing offer.523
The AEMC has found that in NEM regions where consumers have a choice of retailer, the difference between the median standing offer and the best market offer for a representative consumer was between $273 (in the ACT) and $832 (in South Australia).524 Figure 12.1 shows the gap between the median standing offer and the best market offer in five distribution zones over time.
Figure 12.1: Gap between the median standing offer bill and lowest price market offer bill in Canberra, Sydney, Melbourne, Brisbane, Adelaide (2016–18)
$/y
ear
0
100
200
300
400
500
600
700
800
900
2016 2017 2018
Evoenergy Ausgrid Citipower Energex SAPN
383
312
256
140113
832
574
504
365
273
Source: AEMC, 2018 Retail Energy Competition Review Final Report, June 2018, p. 76; AEMC, 2016 Retail Energy Competition Review Final Report, June 2016, pp. 17, 20, 23, 25.
Figure 13.4 in chapter 13 shows the difference in average effective unit charges for standing offers and market offers in Victoria in 2016–17. Figure 12.2 shows how the gap between a retailer’s standing offer and its lowest price market offer has widened since 2014.
523 See for example, CALC, Submission to ACCC Issues Paper, 3 July 2017, pp. 2–3; Powershop, Submission to Review of Electricity and Gas Retail Markets in Victoria, 20 February 2017, p. 2.
524 In early 2018, the difference between the median standing offer and the best market offer for a representative consumer in other NEM regions was $574 in Victoria, $504 in south east Queensland and $365 in NSW (AEMC, 2018 Retail Energy Competition Review Final Report, June 2018, p. 76).
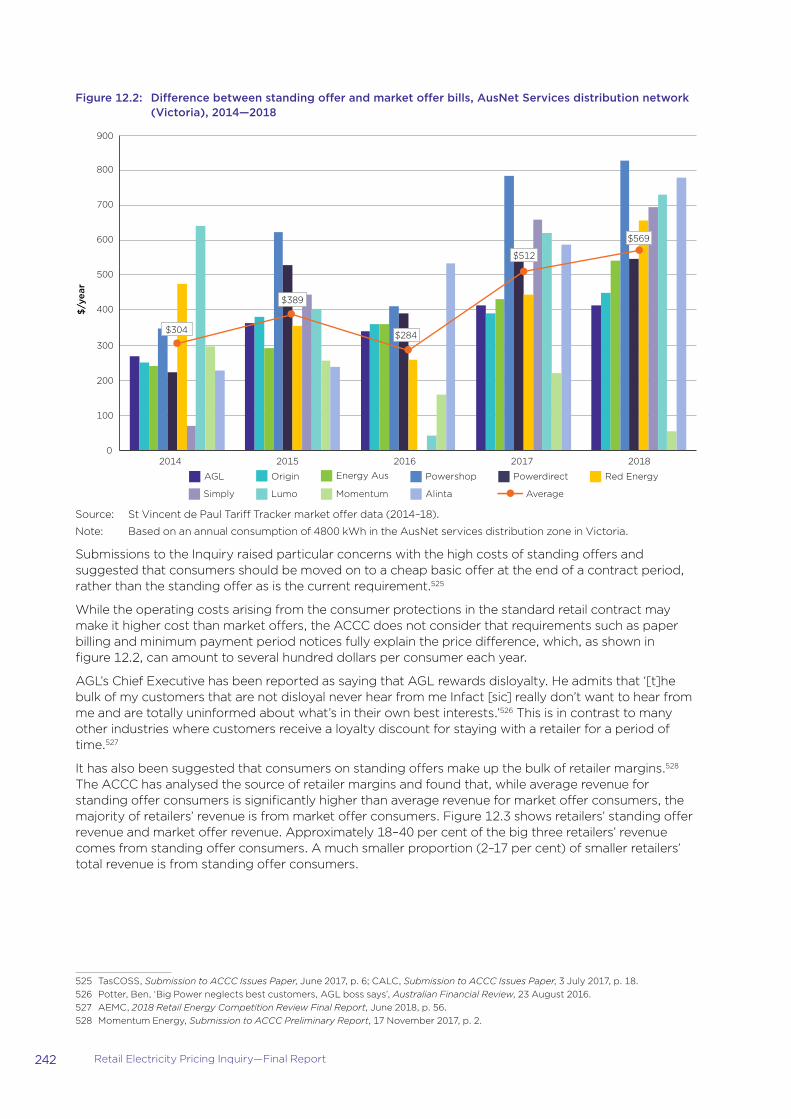
242 Retail Electricity Pricing Inquiry—Final Report
Figure 12.2: Difference between standing offer and market offer bills, AusNet Services distribution network (Victoria), 2014—2018
$304
$389
$284
$512
$569
0
100
200
300
400
500
600
700
800
900
2014 2015 2016 2017 2018
Powershop Powerdirect Red Energy Energy Aus Origin AGL
Alinta Momentum Lumo Simply Average
$/y
ear
Source: St Vincent de Paul Tariff Tracker market offer data (2014–18).
Note: Based on an annual consumption of 4800 kWh in the AusNet services distribution zone in Victoria.
Submissions to the Inquiry raised particular concerns with the high costs of standing offers and suggested that consumers should be moved on to a cheap basic offer at the end of a contract period, rather than the standing offer as is the current requirement.525
While the operating costs arising from the consumer protections in the standard retail contract may make it higher cost than market offers, the ACCC does not consider that requirements such as paper billing and minimum payment period notices fully explain the price difference, which, as shown in figure 12.2, can amount to several hundred dollars per consumer each year.
AGL’s Chief Executive has been reported as saying that AGL rewards disloyalty. He admits that ‘[t]he bulk of my customers that are not disloyal never hear from me Infact [sic] really don’t want to hear from me and are totally uninformed about what’s in their own best interests.’526 This is in contrast to many other industries where customers receive a loyalty discount for staying with a retailer for a period of time.527
It has also been suggested that consumers on standing offers make up the bulk of retailer margins.528 The ACCC has analysed the source of retailer margins and found that, while average revenue for standing offer consumers is significantly higher than average revenue for market offer consumers, the majority of retailers’ revenue is from market offer consumers. Figure 12.3 shows retailers’ standing offer revenue and market offer revenue. Approximately 18–40 per cent of the big three retailers’ revenue comes from standing offer consumers. A much smaller proportion (2–17 per cent) of smaller retailers’ total revenue is from standing offer consumers.
525 TasCOSS, Submission to ACCC Issues Paper, June 2017, p. 6; CALC, Submission to ACCC Issues Paper, 3 July 2017, p. 18.526 Potter, Ben, ‘Big Power neglects best customers, AGL boss says’, Australian Financial Review, 23 August 2016. 527 AEMC, 2018 Retail Energy Competition Review Final Report, June 2018, p. 56.528 Momentum Energy, Submission to ACCC Preliminary Report, 17 November 2017, p. 2.
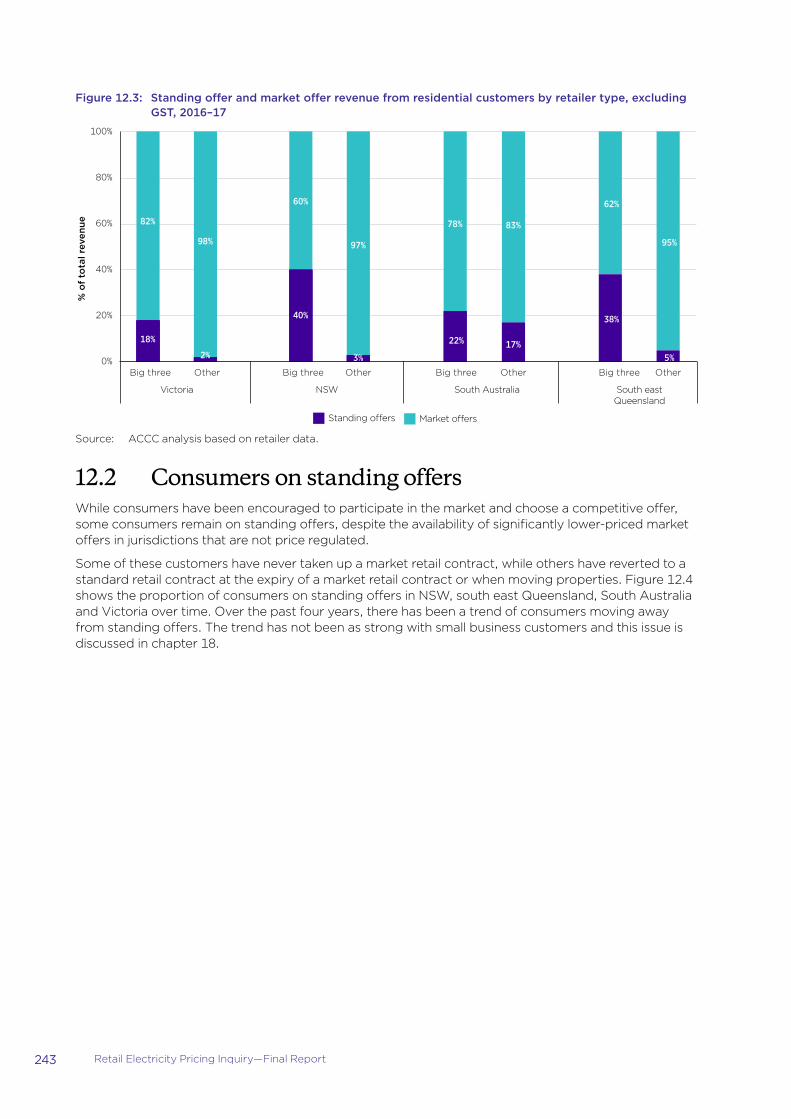
243 Retail Electricity Pricing Inquiry—Final Report
Figure 12.3: Standing offer and market offer revenue from residential customers by retailer type, excluding GST, 2016–17
83%82%
18%
98%
2%
60%
40%
97%
3%
78%
22% 17%
62%
38%
95%
5%0%
20%
40%
60%
80%
100%
Market o�ersStanding o�ers
Victoria NSW South Australia South east Queensland
Other
% o
f to
tal r
even
ue
Big three OtherBig threeBig three Other Big three Other
Source: ACCC analysis based on retailer data.
12.2 Consumers on standing offersWhile consumers have been encouraged to participate in the market and choose a competitive offer, some consumers remain on standing offers, despite the availability of significantly lower-priced market offers in jurisdictions that are not price regulated.
Some of these customers have never taken up a market retail contract, while others have reverted to a standard retail contract at the expiry of a market retail contract or when moving properties. Figure 12.4 shows the proportion of consumers on standing offers in NSW, south east Queensland, South Australia and Victoria over time. Over the past four years, there has been a trend of consumers moving away from standing offers. The trend has not been as strong with small business customers and this issue is discussed in chapter 18.

244 Retail Electricity Pricing Inquiry—Final Report
Figure 12.4: Residential customers on standing offers in non-price regulated jurisdictions, 2014–17
36%
30%
25%
21%
18%
26%
22%
19%
16% 15%14%
12%11%11%
10%
9% 7%
0%
10%
20%
30%
40%
Jun 2014 Jun 2015 Jun 2016 Jun 2017 Dec 2017
Victoria NSW South Australia South east Queensland
% o
f cu
sto
mer
s
Source: ACCC analysis based on AER data; ESC Victoria data.
Note: The dotted lines indicates a six-month gap between figures (rather than 12 months). Figures for Victoria for December 2017 are not included as the ESC Victoria only reports annually. Figures for south east Queensland prior to June 2016 are not included as reporting to the AER for Queensland only commenced in the 2015–16 financial year.
12.2.1 Characteristics of consumers on standing offersIt is often suggested that, as the standard retail contract contains a number of consumer protections, standing offer consumers are more likely to be vulnerable consumers. The ACCC has collected and analysed data to determine whether a number of identified groups of consumers with characteristics associated with vulnerability are more or less likely to be on standing offers.
Figure 12.5 shows the proportion of consumers in non-price regulated jurisdictions that are on payment plans and hardship schemes who are also on standing offers. Approximately 8 per cent of hardship and payment plan consumers across the NEM are on standing offers, compared to 16 per cent of residential consumers that are not on a payment plan or hardship program. This suggests that these particular vulnerable consumers are less likely to be on standing offers than other consumers. This may be because consumers on hardship and payment plans have a greater incentive to find better priced market offers or it may be that retailers who engage with consumers to place them on hardship and payment plans also take steps to help these consumers move to market offers. We note this is only one indicator of vulnerability, and there are potentially many vulnerable consumers that are not on payment plans or in retailer hardship schemes.

245 Retail Electricity Pricing Inquiry—Final Report
Figure 12.5: Residential non-solar customer numbers on standing offers by customer type as at 30 June 2017
4%
13%
5%
8% 8%
8%
21%
14%
21%
16%
0%
5%
10%
15%
20%
25%
Victoria NSW South Australia South east Queensland
NEM
Hardship and payment plan customers All other customers
% o
f cu
sto
mer
s
Source: ACCC analysis based on retailer data.
Figure 12.6 shows the break-down of the average supply and usage charges for standing offer bills and market offer bills. This shows that, in all NEM regions where price is not regulated, consumers on discounted market offers pay a lower price than standing offer consumers. In most NEM regions the undiscounted market offer unit charge is similar to the unit charge for standing offers.
Figure 12.6: Average effective unit charge (c/kWh) (before concessions) attributed to supply and usage charge for residential non-solar survey respondents by NEM region (market offers and standing offers) (excluding regional Qld, Tas and ACT)
c/kW
h
0
5
10
15
20
25
30
35
40
45
SAVic NSW SE Qld
UsageSupply Discount
SAVic NSW SE Qld
Standing o�er Market o�er
67%
33%
69%
31%
72%
28%
69%
31%
63%
37%
57%
43%
82%
18%
78%
22%
Source: ACCC analysis based on Colmar Brunton survey data and retailers’ data.
The survey data also shows 9 per cent of households with an income of less than $25 000 per annum and 8 per cent of households with an income higher than $75 000 are on standing offers, which is higher than the average (7 per cent) (figure 12.7). We note that the proportion of consumers surveyed who are on standing offers was lower than the NEM average, and the proportion of standing offer consumers in all target groups may be higher than indicated here.
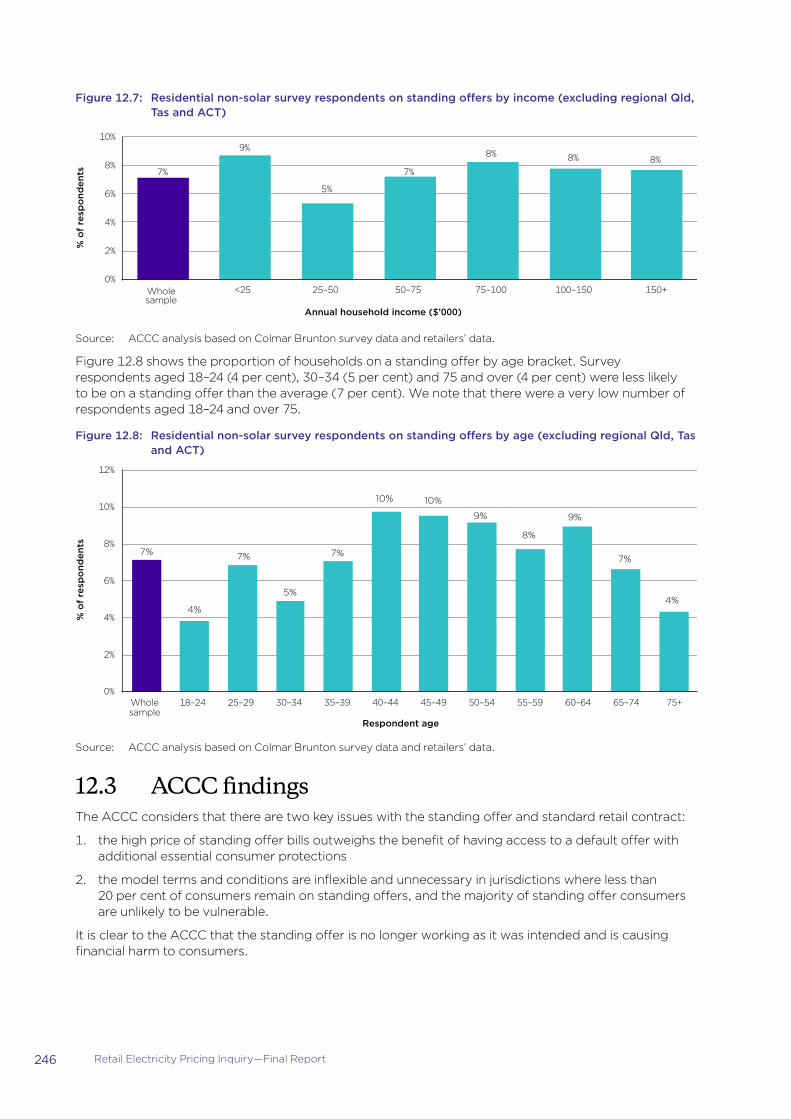
246 Retail Electricity Pricing Inquiry—Final Report
Figure 12.7: Residential non-solar survey respondents on standing offers by income (excluding regional Qld, Tas and ACT)
7%
9%
5%
7%
8% 8% 8%
0%
2%
4%
6%
8%
10%
Wholesample
<25 25–50 50–75 75–100 100–150 150+
Annual household income ($’000)
% o
f re
spo
nden
ts
Source: ACCC analysis based on Colmar Brunton survey data and retailers’ data.
Figure 12.8 shows the proportion of households on a standing offer by age bracket. Survey respondents aged 18–24 (4 per cent), 30–34 (5 per cent) and 75 and over (4 per cent) were less likely to be on a standing offer than the average (7 per cent). We note that there were a very low number of respondents aged 18–24 and over 75.
Figure 12.8: Residential non-solar survey respondents on standing offers by age (excluding regional Qld, Tas and ACT)
0%
2%
4%
6%
8%
10%
12%
Wholesample
18–24 25–29 30–34 35–39 40–44 45–49 50–54 55–59 60–64 65–74 75+
% o
f re
spo
nden
ts
Respondent age
7%
4%
7%
5%
7%
10% 10%
9%
8%
9%
7%
4%
Source: ACCC analysis based on Colmar Brunton survey data and retailers’ data.
12.3 ACCC findingsThe ACCC considers that there are two key issues with the standing offer and standard retail contract:
1. the high price of standing offer bills outweighs the benefit of having access to a default offer with additional essential consumer protections
2. the model terms and conditions are inflexible and unnecessary in jurisdictions where less than 20 per cent of consumers remain on standing offers, and the majority of standing offer consumers are unlikely to be vulnerable.
It is clear to the ACCC that the standing offer is no longer working as it was intended and is causing financial harm to consumers.
247 Retail Electricity Pricing Inquiry—Final Report
The ACCC considers that amendments should be made to abolish the standard retail contract, and require designated retailers to supply electricity to customers under a default offer on request, or in circumstances where the consumer otherwise does not switch to a market offer. The default offer should contain specific consumer protections, and be priced at or below a level set by the AER.
12.3.1 Obligation to supplyThe ACCC considers that it is important to maintain the obligation to supply in its current form. Electricity is an essential service and the inability to access supply would have significant consequences for consumers.
While the majority of consumers are able to access competitive market offers, a small cohort of consumers cannot access a market offer for a number of reasons. This could be due to there being limited market offers where they live (for example in rural areas), or that retailers do not wish to serve them due to poor credit history. The obligation to supply is also important to ensure that there is a default provider for new electricity connections.
The current obligation to supply rests on the designated retailer.529 The relevant designated retailer530 will depend on whether the consumer has an existing electricity connection:
�� Financially responsible retailer: where there is an existing network connection, the retailer who was last responsible for the connection cannot refuse to supply electricity to that premises under its standing offer. For instance, if a house was rented and new tenants move in, the previous tenants’ retailer would be obliged to supply the new residents under the standing offer. Therefore retailers must publish a standing offer for all distribution zones where they operate.
�� Local area retailer: where there is no previous connection, the local area retailer (usually one of the big three retailers) cannot refuse to connect and supply electricity under its standing offer. This usually covers the connection for new houses or where a property is connected to the grid for the first time.
The ACCC has considered whether the obligation to supply should be extended to all retailers and has found that there would be a number of risks with doing this. For example, a retailer cannot take on a customer load that they cannot cover through market trades. If a retailer cannot increase its load beyond its current ability to meet credit requirements they could be forced into financial insecurity.
While extending the obligation to supply would provide some consumers with a wider choice of retailers, it would significantly increase costs for smaller retailers that do not have an established customer base in a region. This may compel them to supply consumer segments in circumstances where they are not able to accommodate the risk of doing so.
The ACCC considers that the obligation to supply should continue to be placed on designated retailers only. The number of households that a retailer is ‘designated’ for increases with the market share of the retailer and we consider that this is the appropriate way to apportion the potential costs associated with supplying consumers that may be a higher credit risk to the retailer.
While the ACCC considers the obligation to supply to be essential, it does not need to be attached to the standard retail contract. The rigidity of the standard retail contract is both unnecessary to ensure that consumers have access to essential consumer protections, and costly for retailers to maintain.531
12.3.2 Need for a default offerThe standing offer currently acts as a default offer for consumers where they have never chosen a retailer, where they do not select a new offer prior to the end of a market retail contract, and where they are switched during a retailer of last resort event.
The standing offer prices for the local area retailer for a NEM region also act as a price ceiling for operators of exempt networks located in that NEM region.532
529 NERL, s. 22(1); NERR, r. 16; Victorian Code, cl. 16.530 NERL, s. 2.531 For instance, in Victoria, retailers are required to publish their standing offer prices in the Victorian Government Gazette which can
cost thousands of dollars.532 AER, Retail Exempt Selling Guideline version 5.0, March 2018, p. 37, appendix A-2, condition 7.

248 Retail Electricity Pricing Inquiry—Final Report
Importantly, the NERL provides that retailers are able to switch a consumer, without their explicit informed consent, to a standard retail contract in circumstances where the consumer has not chosen a new market contract prior to the expiry of their current one, or is switched through a retailer of last resort event.533
The ACCC considers that there remains a need for each retailer to maintain a default offer to ensure that consumers are able to identify which offer they have been shifted to. A default offer is also important to ensure that there is a relatively ‘safe’ offer for consumers to be switched to in circumstances where they are not providing consent to the switch.
The ACCC considers that there is significant risk in enabling retailers to select a market offer to switch a consumer to, as market offers contain many terms and conditions that could be suitable to some consumers but unsuitable to others (for example, an offer with a pay on time discount would be unsuitable for a consumer that is not able to pay their bills on time).
12.3.3 Consumer protections in the default offerAs noted above, the standard retail contract contains a number of consumer protections that are not required in all market offers, such as paper billing, minimum payment periods, a set period for reminder notices, and no more than one price change every six months.
The ACCC considers that retailers’ default offers should include a number of these protections. The ACCC considers that the default offer should include the following protections (that are currently included in the NERR):
�� simple pricing—no conditional discounts and no additional fees or charges (including early termination fees)
�� guaranteed access to paper bills at no additional cost to the consumer
�� a minimum period of 13 business days to make payment after a bill is issued or six business days after a bill reminder is issued
�� access to a bill smoothing arrangement that enables consumers to budget and plan for electricity bills.
The ACCC considers that the additional regulation relating to the standing offer is unnecessary and should be removed to reduce the regulatory burden on electricity retailers. In particular, the ACCC considers that the restriction on changing standing offer prices more than once every six months and the obligation to publish standing offer prices in newspapers and the Victorian Government Gazette can be removed, if the ACCC’s recommendations are adopted. The ACCC recognises the importance of stable pricing to many consumers, but considers that certainty and stability will be provided through the regulated price set by the AER.
The ACCC notes that some consumer protections are provided in market offers, even without a regulatory requirement to do so. For example, all of Momentum Energy’s offers do not include discounts, additional charges or exit fees,534 AGL and Aurora Energy have recently launched prepaid services535, EnergyAustralia’s Secure Saver plan fixes energy prices for two years536 and Origin’s Secure Saver plan has fixed charges for 12 months.537
However, there is no guarantee that retailers will continue to offer these terms and conditions in the future, or that retailers will not impose restrictions on access to these products (for example, requiring consumers to be debt-free). The ACCC is concerned that some consumer protections in market offers may be short-term and designed to respond to current policy settings and pressures. In this regard we note that in 2017 retailers took steps to support concession consumers in Victoria. An internal document from one retailer states that this was implemented in part to support vulnerable consumers and in part to ‘manage risk around growing scrutiny into Victorian margins from government and
533 NERL, ss. 38(1), 54(2), 140(1).534 Momentum Energy, Great Energy Rates, viewed 21 May 2018, https://www.momentumenergy.com.au/residential/gas-electricity-
prices/great-energy-rates.535 AGL, AGL Prepaid, viewed 21 May 2018, https://campaign.agl.com.au/landing/residential/prepaid-tl/?webid=PrepaidAQValue1;
Aurora Energy, Pay as you go, viewed 21 May 2018, https://www.auroraenergy.com.au/your-home/aurora-pay-as-you-go.536 EnergyAustralia, Secure Saver, viewed 28 May 2018, https://www.energyaustralia.com.au/home/electricity-and-gas/understand-
electricity-and-gas-plans/secure-saver.537 Origin, One Low Rate, viewed 21 May 2018, https://www.originenergy.com.au/for-home/campaign/one-low-rate.html.

249 Retail Electricity Pricing Inquiry—Final Report
consumer groups, potentially leading to re-regulation.’ It is not clear that these efforts to support vulnerable consumers would continue if there was no longer a government focus on electricity.
The ACCC considers that the default offer outlined in this chapter must include simple pricing, minimum payment periods, and access to bill smoothing and paper bills to ensure that consumers continue to be able to access these if retailers stop offering them in market retail contracts.
12.3.4 Price of the default offer set by the AERAs outlined above, one of the key concerns with the standing offer and standard retail contract is the price attached to the standard retail contract. While it is expected that a competitive market will result in ‘sticky’ customers paying more than consumers who regularly switch, the significant gap between standing offer bills and market offer bills has become excessive and is causing harm to consumers on standing offers. While the ACCC’s recommendations to address confusing discounting practices will go some way to addressing this issue, without further policy intervention there will remain an incentive for retailers to inflate standing offer prices for those consumers that remain disengaged. As these customers are unlikely to change providers in any event, offering lower prices to these consumers would simply be giving up margin.
The ACCC considers that a direct price intervention is required to counter retailers’ incentives to inflate standing offer prices and take advantage of consumers who are not engaged. The ACCC considers that the NERL should be amended to empower the AER to set the maximum price for default offers in each distribution zone.
This will have two benefits:
�� it will act as a cap for the price of default offers to limit the ‘loyalty tax’ that is levied on disengaged consumers
�� it will be used to calculate a reference bill amount which all discounts must be taken from (see recommendation 32 in chapter 13).
The ACCC has considered the approach that should be taken to setting the maximum price of the default offer, including whether the default offer price should enable retailers to recover customer acquisition and retention costs (CARC). The default offer should not exist to be the lowest price, or close to the lowest price in the market. Its purpose is to act as a fallback position for the disengaged or for those that require its additional protections. Ideally, it should only be utilised by a small number of consumers. It must be set above the price for competitive market offers to avoid incentivising consumer disengagement. For these reasons, the ACCC considers that the AER should calculate the default offer price in each distribution zone based on the efficient costs of operating in each jurisdiction, including the costs of supplying an offer with additional consumer protections, such as paper billing and bill smoothing. This should include a reasonable margin as well as an allowance for CARC.
The default offer is, in a sense, a premium offer with additional safeguard features that come at a cost. This will result in a price that is higher than the lowest priced offers in the market, but is much lower than current standing offer prices. The ACCC considers that this price should be between the median market offer price and median standing offer price, and closer to the median market offer price, but notes that this will ultimately be a matter for the AER. The ACCC notes that it may be argued that some costs of competition should not be recovered from consumers on default offers and the price should be set in a manner similar to prices in Tasmania, the ACT and regional Queensland, where there is little, if any, allowance for CARC. The ACCC disagrees with this position. The default offer should not exist to be a price accessed by most, if not all, consumers in the market. In NEM regions where there is little competition (that is, in Tasmania, regional Queensland and the ACT, and most consumers are on the standing offer) it is appropriate for the regulated price to include little or no CARC. In contrast, in NEM regions where the majority of consumers are on competitive market offers, the default offer price should be set at a higher level. To do otherwise would ignore the costs of customer acquisition being incurred by retailers and would discourage consumer participation and risk significantly increasing consumer disengagement. In this way, the ACCC’s proposed approach is different to the approach taken under the proposed basic service offer (BSO) that is currently being considered by the Victorian Government, outlined in box 12.1.

250 Retail Electricity Pricing Inquiry—Final Report
Box 12.1: Basic service offerUnder the BSO proposed by the Independent Review into the Electricity and Gas Retail Markets in Victoria (Victorian Review), the regulated price would be determined by the regulator and would be based on the efficient cost to run a retail business. It would include an allowance for a maximum retail profit, but would not include CARC or headroom.538 The Victorian Government is currently considering this recommendation.539
As outlined in the Victorian Review final report, a BSO would allow consumers to access an offer that is priced transparently, on an annual basis.540 The Victorian Review also suggests that retailers would still be able to compete around the BSO offer (as retailers would be free to innovate and offer higher or lower prices).541
Advocates for the BSO have also argued that a BSO would provide a ‘yardstick’ that consumers could use in order to get a sense of what is a fair price for electricity, and a BSO would put pressure on retailers to compete on innovation.542 The ACCC received submissions advocating for the return of market-wide price regulation as the best way to address the affordability problems relating to an essential service.543
The ACCC considers that there are significant risks associated with implementing a BSO in Victoria or across the NEM more broadly. This position was supported by a number of submissions to the Victorian Government’s interim response to the Victorian Review as well as in the AEMC’s 2018 Retail Energy Retail Competition Review.544
The ACCC is concerned that implementing a BSO would lead to reduced innovation and act as a disincentive to retailers to adopt new technology or service models. Competition drives such incentives and provides benefits for consumers with new products and improved processes. The retail electricity market is undergoing substantial changes, providing many opportunities for new and improved products and services to be delivered to consumers. It is therefore critical that this opportunity is not foreclosed.
In addition, as a BSO does not include any CARC, it may lead to some retailers exiting the market, leading to fewer options for consumers. The ACCC notes that a similar outcome occurred in France when regulated tariffs were set at a level that other retailers were not able to supply at. The French Government has subsequently removed the price cap.545 While the number of suppliers in the market should not, of itself, be an objective to pursue and protect, the ACCC is of the view that many smaller retailers in this market are at the forefront of innovation and provide improved offerings to consumers.546 There are some signs that retailers are responding to competitive pressures and that some innovation is taking place which may increase as new technology develops further. Examples of recent innovation include smaller retailers partnering with companies like Reposit, which provides software enabling solar consumers to lower their bills and reduce their
538 Thwaites, T, Faulkner, P, and Mulder, T, Independent Review into the electricity and gas retail markets in Victoria, August 2017, p. xi.539 Department of Environment, Land, Water and Planning (Victoria), Victorian Government Interim Response: Bipartisan Independent
Review of the Electricity and Gas Retail Markets in Victoria, March 2018, p. 2.540 Thwaites, T, Faulkner, P, and Mulder, T, Independent Review into the electricity and gas retail markets in Victoria, August 2017, p. 54.541 Thwaites, T, Faulkner, P, and Mulder, T, Independent Review into the electricity and gas retail markets in Victoria, August 2017, p. 54.542 CALC, Submission to the Government’s response to the Victorian Review, 3 April 2018, p. 4. 543 ACOSS, Submission to ACCC Preliminary Report, December 2017, pp 11–12; CALC, Submission to ACCC Preliminary Report,
21 November 2017, p. 3. 544 This was particularly evident in submissions to the Victorian Government’s response to the Victorian Review. In general, electricity
retailers were not in favour of the basic service offer or the abolition of the standing offer (see submissions from 1st Energy, AGL, Alinta, EnergyAustralia, ERM Business Energy, Momentum, Powershop, Simply Energy and Sumo Power). Submissions to the Government’s response to the Victorian Review, viewed 17 May 2018, https://www.energy.vic.gov.au/about-energy/policy-and-strategy; AEMC, 2018 Retail Energy Competition Review Final Report, June 2018, p. 17.
545 In France, regulated tariffs were set at such a level that other retailers were unable to compete. Between July 2012 and July 2013, the French Government only allowed the regulated tariffs to increase by a maximum of 2 per cent, though the French Energy Regulatory Commission (CRE) estimated that the residential tariffs should have increased by 5.7 per cent during this period. The partial tariff freeze created a tariff deficit of €422 million for Électricité de France (the French Government-owned electricity company). The partial tariff freeze was also very harmful to alternative retailers. The French Government has since removed the cap (the Brattle Report, appendix 11, pp. 65, 183).
546 As noted by the AEMC, ‘[t]hese smaller retailers have typically been responsible for driving the emerging tariff innovation and value-add product and services competition in the market that has enabled consumers to better manage their energy use and bills.’ (AEMC, 2018 Retail Energy Competition Review Final Report, June 2018, p. iv).
251 Retail Electricity Pricing Inquiry—Final Report
reliance on the grid.547 Another example is where retailers offer rebates when consumers reduce consumption at certain times.548 This innovation is primarily seen among smaller retailers and the ACCC is concerned that the implementation of the BSO may limit further innovation in this market.
Implementing a BSO would also likely have an impact on consumer behaviour. Research conducted on behalf of the ACCC in relation to the experiences of international jurisdictions indicates that, in jurisdictions with price regulation, consumers tend to remain on the regulated offers and do not participate in the market.549 The ACCC considers that if a BSO were implemented in Victoria or the NEM more broadly, many consumers would take the BSO knowing that they were on the best (or one of the best) available offers, and no longer consider it necessary to engage.
The ACCC agrees with the AEMC’s view that while the benefits of competition and price deregulation in the NEM have not materialised for a number of consumers, competition is clearly benefiting those who are engaging in the market and finding deals that suit their circumstances.550 We do not want to inhibit these consumers from achieving good outcomes.
The ACCC considers that electricity markets are still developing and mature retail competition has not yet been achieved in any NEM jurisdiction. We do not consider that implementing a BSO is warranted at this stage and that a number of our other recommendations will provide better outcomes for consumers than price regulation. In particular, our recommendation to implement a default offer would carry with it many of the safeguard elements of a BSO, but would also retain many of the positive aspects of competition.
We consider that price regulation through a BSO should be a last resort if competition has been shown to be incapable of delivering the best outcomes for consumers.
The ACCC’s recommendation of a default offer priced at or below the price set by the AER will result in a price reduction for standing offer consumers in non-price regulated jurisdictions, while allowing retailers to recover the costs of supplying an offer with additional consumer protections. The default offer is unlikely to be one of the cheapest offers in the market, but will limit the ability of a retailer to price so far above cost that it detrimentally impacts on standing offer consumers.
The ACCC considers that this recommendation will have the added benefit of reducing retail costs, as retailers would no longer be required to offer a rigid contract, where price changes must be published in newspapers or the Victorian Government Gazette (in addition to communicating price changes directly to consumers).
The ACCC considers that this approach is preferable to the BSO recommended by the Victorian Review. This approach enables retailers to recover costs and a reasonable retail margin. This will ensure that consumers continue to be incentivised to participate in the market and choose a competitive offer, but are not unfairly penalised for being disengaged. The ACCC considers that this recommendation most appropriately balances the need to maintain essential consumer protections, and reduce the price differential between market offer and standing offer bills. It will reduce the regulatory burden on retailers associated with maintaining the standard retail contract and allow retailers to continue to compete and innovate.
Price regulated jurisdictionsThe recommendations outlined above are relevant to south east Queensland, NSW, Victoria, and South Australia, as these jurisdictions have significant price differentials between standing offer bills and market offer bills.
The standard retail contract will continue to be relevant for jurisdictions with ongoing price regulation (Tasmania, regional Queensland, and the ACT), as in these NEM regions, the standard retail contract is the contract attached to the regulated price. The ACCC considers that the ACT, Tasmanian and Queensland governments will likely need to retain the standard retail contract as part of regulated
547 Reposit Power, viewed 28 May 2018, https://repositpower.com; Powershop, Grid Impact, viewed 28 May 2018, https://www.powershop.com.au/join-grid-impact.
548 Powershop, Demand response—curb your power, viewed 10 June 2018, https://www.powershop.com.au/demand-response-curb-your-power/.
549 The Brattle Report, appendix 11, p. 61.550 AEMC, 2018 Retail Energy Competition Review Final Report, June 2018, p. xiv.
252 Retail Electricity Pricing Inquiry—Final Report
prices. This will require an extension of the derogations that enable the ACT, Queensland and Tasmania to manage their regulated price-setting arrangements. The ACCC notes that the Queensland Competition Authority uses a network plus retail cost build-up approach to calculate notified prices for regional Queensland consumers, and this includes observations from competitive retail and wholesale electricity markets in Australia. The AER may choose to use this approach for setting the price of the default offer in south east Queensland.
Recommendation 30In non-price regulated jurisdictions, the standing offer and standard retail contract should be abolished and replaced with a default market offer at or below the price set by the AER.
�� Designated retailers, as defined in the NERL, should be required to supply electricity to consumers under a default offer on request, or in circumstances where the consumer otherwise does not take up a market offer.
�� The default offer should contain simple pricing, minimum payment periods, and access to bill smoothing and paper bills.
�� The AER should be given the power to set the maximum price for the default offer in each jurisdiction. This price should be the efficient cost of operating in the region, including a reasonable margin as well as customer acquisition and retention costs.
�� The default offer should be used by retailers in all circumstances where a standing offer is currently used. This includes circumstances where a consumer has moved into a premises but has not contacted the retailer, where a consumer has not selected a market offer before the expiry of a market contract, and where a consumer is switched through a retailer of last resort event.
253 Retail Electricity Pricing Inquiry—Final Report
13. Advertising and marketing
Key points�� Access to consumption and tariff data will significantly improve the ability of consumers to select
electricity offers that suit their circumstances.
�� Electricity retailers’ discounting practices are a deliberate tactic to give the impression that an offer is significantly cheaper than other offers in the market when this is often not the case. This behaviour is confusing, at times misleading, and leads to poor consumer outcomes.
�� Advertising using headline discounts does not give the consumer the ability to easily compare offers, or estimate how much they are likely to pay each bill.
�� The practice of offering significant conditional discounts disproportionately affects those less able to pay, and if a condition is not met, the consumer’s annual bill can increase by hundreds of dollars.
�� While there has been a reduction in complaints to energy ombudsman schemes in relation to door-to-door selling since the big three retailers stopped marketing in this way, there are issues with the continued use of this practice by smaller retailers.
�� Throughout the Inquiry, the ACCC has identified instances where retailer conduct may breach the Australian Consumer Law (ACL). The ACCC is separately investigating these matters further.
Consumers face a range of challenges when choosing a retailer and offer. While the underlying product is the same, electricity retailers market in different ways and structure tariffs in a way that is often confusing.
Throughout the Inquiry, we heard many concerns about the way that electricity retailers advertise and market offers, and how it is difficult for consumers to understand or compare offers based on the limited information provided in an advertisement. We have also heard concerns regarding the use of high-pressure sales tactics by electricity retailers to entice consumers to sign up to an offer on the spot, rather than having the time to consider whether the offer suits the consumer’s needs.
Box 13.1: Regulatory frameworkElectricity retailers must comply with obligations in the National Energy Retail Law (NERL), the NERR (which operate under the NERL), and, in Victoria, the Victorian Code. Retailers must also comply with the economy-wide provisions in the ACL, which is a schedule to the Competition and Consumer Act 2010 (Cth) (CCA).
A number of the concerns raised with the ACCC raise issues under the ACL. Where we have identified examples of conduct that are likely to breach the ACL, we have referred them to our Enforcement teams for further investigation. The ACCC is currently investigating a range of advertising and marketing conduct by retailers and third party intermediaries that market on behalf of retailers.
The NERL and NERR build on the ACL with additional energy specific consumer protections, including obligations on energy retailers to comply with specific information and contracting requirements for residential and small business customers who are small customers. The NERL also sets out the framework for market entry—providing for the authorisation of retailers and the exempt selling framework for supply of electricity in Queensland, NSW, the ACT, South Australia and Tasmania. The Victorian energy consumer protection framework includes the Energy Industry Act 2000 (Vic) and the Victorian Code.
As outlined in the ACCC’s Preliminary Report, we have considered both the NERL, NERR and Victorian regulation throughout this Inquiry.

254 Retail Electricity Pricing Inquiry—Final Report
13.1 Importance of consumer dataIncreasing the availability of relevant and personalised electricity consumption and pricing data to consumers and third parties will benefit consumers in many ways. It will facilitate development of new products and services, better inform decision making, enhance consumer and business outcomes (including on price) and facilitate greater efficiency and innovation in the economy.551 Many of the recommendations outlined in part 3 will be enhanced by consumers having improved access to their own electricity consumption and pricing data in a standard format that they can use, or authorise third parties to use on their behalf.
The lack of easily accessible electricity consumption and pricing data, as well as data on available tariffs in the market, is a barrier to the emergence of services that would assist consumers to choose electricity offers that suit their needs.
Steps being taken to make electricity data more accessible will greatly enhance the capacity for consumer engagement with the market and increase competition.
There will be significant benefits for consumers with traditional accumulation meters that record only aggregate consumption data for a period (generally three months), and even greater benefits for households with smart meters that record consumption data throughout the day.
The majority of households in NSW, Queensland, the ACT, South Australia and Tasmania are still metered using accumulation meters which are manually checked periodically (usually quarterly). Households with accumulation meters can only see their aggregate consumption data for an entire period. In contrast, smart meters, which have been rolled out in Victoria, provide richer data, including half-hourly measurements of consumption. As part of the Power of Choice reforms552, retailers are progressively rolling out smart meters in other NEM regions. This smart meter rollout is very important to maximise the benefit from third party electricity data services.
Third parties face substantial barriers in accessing electricity data. These barriers include electricity businesses concerns regarding privacy, complexity of processes required to access data, inconsistency in the format of the data provided by businesses, lack of consumer awareness or understanding of their right to access data and lack of incentives for data holders to disclose data.553 These barriers make it difficult to build viable business models that rely on access to such data. This means that switching services, such as CHOICE’s new Transformer service, rather than accessing a consumer’s full consumption history, analyses bills to calculate an estimated annual saving based on tariff, consumption history, discounts and feed-in-tariff for solar customers. Other companies may spend significant time proving their right to access the electricity data from individual electricity retailers and distributors with inconsistent processes, eroding the timeliness, efficacy and cost-effectiveness of the services provided.
A lack of timely access to complete electricity data can be a point of friction in consumer decision making. This can be a factor in consumers withdrawing from actively making choices at all (which we know typically leads to the worst price outcomes for consumers) or consumers resorting to other poorer sources of information such as retailer advertising or electricity bills which can be confusing and are not in a form which is useful to navigate the market. In any event this is a source of frustration and leads to sub-optimal outcomes for consumers in this market.
On 9 May 2018, the Australian Government announced its response to the Open Banking Report and agreed to the Consumer Data Right (CDR) model proposed in that report. The ACCC was named as the lead regulator for the Consumer Data Right, working closely with the Office of the Australian Information Commissioner and the Data Standards Body.554 Funding for the Consumer Data Right was confirmed in the budget on 8 May 2018.555
551 Productivity Commission, 2017, Data Availability and Use, Report No. 82, 31 March 2017, p. v.552 The Power of Choice package of reforms led by the COAG Energy Council are ‘all about opportunities for consumers to make
informed choices about how they use energy; and incentives for efficient investment so community demand for energy services can be met by the lowest cost combination demand and supply options.’ (AEMC, Power of Choice, undated, viewed 4 March 2018, https://www.aemc.gov.au/our-work/our-current-major-projects/power-choice).
553 Retailers and distributors have incentives to minimise the cost of providing data, which leads to differences in data formats, and different delivery mechanisms; and concerns that the information may be used to increase a competitor’s market share (Houston Kemp, Facilitating Access to Consumer Electricity Data, A draft report for the Department of Environment and Energy, February 2018, p. i.)
554 Commonwealth of Australia, Department of the Prime Minister and Cabinet, The Australian Government’s response to the Productivity Commission Data Availability and Use Inquiry, 2018, pp. 5–6.
555 Australian Treasurer, Budget 2018–19, Budget Strategy and Outlook, Budget Paper No.1 2018–19, 8 May 2018, pp. 22–3.

255 Retail Electricity Pricing Inquiry—Final Report
The CDR will initially be implemented for the banking sector (where it will be known as ‘Open Banking’), followed by the energy and telecommunications sectors. It will then be rolled out more broadly on a sector-by-sector basis.556 The Consumer Data Right will enable consumers (including businesses) to share their transaction, usage and product data with service providers and comparison services. This right will improve the consumer’s ability to compare and switch between goods and services on offer. The scheme will promote greater competition between service providers, leading not only to better prices for consumers but also to more innovation of products and services.
The COAG Energy Council has also been developing a framework to enhance the availability of and access to electricity data557, and the Energy Security Board is developing a data strategy.558 These initiatives will continue to improve access to data for consumers and third parties by:
�� clarifying the rights and processes for consumers to consent to their data being made available to third parties of their choice, and for third parties to receive this data
�� ensuring that consumers and their data are protected from, and have redress for, unauthorised or inappropriate use
�� building the standards and infrastructure to store, manage and facilitate easy access to electricity data in common and usable format.
Submissions to the COAG Energy Council’s consultation paper on access to data and the Australian Treasury’s Open Banking report argued in support of coordinating rules regarding access to electricity data with the Consumer Data Right.559 The ACCC considers that the CDR will provide a nationally consistent and overarching approach to consumer data initiatives and will provide for the best outcomes for consumers, minimising confusion and creating greater scope for innovation and cross-sectoral opportunities.
The ACCC considers that the overarching framework for accessing standardised and nationally consistent data, as will be provided under the CDR, is essential to consumers being able to make more informed decisions about electricity offers and most importantly, to access third party services that assist them in understanding and choosing electricity offers. It is also essential to maximise the potential for improved competition and productivity in the sector through the development of innovative products and services.
At a minimum, consumers or their authorised representatives should be able to access their data relating to:
1. historical consumption data—the data available will depend on the type of meter the consumer has. The data may be accumulation (for a billing period) or interval (half-hourly data throughout the day)
2. product data—the consumer’s current tariff (including the rates and discounts), as well as data on all generally available retail offers
3. meter data—including the meter type and national metering identifier
4. customer data—including the customer’s contact details.
Consumers would also benefit from being able to access and share information about their distributed energy resources, such as solar PV systems and batteries. Availability of this data is inconsistent. Consideration could be given to bringing this information within a CDR framework but it is unlikely to be practical at this stage. The ACCC recognises that additional complexities arise in relation to data for certain consumers, including those not in the NEM, or in embedded or isolated networks and in relation to gas data. These issues will need to be addressed as part of the CDR implementation. Resolving these
556 Australian Treasury, Consumer Data Right, 9 May 2018, p. iv.557 The COAG Energy Council initiated a project to streamline the processes and facilitate timely access to consumer consumption
data. The Department of the Environment and Energy is co-ordinating this project with the support of consultants, Houston Kemp. Recommendations are expected to go to the COAG Energy Council in mid-2018 (COAG Energy Council, Facilitating Access to Consumer Energy Data—Consultation Paper, 1 March 2018.).
558 The Energy Security Board is developing a strategy and principles to guide strategic thinking on energy data related issues. The data strategy is focused on principles to guide how data is managed, and mechanisms that identify what data, how it is handled, who should have access and where it can be published. The scope of the strategy covers all energy data collected by the regulatory bodies for retail, network and wholesale markets (Energy Security Board, NEM Data Strategy Consultation Paper, 20 March 2018.).
559 Australian Energy Council, Submission to the COAG Facilitating Access to Data Project, 26 March 2018; AGL, Submission to the COAG Facilitating Access to Data Project, 26 March 2018; AGL, Submission to the Open Banking Report, 23 March 2018, Origin, Submission to the Open Banking Report, 23 March 2018.

256 Retail Electricity Pricing Inquiry—Final Report
issues will necessitate the industry and relevant sector regulators working with the CDR regulators (ACCC, the Office of Australian Information Commissioner and Data61).
Below are some examples of the ways that consumers could benefit from improved access to data.
�� Facilitating price comparison and savingsA consumer seeking to find the best electricity offer would be able to authorise an accredited third party data provider to access their electricity data. The accredited provider could use the data to deliver a range of services that could lead to cost savings for the consumer. This could include a comparison of the consumer’s existing offer and consumption patterns to recommend a new offer or tariff structure, comparing household consumption with other similar households or providing personalised advice on energy savings measures (like demand management and appliance replacements).
A UK service, Flipper, uses consumer data to identify the best deal for a consumer and handles the switching process on the consumer’s behalf. Flipper works by extracting consumption data from the consumer’s online energy account, and searching the market to find the best offer, taking into consideration exit fees and discounts. If the best offer saves consumers at least £50, Flipper then starts the switching process on the consumer’s behalf.560
�� Improved bill understandingVELObill in the United States uses Green Button561 data to provide a service for consumers to manage utility costs and change consumption patterns. Using VELObill, consumers can view consumption, compare usage to neighbours or friends, set goals to reduce energy, and evaluate the cost and payback of energy efficiency upgrades.562
�� Make informed decisions about the best products for their needs
A retail business has just faced a doubling of its electricity prices and is looking to install demand management on their cooling and refrigeration as well as solar but cannot determine the appropriate size of system for its electricity needs. Using an online platform, the business is able to identify demand management and solar installation companies, and provide secure access to its electricity data for a limited period of time. Potential suppliers, combining electricity consumption information and information about the business, are able to provide tailored advice and quotes about the size of the system best suited to the company’s needs, an estimated return on investment, and energy management advice.
Recommendation 31The application of the Consumer Data Right to the electricity sector should be pursued as a priority under the Consumer Data Right framework regulated by the ACCC. Consumers and their authorised representatives should have access to at least historical consumption data, product data, meter data and customer data.
560 The Brattle Report, appendix 11, pp. 23, 209–10.561 The Green Button initiative allows electricity consumers easy and secure online access to their personal energy use data. The initiative
involves a standard data format that is available from utilities providers where the Green Button appears. Since the release of the Green Button standard data format, over 140 web applications and 30 mobile applications have been released. These applications include services to identify background electricity use and energy efficiency opportunities within a website allow the consumer to turn off appliances or replace appliances to receive a cost benefit. Applications provide warnings and advice on heating and cooling of household by linking electricity consumption with weather data as well as enhanced billing and energy monitoring applications. Further applications involve comparison of consumption with similar households in the area. These applications are all enabled through a common data standard and commitments from utility companies to make that data available for download (Green Button Alliance, About Us, viewed 31 May 2018, http://www.greenbuttonalliance.org/about).
562 Apps for Energy, VELObill—The utility bill of the future, viewed 16 May 2018, https://appsforenergy.devpost.com/submissions/7930-velobill-the-utility-bill-of-the-future.

257 Retail Electricity Pricing Inquiry—Final Report
13.2 Discounting13.2.1 Discounting practices by retailersThe most common form of competition between retailers is on headline percentage-based discounts.563 This practice has increased in recent years, to the point where discounts advertised by retailers are often upwards of 30 or even 40 per cent, and are being offered across most sales channels.564 This increase in headline discounts has been coupled with retailers inflating the underlying tariffs that discounts are taken from.
The ACCC is aware of strategies by certain retailers to increase discounts to gain customers, and then inflate the underlying tariffs that discounts are taken from, as described in one retailer’s internal document titled, ‘How to win—QLD pricing principles’. This document outlined one retailer’s strategy to win market share in a recently deregulated market. This document stated ‘initial discounting required then price adjusted to optimise margin/retention as customer base grows’. An internal document from another retailer outlines recommendations to minimise discount spend, which included ‘re-introduce multiple price points, introduce certain restrictions on top headline rate (eg excl. solar), cease outbound contact for renewals, continue benefit extension, but at lower rates.’
Retailers’ underlying rates are generally set at or close to the retailer’s standing offer rates. This has led to the situation where the gap between standing offer rates and the cheapest offers in the market has widened over time and there exists significant price dispersion in the market. Figure 13.1 shows the increase in conditional headline discounts in Victoria over time.
Figure 13.1: Conditional headline discounts for single rate residential market offers (Victoria), June 2012 – June 2017
0%
20%
40%
60%
80%
100%
Jun2017
Jun2016
Jun2015
Jun2014
Jun2013
Jun2012
10–20% 30–40%< 10% 20–30%No discount
% o
f fl
at r
ate
mar
ket
o�
ers
Source: ACCC analysis based on 2012–15 ACCC/AER analysis, data accessed 1 June each year from the Victorian Energy Compare website https://compare.switchon.vic.gov.au/; 2016–17 ACCC/AER analysis, Department of Environment, Land, Water and Planning (Victoria) data set.
563 Of the 5940 gas and electricity retail market offers available across the NEM in March 2018, only 20 per cent have no price discounts. Over half of those market offers have at least one conditional discount (AEMC, 2018 Retail Energy Competition Review, June 2018, p.54.).
564 Another retailer’s internal document states that ‘[c]onsumer awareness on price continues to increase across all channels. Historically low discount channels such as Movers are now attracting a discount.’

258 Retail Electricity Pricing Inquiry—Final Report
There is a significant differential between estimated bills for each retailer’s standing offer, so it would be very difficult for a consumer to look at two headline discounts, taken from two retailers’ standing offer prices, to determine which offer will likely lead to lower bills. Table 13.1 shows estimated bills for a medium (2–3 person) household in Adelaide, Sydney and Brisbane. In each city, there is a difference of over $500 in estimated bills between the lowest and highest priced offers.
Table 13.1: Estimated standing offer bills for a medium (2–3 person) household in Adelaide, Sydney and Brisbane
Postcode
Retailer 5000 2000 4000
amaysim Energy $2884 $2563 $1960
Click Energy $2884 $2563 $1960
Dodo Power & Gas $2846 $2372 $1976
EnergyAustralia $2676 $2025 $1902
QEnergy $2557 $2543 $2345
Alinta $2529 $2024 $1800
Lumo Energy $2496 $1938 $1753
Red Energy $2496 $1938 $1753
Momentum Energy $2376 $2044 $1746
Simply Energy $2365 $1920 $1848
AGL $2322 $2004 $1804
Powerdirect $2322 $2004 $1804
Origin $2277 $1974 $1781
Diamond Energy $2218 $2005 $1927
Sanctuary Energy $2122 $1997 $1834
Difference $762 $643 $599
Source: Standing offer estimated bills, calculated using the Energy Made Easy website, offers published as at 11 May 2018.

259 Retail Electricity Pricing Inquiry—Final Report
Box 13.2: Price dispersion—efficient price discrimination or something else?There is a significant amount of price dispersion in each NEM region where price is no longer regulated. If consumers are confused by retailer advertising or marketing, they could end up on an offer that looks like it is competitively priced but is actually significantly more expensive than other offers in the market (see figure 13.2).
Economic literature generally considers price dispersion to be a normal and efficient outcome from competitive markets.565 Further discussion on this is in our Preliminary Report.566
However, as outlined in our Preliminary Report, there is a contrasting view, that price dispersion only reflects information asymmetry and search costs.567
The NEM does not display other characteristics of a well-functioning competitive market, such as low levels of concentration, low margins and price, and a large degree of product differentiation. The ACCC is concerned that price dispersion in the NEM is less a result of efficient price discrimination and more a function of retailers taking advantage of:
1. consumer confusion due to pricing and discounting practices of retailers
2. some consumers being unaware that they will likely be paying more by not actively shopping around and switching (a kind of ‘loyalty tax’)
3. some consumers facing barriers to engagement in the market.
It is in this context that the ACCC has identified concerns about price dispersion in this market and has sought to identify ways to ensure that those consumers who want a good deal for electricity can easily find one, those that face disadvantage can overcome this and only those consumers who actively choose not to engage (because they assess the costs of doing so as greater than the benefits) might end up paying more.
Complexity and confusion created by discounting practicesAs retailers are free to set their underlying tariffs, there is not a simple way for consumers to look at two discounted offers and determine that one will likely lead to lower bills than another. In fact, many consumers may assume that the highest discount will lead to a lower bill, when the bill amount will actually depend on the underlying tariffs and any conditions attached to the discount.
The complexity of discounts arises not only from the way that they are advertised but also from the way that they are structured. Discounts are commonly applied only to the usage component of the bill, but in some cases are applied to the whole bill. Discounts offered by retailers are also frequently conditional in some way, most commonly on the consumer paying their bill on time (pay on time discount). This practice has, at least in part, evolved from restrictions on late payment fees, which were banned in Victoria in 2005 and capped in other NEM regions.568
Some retailers have submitted that discounts are a marketing tool that consumers are able to easily understand, making it simpler for consumers to make decisions about an inherently complex service.569 One retailer, in its internal documents, drew a connection between discounting and increased engagement by consumers in the market, noting ‘[t]he motivation for consumers to consider switching retailers is increasing with the general size of discounts motivating an increasingly large proportion of the market.’ The ACCC agrees with the proposition that consumers understand discounts as a concept, but is concerned that the current approach to discounting in electricity offers is likely to give consumers a false impression about the best offer on the market.
565 Simshauser, P, Whish-Wilson, P, and ‘Price discrimination in Australia’s retail electricity markets: An analysis of Victoria & Southeast Queensland’, Energy Economics vol 62, February 2017, pp. 92–103.
566 ACCC, Retail Electricity Inquiry—Preliminary Report, 22 September 2017, pp. 123–124.567 Independent Competition and Regulatory Commission, Standing offer prices for the supply of electricity to small customers 1 July
2014 to 30 June 2017, Draft report, February 2014, p. 119. 568 Electricity Industry Act 2000 (Vic), s. 40C(1); NERL, s. 24(2)(a). In Tasmania, retailers must waive late payment fees to customers in
certain circumstances (National Energy Retail Law (Tasmania) Act 2012 (Tas), s. 19). 569 Origin, Submission to ACCC Issues Paper, 30 June 2017, p. 21; Sumo Power, Submission to ACCC Issues Paper, 30 June 2017, p. 10.

260 Retail Electricity Pricing Inquiry—Final Report
During AEMC interviews with retailers as part of the 2018 Retail Energy Competition Review, retailers acknowledged problems with discounting as a pricing strategy but noted significant issues in moving away from this marketing approach, for example:
�� consumers continue to respond to discounting
�� it is difficult to compare ‘no discount’ offers
�� there are risks in moving to ‘no discount’ offers as the retailer could lose customers in the short-term until the whole industry moves away from dicounting in advertising.570
Some retailers themselves have also recognised the dilemma associated with having to offer increasingly large discounts. As one retailer commented in an internal 2015 strategy document, it was not sustainable ‘to continue increasing discounts’. The retailer added ‘[i]f incumbents respond with further increases in their discounts, rather than following suite [sic] and further exacerbating the situation, we could instead look at an education campaign promoting our “total bill” discount and attacking “energy only” discounts, calling them out as the marketing gimmick they are.’ The founder and CEO of Energy Locals has also recently been reported as stating that ‘[c]ustomers who engage in the market are presented with a bewildering array of offers, the discounting game has little relationship to what the market is actually willing to pay. Discounts based off a number that retailers can invent are making them highly conditional.’571 Retailer documents also show that consumers want simplicity and often want to discuss offers further.
As noted by the AEMC in its 2018 Retail Energy Competition Review, in the past year, more retailers have introduced offers without discounts.572 However, we remain concerned that the industry will continue to rely on discounting as its primary method of competition, particularly given that the majority of headline discounts have either remained the same or increased in all NEM regions in the past year.573
13.2.2 Are consumers benefiting from discounts?In our Preliminary Report, we showed that in the Powercor distribution zone in Victoria, the average annual bill (at January 2017) for the offer with the highest discount was $125 more than the annual bill for the cheapest offer.574 Figure 13.2 shows the January 2018 figures. In January 2018, there was an $86 difference between the annual bill for the offer with the highest headline discount (43 per cent) and the annual bill for the cheapest offer (37 per cent discount). However, there was an offer in the market with a 40 per cent discount that was $333 more expensive per year than the cheapest offer with no headline discount.
570 AEMC, 2018 Retail Energy Competition Review—Final Report, June 2018, p. 63.571 Latimer, C, ‘Former EnergyAustralia exec says electricity retailers are unethical’, Sydney Morning Herald, 3 June 2018, https://www.
smh.com.au/business/the-economy/former-energyaustralia-exec-says-electricity-retailers-are-unethical-20180601-p4ziwk.html.572 AEMC, 2018 Retail Energy Competition Review—Final Report, June 2018, p. vi.573 AEMC, 2018 Retail Energy Competition Review—Final Report, June 2018, p. 57.574 ACCC, Retail Electricity Pricing Inquiry—Preliminary Report, 22 September 2017, pp. 129–130.

261 Retail Electricity Pricing Inquiry—Final Report
Figure 13.2: Annual cost of offers ($) by advertised offer discount in the Powercor distribution network (Vic), January 2018
1000
1500
2000
2500
0% 5% 10% 15% 20% 25% 30% 35% 40% 45% 50%
Ann
ual b
ill (
$)
Advertised discount (%)
500
0
$1335
$2222
Source: Based on St Vincent de Paul Society Electricity Market offer data, January 2018.
Following the release of the Preliminary Report, we conducted further analysis on the effective unit charge for electricity offers with different discounts. Figure 13.3 demonstrates the potential for consumers to be misled by headline discounts by plotting the average prices paid in Victoria across different bands of discounts. Figure 13.3 reveals that while there is, overall, a general downward trend of lower average prices as discounts increase, there is significant price dispersion within each discount band and significant overlap in the range of prices within each discount band.
While some retailers’ offers in the highest discount band lead to a low average unit charge (21.9 c/kWh), other retailers’ offers with headline discounts of 30 per cent or more have a significantly higher unit price (33.4 c/kWh). It is very difficult for a consumer to look at two offers with similar discounts and know that they would be significantly better off on one offer over another. They would also not be able to tell that they would be significantly better off on some of the offers with no discount or a very low discount. Figure 13.3 shows how at present, consumers cannot rely on an advertised discount figure to select a low price offer. Some consumers on a low or no discount offer are paying a lower price per unit of electricity than some customers on an offer with a discount of 20 per cent or more.

262 Retail Electricity Pricing Inquiry—Final Report
Figure 13.3: Range of average effective unit charges paid (c/kWh) by offer category for residential non-solar customers (Vic), 2016–17
31.6
23.8 24.1 25.0
26.5
23.2
21.6
23.2
21.9
39.5
36.5 35.3
34.7 34.2
29.4 30.8
28.9
33.4
20
22
24
26
28
30
32
34
36
38
40
Standingo�ers (0%)
No discount
> 5% 5–10% 10–15% 15–20% 20–25% 25–30% > 30%
18
c/kW
h
Discount tier (%)
Source: ACCC analysis based on retailer data.
The ACCC’s analysis of retailer offer data shows that in some NEM regions, only a small proportion of consumers are likely to be on the lowest priced offers in the market. Figure 13.4 shows the weighted average unit charge for each NEM region, and that with the exception of the ACT, some consumers in each area are paying significantly more than the weighted average. Figure 13.4 also shows that the lowest prices in the market are being accessed by less than 20 per cent of consumers.
Figure 13.4: Spread of residential non-solar consumers (c/kWh) across offer categories by state (excluding Tas), June 2017
24.4
28.0
10
15
20
25
30
35
40
45
50
27.5
Victoria
0–20% of customers 20–40% of customers 40–60% of customers
60–80% of customers 80–100% of customers Average
5
0
c/kW
h
NSW
18.1
ACT
31.7
South Australia South east Queensland
Source: ACCC analysis based on retailer data.

263 Retail Electricity Pricing Inquiry—Final Report
Data from the Colmar Brunton survey shows that consumers who switch are generally on offers with higher headline discounts (see figure 13.5).
Figure 13.5: Average discount from the total bill—residential non-solar survey respondents
0%
5%
10%
15%
20%
25%
30%
35%
20%
14%
NEM
9%
6%
South eastQueensland
13%11%
NSW
17%13%
South Australia
5% 4%
ACT
Switched retailer but not changed address Has not switched retailer, has not changed address
32%
25%
Victoria
% o
� t
ota
l bill
Source: ACCC analysis of Colmar Brunton survey data and retailer data.
However, this does not necessarily result in consumers ending up on a better offer. Figure 13.6 shows the average effective unit price paid by respondents broken down by supply charge, usage charge and discounts. On average, respondents who have switched retailer increased the headline discount they received, but did not receive a corresponding reduction in the overall effective unit charge.
Figure 13.6: Average effective unit charge (c/kWh) (before concessions) and discounts attributed to supply and usage charge for residential non-solar survey respondents (switched and not switched)
0
5
10
15
20
25
30
35
40
45
c/kW
h
SouthAustralia
Victoria NSW South eastQueensland
UsageSupply Discount
SouthAustralia
Victoria NSW South eastQueensland
ACT ACT
Switched Has not moved and has not switched
68%
32%
69%
31%
64%
36%
70%
30%
46%
54%
59%
41%
80%
20%
78%
22%
71%
29%
82%
18%
Source: ACCC analysis of Colmar Brunton survey data and retailer data.
This supports suggestions that consumers use discounts to make decisions to switch retailer but are not necessarily understanding the price impacts of such a decision, or whether it will lead to a reduction in the price they pay per unit of electricity. We note that while the overall results from the consumer survey undertaken by Colmar Brunton do not show statistically significant better outcomes for consumers who have switched, only a small number of survey respondents had switched. The ACCC considers that these results are demonstrative of the likelihood for consumers to be confused by high headline discounts. The results do not indicate the overall benefits that switching could provide for consumers if they were better able to understand advertisements and use the tools available to choose an offer that suits their circumstances.
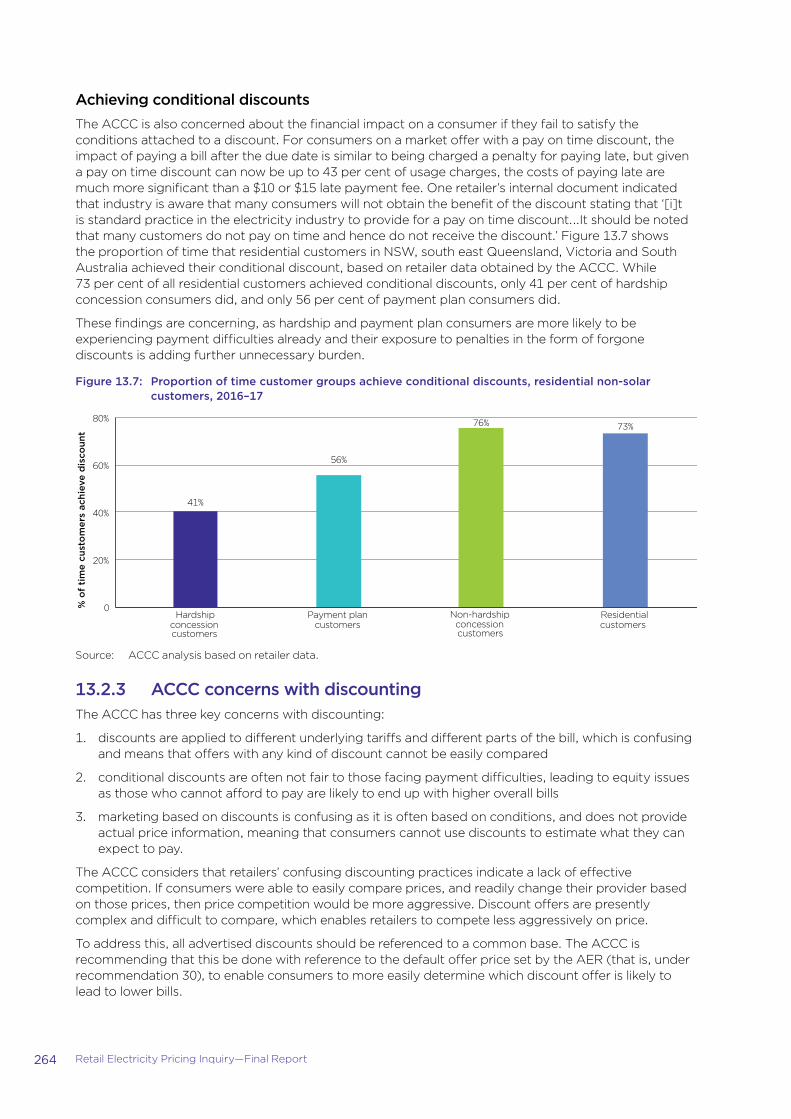
264 Retail Electricity Pricing Inquiry—Final Report
Achieving conditional discountsThe ACCC is also concerned about the financial impact on a consumer if they fail to satisfy the conditions attached to a discount. For consumers on a market offer with a pay on time discount, the impact of paying a bill after the due date is similar to being charged a penalty for paying late, but given a pay on time discount can now be up to 43 per cent of usage charges, the costs of paying late are much more significant than a $10 or $15 late payment fee. One retailer’s internal document indicated that industry is aware that many consumers will not obtain the benefit of the discount stating that ‘[i]t is standard practice in the electricity industry to provide for a pay on time discount….It should be noted that many customers do not pay on time and hence do not receive the discount.’ Figure 13.7 shows the proportion of time that residential customers in NSW, south east Queensland, Victoria and South Australia achieved their conditional discount, based on retailer data obtained by the ACCC. While 73 per cent of all residential customers achieved conditional discounts, only 41 per cent of hardship concession consumers did, and only 56 per cent of payment plan consumers did.
These findings are concerning, as hardship and payment plan consumers are more likely to be experiencing payment difficulties already and their exposure to penalties in the form of forgone discounts is adding further unnecessary burden.
Figure 13.7: Proportion of time customer groups achieve conditional discounts, residential non-solar customers, 2016–17
41%
56%
76% 73%
0
20%
40%
60%
80%
Hardship concession customers
Payment plan customers
Non-hardship concession customers
Residential customers
% o
f ti
me
cust
om
ers
achi
eve
dis
coun
t
Source: ACCC analysis based on retailer data.
13.2.3 ACCC concerns with discountingThe ACCC has three key concerns with discounting:
1. discounts are applied to different underlying tariffs and different parts of the bill, which is confusing and means that offers with any kind of discount cannot be easily compared
2. conditional discounts are often not fair to those facing payment difficulties, leading to equity issues as those who cannot afford to pay are likely to end up with higher overall bills
3. marketing based on discounts is confusing as it is often based on conditions, and does not provide actual price information, meaning that consumers cannot use discounts to estimate what they can expect to pay.
The ACCC considers that retailers’ confusing discounting practices indicate a lack of effective competition. If consumers were able to easily compare prices, and readily change their provider based on those prices, then price competition would be more aggressive. Discount offers are presently complex and difficult to compare, which enables retailers to compete less aggressively on price.
To address this, all advertised discounts should be referenced to a common base. The ACCC is recommending that this be done with reference to the default offer price set by the AER (that is, under recommendation 30), to enable consumers to more easily determine which discount offer is likely to lead to lower bills.

265 Retail Electricity Pricing Inquiry—Final Report
The ACCC also considers that only guaranteed (or unconditional) discounts should be included in the headline discount figure, as the financial impact of missing a discount condition is not well understood by many consumers.
Importantly, these recommendations do not require retailers to advertise using discounts. Retailers will be free to choose not to apply and advertise discounts to their offers in the same way that they are free to do so now. However, if a retailer does choose to use a discount in headline price advertising, it must only show the percentage or dollar discount from a reference bill amount calculated using the default offer price set by the AER (recommendation 30).
Comparing apples with applesThe ACCC considers that consumers will be best placed to identify the most suitable electricity offer for their circumstances by using a comparison tool that considers all offers in the market. The ACCC has made recommendations to improve awareness and use of government-run comparator websites in chapter 14. However, regardless of steps taken to improve and promote comparison tools, many consumers will continue to make electricity purchasing decisions based on headline marketing claims, without taking further steps to determine how much they are likely to pay under the offer or whether they are able to meet the terms and conditions of the offer. Retailers’ current discounting practices are leading to poor outcomes for these consumers.
An internal document from one of the big three retailers states that in re-setting prices in Victoria it will ‘[p]lay like a Tier 2 retailer for electricity acquisition, by using higher base pricing combined with higher discounting.” The ACCC is concerned that retailer discounting practices are likely to escalate, even following a recent rule change made by the AEMC that is designed to stop retailers from advertising discount offers from underlying rates that are higher than the retailer’s equivalent standing offer tariff.575 The ACCC does not consider that the new rule will address the ACCC’s concerns with discounting, as retailers will remain free to increase standing offer prices, enabling them to continue to advertise large headline discounts.
At least one retailer has a practice of using high discounts to attract consumers initially, and then applying a lower discount when recontracting later. An internal document from this retailer states that “[a]ggressive acquisition pricing, and deliberate margin management at re-contracting is critical to [our] pricing strategy—and has enabled significant price dispersion.’ Another retailer’s staff member commented in an internal email that: “[t]he big three retailers particularly, now have large and very active retention / winback teams that are offering high % discount rates and “stay” credits of $100 and on occasion up to $200, that appear to be lossmaking but they are often holding the customer. No doubt with the intention to grow the rate over the next year or so.” This email noted that a particular retailer had “recently resorted to chasing a discount % with customers offering 24, 25, 26, 27% until they find the “sweet” spot with a customer and hold them.”
Discounting from a reference bill
The ACCC considers that, if used appropriately and taken from a consistent benchmark, a discount is a simple way to compare two offers and assess whether one is likely to lead to lower bills than the other. Retailers that choose to advertise discounts should be obliged to do so from a common base, calculated with reference to the default offer price set by the AER (outlined in recommendation 30). This will enable quick and easy comparison of offers. This will also mean that all discounts are taken from the total bill as they must be calculated from the reference bill set by the AER.
The ACCC considers that this approach enables retailers to continue to offer discounts, if they choose to do so, but allows consumers to more easily compare offers, and will stop retailers from artificially inflating prices in order to offer meaningless headline discounts. While consumers are still unlikely to be able to determine the best offer for them based on headline discount alone, as this would require a tailored calculation based on household consumption patterns, this approach will allow consumers to easily determine whether one offer is likely to lead to lower bills than another.
575 On 15 May 2018 the AEMC made a new rule that is designed to restrict retailers from including discounts in market retail contracts where customers would definitely be worse off under the undiscounted market offer than under the standing offer. Further detail on this rule is at appendix 3.

266 Retail Electricity Pricing Inquiry—Final Report
Recommendation 32If a retailer chooses to advertise using a headline discount claim it must calculate the discount from the reference bill amount published by the AER.
�� The AER should publish a reference bill amount for each distribution zone using AER bill benchmarks for medium (2–3 person) households and the price set by the AER for default offers (recommendation 30).
�� Retailers must calculate all discounts off the reference bill, including win-back and retention offers that have discounts attached to them.
�� Headline discounts in advertising must only include guaranteed (unconditional) discounts.
Calculating discounts under the reference bill approach
Figures 13.8 and 13.9 show the steps involved in setting prices and discounts under this recommendation. First, a reference bill amount should be calculated for each distribution zone, based on the relevant AER bill benchmark consumption level for a medium (2–3 person) household.576
Figure 13.8: Setting the reference bill
4000postcode
2115postcode
5137postcode
4904 kWh*Consumption level for a medium household
5513 kWh*Consumption level fora medium household
5623 kWh*Consumption level for a medium household
$1836Annual reference bill**
$2019Annual reference bill**
$2052Annual reference bill**
* Consumption levels for each postcode are based on AER Electricity and gas bill benchmarks for residential customers 2017.** Annual reference bills assume a supply charge of 100 c/day and a usage charge of 30 c/kWh. These charges are for illustrative purposes only. The ACCC anticipates that the supply and usage charges will di er depending on the distribution zone.
Retailers would be free to choose how to structure the underlying tariff, including the supply and usage charge. Applying these underlying rates to the benchmark usage will derive an indicative billing amount. The difference between this amount and the reference bill will be the discount that the retailer will be permitted to advertise.
The underlying rates will need to be displayed in places where retailers are currently required to list them (including retailers’ websites, bills, government-run comparator websites, and commercial comparators). The plan document produced by the Energy Made Easy website would also include these rates.
Given that the underlying rates include the discount from the reference bill amount, these documents will need to clearly state that the percentage discount is from the reference bill amount, so that it does not mislead consumers. Figure 13.9 is a continuation of the example in figure 13.8 and shows how the underlying tariff would be structured for two offers.
576 AER, Electricity and gas bill benchmarks for residential customers 2017, viewed 22 May 2018, https://www.aer.gov.au/retail-markets/retail-guidelines-reviews/electricity-and-gas-bill-benchmarks-for-residential-customers-2017. Note that benchmark consumption levels vary depending on location.

267 Retail Electricity Pricing Inquiry—Final Report
Figure 13.9: Setting rates under the benchmark approach
Retailer A18% discount
from the reference bill
Retailer B7% discount
from the reference bill
$1500Best o�er (annual bill)
$1700Best o�er (annual bill)
75c/daySupply charge
90c/daySupply charge
25.0c/kWh Usage charge
30.7c/kWh Usage charge
$1836 Reference bill4904 kWh Medium consumption
Note: These charges are for illustrative purposes only. The ACCC anticipates that the supply and usage charges will differ depending on the distribution zone.
Given that the AER price ceiling will include an allowance for some costs of competition, most retailers would be able to offer some discount from the price ceiling if they chose to do so. However, the magnitude of the headline discount will likely be significantly reduced from current levels. Figure 13.10 shows how three offers with current high headline discounts might be displayed following the implementation of this recommendation. Figure 13.10 shows that while an offer with a high headline discount may appear like a good deal, it is clear that the discount is meaningless when the discount is recalculated from a consistent reference point.
Figure 13.10: Worked example of the reference bill approach
Retailer A35%
Current headline discount
$1666Total bill, calculated using
benchmarked consumption for a medium household
16% New headline discount
Retailer B18%
Current headline discount
Retailer C28%
Current headline discount
$1651Total bill, calculated using
benchmarked consumptionfor a medium household
17%New headline discount
$1537Total bill, calculated using
benchmarked consumptionfor a medium household
21%New headline discount

268 Retail Electricity Pricing Inquiry—Final Report
Calculating discounts for whole states
If retailers were to advertise a headline discount for offers that could be viewed by consumers in multiple distribution zones (with different pricing), retailers would be required to advertise in a manner that ensures that no consumer would get a false impression regarding the discount that would apply to them. This would likely require a retailer to consider and set its underlying tariffs of their offers to ensure that the headline discount was the same for all distribution zones. This approach would not be dissimilar to what retailers currently do to set a headline discount that can be used in mass media advertising.
Discounts that can be included in a headline discount figure
The ACCC considers that only guaranteed discounts should be included in a headline discount figure. The ACCC considers that is not appropriate to use conditional discounts in headline discount figures where there is not the time or space to explain the conditions (and the financial impact of meeting these conditions).
Complex tariff structures
This recommendation is primarily designed for flat tariffs577, as the majority of discounted offers are flat rate offers. However, the ACCC considers that if a retailer wished to advertise a discount from an offer with a different tariff structure, for example a time of use tariff, retailers should also be required to calculate the discount from the AER reference bill. This would involve the retailer undertaking a process similar to that outlined in figure 13.9, using a benchmark consumption profile relevant to that tariff type.
The ACCC notes that for most complex tariff structures, the annual bill will largely depend on a household’s consumption patterns. Retailers must ensure that they are not marketing such offers in a way that could mislead consumers into thinking that a cost-reflective or demand tariff will suit their personal circumstances.
It is particularly important for consumers to use comparison tools or services that estimate a bill based on actual consumption data, or at least ask targeted questions to estimate consumption, to assist them in estimating bills for complex tariff structures, such as cost-reflective and demand tariffs.
Conditionality of discountsWe are also concerned with the impact of conditional discounts on consumers. The ACCC acknowledges that pay on time discounts incentivise consumers to make timely payments of their bills and that this has a value to retailers. Retailers also make legitimate savings through consumers meeting other conditions, such as paying in advance, or paying by direct debit. However, the size of such savings are not commensurate with the high conditional discounts currently available in the market, providing retailers with an excessive benefit when the conditions are not met.
The ACCC is particularly concerned by the impact that missing a pay on time discount has on a consumer’s bill, particularly for consumers in financial hardship, as they are more likely to miss a bill due date and are less able to afford the penalty when this happens. These customers would often be better off on an offer with no headline discount. Given the magnitude of pay on time discounts in particular, failing to pay by the due date even once each year can significantly increase a consumer’s annual electricity bill. As noted above, data provided by retailers indicates that a lower proportion of hardship consumers and payment plan consumers are receiving pay on time discounts than the average.
While the ACCC’s recommendation to provide funding for consumer groups and other organisations to provide targeted assistance to vulnerable consumers (outlined in section 15.4) will assist many consumers to choose an offer that suits their circumstances, the ACCC remains concerned that excessively high conditional discounts are not reflective of retailers’ cost savings and should not be used in electricity advertising.
The ACCC considers that it is important for retailers to be able to incentivise consumers to act in ways that reduce retail costs, for example by paying in advance or on time, or by using direct debit for payment. However, these incentives should not be in the form of large conditional discounts that can significantly impact on consumer bills.
577 These tariffs, which are used today for the majority of residential customers, include a fixed daily supply charge, and a variable charge reflecting the volume in kWh of electricity consumed.

269 Retail Electricity Pricing Inquiry—Final Report
The magnitude of conditional discounts should be limited to the financial savings that a retailer can reasonably expect to make if a consumer meets the conditions attached to the discount. Further, retailers must be able to justify the magnitude of the discount if requested to by the AER.
Recommendation 33Conditional discounts should be no higher than the reasonable savings that a retailer expects that it will make if a consumer satisfies the conditions attached to the discount. Retailers should bear the onus of substantiating that the conditional discount is reasonable.
Improving consumer understanding of the value of discounted offersIt is difficult for many consumers to estimate the amount that they are likely to pay in each bill, based on marketing of offers with headline discounts alone. However, the remedy to this problem is not as simple as requiring retailers to publish the underlying rates for an electricity offer. Information provided to consumers before they agree to sign up to an electricity plan or take up a particular offer is crucial in assisting them to understand how much they are likely to pay, and to determine which offer best suits their circumstances.
We received a number of submissions relating to the complexity of information provided by retailers to consumers, including information on websites, information directly sent to consumers, and information provided over the phone from call centres.578 While electricity is essentially a homogenous product, pricing structures are complex. To make an informed decision, consumers need to weigh up a range of price and non-price variables within each offer, many of which are difficult to compare.579 Retailers also recognise the complexity of retail electricity offers. In its submission, EnergyAustralia stated that pricing and discounting is inherently complex but that there are opportunities to make improvements in how consumers can “make sense of the offers made to them”.580 Alinta stated that the complexities of the underlying price structures, and therefore the customer’s ability to conduct meaningful comparison across products, is an issue.581
The complexity of information partly reflects the regulatory environment in which electricity retailers operate and the complexity of a product for which demand fluctuates but which must be constantly available to consumers and for which they pay some months after consumption. As noted in the Brattle Report, if consumers perceive retail pricing information to be complex or have difficulty comparing offers from different suppliers, consumers may disengage from the market and make poor purchase decisions or avoid them altogether.582 It is therefore of utmost importance that consumers receive information they can use from retailers and that this information enables them to make good decisions and engage in the market.
Information requirements
The Retail Pricing Information Guideline (RPIG), developed and maintained by the AER, is the main regulatory instrument that sets out how retailers must present information on standing and market offer prices to consumers to assist them to compare retailers’ offers.583 The RPIG includes requirements on how retailers must provide offer information to the AER for presentation on the AER’s price comparison website, Energy Made Easy. It also includes requirements that retailers, and anyone marketing on behalf of retailers, must comply with when marketing offers.
578 EWON, Submission to ACCC Issues Paper, 30 June 2017, p. 4–5; CitySmart, Submission to ACCC Issues Paper, 21 June 2017, p. 2; CALC, Submission to ACCC Issues Paper, 3 July 2017, p. 17; VCOSS, Submission to ACCC Issues Paper, July 2017, p. 18.
579 National Seniors Australia, Submission to ACCC Issues Paper, June 2017, p. 6; AMES Australia, Submission to ACCC Issues Paper, June 2017, p. 1; Alba Cheese, Submission to ACCC Issues Paper, June 2017 p. 1; EWON, Submission to ACCC Issues Paper, 30 June 2017, p. 4.
580 EnergyAustralia, Submission to ACCC Issues Paper, 30 June 2017, p. 16. 581 Alinta, Submission to ACCC Preliminary Report, 17 November 2017, p. 5.582 The Brattle Report, appendix 11, p. 25.583 NERL, s. 61(1).

270 Retail Electricity Pricing Inquiry—Final Report
On 23 April 2018, the AER published a revised version of the RPIG following a consultation process drawing on consumer insights.584 The changes made to the RPIG were informed by stakeholder feedback, and findings from a range of consumer testing.585
Specific information that must be provided when marketing or advertising a discount includes the amount or percentage of the discount, the component of the bill that the discount applies to, and where information on the underlying tariff can be found.586
Requirements relating to the information that retailers must provide to the AER for the Energy Made Easy website include:
�� a requirement to submit specific information to the AER in relation to generally available offers, to be published on the Energy Made Easy website. Energy Made Easy will then generate a basic plan information document (the plan document) for each offer, showing key information about the offer. This information includes a comparison pricing table showing the estimated cost of the offer for three household usage profiles, usage charges, demand charges, supply charges, discounts, the base level tariff and any terms and conditions attached to the offer. Comparison pricing tables are not included in small business plan documents. The Energy Made Easy website will also create a detailed plan information document with additional information regarding the offer terms and conditions587
�� retailers must use language that is clear, simple and widely understood in the information that they provide to the AER for the Energy Made Easy website, and also in advertising and marketing. The RPIG sets out a number of prohibited terms.588
Retailers must also link to the plan document on the retailer’s own website (rather than create their own plan documents)589, provide a copy of the plan document to a consumer during in-person marketing activity590, include clear text in mass media and social media referring consumers to plan documents591, and identify and refer to the plan ID number generated by Energy Made Easy, so that a consumer can find out further information from the electricity retailer only by referencing the plan ID number.592
584 In September 2017, the AER commenced a consultation process that drew on consumer insights to implement a number of the recommendations that eight retailers made to the Prime Minister in August last year. The purpose of the consultation was to identify ways to:�� prompt consumers to investigate whether they could get a better deal�� make it easier for rival retailers to inform consumers accurately that they offer better deals, including by raising awareness of independent comparison services�� persuade consumers that the switching process is less of a hassle than they think�� make it easier for consumers to get hold of the information they need to investigate and switch�� improve how plans are communicated, so that consumers are able to compare options and get what they think they have signed up to.
(AER, Customer price information—Issues paper, September 2017, p. 7.).585 The requirements to provide information to the AER will commence on 31 August 2018, the AER has staggered the implementation
of the remaining obligations. Retailers must comply with all requirements by 1 January 2019 (AER, Notice of Final Instrument: AER Retail Pricing Information Guidelines, Version 5, April 2018, p. 4.).
586 AER, Retail Pricing Information Guidelines version 5.0, April 2018, cl. 34, 106.587 AER, Retail Pricing Information Guidelines version 5.0, April 2018, cl. 72.588 AER, Retail Pricing Information Guidelines version 5.0, April 2018, cl. 65–66, table 3.589 AER, Retail Pricing Information Guidelines version 5.0, April 2018, cl. 81.590 AER, Retail Pricing Information Guidelines version 5.0, April 2018, cl. 93.591 AER, Retail Pricing Information Guidelines version 5.0, April 2018, cl.100, 101, and 102.592 AER, Retail Pricing Information Guidelines version 5.0, April 2018, cl. 104.

271 Retail Electricity Pricing Inquiry—Final Report
As with the RPIG, the Victorian Code sets out how retailers must present their standing and market offer prices to consumers, including a written offer summary.593 Similar to the AER’s RPIG, the Victorian Code stipulates the information that must be included in price and information statements.594 Retailers must also present information in accordance with the format outlined in the Victorian Code.595
Following the Victorian Government’s interim response to the Victorian Review, ESC Victoria commenced a review of electricity billing and marketing.596 The Victorian Review recommended that ESC Victoria develop a small number of typical consumer usage profiles for use in marketing materials and develop a standardised format for retailer information disclosure and marketing material.597 The Victorian Review recommended that the marketing of prices appear in a standardised format and display the actual annual costs for the standardised customer usage profiles.598 ESC Victoria commenced consultation on these recommendations in March 2018. Initial consultation will focus on billing, before design and testing on proposals to marketing will commence in July 2018. A draft decision is expected in November 2018 and the final decision in January 2019.599
ACCC findings
The ACCC considers that the recent changes to the RPIG and ESC Victoria’s process to improve marketing are likely to resolve a number of concerns raised in relation to the difficulties consumers face in estimating how much they will pay under certain offers. Most energy plan documents will now show estimated bills under three consumption levels, and give consumers a clearer indication of the amount that they are likely to pay with and without discounts. The ACCC considers that if Victoria does not implement the ACCC’s recommendation to join the NECF, any changes to the Victorian Code should be consistent with the RPIG to reduce regulatory complexity and retailer costs.
The revised RPIG has been informed by significant stakeholder input, consumer testing and consumer research, and so is likely to be well suited to consumers’ needs. However, we consider that the success of the changes to the RPIG, along with the additional changes to the RPIG required to implement the ACCC’s discounting recommendations, should be monitored and measured through enhanced price and market reporting.
13.3 Marketing and the Australian Consumer LawThe ACL aims to protect consumers and ensure fair trading in Australia. The ACL contains provisions prohibiting misleading and deceptive conduct and false representations, unfair contract terms, unsolicited consumer agreements, and unconscionable conduct. The ACCC has successfully taken court action against electricity retailers for breaches of the ACL. Detail on these matters is set out in appendix 4 to the ACCC’s Preliminary Report.
The ACCC is currently investigating a number of examples of conduct in the retail electricity market that raise concerns under the ACL. These investigations relate to a range of advertising and marketing conduct by electricity retailers and third party intermediaries that advertise on behalf of electricity retailers.
593 Retailers must provide customers with a written offer summary when providing the customer with the terms of information about any new contract during marketing activity or at any other time on request. The offer summary must include the same information as the price and information statement, however, any information on fixed fees or charges relating to the supply of energy should include the period to which the charge relates and the disclosure statement is varied (Victorian Code, cl. 15C.)
594 Victorian Code, cl. 15B(6). 595 Victorian Code, cl. 15B(7).596 ESC Victoria, Overhaul of energy bills underway, Media Release, 20 March 2018.597 Thwaites, J, Faulkner, P, and Mulder, T, Independent Review into the electricity and gas retail markets in Victoria, August 2017,
pp. xi–xii.598 Thwaites, J, Faulkner, P, and Mulder, T, Independent Review into the electricity and gas retail markets in Victoria, August 2017, p. xi.599 ESC Victoria, Slides from bills and marketing workshop – 27 April 2018, viewed 11 June 2018, https://www.esc.vic.gov.au/sites/
default/files/documents/RMR-bills-marketing-workshop-slides-20180414.pdf.

272 Retail Electricity Pricing Inquiry—Final Report
13.3.1 Direct marketingRetailers market to consumers in a number of different ways—in advertising, on websites, through social media, along with more traditional forms of marketing, such as letter box drops, telemarketing and door-to-door selling. Each type of marketing raises different concerns. For example, advertisements often do not contain sufficient information for consumers to understand and compare offers, and direct sellers can pressure consumers into making a quick decision that is not in their interests.
While the big three retailers stopped engaging in door-to-door selling for residential consumers in 2013, other retailers continue to directly market in this way. Many retailers also use telemarketing to acquire new consumers and to retain or win-back consumers who have decided to switch to a new retailer.
Throughout the Inquiry, we received a number of submissions expressing concerns that cold calling and door-to-door sales can confuse or mislead consumers and that these direct marketing techniques have adverse effects and often lead to poor consumer outcomes.600 Submissions highlighted the significant impact that this can have on culturally and linguistically diverse consumers.601 The Energy and Water Ombudsman Victoria (EWOV) has advised the ACCC that while ombudsman cases regarding direct marketing and related transfer issues have decreased markedly, there has been a recent increase in consumers complaining of misleading and high-pressure sales tactics as well as transfers without consent. EWOV is concerned that this may suggest that issues with direct selling may have persisted among some second and third tier retailers.
While we did not receive submissions raising similar concerns with telemarketing, we consider that this form of marketing can lead to confusion and poor consumer outcomes in a similar way to door-to-door selling.602
Current regulationThe ACL contains specific consumer rights and trader obligations for uninvited transactions away from a trader’s premises (such as unsolicited door-to-door and telephone sales). These protections include when a door-to-door salesperson can visit or a telemarketer can call, the right to ask the salesperson to leave, identification requirements, cooling off rights, the right not to be misled and the right to be treated fairly.603
The AER’s RPIG requires door-to-door sales and other in-person sales agents to comply with requirements to provide plan documents during marketing activity. Telemarketers also need to refer small customers to the plan document.604
ACL review
Direct marketing was considered in detail in the review of the ACL in 2017 (the ACL Review). The ACL Review Final Report noted that the consumer detriment arising from pressure selling particularly affects vulnerable consumers. While the ACL Review Final Report did not make recommendations to reform the unsolicited selling provisions in the ACL, it stated that some degree of additional intervention may be required.605
The ACL Review stopped short of banning direct marketing, as banning any business model is an extreme form of intervention that is generally reserved for significant and widespread misconduct in circumstances where all other forms of regulation have failed.606 Instead, the ACL Review recommended an economy-wide study to examine the role, nature and impact of unsolicited selling in the Australian economy, to inform future policy development.607 This study commenced in 2017–18.608
600 CALC, Submission to ACCC Issues Paper, 3 July 2017, p. 10; AMES Australia, Submission to ACCC Issues Paper, June 2017, p. 3; EWOV, Submission to ACCC Issues Paper, 30 June 2017, p. 3.
601 AMES Australia, Australia, Submission to ACCC Issues Paper, June 2017, pp. 2–3.602 The ACCC did receive submissions expressing concerns about telemarketing in the context of save and win-back behaviour, which is
discussed in chapter 6.603 ACCC, Telemarketing & door-to-door sales, viewed 8 June 2018, https://www.accc.gov.au/consumers/sales-delivery/telemarketing-
door-to-door-sales.604 AER, Retail Pricing Information Guidelines version 5.0, April 2018, cl. 95.605 Consumer Affairs Australia and New Zealand, ACL Review Final Report, March 2017, p. 58.606 Consumer Affairs Australia and New Zealand, ACL Review Final Report, March 2017, p. 64.607 Consumer Affairs Australia and New Zealand, ACL Review Final Report, March 2017, p. 61.608 Legislative and Governance forum on consumer affairs, Meeting of Ministers for Consumer Affairs—Joint Communique,
31 August 2017, p. 8.

273 Retail Electricity Pricing Inquiry—Final Report
The ACL Review also considered an ‘opt-in’ approach to replace the existing cooling-off right. This would require a consumer to ‘opt-in’ after the sale, by contacting the seller within a certain time period for a sale to be concluded. This would mean no payment or supply would be permitted until the consumer opts in. This would allow consumers to reconsider their decision without having committed themselves to the transaction and reverse the current opt-out approach where the transaction remains valid unless it is cancelled by the consumer.609
The ACL Review found that the ‘opt-in’ approach would likely result in fewer transactions being completed. The ACL Review concluded that while this may benefit vulnerable and disadvantaged consumers, it would significantly impact on overall sales and should be considered in light of the proposed economy-wide study.
ACCC findingsThere has been a reduction in door-to-door marketing activity following the decision of the big three retailers to stop marketing in this way, and a subsequent decline in marketing related complaints received by energy ombudsmen. We also note that some smaller retailers have indicated to the ACCC that they are moving away from traditional marketing channels towards a greater reliance on digital and online sales channels. Despite that, door-to-door marketing continues to be one of the chief avenues for acquiring new residential customers for smaller retailers.
As outlined above, the complexity and confusion created by retailers’ advertising and marketing of offers using high headline discounts leads to poor consumer outcomes.
The ACCC is particularly concerned that the general complexity and confusion when coupled with pressure selling scenarios of direct marketing could add to consumer detriment. As door-to-door selling occurs in person, many consumers are more vulnerable and could be easily influenced into signing electricity contracts without fully understanding the offer terms and their rights. This is particularly concerning given that consumers may be induced into entering into an ongoing electricity contract that does not suit their needs, and may not realise this until their first bill arrives (which could be up to three months later).
However, we note that direct selling is likely to be one of the primary ways that smaller retailers gain market share and is an important avenue for small retailers to market to consumers. Changes to the AER’s RPIG to clarify that requirements to provide plan documents apply to any entity advertising and marketing on behalf of retailers may assist in reducing confusion caused by direct marketers.
As noted above, there has been an increase in complaints regarding door-to-door selling by smaller retailers. This may mean that the costs to consumers outweigh the benefits of this sales channel to smaller retailers. However, the concerns with door-to-door selling are not isolated to the electricity sector, as evidenced by the economy-wide study into unsolicited selling that is currently being undertaken. We consider that the costs and benefits of direct selling of electricity services should be a focus for the economy-wide study. The ACCC considers that the economy-wide study into unsolicited selling should also assess the costs to smaller retailers of using other acquisition methods (for example focusing only on comparator websites and online marketing) and the potential for retailers to move to other advertising and marketing techniques that could lead to poor consumer outcomes, should direct selling be banned.
609 Consumer Affairs Australia and New Zealand, ACL Review Final Report, March 2017, p. 65.

274 Retail Electricity Pricing Inquiry—Final Report
14. Tools to assist consumers in navigating the market
Key points�� Commercial third party intermediaries, such as commercial comparators, switching services,
connection services and brokers, have the potential to add significant value for consumers in this market but in several areas are not delivering good outcomes for consumers.
�� There are some barriers to automated switching services entering and expanding in the NEM. The largest barrier is access to electricity data and there are processes underway to improve access to data (access to data is discussed in detail in section 13.1). The other barrier is the operation of regulation relating to explicit informed consent.
�� Governments should ensure ongoing funding to raise awareness of government-run comparator websites.
14.1 Tools to assist consumers to choose a retailer and switch
Switching retailers or electricity offers is often suggested as a good way for consumers to reduce their bills and ensure they are getting a good deal for their electricity. This is especially important as consumers who stay loyal to one retailer are likely to pay more for electricity services than a consumer who switches regularly or who ‘threatens’ to switch on a regular basis. This is a notable difference between energy and other industries.
In 2017, many residential customers switched electricity retailers or plans. Victoria and south east Queensland had the highest switching rates (27 and 25 per cent respectively). Switching rates in NSW and South Australia were approximately 19 and 16 per cent respectively. Only around 6 per cent of residential customers in the ACT switched.610 While these switching rates are very high, they include consumers that have switched multiple times and consumers that have only switched because they have moved house. Based on information provided to us by one Victorian distributor, we estimate that the percentage of households that switch each year (other than those who switch retailer when they change address) could be closer to 9 per cent. As noted in chapter 11, action taken by the Prime Minister in 2017 may have also led to increased switching rates.
However, for many consumers, switching retailers is not a simple task. The information provided to consumers prior to or at the point of sale is exceptionally complex, and even relatively engaged consumers find it difficult to navigate the retail electricity market.
Third party intermediaries611 can provide an important and beneficial service to consumers who are seeking to switch electricity retailers.612 Many consumers and businesses use third party intermediaries to help them choose an electricity retailer and offer. Automated switching services regularly scan the market and switch consumers when a lower-priced offer is available. Government-run price comparison websites display all generally available offers in the market. Retailers also often offer comparison tools on their websites. With the exception of government-run comparator services, each of these tools operates on the basis of fees paid by consumers, commissions paid by retailers, or a combination of both.
610 AEMC, 2018 Retail Energy Competition Review Final Report, June 2018, p. 97.611 These are firms who offer a service to consumers to assist them to choose an electricity retailer and assist with signing the consumer
up with a new retailer. These include commercial comparators, switching services, brokers and connection services.612 See for example, CPRC, Five preconditions of effective consumer engagement—a conceptual framework, 2018, pp. 7–8.

275 Retail Electricity Pricing Inquiry—Final Report
According to research undertaken for the AEMC, price comparison websites are the second most common information source for consumers looking to switch their electricity retailers, after internet searching.613 Consumers are more aware of commercial comparators than government-run comparator websites.614
14.1.1 Regulation of third party intermediariesThird party intermediaries can cut through complex information, analyse the consumer’s personal circumstances and provide a tailored recommendation. While these services can provide a benefit to consumers, the ACCC is concerned that many third party intermediaries are not operating in the interests of consumers, and may be adding to the complexity of the retail electricity market.
Third party intermediaries are not subject to any industry specific regulation, but must comply with the ACL. Those that market and advertise on behalf of retailers must also comply with certain provisions of the AER’s RPIG from 1 January 2019.615
The ACCC considers that some behaviour by third party intermediaries is likely to breach the ACL, and may be resolved through enforcement action by the ACCC.
We also consider that some conduct by third party intermediaries that is not likely to breach the ACL is still leading to poor consumer outcomes and additional regulation is required to address these issues.
14.1.2 Concerns with commercial third party intermediariesSubmissions to the Inquiry raised concerns with the conduct of commercial third party intermediaries, including that commercial comparators’ websites and their sales teams may not always adequately disclose their fees and commissions616, that comparators do not ensure that customers are fully informed about their decision617, and that commissions received by third party intermediaries may influence the offers they recommend.618 The ACCC is also aware of circumstances where commercial comparators do not disclose the fact that they cover a limited extent of the market (that is, that they only compare offers from a subset of electricity retailers).619 We consider that it is likely that many consumers assume that the offers and retailers that are considered by third party intermediaries are representative of the full range of retailers and offers available in the electricity market.
The ACCC has received a number of suggestions to improve consumer confidence in commercial comparators. Submissions noted that the ACCC should consider whether the voluntary Energy Comparator Code of Conduct (Comparator Code) should be strengthened so that it can be more effectively enforced620, and revised to ensure that it meets the ACCC’s Guide for comparator website operators and suppliers.621 Consumer advocates have also expressed support for a mandatory code for commercial price comparators, and connection and brokering services, as they did not consider a voluntary code of conduct will resolve concerns with third party intermediaries.622
The ACCC’s concerns with the behaviour of commercial third party intermediaries can be grouped into two key categories:
�� third party intermediaries do not always make recommendations that are in the best interests of consumers
�� third party intermediaries do not always adequately disclose the number of retailers and offers that they consider in making a recommendation to a consumer.
613 Newgate Research, Consumer research for the Australian Energy Market Commission’s 2017 Retail Energy Competition Review, April 2017, p. 27.
614 Newgate Research, Consumer research for the Australian Energy Market Commission’s 2017 Retail Energy Competition Review, April 2017, p. 28.
615 AER, AER Retail Pricing Information Guidelines version 5.0, cl. 8.616 Origin, Submission to ACCC Preliminary Report, 30 November 2017, p. 5.617 Momentum Energy, Submission to ACCC Issues Paper, 30 June 2017, p. 7.618 Momentum Energy, Submission to ACCC Issues Paper, 30 June 2017, p. 7; CALC, Submission to ACCC Issues Paper, 3 July 2017, p. 10.619 Momentum Energy, Submission to ACCC Issues Paper, 30 June 2017, p. 7.620 EWOSA, Submission to ACCC Preliminary Report, November 2017, p. 3.621 EnergyAustralia, Submission to ACCC Preliminary Report, November 2017, p. 19. EWOSA, Submission to ACCC Preliminary Report,
November 2017, p. 3.622 See for example, CALC, Submission to ACCC Preliminary Report, November 2017, p. 10.

276 Retail Electricity Pricing Inquiry—Final Report
Recommending offers in the interests of a consumerMany commercial third party intermediaries’ business models are based on receiving commissions from retailers. Intermediaries often receive different levels of commission from different retailers, which creates an incentive to promote one offer over another, depending on the available commission. Unless the offer with the highest commission is the lowest priced offer for the consumer, this incentive will conflict with the consumer’s interest.
The ACCC is concerned that some commercial comparators may be displaying results based on the level of commission they receive, either by displaying a ‘paid’ result at the top of the result list, or when the intermediary’s outbound call centre follows up with a consumer to encourage them to switch. An internal document from one of the big three retailers stated that moving from the top tier service with a comparator to a lower tier resulted in a reduction of 200 customers in one week. This retailer then reverted to the top tier of service with the comparator. This is particularly concerning as many consumers are likely to use commercial third party intermediaries as an alternative to government-run comparison websites, which are independent and display all generally available offers in the market.
The ACCC is also concerned that third party intermediaries may not always adequately disclose commercial relationships between the retailers and the third party intermediary.
The AEMC has also raised concerns that commercial comparator websites are being used more often by consumers but can lack transparency about the proportion of offers covered and the commission paid by retailers.623 To improve transparency around commissions, the AEMC advocated for transparency requirements on comparators comparing electricity being similar to comparison websites comparing financial services like life insurance. Comparators comparing life insurance are required to provide information to consumers about how the website is remunerated when a customer signs up to an insurance product through the website, including the level of any commissions being paid.624
623 AEMC, 2018 Retail Energy Competition Review, June 2018, p. 83.624 AEMC, 2018 Retail Energy Competition Review, June 2018, p. 110.

277 Retail Electricity Pricing Inquiry—Final Report
Disclosure of retailers and offers considered by the intermediaryMany consumers are likely to falsely assume that commercial third party intermediaries consider all offers to determine which best suits their needs.
Figure 14.1 shows the variability between coverage of retailers for a number of commercial comparators. In two instances, the number of affiliated retailers could not be located on the commercial comparator’s website.
Figure 14.1: Number of retailers represented on commercial comparison websites at March 2018
0 5 10 15 20 25 30 35 40
WATTever**
Energy Bill Doctor
Seek the deal*
Energy compare*
Electricity Monster
Finder.com.au
Canstar Blue
Compare with us
You Compare
Go Switch
Make it cheaper
Mozo
iSelect
Energy Watch
Compare the Market
Electricity and Gas Comparison
Electricity Wizard
Total active retail brands
Number of retailers
31
16
17
10
11
12
25
10
4
8
6
14
13
8
0
0
6
29
12
5
U Choose
Energy Deal
Source: AEMC 2018 Retail Competition Review, p. 103.
Notes: *Could not locate affiliated providers on website.
** Provides comparisons on active retailers, but only affiliated with Energy Locals for switching services.
We consider that it is reasonable for consumers to expect that a service which markets itself as finding a low priced offer will consider all offers in the market, unless the commercial third party intermediary clearly states otherwise.
14.1.3 Need for additional regulation of commercial third party intermediaries
Some of the issues outlined in 14.1.2 may raise concerns under the ACL, and may be resolved through enforcement action by the ACCC. However, we do not consider that these concerns can be adequately addressed through enforcement of the ACL alone. For example, a third party intermediary may only consider a small number of retailers and offers in making a recommendation to a consumer. Even if the intermediary were to clearly disclose this fact so that is does not mislead consumers in relation to the coverage of offers, it would not give the consumer any indication of the alternative services available that would enable them to compare the whole market, which may assist the consumer to make a fully informed decision about an electricity offer.
Voluntary and prescribed codes of conductIndustry codes of conduct can address industry-specific market failures that have not otherwise been addressed by industry participants or by other regulation.625 There are three types of industry codes, which are summarised in table 14.1.
625 ACCC, Dairy Inquiry—Final Report, 30 April 2018, pp. 165–6.

278 Retail Electricity Pricing Inquiry—Final Report
Table 14.1: Types of industry codes
Voluntary Prescribed voluntary
Prescribed mandatory
Development and administration
Developed and administered by industry participants
Developed by government, in consultation with industry participants and the public. Administered by the ACCC.
Application Only applies to industry participants who voluntarily sign up.Signatories can choose to withdraw and cease to be bound at any time (although they will still be liable for breaches that occurred while they were signatories).
Legally binding on all industry participants specified within the code.
Enforceability Enforceable only to the extent that the code includes an enforcement mechanism and process and that participants choose to be bound by the code. The ACCC has no power to enforce a voluntary code.
The ACCC can take enforcement action against parties the code applies to. Remedies include injunctions, damages, non-punitive orders and other compensatory orders.Penalties and infringement notices may apply, but are more likely in a mandatory code than a prescribed voluntary code.Any person who suffers loss or damage due to a contravention of a prescribed code can also bring a court action for damages.626
Examples Current Energy Comparator Code of ConductOther voluntary industry code
Food and Grocery Code627
With penalty provisions:Franchising Code628
Horticulture Code629
Without penalty provisions:Unit Pricing Code630
Oil Code631
Wheat Port Code632
Sugar Code633
Energy Comparator Code of ConductThe Comparator Code was developed in 2015 by the Consumer Utilities Advocacy Centre (now the Consumer Policy Research Centre (CPRC)) in collaboration with energy retailers, comparators, consumer advocates and policy makers.634 At present, there are 11 signatories to the Comparator Code, and around 19 commercial comparators operating across the NEM.635 The Comparator Code’s objectives are to ‘provide customers and stakeholders with an assurance of quality and best practice principles and engender trust and respect between the parties’.636 The Comparator Code includes a number of high level principles for signatories to follow, but does not include sanctions for non-compliance with these principles.637
626 See CCA, ss. 82, 51ACB.627 Competition and Consumer (Industry Codes—Food and Grocery) Regulation 2015.628 Competition and Consumer (Industry Codes—Franchising) Regulation 2014.629 Competition and Consumer (Industry Codes—Horticulture) Regulations 2017.630 Trade Practices (Industry Codes—Unit Pricing) Regulations 2009.631 Competition and Consumer (Industry Codes—Oil) Regulations 2017.632 Competition and Consumer (Industry Code—Port Terminal Access (Bulk Wheat)) Regulation 2014.633 Competition and Consumer (Industry Code—Sugar) Regulations 2017.634 Consumer Utilities Advocacy Centre, Energy Comparator Code of Conduct, August 2015.635 The AEMC estimates number of commercial comparators to be approximately 19. See: AEMC, 2018 Retail Energy Competition
Review Final Report, June 2018, p. 101.636 Consumer Utilities Advocacy Centre, Energy Comparator Code of Conduct, August 2015, p. 1.637 The signatories commit to be impartial and transparent, disclose commissions, ownership and the presence of commercial
arrangements, disclose the method by which they rank the offers, and that they do not have access to all retailers and offers on the market, present information that is clear and comprehensible and ensure that comparisons are as complete and accurate as possible, ensure that assumptions used to compare offers are reasonable, clear, transparent to customers, and consistent across the industry where possible. See: Consumer Utilities Advocacy Centre, Energy Comparator Code of Conduct, August 2015.

279 Retail Electricity Pricing Inquiry—Final Report
The current Comparator Code was introduced in 2015 and had not been reviewed until the CPRC commenced a review in January 2018.638 There is not yet any publicly available information on the status of or timing of this review.
In the Preliminary Report, we raised concerns with the fact that the Comparator Code does not include many features that the ACCC considers are important for any voluntary code, including a complaints handling procedure where complaints can be lodged with an independent decision maker (if the signatory cannot resolve the complaint), monitoring, governance procedures, mechanisms to promote the code and sanctions for non-compliance. Following the release of the Preliminary Report we considered whether our concerns with the conduct of third party intermediaries could be addressed through a strengthened voluntary code, should one eventuate.639
Voluntary versus mandatory codesThe ACCC notes that steps have recently been taken to update the voluntary Comparator Code. However, it is not yet clear how the Comparator Code will be strengthened and when changes will be made.
Further, given a voluntary code is unenforceable, it is not capable of addressing our concerns with the conduct of commercial third party intermediaries as:
�� even if a voluntary code were to be prescribed, industry participants could still choose not to sign up to it and signatories could withdraw from the code at any time
�� at present, the voluntary code applies to commercial comparators only. The ACCC considers that many of the principles that should be included in a mandatory code are relevant to all third party intermediaries that make recommendations to consumers about energy offers
�� the ACCC considers that the Comparator Code must be significantly strengthened in a way that may not benefit some third party intermediaries. As strengthening the Code may be to the detriment of some third party intermediaries, there is a risk that some would withdraw from the code should it be strengthened in the manner set out by the ACCC but remain voluntary.
The key advantage of a prescribed mandatory code is that it will apply to all industry participants. In addition, the ACCC can use its powers to take enforcement action under a mandatory code where necessary. The ACCC would monitor compliance with the code by assessing reported breaches and conducting compliance checks. The ACCC acknowledges that there will be some administrative costs associated with the mandatory code, including the requirement to participate in any compliance checks the ACCC undertakes, but considers they are unlikely to be excessive.
The ACCC considers the code would be most effective if it contained civil penalty provisions similar to the Franchising Code and Horticulture Code. This would allow the ACCC to achieve a timely, cost-efficient enforcement outcome where appropriate, and the financial penalties would act as a deterrent to breaching key provisions of the code.
638 CPRC, News—Operation of an Energy Comparator Code of Conduct, viewed 31 May 2018 http://cprc.org.au/2018/01/12/operation-of-an-energy-comparator-code-of-conduct/.
639 Industry codes would not generally be prescribed unless evidence exists to indicate that self-regulation has been attempted within an industry and failed to address the identified problem. See: Australian Treasury, Policy guidelines on prescribing industry codes under Part IVB of the Competition and Consumer Act 2010, May 2011.

280 Retail Electricity Pricing Inquiry—Final Report
Potential substantive obligations of a mandatory codeWhile the content of any code would be subject to further consultation through the development process, we consider that the code should address the concerns outlined in 14.1.2. Table 14.2 details the identified problem with the industry and the way that a mandatory code could address this problem.
Table 14.2: How a mandatory code could address issues identified with the conduct of third party intermediaries
Identified concern Possible solution
Results may be presented on the basis of commercial interests rather than the consumers’ interests
Requirement that:�� the default method of displaying results is based on the estimated bill (lowest to highest)�� third party intermediaries charge flat rate fees for all retailers and intermediary staff are paid the same regardless of the recommendation they make to a consumer
Some third party intermediaries do not clearly disclose:�� that they receive commissions from retailers and any differences in commission�� if the commissions are having any impact on how offers are presented to consumers�� commercial relationships between the third party intermediary and a retailer
Requirement that third party intermediaries clearly disclose:�� whether they receive commissions from retailers and the amount of that commission�� all commercial relationships between third party intermediaries and electricity retailers
Often inadequate disclosure of the extent of the market and products compared
Requirement that third party intermediaries clearly and prominently disclose any limitations on the number of retailers and offers considered by the intermediary, and link to a government-run comparator website so that the consumer can visit the website to compare all generally available offers
Lack of transparency around methodology and assumptions used for estimating bills and making recommendations
Requirement that third party intermediaries clearly and prominently disclose the methodology and assumptions used for estimating bills and making recommendations
Lack of retailer control over the way that third party intermediaries collect explicit informed consent when they are responsible for making the switch
Requirement that third party intermediaries obtain explicit informed consent from consumers in a way that satisfies retailer obligations under the NERL
Requirements relating to the way that recommendations are made to consumers and disclosure requirements
The ACCC considers that the default method of displaying results should always be based on the estimated bill with options to alter the display if the consumer wishes to prioritise other contract terms over price, or the third party intermediary clearly advertises that it compares non-price outcomes for example, solar credits or green energy. If a filter is selected, filtered results should be recommended in ascending price order.
A key consideration for the code will be balancing the incentives for third party intermediaries to promote offers from retailers that pay the highest commission, and the interests of consumers to find the lowest priced offer. The code may need to include disclosure obligations relating to the commissions paid by retailers and fees charged by third party intermediaries or other provisions to reduce the incentives for third party intermediaries to maximise profits to the detriment of consumers that use their services. One way to balance these incentives would be to require third party intermediaries to charge a flat fee for all retailers, and pay commissions to staff at the same rate regardless of what recommendation is made to a consumer. This would remove the financial incentive to recommend an offer to a consumer that is not suitable for them.

281 Retail Electricity Pricing Inquiry—Final Report
Commercial relationships between third party intermediaries and electricity retailers (or related entities) should also be clearly disclosed.
The ACCC considers that there is lack of transparency around the methodology and assumptions used by third parties for estimating bills and making recommendations. We consider that more disclosure around the assumptions and methodology used by the third party intermediary will better enable consumers to understand how the third party intermediary operates and why an offer is being recommended. The mandatory code should require disclosure around the assumptions and methodology in a way that would assist a reasonable consumer to better understand how the decision making has been done by the third party intermediary.
Requirements relating to the way that consumers are switched
Many third party intermediaries undertake the switching process for the consumer, including obtaining the consumer’s explicit informed consent to switch. The mandatory code should include obligations relating to how an intermediary should obtain a consumer’s explicit informed consent to arrange a one off switch or undertake multiple switches during a specified term. The mandatory code should set out clear enforceable obligations for third party intermediaries in obtaining authority from consumers and giving explicit informed consent in order to manage risk around consumers being switched inadvertently. Further detail on this is at section 14.2.
Independent management and complaints handling
The mandatory code should have a strong governance framework to hold commercial third party intermediaries to account. Further, an independent review of the code should be taken by the designated policy department on a regular basis to ensure that the code remains effective in changing market conditions.
Strong compliance monitoring by the code administration committee, and an obligation to report serious breaches to the ACCC is also important. Such reports must include detail on the complaints received in relation to each signatory and details on systemic complaints.
We consider that the mandatory code should have an effective and specialised complaints handling process as a starting point for complaints. An in-house complaint handling system is often more cost effective, time efficient and user friendly in resolving consumer complaints than external mediation.
In addition to an internal complaint handling process, we consider that a mandatory code must have an effective independent dispute resolution process administered by an independent third party for disputes arising between consumers and code members. Such dispute resolution procedures have been set up in other mandatory codes.640
Scope of the mandatory codeAs noted by the CPRC, it is important that any policy intervention designed to improve the comparison of products and services should apply to all tools that a consumer uses to make product comparisons.641 The ACCC considers that the mandatory code should cover any third party intermediary that offers a service that involves recommending an electricity offer to a consumer, regardless of whether the intermediary has a direct relationship with the retailer. This includes comparator services, connection services, brokers, and automated switching services, and if future business models emerge that make recommendations to consumers, they should be covered by the mandatory code.
Consideration of exemptions from the code
We note that there would be implementation and compliance costs associated with a mandatory code. All parties covered by a mandatory code would be required to inform themselves of the mandatory code requirements as well as incur some ongoing costs for keeping up to date with the code. As under other mandatory codes, all third party intermediaries would also be required to keep necessary records
640 Under the Horticulture Code of Conduct, if the parties cannot resolve a dispute on their own within three weeks after the complainant informs the other party of the dispute, either party may ask the mediation adviser to appoint a mediator. Each party must pay half the costs of the mediation as well as their own costs of attending the mediation, unless they agree otherwise (Competition and Consumer (Industry Codes—Horticulture) Regulations 2017, cl. 40, 45.)
641 CPRC, Five preconditions of effective consumer engagement—a conceptual framework, 2018, p. 53.

282 Retail Electricity Pricing Inquiry—Final Report
and respond to random compliance checks by the ACCC. This would ultimately add to retail costs as third party intermediaries would likely pass these on to retailers (or to the consumer). However, the ACCC does not consider these costs to be excessive. We also note that there would be enforcement and education costs borne by the Australian Government for a mandatory code.
The ACCC considers that potential exemptions should be given due consideration during the Australian Government’s development of the mandatory code. Some exemptions may be necessary so that disproportionate compliance costs are not met by smaller third party intermediaries which may deter their entry or expansion. Similar exemptions are covered by other mandatory industry codes. For example, the Unit Pricing Code is mandatory only for grocery retailers with a floor space of greater than 1000 square metres.642 We note that these exemptions should not dilute the substantive obligations discussed above.
When implementing the mandatory code, the Australian Government should consider whether there is a need to extend the mandatory code to all aspects of a third party intermediary’s business, for example health insurance, telecommunications comparison services etc., as some third party intermediaries such as commercial comparators often compare a diverse range of products through their channels.
Recommendation 34The Australian Government should prescribe a mandatory code of conduct for third party intermediaries, which addresses the issues discussed in chapter 14. For example, offers should be recommended based on price benefit to the consumer rather than the size of the commission received by the third party. The code should contain civil penalty provisions for any breaches.
14.2 Barriers to automated switching services entering and expanding across the NEM
Consumers have access to information about retailers and their offers through various channels, including government websites, retailers, and consumer groups. Information on switching retailers is also available through government-run comparator websites and third party intermediaries. However, despite the vast amount of information available, a large number of consumers have not switched electricity retailer or offer in a number of years.
The improvements to third party intermediaries outlined in section 14.1 will only assist consumers who are willing and able to undertake the searches and arrange to switch themselves. The ACCC considers that merely providing recommendations on offers and retailers is unlikely to be sufficient for many consumers. The ACCC notes research undertaken by the Centre for Competition Policy at the University of East Anglia and Ofgem’s research and trials on switching, which show that merely providing consumers with cheaper offers was not sufficient to ensure switching.643 Further detail on the Ofgem trial is at section 11.1. CHOICE has also advised that during a trial of an advice service, 20 per cent of consumers took up the recommendation and switched.
Since the Preliminary Report was published, we have seen some developments in Australia. CHOICE has launched an automatic switching service called Transformer.644 Transformer uses a consumer’s bill to determine whether a consumer can save money by switching to a new electricity offer based on an analysis of their previous usage, tariff, rate and discount structure. Transformer analyses every publicly available electricity offer on that day to determine potential savings to residential energy consumers. If CHOICE sources an electricity offer with a saving of at least $100 a year, CHOICE will invite the consumer to join Transformer.645 Transformer does not accept commissions from retailers and charges a flat annual subscription fee of $99 each year.646 Transformer will review the consumer’s offer at least
642 Explanatory Statement to the Trade Practices (Industry Codes—Unit Pricing) Regulations 2009, p. 1.643 Deller, D, Giulietti, M, Loomes, G, Waddams Price, C, Bermejo, AM, Jeon, A Y, Switching Energy Suppliers: It’s Not All About the
Money, CCP Working Paper 17–5, Centre for Competition Policy, University of East Anglia, August 2017; Ofgem, Small scale database trial, November 2017, pp. 4–5; Ofgem, Results from the cheaper market offers letter trial, November 2017, pp. 3–4; Ofgem, Private beta digital trial—Early findings & insight, February 2018, p. 3.
644 CHOICE Transformer, Homepage, viewed 14 May 2018, https://canisaveonenergy.com.au/.645 CHOICE Transformer customer terms and conditions, viewed 14 May 2018, https://transformer.choice.com.au/terms-and-conditions.646 CHOICE Transformer, Homepage, viewed 14 May 2018, https://canisaveonenergy.com.au/.

283 Retail Electricity Pricing Inquiry—Final Report
once every three months to determine whether a cheaper alternative is available.647 CHOICE claims that in its analysis of 600 consumer energy bills, consumers could save an average of $324 each year.648
We are also aware of other switching services in Australia. RoboSave reads a consumer’s bills and then scans the market and automatically switches electricity offers on the consumer’s behalf. RoboSave charges an annual subscription fee of $29.95, but may take commissions from retailers in the event that a consumer is switched.649 The Energy Bill Doctor provides a free service where consumers can upload a bill and the Energy Bill Doctor will seek to find the consumer a cheaper power plan.650 The Energy Bill Doctor provides both a switching service with a selected group of retailers from which it receives commissions plus a more general comparison service.651
On 16 June 2018, the NSW Premier announced that Service NSW will commence a service to assist consumers to find a new offer and switch.652
The ACCC notes that automated switching providers are still a relatively new feature of the electricity market, and there are limited intermediaries that undertake switching on behalf of consumers. We consider that if enough consumers started using a service of this kind, it has the potential to place competitive pressure on retailers to provide better offers both to existing customers and to new customers. While consumers would be charged a subscription fee, an automated switching service would likely still reduce search costs for consumers as they would be able to sign up to such service and set and forget rather than searching for offers or retailers on their own.
The ACCC has identified two key barriers to automated switching services entering and expanding in the NEM:
�� at present, third parties have difficulty accessing individual consumer energy usage data. We consider that access to consumer data is essential for third party intermediaries to provide tailored recommendations to consumers, and monitor any changes to consumption. At present there are some hurdles to consumers accessing their own data and authorising third parties to access the data on their behalf, and as outlined in section 13.1, there are processes underway to improve access to data
�� perceived restrictions on the ability of third parties to give explicit informed consent (EIC) on behalf of a consumer. The ACCC recommends amendments to the NERL to clarify that third parties can give explicit informed consent on behalf of consumers and remove this barrier to the entry and expansion of automated switching services in the NEM.
14.2.1 Ability for third parties to give EIC on behalf of consumersUnder the NERL and the Victorian Code, electricity retailers must obtain a consumer’s EIC before transferring them from another retailer or entering into a market retail contract with the consumer.653 Under both the NERL and the Victorian Code, EIC can be obtained in writing, verbally or electronically.654 Failing to meet EIC requirements before transferring consumers to new energy plans is a breach of the NERL.655 EIC plays an important role in ensuring that consumers are not switched inadvertently, or without fully understanding the terms of the offer that they are signing up to.
While the NERL and the Victorian Code provide for agents of the retailer to collect EIC from consumers656, it is silent on the ability of third parties to give EIC on behalf of consumers. The ACCC understands that in practice, where retailers have a contractual relationship with a third party for marketing purposes the third party may procure EIC from the customer in a manner that can be appropriately audited by the retailer. One retailer commented that allowing a third party to sign
647 CHOICE Transformer, Transformer customer terms and conditions, viewed 21 May 2018, https://transformer.choice.com.au/terms-and-conditions.
648 CHOICE Transformer, Homepage - How do you calculate my savings, viewed 17 May 2018, https://canisaveonenergy.com.au/.649 One Big Switch, Homepage, viewed 14 May 2018, https://www.onebigswitch.com.au/robosave_products/energy; One Big Switch,
RoboSave Terms and Conditions, p. 8.650 Energy Bill Doctor website, Homepage, viewed 14 May 2018, www.energybilldoctor.com.au.651 Energy Bill Doctor website, Homepage, viewed 14 May 2018, www.energybilldoctor.com.au.652 Gladys Berejiklian, NSW Premier, NSW Budget: ‘One-Click Energy Switch’ could save households more than $1000 a year, Media
Release, 16 June 2018.653 NERL, s. 38; Victorian Code, cl. 16(4), 57(1).654 NERL, s. 39(2); Victorian Code, cl. 3C(2).655 NERL, s. 38.656 NERL, s. 39, Victorian Code, cl. 3C(1).

284 Retail Electricity Pricing Inquiry—Final Report
up on a customer’s behalf in circumstances where the third party has no contractual relationship with the retailer could create significant issues from a compliance perspective if the third party is not required to adhere to the same standards as the retailer in procuring EIC and satisfying other compliance requirements.
As outlined above, the ACCC considers that automated switching services could be beneficial to many consumers if they meet the requirements under the mandatory code of conduct as explained in section 14.1. However, there are some risks with allowing third parties to give consent on behalf of consumers. In particular, there is a risk that consumers could be inadvertently switched without understanding that they have authorised a third party to give EIC on their behalf, and consumers may not be fully aware of their cooling-off rights if they are not engaging directly with the retailer.
Some retailers have advised the ACCC that it is difficult for them to ensure that third party intermediaries obtain EIC in accordance with the NERL and the Victorian Code. One retailer has argued that unless regulation relating to EIC applies equally to third party intermediaries, there will be a risk that these third parties may switch consumers without clear consent, which opens retailers (both outgoing and incoming) up to the risk of a customer churning without evidence of EIC. One large retailer stated that they regularly identify consumers who have been switched without consent through retention activity. We note that while the NERL and the Victorian Code require retailers to obtain EIC either verbally, written or electronically there are retailers that set out obligations on third parties to obtain EIC in a certain way.
14.2.2 ACCC findingsWhile comparator services can be useful for consumers who are relatively engaged, there will always be an inherent conflict between the interests of retailers that are paying the comparators (the incentive to increase profits) and the interests of the consumers who use the service (the desire to achieve the lowest price). The improvements to third party intermediaries outlined in section 14.1 will only assist consumers who are willing and able to undertake the searches and arrange to switch themselves. The ACCC considers that a service which merely provides recommendations on offers is unlikely to be sufficient for many consumers. A third party intermediary that works for the consumer, such as an automated switching service, has the potential to assist a cohort of consumers who will only engage if they are able to contract with a third party to make electricity decisions on their behalf.
The ACCC notes the importance of the regulation requiring retailers to obtain EIC from consumers.657 Requiring retailers to obtain EIC from a consumer in a particular format before switching them is designed to ensure that consumers have been provided with sufficient information to understand what they have agreed to. The AER has taken action against retailers in the past for failure to comply with the NERL provisions relating to EIC658, and in 2015, following an increase in the number of breaches of the EIC provisions, issued a compliance check to remind retailers of their obligations to obtain EIC.659
Given that the regulatory obligations relating to obtaining EIC fall only on retailers, it is essential for retailers to have some ability to confirm that EIC has been given in accordance with the law.
The ACCC considers that amending EIC regulation to enable third parties to give EIC on behalf of consumers in isolation poses some significant risks including consumers being switched inadvertently, or without fully understanding the terms of the offer that they are signing up to. However, we consider that these risks could be appropriately managed if the proposed mandatory code mirrored the EIC requirements that are applicable to retailers under the NERL. This would mean that under the mandatory code recommended in section 14.1, third party intermediaries would be required to obtain EIC from consumers in a manner that satisfies retailers’ obligations under the NERL. We consider that such a requirement would not only provide a strong deterrent to third party intermediaries switching consumers without consent, but would also provide assurance and confidence to retailers that third parties obtaining consent on behalf of consumers are appropriately regulated and EIC will have been given in accordance with the NERL and the Victorian Code. This would also ensure that consumers are
657 The Brattle Report notes that there is thus a trade-off between the benefits of liberalising channels of engagement and the need to protect consumers from excessive and/or misleading marketing. The Brattle Report, appendix 11, p. 25.
658 See for example, AER, Simply Energy fined $60 000 for alleged failure to obtain consent before switching customers, Media Release, 24 January 2017; AER, EnergyAustralia ordered to pay penalties of $500 000 for failing to obtain explicit informed consent, Media Release, 27 March 2015.
659 AER, Compliance Check—National Energy Retail Law: explicit informed consent, November 2015.

285 Retail Electricity Pricing Inquiry—Final Report
not being switched inadvertently, and that they (or their agent) fully understands the terms of the offer that they are signing up to.
Recommendation 35Consumers should be able to provide their consent to third party intermediaries to give EIC on their behalf. The mandatory code (recommendation 34) should outline the process that third party intermediaries must undertake to ensure that they give EIC in a way that satisfies retailers’ obligations under the NERL.
14.3 Low awareness of government-run price comparator websites
Two government-run comparator websites operate in the NEM: Energy Made Easy, which covers all NEM states except Victoria, and Victorian Energy Compare. Broadly, they operate in similar ways, displaying the full range of generally available offers in the market. When used by consumers, we consider these websites are valuable price comparison tools. The ACCC considers that the key obstacle to these websites driving good consumer outcomes across the market is the relatively low awareness of them.
Consumer research undertaken as part of the AEMC’s 2016 Retail Energy Competition Review and 2017 Retail Energy Competition Review has highlighted that there is very low awareness of independent government-run comparator websites.660 This is not unexpected, given that government-run comparator websites have a relatively small budget for advertising and marketing, when compared to commercial comparators.
Throughout this Inquiry, the ACCC has received numerous submissions on the limited awareness of government-run comparator websites661, and low usage rates of these services.662 Submissions also stated that the effectiveness of government-run comparator websites should be improved.663 Other suggestions included additional funding for promoting and improving government-run comparators664 and expanding government-run comparator services to cater for consumers who do not have access to the website or have difficulties using the website.665 The CPRC has also noted the importance of ongoing reviews of the use and user experience of government-run comparators to improve their usability, relevance and accuracy.666
The Australian Government and Victorian Government have recently provided additional funding for the Energy Made Easy and Victorian Energy Compare websites respectively.667 The Victorian Government is also promoting the Victorian Energy Compare website by providing a $50 bonus to all households that visit Victorian Energy Compare between 1 July and 31 December 2018.668
The AER is currently planning a suite of improvements to the Energy Made Easy website with the changes to be released in early August 2018. These changes to Energy Made Easy include improvements to the offer search pathway, display of offers on the results page and changes to implement requirements to provide plan documents arising from the revised RPIG. The AER has also
660 Newgate Research, Consumer research for the Australian Energy Market Commission’s 2016 Retail Energy Competition Review, June 2016, pp. 3, 64–5, Newgate Research, Consumer research for the Australian Energy Market Commission’s 2017 Retail Energy Competition Review, April 2017, p. 28.
661 EWOV, Submission to ACCC Issues Paper, 30 June 2017, p. 3; Tasmanian Small Business Council, Submission to ACCC Issues Paper, 4 July 2017, p. 8.
662 VCOSS, Submission to ACCC Preliminary Report, November 2017, p. 3.663 Sumo Power, Submission to ACCC Preliminary Report, 17 November 2017, p. 2; Alinta, Submission to ACCC Issues Paper, 30 June
2017, p. 2.664 ECA, Submission to ACCC Issues Paper, July 2017, p. 19; NSW Farmers’ Association, Submission to ACCC Issues Paper, June 2017,
p. 3.665 ACOSS, Submission to ACCC Preliminary Report, December 2017, p. 9; PIAC, Submission to ACCC Preliminary Report, 17 November
2017, p. 4.666 CPRC, Five preconditions of effective consumer engagement—a conceptual framework, 2018, p. 7.667 AER, AER welcomes increased funding, 20 June 2017, viewed 20 June 2018, https://www.aer.gov.au/news-release/aer-welcomes-
increased-funding; Parliament of Victoria, Public Accounts and Estimates Committee, Report on the 2017–18 Budget Estimates, p. 120.
668 The Hon. Daniel Andrews MP, Helping Victorians bust their energy bills, 22 April 2018.

286 Retail Electricity Pricing Inquiry—Final Report
initiated a major project to further improve the Energy Made Easy website, with a plan to progressively implement an optimised and enhanced comparator service with the additional funding it has received.
14.3.1 ACCC findingsThe ACCC considers that the best way for consumers to make a fully informed decision about their retail electricity offer would be to visit a government-run comparator website to compare all generally available offers. However, as outlined in our Preliminary Report, more could be done to improve the usability and awareness of these services. We consider that the AER’s current project to improve the Energy Made Easy website will address the concerns raised in relation to the Energy Made Easy website’s functionality and usability.
Without sustained funding to promote and raise awareness of the Energy Made Easy website, many consumers may not be aware of its existence. While the Victorian Government’s $50 incentive will increase awareness of the Victorian Energy Compare website in the short-term, it will also require ongoing funding for the promotion of the website to ensure that consumers continue to access and use it before choosing an electricity offer.
The ACCC considers that ongoing funding to promote government-run comparator websites, such as that undertaken in other countries669, is essential to enable them to continue to provide impartial and unbiased comparison services to as many consumers as possible. Since 2011, the New Zealand Electricity Authority has run a campaign called ‘What’s My Number?’ to raise consumer awareness about switching electricity retailers. Using online platforms, television and magazines, the campaign aims to provide consumers with information about the ability to switch power companies, the ease of switching, and the potential savings that can be made on their power bills.670
In the current campaign, consumers are encouraged to visit the campaign website671 to use a simple calculator to assess potential savings. Potential savings are calculated based on a questions relating to location, energy usage and current retailer. Consumers can then click through to the Consumer Powerswitch comparison website which allows them to see details of the different offers available and decide whether to switch.672
Since its launch in 2011, the ‘What’s My Number’ website has had close to two million unique visitors and more than one million of those have clicked through to the free price comparison website Consumer Powerswitch.673
Recommendation 36The Australian Government and Victorian Government should commit to ongoing funding to raise awareness of the government-run comparator websites similar to the approach taken in New Zealand with the ‘What’s My Number’ campaign.
Encouraging consumers to visit government-run comparator websites is the best way to assist them to find the most suitable offer. However, switching on just one occasion is unlikely to deliver long-term benefits, as retailers maintain an incentive to attract customers with low price offers in the short run only to increase prices at a later stage. This means that it is the package of recommendations in part 3 that is important to reduce complexity and enable consumers to regularly engage (or facilitate a third party to do so on their behalf) and select an offer that best suits their circumstances periodically to ensure enduring positive outcomes.
669 New Zealand has the highest annual switching rates out of all of the international jurisdictions. This is likely attributable to the NZ$11 million ‘What’s My Number’ campaign that ran alongside its price comparison website of the same name, as well as an NGO-run switching tool. Launched in 2011, the 3.5-year campaign involved multi-media advertisements that educated consumers regarding their retail options and the simplicity of the switching process. The regulator has concluded that the campaign had “an immediate and ongoing impact”, with two-thirds of customers now believing it was worthwhile to switch retailers. The Brattle Report, appendix 11, p. 103.
670 New Zealand Electricity Authority, WhatsMynumber.org.nz—More Info, viewed 24 May 2018, https://www.whatsmynumber.org.nz/moreinfo.
671 New Zealand Electricity Authority, Homepage, viewed 24 May 2018, https://www.whatsmynumber.org.nz/.672 New Zealand Electricity Authority, WhatsMynumber.org.nz—More Info, viewed 24 May 2018, https://www.whatsmynumber.org.nz/
moreinfo.673 New Zealand Electricity Authority, Campaign statistics, viewed 24 May 2018, https://www.ea.govt.nz/about-us/what-we-do/whats-
my-number/campaign-statistics/.

287 Retail Electricity Pricing Inquiry—Final Report
14.4 Day-to-day contact with retailersAfter a consumer has selected an electricity retailer and offer, their primary interaction with their retailer is through billing or the retailer’s complaints and enquiries process.
14.4.1 BillsInformation in consumer bills is a critical part of the electricity market and is currently the primary tool to inform consumers about what they are consuming and the costs associated with this. The underlying pricing of electricity is complex and this complexity coupled with bill formatting makes it difficult for consumers to understand the volume of electricity they are using and how their bill is calculated.
Retailers are required to provide a consumer with a bill at least once every 100 days in NERL jurisdictions and every three months in Victoria.674 Bills must include a range of information including, but not limited to, account details, consumption details, amount and pay by date.675 We note differences in billing information requirements under the Victorian Code regarding smart meters.676 While the timing and information of bills are prescribed under both the NERL and the Victorian Code, there is no standard format for bills.
The ACCC has received feedback from many stakeholders in relation to electricity bills, and improvements that could be made to enable consumers to easily read and understand bills. Some submissions argue that the lack of a consistent bill format and the amount of information included on a bill is confusing for consumers677, and makes it difficult for consumers to easily determine how a bill is calculated.678 One submission pointed out that the information on bills is ‘information overload’ which defeats the purpose of informing consumers about their service.679 Some submissions suggest that there would be benefit in providing consumers with an itemised break-down of network and retail costs on a bill, to improve pricing transparency and provide consumers with network price signals.680 An internal document from one retailer reported on its customer research, noting that customers were ‘generally dissatisfied with the complexity of bills’. According to this research, customers believed that ‘an ideal energy company would provide competitive pricing, [and] clear and transparent bills’.
While the required information for bills has not been reviewed since the NERL was adopted in 2012, technology has allowed retailers to develop bespoke methods for providing this information to their customers. For instance, electricity retailers are now using web portals, mobile apps and email to provide consumers with consumption data from distributors along with basic billing information.
Increased access to and use of the internet and electronic communications creates opportunities for retailers to develop alternate means of communicating with consumers and creating greater flexibility for retailers to layer information, providing simple overviews for all consumers, and detailed information for consumers who seek it.
We have also received a number of suggestions to improve the content and format of bills. For example, bills could include:
�� prominent links to government-run comparator websites, with information to assist consumers to use these comparators and to encourage consumers to check whether their offer continues to suit their circumstances
�� prominent links to the relevant ombudsman to increase the awareness of these schemes and how consumers can use them
674 NERR, r. 24; Victorian Code, cl. 24 (1)(a). Note that some retailers made a commitment to the Prime Minister, Treasurer and Minister for the Environment and Energy that they would move towards monthly billing (Prime Minister, Minister for the Environment and Energy, Turnbull government secures better power deal for Australian families, Media Release, 30 August 2017).
675 NERR, r. 25; Victorian Code, cl. 25.676 Victorian Code, cl. 25.677 Mach 1 Panels, Submission to ACCC Issues Paper, 31 May 2017, p. 1; Arie de Gruiter Submission to ACCC Issues Paper, 9 June 2017,
p. 1; John Broadbent, Submission to ACCC Issues Paper, 26 June 2017, p. 1; Printing Industries Association of Australia, Submission to ACCC Issues Paper, 3 July 2017, p. 7.
678 Neville Grant, Submission to ACCC Issues Paper, 2 June 2017, p. 1.679 CALC, Submission to ACCC Issues Paper, 3 July 2017, p. 17.680 Spark Infrastructure, Submission to ACCC Preliminary Report, November 2017, p. 6; ERM Power, Submission to ACCC Preliminary
Report, November 2017, p. 5.

288 Retail Electricity Pricing Inquiry—Final Report
�� itemised network costs and retail costs to increase transparency on different retailer costs. We note that this information is required in some other jurisdictions. In most states of the United States of America, a consolidated bill is sent by the network business with both network and retail charges.681 In France, distribution charges must be listed separately on the bill and Germany requires the local default supplier to provide a break-down of wholesale and network cost components.682
We have heard some calls for more flexible billing processes, to allow retailers to provide billing information in different formats if their consumers opt out of receiving bills. In contrast, we have heard many stories of the importance of traditional, hard copy bills for many consumers.
Recent work in relation to billsOn 21 November 2017, the Australian Treasury released a consultation paper on fees for paper bills.683 The paper noted that businesses have traditionally supplied consumers with a paper bill, with the cost of this absorbed by businesses and included in the final price. However, recently businesses have started using digital billing and as a result have begun to charge a fee to those consumers who elect to continue receiving a paper bill.
The consultation paper sought feedback on five options, including keeping the status quo with an industry education campaign, a ban on billing fees, a ban on billing fees for essential services, fees limited to cost recovery and promoting exemptions through behavioural approaches.684 Submissions to the consultation paper have closed and the final decision is yet to be published.
Along with this work by the Australian Treasury, from 1 January 2018, the NSW Government has also prohibited electricity retailers from charging fees for paper bills.685
The ACCC notes that the Behavioural Economics Team of the Australian Government (BETA) and the Australian Government Department of the Environment and Energy are undertaking a research project to evaluate consumer comprehension of, and engagement with, electricity bills. This project will explore the electricity bill content and layout that is most helpful to consumers in understanding their bills. This research is expected to reveal insights into how electricity bills could more effectively help consumers engage in the electricity market to find the most suitable deal for them. The outcomes of this research are expected to be published on BETA’s website by the end of 2018.
Following the Victorian Government’s interim response to the Victorian Review, ESC Victoria is also undertaking work to identify ways to make it easier for consumers to understand and compare energy deals, including a review of information presented on bills and in marketing materials.686
ESC Victoria is drawing on a variety of sources, including consumer sounding, market research and testing, and trials with consumers, and will be working closely with consumers and energy retailers to understand their perspectives and design practical solutions.687 ESC Victoria is due to release a draft decision in August 2018.688
ACCC findingsAn electricity bill with clear information is a critical part of the market and it is the tool through which consumers understand how much they consume, how their bill is calculated, and how to ask a question or dispute a bill. While a bill may perform other functions, for example, referring consumers to tools to compare offers, it is essential that a consumer is able to easily identify key information when looking at a bill.
681 In the US, with the exception of Texas, the network company sends a consolidated bill with both network and retail charges (the Brattle Report, appendix 11, p. 41).
682 The Brattle Report, appendix 11, pp. 176, 199.683 Australian Treasury, Consultation regulation impact statement: Paper billing, November 2017.684 Australian Treasury, Consultation regulation impact statement: Paper billing, November 2017, p. 15.685 NSW Planning and Environment Resources and Energy, Your rights as an energy consumer, viewed 9 May 2018, https://www.
resourcesandenergy.nsw.gov.au/energy-consumers/your-rights.686 Customer outcomes in the energy market, Terms of Reference to the Essential Services Commission, 19 March 2018, https://
www.esc.vic.gov.au/sites/default/files/documents/Retail-Market-Review-terms-of-reference-ESC-customer-outcomes-energy-market-20180315.pdf.
687 ESC Victoria, Slides from bills and marketing workshop—27 April 2018, viewed 22 May 2018, https://www.esc.vic.gov.au/sites/default/files/documents/RMR-bills-marketing-workshop-slides-20180414.pdf.
688 ESC Victoria, Slides from bills and marketing workshop—27 April 2018, viewed 22 May 2018, https://www.esc.vic.gov.au/sites/default/files/documents/RMR-bills-marketing-workshop-slides-20180414.pdf.

289 Retail Electricity Pricing Inquiry—Final Report
There could be some benefits to the consumer and retailer if retailers were able to deliver billing information in a way that is tailored to the consumer, rather than in a traditional bill format. However, this will not suit all consumers, and there are significant risks in giving retailers freedom to choose what information is relevant to consumers. We consider that the risks associated with giving retailers complete flexibility to deliver billing information to consumers significantly outweigh the benefits.
Accessibility must be considered. Not all consumers are confident with or have access to the internet, and could easily be disadvantaged in a completely electronic environment. Submissions made to the Australian Treasury’s consultation on paper billing fees689 and the recent NSW Government interventions highlight the importance of ensuring that all consumers can access a paper bill.690
We agree that providing a break-down of different types of costs could improve transparency and give consumers a better basis on which they can shop around and it may also place electricity retailers under more pressure to justify or reduce their costs. However, this information may not be understood by most consumers, and could increase complexity without significant benefits.
The ACCC considers that some improvements could be made to bills to ensure that they have clear information that is easy for most consumers to understand. At present, a large number of items must be included on every bill, and this could be leading to greater complexity. This list should be reviewed to determine which pieces of information remain essential. Further, the requirement to mention the government-run comparator websites could be strengthened to require retailers to clearly and prominently display a link to the comparator website with a statement explaining that it can be used to check whether the consumer would be likely to save on their bill if they switched (rather than detailed estimated savings under particular offers).
Importantly, the ACCC considers that any improvements should be made on the basis of consumer testing and consumer research. The ACCC considers that the work being undertaken by the Department of the Environment and Energy and BETA will form a good basis for any changes to current regulation relating to bills.
14.4.2 Energy ombudsman schemesEnergy ombudsman schemes operate in each NEM region and provide dispute resolution services for consumers. The value of ombudsman schemes and their important role in resolving disputes has been further reinforced in submissions and during consultation for this Inquiry. It has been reported to us, for example, that when negotiations break down with retailers, it is often only with the intervention of the ombudsman’s office that a resolution will be reached. This intervention is particularly crucial for vulnerable consumers who would often otherwise be faced with disconnection.
However, there is very low awareness of energy ombudsman schemes. As outlined in our Preliminary Report, most consumers generally find out about ombudsman schemes from word of mouth or internet searching, rather than from their electricity retailer. We have also heard that some consumers who are experiencing financial difficulties mistakenly consider that they are unable to make a complaint as the debt has already been incurred, and therefore must be paid.
Ombudsman offices conduct outreach and awareness activities to try to improve awareness of the schemes. The Energy and Water Ombudsman NSW (EWON) and the Energy and Water Ombudsman South Australia (EWOSA) highlighted the outreach and awareness activities they undertook to educate consumers about ombudsman services, but noted that retailers could do more to increase awareness amongst their customers of the schemes and of their ability to access assistance. EWOSA pointed out that in its survey of consumers who have used its services, less than 5 per cent became aware of EWOSA through their retailer.691 EWON highlighted the importance of early engagement between retailers and consumers in resolving disputes and the important role the ombudsman could play in giving confidence to consumers to approach their retailer. EWON suggested that retailers should provide details of ombudsman schemes on reminder notices as well as disconnection warning notices
689 See for example, Andrew Wilkie MP, Submission to Consultation regulation impact statement: Paper billing, 1 December 2017, p. 1; Queensland Advocacy Incorporated, Submission to Consultation regulation impact statement: Paper billing, December 2017, p. 3; Caxton Legal Centre, Submission to Consultation regulation impact statement: Paper billing, December 2017, p. 3.
690 NSW Planning and Environment Resources and Energy, Your rights as an energy consumer, viewed 9 May 2018, https://www.resourcesandenergy.nsw.gov.au/energy-consumers/your-rights.
691 EWOSA, Submission to ACCC Preliminary Report, 17 November 2017, p. 2.

290 Retail Electricity Pricing Inquiry—Final Report
as a way of facilitating engagement.692 EWOSA was of the view that the relevant ombudsman’s contact details should be included on each bill with wording to direct the consumer to the ombudsman if they were not happy with the way the retailer had dealt with a complaint.693
ACCC findingsBetter information and access to the ombudsman will benefit consumers as they will have clear direction as to where and how they can seek assistance if they cannot resolve a dispute with their retailer. This information will also help retailers by helping to reduce the time lost and cost associated with protracted customer disputes.
We consider that awareness levels of ombudsman schemes could be improved, and given retailers have regular contact with consumers, they are in the best position to improve awareness of ombudsman schemes. This could be achieved through providing ombudsman details in a prominent position on retailer websites and in relevant communications with consumers. We note that, as retailers pay for each dispute investigated by an energy ombudsman, there is a disincentive to refer consumers to the ombudsman. These fees vary, but can cost retailers hundreds of dollars per complaint. To counter this disincentive, the NERR includes a number of circumstances where retailers must alert consumers to their rights to access an ombudsman scheme, including:
�� in market contracts694
�� on retailers’ websites695
�� before a consumer enters into a contract with an electricity retailer, or as soon as possible afterwards696
�� in disconnection warning notices.697
While there are a number of requirements to provide information about ombudsman schemes, there is no requirement about how prominent this information should be. That being said, most retailers include ombudsman details on their complaints or dispute resolution webpage which is likely to be the first non-paid search result that is returned in a search for the retailer’s name and the term ‘complaints’.
One way to raise awareness of ombudsman schemes would be to require retailers to include ombudsman details on each consumer bill. However, this could result in consumers contacting the ombudsman without first lodging a dispute with their retailer and giving the retailer the opportunity to investigate and respond, with a flow-on impact on retail costs. We consider that internal dispute resolution is an important first step, especially given that energy ombudsman schemes will not consider complaints where the consumer has not first sought to resolve these with the retailer. It is important, however, for retailers to advise consumers of their rights to refer disputes to the relevant ombudsman if they are not satisfied with the retailer’s decision. The ACCC does not consider that policy changes are required to improve the provision of information regarding ombudsman schemes to consumers. However, retailers should review their processes to ensure compliance with the NERR and that consumers are aware of the existence of ombudsman services.
692 EWON, Submission to ACCC Preliminary Report, 17 November 2017, pp. 4–5.693 EWOSA, Submission to ACCC Preliminary Report, 17 November 2017, p. 2.694 NERR, r. 50.695 NERR, r. 56.696 NERR, r. 64.697 NERR, r. 110(2).

291 Retail Electricity Pricing Inquiry—Final Report
15. Additional protections for vulnerable consumers
Key points�� Vulnerable consumers face particular barriers to engaging with the retail electricity market, and
can be more severely impacted by rising electricity prices.
�� Regardless of what steps are taken to reduce the overall cost stack, or reduce complexity, some vulnerable consumers will require additional assistance.
�� The ACCC considers that the existing measures to support vulnerable consumers are not sufficient to support those in financial hardship, and those that face additional barriers in engaging with the retail electricity market.
15.1 Who is a vulnerable consumer?Vulnerable consumers are not a homogenous group; there are a range of factors which determine the barriers they face and their ability and motivation to respond to those barriers.698 Many of the submissions to the Inquiry highlighted the broad range of circumstances that may result in vulnerability. These include language barriers699, cultural background700, health problems701, and family violence issues.702 Having a low or irregular income703, household structures704, age and disability may also lead to periods of vulnerability.705 Newly arrived migrants or refugees with low energy literacy, little or no experience in having a choice of provider, and low financial and/or numeracy literacy also face significant issues in engaging with the retail electricity market.706 Similar characteristics have been identified by the CPRC which recently reported that barriers to engagement for consumers often relate to vulnerabilities such as financial hardship, mental health issues, language barriers or temporary trauma (associated with an accident or illness).707
For the purposes of this report, the ACCC has considered two forms of vulnerability that often overlap:
�� where a consumer who, due to personal circumstances, is unable to meet or is at risk of being unable to meet the cost of electricity supply and, as a result, is at risk of experiencing detriment to their well-being and standard of living
�� where a consumer faces additional barriers to engaging with the retail electricity market.
The personal circumstances causing the inability to meet the cost of electricity supply may be permanent or temporary. Payment difficulties are often not isolated to electricity costs, and consumers may be facing difficulties in meeting payments for other expenses. For many consumers, utility bills arrive at the same time and this can exacerbate payment difficulties.
698 A recent article published in the Journal of Consumer Policy considered vulnerability in the context of the UK and EU energy markets and stated that “[p]ersonal vulnerabilities comprise physical and economic disabilities, whereas market-related vulnerabilities correspond to intellectual disabilities relating to various difficulties in exercising consumer choice.” (Ioannidou, M, ‘Effective Paths for Consumer Empowerment and Protection in Retail Energy Markets’, Journal of Consumer Policy, vol. 41, 2018, p. 145).
699 AMES Australia, Submission to ACCC Issues Paper, June 2017, p. 2; EWOV, Submission to ACCC Issues Paper, 30 June 2017, pp. 2–3; IPART, Submission to ACCC Issues Paper, 19 June 2017, p. 4.
700 AMES Australia, Submission to ACCC Issues Paper, June 2017, p. 2; EWOV, Submission to ACCC Issues Paper, 30 June 2017, pp. 2–3.701 VCOSS, Submission to ACCC Issues Paper, 13 July 2017, p. 12.702 VCOSS, Submission to ACCC Issues Paper, 13 July 2017, p. 12.703 VCOSS, Submission to ACCC Issues Paper, 13 July 2017, p. 12.704 VCOSS, Submission to ACCC Preliminary Report, December 2017, p. 5.705 Denise Burke, Submission to ACCC Issues Paper, 5 June 2017; EWOV, Submission to ACCC Issues Paper, 30 June 2017, pp. 2–3.706 AMES Australia, Submission to ACCC Issues Paper, June 2017, p. 2. PIAC found in a survey on disconnection that disconnection
was about more than the bill but about several demographic factors working together. Such factors include, but are not limited to, having a medical condition, mental illness, intellectual disability, being a new migrant, unemployment, and speaking a language other than English. Their findings supported ‘the conclusion that people who get disconnected have often faced multiple sources of disadvantage’.
707 CPRC, Five preconditions of effective consumer engagement—a conceptual framework, 2018, p. 6.

292 Retail Electricity Pricing Inquiry—Final Report
Our understanding of vulnerability has also been informed by experiences in other jurisdictions. The Brattle Report highlights varying approaches to understanding and addressing vulnerability in electricity markets.708 While all overseas jurisdictions have some targeted support framework to assist vulnerable consumers, approaches vary. Some jurisdictions including France, Great Britain, the Netherlands and New Zealand have legal definitions of vulnerability.709 However, other jurisdictions (including Australia) do not have legal definitions of vulnerability despite the existence of frameworks to support vulnerable consumers, such as concession schemes, hardship regulation and disconnection protection.
Targeted support for vulnerable consumers is commonly extended to low income energy users as well as people with medical dependencies and those with higher energy costs as a proportion of income. Some jurisdictions including Pennsylvania, Texas, Illinois and France use specific circumstances such as domestic violence, extreme weather, household condition, and employment factors in determining vulnerability and providing support.710
Approaches in each jurisdiction reflect their broader social policies. In the NEM, support for vulnerable consumers is largely administered using the broader income assistance framework, and complemented by state-based energy concessions frameworks, which are applied to consumers in the electricity market through electricity retailers.
Appropriate government support is essential to address the difficulties that vulnerable consumers face in engaging with the retail electricity market. Improvements can be made to the level of financial support that governments provide to vulnerable consumers, to the regulation designed to protect vulnerable consumers, and also to the level of direct assistance provided by consumer and community organisations.
15.2 Need for additional support for vulnerable consumers
We received many submissions outlining measures to support vulnerable consumers.711 These submissions all called for greater assistance and protections for those consumers that are less able to afford electricity bills, and those facing barriers in engaging with the retail electricity market.712 Submissions stated that many vulnerable consumers have not benefited from competitive markets and need further targeted protections to ensure access to this essential service and minimise the detriment of disconnection, energy rationing and high energy debt.713
Some submissions argued for market-wide price regulation, for example through the basic service offering recommended by the Victorian Review.714 Others advocated for targeted price protection for concession holders, those on hardship programs, or the elderly.715 Submissions also argued that:
�� retailers should be more proactive in assisting vulnerable consumers, identifying vulnerable consumers earlier and improving retailer hardship programs716
�� there is a need for government action, particularly in relation to concession schemes, with a number of stakeholders arguing that concession schemes should be consistently applied across the NEM.717
708 The Brattle Report, appendix 11, pp. 71–77.709 For example, in France a vulnerable consumer is defined as someone who “experiences difficulties in their household to have access
to the necessary energy supply to satisfy basic necessities.” In Great Britain vulnerable consumer is defined as “one who is less able than a typical consumer to protect or represent their interests.” Protections in the Netherlands apply to “residential consumers from whom disconnection would result in serious health risks” (The Brattle Report, appendix 11, pp. 71–72).
710 The Brattle Report, appendix 11, pp. 76–77.711 See for example: ACOSS, Submission to ACCC Preliminary Report, December 2017, pp. 6–17; VCOSS, Submission to ACCC
Preliminary Report, November 2017, p. 6.712 EWON, Submission to ACCC Issues Paper, 30 June 2017, pp. 9–10; ACOSS, Submission to ACCC Preliminary Report, December 2017
pp. 6–7; ACOSS, Submission to ACCC Preliminary Report, December 2017, p. 13.713 ACOSS, Submission to ACCC Preliminary Report, December 2017, p. 10; EWON, Submission to ACCC Preliminary Report,
17 November 2017, pp. 2–7; PIAC, Submission to ACCC Preliminary Report, 17 November 2017, p. 22.714 CALC, Submission to ACCC Preliminary Report, 21 November 2017, pp. 3–4; TasCOSS, Submission to ACCC Issues Paper, June 2017,
p. 6.715 See for example: EWON, Submission to ACCC Issues Paper, 30 June 2017, p. 9; VCOSS, Submission to ACCC Preliminary Report,
November 2017, pp. 4–5.716 EWOSA, Submission to ACCC Preliminary Report, 17 November 2017, pp. 2–3; ECA, Submission to ACCC Issues Paper, 27 July 2017,
p. 9.717 See for example, ACOSS, Submission to ACCC Preliminary Report, 15 December 2017, p. 15.
293 Retail Electricity Pricing Inquiry—Final Report
Some stakeholders suggested that existing services be tailored to provide additional support for vulnerable consumers, including brokering services, comparator services, and automated switching services to ensure consumers can be placed on the best deal for them with minimal confusion and trouble.718
15.2.1 What do vulnerable consumers pay for electricity?The Colmar Brunton survey considered whether consumers with certain characteristics are likely to pay more or less for electricity than other groups, or the general population. The survey focused on a range of target groups including low income earners (less than $25 000 per annum), older Australians (65 years and over), middle-income households with two or more dependents, households with concession card holders, sole parent households, households from a non-English speaking background, households with no or limited internet access and households with people with a disability.719
Average effective unit charges for target groupsFigure 15.1 shows the average unit charge (c/kWh) for each of the target groups with the concession applied, and the concession amount (c/kWh). The survey found that average effective unit charges varied between groups with all target groups (except for older households) paying more per unit of electricity than the average for the whole sample. Low-income households, those with limited or no use of the internet, and public rental households paid the highest rates for electricity before concessions were applied. Taking concessions into account, households from a non-English speaking background paid the most. The difference between the whole sample effective unit charge (29.1 c/kWh), and the unit charge for households from a non-English speaking background (31.3 c/kWh), is 2.2 c/kWh.720 For an average household using 5000 kWh of electricity per year, this would equate to $110 per year.
718 ACOSS, Submission to ACCC Preliminary Report, 15 December 2017, p. 13; VCOSS, Submission to ACCC Issues Paper, July 2017, p. 22.
719 In addition to the target groups above, the data set includes: solar customers, standing offer customers, customers on plans with pay on time discounts, hardship customers, customers on payment plans and more.
720 We note that effective unit charges in the consumer survey vary slightly from those presented in chapter 1. That is, the NEM-wide average effective unit charge derived from data collected from retailers was 29.6 c/kWh whereas the survey produced an equivalent figure of 29.1 c/kWh. These variations are attributable to a variety of factors including: time period covered, average usage, and the inclusion or exclusion of discounts, concessions and other fees and charges.

294 Retail Electricity Pricing Inquiry—Final Report
Figure 15.1: Average effective unit charge (c/kWh) for residential non-solar survey respondents by target group (with and without concessions)
0 5 10 15 20 25 30 35 40
Own outright
Paying o� a mortgage
Private rental
Public rental
No internet access or limited use
Language other than English
One or more disabilities
Middle income, 2+ dependents
Sole parents
Hardship
Entitled to a concession
Low income
Older households 65+
Not vulnerable
All vulnerable groups*
Whole sample
E�ective unit price (after concessions) Concession
c/kWh
28.1
29.7
29.6
28.6
28.5
31.3
26.5
28.3
29.0
27.6
26.7
28.2
26.9
30.1
28.3
29.1
31.5
30.5
32.5
32.6
34.1
33.0
30.8
29.4
33.2
31.2
32.4
34.7
31.9
30.5
32.3
31.5
Source: ACCC analysis of Colmar Brunton survey data and retailer data.
Note: The figure for all vulnerable groups excludes survey respondents with an unknown or annual income of over $100 000 per annum.
Impact of consumption on effective unit charges
The Colmar Brunton survey shows the large influence that consumption has on the effective unit price paid by respondents. As electricity consumption increases, the supply charges (which are a fixed amount per day) are spread over a greater volume of consumption, resulting in the lower average effective unit charges in figure 15.2.
Two households on identical tariffs with identical discounts will have different effective unit charges if they use different amounts of electricity. For example, the same tariff/discount could result in one household with an annual consumption of 5000 kWh having a bill of $1500 and an effective unit charge of 30 c/kWh while a household on the same tariff that uses 8000 kWh per year would have a bill of $2300, but is effectively paying only 28.8 c/kWh.

295 Retail Electricity Pricing Inquiry—Final Report
Figure 15.2: Average effective unit charge (c/kWh) (before concessions) for residential non-solar survey respondents by average daily usage tiers (kWh/day)
0
10
20
30
40
50
30+20–3010–205–100–5
Daily usage tiers (kWh/day)
c/kW
h
47.2
35.6
28.8
25.423.8
43%
60%
75%83%
88%57%
40%
25%17% 12%
Supply Usage (net of discount)
Source: ACCC analysis of Colmar Brunton survey data and retailer data.
Figure 15.2 shows how sensitive the effective unit price measure is to increasing usage. Supply charges make up more than 50 per cent of bills for households using less than 5 kWh per day (on average).
Figure 15.3 shows the annual consumption for each of the target groups, compared to the whole sample. Most target groups have a lower annual consumption than the average for the whole sample. The lower usage amounts for each of the target groups (when compared to the whole sample) may partly explain the higher average effective unit charges.
Figure 15.3: Average consumption (kWh) for residential non-solar survey respondents by target group
0 1000 2000 3000 4000 5000 6000 7000
Own outright
Paying o a mortgage
Private rental
Public rental
No internet access or limited use
Language other than English
One or more disabilities
Middle income, 2+ dependents
Sole parents
Entitled to a concession
Low income
Older households 65+
Not vulnerable
All vulnerable groups*
Whole sample
Annual usage (kWh)
5337
5015
5709
4893
4033
5017
5189
6540
5806
4588
4137
4883
4845
5978
5059
Source: ACCC analysis of Colmar Brunton survey data and retailer data.
Note: The figure for all vulnerable groups excludes survey respondents with an unknown or annual income of over $100 000 per annum.
The ACCC also commissioned the CSIRO to model the impact of different retail offers on consumers with different personal circumstances, household types and household incomes (further information on the analysis is in chapter 7). Through this modelling exercise, the CSIRO used the Energy Use Data Model to determine how much of household expenditure goes to energy costs, and, as seen in figure 15.4 the impacts can vary markedly depending on household energy usage and incomes.

296 Retail Electricity Pricing Inquiry—Final Report
Figure 15.4 shows the average market offer bill as a proportion of total household income for less vulnerable and more vulnerable households.721 Market offer bills account for a much larger proportion of vulnerable consumer household income.
Figure 15.4: Average market offer bills as a proportion of approximate household income (by household situation)
0%
2%
4%
6%
8%
10%
12%
14%
16%
% o
f ho
useh
old
inco
me
Less vunerable Vunerable
Solar householdsNon-solar households
Source: CSIRO.
Note: The box shows the middle 50 per cent of estimated bills (also known as the interquartile range or IQR) and the extended vertical line shows the expected extent of non-outlier bills (1.5 x IQR).
721 The CSIRO considered two forms of vulnerability:�� affordability: whether an electricity bill constitutes a significant portion of household income�� household situation: whether a household is well placed to respond to high bills through the acquisition of energy efficient, renewable energy technologies and meaningful behaviour change.
CSIRO considered a household to be vulnerable under the affordability metric if their mean electricity bill was at least 4.34 per cent of their household income. Note that, per the 2017 Consumer Price Index, typical household expenditure on electricity is 2.17 per cent. CSIRO considered households to be vulnerable under the household situation metric if they are very low-income, a low-income renter, a low-income household with a large number of occupants, a low-income household in an apartment, or a low-income household with at least one old-age occupant.

297 Retail Electricity Pricing Inquiry—Final Report
Figure 15.5 shows the average standing offer bill as a proportion of total household income for less vulnerable and more vulnerable households. Standing offer bills make up a much larger proportion of low income earners’ income than higher income earners.
Figure 15.5: Average standing offer bills as a proportion of approximate household income (by household situation)
0%
5%
10%
15%
20%
25%
30%
% o
f ho
useh
old
inco
me
7.8 24.7 42.9 65.5 91 117 156
Solar householdsNon-solar households
Approximate annual household income
Source: CSIRO.
Note: The box shows the middle 50 per cent of estimated bills (also known as the interquartile range or IQR) and the extended vertical line shows the expected extent of non-outlier bills (1.5 x IQR).
15.3 Improving concession schemesThe main way that vulnerable consumers are provided with financial support to pay their electricity bills is through state and territory concession schemes.722 In our Preliminary Report we outlined several problems with the way concession schemes are administered and recommended that state and territory governments should review concessions policy to ensure that consumers are aware of their entitlements to concessions, that concessions are well targeted and structured to benefit those most in need and, where appropriate, that there is consistency between policies.723
Since the Preliminary Report was published, we have further considered whether state and territory concession schemes are fit for purpose and have confirmed our position that changes must be made to concession schemes as a matter of urgency.
722 These concession schemes differ from state to state, but generally include concessions for pensioners, those on health care cards and those with disabilities. Consumers are generally able to apply for more than one concession where applicable. Most concessions are a set dollar figure, with the exception of Victoria, where the concessions are a percentage discount from the total bill. See: https://www.australia.gov.au/information-and-services/benefits-and-payments/government-concessions-states-and-territories; https://services.dhhs.vic.gov.au/annual-electricity-concession; https://www.sa.gov.au/topics/care-and-support/financial-support/concessions/energy-bill-concessions; https://www.qld.gov.au/community/cost-of-living-support/electricity-gas-rebates; http://www.concessions.tas.gov.au/concessions/electricity_and_heating; https://www.assistance.act.gov.au/adult/utilities/energy_concession; https://www.resourcesandenergy.nsw.gov.au/energy-consumers/financial-assistance/rebates.
723 ACCC, Retail Electricity Pricing Inquiry—Preliminary Report, 22 September 2018. p. 156.
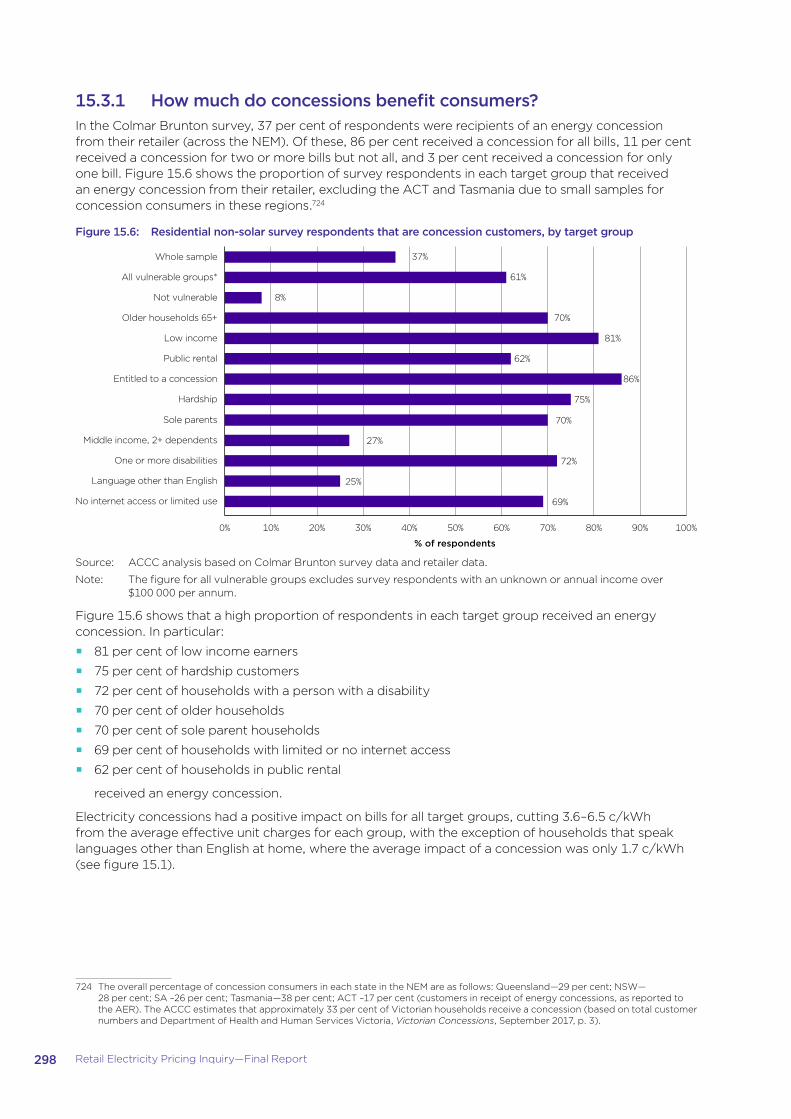
298 Retail Electricity Pricing Inquiry—Final Report
15.3.1 How much do concessions benefit consumers?In the Colmar Brunton survey, 37 per cent of respondents were recipients of an energy concession from their retailer (across the NEM). Of these, 86 per cent received a concession for all bills, 11 per cent received a concession for two or more bills but not all, and 3 per cent received a concession for only one bill. Figure 15.6 shows the proportion of survey respondents in each target group that received an energy concession from their retailer, excluding the ACT and Tasmania due to small samples for concession consumers in these regions.724
Figure 15.6: Residential non-solar survey respondents that are concession customers, by target group
0% 10% 20% 30% 40% 50% 60% 70% 80% 90% 100%
Hardship
Entitled to a concession
Public rental
Low income
Older households 65+
Not vulnerable
All vulnerable groups*
Whole sample
% of respondents
37%
61%
8%
70%
81%
62%
86%
75%
No internet access or limited use
Language other than English
One or more disabilities
Middle income, 2+ dependents
Sole parents 70%
27%
72%
25%
69%
Source: ACCC analysis based on Colmar Brunton survey data and retailer data.
Note: The figure for all vulnerable groups excludes survey respondents with an unknown or annual income over $100 000 per annum.
Figure 15.6 shows that a high proportion of respondents in each target group received an energy concession. In particular:
�� 81 per cent of low income earners
�� 75 per cent of hardship customers
�� 72 per cent of households with a person with a disability
�� 70 per cent of older households
�� 70 per cent of sole parent households
�� 69 per cent of households with limited or no internet access
�� 62 per cent of households in public rental
received an energy concession.
Electricity concessions had a positive impact on bills for all target groups, cutting 3.6–6.5 c/kWh from the average effective unit charges for each group, with the exception of households that speak languages other than English at home, where the average impact of a concession was only 1.7 c/kWh (see figure 15.1).
724 The overall percentage of concession consumers in each state in the NEM are as follows: Queensland—29 per cent; NSW—28 per cent; SA –26 per cent; Tasmania—38 per cent; ACT –17 per cent (customers in receipt of energy concessions, as reported to the AER). The ACCC estimates that approximately 33 per cent of Victorian households receive a concession (based on total customer numbers and Department of Health and Human Services Victoria, Victorian Concessions, September 2017, p. 3).
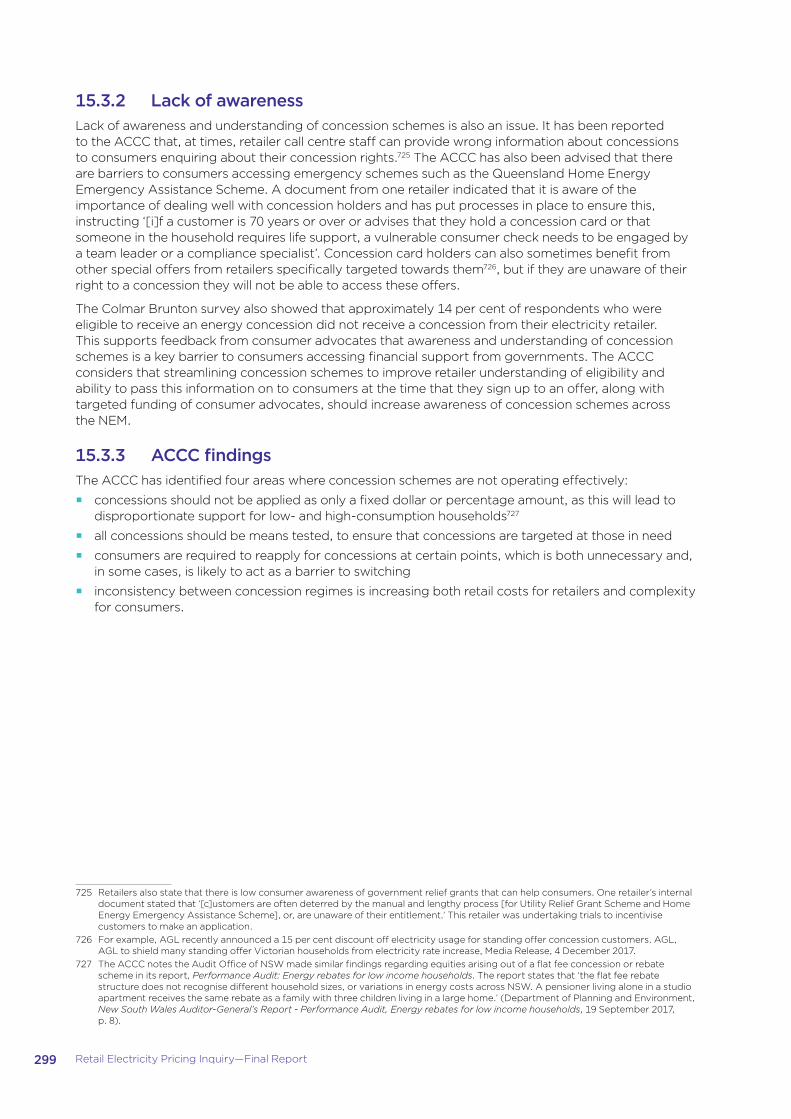
299 Retail Electricity Pricing Inquiry—Final Report
15.3.2 Lack of awarenessLack of awareness and understanding of concession schemes is also an issue. It has been reported to the ACCC that, at times, retailer call centre staff can provide wrong information about concessions to consumers enquiring about their concession rights.725 The ACCC has also been advised that there are barriers to consumers accessing emergency schemes such as the Queensland Home Energy Emergency Assistance Scheme. A document from one retailer indicated that it is aware of the importance of dealing well with concession holders and has put processes in place to ensure this, instructing ‘[i]f a customer is 70 years or over or advises that they hold a concession card or that someone in the household requires life support, a vulnerable consumer check needs to be engaged by a team leader or a compliance specialist’. Concession card holders can also sometimes benefit from other special offers from retailers specifically targeted towards them726, but if they are unaware of their right to a concession they will not be able to access these offers.
The Colmar Brunton survey also showed that approximately 14 per cent of respondents who were eligible to receive an energy concession did not receive a concession from their electricity retailer. This supports feedback from consumer advocates that awareness and understanding of concession schemes is a key barrier to consumers accessing financial support from governments. The ACCC considers that streamlining concession schemes to improve retailer understanding of eligibility and ability to pass this information on to consumers at the time that they sign up to an offer, along with targeted funding of consumer advocates, should increase awareness of concession schemes across the NEM.
15.3.3 ACCC findingsThe ACCC has identified four areas where concession schemes are not operating effectively:
�� concessions should not be applied as only a fixed dollar or percentage amount, as this will lead to disproportionate support for low- and high-consumption households727
�� all concessions should be means tested, to ensure that concessions are targeted at those in need
�� consumers are required to reapply for concessions at certain points, which is both unnecessary and, in some cases, is likely to act as a barrier to switching
�� inconsistency between concession regimes is increasing both retail costs for retailers and complexity for consumers.
725 Retailers also state that there is low consumer awareness of government relief grants that can help consumers. One retailer’s internal document stated that ‘[c]ustomers are often deterred by the manual and lengthy process [for Utility Relief Grant Scheme and Home Energy Emergency Assistance Scheme], or, are unaware of their entitlement.’ This retailer was undertaking trials to incentivise customers to make an application.
726 For example, AGL recently announced a 15 per cent discount off electricity usage for standing offer concession customers. AGL, AGL to shield many standing offer Victorian households from electricity rate increase, Media Release, 4 December 2017.
727 The ACCC notes the Audit Office of NSW made similar findings regarding equities arising out of a flat fee concession or rebate scheme in its report, Performance Audit: Energy rebates for low income households. The report states that ‘the flat fee rebate structure does not recognise different household sizes, or variations in energy costs across NSW. A pensioner living alone in a studio apartment receives the same rebate as a family with three children living in a large home.’ (Department of Planning and Environment, New South Wales Auditor-General’s Report - Performance Audit, Energy rebates for low income households, 19 September 2017, p. 8).
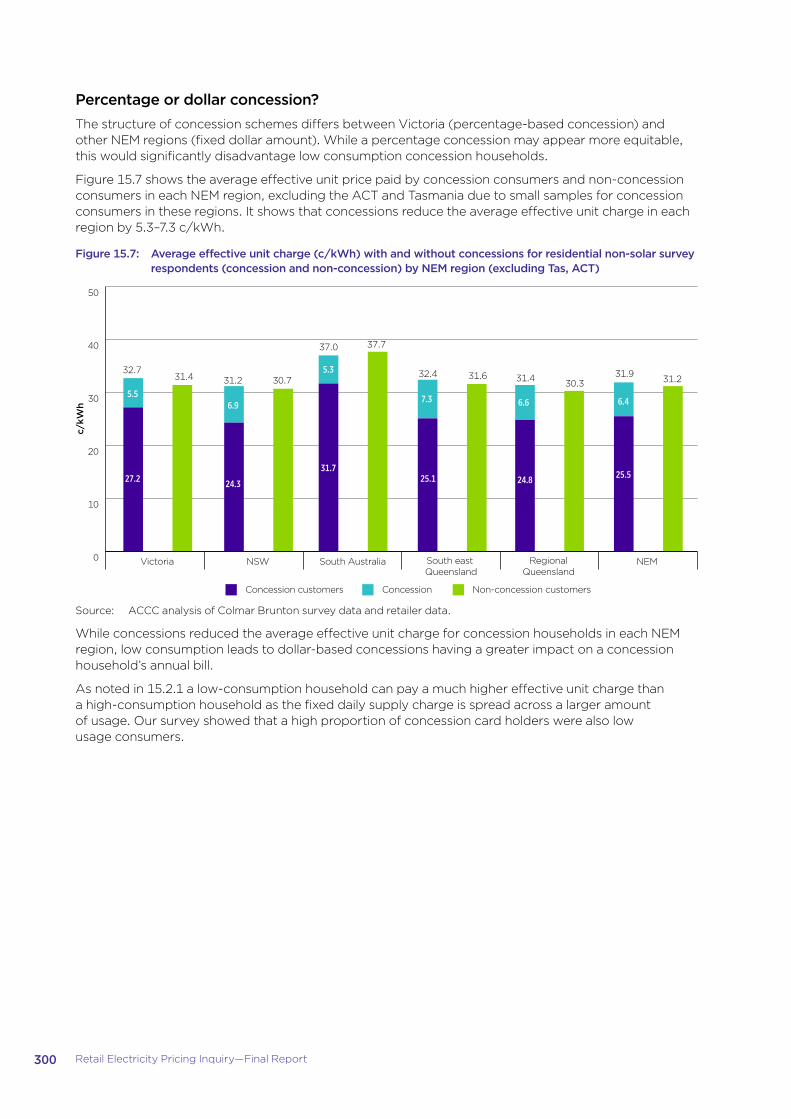
300 Retail Electricity Pricing Inquiry—Final Report
Percentage or dollar concession?The structure of concession schemes differs between Victoria (percentage-based concession) and other NEM regions (fixed dollar amount). While a percentage concession may appear more equitable, this would significantly disadvantage low consumption concession households.
Figure 15.7 shows the average effective unit price paid by concession consumers and non-concession consumers in each NEM region, excluding the ACT and Tasmania due to small samples for concession consumers in these regions. It shows that concessions reduce the average effective unit charge in each region by 5.3–7.3 c/kWh.
Figure 15.7: Average effective unit charge (c/kWh) with and without concessions for residential non-solar survey respondents (concession and non-concession) by NEM region (excluding Tas, ACT)
0
10
20
30
40
50
Non-concession customersConcession Concession customers
c/kW
h 6.9
24.3
30.731.2
NSW South east Queensland
7.3
25.1
31.632.4
5.5
27.2
31.432.7
Victoria NEM
6.4
25.5
31.231.95.3
31.7
37.737.0
South Australia RegionalQueensland
6.6
24.8
30.331.4
Source: ACCC analysis of Colmar Brunton survey data and retailer data.
While concessions reduced the average effective unit charge for concession households in each NEM region, low consumption leads to dollar-based concessions having a greater impact on a concession household’s annual bill.
As noted in 15.2.1 a low-consumption household can pay a much higher effective unit charge than a high-consumption household as the fixed daily supply charge is spread across a larger amount of usage. Our survey showed that a high proportion of concession card holders were also low usage consumers.
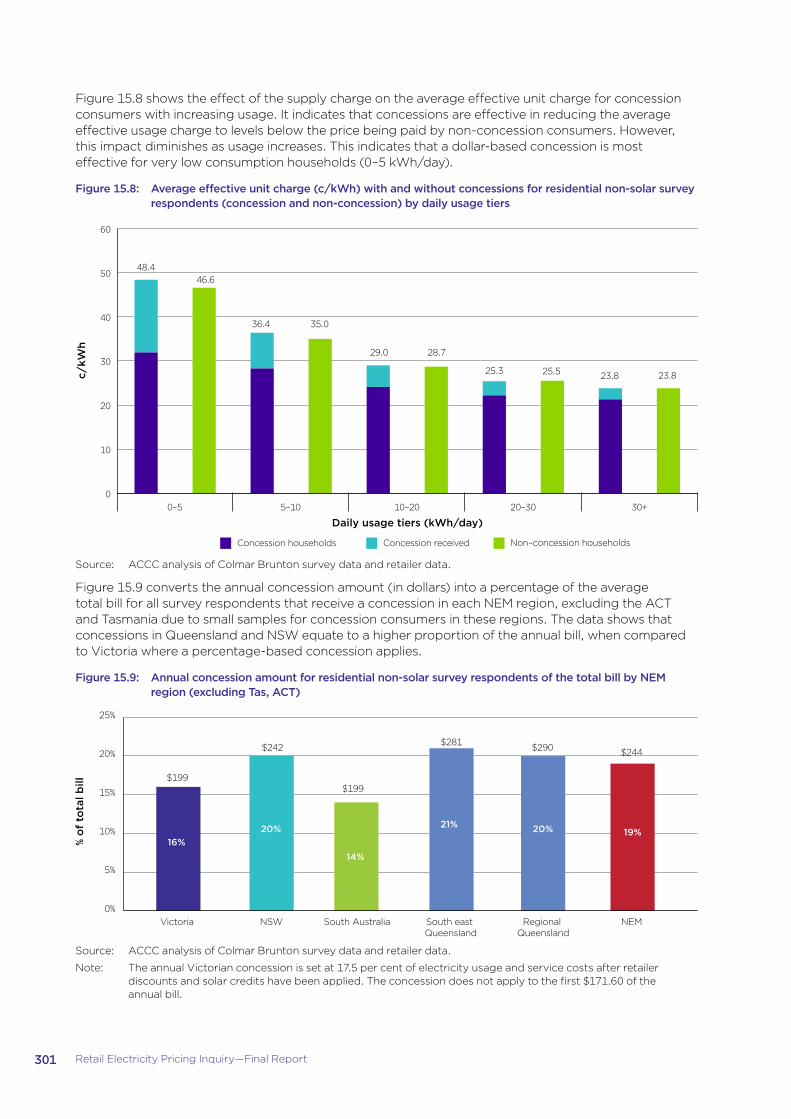
301 Retail Electricity Pricing Inquiry—Final Report
Figure 15.8 shows the effect of the supply charge on the average effective unit charge for concession consumers with increasing usage. It indicates that concessions are effective in reducing the average effective usage charge to levels below the price being paid by non-concession consumers. However, this impact diminishes as usage increases. This indicates that a dollar-based concession is most effective for very low consumption households (0–5 kWh/day).
Figure 15.8: Average effective unit charge (c/kWh) with and without concessions for residential non-solar survey respondents (concession and non-concession) by daily usage tiers
0
10
20
30
40
50
60
30+20–3010–205–100–5
Non–concession householdsConcession receivedConcession households
48.446.6
36.4 35.0
29.0 28.7
25.3 25.5 23.8 23.8c/kW
h
Daily usage tiers (kWh/day)
Source: ACCC analysis of Colmar Brunton survey data and retailer data.
Figure 15.9 converts the annual concession amount (in dollars) into a percentage of the average total bill for all survey respondents that receive a concession in each NEM region, excluding the ACT and Tasmania due to small samples for concession consumers in these regions. The data shows that concessions in Queensland and NSW equate to a higher proportion of the annual bill, when compared to Victoria where a percentage-based concession applies.
Figure 15.9: Annual concession amount for residential non-solar survey respondents of the total bill by NEM region (excluding Tas, ACT)
0%
5%
10%
15%
20%
25%
South AustraliaVictoria NSW Regional Queensland
South east Queensland
NEM
$244$281 $290$242
$199$199
% o
f to
tal b
ill
16%20%
14%
21% 20% 19%
Source: ACCC analysis of Colmar Brunton survey data and retailer data.
Note: The annual Victorian concession is set at 17.5 per cent of electricity usage and service costs after retailer discounts and solar credits have been applied. The concession does not apply to the first $171.60 of the annual bill.

302 Retail Electricity Pricing Inquiry—Final Report
While figure 15.9 indicates that a dollar concession works well for consumers in Queensland and NSW, this will not be the case for higher consumption concession households. In addition, the dollar concession amounts do not reflect changes in electricity prices, and in the past, when electricity prices have increased, the concession amount has not increased at the same rate.
The ACCC considers that governments should implement a hybrid approach to concessions, including:
�� a dollar amount to offset daily supply charges, which concession households cannot reduce regardless of changes to their consumption pattern
�� a percentage discount to offset variable usage charges. This would support both high- and low-consumption households, incentivising households to reduce consumption where possible but not requiring them to ration electricity in order to meet costs.
The ACCC considers that the combination of a dollar amount and percentage concession will bring greater benefits to households with energy concessions than the current arrangements. Targeting both the supply charge and usage charges accommodates the differences in household size and type within this consumer group and ensures that all households benefit. It also protects the significant proportion of concession holders who are the least equipped to manage their usage (those who live in rental properties are unable to afford energy-saving devices, and/or have a number of dependents).
Targeting those most in needAs outlined by the Brotherhood of St Laurence in its 2017 report, Empowering disadvantaged households to access affordable, clean energy, some of the lowest income households, such as those on Newstart, do not qualify for an energy concession in some jurisdictions.728 Households with low or variable incomes may also miss out on any government concession.729 The ACCC has also been advised that migrants and refugees are often in need of financial support but do not receive concessions, as well as the working poor who do not have concession cards. Retailers consider that concessions are not necessarily targeted at those most in need of financial assistance, and retailers have observed multiple instances of hardship consumers who are not eligible for a concession. Similarly, in Queensland, consumers are only entitled to concessions from the date that the consumer contacts the retailer about their entitlement, regardless of how long they may have been entitled to the concession.
On the other hand, the ACCC considers that there are likely to be a number of groups that currently receive energy concessions that may not require financial assistance to meet energy costs. For example, all holders of a Seniors Card in Queensland that work less than 35 hours per week are entitled to an energy concession, regardless of their annual income or assets.730 While the survey conducted by Colmar Brunton on behalf of the ACCC found that a large proportion of the target groups received an energy concession, we note that the survey did not seek to identify groups that receive a concession but did not need financial assistance in paying electricity bills.
The examples outlined above are cause for concern and demonstrate that current state and territory concession schemes are inefficient and often not well targeted to those in genuine financial hardship. The ACCC considers that state and territory governments should review concession schemes to identify any groups that are receiving concessions that do not require financial assistance to meet energy costs. At a minimum, the ACCC considers that governments should implement consistent, transparent and fair means testing to determine eligibility requirements for energy concessions to ensure that the budget for concessions is allocated to those most in need.
Requirements to reapply for concessionsThe ACCC is aware of cumbersome processes in some jurisdictions which are unnecessary and make it difficult for consumers to receive their concessions, and may also act as a barrier to switching. In South Australia, for example, consumers are required to reapply for a concession when they switch retailers. Consumers are also required to pay an initial bill with a retailer before the application can be finalised. This not only delays the receipt of the concession but acts as a disincentive for concession consumers
728 Brotherhood of St Laurence, Empowering disadvantaged households to access affordable, clean energy, July 2017, p. 64.729 Brotherhood of St Laurence, Empowering disadvantaged households to access affordable, clean energy, July 2017, p. 64.730 All holders of a Queensland Seniors Card are eligible to receive this concession. To be eligible for a seniors card a consumer must
be either over 65 years of age and working less than 35 hours paid work a week or 60 to 64 years of age, holding another type of concession card and working less than 35 hours paid work a week. See https://www.qld.gov.au/seniors/legal-finance-concessions/applying-seniors-card. There are a number of other card holders who are also eligible. See https://www.qld.gov.au/community/cost-of-living-support/electricity-gas-rebates#Eligibility.

303 Retail Electricity Pricing Inquiry—Final Report
to switch retailers.731 As a result, even though there may be more competitive offers in the market, concession consumers may remain on less beneficial tariffs for fear of losing their concessions and having to do without them for a period of time.
In Victoria, once concession consumers reach a particular usage threshold, they must apply to the Department of Health and Human Services to continue to receive the concession. This can result in a delay in receiving their entitlements and may act as a deterrent to making the application for the concession. The ACCC considers that there are limited circumstances in which consumers should be required to reapply for concessions, for example where the consumer’s financial circumstances have changed.
Consistency between concession schemesA number of electricity retailers have indicated support for a nationally consistent concession regime.732 The ACCC considers that streamlining concession policies across the NEM will benefit retailers and consumers in a number of ways:
�� consistent policies will reduce regulatory costs associated with administering the regimes (see chapter 10)
�� it will assist retailer contact centres to provide detail on concession schemes733
�� it will be simpler for consumers to find clear, easy to understand information on concession schemes, which will likely lead to increased awareness of concession eligibility.
The ACCC notes that there will likely be a need for NEM regions to take different approaches to concession eligibility, for example due to differing climates. However, the ACCC considers that there are many ways that concession policies can be streamlined to improve outcomes for concession households. The ACCC reiterates its recommendation from the Preliminary Report that COAG should commence a review of concession policies to implement the ACCC’s recommendations above and streamline concession policies where possible.
Recommendation 37COAG should improve concession schemes across the NEM to ensure that, to the extent possible, there is a uniform, national approach to electricity concessions. Concession schemes should:
�� be means tested to ensure that they are targeted at those most in need
�� include a fixed dollar amount to offset daily supply charges and a percentage discount to offset variable usage charges
�� only require consumers to reapply for concessions where this is necessary for the administration of the concession scheme.
731 Department of the Premier and Cabinet, South Australia, Energy Concessions, viewed 9 May 2018, https://www.sa.gov.au/topics/care-and-support/financial-support/concessions/energy-bill-concessions.
732 See for example, Origin, Submission to Issues Paper, 30 June 2017, pp. 5, 34–5; EnergyAustralia, Submission to ACCC Preliminary Report, 28 November 2017, pp. 20–22.
733 Lack of awareness and understanding of concession schemes is also an issue. It has also been reported to the ACCC that at times retailer call centre staff can provide wrong information about concessions to customers inquiring about their concession rights. The Audit Office of NSW found in its recent audit of the NSW scheme that ‘national energy retailers do not typically review their call centre scripts…and the variability in schemes across jurisdictions means they may find it difficult to provide accurate information to households’ (Department of Planning and Environment (NSW), New South Wales Auditor-General’s Report—Performance Audit, Energy rebates for low income households, 19 September 2017, p. 12).

304 Retail Electricity Pricing Inquiry—Final Report
15.4 Targeted support for vulnerable consumersDuring the course of the Inquiry, the ACCC has gained valuable insight into the way that consumer advocates, community organisations, financial counsellors and many other organisations assist vulnerable consumers. We consider the best way to address some of the continuing problems that vulnerable consumers face is through sustained, reliable funding of consumer organisations to provide a range of services aimed at supporting specific vulnerable consumer cohorts. Submissions to the Victorian Government’s interim response to the Victorian Review advocated for targeted support for vulnerable consumers by way of funding from government to consumer advocates who can then assist this consumer cohort.734 The Switched on Communities program, run by the Queensland Council of Social Service (QCOSS), involved approximately 3000 events and activities and engaged with approximately 6600 people. QCOSS estimates that the program reached over 41 000 people across south east Queensland. The outcomes from Switched on Communities included reduced usage, lower bills and greater access to concessions and rebates.
We consider that increased funding for these groups is essential to supplement services currently available, and to improve vulnerable consumers’ energy literacy to empower them to engage with the retail electricity market. Consumer groups and community organisations are best placed to provide assistance to vulnerable consumers as they have the required knowledge, experience and understanding to effectively target support to those most in need. As stated by the CPRC in a recent paper, ‘[i]nterventions and remedies for vulnerable customers should consider the specific types of vulnerabilities and barriers being experienced …integrated outreach and intervention strategies will be most effective when they leverage the strengths of different sectors and of organisations effective in reaching vulnerable consumers.’735 There are a range of ways in which consumer organisations (including providers like financial counsellors, social service providers, and even health care providers) can assist consumers facing broader personal challenges.
15.4.1 Examples of assistance for vulnerable consumers
Assisting consumers manage energy debt and affordability problemsThe difficulties that many consumers face with energy debt form part of a wider affordability problem. While energy is only one component of this affordability problem, a number of consumer groups have stressed the fact that, after rent or mortgage payments, energy (particularly electricity) is the largest bill for many consumers. As noted in our Preliminary Report, in struggling to pay accommodation and energy bills, many consumers go without other essentials such as medicine, clothing and even food.736 The Public Interest Advocacy Centre (PIAC) has also recently conducted a survey on disconnection which found that consumers go to various lengths to avoid disconnection, including cutting back on buying food or other groceries, borrowing money from family, selling personal possessions, and delaying medical treatment. Managing electricity bills and remaining out of energy debt will improve the lives of these consumers significantly while also enabling retailers to manage their debt recovery and income flow more effectively. This should also reduce retailer costs associated with bad debt, as discussed in detail in chapter 10.
Financial counsellors play an important role providing budgeting advice and assistance to consumers struggling to make ends meet. Given the prominence of electricity costs in most household budgets, counsellors can intervene on a consumer’s behalf with a retailer, which is particularly important when a consumer’s debt has become unmanageable and they are facing disconnection. They can also assist consumers who are finding it difficult to negotiate a payment plan with their retailer or who want to go onto a hardship program but are finding it difficult. For example, retailers often have onerous ‘commitment to pay’ requirements that need to be met before they will allow a consumer to go onto a hardship program and this can include a number of regular payments. Many consumers will find it difficult to meet these requirements. Financial counsellors, who are aware of the income and costs
734 Momentum Energy, Submission to DELWP’s Retail Market Review Consultation Paper, 3 April 2018, pp. 10–11; St Vincent de Paul, Submission to DELWP’s Retail Market Review Consultation Paper, March 2018, p. 1. Also, a recent article published in the Journal of Consumer Policy recommends ‘reliance on the process of empowerment coupled with targeted social policy measures’ (Maria Ioannidou, ‘Effective Paths for Consumer Empowerment and Protection in Retail Energy Markets’, Journal of Consumer Policy, vol 41, 2018, p. 152).
735 CPRC, Five preconditions of effective consumer engagement—a conceptual framework, 2018, p. 6.736 ACCC, Retail Electricity Pricing Inquiry—Preliminary Report, 22 September 2017, p. 145.

305 Retail Electricity Pricing Inquiry—Final Report
faced by that household, can accurately judge what that consumer is able to pay on a hardship program. This gives both the consumer and the retailer confidence that the best arrangement has been made to manage the debt and avoid disconnection. PIAC’s disconnection survey found that for consumers facing disconnection, not knowing where to get help was a significant barrier, and many consumers that had been disconnected considered that disconnection would have been less likely had they known where to go for help, or had someone to advocate on their behalf. We note that the recommendation in chapter 13 to cap conditional discounts at the reasonable savings that a retailer will make if the consumer meets the condition will also significantly assist vulnerable consumers.
Assisting consumers to understand financial assistance schemesThere are many ways that governments and retailers provide assistance to consumers who are struggling to pay their energy bills. Related to the above role, funding could be used to raise awareness of available concession schemes, hardship programs, payment plans and ombudsman schemes. While this information is provided in various places and is available, the approach taken by retailers in providing and guiding their customers to this information varies. For example, some hardship policies clearly stipulate that they will ensure concessions are applied to their hardship consumers’ accounts, and one retailer says it will help consumers fill out the forms if needed.737 However, other retailers’ policies indicate that the retailer will only refer consumers to government concession programs.738 In order to benefit from hardship programs and to enquire about them, consumers must first be aware that the hardship policy exists. This is not always the case for certain vulnerable consumers.739 The ACCC has also received feedback that many older consumers were reluctant to access retailers’ hardship programs due to a perception of stigma associated with being unable to pay their bills. Older consumers prefer to prioritise paying electricity bills over expenditure on other essentials such as food, medication and discretionary items. We note that no respondent to the Colmar Brunton survey aged 65 or over was on a hardship program (3 per cent of all survey respondents were on a hardship program). Approximately 2 per cent of survey respondents aged 65 or over were on a payment plan compared to 7 per cent of all survey respondents).
Vulnerable consumers may require assistance to find information about retail electricity offers, and then to weigh up the benefits of each option. This is something that a consumer or community organisation could assist them with. Such organisations would help to ensure appropriate assistance is provided to those who are eligible for it. These organisations could also assist consumers to learn about the market and what is available, encouraging them to become more involved. There are many organisations currently offering these services, and the ACCC considers that additional funding will enable such services to benefit many more consumers who require additional assistance to engage with the retail electricity market.
Assisting consumers understand market informationFunding could also be used to assist consumers to better understand the market and to gain confidence to navigate the offers that are presented by retailers. Improvements to the government-run comparator websites, along with other recommendations made by the ACCC in part 3, will assist consumers generally to engage. However, some consumers will struggle to navigate the market and will always require some assistance. We consider it is important, while providing assistance to consumers in the way of better hardship programs and concessions to help reduce costs, to also assist them to take steps to learn about and engage in the market. Consumer advocate organisations could assist them to learn to use government-run comparator websites, to read their energy bills, to know what to ask when considering an offer, and how to find important information. This will help vulnerable consumers to avoid the ‘loyalty tax’ imposed on consumers who remain with a retailer for an extended period without
737 Origin, Origin Hardship policy, clause 5.4, 25 August 2015, viewed 24 May 2018, https://www.originenergy.com.au/content/dam/origin/residential/docs/your-account/hardship-policy.pdf; Red Energy, Hardship Policy Victoria, New South Wales, South Australia, Queensland, clause 6, January 2011, viewed 24 May 2018, https://www.redenergy.com.au/docs/Red-Energy-Hardship-Policy.pdf.
738 AGL, Staying Connected Hardship policy and program details, clause 2.1, viewed 24 May 2018, https://www.agl.com.au/-/media/aglmedia/documents/help/staying-connected/agl_staying_connected_policy-mar-18.pdf; EnergyAustralia, National Hardship Policy, clause 7, September 2012, viewed 24 May 2018, https://www.energyaustralia.com.au/sites/default/files/2017–03/HardshipPolicy-LongVersion-Final.pdf; Alinta, Alinta Energy’s Financial Hardship Policy, October 2012, p. 3, viewed 24 May 2018, https://www.alintaenergy.com.au/Alinta/media/Images/ECpdfs/Customer%20Information/12_0120_AERS_Hardship_Policy_Oct05.pdf; Click Energy, Payment Difficulties, undated, p. 1, viewed 24 May 2018, https://www.clickenergy.com.au/payment-difficulties/; Powershop, Power On Powershop Hardship Policy, clause 3, 29 January 2013, viewed 24 May 2018, https://www.powershop.com.au/content/hardship/2013–01–29_Powershop_Hardship_Policy_Full_Version.pdf.
739 The ACCC received feedback that many older Australians were unaware of retailer hardship programs. This may be because this consumer group are not big users of the internet and many retailer hardship programs are found on retailer website.
https://www.originenergy.com.au/content/dam/origin/residential/docs/your-account/hardship-policy.pdf

306 Retail Electricity Pricing Inquiry—Final Report
seeking to switch. It would also be valuable to recent migrants to Australia and could be provided in the material they are given on arrival as part of their education program.
Assisting consumers with energy efficiencyFunding could also assist consumer and community organisations increase awareness of energy efficiency and the tools available to assist households to reduce electricity costs. This could include developing information resources aimed at particular consumer groups, informing consumers about various items that can assist energy efficiency, and updating consumers on new developments and options coming out on the market. Funding could also be used to provide alternatives to online information for consumers who do not have internet access and who are not comfortable seeking information that way. Such information could be provided through local libraries and community groups. This will ensure that fewer vulnerable consumers are left behind as more will be able to access new technologies and innovations and will have the best chance possible to reduce their energy usage and hence their bills.
The ACCC understands that in Tasmania, Aurora Energy has arranged for energy home efficiency experts and financial counsellors to jointly visit consumers in their homes and this has been well received by consumers. The ACCC considers that initiatives such as this one, which take account of a consumer’s financial situation as a whole and can assess how best to deal with electricity costs and usage within that context, are likely to significantly assist consumers. Funding for such schemes has the potential to make a big impact in the lives of consumers and brings consumers and industry together to solve problems in a practical way.
15.4.2 ACCC findingsThe ACCC considers that each year governments across the NEM should jointly resource a grant scheme to fund community and consumer organisations to provide targeted assistance to vulnerable consumers to improve energy literacy and assist them to find lower-priced offers.
We consider that the Australian Government should match any contribution made by each state or territory government. An alternative approach to funding would be to impose an industry levy on electricity retailers, based on customer numbers. However, we consider that the costs of targeting support to vulnerable consumers should be treated as a social cost, rather than a retail cost that will be added to every electricity bill across the NEM. The ACCC considers that consumers will end up paying more for electricity if retailers are required to meet this extra cost.
This increased funding of organisations to support vulnerable consumers must be coupled with a clear and sustained mechanism for support. We stress the importance of improved funding being provided on an ongoing basis and recommend that an independent organisation (government or non-government) be charged with administering the grants scheme and allocating it across the country on a needs basis. We consider that this approach will ensure that the funding is provided to a diverse range of organisations that are able to reach a mix of vulnerable consumer groups in the way that suits each group.
Funds should be provided to a central organisation in each NEM region to award to groups that apply for grants. Organisations should be required to report back each year on progress made and regularly reapply for funding. This will ensure measures are assessed and can be adapted if needed, but also that sufficient time is given to enable them to have an effect and for work to be done in some security.

307 Retail Electricity Pricing Inquiry—Final Report
We note that ECA currently administers a grant scheme for consumer advocates across the NEM. Given the targeted nature of this funding, we consider that the Council of Social Services in each NEM region are equally well equipped to administer this grant scheme, as was the case for Switched on Communities in Queensland.
Recommendation 38In addition to existing funding, the Australian Government and the relevant state or territory government should jointly fund (to a value of $5 per household in each NEM region, or $43 million NEM-wide, per annum) a grant scheme for consumer and community organisations to provide targeted support to assist vulnerable consumers to improve energy literacy. This grant scheme should be modelled on the approach taken by the Queensland Council of Social Services in administering the Switched on Communities program. This targeted support will assist vulnerable consumers to participate in the retail electricity market and choose an offer that suits their circumstances.
15.5 Adequacy of current hardship regulationUnder current hardship regulation, retailers must identify consumers facing financial hardship and help those consumers manage their energy bills on an ongoing basis.740 Hardship programs are designed to be a temporary measure to assist consumers facing payment difficulties get on top of their debt and then move off the program. Retailers have an awareness of the characteristics and situations of their hardship consumers. One retailer’s internal documents describe its current hardship consumers as having: ‘34% higher consumption than average. Debt per customer $2234 … consumption is high because they live in rentals, older homes, have cheaper and costly to run appliances. Segment mix of short and long [term] unemployed, immigrants, pensioners and large families.’
The NERL sets out minimum requirements that must be included in a retailer’s hardship program, including processes to identify a residential customer experiencing payment difficulties due to hardship and responding early once identified. Retailers must offer flexible payment options for hardship consumers, have processes to identify government concession programs and financial counselling services (and a process to notify hardship consumers of these services) and have processes to review the appropriateness of the hardship consumer’s retail market offer.741 Under the NERR, retailers must inform hardship consumers about their hardship policies, stipulate what must be considered when setting up a payment plan (such as a consumer’s ability to pay and any arrears owing), require late payment fees to be waived, and allow hardship consumers to use Centrepay as a payment option.742
15.5.1 Retailers’ administration of payment plans and hardship programsHardship regulation requires retailers to offer payment plans and hardship programs when consumers are identified as experiencing payment difficulties.743 While retailers must have processes in place to respond to financial hardship, it is often only when consumers are already in significant debt that hardship programs are considered. By this time, the problem is usually too large to be easily managed and dealt with, as many consumers could have acquired such a level of debt that they are unable to clear it through payment plans while keeping on top of the cost of their ongoing usage. In a survey on disconnection, PIAC found that a number of customers in its survey claimed to have been disconnected while on payment plans or hardship programs.744 The ACCC was advised of one example where a consumer had a debt of $2285 eight months after moving into a property, and while the retailer had noticed high usage at the property, this had not been discussed with the consumer. In this case the retailer had disconnected the consumer and would not reconnect them without a payment of
740 NERL, s. 43 (1).741 NERL, s. 44.742 NERR, version 12, r. 71–74; Victorian Code, cl. 71–4.743 NERL, s. 50.744 36 per cent of respondents said that they were on a payment plan when they were disconnected and 9 per cent on a hardship
program. PIAC stated that this did not mean that the programs were necessarily failures. However, it also stated that the research supports the view that assistance is being provided to a proportion of those who are in danger of getting disconnected, but that this assistance is not always effective.

308 Retail Electricity Pricing Inquiry—Final Report
50 per cent of the outstanding balance. The retailer had also not offered a payment plan at any time to the consumer prior to disconnection.
A number of recent reports on vulnerable consumers have also described significant deficiencies with the support that retailers provide consumers in financial hardship.745 For example, in 2017, the AER reported that an increasing number of consumers were being rejected from retailers’ hardship programs. In addition, the AER reported that consumers on hardship programs were finding it increasingly difficult to transition off them.746 The ACCC has also uncovered deficiencies in retailers’ approaches to hardship programs through documents compulsorily acquired from retailers, with an internal document from one retailer stating that one of its strategies to encourage engagement (amongst others) was to ‘disconnect, as a means to encourage engagement.’ Despite the requirements of the NERL and NERR, consumers continue to experience difficulty accessing these services. It is important to note that there are differences between retailer hardship policies. The ACCC has been advised that some smaller retailers take an inflexible approach towards negotiating payment arrangements and show a reluctance to provide medium-to long-term support for consumers experiencing hardship. The ACCC is also concerned that some electricity customers are in need and eligible for retailers’ hardship programs but do not access them due to the stigma associated with being on a ‘hardship program’. It is important that appropriate terminology is used to reduce the stigma attached to such programs. In October 2017 the ESC Victoria released its final decision for a new ‘payment difficulties framework’. This terminology may go some way to reducing the stigma attached to accessing hardship programs.
Some retailers’ internal documents indicate that they will avoid servicing consumers with a bad credit history. Retailers also encourage consumers to transfer to other retailers by offering to waive debt. The ACCC has also been advised that at least one small retailer has strongly encouraged hardship consumers who had made a request for assistance to transfer away to another retailer. In one instance, after the consumer requested a payment arrangement, they were advised by the retailer that the best option was to find another retailer. The consumer in this case wanted to pay their outstanding bills. However, the ACCC notes that in an internal document, one large retailer showed that it was willing to consider ways to assist consumers who were struggling with energy debt and that it was aware of the circumstances many of these consumers found themselves in. This document stated that the large retailer would ‘[p]rovide partial or complete debt waiver for customers who due to circumstances will be unable to ever repay their bill … Circumstances include: family violence, asylum seekers, family illness, job displacement …’
Financial counsellors report that consumers find it difficult to find someone to talk to from their retailer who can assist. There is a ‘gate keeping’ tendency whereby call centres screen calls and while hardship teams are often helpful and knowledgeable, the call centre is the first point of contact, and is often under resourced and its staff poorly trained.747 In addition, many consumers are unaware of hardship policies in the first place and often assume they must pay the amount owing without any power to negotiate repayment arrangements. They are unaware that they can negotiate with their retailer to pay in instalments or to go on a hardship program.
745 CPRC, Five Preconditions of effective consumer engagement—a conceptual framework, 2018, p. 17; CALC, Heat or eat?, August 2015, pp. 8, 17–19.
746 AER, Energy affordability problems head to hardship and disconnections: AER retail report, Media Release, 22 November 2017, viewed 9 May 2018, https://www.aer.gov.au/news-release/energy-affordability-problems-lead-to-hardship-and-disconnections-aer-retail-report; AER, Annual Report on Compliance & Performance of the Retail Energy Market, 2016–17, p. 3; The AEMC has also recently reported a decrease in customers successfully completing hardship programs and a significant increase in the numbers of customers being excluded from hardship programs. This comprises an increase from around 46 per cent in 2015–16 to 57 per cent in 2016–17 for electricity customers in NECF regions (AEMC, 2018 Retail Competition Review Final Report, June 2018, p. 183).
747 This behaviour may also breach the NERL. In November 2017 Origin paid penalties of $40 000 relating to its alleged failure to provide hardship assistance to a residential customer and its alleged wrongful disconnection of the customer’s premises in NSW in 2015. Both the customer and a volunteer from a charitable organisation had provided information to Origin about the customer’s financial difficulties but the customer was never transferred to the hardship team or put on the hardship program. Origin then failed to follow the proper process before disconnecting the customer (AER, Origin Energy pays $40 000 in penalties for alleged wrongful disconnection and failure to provide hardship assistance, Media Release, 17 November 2017).

309 Retail Electricity Pricing Inquiry—Final Report
Box 15.1: Case studies: consumers’ experience with hardship policies748
Johnny is in his late 40s, has alcohol dependency, is going deaf and has dementia. He receives a disability support pension. It is important to him to be able to live independently and Johnny’s mother is trying to assist him as he is struggling to deal with electricity debt. Johnny’s mother has been trying to make a payment arrangement with the electricity retailer for electricity supply, but the retailer refused to review payment arrangements and also refused a number of requests for Johnny to go on a hardship plan. The retailer insisted that Johnny repay the full amount of the debt before they will consider allowing him to go on a hardship plan. Disconnection was initiated by the retailer, but did not take place. Johnny and his mother sought advice from a financial counsellor. The retailer accepted a fortnightly payment of $76 on the condition that Johnny make an application to the South Australian Emergency Electricity Payment Scheme for financial assistance.749 The outcome was that Johnny’s debt is $1293, his average use per fortnight is $70 and his payment (negotiated with the retailer) is $76 per fortnight. Johnny’s account must be fully reviewed in three months’ time.
Susan was working full-time as a midwife until January 2018 when she needed to have surgery. It did not go well and Susan needs three more operations to correct the problem. Susan’s post-tax income before the surgery was about $2500 per fortnight, but she is now receiving $1500 per fortnight. Susan hopes to be able to return to work in October 2018. Susan has two children who live with her and has received an extension from Centrelink for child support. Susan is a dual fuel customer and always paid her bills on time up to January 2018, but now finds bills difficult to pay. Susan contacted her retailer to ask to be put on a hardship program until she has full-time income again. Susan’s request was refused because she had recent energy debt. The retailer demanded a payment of $20 per fortnight for each of electricity and gas and four consecutive fortnightly payments before they would consider reviewing the situation. Susan’s current electricity debt is $1357 and gas debt is $447. Susan is still at risk of disconnection as she still cannot meet the fortnightly payment (‘commitment to pay’) requirement. Susan has accepted the offer of a free energy audit and an application has been made for the South Australian Emergency Electricity Payment Scheme for assistance to reduce the outstanding electricity bill and to the Wyatt Trust for the gas bill. Susan plans to contact the retailer with her financial counsellor at their next appointment to seek access to a hardship program once she has made the required four payments.
These case studies demonstrate how consumers can build up large amounts of debt and find it difficult to access hardship programs or payment plans. It also demonstrates that at a certain point, payment plans and hardship programs are of limited benefit to some consumers and that the assistance provided by financial counsellors and other grant schemes for vulnerable consumers plays a crucial role.
748 These case studies were developed by UnitingCare Wesley Bowden and Uniting Communities from information provided by financial counsellors from both organisations.
749 The Emergency Electricity Payment Scheme provides a payment of up to $400 for low income earners who are experiencing significant financial difficulties and are at risk of disconnection. Applications must be made through financial counsellors and applicants can only receive one payment every three years (Affordable Living SA, Emergency Electricity Payment Scheme, viewed 1 May 2018, https://affordablesa.com.au/news/eeps-emergency-electricity-payment-scheme).
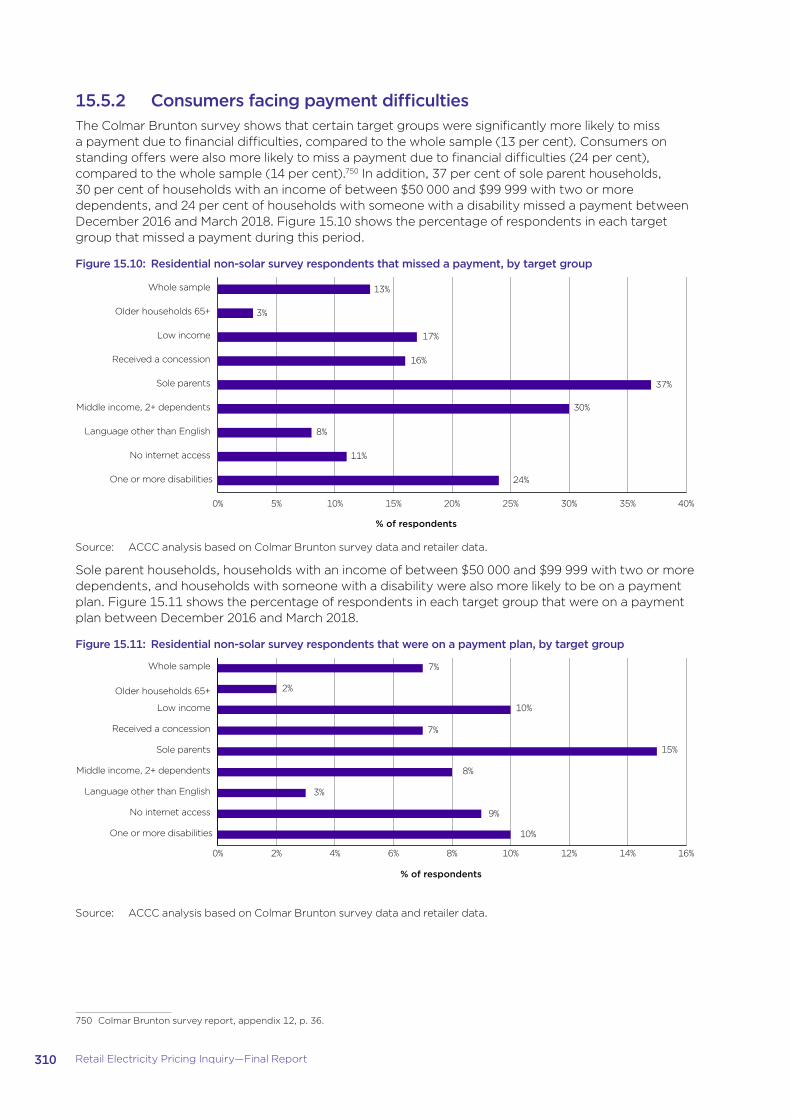
310 Retail Electricity Pricing Inquiry—Final Report
15.5.2 Consumers facing payment difficultiesThe Colmar Brunton survey shows that certain target groups were significantly more likely to miss a payment due to financial difficulties, compared to the whole sample (13 per cent). Consumers on standing offers were also more likely to miss a payment due to financial difficulties (24 per cent), compared to the whole sample (14 per cent).750 In addition, 37 per cent of sole parent households, 30 per cent of households with an income of between $50 000 and $99 999 with two or more dependents, and 24 per cent of households with someone with a disability missed a payment between December 2016 and March 2018. Figure 15.10 shows the percentage of respondents in each target group that missed a payment during this period.
Figure 15.10: Residential non-solar survey respondents that missed a payment, by target group
0% 5% 10% 15% 20% 25% 30% 35% 40%
One or more disabilities
No internet access
Language other than English
Middle income, 2+ dependents
Sole parents
Received a concession
Low income
Older households 65+
Whole sample
24%
11%
8%
30%
37%
16%
17%
3%
13%
% of respondents
Source: ACCC analysis based on Colmar Brunton survey data and retailer data.
Sole parent households, households with an income of between $50 000 and $99 999 with two or more dependents, and households with someone with a disability were also more likely to be on a payment plan. Figure 15.11 shows the percentage of respondents in each target group that were on a payment plan between December 2016 and March 2018.
Figure 15.11: Residential non-solar survey respondents that were on a payment plan, by target group
0% 2% 4% 6% 8% 10% 12% 14% 16%
Older households 65+
One or more disabilities
No internet access
Language other than English
Middle income, 2+ dependents
Sole parents
Received a concession
Low income
Whole sample
10%
9%
3%
8%
15%
7%
10%
2%
7%
% of respondents
Source: ACCC analysis based on Colmar Brunton survey data and retailer data.
750 Colmar Brunton survey report, appendix 12, p. 36.

311 Retail Electricity Pricing Inquiry—Final Report
Approximately 7 per cent of Colmar Brunton survey respondents were on payment plans, and 3 per cent were on retailer hardship programs. Respondents in rental accommodation were also more likely to be on a hardship program or payment plan than the average for the whole sample. In particular, respondents in public housing were also more likely to be on a payment plan (12 per cent) or retailer hardship program (13 per cent), when compared to the average for the whole sample. Figure 15.12 shows the percentage of survey respondents in various housing types that are on a payment plan or hardship program.
Figure 15.12: Residential non-solar survey respondents that were on a payment plan or hardship program by housing status
0%
2%
4%
6%
8%
10%
12%
14%
Own outrightPaying o a mortgagePrivate rentalPublic rentalWhole sample
HardshipPayment plan
% o
f re
spo
nden
ts
7%
3%
12%
13%
11%
5%
7%
1%
2%
0%
Source: ACCC analysis based on Colmar Brunton survey data and retailer data.
15.5.3 Recent action to improve hardship regulationIn 2017, the AER reviewed a number of retailer hardship policies. Most of those policies showed deficiencies and required improvement.751 Many retailers could not report on implementation at a customer level, leading to a wide variation in the application of these policies.752 Establishing a breach under the current hardship rules requires the conduct be directly linked to a failure in the retailer’s hardship policy. It can be difficult for the AER to establish that a breach has occurred, particularly given the broad and subjective language used in many policies.753
The AER recently proposed a rule change that would see it develop an enforceable guideline relating to hardship policies.754 If the rule change is implemented, while hardship policies will remain based on minimum requirements set out in the NERL, the AER’s guidelines will provide clearer direction on how a retailer has implemented those minimum requirements in formulating its hardship policy. This may include specific action-based statements to give effect to the requirements in clear and objective language. This will assist retailers to fulfil their obligations to consumers in financial hardship and improve consumer outcomes by providing certainty and a point of reference across the industry. It will also assist the AER in using its enforcement tools to take action against retailers that fail to fulfil their hardship obligations. On 24 May 2018, the AEMC released a consultation paper in relation to the proposed rule change. Consultation closed on 28 June 2018.755
751 AER, Request for rule change—strengthening protections in the National Energy Retail Rules for customers in financial hardship, Letter to the AEMC, 21 March 2018, p. 7.
752 AER, Strengthening protections for customers in financial hardship, Media Release, 27 March 2018; AER, Request for rule change—strengthening protections in the National Energy Retail Rules for customers in financial hardship, Letter to the AEMC, 21 March 2018, p. 1.
753 AER, Request for rule change—strengthening protections in the National Energy Retail Rules for customers in financial hardship, Letter to the AEMC, 21 March 2018, p. 17.
754 AER, Request for rule change—strengthening protections in the National Energy Retail Rules for customers in financial hardship, Letter to the AEMC, 21 March 2018.
755 AEMC, Strengthening protections for customers in financial hardship: have your say, Media Release, 24 May 2018.

312 Retail Electricity Pricing Inquiry—Final Report
The ESC Victoria is also in the process of reviewing and revising the Victorian Code to adopt the recommendations from its 2015 hardship review.756 These revisions will increase protections for consumers in hardship and result in much earlier intervention for people in payment difficulty. ESC Victoria’s hardship review recommended a framework providing a clear set of minimum standards that ensure those having difficulty paying their energy bills have a right to assistance.757 This recommended amendment will commence on 1 January 2019.758
15.5.4 ACCC findingsThe ACCC considers that there are currently deficiencies with hardship regulation and with the way retailers manage their hardship programs. Retailers could, and should, be doing more to support vulnerable consumers in financial hardship to minimise the risk of consumers entering into hardship programs when they have already accrued significant debt. The ACCC is concerned by the number of consumers being excluded from hardship programs and the overall decline in the number of consumers failing to successfully complete these programs.
The ACCC considers that more should be done to ensure that retailers proactively engage with consumers experiencing payment difficulties and implement broader outreach programs to subscribe consumers to hardship programs at a much earlier stage. Retailers could also go further to assist consumers to manage payments, for example by staggering gas and electricity bills. The ACCC considers that there are a number of indicators that a consumer could be at risk of payment difficulties:
�� where they have not made two or more payments
�� where a consumer (or a financial counsellor on their behalf) contacts a retailer concerning a bill and notes their difficulty in paying the bill or indicates they are forgoing basic needs to meet the cost (food and health care)
�� where they are having difficulties understanding key documentation (for example, if they have requested a translator or detailed assistance with understanding their bill)
�� where they are referred from a financial counsellor because the counsellor considers that they would benefit from a hardship program. However, the ACCC notes that interaction with a financial counsellor or other consumer advocate should not be a prerequisite to entry into a hardship program.
The ACCC considers that an AER guideline will address concerns regarding the high standards that some retailers set for entry into a hardship program, and the reasons why consumers can be removed from a hardship program. The ACCC considers that implementing the AER’s proposed rule change will have a positive impact on retailer costs (administration of hardship program and call centre costs) as proactive support for consumers in financial hardship will lead to lower levels of energy debt. Early identification and engagement with consumers will likely also reduce disconnection rates.
The ACCC considers that if retailers are more proactive and considered in the steps they take to avoid consumers accruing debts in the first place, and ultimately avoiding disconnections, the financial impact upon retailers and the broader community may decrease. While offering and providing the services under retailers’ hardship programs to more consumers may increase retailer costs, we consider that ultimately it will reduce retailer’s costs (particularly in relation to bad debt) and also costs to the community, as fewer consumers will face difficult financial situations. While the ACCC understands that retailers must operate their businesses efficiently to achieve returns for their investors, retailers must also comply with the energy laws which place significant emphasis on the retailers’ role to ensure consumers in hardship are assisted and disconnection is avoided.
The proposed AER rule change will set out the required elements for workable hardship policies of a high standard which retailers can adapt to their circumstances and those of their customers. The enforceability of the guidelines will enable the AER to act where needed where hardship policies fall short. The ACCC considers that the AER’s proposed rule change will provide an incentive for retailers to take a more proactive and careful approach to hardship, while enabling them to independently determine how they will support vulnerable consumers. The ACCC also considers the AER’s proposed rule change, if made, will address the concerns with retailers not treating consumers in vulnerability
756 ESC Victoria, Supporting Customers, Avoiding Labels—Energy Hardship Inquiry Final Report, February 2016.757 Ibid., pp. 60–2.758 ESC Victoria, Amendments to the Energy Retail Code: Payment Difficulties, October 2017, cl. 1(2).
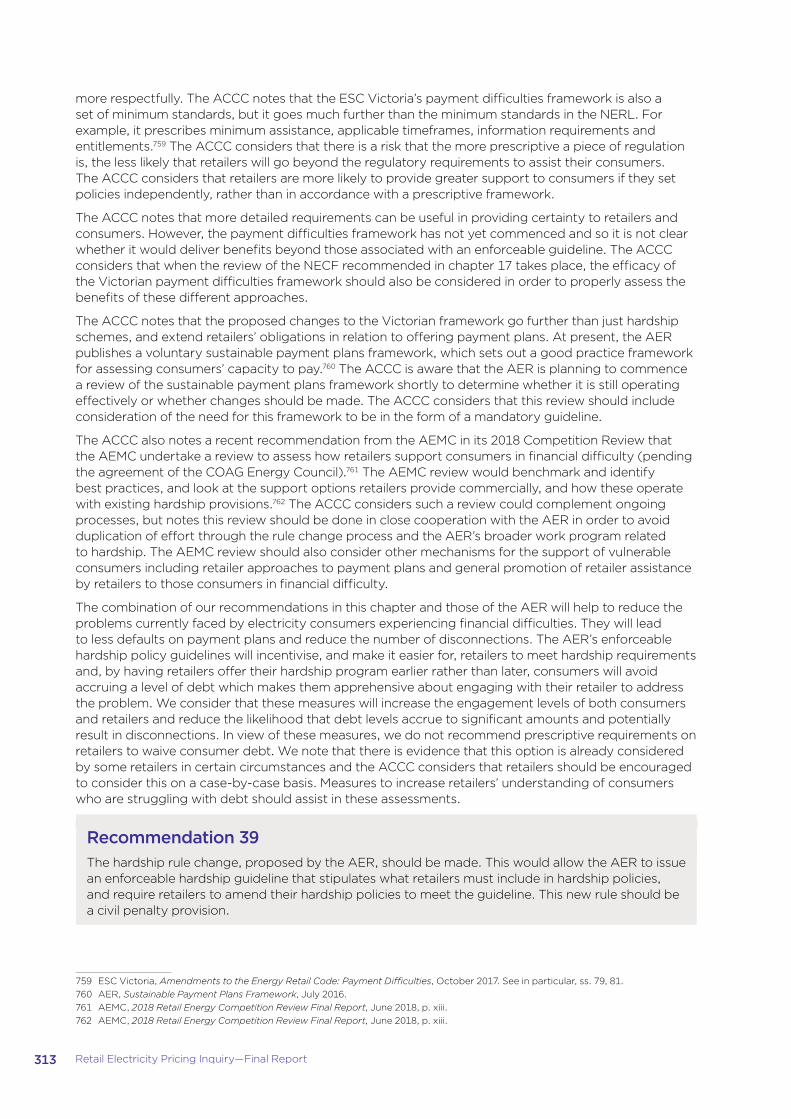
313 Retail Electricity Pricing Inquiry—Final Report
more respectfully. The ACCC notes that the ESC Victoria’s payment difficulties framework is also a set of minimum standards, but it goes much further than the minimum standards in the NERL. For example, it prescribes minimum assistance, applicable timeframes, information requirements and entitlements.759 The ACCC considers that there is a risk that the more prescriptive a piece of regulation is, the less likely that retailers will go beyond the regulatory requirements to assist their consumers. The ACCC considers that retailers are more likely to provide greater support to consumers if they set policies independently, rather than in accordance with a prescriptive framework.
The ACCC notes that more detailed requirements can be useful in providing certainty to retailers and consumers. However, the payment difficulties framework has not yet commenced and so it is not clear whether it would deliver benefits beyond those associated with an enforceable guideline. The ACCC considers that when the review of the NECF recommended in chapter 17 takes place, the efficacy of the Victorian payment difficulties framework should also be considered in order to properly assess the benefits of these different approaches.
The ACCC notes that the proposed changes to the Victorian framework go further than just hardship schemes, and extend retailers’ obligations in relation to offering payment plans. At present, the AER publishes a voluntary sustainable payment plans framework, which sets out a good practice framework for assessing consumers’ capacity to pay.760 The ACCC is aware that the AER is planning to commence a review of the sustainable payment plans framework shortly to determine whether it is still operating effectively or whether changes should be made. The ACCC considers that this review should include consideration of the need for this framework to be in the form of a mandatory guideline.
The ACCC also notes a recent recommendation from the AEMC in its 2018 Competition Review that the AEMC undertake a review to assess how retailers support consumers in financial difficulty (pending the agreement of the COAG Energy Council).761 The AEMC review would benchmark and identify best practices, and look at the support options retailers provide commercially, and how these operate with existing hardship provisions.762 The ACCC considers such a review could complement ongoing processes, but notes this review should be done in close cooperation with the AER in order to avoid duplication of effort through the rule change process and the AER’s broader work program related to hardship. The AEMC review should also consider other mechanisms for the support of vulnerable consumers including retailer approaches to payment plans and general promotion of retailer assistance by retailers to those consumers in financial difficulty.
The combination of our recommendations in this chapter and those of the AER will help to reduce the problems currently faced by electricity consumers experiencing financial difficulties. They will lead to less defaults on payment plans and reduce the number of disconnections. The AER’s enforceable hardship policy guidelines will incentivise, and make it easier for, retailers to meet hardship requirements and, by having retailers offer their hardship program earlier rather than later, consumers will avoid accruing a level of debt which makes them apprehensive about engaging with their retailer to address the problem. We consider that these measures will increase the engagement levels of both consumers and retailers and reduce the likelihood that debt levels accrue to significant amounts and potentially result in disconnections. In view of these measures, we do not recommend prescriptive requirements on retailers to waive consumer debt. We note that there is evidence that this option is already considered by some retailers in certain circumstances and the ACCC considers that retailers should be encouraged to consider this on a case-by-case basis. Measures to increase retailers’ understanding of consumers who are struggling with debt should assist in these assessments.
Recommendation 39The hardship rule change, proposed by the AER, should be made. This would allow the AER to issue an enforceable hardship guideline that stipulates what retailers must include in hardship policies, and require retailers to amend their hardship policies to meet the guideline. This new rule should be a civil penalty provision.
759 ESC Victoria, Amendments to the Energy Retail Code: Payment Difficulties, October 2017. See in particular, ss. 79, 81.760 AER, Sustainable Payment Plans Framework, July 2016.761 AEMC, 2018 Retail Energy Competition Review Final Report, June 2018, p. xiii.762 AEMC, 2018 Retail Energy Competition Review Final Report, June 2018, p. xiii.

314 Retail Electricity Pricing Inquiry—Final Report
15.6 State government collective bargaining processes for vulnerable consumers
A number of submissions to the Inquiry suggested that a government-led collective bargaining process for a vulnerable consumer offer could assist vulnerable consumers in choosing an offer. Collective bargaining programs are currently being trialled in South Australia and Victoria.763
In November 2017, the South Australian Government finished a tender process for an energy discount offer for low income and vulnerable households. Origin secured the tender to provide energy concession customers with the SA Concession Energy Discount Offer (the SA concession offer).764 The SA concession offer also includes flexible payment options, and no late payment, processing, paper bill, credit card or exit fees. The SA concession offer is an opt-in scheme open to all South Australian energy concession recipients. Eligible consumers were informed of the offer by letter and required to complete a hard copy application form if interested in signing up. In April 2018, Origin reported to EWOSA that it had received 40 000 forms regarding the offer, and of these, 21 000 were existing Origin customers.
The Victorian Government has also recently tendered for an energy brokerage service pilot, to be rolled out from mid-2018.765 The aim of the project is to design and run a pilot for a subset of vulnerable consumers to test and analyse the need for, and the benefits of, providing an independent brokerage service. The trial will involve up to 10 000 vulnerable households. Depending on the outcomes of the trial, the Victorian Government will explore implementing a group purchasing/single buyer scheme more broadly.
15.6.1 ACCC findingsThe ACCC considers that the outcome of these trials should be carefully assessed to determine if these trials have resulted in lower prices for vulnerable consumers. Some benefits from the SA Concession Offer have already been reported, including some consumers using the offer to negotiate with their current retailer to obtain a better deal. The SA concession offer includes a number of the protections available in standard retail contracts (including flexible payment options, no late payment fee, no processing fee, no credit card fee, no paper bill fees and no exit fee); however, it does not include the requirement that the retailer can only change the rate every six months. Comparing this offer with other market offers in South Australia, we consider it to be competitively priced. For any scheme of this type, we consider that the sign-up process should be simple, that consumers should clearly understand what it is they are being offered and that consumers should be able to exit the deal without penalty to take advantage of other offers if they choose.
15.7 Other avenues to assist consumers15.7.1 Consumer advocacy during policy and regulatory processesConsumer advocates play an important role in advocating for their constituency during policy development processes and regulatory processes. A broad range of groups have provided valuable input to the Inquiry. The ACCC considers that it is important that governments continue to appropriately fund consumer and small business groups to advocate on behalf of their constituents during policy and regulatory processes. This is particularly the case for those groups who advocate on behalf of vulnerable consumers.
763 The Brattle Report, appendix 11, p. 51.764 South Australian Government, Energy concession discount offer, viewed 29 May 2018, https://www.sa.gov.au/topics/care-and-
support/financial-support/concessions/energy-bill-concessions/energy-discount-offer; Origin, Origin to deliver big savings to South Australian concession holders, 7 December 2017, https://www.originenergy.com.au/blog/big-picture/origin-to-deliver-big-savings-to-south-australian-concession-hol.html.
765 Tenders Victoria, Energy Brokerage Service Pilot, viewed 27 March 2018, https://www.tenders.vic.gov.au/tenders/tender/display/tender-details.do?id=20572&action=display-tender-details.
315 Retail Electricity Pricing Inquiry—Final Report
There are a variety of mechanisms currently in place where advocacy groups work on behalf of consumers766, and we consider that these groups should be used to provide input on behalf of vulnerable consumers in the electricity market. These groups could also assist retailers to implement and improve measures that are designed to assist vulnerable consumers. These groups could provide input on hardship polices, ongoing advice concerning vulnerable consumers, educating consumers on new policies, and assistance in developing marketing material, educational resources and comparator tools designed to assist vulnerable consumers to better understand key information.
We consider that the ability of consumer groups to be meaningfully involved in policy advice and implementation rests, to a large degree, on adequate, sustained funding. As such, we reiterate the importance of measures to guarantee this funding and our recommendation concerning well-targeted and sustained government grant schemes for consumer advocates.
15.7.2 Energy efficiency schemesThere are a number of energy efficiency schemes currently operating across the NEM assisting vulnerable consumers make their homes energy efficient. These include Australian Government initiatives, a number of state and territory schemes, and other smaller projects run by not-for-profit organisations. These schemes are likely to assist some vulnerable consumers to manage their consumption and reduce electricity bills.
Box 15.2: Current energy efficiency projects aimed at helping vulnerable consumersThe Australian Government has issued a three-year grant to ECA to undertake the Power Shift Project, a review of low income energy efficiency programs. ECA is also required to conduct research with the aim of providing policy makers, industry and other stakeholders with information about what works and what does not work when helping energy consumers to manage their bills, and why. This information is expected to lead to better products, tools and programs to help consumers manage their energy use and bills.767
The Australian Government has also recently decided to conduct a review of the Greenhouse and Energy Minimum Standards Act 2012 (Cth), which allows the Australian Government to set uniform national energy efficiency standards for appliances and equipment.768
In December 2017, the ACT Government launched a new low income housing rebate scheme to support the rollout of solar PV systems to low income housing. Eligible participants (home owner occupiers with an Australian Government concession card) can access a subsidy of up to 60 per cent (capped at $3000) of the total cost of a solar PV system along with a three-year interest free loan to pay off the difference. The expected savings for consumers are estimated at $300 to $900 a year.769
766 These include the Customer Consultative Group, which provides advice to the AER in relation to the AER’s functions under energy laws affecting energy consumers. Participating organisations inform the AER about various issues which impact on the groups they represent and discuss key energy consumer issues with other consumer representatives. See https://www.aer.gov.au/about-us/customer-consultative-group for details of the group and its membership. Other groups include ECA, which works directly with COAG on behalf of consumers and businesses (http://energyconsumersaustralia.com.au/) and the ACOSS.
767 ECA, Powershift, viewed 2 May 2018, http://energyconsumersaustralia.com.au/projects/power-shift/.768 Department of the the Environment and Energy, Review of energy efficiency legislation, Media Release, 19 January 2018.769 ACT Government, Helping low income households lower their emissions and their energy costs, Media Release, 19 December 2017.

316 Retail Electricity Pricing Inquiry—Final Report
15.7.3 Renters and those outside the traditional energy marketAs discussed in the ACCC’s Preliminary Report, consumers living in rental accommodation or within an embedded network770 are limited in their energy choices and can find it difficult to access consumer protections available to other consumers.771 Although not always the case, many vulnerable consumers live in these types of accommodation, particularly consumers in public housing.
Embedded networks regulation has been the subject of a number of ongoing reviews and analysis by the AEMC, AER and the Victorian Government. This has produced a number of recommendations designed to enhance competition and improve consumer protections for embedded network customers. An outline of these reviews, their findings and planned next steps is in appendix 3. The proposed changes include a range of measures designed to assist consumers including better information disclosure, access to ombudsmen schemes and dispute resolution (which has been implemented by the AER and ESC Victoria). They also include provision for monitoring and enforcement and measures to improve access to competition within embedded networks. Given this extensive work already underway, the ACCC considers that improvements to the embedded network consumer experience will be made through these processes.
The ACCC acknowledges that consumers who rent, particularly consumers in public housing, face restrictions in their ability to improve the energy efficiency of their homes and reduce the cost of their electricity supply. They are unable to easily purchase products such as insulation or solar panels. Poor design and lack of maintenance of many rental properties are also an issue, with ill-fitting windows and doors and poor heating options creating high bills. A particular issue facing those in rental accommodation is that they have limited access to solar PV systems. In the Colmar Brunton survey, approximately 21 per cent of all respondents have solar, whereas less than 1 per cent of those in public rental and only 6 per cent of those in private rental have access to solar PV systems (see figure 15.13).
Figure 15.13: Residential solar survey respondents by housing status
0%
10%
20%
30%
40%
Paying o� mortgageOwn outrightPublic RentalPrivate Rental
6%
< 1%
32%
25%
% o
f re
spo
nden
ts
Source: ACCC analysis based on Colmar Brunton survey data and retailer data.
770 Embedded networks are sites with multiple households or businesses (typically apartment blocks, retirement villages, caravan parks and shopping centres) where electricity to the site is provided through a single network connection point. The site operator purchases all the energy required at the site and then on-sells it to the tenants or residents based there. Consumers located in embedded networks have limited access to alternative suppliers of electricity.
771 ACCC, Retail Electricity Pricing Inquiry—Preliminary Report, 22 September 2017, p. 150.

317 Retail Electricity Pricing Inquiry—Final Report
Box 15.3 outlines a number of initiatives underway to improve renters’ access to solar.
Box 15.3: Measures to assist renters access solar PVThe City of Darebin in Melbourne has rolled out a program to help residents, businesses and organisations install solar panels. Under the program, the City of Darebin pays the upfront cost of the system and then the tenant (or landlord) pays it off over 10 years, interest free.772
The Citizens Own Renewable Energy Network Australia, a not-for-profit group, has partnered with Z-NET Uralla to offer interest free loans to landlords for solar PV or other energy efficient improvements on the undertaking that landlords will raise their rent by no more than half of what the tenant will save on power bills.773
The Queensland Government is installing solar panels in three trial locations (Cairns, Rockhampton and Logan) to deliver cheaper energy to public housing tenants. It is also trialling a 200 kW rooftop solar farm installed onto government-owned buildings in the remote Indigenous community of Lockhart River. The Cairns and Rockhampton trial commenced in September 2017 and the Logan trial is expected to commence in mid-2018. When results from the trials are available, the Queensland Government will evaluate the costs and benefits and decide whether to expand the program across Queensland.774
In mid-2016, the City of Adelaide launched Solar Savers Adelaide, a program designed to remove the upfront costs of installing solar PV energy systems for eligible low-income residents or rental properties in the City of Adelaide. Under the program, the Council will fund the supply and installation of 2 kW solar PV energy systems. Costs will be recovered through a separate rate charged to the property and paid off in quarterly instalments over a 10-year period by the property owner.775 The installation process began in July 2017.
Enova Energy is installing ‘community solar gardens’ on rooftops, where consumers can apply for one or more solar panels that are located on a ‘host’ rooftop. This means that consumers that traditionally would not be able to invest in solar (including renters) will be able to invest in solar PV technology.776
The ACCC considers that governments and the market are making progress towards addressing many of the issues that both renters and consumers outside the NEM experience. Such progress should be maintained to ensure that consumers in public and private rentals, and embedded networks, are not disproportionately affected by electricity price increases. Steps to improve energy efficiency of rental properties, particularly public housing, could form part of these efforts.
772 City of Darebin, Solar programs, viewed 2 May 2018, http://www.darebin.vic.gov.au/Darebin-Living/Caring-for-the-environment/EnergyClimate#Solar-Programs.
773 Citizens Own Renewable Energy Network, Breakthrough projects, viewed 2 May 2018, https://corenafund.org.au/big-win-projects/current-breakthrough-projects/.
774 Queensland Government, Solar panel trial, viewed 2 May 2018, https://www.qld.gov.au/housing/public-community-housing/during-your-tenancy/solar-panel-trial.
775 City of Adelaide, Solar Savers Adelaide, viewed 2 May 2018, https://yoursay.cityofadelaide.com.au/solarsavers.776 Enova Energy, Solar Garden, viewed 5 June 2018, https://enovaenergy.com.au/solargarden/.
318 Retail Electricity Pricing Inquiry—Final Report
16. Measuring outcomes and improvements in the market and appropriate tools for the AER
Key points
�� There are numerous reports monitoring prices across the NEM that overlap and there is no single, authoritative and comprehensive source of consumer prices in the market.
�� There are some deficiencies in the current approach to reporting processes. In particular, there is no transparency over what consumers are actually paying, the reports are not supported by effective information gathering powers, and there are significant gaps in the reporting of business and consumer outcomes.
�� The national energy laws should be supported by comprehensive and appropriate penalties to ensure businesses comply with their responsibilities and consumers are protected.
�� Penalties under the national electricity laws are generally set at a lower level than comparable regulatory regimes in Australia like the ACL. To build a strong compliance culture in retail energy markets, energy market penalties should be increased in line with the ACL.
This chapter deals with two issues:
1. Price reporting and monitoring of the electricity market and ways to improve market transparency in retail and wholesale markets (section 16.1)
2. Appropriate tools for the AER, including penalties for non-compliance with electricity laws (section 16.2).
16.1 Reporting in the NEMScrutiny of retail electricity pricing and competition over recent years has allowed governments, regulators and policy makers in the NEM to gain some understanding of the trends in retail electricity pricing. This has helped inform assessments about the effectiveness of retail competition and has helped identify trends such as growing retail price dispersion.
The numerous price reporting mechanisms detailed in box 16.1 and undertaken by the AER and AEMC, the ABS, state governments, and not-for-profit organisations (St Vincent de Paul) observe retail prices over time, and have been a key part of identifying the affordability problem with electricity.
319 Retail Electricity Pricing Inquiry—Final Report
Box 16.1: Current retail price reporting of the NEM
�� ABS measures electricity costs as part of the CPI—including retailer surveys relating to electricity prices in capital cities. The ABS CPI for electricity is the longest running electricity price series in the NEM.777
�� AEMC Residential Electricity Price Trends Report—provides advice on what factors are driving changes in electricity prices in the near term. To estimate price changes the AEMC uses real offer data and also estimates price trends for the next three years based on publicly available data and wholesale market modelling.778
�� AEMC Retail Energy Competition Review—analyses market factors in retail electricity and gas markets including customer activity (switching and consumer sentiment), consumer outcomes (typical savings achieved when switching retailers), ease of market entry and exit, independent rivalry and prices.779
�� AER report on the performance of the retail energy market—reports retailer market performance information and residential prices based on the AER’s electricity bill benchmark, and includes representative low income costs and affordability metrics.780
�� AER State of the energy market—includes information on retail prices using pricing for residential single rate offers published on the Energy Made Easy and Victorian Energy Compare websites.781
�� Essential Services Commission of South Australia—South Australia Energy Retail Offer Prices—provides generally available residential and small business offers for small consumers in South Australia.782
�� ESC Victoria—Victorian Energy Market Report—provides generally available residential and small business offers for small consumers in Victoria.783
�� IPART—monitors and reports annually on competition in the retail electricity market in NSW, including price reporting. The report uses its own data, plus AEMC data to calculate residential and small business standing offers and most common market offers.784
�� QCA—in addition to its price-setting function for regional Queensland, monitors and reports annually on retail prices in the south east Queensland retail electricity market.785
�� OTTER—produces reports that review the service standards and pricing of the Tasmanian energy supply industry. These reports include prices for residential and small business consumers based on adjusted annual consumption data.786
�� St Vincent de Paul Tariff Tracking project—reports at least annually on retail electricity prices on a state-by-state basis across the NEM looking at standing and market offers by retailer and highlighting differences between network regions.787
�� ECA SME Retail Tariff Tracker project—collects retail offers available to small businesses from the AER’s Energy Made Easy website and directly from retailers (commenced 2017).788
777 See, for example, ABS, 6401.0—Consumer Price Index, Australia, March 2018.778 See, for example, AEMC, 2017 Residential Electricity Price Trends, December 2017.779 See, for example, AEMC, 2018 Retail Energy Competition Review, June 2018.780 See, for example, AER, Annual Report on Compliance and Performance of the Retail Energy Market 2016–17, November 2017.781 See, for example, AER, State of the energy market, May 2017.782 See, for example, Essential Service Commission South Australia, Energy Retail Offers Comparison Report 2016–17, August 2017.783 See, for example, ESC Victoria, Victorian Energy Market Report 2016–17, November 2017.784 See, for example, IPART, Review of the Performance and Competitiveness of the Retail Electricity Market in NSW, December 2017.785 See, for example, The Queensland Competition Authority, Ministerial Advice—Retail Electricity Prices in South East and Regional
Queensland, November 2017.786 See, for example, OTTER, Standing Offer Price Comparison Reports, viewed 30 May 2018, http://www.economicregulator.tas.gov.
au/electricity/reports/price-comparisons/standing-offer-price-comparison-reports.787 See, for example, St Vincent de Paul, Energy, viewed 30 May 2018, https://www.vinnies.org.au/page/Our_Impact/Incomes_
Support_Cost_of_Living/Energy/.788 See, for example, ECA, SME Retail Tariff Tracker: Final Report December 2017, December 2017.
http://www.economicregulator.tas.gov.au/electricity/reports/price-comparisons/standing-offer-price-c
320 Retail Electricity Pricing Inquiry—Final Report
As can be seen in box 16.1, there are numerous reports to observe retail electricity offers in the market. There is significant value to the public and policy makers provided through these reports. However, some deficiencies in the current approach include:
�� none of the reports provide transparency around what consumers are actually paying. Current price reporting only provides estimates of consumer bills based on benchmark usage amounts
�� the way pricing is constructed (including the applied assumptions and methodologies) by the different reporting bodies varies and pricing results are not readily comparable
�� none of the reports are supported by effective information gathering powers to allow regulators or governments to have a full understanding of retail costs and margins, and other complementary information like what types of offers consumers are on
�� while there is duplication of effort around residential prices, there are also significant gaps particularly around business customer price reporting and outcomes. Prior to 2017, there was very little transparency of business offers and outcomes.
A large part of the Inquiry has been about collecting and analysing data to ‘fill in the gaps’ and to provide insights into the market that are not available through the current price reporting arrangements. The ACCC was able to obtain price and market information that allowed the Inquiry to determine:
�� what electricity customers are actually paying and where consumers are not benefiting from retail electricity competition
�� what factors are driving price, including where benefits are unevenly distributed between different types of consumers.
This analysis was only possible as the ACCC was able to obtain significant information and data using its compulsory information gathering powers under s. 95ZK of the CCA.
The information obtained throughout the Inquiry has allowed the ACCC to uncover the full range of factors that have driven price increases in the last 10 years. Other information obtained from retailers provided insights into revenue generated for retailers by particular types of offers and discount levels and a consumer survey, combined with billing data from retailers, has provided insights into outcomes for different demographics.
The ACCC considers that these types of insights are what is required for governments and policy makers to make informed decisions about the future direction of the electricity market.
In addition to routine monitoring of the market, the ACCC considers it is important that effective monitoring be adopted following the Inquiry to monitor the effectiveness of the ACCC’s recommendations and other recent policy changes. Effective monitoring will allow governments to ensure that the market and individual retailers are responding as intended to changes made by governments. The ACCC sees merit in a strengthened price reporting function being allocated to the AER, supported by powers to compulsorily obtain information from electricity retailers. In its submission to the ACCC Preliminary Report, ECA raised the need for improved price reporting, highlighting it is not unreasonable to place reporting obligations on retailers that are based on the existing reporting required from a listed company.789 ECA also considered that a market body may require ongoing information gathering powers similar to those of the ACCC.790
The ACCC is concerned that without a NEM-wide approach to retail price monitoring, governments and the community will find it increasingly difficult to observe the market and retailer behaviour. These difficulties will likely increase through further diversification of the market resulting from changing consumer preferences and energy needs (for example, through the increase in uptake of solar PV technology and batteries, new tariff structures, and future uptake of peer-to-peer trading and electric vehicles).
The ACCC considers that price monitoring that includes the ability to observe retailer costs and gather information on the offers consumers are on, and what they are actually paying, is necessary to observe whether consumers are seeing the benefits of the competitive market. This price monitoring could be reported in a similar way to the reporting undertaken by the ACCC in this Inquiry. In addition to these reforms, the ACCC recommends that price monitoring is extended to business customers to ensure the same level of transparency as that afforded to residential customers.
789 ECA, Submission to ACCC Preliminary Report, 12 December 2017, p. 6.790 ECA, Submission to ACCC Preliminary Report, 12 December 2017, p. 6.

321 Retail Electricity Pricing Inquiry—Final Report
In particular, the ACCC considers there should be a consistent, NEM-wide approach to reporting on:
1. retail electricity prices
2. retail revenues, costs and profits, undertaken periodically, to help monitor the effectiveness of competition
3. wholesale market competitiveness, including reporting on new investment in generation capacity, ownership of capacity and output. This work should assist in monitoring the effectiveness of the NEG
4. analysis of the contract market, including analysing the data reported to the repository as recommended in chapter 5, ASX data and data gathered directly from retailers and generators.
The ACCC understands that state and territory governments must maintain a strong interest in retail pricing policy, particularly considering the clear differences between jurisdictional markets. However, the duplicative reporting approach currently in place results in conflicting and confusing measures of market performance, and a process that is more costly for retailers than is necessary. For this reason, the ACCC is recommending that governments transition from a combination of NEM-wide and state-based price reporting to a single NEM-wide agency responsible for price monitoring. The only appropriate exception to this is where state governments retain price regulation responsibilities and their jurisdictional regulator reasonably requires certain information to set regulated prices for their region.
Recommendation 40Retail price monitoring should be streamlined, strengthened and appropriately funded to ensure greater transparency in the market, reduced costs, and allow governments to more effectively respond to emerging market issues. This should be done by:
�� COAG Energy Council agreeing to streamline price reporting and monitoring to the AER and the AER receiving all the necessary powers to obtain information from retailers about price, offers, customer billing data and retail costs
�� COAG Energy Council agreeing to extend price reporting for retail electricity services to small to medium business customers
�� state governments agreeing to close their own price reporting and monitoring schemes in favour of an expanded and strengthened NEM-wide regime.
A NEM-wide price reporting and monitoring framework should include a combination of price monitoring with full EBITA data (including standardised costs to serve, attract and retain consumers, and margins), and consumer expenditure surveys. This reporting should be done on a regular basis and include customer expenditure data, based on representative customer surveys and retailer billing and offer data, and be reflective of demographic information.
On 8 December 2016 the NEL was amended to require the AER to systemically monitor wholesale electricity markets in the NEM and report at least once every two years on wholesale market competitiveness.791 The wholesale market monitoring powers under the NEL require the AER to consider whether there is effective competition within a wholesale electricity market.792 In assessing effective competition the AER must have regard to whether there are active competitors and whether they hold a sustainable position, whether prices are determined by cost or whether there is a degree of market power, whether barriers to entry are low, and whether there is independent rivalry.793
791 NEL s. 18 (c).792 NEL s. 18 (c).793 NEL s. 18 (b).

322 Retail Electricity Pricing Inquiry—Final Report
In March 2018 the AER released a statement of approach to its wholesale market monitoring functions which includes its methodology for assessing competition and its approach to information gathering.794 The AER noted that it must use publicly available information to carry out its wholesale market monitoring functions in the first instance but that if an issue is identified the AER may use powers under s. 28 of the NEL to acquire non-public information.795
The AER’s current market monitoring powers do not specifically extend to monitoring of contract markets. The critical nature of contract markets for the effective functioning of the electricity supply chain is discussed in chapter 5. In order to improve transparency in contract markets, chapter 5 recommends (see recommendation 6) that data on over the counter contracts be reported to the AER and made publicly available in a de-identified format.
The ACCC considers that, with access to this data, the AER’s wholesale monitoring function should be extended to include monitoring and analysis of, and reporting on, contract markets. The ACCC also considers that the AER should have appropriate compulsory information gathering powers to investigate concerns arising from its monitoring and analysis of these markets.
Recommendation 41The AER’s wholesale market monitoring functions should be expanded and appropriately funded to include monitoring, analysing and reporting on the contract market. This should include analysing the data reported to the OTC repository (recommendation 6), ASX data and data gathered directly from retailers and generators (including through the use of compulsory information gathering powers).
16.2 Empowering the regulator to ensure consumers are being treated fairly and reasonably
The National Electricity Law (NEL), National Gas Law (NGL) and the NERL share the common broad objective of promoting efficient investment in, and efficient operation and use of, energy services for the long-term interests of consumers of energy with respect to price, quality, safety, reliability and security of supply. The regulated community under the NEL, the NER, the NGL and the National Gas Rules is made up of industry participants who participate in the energy wholesale markets and operate transmission/distribution networks.796 As retail customers do not participate in wholesale energy markets, the energy laws were largely silent on issues impacting end use customers until the commencement of the NERL and NERR.
In designing the NERL and NERR, governments considered the application of the ACL and its associated enforcement provisions, and decided not to include a similar enforcement framework in the energy laws. At the time, governments were concerned by the potential impacts on the market of automatically reproducing the ACL enforcement regime within the context of the national energy laws797, due to:
�� the fact that retailers were already subject to the ACL
�� consumer protection being a relatively new function of the energy laws and a concern about setting disproportionate penalties that exceeded the materiality of the breaches entailed under NERL and NERR provisions798
�� the fact that energy laws had only recently been streamlined to two levels of penalties with the introduction of the NEL and NGL799
794 AER, Wholesale electricity market performance monitoring, March 2018, p. 17.795 AER, Wholesale electricity market performance monitoring, March 2018, p. 17.796 Allens Linklaters and NERA Economic Consulting, Review of Enforcement Regimes under National Energy Laws, November 2013,
p. 18.797 COAG Energy Council Energy Market Reform Working Group, Review of Enforcement Regimes under National Energy Laws
Discussion Paper, 19 April 2013, p. 10.798 COAG Energy Council Energy Market Reform Working Group, Review of Enforcement Regimes under National Energy Laws
Discussion Paper, 19 April 2013, p. 10.799 COAG Energy Council, Review of Enforcement Regimes under the National Energy Laws; proposed policy positions for consultation,
March 2016, p. 13.

323 Retail Electricity Pricing Inquiry—Final Report
�� the principle that governments wanted to ensure the regime remained simple, as well as consistent and fair to participants.800
The resulting penalty levels, compared alongside relevant ACL provisions, are detailed in table 16.1.
Table 16.1: Comparison of NERL penalties with ACL penalties801802803804
Civil penalty Infringement notice
NERL/NERR104 Some ACL provisions105 NERL/NERR106 Some ACL provisions107
Natural person Up to $20 000 Up to $220 000 $4 000 $2 520
Body corporate Up to $100 000 Up to $1.1 m $20 000 $12 600
Listed corporation N/A N/A N/A $126 000
The ACCC notes that a Bill was introduced into parliament in February 2018 to amend the maximum penalties for breaches of the ACL by a body corporate to a fine of not more than the greater of the following:
�� $10 000 000
�� if the court can determine the value of the benefit obtained directly or indirectly by the body corporate that is reasonably attributable to the commission of the offence, three times the value of that benefit
�� if the court cannot determine the value of that benefit, 10 per cent of the annual turnover of the body corporate during the 12 month period prior to the time that the body corporate committed or began committing the offence.805
16.2.1 Review of the energy enforcement regimesIn 2013, the COAG Energy Council, responding to concerns raised by consumer advocates, agreed to review enforcement regimes under the national energy laws806 to ensure that the regimes remained appropriate with the introduction of consumer protections under the NERL and NERR. The independent review of enforcement regimes found the enforcement regime to be generally effective and efficient, but suggested some changes to the laws to:
�� increase civil penalties and infringement notices generally to reflect the changed value of money (these had not been indexed or changed since the introduction of the NEL)
�� expand the range of orders available for breaches of civil penalty provisions807
�� implement principles to govern the COAG Energy Council’s approach to the allocation of conduct provisions808
�� review civil penalties to determine if certain provisions need to be set at a higher penalty range (particularly the civil penalty for rebidding).809
800 COAG Energy Council Energy Market Reform Working Group, Review of Enforcement Regimes under National Energy Laws Discussion Paper, 19 April 2013 p. 15.
801 COAG Energy Council Energy Market Reform Working Group, Review of Enforcement Regimes under the National Energy Laws; proposed policy positions for consultation, March 2016, p. 12.
802 These are the maximum penalties for false or misleading and unconscionable conduct, pyramid selling and breaches of relevant product safety provisions. There are lesser civil penalties that apply to other contraventions.
803 COAG Energy Council Energy Market Reform Working Group, Review of Enforcement Regimes under the National Energy Laws; proposed policy positions for consultation, March 2016, p. 12.
804 These are the maximum penalties for false or misleading and unconscionable conduct, pyramid selling and breaches of relevant product safety provisions. There are lesser civil penalties apply to other contraventions.
805 Treasury Laws Amendment (2018 Measures No. 3) Bill 2018, s. 3.806 The NEL, NGL and NERL are Commonwealth-State-Territory cooperative legislative schemes. Each national law is set out in a statute
of South Australia and applied as a law in force in each jurisdiction that participates in each cooperative scheme through legislation known as an ‘application Act’. See National Electricity (South Australia) Act 1996 (SA); National Gas (South Australia) Act 2008 (SA); National Energy Retail Law (South Australia) Act 2011 (SA).
807 Allens Linklaters and NERA Economic Consulting, Review of Enforcement Regimes under National Energy Laws, November 2013, p. 8.
808 Allens Linklaters and NERA Economic Consulting, Review of Enforcement Regimes under National Energy Laws, November 2013, p. 50. The energy laws allow ‘a person other than the AER’ to seek various orders from a court based on a breach of a conduct provision, and to recover the amount of loss or damage that that person suffered as a result of any breach of that conduct provision. At present there are no principles that inform when the COAG Energy Council sets a conduct provision.
809 Allens Linklaters and NERA Economic Consulting, Review of Enforcement Regimes under National Energy Laws, November 2013, p. 8.

324 Retail Electricity Pricing Inquiry—Final Report
The COAG Energy Council has engaged in a series of consultation processes since the review to progress the above recommendations810, however, changes to the laws are yet to be finalised. In 2016, the COAG Energy Council agreed in principle to the implementation of reforms associated with increasing civil penalty and infringement notice amounts in line with the value of money (and setting a formula in the regulations to index future increases), and expanding the range of orders to include probation orders, community service and adverse publicity orders.811 However, the finalisation of the associated legislative amendment package is pending current consultation on increasing the maximum penalties of certain provisions.812
In May 2018, the COAG Energy Council released a consultation paper on AER powers and penalties and is currently seeking stakeholders’ views on:
�� amending the national energy laws to give the AER the power to compel individuals to appear before it and give evidence813
�� conducting a targeted review of whether additional provisions of the national energy laws or subordinate instruments should attract the highest maximum civil penalty amount.814
The ACCC notes that the reform process underway includes increases to civil penalties against an identified group of provisions to the maximum civil penalty under the energy laws.815 The ACCC agrees that these provisions are important and their effective enforcement underpins the integrity of the market and consumer confidence. The ACCC considers that the current civil penalty amounts are insufficient to impose a credible level of deterrence and provide meaningful consequences to businesses. Therefore, the ACCC considers that the penalties should be increased to provide the AER with a greater level of flexibility in its response to address breaches of the national energy laws.
As noted above, there is a Bill before the Commonwealth Parliament to increase certain civil penalties under the ACL. The ACCC considers the provisions listed in the AER powers and civil penalties consultation paper816 for increases to the $1 million mark warrant the higher levels referenced in the ACL amendment Bill of $10 million, 10 per cent of turnover, or three times the value of the benefit gained. The ACCC also considers that the current rebidding provisions that presently attract the $1 million civil penalty should also be increased to this new upper civil penalty limit.
The 2018 COAG Energy Council consultation paper also seeks stakeholder views on whether other civil penalties should be included in the list increasing to the maximum penalty and whether the AER should still be able to issue an infringement notice for breaches of such provisions.817 The ACCC considers that the provisions identified for increase to higher penalty rates should continue to have infringement notices available as a remedy. However, the ACCC considers that these should remain around current levels to ensure they are proportionate and effective. Maintaining infringement notices around existing levels will allow the regulator to take timely action on matters that do not warrant the higher level of response.
The ACCC additionally notes that the AEMC and the AER have made recommendations to the COAG Energy Council to add hardship rules 818 and the AER’s RPIG819 to the list of civil penalty provisions under the laws, which again would improve retailer compliance with those important consumer protection
810 COAG Energy Council, COAG Energy Council Meeting Communique, 11 December 2014, p. 5. The COAG Energy Council agreed in December 2014 in principle to nine of the 11 recommendations in Allens Linklaters and NERA Economic Consulting, Review of Enforcement Regimes under National Energy Laws.
811 COAG Energy Council, Review of Enforcement Regimes under the national Energy Laws, May 2016, p. 9. The consultation paper noted that the ACL provides for the ACCC to seek similar orders—for example, s. 86C of the CCA and s. 246 of the ACL allow the ACCC to apply for community service, probation, or adverse publicity orders for breaches of the relevant provisions. Section 86D of the CCA and s. 247 of the ACL allow the ACCC to apply for adverse publicity orders only for breach of the relevant provisions. In addition, ss. 86C and 86D of the CCA together provide definitions for a community service order; a probation order; and an adverse publicity order.
812 COAG Energy Council, Energy Market Reform Bulletin: Release of a consultation paper: AER Powers and Civil Penalty Regime Consultation Paper, June 2018, Bulletin 44.
813 COAG Energy Council, AER Powers and Civil Penalty Regime Consultation Paper, June 2018, p. 4.814 COAG Energy Council, AER Powers and Penalties Regime Consultation Paper, June 2018, p. 4.815 COAG Energy Council, AER Powers and Penalties Regime Consultation Paper, June 2018, p. 13.816 COAG Energy Council, AER Powers and Penalties Regime Consultation Paper—Appendix A List of Civil Penalty Provisions, June 2018.817 COAG Energy Council, AER Powers and Penalties Regime Consultation Paper, June 2018, p. 15.818 AEMC, Consultation Paper: National Energy Retail Amendment (Strengthening protections for customers in hardship) Rule 2018,
May 2018, p. 8.819 AEMC, Rule Determination: National Energy Retail Amendment (Preventing discounts on inflated energy rates) Rule 2018, May 2018,
p. ii.

325 Retail Electricity Pricing Inquiry—Final Report
provisions. The lack of a civil penalty provision against RPIG is particularly concerning and the ACCC considers that the COAG Energy Council should act to rectify this issue as soon as possible.
These changes will provide the AER with the enforcement tools that are necessary to deter conduct, and respond appropriately to breaches of the energy laws that cause significant consumer harm.
It is also worth noting that overseas markets, such as Great Britain, have much higher levels for penalties and a wider range of orders to ensure retailer compliance.820
In 2016 the COAG Energy Council also consulted on expanding the range of orders the AER can apply for including the inclusion of community service orders, probation and adverse publicity orders.821 The ACL allows regulators to apply to a court for community service orders as a remedy for breaches.822 The ACCC supports the addition of these orders to the laws as they bring remedies into line with the ACL and increases the range of remedies to non-monetary ones.
However, the ACCC notes that a community service order of this type requires positive action from the retailer to perform the service specified. As noted in the 2017 review of the ACL, it was found there are circumstances in which a firm is not qualified or trusted to give effect to a community service order.823 The ACCC considers the energy laws and rules would benefit from similar provisions, noting such a practice would reduce the risk of non-compliance against orders in certain circumstances.
The ACCC notes that the COAG Energy Council is also presently consulting on whether the AER should have the power to require individuals to give evidence before it, similar to the ACCC’s power under s. 155(1)(c) of the CCA.824 The AER does not currently have a power to require the provision of oral evidence on oath when it is investigating potential contraventions of the national energy laws and rules.825 This power is available to other comparable regulators including the Australian Securities and Investments Commission826 and the Australian Communications and Media Authority.827 Giving the AER this power was one of the recommendations from the 2013 Enforcement Regimes Review.828
According to the review, precluding the AER from being able to obtain information under oath limits its ability to:
�� determine if information is incomplete or incorrect. This is particularly problematic for technical information like that associated with the wholesale electricity market
�� detect inconsistencies emerging between written evidence and oral testimony
�� compel witnesses for oral questioning on written information to clarify material or statements.829
820 Allens Linklaters and NERA Economic Consulting, Review of Enforcement Regimes under National Energy Laws, November 2013, pp. 76–77. For instance the UK has civil penalties equivalent to up to 10 per cent of turnover and the ability to pursue compensation for customers (Ofgem, Enforcement Overview 2016–17, June 2017, p. 8).
821 COAG Energy Council, Review of Enforcement Regimes under the National Energy Laws: proposed policy positions for consultation, March 2016, p. 9.
822 ACL, s. 246(2).823 The Australian Government, p. 87. Treasury Laws Amendment (Australian Consumer Law Review) Bill 2018: Exposure Draft
and Explanatory Memorandum, January 2018, p. 15. Existing s. 246(2) (a) of the ACL allows regulators to apply to the court for a community service order as a remedy where a person has contravened, or has been involved in a contravention of, the ACL. Schedule 9 to this Bill amends s. 246 to clarify that a court may issue a community service order requiring the person to engage a third party, at the person’s expense, to perform the service required in the order.
824 COAG Energy Council, AER Powers and Civil Penalty Regime Consultation Paper, June 2018, p. 6.825 COAG Energy Council, AER Powers and Civil Penalty Regime Consultation Paper, June 2018, p. 6.826 Australian Securities and Investment Commission Act 2001 (Cth), s. 19.827 Australian Communications and Media Authority Act 2005 (Cth), ss. 173 and 174.828 Allens Linklaters and NERA Economic Consulting, Review of Enforcement Regimes under National Energy Laws, November 2013,
p. 10.829 Allens Linklaters and NERA Economic Consulting, Review of Enforcement Regimes under National Energy Laws, November 2013,
p. 120.

326 Retail Electricity Pricing Inquiry—Final Report
Some of these issues were illustrated in the judgement in the case the AER brought against Stanwell Corporation in 2009.830 The AER brought an application to the court for a civil penalty against Stanwell Corporation alleging a breach of clause 3.8.22A of the NER, which requires generators to make ‘rebids’ in good faith.831 The Enforcement Regimes report noted the issues that arose in that case, stating:
There the Federal Court highlighted the fact that there were differences between the written responses to an information request under section 28 of the NEL and oral evidence given by witnesses. These inconsistencies would most likely have been clarified had the AER been able to directly question the relevant traders rather than being required to rely solely on written responses to information requests. In that case, the AER needed to amend its pleadings to address these differences. The case could have been run more efficiently had the statements of the witnesses been available to the AER as part of its investigation.832
The AER noted in its 2014 submission to the Enforcement Regimes review consultation process that access to better quality information would help guide investigations and is a necessary tool as it will allow the AER to make more informed decisions about potential action.833 The ACCC considers it critical that this tool is made available to the AER as soon as practicable.
Recommendation 42The COAG Energy Council should adopt all the suggested increases to all civil penalty provisions listed in the consultation paper as a matter of priority, but instead of increasing the amount to $1 million as proposed, increases should be at the same levels as parliament is currently considering for the ACL ($10 million three times the benefit gained or 10 per cent of turnover). The civil penalties suggested for increase to the maximum level across the NEL, NER, NERL and NERR relate to listed provisions in the consultation paper, such as:
�� information required for projected assessment of system adequacy
�� limitations on generators’ technical parameters—requirements only apply in certain circumstances
�� key requirements that generators must meet, regardless of the circumstances of their plant
�� the requirement to advise AEMO if a situation changes, and keep AEMO continuously informed
�� obligations with respect to life support customers
�� wrongful disconnection by a retailer or network service provider
�� the requirement to implement a hardship policy
�� explicit informed consent requirements for certain transactions.834
Recommendation 43The rebidding rules that currently attract civil penalties of $1 million should also be increased to the new higher level penalties, and that the wholesale provisions arising from the ACCC recommendations 1 and 3 associated with the conduct of participants under the NEL are increased to the same level as well and that these provisions also be subject to disgorgement (ill-gotten gain) penalties.
830 Australian Energy Regulator v Stanwell Corporation Limited [2011] FCA 991 (30 August 2011).831 Allens Linklaters and NERA Economic Consulting, Review of Enforcement Regimes under National Energy Laws, November 2013,
p. 120.832 Allens Linklaters and NERA Economic Consulting, Review of Enforcement Regimes under National Energy Laws, November 2013,
p. 120.833 AER, Submission on the Review of Enforcement Regimes under the National Energy Laws—recommendations to the final report,
October 2014, p. 4.834 COAG Energy Council, AER Powers and Civil Penalty Regime Consultation Paper—Appendix A List of Civil Penalty Provisions, May
2018. A summary of the listed provisions suggested for increase under the COAG Energy Council. The list is not an exhaustive list of all the provisions in appendix A. The ACCC also notes that this list includes some gas provisions; however, the Inquiry did not consider these as they are out of scope of this process.
327 Retail Electricity Pricing Inquiry—Final Report
Recommendation 44The COAG Energy Council should amend the energy laws in line with the current recommendations before the COAG Energy Council to allow the AER to seek community service orders, probation orders, and adverse publicity orders, as well as enabling the AER to seek that a third party is required to undertake a community service order.
Recommendation 45The COAG Energy Council should provide the AER with the power to require individuals to give evidence before it.
16.2.2 Additional changesIn addition to these proposed changes the ACCC recommends that the COAG Energy Council also introduce a third class of infringement notice penalties to provide the AER with greater flexibility to address minor as well as more significant business conduct issues. These changes will complement and support the changes that the ACCC is proposing to drive better consumer outcomes and bring the energy laws in line with comparable enforcement regimes in place in the ACL and other sectors.
There are a wide range of participants in the energy market, including numerous smaller operators that sell energy under the NERL exemptions framework.835 As a consequence the AER requires a range of remedies to address both smaller participants, specifically exempt sellers, and more minor provisions of the energy laws and rules, to allow for proportionate and fair responses across the national energy laws. Therefore the ACCC suggests that the COAG Energy Council should introduce a new class of infringement notices for minor remedial actions. The COAG Energy Council, in a process similar to the civil penalty review, could identify provisions and rules that may be more appropriately addressed through a lower infringement notice of $5000 for the NERL and the NERR.
Under the national energy laws, an individual does not have to provide information or produce a document that would tend to incriminate them or make them liable to a criminal penalty (see, for example, s. 28(6) of the NEL). A corporation does not have this protection.836 The ACCC notes that with the addition of new information gathering powers, it will be necessary to support these powers with appropriate penalties associated with the destruction of evidence and providing false or misleading information to the AER. The ACCC suggests that penalties associated with the destruction of evidence or providing false or misleading claims should be equivalent to the CCA and attract similar penalties.837
Recommendation 46The COAG Energy Council should amend the energy enforcement regime to:
�� permit the AER to issue a new lower level infringement penalty ($5000) for minor breaches of certain provisions for the NERL and NERR in addition to the current $20 000 infringement penalty for more current provisions. The COAG Energy Council should identify provisions most suited to lower levels of penalty or provisions directed at smaller market participants like exempt sellers.
�� introduce penalties for destroying evidence or providing false or misleading information to the AER under its information gathering powers to levels equivalent to the ACL.
835 NERL, ss. 88 and 109.836 COAG Energy Council, AER Powers and Civil Penalty Regime Consultation Paper, June 2018, p. 10.837 CCA, s. 135C.
328 Retail Electricity Pricing Inquiry—Final Report
17. Is the current regulatory framework fit for purpose?
Key points
�� The NERL and NERR provide consumer protections which are unique to energy and should be retained to maintain the safe supply of this essential service.
�� In the preceding chapters of part 3, the ACCC has recommended a number of changes necessary to improve the outcomes for consumers in the immediate term. These changes should be implemented by governments as a matter of priority.
�� Governments currently have no framework or consumer protection principles by which they can manage and review the overall operation of energy specific consumer protections, particularly in light of market change and technological disruption. Providing such guidance would lead to regulation that is more clearly aimed at benefiting consumers.
�� In addition to implementing the ACCC’s recommendations from this Inquiry that will improve consumer outcomes in the short- and medium-term, a review of the effectiveness of the whole consumer electricity regulatory framework should be conducted within three years after the implementation of the recommendations and no later than four years after the release of this report.
17.1 How did the current regulatory framework come to be?
Introduction of the National Energy Customer Framework (including the NERL and NERR) was the last major task associated with the competition policy reforms flagged in the Parer review.838 The process to harmonise state-based consumer protections was undertaken progressively and was done alongside the removal of price regulation in most markets. The intention of the NERL and NERR was to provide the energy specific consumer protections necessary to ensure consumers had access to retail electricity and gas services and to minimise the complexity for consumers when negotiating their energy market contracts.839 The NERL and NERR are an amalgamation of multiple state and territory regulatory regimes that also operates alongside national electricity and gas laws. As a consequence the framework took a number of years to negotiate between participating state and territory governments.
The NERL and NERR were designed to balance community benefits, including ensuring reasonable access to energy supply for all grid connected consumers and the protection of consumers in financial hardship, with the promotion of an economically efficient and competitive energy market.840
As discussed in chapter 10, some of the efficiency gains expected to stem from a single approach to energy market regulation across the NEM have not been realised due to differences in regulation across jurisdictions. This is largely due to Victoria’s decision in 2012 not to adopt the framework due to concerns that the NERL and NERR would reduce consumer protections offered to Victorian consumers.841 This decision resulted in two similar but separate frameworks within the NEM which retailers must comply with if they wish to operate within Victoria as well as the other NEM states. While Victoria took the positive step of harmonising its framework with the NERL and NERR in 2014842, differences remain and the costs associated with these differences are estimated in chapter 10.
838 Parer, W, Breslin, P, Sims, R and Agostini, D, Towards a truly national and efficient energy market, Council of Australian Governments, December 2002, p. 86.
839 South Australian Parliament, House of Assembly, National Energy Retail Law (South Australia) Bill, Second Reading speech, Hansard 27 October 2010.p. 1748.
840 South Australian Parliament, House of Assembly, National Energy Retail Law (South Australia) Bill, Second Reading speech, Hansard 27 October 2010. p. 1747.
841 ESC Victoria, Harmonisation of Energy Retail Codes and Guidelines with the National Energy Customer Framework—Consultation Paper, December 2012, p. 1.
842 ESC Victoria, Harmonisation of the Energy Retail Code and Guidelines with the National Energy Customer Framework—Final Decision Paper, 4 July 2014, p. 1.

329 Retail Electricity Pricing Inquiry—Final Report
Retailers have indicated to the Inquiry that these costs will increase when Victoria implements a number of major reforms arising from the Victorian Review that will move its regulatory regime further from the NERL and NERR.
In addition to the regulatory regime in Victoria, NECF jurisdictions are able to make limited changes to the regulatory arrangements to suit specific issues facing their jurisdiction under the Australian Energy Market Agreement. These are known as derogations. In 2015, the Review of Governance Arrangements for Australia’s Energy Markets (the Energy Governance Review) found that governments could be at risk of taking a ‘pick and mix’ approach to regulation and recommended the COAG Energy Council introduce a necessity principle for the assessment of all derogations.843 This recommendation is yet to be addressed by the COAG Energy Council.
The recommendations in chapter 10 relating to Victoria’s adoption of the NECF and the remaining NEM jurisdictions’ removal of any derogations which detract from the consistency of the framework will be important to the aims of reducing costs and building greater regulatory consistency and certainty.
17.2 Concerns with the current regulatory frameworkIn designing the NECF, governments had to bring together different consumer protection regimes operating in each of the NEM jurisdictions prior to its development. As discussed in the Preliminary Report, the NEM has evolved over the past decade, shifting from a highly centralised retail market with a small number of often state-owned retailers, to many retailers and thousands of retail offers. New products like solar PV and batteries have emerged and placed added pressure on a regulatory framework that was designed for a simpler market where electricity was sent in one direction only. The NERL and NERR were designed for a retail market where a few retailers operated, and the products and services offered by those retailers were in most cases identical.
The NERL, as well as the electricity law (and gas law), were designed to regulate specific actions and processes in the market rather than regulating outcomes. Consequently, the laws, supporting rules, procedures, guidelines and regulations seek to conceive and manage every necessary market process and interaction including those with consumers. This has resulted in an expanding and increasingly complex body of regulations over time.
Under the NERL, there is no mechanism for a broad-based review of its effectiveness against its stated objectives, as was undertaken through the ACL review process of 2017.844 Reviews of the NERL and NERR have, to date, been done under state review processes, or through issue specific AEMC reviews as directed by the COAG Energy Council.845 This includes reviews like the 2012 Power of Choice review and the 2017 review of consumer protection in embedded networks.846
The other mechanism for assessing consumer outcomes and protections is the rule change process associated with the NERR. Under the energy laws, the AEMC must consider rule changes proposed by any individual to determine the benefits of that rule, against the NERL and specifically the National Energy Retail Objective.847 While the ACCC recognises that these rule change processes are complemented by broader reviews, such as the two separate reviews suggested by the AEMC in 2018, the first on hardship, and the second on consumer protections relating to new energy service providers (solar and battery services)848, these processes are subject limited and do not consider the totality of the regulatory framework. The AEMC has also, through its Retail Energy Competition Review, and its annual Strategic Review Process, provided advice on competition and consumer issues, and has
843 Vertigan, M, Yarrow, G and Morton, E, Review of Governance Arrangements for Australian Energy Markets Final Report, October 2015, p. 37.
844 See Consumer Affairs Australia and New Zealand, Australian Consumer Law Review Final Report, March 2017, p. 109 for terms of reference for the ACL review.
845 NERL, s. 232. The South Australian Government completed a review of their application of the NERL in April 2016 as per the National Energy Retail Law (South Australia) Act 2011 (SA), s. 30.
846 Under the energy laws the AEMC can be tasked by the COAG Energy Council to undertake reviews on matters relating to the efficient operation of the market or the long-term interests of consumers. For instance, the COAG Energy Council tasked the AEMC with undertaking the Power of Choice Review to set out a work program for encouraging demand side participation in the NEM. AEMC, Power of Choice Review, November 2012. Similarly the Energy Council tasked the AEMC to complete the Review of regulatory arrangements for embedded networks, November 2017. It focused on embedded network customers’ access to retail competition and necessary consumer protection arrangements. AEMC, Review of Electricity Customer Switching, April 2014, considered regulatory barriers to the timely switching of customers between retailers.
847 The objective of the NERL is to promote efficient investment in, and efficient operation and use of, energy services for the long-term interest of consumers of energy with respect to price, quality, safety, reliability, and security of supply of energy. See, NERL, s. 13.
848 AEMC, 2018 Retail Competition Review Final Report, June 2018, p. xiii.

330 Retail Electricity Pricing Inquiry—Final Report
offered a range of suggestions to the COAG Energy Council to improve market efficiency, consumer empowerment and consumer protection, a number of which are yet to be implemented by the COAG Energy Council.849
Under the laws, the AEMC, in considering rule changes, is required to have regard to the promotion of the long-term interests of consumers with regard to the price, quality and reliability. However, other than the national energy retail objective, there is limited direction as to the principles that inform the protection and empowerment of the consumers under that regulatory framework.850 The ACCC notes that the COAG Energy Council has not provided policy principles to guide changes to consumer related protections under the NERR, as it can do under the NERL and NEL.851 Ministerial principles would provide a clear direction by which the AEMC should consider rule changes as it regards consumer welfare, and these principles could also form the basis for the three-year review of the NERL.
The Inquiry has found that the incremental and ad hoc approach employed to date to address poor retailer behaviour and consumer harms, has not benefited consumers in terms of either market efficiency (see chapter 10) or consumer protections (chapters 11–15). Since 2012, there have been 10 changes to the retail rules852, and there are a further eight open or pending rule change proposals registered with the AEMC. These rule changes along with other associated changes to the electricity rules, AER guidelines, and other procedural changes have resulted in the NEM being in a constant state of regulatory change since the introduction of the NERL and NERR. It is difficult to quantify the impacts or the cost of this period of constant regulatory change; however, industry and consumer stakeholders alike have noted throughout the Inquiry, and through previous processes, the difficulty to keep pace with the changes and the need for greater strategic direction.853
The ACCC is concerned by an ever increasing suite of prescriptive rules that are increasing costs and largely being circumvented by retailers through ‘creative compliance’. The risks associated with a framework entirely based on prescriptive rules will only increase as the market and technologies continue to change. In part this can be addressed by creating consistency across the regulatory framework, in particular by Victoria joining the NECF and limiting state-based derogations (see chapter 10).
In addition, the ACCC’s concerns can be addressed by:
1. providing additional clarity on the principles that should underpin the regulatory framework and in particular how it should be focused on the best outcomes for consumers
2. a comprehensive review of the effectiveness of the framework.
These are discussed below.
17.3 A framework focused on best outcomes for consumers
The ACCC considers that there is scope for the NERL and NERR to apply a hybrid approach that balances prescriptive and non-prescriptive elements to ensure that there are clear requirements around specific practices that are activity based, and those features of the framework that would better lend themselves to consumer outcomes, like ensuring fair and reasonable terms and conditions in contracts. An example of another jurisdiction making changes in this direction is the UK, detailed in box 17.1.
849 AEMC, 2018 Retail Competition Review Final Report, June 2018, pp. 212–214 refers to the full list of recommendations.850 Australian Energy Market Agreement Amendment, December 2013, cl. 2.1 (a). See the overarching objective in the COAG: The NERL
requires the AER and AEMC to have regard to the National Energy Retail Objective and consumer protections (NERL, ss. 205 and 236(2)(a)–(b)).
851 NERL, s. 14 (1) and NEL, s. 8(1) allow for the COAG Energy Council to issue a statement of policy principles in relation to any matters that are relevant to the exercise and performance by the AEMC of its functions and powers in relation to making a rule or conducting a review.
852 Including nine external rule change requests and one minor procedural change instigated by the AEMC. As per the AEMC rule change advice as at 9 May 2018. Prior to October 2017, of the more than 250 rule changes completed by the AEMC, only nine related to retail rules. However, this trend has changed with the AEMC receiving 11 retail rule change requests since October 2017. AEMC, AEMC Retail Competition Review: Final Report, June 2018, p. 10.
853 Vertigan, M, Yarrow, G and Morton, E, Review of Governance Arrangements for Australian Energy Markets Final Report, October 2015, pp. 19–20.

331 Retail Electricity Pricing Inquiry—Final Report
Box 17.1: UK moves toward more principles-based energy regulationAustralia is not alone in the challenges it faces regulating the retailer-customer relationship in the electricity market. Most notably, the United Kingdom (UK) has experienced similar issues with its retail market rules framework over the past decade. In 2016, the UK’s Competition Markets Authority (CMA) completed an investigation into the UK’s energy markets and found a number of the regulatory requirements governing licensing, pricing and tariffs had the unintended effects of reducing competition and customer switching.854 The CMA also found that retailers in the UK faced ongoing change and a range of prescriptive requirements, following three major market interventions between 2010 and 2016.855 As a consequence, the CMA recommended reducing the level of licence and regulatory requirements and moving toward a principles-based retail code with a Standard of Conduct to address adverse retailer behaviour.856
The Standards of Conduct requirements have been in place in the UK since October 2017 and cover:
�� retailer behaviour toward consumers
�� the information retailers must provide to consumers
�� customer service
�� support for vulnerable consumers.857
The UK approach still has certain prescriptive elements of regulation which address designated activities; however, these are limited to functional or system matters like billing and customer transfer.858 Prior to this reform the UK market was reacting and responding to retailer practice changes, prescribing large amounts of regulation to address increasing numbers of discrete problems faced by an increasingly diverse consumer base.
Moving to a more principles-based approach over time will require a regulatory shift in the NERL and NERR and would require a change in retailers’ approach to regulation, as a principles-based approach is predicated on retailers understanding and responding to values rather than compliance with specific steps.859 We note that energy businesses, including retailers, have reportedly indicated a willingness to take steps in this direction through a consumer confidence code.860
In order to signal a strong focus on consumer outcomes, the COAG Energy Council could establish ministerial principles focused on consumer outcomes. These principles would apply to COAG Energy Council decisions and the AEMC rule making process as per the process provided in the energy laws. The ACCC considers these ministerial principles should reflect the consumer protection principles underpinning the ACL. These principles should include direction on governments’ expectations around regulation to protect vulnerable consumers.
The COAG Energy Council could use these ministerial principles in the first instance to directly inform the range of revisions that will be required to the NERL/NERR to repeal the standing offer and the standard retail contract.
854 CMA, Energy market investigation, Final Report, 24 June 2016, pp.23–24.855 CMA, Energy market investigation, Final Report, 24 June 2016, p. 359.856 CMA, Energy market investigation, Final Report, 24 June 2016, p. 57.857 Ofgem, Licence Guide: Standards of Conduct, 10 October 2017, p. 3858 Ofgem, Licence Guide: Standards of Conduct, 10 October 2017, p. 2.859 Australian Law Reform Commission, Australian Privacy Law and Practice, ALRC Report 108, May 2008, p. 237.860 Chambers, M, ‘Energy chiefs’ secret bid to avoid royal commission-style inquiry’, The Australian, 22 February 2018.

332 Retail Electricity Pricing Inquiry—Final Report
Recommendation 47The COAG Energy Council should develop a set of ministerial principles that informs rule changes and ministerial decisions relating to consumer protection regulation, including requirements to:
�� reduce regulatory complexity where appropriate and focus regulation on consumer outcomes
�� ensure consumers have access to necessary information and resources to make informed decisions
�� promote fair and reasonable treatment of consumers in day-to-day engagement with market participants
�� reduce the risk of inequity in outcome between consumers in the retail market
�� ensure regulatory flexibility to support technological and market innovation
�� understand the needs of vulnerable consumers and support their increased participation in the market.
A comprehensive review of the effectiveness of the regulatory frameworkThe market will continue to evolve over the coming years, and in order to ensure the consumer protections and retail competition aspects of the law operate as intended, it will be necessary to undertake a wide ranging review of the NERL and NERR in the medium term. The review should not take place until three years after the current reform process has been completed, and should examine how the NERL and NERR are operating in practice and whether they are serving consumers well. Scheduling a wide ranging review of the NERL and NERR in the medium term will allow governments, market bodies, the AER, industry and consumer advocates to take stock and consider whether issues identified through this process are improving, as well as take account of emerging market and technological changes.
As stated earlier, realising the benefits of the recommendations is largely dependent on the package of reforms being implemented in full. The review should take place three years after the implementation of the recommendations and no later than four years after the release of this report, and should be coordinated by the Energy Security Board.
Recommendation 48The COAG Energy Council should undertake a review of the effectiveness of the NECF three years after the implementation of the Inquiry recommendations and no later than four years after the release of this report.

Business customers04

334 Retail Electricity Pricing Inquiry—Final Report
Key points�� Current high electricity prices in the NEM are reducing the competitiveness of businesses of all
sizes. Price pressure must be eased if we are to avoid business closures and employment losses across the economy.
�� The greatest assistance in reducing electricity costs for businesses can come from efforts to reduce wholesale electricity and network costs as described in parts 1 and 2 of this report.
�� Small businesses face similar problems to residential customers in engaging with retail markets, while having access to even less data and appropriate resources to compare offers. This is why the recommendations in part 3 around tools that support consumers like the discount benchmark are extended to small businesses.
�� There are too many small businesses on high-priced standing offers or no-discount market offers, making the recommendations in part 3 around the discounting benchmark default offer critical for small business.
Businesses in the NEM have experienced unprecedented increases in their electricity prices in recent years, and this is having a dramatic impact on their productivity and ability to compete.
The cost of electricity varies significantly between businesses and largely depends on their level of consumption. Generally speaking, small businesses with a relatively low level of usage, for example a sole home operated business, may pay around, or slightly above the price paid by a household consumer. Medium to large and industrial level electricity users face somewhat lower per unit prices, but have much larger bills due to significantly higher usage.
The cost of electricity makes up a very large proportion of the operating costs of businesses in some sectors. Some heavy industrial manufacturing, for example steel manufacturing and aluminium smelting, use extremely high amounts of electricity. Other sectors, such as some retail and hospitality operations, have a heavy reliance on refrigeration and lighting which draw significant amounts of electricity. As these businesses can operate on thin margins, a significant increase in electricity costs can wipe out profitability entirely.
Many of the issues raised in earlier sections of this report relating to complexity of offers for households and the day-to-day experience of consumers are equally relevant to small businesses in their engagement with the market. The ACCC considers that the recommendations in part 3 should apply to the small business sector and should help to dramatically improve the ability of small businesses to navigate the electricity market and make large cost savings. The average SME usage is about three times that of a residential household861, meaning SME customers have the potential to save thousands of dollars in electricity costs through relatively small unit price reductions.
In part 4, the ACCC considers additional actions aimed at increasing small business customer engagement and improving outcomes for these customers. This part also details the benefits of greater price and market performance reporting relating to business customers to provide greater transparency for this part of the market.
In chapter 18 we look at some specific issues faced by SME customers and set out recommendations aimed at addressing the specific barriers SME customers face in effectively understanding and dealing with the retail electricity market.
We also address the situation for large C&I customers users and the role that self-supply and demand response can play in lowering electricity costs and improving overall business competiveness.
861 ACCC analysis of retailer data provided.

335 Retail Electricity Pricing Inquiry—Final Report
18. Improving outcomes for business customers
18.1 Small businessAround 97.5 per cent of all Australian businesses are small businesses.862 This group covers a wide range of business types and sizes, with diverse energy use needs and costs, and a varied experience with engaging with the energy market.
Outside the energy sector, the definition of small business relates to the number of employees and/or turnover of a business.863 However under the energy laws, small business electricity users are defined on a consumption level basis. The NERL defines a small business customer as a customer that consumes less than 100 MWh per year.864 This threshold varies between jurisdictions by local derogation, with a limit of 40 MWh in Victoria, 150 MWh in Tasmania, and 160 MWh in South Australia.
Figure 18.1: A snapshot of Australian small business
small businessesaccording to number of employees
2 182 135small businessesbased on energy use
1 millionof business owners
are born overseas
33%
97% of allbusiness in Australiaare small businesses
61% of soleoperators
27% of businesseswith 1 to 4 employees
9% of businesseswith 5 to 19 employees
3% of businesses have 20 or more employees and
are not small businesses
Source: ABS data and Alviss tariff tracker on behalf of Energy Consumers Australia.865
862 ABS, Counts of Australian Businesses, including Entries and Exits June 2013 to June 2017, 2 February 2018, Category 8165.0.863 The ABS defines businesses by the number of employees, with a small business being a business with less than 20 employees; the
Australian Taxation Office defines a small business as one that has annual revenue turnover (excluding GST) of less than $2 million.864 NERL, s. 5 and National Energy Retail Regulations (SA), s. 7.865 ABS, Counts of Australian Businesses, including Entries and Exits, Jun 2013 to Jun 2017, 2 February 2018, Category 8165.0; Alviss
Consulting, Analysis of small business retail energy bills in Australia: Preliminary Report, October 2017, p. 8.

336 Retail Electricity Pricing Inquiry—Final Report
18.1.1 Small businesses’ price and bill outcomesThe ACCC has found common themes between the experiences and concerns of residential and small business energy customers. Small business customers’ engagement with retailers, whether searching for offers or dealing with day-to-day issues like billing, can be just as difficult as their household counterparts. However, the electricity costs for small businesses can be far higher, representing a major part of operating costs.866 In some sectors, electricity costs come only after accommodation and wage costs as the main operational costs, due to the nature of their energy needs.
When compared with households, the recent electricity price increases of the last one to two years will in most cases have had a larger impact on small businesses, given their higher average usage867, and for some a higher proportion of their income spent on energy costs.868 Increasing electricity costs have reduced the capacity of some businesses to grow or to stay competitive, and consultation with the business community has indicated that passing on electricity costs to their customers is frequently not possible.869 Many businesses lack the knowledge and expertise to make effective choices relating to their electricity supply.870 Those that are able to identify measures to reduce electricity costs such as improving energy efficiency and installation of solar panels can find it difficult to manage the significant upfront capital investment that is required. A small business survey recently indicated that there has been a significant increase in the number of small businesses that have decided not to investigate their options to invest in technologies such as solar panels, solar hot water, smart meters and energy management systems since 2017.871
Throughout the Inquiry businesses have expressed concerns over the impact of electricity price increases. As noted above, the prices paid by small businesses vary widely. For instance, a sole trader with low energy use is likely facing higher per unit prices but much lower bills than those customers representative of the average SME customer as represented in the SME cost stack in figure 1.28 (chapter 1). According to ACCC data, average SME customer bills are generally around three times higher than the average household bill.872
The 2018 AEMC Retail Competition Review found that very small business customers873 can pay more than a residential consumer when consuming the same amount of electricity.874 As seen in figure 18.2, small business customers using the same amount of electricity as the median residential household are facing higher bills.
866 ACCC analysis of retailer data: an average household in the NEM consumes around 4500 kWh each year; a small business could consume over 10 times that amount and still stay under the threshold (depending on the region).
867 Alviss Consulting, Analysis of small business retail energy bills in Australia, Final Report, December 2017, p. 6. Across network regions in the NEM, Alviss reported a wide range of consumption averages from 13 000 kWh through to the upper range of 32 257 kWh.
868 The ACCC received information for business organisations and the AEMC detailing diverse business customer needs for energy. AEMC, Small Businesses Struggle to deal with Energy Retailers, Media Release, 15 June 2018, p. 2. The media release summarises their findings around self-reported energy needs across business sectors and their likelihood of being either price sensitive or with higher energy use. The New South Wales Small Business Commissioner provided examples of the price sensitivity for businesses that operate large refrigeration and air-conditioning systems and their inability to change their load profile (New South Wales Small Business Commissioner, Submission to ACCC Preliminary Report, 16 November 2017, p. 2). The South Australian wine industry noted that electricity made up to 50 per cent of total production costs of wine in 2015 for some businesses (South Australian Wine Industry Association, Submission to ACCC Issues Paper, 30 June 2017, p. 3).
869 ECA, Submission to ACCC Issues Paper, July 2017, p. 7; Printing Industries Association of Australia, Submission to ACCC Issues Paper, 30 June 2017, p. 16.
870 Large Format Retail Association, Submission to ACCC Issues Paper, 30 June 2017, p. 11; Chamber of Commerce and Industry Queensland, Submission to ACCC Issues Paper, 7 July 2017, p. 3.
871 According to Colman Brunton, 51 per cent definitely won’t invest in solar panels, 62 per cent definitely won’t invest in solar hot water systems, 32 per cent definitely won’t invest in smart meters and 57 per cent definitely won’t invest in energy management systems (Colmar Brunton, Small business survey report for the AEMC 2018 Retail Energy Competition Review, June 2018, pp. 75–81).
872 ACCC analysis of retailer data points out that the NEM-wide average cost stack for SME customers is similar to that for residential customers. However, SME users typically have a higher usage than residential customers. See chapter 1.1.2.
873 AEMC, Small Businesses Struggle to deal with Energy Retailers, Media Release, 15 June 2018, p. 2. The AEMC considers sole traders and partnership as equivalent to households consumption for the purpose of this analysis.
874 AEMC, 2018 Retail Energy Competition Review Final Report, June 2018, p. 79.

337 Retail Electricity Pricing Inquiry—Final Report
Figure 18.2: Comparison of representative residential consumer offers and small business market offers across the NEM (same usage levels)
0
500
1000
1500
2000
2500
Adelaide Brisbane Canberra Melbourne Sydney
Residential bill Business bill
Med
ian
annu
al e
lect
rici
ty b
ill (
$)
Source: AEMC, June 2018.875
The AEMC also found that a business customer in Sydney can pay up to $1000 more per year than a residential consumer using the same consumption of 16 000 kWh.876 This outcome is representative of the smaller end of the business customer usage range. These findings reflect the different tariffs faced by small business and residential customers.
Those small business customers with a higher usage range (around 40 000 kWh) and representative of the type of use seen by businesses like those operating in the medical, retail, and hospitality sectors877 face annual bills similar to those detailed in figure 18.3 (when on market offers).
Figure 18.3: Average annual market retail business customer bills for businesses using 40 000 kWh
8 000
9 000
10 000
11 000
12 000
13 000
14 000
15 000
16 000
17 000
18 000
Apr 2016 Apr 2017 Oct 2017 Apr 2018
South Australia NSW QueenslandVictoria ACT Tasmania
Ann
ual b
ill (
$)
Source: AEMC, June 2018.878
875 The AEMC pricing data was accessed in March 2018 and drawn from the Energy Made Easy and Victorian Energy Compare websites. Data compared median representative residential prices (based on AER bill benchmark usage levels) and average business offers for the same level of usage. Average offers were based on median market offers in DNSPS of SAPN, Energex, Evoenergy, Citipower and Ausgrid. Analysis assumes all discounts are realised and include GST.
876 AEMC analysis based on Energy Made Easy data accessed 26 April 2018. Analysis is based on a consumer in the 2000 postcode area, with no controlled load and annual consumption of 16 000 kWh per year. Analysis assumes all discounts are realised and include GST (AEMC, 2018 Retail Energy Competition Review: Final Report, June 2018, p. 79).
877 Alviss Consulting, Analysis of small business retail energy bills in Australia, December 2019, p. 18.878 Data prepared by Alviss Consulting (unpublished) simple averages of generally available retail market offers for small business
available on the Energy Made Easy and Victorian Energy Compare websites in April 2018.

338 Retail Electricity Pricing Inquiry—Final Report
Due to the highly diversified customer base in the small business segment of the market, it is difficult to compare business customer experiences side by side. However, what is clear is that the majority of businesses have faced significant price increases in recent years. As detailed below, many small businesses, regardless of whether they have small or medium sized energy loads, are still experiencing challenges in engaging with the market.
The ACCC’s analysis shows that a large number of small businesses are on high-priced offers. In the competitive markets of south east Queensland and NSW there are around a third of small and medium business customers on the standing offer rate, which is substantially higher than most market offers. In most retail markets where retail competition exists there is a similarly high proportion of customers on low or no discount offers (see figure 18.4), resulting in many small businesses paying more than the market offer average.
Figure 18.4: SME customers by offer type and region as at 30 June 2017
0%
20%
40%
60%
80%
100%
ACT NSW South Australia
South east Queensland
Victoria NEM
>30% Discount 20–25%
Discount 10–15% Discount <5%
Discount 25–30% Dicount 15–20%
Discount 5–10% No discountStanding oers
% o
f cu
sto
mer
s
Source: ACCC analysis of retailer data.
Note: NEM figure excludes Tasmania and regional Queensland.
While residential standing offer customer numbers have significantly decreased in all non-price regulated NEM regions, a higher proportion of SME customers remain on standing offers. The higher rates of business customers on standing offers appear to be driven by the high rates of SME customers who have not changed electricity retailer for the past two to four years (see figure 18.5).
Figure 18.5: SME tenure profile by offer type and region, 30 June 2017
0%
20%
40%
60%
80%
100%
Marketo�ers
Standingo�ers
Marketo�ers
Standingo�ers
Marketo�ers
Standingo�ers
Marketo�ers
Standingo�ers
NSW South Australia South eastQueensland
NEM
> 4 years 2–4 years 1–2 years < 1 year
Marketo�ers
Standingo�ers
ACT
Marketo�ers
Standingo�ers
Victoria
% o
f cu
sto
mer
s
Source: ACCC analysis of retailer data.
Note: NEM figure excludes Tasmania and regional Queensland.

339 Retail Electricity Pricing Inquiry—Final Report
18.1.2 Complexity and confusion for small business customersThe ACCC has heard from many small businesses and their representatives that energy offers are too complex, discounts are confusing, and the lack of transparency and comparability of retailers’ offers presents a significant barrier to comparing offers and making the right decision.879 Even though SMEs might perhaps be expected to have a more confident and expert approach to purchasing energy than residential customers, small businesses in practice face many of the same challenges as residential consumers when it comes to understanding their electricity needs or costs.880 A large group of small businesses also believe there is not enough readily available or simple information targeted at them about retail offers.881
Poor transparency and a lack of tools to compare offers was a common theme in business related submissions to the Inquiry. The small business survey commissioned by the AEMC also showed that the average self-rated confidence in finding the right information to help choose a suitable energy plan has significantly declined since 2017 (see figure 18.6).
Figure 18.6: Small business confidence in finding best energy plan
2014
2015
2016
2017
2018
Quite or very confident (7–10) Fairly confident (4–6) Not confident (0–3) Don't know
Meanconfidence
(0–10)
6.5
7.1
7.0
6.0
5.5
62%
67%
68%
45%
21%
4%
1%
22%
9% 2%
17%
13%41%
41%
19%
7%
37%
2%
20% 2%
Source: Colmar Brunton research undertaken for the AEMC’s 2017 Retail Energy Competition Review.
879 Mach 1 Panels, Submission to ACCC Issues Paper, 31 May 2017, p. 1; Chamber of Commerce and Industry Queensland, Submission to ACCC Issues Paper, 7 July 2017, p. 3; Klein, S, Submission to ACCC Issues Paper, June 2017, p. 1; Alba Cheese, Submission to ACCC Issues Paper, June 2017, pp. 1–2; Printing Industries Association of Australia, Submission to ACCC Issues Paper, 30 June 2017, p. 7; NSW Small Business Commissioner, Submission to ACCC Issues Paper, 30 June 2017, p. 2.
880 See for example Tasmanian Small Business Council, Submission to ACCC Issues Paper, June 2017, p. 7; Chamber of Commerce and Industry Queensland, Submission to ACCC Issues Paper, July 2017, p. 3.
881 ECA, Energy Consumer Sentiment, December 2017, p. 44; Chamber of Commerce and Industry Queensland, Submission to ACCC Issues Paper, 7 July 2017, p. 3; New South Wales Business Chamber, Submission to ACCC Issues Paper, 30 June 2017, pp. 2–3.

340 Retail Electricity Pricing Inquiry—Final Report
The same survey shows that there has been a steep decrease in the level of awareness of price comparison websites among small businesses since 2017 (see figure 18.7).
Figure 18.7: Small businesses unprompted awareness of price comparison websites
0%
5%
10%
15%
20%
25%
30%
35%
40%
45%
2014 2015 2016 2017 2018
% o
f re
spo
nden
ts
Any website iSelect Compare The Market
Choosi CHOICE Energy Made Easy
24%
9%
4%
30%
16%
2%
37%
23%
6%
41%
20%
12%
22%
12%10%
Source: Colmar Brunton research undertaken for the AEMC’s 2017 Retail Energy Competition Review.
Small businesses face other challenges in engaging with the market beyond the confusing and complex nature of retail offers. Submissions and consultations have highlighted that businesses are typically time-poor.882 Most small businesses are sole traders so have no staff to dedicate to electricity procurement.883 These factors go some way to explain the higher rates of small business customers on standing offers or undiscounted offers compared to residential consumers. Considering the overlap of issues between households and small businesses, many measures aimed at supporting households to find a better deal should help small businesses. Many of the issues and recommendations outlined in part 3 around consumer search tools and improved market transparency are equally relevant to small businesses and the ACCC’s recommendations and should generally be applied to small business customers. For example, recommendations 32 and 33 relating to discounts should make comparing and selecting offers for small business customers much simpler and encourage retailers to innovate further in the offers they provide. Given that some small businesses are paying higher electricity prices (at a per unit rate) when compared to households, these measures are vital.
The ACCC recognises that implementing a reference bill approach for discounting may be more complex for small businesses due to the wide range of usage patterns and volumes among the small business cohort. However, we consider the value to small business of this reform to be significant. The ACCC therefore supports the extension of discounting from a reference bill to small business offers. The current price reporting by Alviss Consulting and IPART for small business demonstrates that developing generally representative benchmarks is possible.884
882 NSW Small Business Commissioner, Submission to ACCC Issues Paper, 14 July 2017, p. 2. When asked for reasons not to switch, small businesses indicated there was no alternative available (18 per cent), it would be too time consuming (12 per cent), it would be too difficult (6 per cent) or the information was too difficult to understand (5 per cent) (Energy Consumers Australia, Energy Consumer Sentiment Survey Findings July 2016, p. 38).
883 Australian Bureau of Statistics, Counts of Australian Businesses, June 2013 to June 2017, viewed 8 May 2018, http://www.abs.gov.au/AUSSTATS/[email protected]/Lookup/8165.0Main+Features1Jun%202013%20to%20Jun%202017?OpenDocument. The ABS notes that 61.2 per cent of Australian business are sole traders.
884 Alviss Consulting, Analysis of small business retail energy bills in Australia, December 2017.

341 Retail Electricity Pricing Inquiry—Final Report
The ACCC considers that abolishing the standard retail contract and replacing it with a default offer for small businesses, in line with recommendation 30 for residential customers, will result in significant savings for small businesses that are currently on standing offers. The AEMC has estimated that the gap between the median standing offer and median market offers can be between $969 and $3547.885
The ACCC’s recommendation would substantially narrow this gap because highly inflated standing offer rates would no longer apply. Savings for those on standing offers could be $1000–$1500 per year for average small business customers and two to three times that amount for businesses closer to the higher end of the small customer usage threshold.886
Recommendation 49The ACCC’s recommendation to abolish the standing offer and replace it with a ‘default offer’ set by the AER (recommendation 30) should be extended to offers for SME customers that are considered small customers under the NERL.
Recommendation 50The ACCC’s recommendation that all discounts must be calculated from a reference bill set by the AER (recommendation 32) should be extended to all generally available offers including offers for SME customers. The AER should develop a benchmark for representative usage levels for an average SME customer. Similarly, restricting conditional discounts to the reasonable savings that a retailer expects to make if a consumer satisfies the conditions (recommendation 33) should also apply to offers for business.
In chapter 13 the ACCC has noted the important role that smart meters and access to data will play for consumers in the future, by allowing consumers to manage their energy use and make more informed energy choices. Improved real-time energy data will further assist business users to access tools that measure their electricity use across their operation, and ultimately make more informed decisions about their energy costs. For small businesses with a heavy reliance on electricity, this can make a major difference to their competitiveness. In chapter 7 we recommend audits around the progress of the competitive rollout of smart meters, and an important part of this process will be tracking the effective rollout of smart meters to small businesses.
18.1.3 Effective tools and resources for small businessesIn addition to the recommendations above, the ACCC considers that small businesses will get the best outcomes if they use the tools available to get advice tailored to their circumstances. This is particularly important given the disparate nature of small business electricity usage, which means that what can be a good offer for a small energy user is unlikely to be the best offer for a large energy user.
Even though government-run comparators, such as the AER’s Energy Made Easy website, provide information on small business offers as well as residential ones, the limited awareness of the service, and the lack of promotion directed at small businesses needs to be addressed if there is to be a real growth in the level of small business engagement with the retail market. The general lack of awareness among businesses around how to reduce their costs or engage with the market is of concern to stakeholders, and a number of consultations and submissions to the ACCC reflected poor awareness among businesses on their options and rights.887 The ACCC sees benefit in developing and promoting well-targeted information and resources specifically for small businesses, to bring their engagement up to levels that are at least comparable with other consumers.
885 Savings per annum for an average small business customer (an assumed usage of 17 500 kWh) when moving from the standing offer to the cheapest market offer are estimated to be $969 in the ACT, $2211 in NSW (Ausgrid), $2662 in Victoria (Citipower), $2152 in south east Queensland, and $3457 in South Australia (AEMC, 2018 Retail Energy Competition Review: Final Report, June 2018, p. 82, table 4.6).
886 ACCC analysis of generally available small business standing offers on the Energy Made Easy website indicates that customers with usage of around 40 000 kWh would pay approximately $6000 more when on the standing offer compared to the average market offer.
887 EWOV, Submission to ACCC Issues Paper, 30 June 2017, p. 4; Large Format Retail Association, Submission to ACCC Issues Paper, 30 June 2017, p. 11; Chamber of Commerce and Industry Queensland, Submission to ACCC Issues paper, 7 July 2017, p. 3.

342 Retail Electricity Pricing Inquiry—Final Report
A review by the ACCC of the main energy consumer information websites suggests much of the information on the benefits of shopping around for all small customers is presented generally for a residential audience.888 Considering this, the ACCC also recommends that governments develop strategic engagement plans regarding electricity markets that can be disseminated through its small business information channels. In chapter 14, the ACCC outlined its view that the Australian Government should undertake an awareness campaign similar to the ‘What’s my Number’ campaign carried out by the New Zealand Energy Authority.889 Such an awareness campaign would also assist small businesses by increasing awareness of price comparator services. Increased use of government-run comparator websites would likely kick-start competition and prompt greater small business engagement with the electricity market.
Given the Inquiry has heard that small business customers are time-poor and generally unaware of the tools available to assist with energy decisions, the ACCC considers it appropriate for a government-funded campaign to promote awareness of the government comparators focused on small businesses.
Recommendation 51Governments and market bodies should develop specific electricity market awareness campaigns targeted at small business customers.
As part of these communication campaigns, governments and market bodies should look at how they can channel marketing material through departments and agencies that service small businesses (such as small business representative groups) as well as existing channels of communication for energy.
Taking into account that business experiences and needs are not homogeneous, the ACCC also considers small business organisations, alongside the energy ombudsmen and small business commissioners, can play a useful role in providing and sourcing tailored and readily accessible advice to small businesses. While some business organisations already provide support directly to the small business community, for instance the Bundaberg Canegrowers Bill Check Service890, the ACCC considers this assistance needs to be more readily available. Increased offering of these services by organisations supporting small business will only happen with the assistance of governments. As with social service organisations that support households struggling with energy costs, energy advice is not the core work of business organisations, yet it is an increasing priority for their members. For this reason, government support will be needed to specifically fund these functions.
As small businesses often require tailored assistance and advice, small businesses would benefit from targeted support in a similar way to vulnerable consumers. The measures that the ACCC recommends for vulnerable consumers are described in chapter 15, and include providing funding to consumer organisations to improve energy literacy and help vulnerable consumers find better deals (recommendation 38). Such funding could also be provided to small business groups to provide retail bill advice and information services. This program could be operated in a similar way to the vulnerable consumer information funding program, supporting in-house staff or online tools operated by business organisations and geared toward a sector’s specific energy profile and needs. These programs could be procured and assessed through competitive processes and allocation of grants.
Recommendation 52State and territory governments should fund small business organisations to provide tailored retail electricity market advice. The fund should total $10 million over three years and be awarded on a competitive basis to small business representative organisations providing information, tools and advice to small businesses on retail electricity choices. This program could support individualised bill checking services and development of tools to help small businesses make better energy choices.
888 The ACCC reviewed a range of websites on electricity and gas markets and found the information in many cases was predominantly directed at residential audiences. Even where a business landing page existed information was often high level, and specific information on pricing and rights still referred by to a more generic consumer information page.
889 Brattle report, appendix 10, p. 103.890 Bundaberg Canegrowers, Newsletter April 2018, viewed 21 May 2018, http://www.bdbcanegrowers.com.au/wp-content/
uploads/2018/05/Newsletter-April-2018.pdf.

343 Retail Electricity Pricing Inquiry—Final Report
18.1.4 The day-to-day experience of small business customers
Payment flexibilityWith many small businesses struggling with recent rises in electricity costs, there is a risk of disconnection and average debt rates increasing. This concern is reflected in anecdotal evidence of debt and disconnection, as well as business closures; however evidence of this is yet to bear out in current market data where disconnection and debt for small businesses is generally stable across all states except the ACT and Victoria.891 Yet, unlike households, small businesses are not able to obtain the consumer protections associated with energy debt like hardship policies and payment plan arrangements.892 The development and application of payment difficulty frameworks and hardship assistance for small businesses is therefore at the discretion of retailers.
Following the Prime Minister’s roundtable with retailers, we understand that retailers have been considering ways to improve small business accessibility to payment plans. The ACCC understands that some retailers in certain circumstances have provided access to payment plans to SMEs. However, documents reviewed during the Inquiry indicate retailer efforts in this regard are ad hoc in nature rather than supported by consistent internal policies. The ACCC considers that retailers can and should do more in this regard.
The ACCC recognises that regulating retailers to establish hardship policies and payment plans for small business customers is not without complexity or risk. The ACCC notes retailer concerns around the additional costs they would face in managing the risk, in addition to the costs of assessing customers’ applications for payment plans, particularly noting the risk of business insolvency and the high rates of business failure.893 This issue, as well as potential increases in retailer bad debt costs, makes the ACCC reluctant to recommend further regulation that requires retailers to establish a business hardship policy.
Therefore, the ACCC suggests that retailers are given an opportunity to develop an industry-led approach, where retailers improve the accessibility and clarity of information around payment plan options for small business. In 2020, governments should re-evaluate the efficacy of industry-led action once governments have time to monitor price and market performance of retailers around business consumers.
Recommendation 53After two years, the COAG Energy Council should review industry efforts to assist small businesses experiencing payment difficulties. The review should take into account metrics like customer satisfaction, disconnection levels and average debt levels for small businesses. The review should determine if industry-led improvements are effective or whether changes to the NERL are necessary to require retailers to have a hardship policy for small businesses.
In chapter 16, the ACCC recommended a strengthened price reporting regime as a means by which governments, regulators and policy makers in the NEM could gain a better understanding of retail electricity markets and what consumers are paying. This reporting regime should also extend to business outcomes. The AEMC also sees a case for including reporting on small business customers’ experiences.894 Greater retail price and market performance reporting for business will be essential if governments are to intervene and extend specific protections to small business like payment plan provisions.
891 AER, Annual Report on Compliance and Performance of the Retail Energy Market, 2016–17, November 2017, p. 28; Essential Services Commission, Victorian Energy Market Report 2016–2017, p. 59. The number of small business disconnections in Victoria is declining.
892 NERL, ss. 43, 50.893 According to data from the ABS, only about 50 per cent of small businesses survive the first years of business (ABS, Counts of
Australian Businesses, including Entries and Exits, Jun 2013 to Jun 2017, viewed 21 May 2018, http://www.abs.gov.au/ausstats/[email protected]/mf/8165.0).
894 AEMC, 2018 Retail Energy Competition Review Final Report, June 2018, p. xiv.
344 Retail Electricity Pricing Inquiry—Final Report
Recommendation 54The ACCC’s recommendation in respect of improved and streamlined price reporting (recommendation 40) should include expanded reporting for businesses. Price reporting for businesses should be consistent with residential electricity price reporting and retailer cost reporting. The expanded and streamlined reporting process would also allow for disaggregated data on business customer switching trends, reporting on what SMEs are paying, and reporting on the kinds of offers they are on.
Awareness of rights and support servicesIncreasing awareness of services offered by the energy ombudsmen and small business commissioners should help improve many businesses day-to-day interactions with energy retailers. As noted in the Energy and Water Ombudsman NSW case study in box 18.1, their assistance can result in better outcomes for business customers. Therefore, any information or marketing campaign targeted at small business must consider improved promotion of energy ombudsmen services and relevant consumer protection information.
Box 18.1: Case study EWON incorrect retail business usage classificationA small business customer contacted EWON to dispute the first quarterly electricity bill received from his retailer for $2819.67. The customer had just moved into the premises and complained that he was being charged a capacity demand charge. The customer explained to EWON that he had not been made aware that he would incur such a charge and considered that his business did not consume enough electricity to justify it. The customer had contacted the retailer who advised him that his network tariff could not be changed.
EWON contacted the retailer who reviewed the customer’s consumption and acknowledged that the customer would be better suited to a network tariff designed for businesses with low annual consumption. The retailer provided EWON with a tariff change request form for the customer to complete. The retailer submitted the request to change the customer’s network tariff and offered to credit the customer’s account with $758.73. The customer was referred back to their retailer to discuss a payment arrangement or extension of time to pay the balance owing.895
EWON indicated it receives around 1500 small business complaints each year, with more than half of them related to disputes about bills, tariffs and business classifications.896
Submissions from energy ombudsman schemes highlighted the important role they play in resolving small business disputes and the low level of awareness of their role among that consumer group.897 The ACCC acknowledges the efforts energy ombudsmen have made to promote their services, but considers that more can be done to improve awareness.898
Recommendation 55State and territory governments should provide resourcing toward promoting energy ombudsman schemes as a part of a broader marketing campaign to build small business engagement with retail electricity markets.
895 Anonymised case study provided by EWON, May 2018.896 Information on small business complaints provided by EWON, May 2018.897 EWON, Submission to ACCC Preliminary Report, 17 November 2017, p. 4; EWOSA, Submission to ACCC Preliminary Report,
17 November 2017, p. 2.898 EWOSA, Submission to ACCC Preliminary Report, 17 November 2017, p. 2.

345 Retail Electricity Pricing Inquiry—Final Report
18.1.5 Small business customers in regional and price regulated marketsSome small businesses are located in regulated parts of the NEM, such as regional Queensland, the ACT and Tasmania. Small businesses are mostly dependent on the prices set by the regulators and have no access to effective competition.899 Some organisations representing small businesses in these areas expressed a concern that, under these circumstances, businesses are more likely to be paying more for their electricity than comparable business customers elsewhere.900
Customers in remote and regional areas in competitive markets can have different energy needs and experiences than businesses in urban areas.901 In addition to certain areas being serviced by fewer retailers, many businesses in regional areas are agribusinesses and as such have different electricity needs.902 Agribusinesses are often price takers in domestic and international markets and recent electricity price increases typically cannot be passed through to their customers.
Further, the potential move to cost-reflective network tariffs has been observed to have a significant impact on agribusinesses’ ability to compete.903
In general, the ACCC’s observations about, and recommendations for, retail competition (set out in chapter 6) and improving consumer experiences (set out in part 3) apply across the NEM, including to regional customers. The ACCC considers that efforts on these fronts should improve outcomes for customers in metropolitan and regional areas. However, some discrete issues that apply to regional customers only are considered below.
Regulated retail prices and regional businessesIn Tasmania, the ACT and regional Queensland, the vast majority of small businesses are on the relevant regulated tariff rate for their customer class.904 In Tasmania and regional Queensland, small businesses have reported that, while in theory they can choose a retail offer from a commercial provider, the outcome of choosing a non-regulated market offer price (where it is available) is often a higher price than that afforded through the regulated offer. A small business survey carried out on behalf of the AEMC showed that many small businesses in these areas believe they have no choice of electricity retailer.905
The Tasmanian Small Business Council acknowledged the benefits of the price-setting aimed at limiting retail headroom, and the Tasmanian Government subsidy to offset recent wholesale market price increases.906 However, it noted that the current arrangements in the Tasmanian wholesale market prevent mainland retailers entering the market and providing any choice to Tasmanian business customers.907 Their greatest concern with Tasmania’s situation is the single buyer and seller wholesale market model and their connection to the regulator as state-owned entities, leaving Tasmanian customers open to the risk in the future of market power from a monopoly provider.908
Business organisations representing SME customers in regional Queensland909 raised similar concerns around access to effective competition. The Queensland Energy Users Network (QEUN) raised concerns with the QCA about their approach to setting regulated retail prices in regional Queensland.910 The higher costs under these offers have been noted by the QEUN as having a significant impact on regional Queensland businesses’ ability to expand and compete. There is also a low level of competition
899 Tasmanian Small Business Council, Submission to ACCC Issues paper, 4 July 2017, p. 6; Chamber of Commerce and Industry Queensland, Submission to ACCC Issues Paper, 7 July 2017, p. 2.
900 Agricultural Industries Energy Task Force, Submission to ACCC Issues Paper, 12 July 2017, attachment 1, p. 68; NSW Farmers’ Association, Submission to ACCC Issues Paper, June 2017, p. 5.
901 EWON, Submission to ACCC Preliminary Report, 17 November 2017, p. 2; NSW Farmers’ Association, Submission to ACCC Preliminary Report, November 2017, p. 5.
902 Queensland Electricity Users Network, Impact of higher electricity prices on businesses in regional Queensland, January 2018, p. 26.903 NSW Farmers’ Association, Submission to ACCC Preliminary Report, November 2017, p. 3.904 The AEMC indicates in its state summaries that the majority of small customers in these jurisdictions remain on standing offers across
both residential and small business customer groups (AEMC, 2018 Retail Energy Competition Review: Final Report, June 2018, pp. 257, 318 and 282).
905 88 per cent of Tasmanian businesses, 82 per cent of regional Queensland businesses, and 24 per cent of businesses in the ACT do not believe they have a choice of electricity retailer (Colmar Brunton, Small business survey report for the AEMC 2018 Retail Energy Competition Review, June 2018, pp. 129, 137).
906 Tasmanian Small Business Council, Tasmanian Wholesale Electricity Market Study: Final Report, January 2018, p. ii.907 Tasmanian Small Business Council, Tasmanian Wholesale Electricity Market Study: Final Report, January 2018, p. ii.908 Tasmanian Small Business Council, Submission to ACCC Issues Paper, June 2017, pp. 6–7.909 Ergon Energy estimates that there are 101 500 SME customers in its network region. Ergon Energy, Tariffs Structure Statement Ergon
Energy, 2017–2018, November 2015, p. 5.910 Queensland Electricity Users Network, Submission to Queensland Competition Authority, January 2018, p. 6.

346 Retail Electricity Pricing Inquiry—Final Report
in regional Queensland, and a recent small business survey indicated that regional Queensland customers are dissatisfied with the lack of choice of retail offers.911
The ACCC recognises that the costs to supply customers in different geographic regions do vary, and price-setting needs to take into account the differing costs to supply. In chapter 12 the ACCC considers the price setting process employed by the QCA with regard to the development of a default offer. The QCA sets prices for regional Queensland customers based on the lower costs of supply in south east Queensland, consistent with the Queensland Government’s Uniform Tariff Policy.912 These notified prices are, therefore, significantly lower than the unsubsidised costs of supply to most regional Queensland customers.913
However, the ACCC notes that regional Queensland customers do still pay more than those business customers on the median market offer in the south east Queensland market.914 The ACCC notes that the QCA uses a network plus retail cost build-up approach to calculate notified prices. These costs include a competitive allowance based on observations from competitive retail and wholesale electricity markets in Australia. Offers in south east Queensland will be lower than the notified price to the extent that retailers can reduce these ‘competition costs’ below the allowance set by the QCA.
The ACCC considers that transparency in regulated price setting for regional Queensland customers will be important to ensure that customers pay no more than needed to meet the costs of supply. The ACCC recommendations regarding network asset write-downs in chapter 7 and improving competition in the wholesale market in chapter 4, including the specific recommendations concerning the restructuring of Queensland’s generator portfolios (recommendation 2), should reduce the retail costs experienced by customers in regional Queensland markets.
In addition to general price differences between south east and regional Queensland, regional Queensland customers have also raised concerns with the lack of awareness and understanding of the Queensland non-reversion policy. This policy prevents regional customers returning from a market retail offer to the Ergon Energy retail regulated price, even where the market retail price is higher than the regulated rate.915 Unlike New York or other overseas markets which have protections built in for customers that trial competitive offers916, Queensland’s non-reversion policy has resulted in customers in Queensland not getting any guarantees of lower prices or the opportunity to return to the regulated price option where the market retail offer turns out to be higher than the regulated rate.
911 AEMC, 2018 Retail Energy Competition Review: Final Report, June 2018, p. 190.912 Queensland Competition Authority, Final Determination: regulated retail electricity prices for 2018–19, May 2018, p. iii.913 QPC, Electricity Pricing Inquiry: Final Report, May 2016, p. 229.914 Alviss consulting SME offer data (unpublished) indicates that small business customers in the Ergon Energy network and on a single
rate pay around $6580 per annum when using around 20 000 kWh and the average market offer for a comparable customer in south east Queensland is around $6000 per annum.
915 The non-reversion policy as laid down in the Electricity Act 1994 (Qld), the Energy and Water Ombudsman Act 2006 (Qld) and the National Energy Retail Law (Queensland) Act 2014 (Qld) Note that a Bill was introduced into the Queensland Parliament in February 2018 to remove the non-reversion policy (Electricity and Other Legislation (Batteries and Premium Feed-in Tariff) Amendment Bill 2018 (Qld)).
916 Brattle report, appendix 10, p. 128.

347 Retail Electricity Pricing Inquiry—Final Report
Box 18.2: Queensland non-reversion policy increasing energy costs for small businessesA business in regional Queensland took over the lease of a child care centre. A previous lessee for the centre had switched away from the incumbent Ergon Energy to another retailer. The new owner decided to sign a contract with that same retailer. During the first year, the child care centre was charged the regulated price. From the second year the prices were raised to more than 10 per cent above the regulated prices. The annual electricity costs were around $18 000. The child care centre could not switch back to the regulated offer by Ergon Energy ‘because of the law’ stating that once switched away from Ergon Energy they could not return to the regulated supplier. There is no alternative retail competitor available in regional Queensland. After 18 months of being charged more than the regulated price, the business owner established that the retailer was allowed to charge more than the regulated price because they had a contract and that the regulated price is intended to protect only those who do not have a contract. The business owner requested the contract be cancelled, and the retailer cancelled the contract and agreed to refund any charges in excess of the regulated rate. The regulated price has been charged since.
The same business in regional Queensland built a new child care centre and contracted Ergon Energy for supply. The first two bills were charged at 35 per cent above the regulated price. When asked why, Ergon Energy explained the child care centre had been charged as a ‘large user’ (over 100 MWh per year). While the child care centre insisted they were only using about 50 MWh, Ergon Energy in the first instance refused to lower the bill and said that any change in the determined usage would not lead to any refunds. However, after the child care centre insisted, Ergon Energy capitulated and started charging the child care centre the regulated price. The overcharging was never refunded.917
The non-reversion policy, while initially intended to promote competition, is concerning as it appears to have had the opposite effect in that it acts as a disincentive for customers to move to market offers. The ACCC supports the Queensland Government’s move to end the non-reversion policy for small customers.918
Cost reflective network tariffs and regional businessesThe provision of network infrastructure to regional and rural areas is more costly than to metropolitan areas. The large distances that need to be covered requires greater capital investment, maintenance and staffing resources. Furthermore, this increased cost is spread across a smaller numbers of users, meaning that individual users pay significantly more for network services. This is why the ACCC recommends that the COAG Energy Council consider a NEM-wide approach to standalone systems (see chapter 8). In chapter 7, the ACCC considered how to reduce network costs including write-downs in the value of network assets. This would likely have a positive impact on regional businesses, including the agriculture sector, in relevant networks. However, cost-reflective tariffs are of concern to the agriculture sector, particularly irrigation, as they can face higher costs when placed on the cost-reflective network tariff rather than current flat rate tariffs. How these businesses are affected depends on when their usage takes place and the extent to which usage can be time-shifted. The current tariff structure has cross subsidies built in to it that sees all customers paying similar rates regardless of full costs that are implied by providing them network services.
The TSS process and the Distribution Pricing Principles under the NER919 require network businesses to consider the impact on retail customers of changes to network tariffs in the design of new tariffs. This allows for consideration of a retailer’s customer’s ability to respond to the new price signal of the approved network tariff. The ACCC notes from submissions that certain business sectors may require additional targeted assistance to help them adjust to the new network pricing arrangements.920 This
917 Anonymised case study provided by the Queensland Small Business Champion, May 2018.918 For the Queensland Government announcement to remove the non-reversion policy, see Queensland Government, Joint Statement,
Media Release, 24 October 2017. The ACCC understands that the non-reversion policy is still in place for regional Queensland customers (see Wardill, S, Bit of political spin to the power game, the Courier Mail, 22 June 2018). There is legislation before the Queensland Parliament to remove the restriction on regional Queensland customers for this see the Parliament Queensland, Electricity and Other Legislation Amendment Bill, viewed 22 May 2018 http://www.parliament.qld.gov.au/documents/tableOffice/BillMaterial/180215/Electricity.pdf.
919 NER, r. 6.18.920 NSW Farmers’ Association, Submission to ACCC Preliminary Report, November 2017, p. 6.
348 Retail Electricity Pricing Inquiry—Final Report
assistance could be targeted at businesses that are unable to change or shift their load due to factors like production processes or, for instance, irrigators that must use water pumps at times of critical peaks due to the unavoidable need for increased irrigation during extreme weather events.921
The QPC considered the concerns raised by irrigators regarding increasing network costs, in the case of Queensland’s subsidised obsolete tariffs, and recommended that structural adjustment assistance from the Queensland Government could be used to assist business customers.922 The types of assistance considered for this group included upfront structural assistance, energy efficiency audits, and demand management.923 The QPC found positive results with the application of energy saving measures, like energy audits, in reducing network costs. The issue of potential increases in network costs and the need for transitional arrangements, will be equally applicable with the introduction of cost-reflective tariffs. The NSW Farmers’ Association also identified that agribusinesses have significant opportunities to employ a range of technologies to manage and reduce their load, but trials of integrated technology solutions as well as tailored cost-reflective network tariffs are required to enable access to those emerging technology solutions.924
Recommendation 56Governments should make available well targeted assistance programs including energy efficiency audits to assist the businesses most adversely impacted by the transition to more cost network reflective tariffs.
18.2 Medium business customersMedium-sized businesses are energy customers whose usage will be around or above the NERL usage threshold925 and that have 20 or more employees.926 The protections in the NERL are aimed at individual customers with limited buying power or the commercial experience to negotiate complex contracts. Therefore many of the protections in the NERL are not applicable to more complex commercial contracts associated with electricity supply for larger users. For instance, where contractual disputes arise between a retailer and a medium-sized business these are best addressed by civil arbitration and legal processes as they can be more complex than small customer disputes supported by energy ombudsmen services.
Medium businesses generally receive a lower unit price than small customers but a substantially higher overall cost due to their level of consumption.927 Medium-sized businesses are generally more aware and capable of measures to reduce their energy needs, such as the takeup of new technologies to augment or reduce their energy demand. The businesses surveyed by the AEMC indicated that they are also more likely to install or better utilise smart meters and energy management systems.928
Medium-sized businesses typically have to negotiate energy contracts every one to three years. Businesses that have 20 to 199 employees are significantly more confident in finding the right information to help choose energy plans than the average businesses.929 However this engagement has not insulated medium-sized businesses from dramatically increasing electricity costs, which have been reported anecdotally to the Inquiry of 200–300 per cent from their most recent offers. In late 2017, the South Australian Hotels Association reported increasing financial stress across its members, with examples of bills increasing by $500–$600 per week, and highlighted electricity prices were a key factor in some hotel closures.930
921 Agricultural Industries Energy Task Force, Submission to ACCC Issues Paper, 12 July 2017, attachment 1, p. 14.922 QPC, Electricity Pricing Inquiry, May 2016, p. 254.923 QPC, Electricity Pricing Inquiry, May 2016, p. 254.924 NSW Farmers’ Association, Submission to ACCC Preliminary Report, November 2017, p. 26.925 The NERL, s. 5 and National Energy Retail Regulations (SA), s. 7 define a small customer as all residential and business customers
that consume less than 100MWh per year. Some jurisdictions have a consumption limit for a business customer that differs to the NERL: 40 MWh in Victoria, 150 MWh in Tasmania, and 160 MWh in South Australia. All other states are 100 MWh.
926 The ABS defines businesses by the number of employees, with a small business being a business with less than 20 employees.927 AEMC, AEMC wants energy retailers to win consumers’ trust, Media Release, 15 June 2018, p. 4.928 AEMC, 2018 Retail Energy Competition Review Final Report, June 2018, p. 129.929 AEMC, 2018 Retail Energy Competition Review Final Report, June 2018, p. 129.930 Robinson, L, ‘High energy prices increase pressure on country hotels’, ABC News, 29 November 2017.

349 Retail Electricity Pricing Inquiry—Final Report
Medium-sized businesses are generally price takers and still experience some challenges when engaging with retail electricity markets. The barriers to engaging with the retail markets as described earlier in the chapter are not limited to small businesses, with many medium-sized businesses facing similar issues with comparing complex offers and negotiating their electricity contracts. Submissions indicated that many medium-sized businesses engage with retailers, or third parties like energy brokers, and rarely engage directly in the wholesale spot market.931 The ACCC has learnt from consultations with medium-sized businesses that engaging with the wholesale market is generally unattractive due to the complexity of managing energy procurement and the difficulty around procuring competitively priced hedging contracts, particularly in markets with limited liquidity.932
The ACCC is also aware that recent price increases in some wholesale markets has resulted in medium businesses (at or above the usage threshold for small customers) receiving tenders with a limited time for response.933 Where previously they may have had around a week to accept or reject a quote, some businesses have reported being given only a few days. If quotes are not accepted in time, retailers will re-assess and often re-price the quote depending on their additional contracting costs to meet that load.934 The AEMC has found that in 2018 there has been some relaxation in those timeframes, although retailers indicated that this shorter timeframe for considering offers will persist while wholesale markets remain volatile.935
18.2.1 Group buying for electricity contracts for business customersIn response to higher retail prices, a number of groups of businesses have sought authorisation from the ACCC to collectively bargain for electricity. The purpose of a buying group for electricity is to create scale among the group by pooling their electricity demand to seek more competitive offers from suppliers. Sometimes, the larger load will allow the group to underwrite capacity for a new entrant supplier. The group will collectively tender for an electricity supplier to secure a supply agreement with each member on the same terms (including price) to meet the collective electricity requirements of the group. These arrangements are authorised by the ACCC where the public benefits arising from the conduct outweigh the public detriments. Authorisation allows businesses to manage the potential risk of legal action for a breach of the CCA. So far, ACCC has granted authorisation for three collective bargaining/joint purchasing arrangements for electricity.
�� In July 2016 the ACCC granted authorisation to Melbourne City Council and 13 other parties to establish a joint renewable energy purchasing group, which they have called the Melbourne Renewable Energy Project (MREP). Through the authorised group buying arrangement, the group collectively purchased renewable energy from a newly built 39-turbine 80 MW capacity wind farm. The members committed to purchase 88 GWh of electricity per year from the wind farm under a long-term PPA. The group has also published a guide to assist others with buying off-site renewable electricity.936
�� The Eastern Energy Buyers Group, initially comprising industrial energy users in the Victorian agricultural sector, was granted authorisation to establish a joint energy purchasing group and to run joint tender processes for electricity and gas. The authorisation permits new industrial energy users to join the group as long as the combined annual energy consumption of the group does not exceed 16 PJ of gas or 4.5 TWh of electricity, which is around 10 per cent of Victorian consumption.937
�� The SACOME electricity buying group comprises businesses located in South Australia involved in the mining, university, property investment, and manufacturing and food sectors. Together, the group’s total load accounts for around 16 per cent of electricity demand in South Australia. On 8 June 2018 SACOME awarded an eight-year supply contract to renewable energy retailer SIMEC ZEN Energy, part of Sanjeev Gupta’s GFG Alliance, underwriting new investment in generation capacity in South Australia. SACOME reported that this will significantly reduce the cost of electricity
931 Business SA, Submission to ACCC Preliminary Report, November 2017, p. 3.932 South Australian Chamber of Mines & Energy, Submission to ACCC Preliminary Report, 24 November 2017, pp. 3, 6; Business SA,
Submission to ACCC Issues Paper, 30 June 2017, p. 3.933 NSW Business Chamber, Submission to ACCC Issues Paper, 30 June 2017, p. 3; AEMC, 2018 Retail Energy Competition Review: Final
Report, June 2018, pp. 124–5.934 AEMC, 2018 Retail Energy Competition Review Final Report, June 2018, p. 124.935 AEMC, 2018 Retail Energy Competition Review Final Report, June 2018, p. 125.936 Melbourne City Council, Melbourne Renewable Energy Project: A new generation of energy, viewed 24 May 2018, http://www.
melbourne.vic.gov.au/business/sustainable-business/mrep/Pages/melbourne-renewable-energy-project.aspx.937 ACCC Final determination, Authorisations A91594 & A91595, 22 November 2017.

350 Retail Electricity Pricing Inquiry—Final Report
for their members.938 With electricity representing up to 40 per cent of input costs for members of the group.939 Six of the 27 companies in the authorised buying group have thus far accepted the final offer received from SIMEC.940 SACOME indicated that other SACOME members that have not yet entered the agreement could do so at a later stage.941
The successful completion of the SACOME energy buying group process demonstrates the potential for group buying for other commercial and industrial buying group customers. The ACCC is generally supportive of buying groups for electricity, particularly where they are structured in such a way as to provide scale and a customer base that will help underwrite new investment in generation capacity. These types of arrangements, where successful, can be an important avenue to new entry and therefore a new source of competition in wholesale markets.
In October 2017, amendments to the CCA were passed by the Australian Parliament.942 As part of the amendments, greater flexibility was introduced to the small business collective bargaining notification provisions. Notification provides similar protections to authorisation but it is often simpler and faster. Further, the amendments provide the ACCC with the power to issue class exemptions where particular kinds of conduct that pose very little risk to competition or lead to public benefits are exempt from the competition provisions of the CCA. A class exemption creates a ‘safe harbour’ for business and thereby reduces the compliance and administration costs associated with seeking authorisation or lodging a notification on a case-by-case basis. The ACCC will shortly commence public consultation on a proposed class exemption for certain forms of collective bargaining. The need for joint buying groups, including joint electricity purchasing arrangements, to be included in the collective bargaining exemption will be considered. The process is aimed to be concluded by the end of 2018.
However, introducing class exemptions for group buying processes may not be enough to help reduce price pressure for C&I customers. For example, while the SACOME deal has provided long-term certainty for those participants that have accepted the offer, SACOME has indicated that the process associated with negotiating the agreement was complex and took time to settle.943 The length of this contract (eight years) is also far beyond the one to three-year contracts currently the norm for most business customers. The Inquiry has found through its consultations, even larger C&I customers may not be in the position to enter into longer-term financing commitments, potentially serving as a barrier to other similar deals that look to underwrite generation projects. This issue is discussed in further detail below and in chapter 4.
18.3 Large C&I customersIndustry accounts for 34 per cent of total electricity consumption in the NEM and large users, including aluminium production, account for almost half of this.944 The commercial sector accounts for 26 per cent of total electricity consumption.945 The commercial sector includes a wide range of businesses including financial services, commercial building services, construction and retail services, as well as public services and agriculture.
The Preliminary Report outlined the issues C&I customers face, the most pressing concern being recent sharp increases in their electricity costs largely driven by wholesale prices.946 Submissions from industrial users to the Preliminary Report confirm that they have seen substantial increases, in some cases a doubling or tripling, against their most recent electricity offer.947
938 SACOME and SIMEC ZEN Energy, SACOME Joint Electricity Purchasing Group awards long-term supply contract to Sanjeev Gupta’s SIMEC ZEN Energy, Media Release, 8 June 2018, p. 1.
939 SACOME and SIMEC ZEN Energy, SACOME Joint Electricity Purchasing Group awards long-term supply contract to Sanjeev Gupta’s SIMEC ZEN Energy, Media Release, 8 June 2018, p. 2.
940 SACOME and SIMEC ZEN Energy, SACOME Joint Electricity Purchasing Group awards long-term supply contract to Sanjeev Gupta’s SIMEC ZEN Energy, Media Release, 8 June 2018, pp. 3–4.
941 Maclennan, L, South Australian miners unite to cut their power bills with renewable energy deal, ABC News, 8 June 2018, viewed 20 June 2018, http://www.abc.net.au/news/2018–06–08/sa-mining-lobby-signs-up-to-renewable-energy-plan/9850600.
942 Competition and Consumer Amendment (Competition Policy Review) Bill 2017, s. 45AU.943 Maclennan, L, South Australian miners unite to cut their power bills with renewable energy deal, ABC News, 8 June 2018, viewed
20 June 2018, http://www.abc.net.au/news/2018–06–08/sa-mining-lobby-signs-up-to-renewable-energy-plan/9850600.944 Unpublished figures provided by the Department of the Environment and Energy, September 2017, table F.945 Unpublished figures provided by the Department of the Environment and Energy, September 2017, table F.946 ACCC, Retail Electricity Pricing Inquiry—Preliminary Report, 22 September 2017, pp. 20–22.947 Townsville City Council, Submission to ACCC Preliminary Report, 17 November 2017, p. 2; Printing Industries Association of Australia,
Submission to ACCC Issues Paper, 30 June 2017, p. 4.
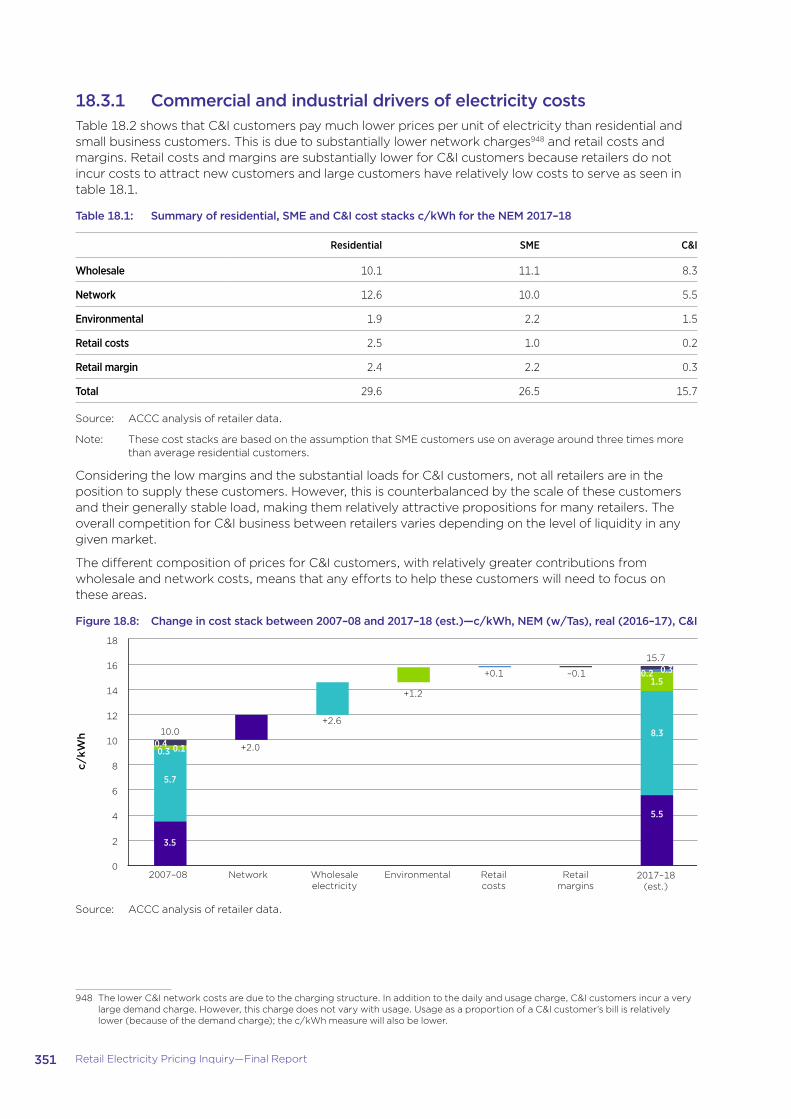
351 Retail Electricity Pricing Inquiry—Final Report
18.3.1 Commercial and industrial drivers of electricity costsTable 18.2 shows that C&I customers pay much lower prices per unit of electricity than residential and small business customers. This is due to substantially lower network charges948 and retail costs and margins. Retail costs and margins are substantially lower for C&I customers because retailers do not incur costs to attract new customers and large customers have relatively low costs to serve as seen in table 18.1.
Table 18.1: Summary of residential, SME and C&I cost stacks c/kWh for the NEM 2017–18
Residential SME C&I
Wholesale 10.1 11.1 8.3
Network 12.6 10.0 5.5
Environmental 1.9 2.2 1.5
Retail costs 2.5 1.0 0.2
Retail margin 2.4 2.2 0.3
Total 29.6 26.5 15.7
Source: ACCC analysis of retailer data.
Note: These cost stacks are based on the assumption that SME customers use on average around three times more than average residential customers.
Considering the low margins and the substantial loads for C&I customers, not all retailers are in the position to supply these customers. However, this is counterbalanced by the scale of these customers and their generally stable load, making them relatively attractive propositions for many retailers. The overall competition for C&I business between retailers varies depending on the level of liquidity in any given market.
The different composition of prices for C&I customers, with relatively greater contributions from wholesale and network costs, means that any efforts to help these customers will need to focus on these areas.
Figure 18.8: Change in cost stack between 2007–08 and 2017–18 (est.)—c/kWh, NEM (w/Tas), real (2016–17), C&I
2017–18(est.)
Retailmargins
Retailcosts
EnvironmentalWholesaleelectricity
Network2007–08
c/kW
h
0
2
4
6
8
10
12
14
16
18
+2.6
+1.2
+0.1 –0.1
+2.0
15.70.3
1.50.2
8.3
5.5
10.00.4 0.10.3
5.7
3.5
Source: ACCC analysis of retailer data.
948 The lower C&I network costs are due to the charging structure. In addition to the daily and usage charge, C&I customers incur a very large demand charge. However, this charge does not vary with usage. Usage as a proportion of a C&I customer’s bill is relatively lower (because of the demand charge); the c/kWh measure will also be lower.
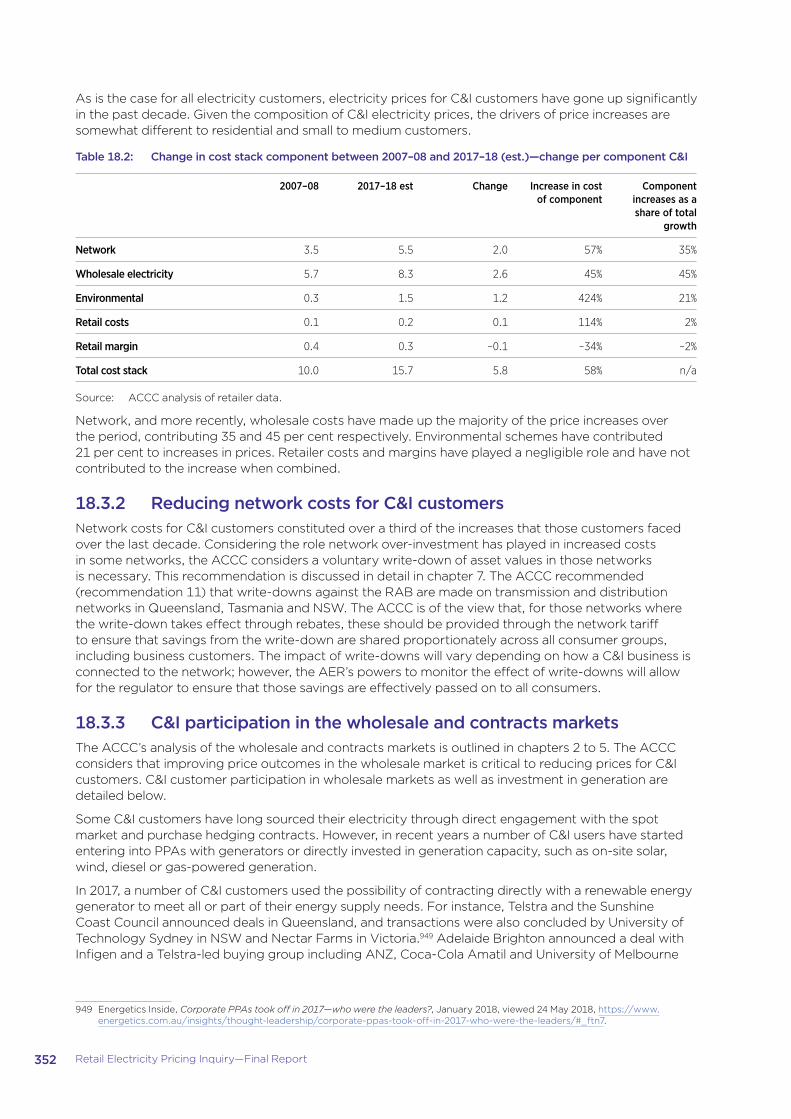
352 Retail Electricity Pricing Inquiry—Final Report
As is the case for all electricity customers, electricity prices for C&I customers have gone up significantly in the past decade. Given the composition of C&I electricity prices, the drivers of price increases are somewhat different to residential and small to medium customers.
Table 18.2: Change in cost stack component between 2007–08 and 2017–18 (est.)—change per component C&I
2007–08 2017–18 est Change Increase in cost of component
Component increases as a share of total
growth
Network 3.5 5.5 2.0 57% 35%
Wholesale electricity 5.7 8.3 2.6 45% 45%
Environmental 0.3 1.5 1.2 424% 21%
Retail costs 0.1 0.2 0.1 114% 2%
Retail margin 0.4 0.3 –0.1 –34% –2%
Total cost stack 10.0 15.7 5.8 58% n/a
Source: ACCC analysis of retailer data.
Network, and more recently, wholesale costs have made up the majority of the price increases over the period, contributing 35 and 45 per cent respectively. Environmental schemes have contributed 21 per cent to increases in prices. Retailer costs and margins have played a negligible role and have not contributed to the increase when combined.
18.3.2 Reducing network costs for C&I customersNetwork costs for C&I customers constituted over a third of the increases that those customers faced over the last decade. Considering the role network over-investment has played in increased costs in some networks, the ACCC considers a voluntary write-down of asset values in those networks is necessary. This recommendation is discussed in detail in chapter 7. The ACCC recommended (recommendation 11) that write-downs against the RAB are made on transmission and distribution networks in Queensland, Tasmania and NSW. The ACCC is of the view that, for those networks where the write-down takes effect through rebates, these should be provided through the network tariff to ensure that savings from the write-down are shared proportionately across all consumer groups, including business customers. The impact of write-downs will vary depending on how a C&I business is connected to the network; however, the AER’s powers to monitor the effect of write-downs will allow for the regulator to ensure that those savings are effectively passed on to all consumers.
18.3.3 C&I participation in the wholesale and contracts marketsThe ACCC’s analysis of the wholesale and contracts markets is outlined in chapters 2 to 5. The ACCC considers that improving price outcomes in the wholesale market is critical to reducing prices for C&I customers. C&I customer participation in wholesale markets as well as investment in generation are detailed below.
Some C&I customers have long sourced their electricity through direct engagement with the spot market and purchase hedging contracts. However, in recent years a number of C&I users have started entering into PPAs with generators or directly invested in generation capacity, such as on-site solar, wind, diesel or gas-powered generation.
In 2017, a number of C&I customers used the possibility of contracting directly with a renewable energy generator to meet all or part of their energy supply needs. For instance, Telstra and the Sunshine Coast Council announced deals in Queensland, and transactions were also concluded by University of Technology Sydney in NSW and Nectar Farms in Victoria.949 Adelaide Brighton announced a deal with Infigen and a Telstra-led buying group including ANZ, Coca-Cola Amatil and University of Melbourne
949 Energetics Inside, Corporate PPAs took off in 2017—who were the leaders?, January 2018, viewed 24 May 2018, https://www.energetics.com.au/insights/thought-leadership/corporate-ppas-took-off-in-2017-who-were-the-leaders/#_ftn7.
353 Retail Electricity Pricing Inquiry—Final Report
concluded a PPA transaction in Victoria.950 The University of NSW announced that it reached an agreement with Maoneng Australia and Origin to have 100 per cent of its energy supplied by solar PV.951
Second tier retailers like Tango Energy, the retail arm of Pacific Hydro, have also entered into PPAs with large commercial buyers like the City of Melbourne, referenced above as the MREP authorised group buyer, to fund new renewable energy projects, like an 80 MW wind farm in Crowlands.952
According to the Climate Council, business installations of solar have increased by 60 per cent over 2016 and 2017, with over 40 000 commercial systems now installed in Australia. The total capacity of business solar installations has more than doubled since the start of 2016.953 Powerlink, the Queensland transmission network, added seven large connections for solar and wind farms in 2017 and reported that it has almost 30 GW of connection inquiries, indicating businesses are making substantial investments in renewable capacity in Queensland.954 A recent example of this is the University of Queensland’s announcement that it will be investing $125 million in a 64 MW solar farm in Warwick. The university expects the farm to offset its electricity costs of $22 million per year.955
Box 18.3: Case study—Sun MetalsSun Metals commissioned the development of a 124 MW solar PV plant alongside its zinc refinery plant north of Townsville. Sun Metals is one of the biggest electricity consumers in Queensland, using 900 000 MWh of electricity to produce 225 000 tons of zinc every year. High wholesale and network electricity costs have led Sun Metals to build a solar farm that it estimates will provide around one third of the business’ electricity needs.
Since 2004, Sun Metals has been a wholesale electricity market customer and has employed demand management in the form of load shifting to avoid peak wholesale energy prices. Output from its onsite solar farm will strengthen Sun Metals capacity to participate in the energy market as well as optimise zinc production. Sun Metals chose to invest in its own solar generation capacity instead of using a PPA. The refinery will be the largest single-site consumer of renewables in the country. The solar farm commenced operation in June 2018.956
While some C&I customers are entering into new generation projects like those listed above, new large-scale generation projects carry considerable risk and can be unattractive to traditional financing. As discussed in chapter 4, a number of industrial customers have noted in confidential consultations with the ACCC that the long-term commitment (PPAs are usually in the order of 10 years) associated with new generation investment can be prohibitive. The ACCC believes it is critical to ensure that challenges with project financing do not preclude C&I customers from gaining access to the benefits of independent new low-cost generation in the market. Therefore the ACCC sees a role for the Australian Government in providing support for C&I customers to directly source their full electricity requirements.
The program would limit support to those projects that support at least three large customers. Therefore the project criteria associated with government support of offtake agreements (recommendation 4) should be well targeted and focused on encouraging investment in additional generation from new entrants, and ultimately enable access to low cost generation for C&I customers.957
950 Energetics Inside, Corporate PPAs took off in 2017—who were the leaders?, January 2018, viewed 24 May 2018, https://www.energetics.com.au/insights/thought-leadership/corporate-ppas-took-off-in-2017-who-were-the-leaders/#_ftn7.
951 Energetics Inside, Corporate PPAs took off in 2017—who were the leaders?, January 2018, viewed 24 May 2018, https://www.energetics.com.au/insights/thought-leadership/corporate-ppas-took-off-in-2017-who-were-the-leaders/#_ftn7.
952 Pacific Hydro, The Power of Coming Together—Pacific Hydro and Tango Energy announced as preferred supplier, 17 November 2017, viewed 7 June 2018, http://www.pacifichydro.com.au/pacific-hydro-secures-financing-for-crowlands-wind-farm/?language=en.
953 Climate Council, Renewables & Business: Cutting prices & pollution, 2018, p. 5.954 Powerlink, Connect to our network, viewed 24 May 2018, https://www.powerlink.com.au/connect-our-network; Renewables flow for
Queensland, viewed 22 May 2018, https://www.powerlink.com.au/news-media/renewables-flow-queensland.955 University of Queensland, UQ set world standard with 100 per cent renewable energy, viewed 7 June 2018, https://www.uq.edu.au/
news/article/2018/06/uq-set-world-standard-100-cent-renewable-energy.956 Climate Council, Renewables & Business: Cutting prices & pollution, 2018, p. 19; Smee, B, ‘Almost half of Australian big business
is moving to renewables’, The Guardian, 15 May 2018; RCR, Sun Metals Solar Farm, viewed 24 May 2018, https://www.rcrtom.com.au/latest-projects/sun-metals-solar-farm/; Potter, B, ‘Sun Metals goes solar to cut energy costs’, Australian Financial Review, 21 December 2017.
957 See chapter 4 for detail around the design of the proposed scheme.

354 Retail Electricity Pricing Inquiry—Final Report
Another initiative to fund smaller-scale, local initiatives is provided by the Australian Renewable Energy Agency (ARENA). ARENA funds projects that drive innovation and commercialisation of renewable energy technologies.958 For example, ARENA recently announced a $370 000 funding for a micro-grid designed to test the feasibility of a local energy marketplace of connected energy users who can buy and sell locally produced renewable energy.959 The virtual micro-grid will incorporate solar PV serving around 200 dairy farms.960
Some smaller industrial customers also find it harder to maintain the level of market knowledge required to engage with the current wholesale market.961 There also appears to be an underutilisation of demand response by large industrial customers and this issue is considered in more detail in chapter 8. The wholesale market conditions seem to be supportive of a growing number of third parties offering demand response possibilities as well as PPAs to customers. Established intermediaries like Flow Power and EnerNOC offer integrated demand management systems (including features like direct load control and integration of self or local generation). Flow Power also offers PPAs to large customers, across both South Australia and Victoria.962 EnerNOC provides demand management services and has seen an increase in their portfolio of customers across the NEM.963
The ACCC has recommended a package of changes to improve competition in wholesale markets by encouraging investment in new generation across the NEM and addressing market concentration. The ACCC believes these recommendations detailed in chapter 4 will provide the necessary signals to bring down wholesale prices and improve the outcomes for C&I customers.
The ACCC’s recommendations for networks and environmental policies in part 2 will also be of great assistance to C&I customers given the proportionally larger contribution to C&I bills made by these cost components.
958 ARENA, About, viewed 14 June 2018, https://arena.gov.au/about/.959 ARENA, Dairy farmers could trade energy via blockchain in the Latrobe Valley, viewed 22 May 2018, https://arena.gov.au/blog/
latrobe-valley-microgrid/.960 ARENA, Dairy farmers could trade energy via blockchain in the Latrobe Valley, viewed 22 May 2018, https://arena.gov.au/blog/
latrobe-valley-microgrid/.961 South Australian Chamber of Mines & Energy, Submission to ACCC Preliminary Report, 24 November 2017, p. 6.962 For example: Flow Power, Multicube stockfeeds, viewed 25 May 2018, https://flowpower.com.au/case-studies/multicube-
stockfeeds/.963 EnerNOC, Demand response, viewed 25 May 2018, https://www.enernoc.com/products/businesses/capabilities/demand-response.

355 Retail Electricity Pricing Inquiry—Final Report
Appendix 1: Terms of referenceOn 27 March 2017 the Treasurer, the Hon. Scott Morrison MP, pursuant to s. 95H(1) of the CCA issued a notice requiring the ACCC to hold an inquiry into the competitiveness of retail electricity markets within the NEM. The Treasurer’s direction noted that while the focus of the Inquiry is on retail markets, the operation and competitiveness of the wholesale electricity market significantly affects retail market outcomes and needs to be considered in this context.
The Terms of reference for the Inquiry include, but are not restricted to:
i. the key cost components of electricity retail pricing in the NEM and how they have changed over time
ii. the existence and extent of any barriers to entry, expansion and/or exit in retail electricity markets
iii. the extent and impact of vertical integration in the NEM
iv. the existence of, or potential for, anti-competitive behaviour by market participants and the impact of such behaviour on electricity consumers
v. any impediments to consumer choice, including transaction costs, a lack of transparent information, or other factors
vi. the impact of diverse customer segments, and different levels of consumer behaviour, on electricity retailer behaviour and practices
vii. identifying any regulatory issues, or market participant behaviour or practices that may not be supporting the development of competitive retail markets
viii. the profitability of electricity retailers through time, and the extent to which profits are, or are expected to be, commensurate with risk
ix. all wholesale market price, cost and conduct issues relevant to this Inquiry.

356 Retail Electricity Pricing Inquiry—Final Report
Appendix 2: Summary of the InquiryOn 27 March 2017, the Treasurer, the Hon. Scott Morrison MP, directed the ACCC to hold an inquiry into the retail supply of electricity and the competitiveness of retail electricity markets in the NEM (the Inquiry). The ACCC’s terms of reference for the Inquiry (appendix 1) were broad, encompassing all levels of the electricity supply chain.
Information considered during the InquiryThroughout the Inquiry, the ACCC has received information from a variety of sources, including through submissions, public forums, information sourced through compulsory information gathering powers, research and analysis conducted by consultants engaged by the ACCC, consumer surveys and stakeholder feedback. This information has helped the ACCC to:
�� assess electricity consumption across the economy
�� examine the factors behind the increase in retail electricity prices
�� consider how the wholesale and retail markets are operating
�� understand the experience for consumers in the retail market.
The ACCC was required to hold this Inquiry in public by s. 95R(1) of the CCA. As the Inquiry was a public process, written feedback has generally been published on the ACCC’s website. Parties were permitted to request that information provided not be disclosed to the public on the basis that disclosure of the information would damage the competitive position of the party (ss. 95ZN(1) of the CCA).
A range of parties made confidentiality claims over the information they provided to the ACCC. Where the ACCC considered that disclosure of information was necessary in the public interest, the ACCC consulted with the relevant parties before disclosing that information.
Issues PaperThe ACCC published the Issues Paper for the Inquiry on 31 May 2017. The Issues Paper outlined the key issues of relevance to the Inquiry, and requested feedback by 30 June 2017. The ACCC received over 150 submissions to the Issues Paper. A wide range of parties made submissions, including electricity generators, electricity retailers, electricity networks, consumer groups, industry groups, and individual consumers.
Public forumsThroughout July and August 2017 the ACCC held six public forums in a number of locations across the NEM. The forums were primarily focused on small customers, with a large customer forum held in Adelaide. The forums took place in:
State City Date
Queensland Brisbane 25 July 2017
South Australia (large user) Adelaide 31 July 2017
South Australia Adelaide 31 July 2017
Victoria Melbourne 3 August 2017
Queensland Townsville 7 August 2017
NSW Sydney 14 August 2017
ACCC Commissioners and staff attended the forums. The ACCC heard a range of views from approximately 250 electricity customers and stakeholders.

357 Retail Electricity Pricing Inquiry—Final Report
Compulsory information gathering powersThe direction under s. 95H(1) of the CCA allows the ACCC to use compulsory information gathering powers to request information, documents and sworn oral evidence.
The ACCC has used its compulsory information gathering powers to obtain information and documents. Notices under s. 95ZK of the CCA were issued to electricity retailers and generators.
These notices required a variety of information be provided, including documents, information and data about:
�� organisational structures
�� electricity offer information
�� sales, revenue and customer numbers
�� consumption information
�� price and discounting information
�� marketing and product strategies.
The ACCC issued over 110 s. 95ZK notices to 45 businesses.
Over the course of the Inquiry, the ACCC received over 48 000 documents in response to its notices from notice recipients. The ACCC examined the information, documents and data received, which needed extensive review and analysis. Notice recipients claimed confidentiality over nearly all of the material submitted.
Public sources of informationIn addition, the ACCC has made significant use of data and information from public sources. The public reporting of various prices and information through the supply chain is valuable for market transparency. Information relied upon by the ACCC has included reporting by the AER, AEMC and other local and international regulators; reporting and information produced by AEMO; and reporting by consumer groups.
Preliminary ReportThe Preliminary Report for the Inquiry was provided to the Treasurer on 22 September 2017, and the ACCC sought stakeholder feedback to the Preliminary Report and its findings. Submissions to the Preliminary Report were due by 17 November 2017.
The Inquiry received over 40 submissions in response to the Preliminary Report. All public submissions to the Preliminary Report are listed at appendix 4.
The ACCC considered the wide range of views provided by all stakeholders and took these into account when preparing the Final Report.
Meetings with stakeholders taken during the drafting of the Preliminary Report and Final ReportThe ACCC has held many meetings with stakeholders during the Inquiry and prior to the release of the Preliminary Report. These stakeholders include:
�� electricity retailers of all sizes
�� electricity generators
�� electricity network businesses
�� energy organisations and regulators
�� consumer advocates, such as Energy Consumers Australia, Public Interest Advocacy Centre, Consumer Action Law Centre, Uniting Communities, Brotherhood of St Laurence, Consumer Policy Research Centre, Australian Council for Social Services, Victorian Council for Social Services, Queensland Council for Social Services
�� business groups, such as Business SA, Queensland Electricity Users Network, Tasmania Small Business Council, Canegrowers, Australian Industrial Energy, Master Grocers, South East Melbourne Manufacturers Alliance, Australian Food and Grocery Council
�� small business commissioners and the Queensland small business champion.

358 Retail Electricity Pricing Inquiry—Final Report
Appendix 3: Relevant consumer protection work by other agencies
Commitments made to the Prime MinisterIn August 2017, the Prime Minister, the Australian Treasurer and the Australian Minister for the Environment and Energy met with the CEOs of eight electricity retailers.964 During these meetings, the electricity retailers gave a series of commitments to improve customers’ experiences with the retail electricity market (the Prime Minister commitments). These commitments included:
�� writing to customers on standing offers and those on market offers who have reached the end of their benefit period but not moved to another offer, outlining the availability of alternate offers and how much they can save on a better deal965
�� regularly reporting to the AER on the number of customers on market offers where the discount period has expired966
�� supporting an expedited rule change requiring a clear disclosure at the end of the benefit period.967 The AEMC made this rule on 7 November 2017 and it took effect from 1 February 2018.968 The rule requires the AER to produce a guideline on what benefit changes would require notification and the content of the notice, and retailers must comply with this guideline by 1 October 2018.969 The AER published this guideline on 18 June 2018970
�� producing clear, user friendly factsheets to better explain offer terms and conditions, and working with the government and the AER on other tools such as a comparison rate and marketing in dollar terms rather than in discounts.971 On 23 April 2018, the AER released revised Retail Pricing Information Guidelines, which implement this commitment972
�� where possible, making monthly billing the default option for market offer customers.973
Recent rule changes and rule change requestsSince the Inquiry commenced, a number of rule change requests have been submitted to the AEMC. The current status of these rule change requests is set out below.
Benefit change noticeAs part of the commitments to the Prime Minister, the eight energy retailers agreed to contact customers on market offers with expired benefit periods and support a rule change requiring all energy retailers to notify a customer when a benefit is ending or changing.
On 22 August 2017, the Australian Minister for the Environment and Energy, the Hon. Josh Frydenberg MP, submitted a rule change request to the AEMC that would require retailers to notify small customers when fixed term benefits (for example, price discounts) were about to end or change.974
964 The eight retailers are AGL, Alinta, EnergyAustralia, Origin, Momentum Energy, Simply Energy, Red Energy and Lumo Energy.965 Prime Minister of Australia, Minister for the Environment and Energy, Turnbull government secures better power deal for Australian
families, Media Release, 30 August 2017.966 AER, Annual Report on Compliance and Performance of the retail energy market 2016–17, November 2017, p.1.967 The Hon. Josh Frydenberg MP, Minister for the Environment and Energy, Rule change to put customers first, Media Release,
7 November 2017.968 AEMC, Notification of end of fixed benefit period, Media Release, 7 November 2017.969 AEMC, Notification of end of fixed benefit period, Media Release, 7 November 2017.970 AER, Benefit Change Notice Guidelines, June 2018.971 The Hon. Josh Frydenberg MP, Making energy bills more affordable, Media Release, 18 December 2017; The Hon. Josh Frydenberg
MP, Minister for the Environment and Energy, Turnbull Government secures better power deal for Australian Families, Media Release, 30 August 2017.
972 AER, Retail Pricing Information Guidelines version 5.0, April 2018.973 Prime Minister of Australia, Minister for the Environment and Energy, Turnbull Government secures better power deal for Australian
families, Media Release, 30 August 2017.974 AEMC, Rule determination: National Energy Retail Amendment (Notification of the end of a fixed benefit period) Rule 2017,
7 November 2017, p. 1.

359 Retail Electricity Pricing Inquiry—Final Report
After consideration of the Minister’s request, on 7 November 2017 the AEMC made the final rule, which requires retailers to contact customers between 20 and 40 business days before the expiry or change of a benefit.975 This notification must be given in the manner and form specified in guidelines prepared by the AER, and include certain information including a reference to Energy Made Easy. These rules require the AER to publish guidelines setting out how the benefit change notice must be presented and the information that must be included in the notice.976
As noted below, ESC Victoria has made a corresponding change to the Victorian Code to require retailers to contact customers prior to the end of a benefit period. ESC Victoria has stated that it will consider the merits of requiring retailers to provide more detailed information, in light of the Victorian Government’s response to the Victorian Review.977
On 18 June 2018 the AER published the benefit change guidelines. The guidelines state that the requirement to send a benefit change notice applies to both financial benefits (such as a price discount) and non-financial benefits (such as a magazine subscription). The guidelines require retailers to set out benefit change notices in a particular way, using language that is clear, simple and widely understood. The guidelines require a benefit change notice to include:
�� a headline statement that the customer is about to lose their benefit
�� the amount that the customer will pay if they do not switch to an alternative offer
�� information required to enable a customers to search for offers on the AER’s Energy Made Easy website, including the tariff type, whether the customer has a controlled load and historical consumption data
�� instructions for customers to use the information to compare offers on the Energy Made Easy website.
This rule is an extension of the existing rule relating to end of contract notifications. Retailers are also required to notify customers on a fixed term market retail contract, between 20 and 40 days before their contract ends.978 This notice must include:
�� the date on which the contract will end
�� details of the prices, terms and conditions applicable to the sale of energy to the premises concerned under the deemed customer retail arrangement
�� the customer’s options for establishing a new contract (including the availability of a standing offer).979
Preventing discounts on inflated energy ratesOn 18 December 2017, the Australian Minister for the Environment and Energy submitted a rule change request to the AEMC that would restrict retailers from advertising offers with discounts where any of the underlying tariffs for the offer are higher than the retailer’s standing offer for that tariff type.
On 15 May 2018, the AEMC made a rule restricting retailers from including discounts in market contracts where:
�� there is an equivalent standing offer
�� at least one undiscounted energy rate in the market retail contract exceeds the equivalent component in the retailer’s standing offer
�� no undiscounted energy rate in the market retail contract is lower than the equivalent component in the retailer’s standing offer
�� the level or rate of every payment to be made by the retailer to the customer under the market retail contract (if any) is equal to or lower than the level or rate of the equivalent energy payment under the retailer’s standing offer.
975 AEMC, Rule determination: National Energy Retail Amendment (Notification of the end of a fixed benefit period) Rule 2017, 7 November 2017, p. i; AEMC, National Energy Retail Amendment (Notification of end of fixed benefit period) Rule 2017 No.2, New r. 48A.
976 AEMC, National Energy Retail Amendment (Notification of end of fixed benefit period) Rule 2017 No.2, New rr. 48A, 48B.977 Essential Services Commission Victoria, Fixed benefit periods—notification obligations for energy retailers—final decision,
21 December 2017, p. iv.978 NERR, r. 48; Victorian Code, cl. 48.979 NERR, r. 48; Victorian Code, cl. 48.

360 Retail Electricity Pricing Inquiry—Final Report
The new rule commences on 1 July 2018.980
Advanced notice of price changesOn 1 March 2018, the Australian Minister for the Environment and Energy and the NSW Minister for Utilities and Resources, the Hon. Don Harwin MLC, submitted a rule change request to the AEMC that would require retailers to provide customers with 10 business days’ notice of increases to market offer energy prices.981 The current rules require electricity retailers in all NECF jurisdictions, aside from Queensland, to inform customers of price changes no later than the next bill after the change takes effect.982
On 26 April 2018, the AEMC published a consultation paper for the rule change request. This consultation paper sought feedback from stakeholders on the proposed rule change, including whether the price change notification should require retailers to include information for the customer to source a new competitive offer.983 Submissions closed on 24 May 2018.
Strengthening protections for customers in hardshipOn 21 March 2018, the AER submitted a rule change request to the AEMC to require the AER to develop a binding guideline on hardship policies as a single point of reference for industry on how the hardship obligations should be applied, and provide customers with a clear understanding of their rights and entitlements.984 The AER submitted this rule change request following its 2017 Hardship Policy Review. The AER’s Hardship Policy Review found a wide variation in practices across retailers and a disconnect between retailers’ policies and practical assistance offered to customers.985 Consultation on this rule change request closed on 28 June 2018.
Metering installation timeframesOn 5 March 2018, the Australian Minister for the Environment and Energy submitted a rule change request to the AEMC to require electricity retailers to provide customers with new meters on the date agreed with the customer, or otherwise within six business days.986
On 31 May 2018, the AEMC published a consultation paper on the rule change request.987 This consultation paper seeks feedback on the proposed rule change, including the costs and benefits of imposing timeframes on the installation of new and replacement meters and when the timeframe should commence, the costs and benefits of the proposed options to streamline the meter installation process, and the options to improve the planned interruption notification process. Submissions close on 12 July 2018.
The NSW Minister for Energy and Utilities has also submitted a request to IPART to review NSW electricity retailers’ metering practices and report its findings with the review of the performance and competition of retail electricity and gas markets. The Minister asked IPART to complete this review as a result of customer complaints and delays in meter installations.988 Submissions closed on 29 June 2018, with a draft report due in September 2018. The final report is due to the Minister by 30 November 2018.989
980 AEMC, Rule determination: National Energy Retail Amendment (Preventing discounts on inflated energy rates) Rule 2018, 15 May 2018, p. 12.
981 AEMC, Consultation Paper: National Energy Retail Amendment (Advance notice of price changes) Rule 2018, 26 April 2018, pp. 1, 7.982 NERR, r. 46; AEMC, Consultation Paper: National Energy Retail Amendment (Advance notice of price changes) Rule 2018, 26 April
2018, pp. 4–5.983 AEMC, Consultation Paper: National Energy Retail Amendment (Advance notice of price changes) Rule 2018, 26 April 2018,
pp. 13–17.984 AER, Request for rule change—strengthening protections in the National Energy Retail Rules for customers in financial hardship,
21 March 2018.985 AER, Strengthening protections for customers in financial hardship, Media Release, 27 March 2018.986 The Hon. Josh Frydenberg MP, Minister for the Environment and Energy, Metering installation timeframes—request to change the
National Electricity Rules and the National Energy Retail Rules, 1 March 2018.987 AEMC, Consultation Paper: National Electricity Amendment (Metering Installation Timeframes) Rule 2018; National Energy Retail
Amendment (Metering Installation Timeframes), 31 May 2018.988 IPART, IPART review of electricity retailers’ metering practices in NSW, 29 May 2018.989 IPART, Retailers’ meter installation practices in NSW, viewed 15 June 2018, https://www.ipart.nsw.gov.au/Home/Industries/
Energy/Reviews/Electricity/Retailers%e2%80%99-meter-installation-practices-in-NSW?qDh=0.

361 Retail Electricity Pricing Inquiry—Final Report
On 1 May 2018, the Australian Energy Council submitted a rule change proposal to the AEMC to change when a metering coordinator would take responsibility for a metering installation.990 The AEMC is yet to initiate the rule change process and it is expected a consultation paper will be released on 26 July.991
Estimated meter readsOn 3 April 2018, the Australian Minister for the Environment and Energy submitted a rule change request to the AEMC to require retailers to:
�� ensure that an estimated bill is not based on a meter estimate that is grossly inaccurate
�� advise customers that they may obtain an adjusted estimated bill by providing the retailer with a self-read of the meter that the retailer considers to be accurate
�� provide customers with an adjusted estimated bill based on the customer’s self-read of the meter.992
On 17 May 2018, the AEMC published a consultation paper seeking stakeholder feedback on the proposed rule change request.993 We note that a number of other agencies have recently completed or are undertaking work that is designed to improve consumers’ ability to engage with the retail electricity market.
Long-term standing offer noticeOn 14 June 2018, the Australian Minister for the Environment and Energy submitted a rule change request to the AEMC. If made, the rule would require retailers to:
�� contact customers who have been on a standing offer for more than 12 months; and
�� notify them that they can visit the Energy Made Easy website to compare the alternative offers available to them.994
The proposed rule change intends to address the fact that standing offer customers are less likely to engage with the market and are more likely to be paying more for electricity by making them aware they may be able to access a better offer.995 The AEMC is yet to initiate this rule change process.
Amendments to the Victorian CodeSince the Inquiry commenced, ESC Victoria has considered a number of changes to the Victorian Code:
�� fixed benefit periods. From 1 February 2018, retailers were required to notify their customers about changes to the benefits (such as price discounts) they receive as part of their energy contracts996
�� minimum disconnection amount. This amendment takes effect from 1 July 2018, and introduces a new minimum customer disconnection amount of $300 (including GST), bringing it in line with the minimum disconnection amount set by the AER997
�� entitlements to minimum standards of assistance for customers anticipating or facing payment difficulty and who are at risk of falling into debt and being disconnected. This amendment takes effect from 1 January 2019.998
990 Energy Council Australia, Rule Change Proposal, 1 May 2018, p. 4.991 AEMC, Meter installation—creation of incoming roles, viewed 15 June 2018, https://www.aemc.gov.au/rule-changes/meter-
installation-creation-incoming-roles.992 AEMC, Consultation Paper: National Electricity Amendment (Estimated Meter Reads) Rule 2018, 17 May 2018, p. 8.993 AEMC, Consultation Paper: National Electricity Amendment (Estimated Meter Reads) Rule 2018, 17 May 2018.994 The Hon. Josh Frydenberg MP, Minister for the Environment and Energy, Helping households find better energy deals, Media
Release, 14 June 2018.995 The Hon. Josh Frydenberg MP, Minister for the Environment and Energy, Australian Government Rule Change Proposal to the
Australian Energy Market Commission: Long-term standing offer notice rule change proposal, 14 June 2018, p. 4.996 Essential Services Commission Victoria, Energy Retail Code amendment (fixed benefit period) Final Decision, 21 December 2017,
p. v.997 Essential Services Commission Victoria, Energy Retail Code review 2016 (customers facing payment difficulties), viewed
14 June 2018, https://www.esc.vic.gov.au/electricity-and-gas/electricity-and-gas-codes-guidelines-policies-and-manuals/energy-retail-code/energy-retail-code-review-2016-customers-facing-payment-difficulties. AER, Review of the Minimum Disconnection Amount, Final Decision, March 2017, p. 4.
998 Essential Services Commission Victoria, Energy Retail Code amendment (customers facing payment difficulties), viewed 14 June 2018, https://www.esc.vic.gov.au/electricity-and-gas/electricity-and-gas-codes-guidelines-policies-and-manuals/energy-retail-code/energy-retail-code-review-2016-customers-facing-payment-difficulties.

362 Retail Electricity Pricing Inquiry—Final Report
Victorian Government’s interim response to the Independent Review into the Electricity and Gas Retail Markets in VictoriaOn 11 March 2018, the Victorian Government released its response to the Victorian Review. The Victorian Government accepted nine of the Victorian Review’s recommendations and said that it would undertake further analysis on the remaining two recommendations (introducing a no-frills basic service offer and abolishing standing offers).
In its interim response, the Victorian Government undertook to immediately take the following steps concerning key recommendations:
�� further analysis of the application and scope of the basic service offer and abolishing standing offers, or appropriate alternatives, and their effect on Victoria’s energy sector
�� consultation with stakeholders concerning implementing the remaining recommendations
�� requiring ESC Victoria to review its codes and implement recommendations aimed at improving energy retailer marketing and billing practices, including marketing offers in a standardised format
�� requiring ESC Victoria to monitor and report on the competitiveness of the energy retail market and to develop a methodology for a ‘reference basic service offer price’
�� requesting ESC Victoria to review its codes, including the Victorian Code, to ensure a focus on customer outcome.999
The Victorian Government also secured commitments from major energy retailers to provide additional rebates to customers on default or standing offers and announced funding for the Home Energy Brokerage Service and the Home Energy Assist program to help more than 3300 Victorian homes to become energy efficient.1000 As set out in section 15.6, the Victorian Government is also progressing a not-for-profit brokerage service to be rolled out from mid-2018.
The Victorian Government’s final response to the Victorian Review is expected in mid-2018.
AEMC review of embedded networks regulatory arrangementsAn embedded network is a site with multiple households or businesses where the electricity is provided through a single connection point and the site operator purchases all the electricity and then on-sells it to customers within the site. Embedded networks are generally shopping centres, apartment complexes, retirement villages and caravan parks. Electricity users in an embedded network are outside the traditional electricity market and can have reduced customer protections compared to those afforded to customers of authorised retailers.
The current regulatory framework for embedded networks is complex. Many embedded network operators are authorised retailers, which means they must comply with the NERL, NERR and corresponding provisions in the Victorian Code in the same way as traditional electricity retailers. However, some embedded network operators may be exempted from holding a retailer authorisation by the AER or ESC Victoria. Embedded network operators with an exemption must follow strict conditions and meet a range of obligations to their customers, but generally the regulatory requirements are lower than those for authorised retailers. The exemptions framework was designed to regulate incidental sales of energy where the more onerous requirements of the authorisations framework were not appropriate. However, this means that at present, customers in such embedded networks may not benefit from all of the protections in the NERR and NERL.
999 Department of Environment, Land, Water and Planning (Victoria), Victorian Government Interim Response to Bipartisan Independent Review of the Electricity and Gas Retail Markets in Victoria, March 2018, p. 2.
1000 Department of Environment, Land, Water and Planning (Victoria), Victorian Government Interim Response to Bipartisan Independent Review of the Electricity and Gas Retail Markets in Victoria, March 2018, p. 1.

363 Retail Electricity Pricing Inquiry—Final Report
On 28 November 2017, the AEMC released its final report on its review of regulatory arrangements for embedded networks in the NERL and NERR.1001 The purpose of the review was to identify and assess any issues for embedded networks under the NERL and NERR (including barriers to customers accessing offers from competing retailers) and identify appropriate solutions.1002
The review focused on the regulatory approach for small customers (residential customers and low consumption business customers). The review did not consider the regulatory approach for high-consumption businesses located in embedded networks.
The AEMC’s report found that the current regulatory arrangements for embedded networks are no longer fit for purpose. In particular:
�� some customers are unable to access competitive prices or important consumer protections
�� customers in embedded networks often pay close to the maximum allowable price as there are limited incentives for embedded network operators to pass on savings to small customers
�� there are significant practical barriers to customers accessing retail market competition and therefore customers have a limited ability to switch
�� there is limited monitoring and enforcement in regards to embedded network operators’ compliance with their obligations.1003
The AEMC recommended changes to the current regulatory framework for both legacy networks and new embedded networks to provide embedded network customers with appropriate levels of access to retail competition, noting that customers in embedded networks will need to make an initial investment to install a new grid-connected meter in order to obtain electricity from an alternative retailer.1004 The AEMC also recommended that the COAG Energy Council, state governments and the AER implement changes as soon as possible to improve consumer protections relating to:
�� information disclosure regarding the cost, benefit and risks of embedded networks at the time of the purchase or lease of a property
�� access to energy ombudsman schemes
�� monitoring and enforcement to the extent possible.1005
Other relevant workIn March 2018, the AER released revised versions of the Retail Exempt Selling Guidelines and Network Service Provider Registration Exemption Guideline. These guidelines apply to sellers and exempt network operators that have been exempt from holding a retailer authorisation or network registration respectively.
The guidelines now facilitate access to energy ombudsman schemes for residential customers of exempt sellers, and place obligations on exempt sellers and exempt network operators to put in place complaints and dispute handling processes. The AER also made a number of amendments to better align consumer protections for customers in exempt networks to the protections that apply to customers of authorised retailers, including an obligation to supply, and requirements around reconnection and payment plans.1006
The Victorian Government has reviewed its General Exemption Order, which allows certain embedded network operators to sell electricity without obtaining a retailer licence.1007 Following its review, the Victorian Government updated the General Exemption Order to ensure customers in embedded networks have the same protections as customers in other networks. This includes the requirement for embedded network operators to become members of an approved dispute resolution service by 1 July 2018.
1001 AEMC, Final Report: Review of regulatory arrangements for embedded networks, 28 November 2017.1002 AEMC, Review of embedded networks regulatory arrangements, Media Release, 27 January 2017; AEMC, Final Report: Review of
regulatory arrangements for embedded networks, 28 November 2017, p. 1.1003 AEMC, Final Report: Review of regulatory arrangements for embedded networks, 28 November 2017, p. iv.1004 AEMC, Final Report: Review of regulatory arrangements for embedded networks, 28 November 2017, p. i and 79.1005 AEMC, Final Report: Review of regulatory arrangements for embedded networks, 28 November 2017, pp. v and vi.1006 AER, Notice of Final Instrument: AER (Retail) Exempt Selling Guideline—Version 5, March 2018, pp. 3, 5.1007 Department of Environment, Land, Water and Planning (Victoria), Review of the Victorian Electricity Licence Exemptions
Framework–Final Position Paper, 2017, p. 2.

364 Retail Electricity Pricing Inquiry—Final Report
Appendix 4: Public submissions to the Preliminary ReportAGL
AGL supplementary submission
Alinta Energy
ATCO Australia
Australian Council of Social Service
Australian Energy Council
Business SA
CEG on behalf of Origin Energy
Chamber of Commerce and Industry Queensland
CitiPower, Powercor & United Energy
Consumer Action Law Centre
Don Willis
Dr Ken Taylor
Dr Martin Gill
Energy & Water Ombudsman NSW
Energy & Water Ombudsman SA
EnergyAustralia
Energy Consumers Australia
Energy Networks Australia
Enova Community Energy Ltd
ERM Power
Finncorn Consulting
Frontier Economics on behalf of AGL
IFM Investors and AustralianSuper
Jeff Jamieson (for MM Technology)
Jim McMillan
Leigh Murray
Limestone Association of Australia
Major Energy Users
Mark Delaney
Martin Vizjak
Momentum Energy
NSW Business Chamber
NSW Farmers
NSW Small Business Commissioner
Office of the Mayor—City of Townsville
365 Retail Electricity Pricing Inquiry—Final Report
Origin Energy
Peter Fraser
Public Interest Advocacy Centre
Queensland Consumers Association
RBB Economics
SA Power Networks
Spark Infrastructure
Simply Energy
South Australian Chamber of Mines & Energy
Tasmanian Small Business Council
Sumo Power
TransGrid
Victorian Council of Social Service
Victorian Electricity Network Businesses
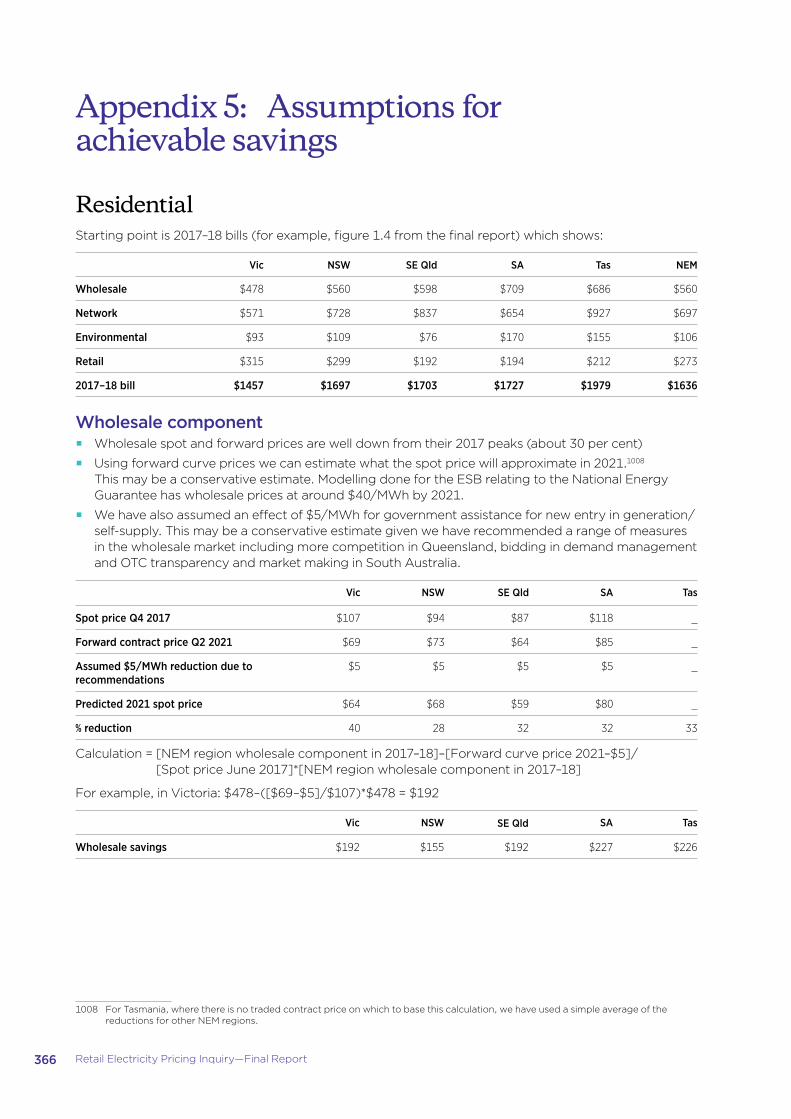
366 Retail Electricity Pricing Inquiry—Final Report
Appendix 5: Assumptions for achievable savings
ResidentialStarting point is 2017–18 bills (for example, figure 1.4 from the final report) which shows:
Vic NSW SE Qld SA Tas NEM
Wholesale $478 $560 $598 $709 $686 $560
Network $571 $728 $837 $654 $927 $697
Environmental $93 $109 $76 $170 $155 $106
Retail $315 $299 $192 $194 $212 $273
2017–18 bill $1457 $1697 $1703 $1727 $1979 $1636
Wholesale component�� Wholesale spot and forward prices are well down from their 2017 peaks (about 30 per cent)
�� Using forward curve prices we can estimate what the spot price will approximate in 2021.1008 This may be a conservative estimate. Modelling done for the ESB relating to the National Energy Guarantee has wholesale prices at around $40/MWh by 2021.
�� We have also assumed an effect of $5/MWh for government assistance for new entry in generation/self-supply. This may be a conservative estimate given we have recommended a range of measures in the wholesale market including more competition in Queensland, bidding in demand management and OTC transparency and market making in South Australia.
Vic NSW SE Qld SA Tas
Spot price Q4 2017 $107 $94 $87 $118 _
Forward contract price Q2 2021 $69 $73 $64 $85 _
Assumed $5/MWh reduction due to recommendations
$5 $5 $5 $5 _
Predicted 2021 spot price $64 $68 $59 $80 _
% reduction 40 28 32 32 33
Calculation = [NEM region wholesale component in 2017–18]–[Forward curve price 2021–$5]/[Spot price June 2017]*[NEM region wholesale component in 2017–18]
For example, in Victoria: $478–([$69–$5]/$107)*$478 = $192
Vic NSW SE Qld SA Tas
Wholesale savings $192 $155 $192 $227 $226
1008 For Tasmania, where there is no traded contract price on which to base this calculation, we have used a simple average of the reductions for other NEM regions.

367 Retail Electricity Pricing Inquiry—Final Report
Network component�� The AER has made or is consulting on determinations for most networks covering some of the
period up to 2023. We can use these to estimate network prices over that period. These changes are estimated as follows:
Vic NSW SE Qld SA Tas
Network tariff saving $22 $10 $37 $12 $7 increase
�� For those regions where we are recommending a RAB write-down, we can reduce bills by an amount associated with that measure. This is calculated using the lower RAB amount in the AER’s modelling tools, delivering savings as follows:
NSW SE Qld Tas
RAB write-down $164 $110 $120
�� In Victoria we can reduce bills by the amount of the easement tax ($136m) which equates to $17 per customer.
Environmental component�� The main saving here is bringing premium solar FiT schemes onto state budgets.
�� Queensland has already done this at a cost of $770 million over three years.
�� In NSW the equivalent measure is ceasing to recover costs for the climate change fund.
�� We have also used the SRES amount from the cost stacks to estimate a reduction from abolishing that policy.
Vic NSW SE Qld SA Tas
Premium FiTs on-budget 19 25
$0 if current policy
maintained 72 45
Removing SRES 15 18 17 17 30
Total environmental savings 34 43 17 89 75
Retail component�� We are recommending harmonisation of regulatory regimes between Victoria and other states
which we estimate costs each customer in the NEM $4 per year.
�� The ‘default offer’ (which is to replace the standing offer) will be set at a significantly lower level. Our working assumption for these calculations is an offer that is halfway between current standing offer levels and current market offer levels. This assumption is likely to be conservative as we believe the default offer will be closer to market offer levels. In reality, this saving will be large for standing offer customers but zero for market offer customers but is represented as being averaged across all consumers in the calculations.
�� We use AEMC estimates of the difference between standing and market offers. So the saving of moving to the default offer is these amounts divided by two (to get halfway between standing and market offers). Then we multiply the savings per customer by the number of customers on standing offers to get a ‘total saved’ amount. This is then divided by the number of residential customers in the relevant region to get an average saving per customer.

368 Retail Electricity Pricing Inquiry—Final Report
Vic NSW SA SE Qld
Diff between standing and market offers (AEMC) 330 210 280 212
Saving for each customer moved onto default 165 105 140 106
Standing offer customers 172 000 644 609 92 887 299 477
Total saved 28 380 000 67 683 945 13 004 180 31 744 562
Average per customer (whole market) 11 22 17 24
�� For market offer customers, our recommendations are targeted at improving competition, improving transparency and making it easier for customers to find a better deal.
�� We have assumed it is achievable to get 20 per cent of customers on market offers with discounts between zero and 10 per cent to move to market offers with discounts of at least 30 per cent. This may be conservative given the range of measures we are recommending.
�� Using data collected during the Inquiry (shown in figures 1.8, 1.11, 1.14 and 1.17) we have calculated the impact of this switching on retailer revenue (holding prices constant across the market).
�� The change in revenue divided by the number of customers gives an estimate of annual average savings.
For example, in NSW:
Assuming:
�� 3.1 million customers
�� 6000 kWh average usage
�� $1697 average annual bill.
Discount level
None Up to 5% 5 to 10% 10 to 15% 15 to 20% 20 to 25% 25 to 30% Over 30%
Average effective price1009 29.7 29.2 28.3 26.4 26.3 25.2 23.0 23.3
Proportion of customers1010 4.0 8.0 11.0 17.0 31.0 12.0 2.0 0.7
Proportion of customers after switching(assumed) 3.2 6.4 8.8 17.0 31.0 12.0 2.0 5.3
Current implied retailer revenue($ m)1011 220 432 576 830 1507 559 85 30
Implied retailer revenue post-switching ($ m) 176 346 460 830 1507 559 85 228
Change in revenue –44 –86 –115 – – – – 198
The total change in revenue in NSW is a fall of $47 million. Dividing this by 3.1 million customers gives an average saving of $15 per customer.
1009 ACCC analysis based on data provided from retailers—see figures 1.8, 1.11, 1.14 and 1.17.1010 ACCC analysis based on data provided from retailers—see figures 1.8, 1.11, 1.14 and 1.17.1011 This calculation is [proportion of customers] x [3 100 000] x [6000] x [average effective price].

369 Retail Electricity Pricing Inquiry—Final Report
SME customersThe approach to calculating savings for SME customers is the same as for residential customers with the following exceptions:
�� Due to the large range of annual usage by the SME customer cohort, a c/kWh saving has been calculated instead of a $ per customer basis.
�� The reductions in each cost stack component are based on the proportions from the SME cost stack.
�� A larger achievable saving is attributable to the retail component of the cost stack due to a higher proportion of SME customers being on standing offers. Whereas the reduction in retail costs from this for residential customers is about 12 per cent on average (across the NEM), for SME customers it is assumed to be 20 per cent.
C&I customersThe approach to calculating savings for C&I customers is the same as for residential customers with the following exceptions:
�� Due to the large range of annual usage by the C&I customer cohort, a c/kWh saving has been calculated instead of a $ per customer basis.
�� The reductions in each cost stack component are based on the proportions from the C&I cost stack.
�� An assumed zero saving is attributable to the retail component of the cost stack due to the much smaller contribution of that cost component to C&I customer costs.