Impact of Supervisory Gas Pressure on Dry Pipe Sprinkler System ...
24
Impact of Supervisory Gas Pressure on Dry Pipe Sprinkler System Water Delivery Time Steve Wolin Director, Development and Compliance 1
-
Upload
phungnguyet -
Category
Documents
-
view
219 -
download
0
Transcript of Impact of Supervisory Gas Pressure on Dry Pipe Sprinkler System ...

Impact of Supervisory Gas Pressure on
Dry Pipe Sprinkler System Water Delivery Time
Steve Wolin
Director, Development and Compliance
1

Why Does Water Delivery Time Matter?
Delays application of water to fire
Allows fire to grow larger after activation
Limits system size
© 2015 Reliable Automatic Sprinkler Co., Inc. 2
Time
Ignition
Activation
Water Delivery

NFPA 13 Water Delivery Time Requirements
Systems protecting dwelling units: 15 s
Other systems: 60 s
Exceptions:
Systems up to 500 gal.: No Requirement
Systems up to 750 gal. with quick-opening device: No Requirement
OH,EH, and High Piled with multiple sprinklers open: 40- 50 s
Shorter times required by specific design criteria
Water delivery time may be evaluated with a Listed calculation program or a test.
© 2015 Reliable Automatic Sprinkler Co., Inc. 3

Factors Influencing Water Delivery Time
NFPA 13
System volume
Quick-opening device
All other factors are
evaluated based on
performance by tests or
calculations
Actual
System volume
Quick-opening device
System configuration
Supervisory pressure
Trip pressure
Water supply
Sprinkler/test valve size
© 2015 Reliable Automatic Sprinkler Co., Inc. 4

Components of Water Delivery Time
Trip Time
Time between opening sprinkler/test valve
and dry pipe valve opening.
Transit Time
Time between dry pipe valve opening and
water reaching sprinkler/test valve.
© 2015 Reliable Automatic Sprinkler Co., Inc. 5

Differential Dry Pipe Valves (Conventional)
© 2015 Reliable Automatic Sprinkler Co., Inc. 6
Simple design
Approx. ratio of 5.5:1
Typically, 40 psi min. supervisory pressure at
175 psi water supply pressure
Compressor/nitrogen generator sized based
on anticipated leakage at supervisory
pressure

Low Pressure Dry Pipe Valve
© 2015 Reliable Automatic Sprinkler Co., Inc. 7
Smaller clapper reduces case size
Variable ratio
Typically, 18 psi min. supervisory pressure at
175 psi water supply pressure
Reduces compressor/nitrogen generator size
Less oxygen/moisture introduced into system
Lower pressure to resist initial flow of water

Prior Work
The Fire Protection Research Foundation
O’Connor, D.J., et al (Schirmer Engineering Corporation), “Supporting Data Needs for Automatic Sprinkler Committees Research Project: Review of NFPA 13 Dry System Water Delivery Provisions”, The Fire Protection Research Foundation, Quincy, MA, 2007.
© 2015 Reliable Automatic Sprinkler Co., Inc. 8

Schirmer/Foundation Prior Work
Reviewed prior water delivery time studies
Solicited water delivery time data
Provided information on computer programs
for calculating water delivery time
No direct comparison based on supervisory
gas pressure
© 2015 Reliable Automatic Sprinkler Co., Inc. 9

Prior Work
FM Global Heskestad, G., and Kung, H.C., “Transient Response of Dry-Pipe
Sprinkler Systems,” Technical Report, Serial No. 15918, Factory Mutual Research Corporation, Norwood, MA, 1971.
Nam, S., “Design of Dry Pipe Sprinkler Systems to Meet the Water Delivery Time Restriction in Industrial Freezers,” Fire Safety Science-Proceedings of the Ninth International Symposium, IAFSS, 2008, pp. 491-502.
Tyco Fire & Building Products Golinveaux , J.G., “A Technical Analysis: The Variables That Affect
The Performance of Dry Pipe Systems,” Tyco Fire and Building Products, Lansdale, PA, 2002.
© 2015 Reliable Automatic Sprinkler Co., Inc. 10

FM Global Prior Work
Provides equations to calculate trip time and transit time
Includes data for 40 sample systems
Suggests relationship between trip time and system volume
Identifies system configuration as primary factor influencing transit time
Other factors:
Static water pressure
Supervisory gas pressure
© 2015 Reliable Automatic Sprinkler Co., Inc. 11

© 2015 Reliable Automatic Sprinkler Co., Inc. 12
Conventional PressureTrip Time = 0.016 x System Volume
R² = 0.369Avg. ∆P = 16.2 psi
Low PressureTrip Time = 0.012 x System Volume
R² = 0.247Avg. ∆P = 5.5 psi
0
10
20
30
40
50
60
70
0 500 1,000 1,500 2,000 2,500
Tri
p T
ime
(se
co
nd
s)
System Volume (gallons)
FM Global Data - Trip Time
Conventional Pressure Low Pressure
Linear (Conventional Pressure) Linear (Low Pressure)
∆P = 40 psi
∆P = 3 psi
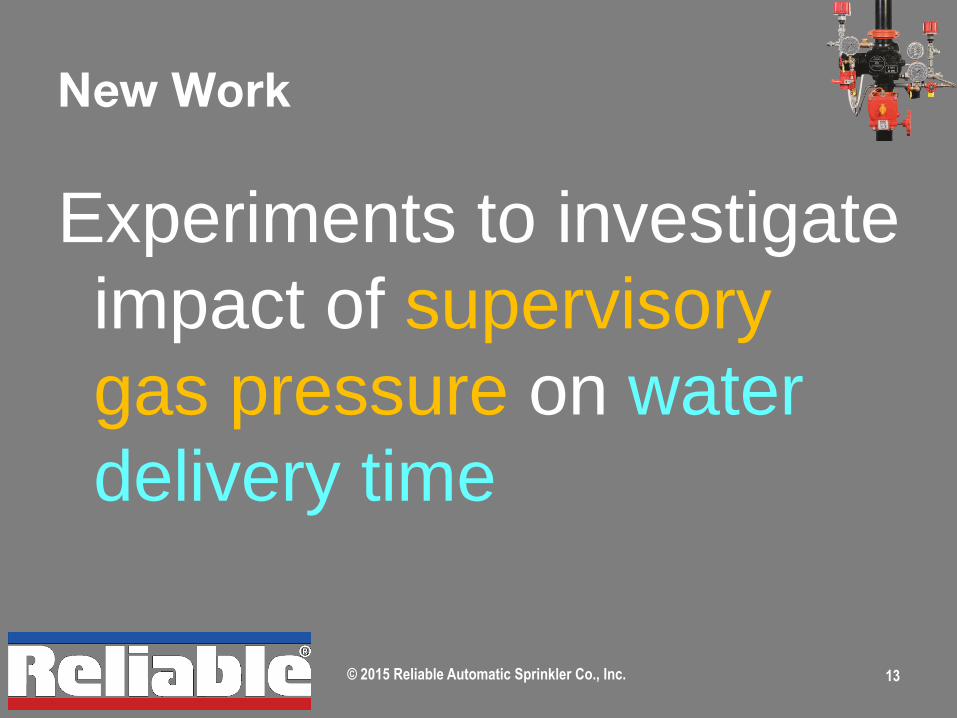
New Work
Experiments to investigate
impact of supervisory
gas pressure on water
delivery time
© 2015 Reliable Automatic Sprinkler Co., Inc. 13

Sample Systems
Conventional Pressure
Supervisory Press.: 40 psi
Trip Press.: 32 psi
Low Pressure
Supervisory Press.: 18 psi
Trip Press.: 12 psi
© 2015 Reliable Automatic Sprinkler Co., Inc. 14
Which system trips faster?
Which system delivers water faster?

Overall Test Setup
4” nom. Mains
2” nom. Risers
1-1/2” nom. Branch Lines
Piping sloped 1/2“ per 10’
Key
Sprinkler Fitting
Control Valve
Water Supply © 2015 Reliable Automatic Sprinkler Co., Inc. 15

Test Variables
Trip Time Pipe configuration
Short tree
Long tree
Loop
Sprinkler K-factor
8.0 gpm/psi1/2
16.8 gpm/psi1/2
Supervisory gas pressure/Trip pressure
18 psi/12 psi
40 psi/32 psi
Transit Time Pipe configuration
Short tree
Long tree
Loop
Sprinkler K-factor
8.0 gpm/psi1/2
16.8 gpm/psi1/2
Trip pressure
12 psi
32 psi
© 2015 Reliable Automatic Sprinkler Co., Inc. 16

Short Tree
Pipe Volume Total
(gallons)
Volume Direct Path
(gallons)
Distance (feet)
Mains 71.3 71.3 108.0
Risers 2.0 0.2 1.2
Branch Lines
16.4 3.2 30.0
Total 89.7 74.7 139.2
© 2015 Reliable Automatic Sprinkler Co., Inc. 17
Key
Sprinkler Location
Flow Direction
Water Supply

Long Tree
© 2015 Reliable Automatic Sprinkler Co., Inc. 18
Key
Sprinkler Location
Flow Direction
Water Supply
Pipe Volume Total
(gallons)
Volume Direct Path
(gallons)
Distance (feet)
Mains 196.7 195.7 296.5
Risers 2.2 0.2 1.2
Branch Lines
20.1 3.2 30.0
Total 219.0 199.1 327.7

Loop
Pipe Volume Total
(gallons)
Volume Direct Path
(gallons)
Distance (feet)
Mains 196.7 196.7 298.0
Risers 2.2 0.2 1.2
Branch Lines
20.1 3.2 30.0
Total 219.0 200.1 329.2
© 2015 Reliable Automatic Sprinkler Co., Inc. 19
Key
Sprinkler Location
Flow Direction
Water Supply
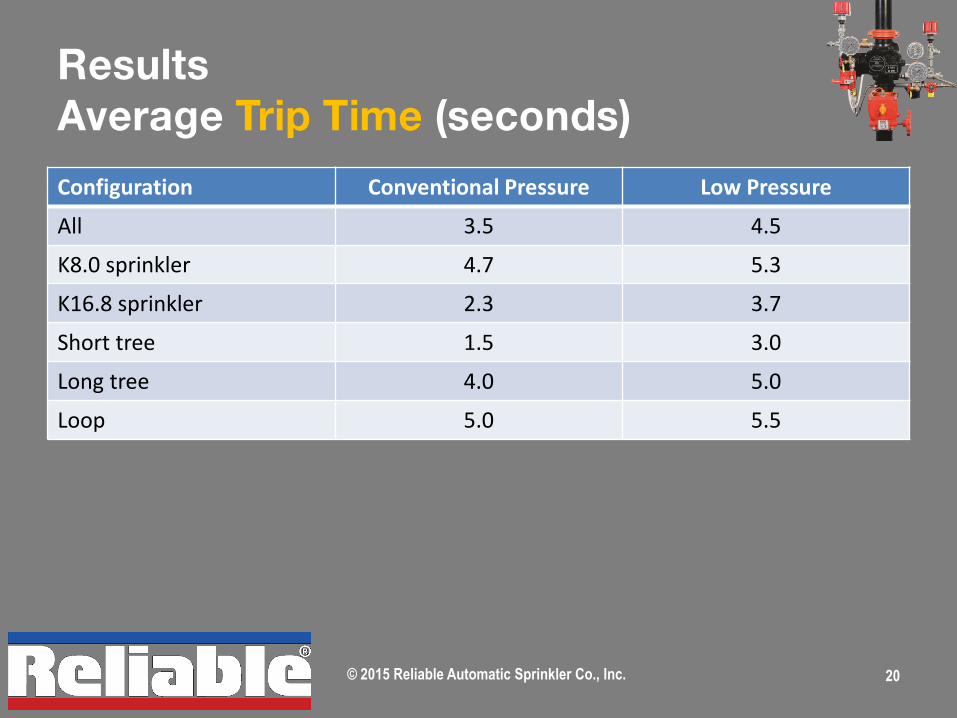
Results Average Trip Time (seconds)
Configuration Conventional Pressure Low Pressure
All 3.5 4.5
K8.0 sprinkler 4.7 5.3
K16.8 sprinkler 2.3 3.7
Short tree 1.5 3.0
Long tree 4.0 5.0
Loop 5.0 5.5
© 2015 Reliable Automatic Sprinkler Co., Inc. 20

Results Average Transit Time (seconds)
Configuration Conventional Pressure Low Pressure
All 30.2 25.8
K8.0 sprinkler 33.0 25.7
K16.8 sprinkler 27.3 26.0
Short tree 14.0 12.0
Long tree 41.5 35.0
Loop 35.0 30.5
© 2015 Reliable Automatic Sprinkler Co., Inc. 21

Results Average Water Delivery Time (seconds)
Configuration Conventional Pressure Low Pressure
All 33.7 30.3
K8.0 sprinkler 37.7 31.0
K16.8 sprinkler 29.6 29.7
Short tree 15.5 15.0
Long tree 45.5 40.0
Loop 40.0 36.0
© 2015 Reliable Automatic Sprinkler Co., Inc. 22

Conclusions Based on Test Setup
Water delivery time (CP: 33.7s vs LP: 30.3s)
Faster with Low Pressure
Dominated by Transit Time
Trip Time (CP: 3.5s vs LP: 4.5s)
Faster with Conventional Pressure
Transit Time (CP: 30.2s vs LP: 25.8s)
Faster with Low Pressure
© 2015 Reliable Automatic Sprinkler Co., Inc. 23

Conclusions Based on Test Setup
Sprinkler/Test Valve Orifice Size
Larger orifice reduces trip time
Larger orifice reduces transit time for
Conventional Pressure
Larger orifice does not impact transit time
for Low Pressure
© 2015 Reliable Automatic Sprinkler Co., Inc. 24