Impact of CT Errors on Protective Relays
32
- Impact of CT Errors on Protective Relays – Case Studies and Analysis Rich Hunt GE Multilin Presented at the Georgia Tech Fault & Disturbance Analysis Conference, Atlanta, GA, May 19-20, 2008
Transcript of Impact of CT Errors on Protective Relays
-
Impact of CT Errors on Protective Relays – Case Studies and Analysis
Rich Hunt GE Multilin
Presented at the Georgia Tech Fault & Disturbance Analysis Conference, Atlanta, GA, May 19-20, 2008

Impact of CT Errors on Protective Relays
Page 1 of 30
Impact of CT Errors on Protective Relays – Case Studies and Analysis Rich Hunt, Lubo Sevov, Ilia Voloh - GE Multilin
Current transformers (CTs) are the basic interconnection between the power system and almost all measurement devices such as protective relays. CTs step the primary current down to a nominal secondary level for use by protective relays, meters, and other monitoring devices. One of the practical concerns for the protection engineer is the actual ability of a CT to replicate the primary current.
CTs perform reasonably in most operating scenarios, faithfully reproducing primary current as a secondary current, with little distortion or error. C37.110, the IEEE Guide for the Application of Current Transformers Used for Protective Relaying Purposes[1] allows that a ANSI C-class CT connected to a standard burden should have no more than 10% error at 20 times rated voltage. In practice, modern C-class CTs have an error of 1% to 2%, and keep this high level of accuracy over their operating life. However, there are scenarios where CTs can be expected to not perform well, and can have a negative impact on the performance of the protection system. The protection engineer must consider these scenarios when designing the protection system, and relay suppliers must consider these scenarios when designing relays.
The following discussion describes how CT replication error impacts protective relay performance by presenting three actual examples of relay performance. These examples specifically describe the operation of a line differential relay at a dual-breaker line terminal line, the operation of a generator differential relay, and the operation of a low-impedance bus differential relay, based on oscillography data and event logs retrieved from protective relays. Each of these examples illustrates undesirable relay operations due to CT saturation. However, the root cause of the relay operation is response to CT saturation is different for each case. Therefore, the appropriate protection system design to prevent undesirable relay operations is different for each example.
Impact of CT Errors on Protective Relays
Page 2 of 30
1. CT Fundamentals To understand the performance of CTs during fault conditions, a review of
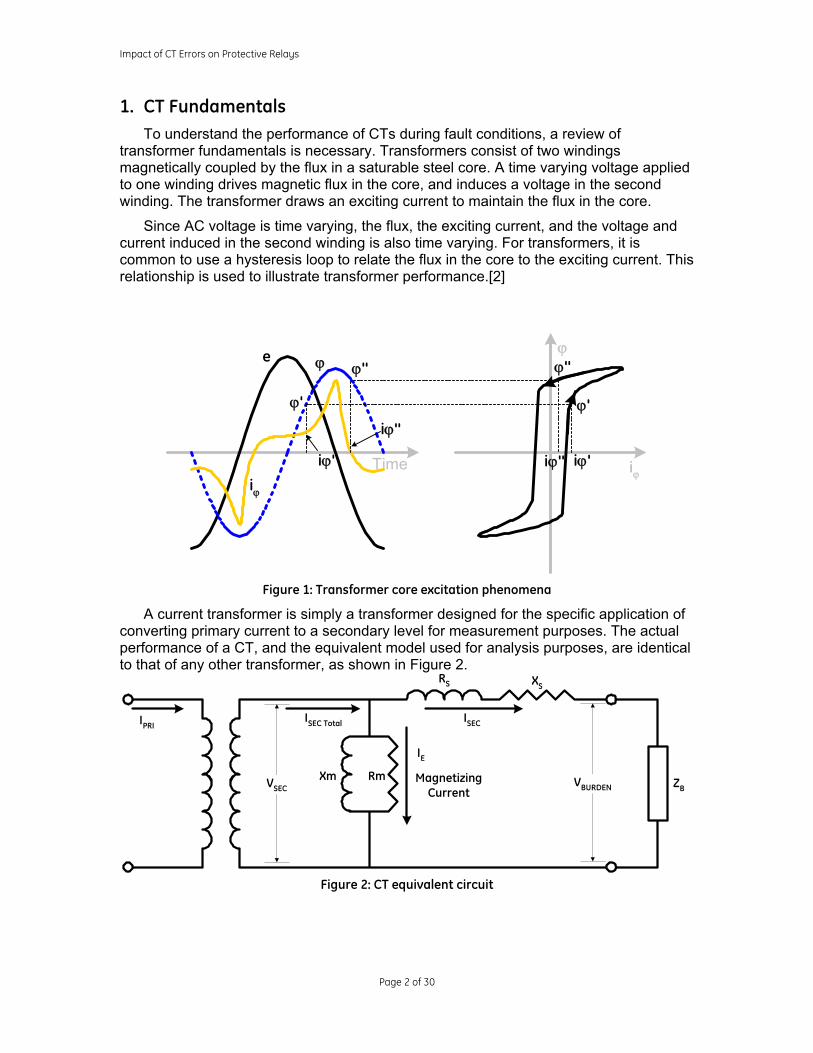
transformer fundamentals is necessary. Transformers consist of two windings magnetically coupled by the flux in a saturable steel core. A time varying voltage applied to one winding drives magnetic flux in the core, and induces a voltage in the second winding. The transformer draws an exciting current to maintain the flux in the core.
Since AC voltage is time varying, the flux, the exciting current, and the voltage and current induced in the second winding is also time varying. For transformers, it is common to use a hysteresis loop to relate the flux in the core to the exciting current. This relationship is used to illustrate transformer performance.[2]
Figure 1: Transformer core excitation phenomena
A current transformer is simply a transformer designed for the specific application of converting primary current to a secondary level for measurement purposes. The actual performance of a CT, and the equivalent model used for analysis purposes, are identical to that of any other transformer, as shown in Figure 2.
Figure 2: CT equivalent circuit
Time
e ϕ
iϕ
ϕ
iϕ
ϕ'
ϕ''
iϕ'
iϕ''ϕ'
ϕ''
iϕ'iϕ''
RmXm
ISECIPRI
MagnetizingCurrent
ZB
XSRS
IE
VSEC VBURDEN
ISEC Total
Impact of CT Errors on Protective Relays
Page 3 of 30
The concern for the relay engineer is the actual current at the secondary terminals of the CT. This current, ISEC, is the total secondary current as transformed by the CT, ISEC
Total, minus the current necessary to supply the magnetizing branch IE.
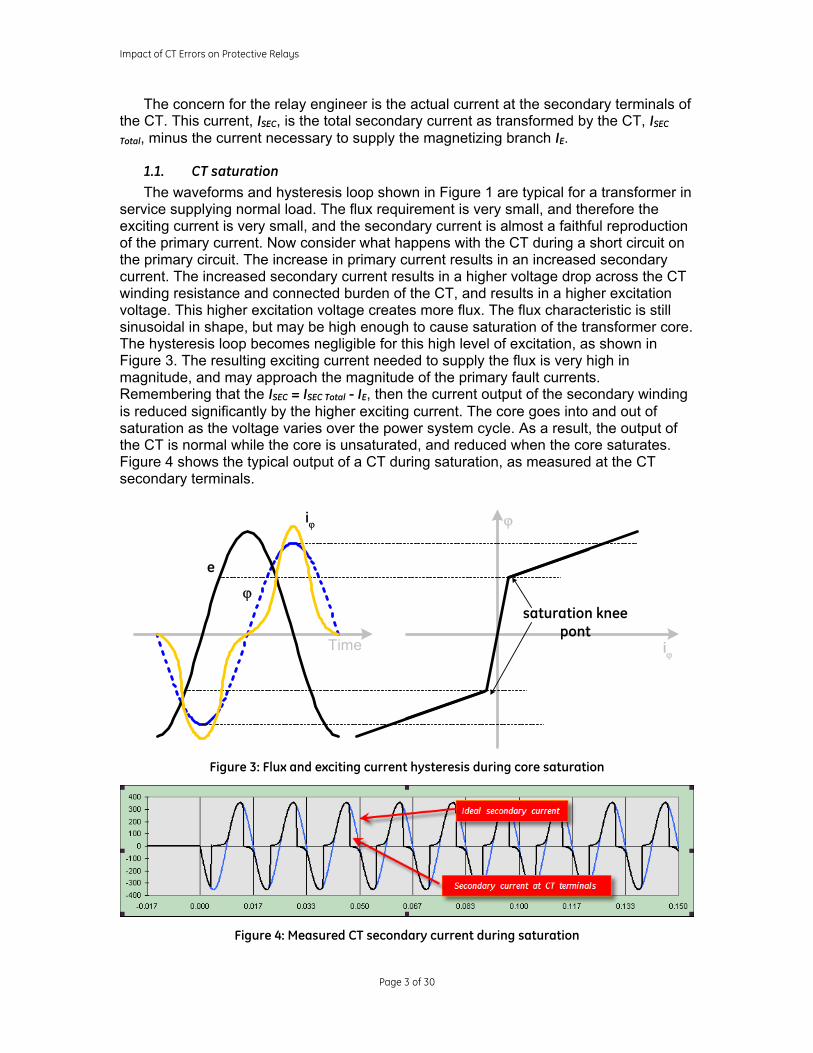
1.1. CT saturation The waveforms and hysteresis loop shown in Figure 1 are typical for a transformer in
service supplying normal load. The flux requirement is very small, and therefore the exciting current is very small, and the secondary current is almost a faithful reproduction of the primary current. Now consider what happens with the CT during a short circuit on the primary circuit. The increase in primary current results in an increased secondary current. The increased secondary current results in a higher voltage drop across the CT winding resistance and connected burden of the CT, and results in a higher excitation voltage. This higher excitation voltage creates more flux. The flux characteristic is still sinusoidal in shape, but may be high enough to cause saturation of the transformer core. The hysteresis loop becomes negligible for this high level of excitation, as shown in Figure 3. The resulting exciting current needed to supply the flux is very high in magnitude, and may approach the magnitude of the primary fault currents. Remembering that the ISEC = ISEC Total - IE, then the current output of the secondary winding is reduced significantly by the higher exciting current. The core goes into and out of saturation as the voltage varies over the power system cycle. As a result, the output of the CT is normal while the core is unsaturated, and reduced when the core saturates. Figure 4 shows the typical output of a CT during saturation, as measured at the CT secondary terminals.
Figure 3: Flux and exciting current hysteresis during core saturation
Figure 4: Measured CT secondary current during saturation
Time
e
ϕ
iϕ ϕ
iϕ
saturation kneepont
Impact of CT Errors on Protective Relays
Page 4 of 30
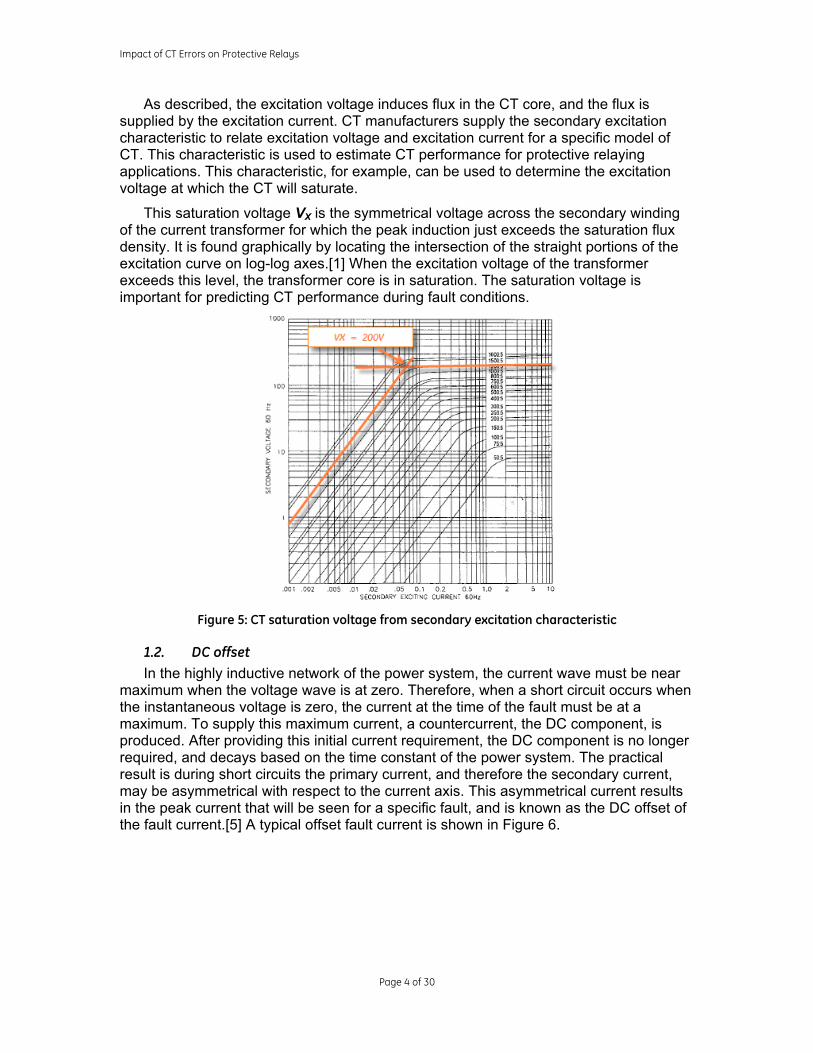
As described, the excitation voltage induces flux in the CT core, and the flux is supplied by the excitation current. CT manufacturers supply the secondary excitation characteristic to relate excitation voltage and excitation current for a specific model of CT. This characteristic is used to estimate CT performance for protective relaying applications. This characteristic, for example, can be used to determine the excitation voltage at which the CT will saturate.
This saturation voltage VX is the symmetrical voltage across the secondary winding of the current transformer for which the peak induction just exceeds the saturation flux density. It is found graphically by locating the intersection of the straight portions of the excitation curve on log-log axes.[1] When the excitation voltage of the transformer exceeds this level, the transformer core is in saturation. The saturation voltage is important for predicting CT performance during fault conditions.
Figure 5: CT saturation voltage from secondary excitation characteristic
1.2. DC offset In the highly inductive network of the power system, the current wave must be near
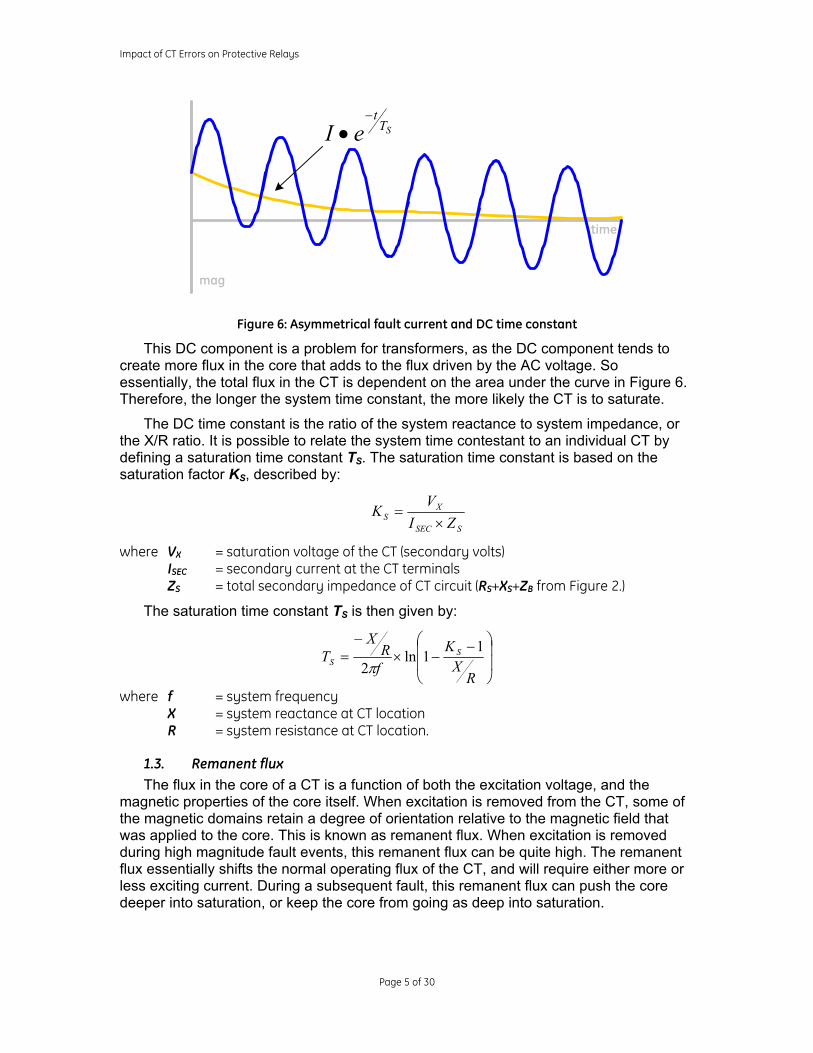
maximum when the voltage wave is at zero. Therefore, when a short circuit occurs when the instantaneous voltage is zero, the current at the time of the fault must be at a maximum. To supply this maximum current, a countercurrent, the DC component, is produced. After providing this initial current requirement, the DC component is no longer required, and decays based on the time constant of the power system. The practical result is during short circuits the primary current, and therefore the secondary current, may be asymmetrical with respect to the current axis. This asymmetrical current results in the peak current that will be seen for a specific fault, and is known as the DC offset of the fault current.[5] A typical offset fault current is shown in Figure 6.
Impact of CT Errors on Protective Relays
Page 5 of 30
Figure 6: Asymmetrical fault current and DC time constant
This DC component is a problem for transformers, as the DC component tends to create more flux in the core that adds to the flux driven by the AC voltage. So essentially, the total flux in the CT is dependent on the area under the curve in Figure 6. Therefore, the longer the system time constant, the more likely the CT is to saturate.
The DC time constant is the ratio of the system reactance to system impedance, or the X/R ratio. It is possible to relate the system time contestant to an individual CT by defining a saturation time constant TS. The saturation time constant is based on the saturation factor KS, described by:
SSEC
XS ZI
VK×
=
where VX = saturation voltage of the CT (secondary volts) ISEC = secondary current at the CT terminals ZS = total secondary impedance of CT circuit (RS+XS+ZB from Figure 2.)
The saturation time constant TS is then given by:
⎟⎟
⎠
⎞
⎜⎜
⎝
⎛ −−×
−=
RXK
fR
XT SS
11ln
2π
where f = system frequency X = system reactance at CT location R = system resistance at CT location.
1.3. Remanent flux The flux in the core of a CT is a function of both the excitation voltage, and the
magnetic properties of the core itself. When excitation is removed from the CT, some of the magnetic domains retain a degree of orientation relative to the magnetic field that was applied to the core. This is known as remanent flux. When excitation is removed during high magnitude fault events, this remanent flux can be quite high. The remanent flux essentially shifts the normal operating flux of the CT, and will require either more or less exciting current. During a subsequent fault, this remanent flux can push the core deeper into saturation, or keep the core from going as deep into saturation.
mag
time
STt
eI−
•
Impact of CT Errors on Protective Relays
Page 6 of 30
1.4. Some basic relations of CTs From the CT equivalent circuit of Figure 2, and the saturation factor and time to
saturation, it is simple to derive some basic relationships of the CT to X/R ratio, connected burden, and fault current. The voltage VSEC, which is the secondary excitation voltage, is determined from the voltage drops across the CT secondary circuit:
( )BSSECSEC ZRIV +×=
where RS = secondary winding resistance of the CT ZB = total burden (including wiring leads) connected to the CT secondary.
For ANSI C-Class CTs, the leakage reactance ZS is negligible, and may be ignored.
The flux in the core can approach 1+X/R during a fully offset fault.[1] Therefore, a second relation is that the CT will not saturate if R
XKS +>1 . Tying the saturation
factor KS to the saturation voltage VX provides that a CT will not saturate if the following relation is true:
( )RXZIV SSECX +××> 1
assuming a resistive burden.
Based on this last equation, it is simple to see that increasing fault currents, increasing connected burden, and increasing X/R ratio requires a higher saturation voltage to prevent CT saturation. In practice, it is rarely possible to completely prevent CT saturation from occurring for all fault events. The best methods to reduce the likelihood of CT saturation is to use a higher accuracy class CT (increasing the saturation voltage), a higher connected turns ratio (reducing the secondary current), and limiting the connected burden.
When choosing CTs for a specific application, there are two general methods for selecting the appropriate CT accuracy class and turns ratio with regards to possible saturation. One method simply looks at the maximum symmetrical fault current:
SSECX ZIV ××> 2
or if the CT saturation voltage is greater than twice the voltage drop due to the maximum symmetrical fault current, the CT is sized adequately. The other method uses the maximum asymmetrical fault current:
SSECR
Xt
X ZIeV ××+>− π2
1
If the saturation voltage is greater than the voltage drop for the maximum asymmetrical fault, the CT is sized adequately. However, these are just general recommendations. CTs sized based on either one of these methods will saturate for some fault events, depending on fault current magnitude, the amount of DC offset in the fault, and remanent flux in the CT. This paper examines actual events where CTs sized by these methods still had significant measurement errors.
2. Unequal CT saturation CTs identical in accuracy class, turns ratio, and connected burden will not perform
exactly the same during fault events, due to variations and differences in manufacturing
Impact of CT Errors on Protective Relays
Page 7 of 30
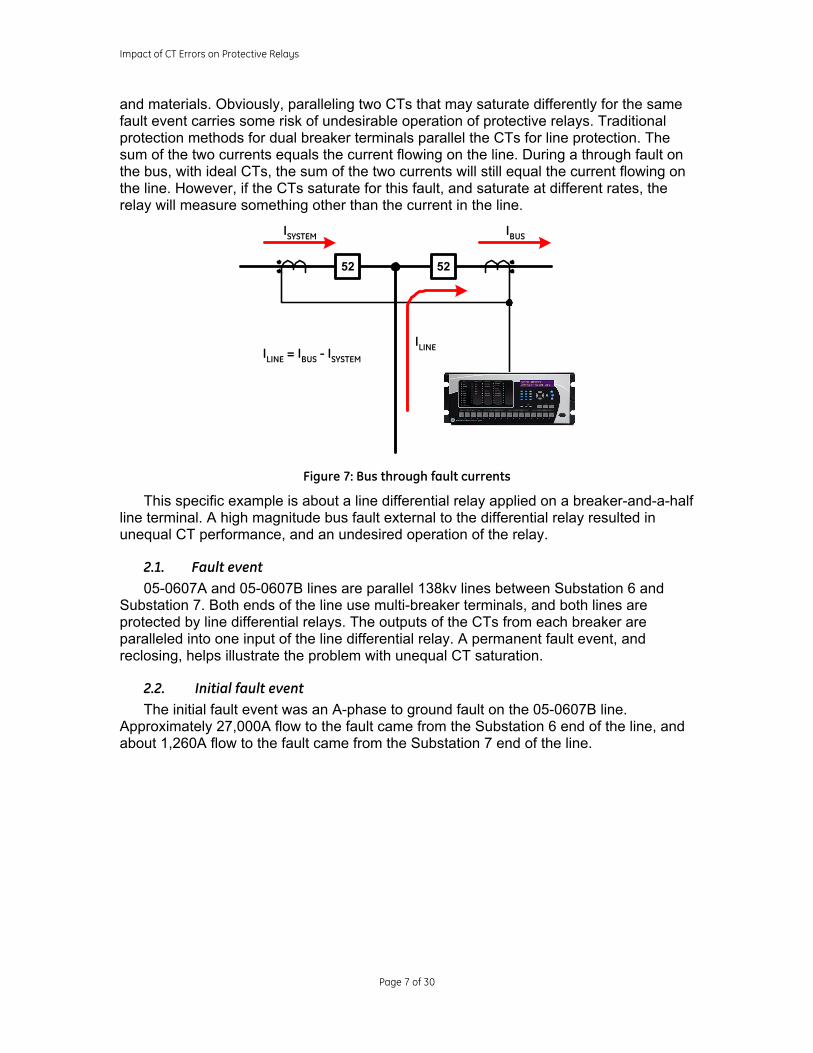
and materials. Obviously, paralleling two CTs that may saturate differently for the same fault event carries some risk of undesirable operation of protective relays. Traditional protection methods for dual breaker terminals parallel the CTs for line protection. The sum of the two currents equals the current flowing on the line. During a through fault on the bus, with ideal CTs, the sum of the two currents will still equal the current flowing on the line. However, if the CTs saturate for this fault, and saturate at different rates, the relay will measure something other than the current in the line.
Figure 7: Bus through fault currents
This specific example is about a line differential relay applied on a breaker-and-a-half line terminal. A high magnitude bus fault external to the differential relay resulted in unequal CT performance, and an undesired operation of the relay.
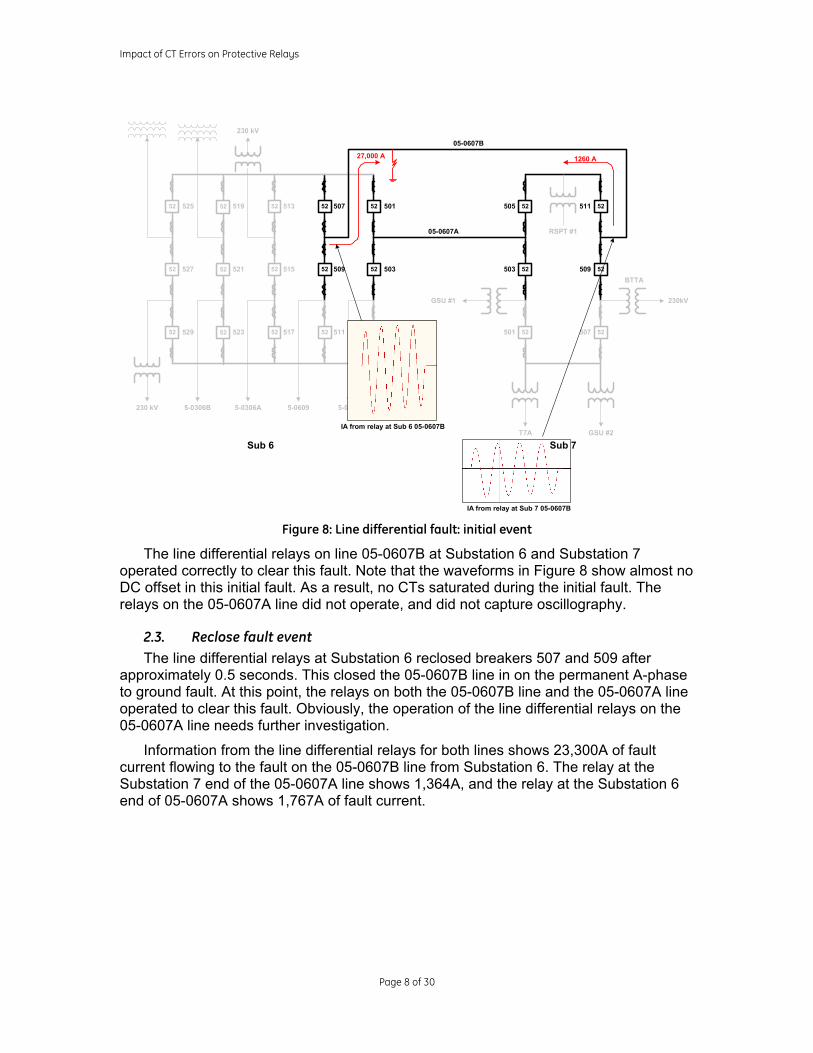
2.1. Fault event 05-0607A and 05-0607B lines are parallel 138kv lines between Substation 6 and
Substation 7. Both ends of the line use multi-breaker terminals, and both lines are protected by line differential relays. The outputs of the CTs from each breaker are paralleled into one input of the line differential relay. A permanent fault event, and reclosing, helps illustrate the problem with unequal CT saturation.
2.2. Initial fault event The initial fault event was an A-phase to ground fault on the 05-0607B line.
Approximately 27,000A flow to the fault came from the Substation 6 end of the line, and about 1,260A flow to the fault came from the Substation 7 end of the line.
5252
IBUSISYSTEM
ILINEILINE = IBUS - ISYSTEM
Impact of CT Errors on Protective Relays
Page 8 of 30
Figure 8: Line differential fault: initial event
The line differential relays on line 05-0607B at Substation 6 and Substation 7 operated correctly to clear this fault. Note that the waveforms in Figure 8 show almost no DC offset in this initial fault. As a result, no CTs saturated during the initial fault. The relays on the 05-0607A line did not operate, and did not capture oscillography.
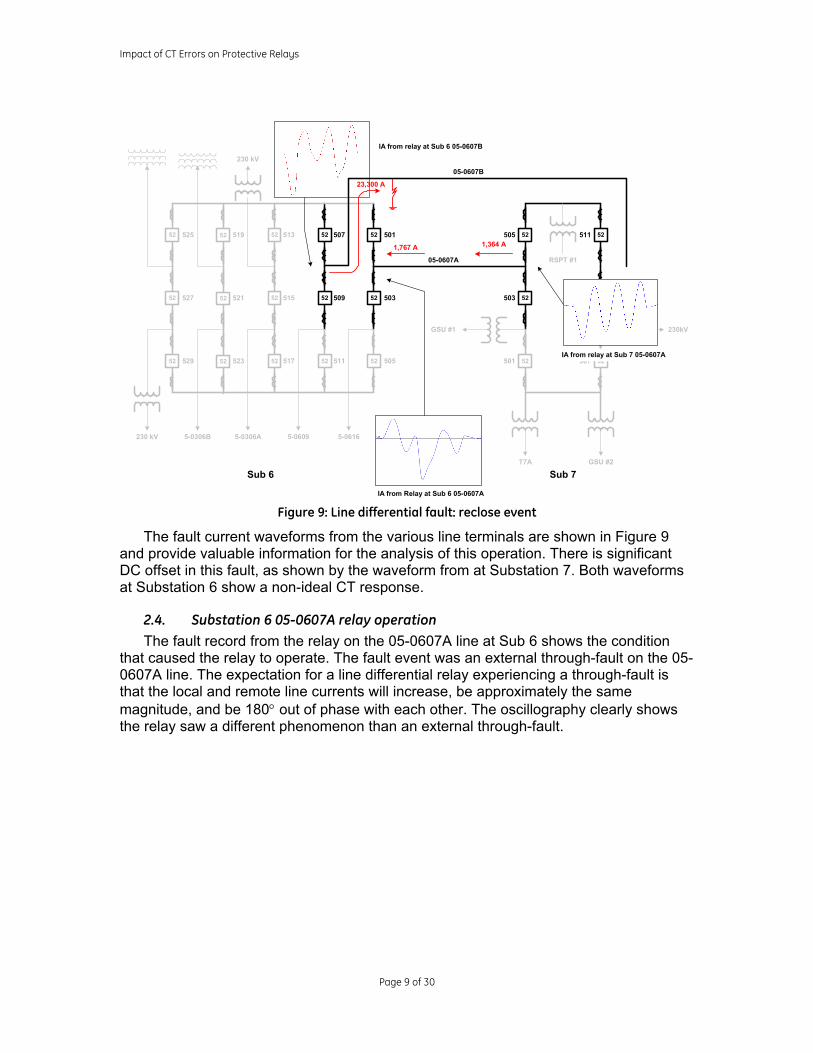
2.3. Reclose fault event The line differential relays at Substation 6 reclosed breakers 507 and 509 after
approximately 0.5 seconds. This closed the 05-0607B line in on the permanent A-phase to ground fault. At this point, the relays on both the 05-0607B line and the 05-0607A line operated to clear this fault. Obviously, the operation of the line differential relays on the 05-0607A line needs further investigation.
Information from the line differential relays for both lines shows 23,300A of fault current flowing to the fault on the 05-0607B line from Substation 6. The relay at the Substation 7 end of the 05-0607A line shows 1,364A, and the relay at the Substation 6 end of 05-0607A shows 1,767A of fault current.
52
52
52
52
52
52
52
52
52
52
52
52
52
52
52
501
503
505
507
509
511
513
515
517
519
521
523
525
527
529
5-06165-06095-0306A5-0306B230 kV
230 kV
52
52
52
52
52
52
511
509
507
505
503
501
05-0607A
05-0607B
RSPT #1
GSU #1
GSU #2T7A
230kV
BTTA
Sub 6 Sub 7
1260 A27,000 A
IA from relay at Sub 6 05-0607B
IA from relay at Sub 7 05-0607B
Impact of CT Errors on Protective Relays
Page 9 of 30
Figure 9: Line differential fault: reclose event
The fault current waveforms from the various line terminals are shown in Figure 9 and provide valuable information for the analysis of this operation. There is significant DC offset in this fault, as shown by the waveform from at Substation 7. Both waveforms at Substation 6 show a non-ideal CT response.
2.4. Substation 6 05-0607A relay operation The fault record from the relay on the 05-0607A line at Sub 6 shows the condition
that caused the relay to operate. The fault event was an external through-fault on the 05-0607A line. The expectation for a line differential relay experiencing a through-fault is that the local and remote line currents will increase, be approximately the same magnitude, and be 180° out of phase with each other. The oscillography clearly shows the relay saw a different phenomenon than an external through-fault.
52
52
52
52
52
52
52
52
52
52
52
52
52
52
52
501
503
505
507
509
511
513
515
517
519
521
523
525
527
529
5-06165-06095-0306A5-0306B230 kV
230 kV
52
52
52
52
52
52
511
509
507
505
503
501
05-0607A
05-0607B
RSPT #1
GSU #1
GSU #2T7A
230kV
BTTA
Sub 6 Sub 7
23,300 A
1,364 A1,767 A
IA from Relay at Sub 6 05-0607A
IA from relay at Sub 6 05-0607B
IA from relay at Sub 7 05-0607A
Impact of CT Errors on Protective Relays
Page 10 of 30
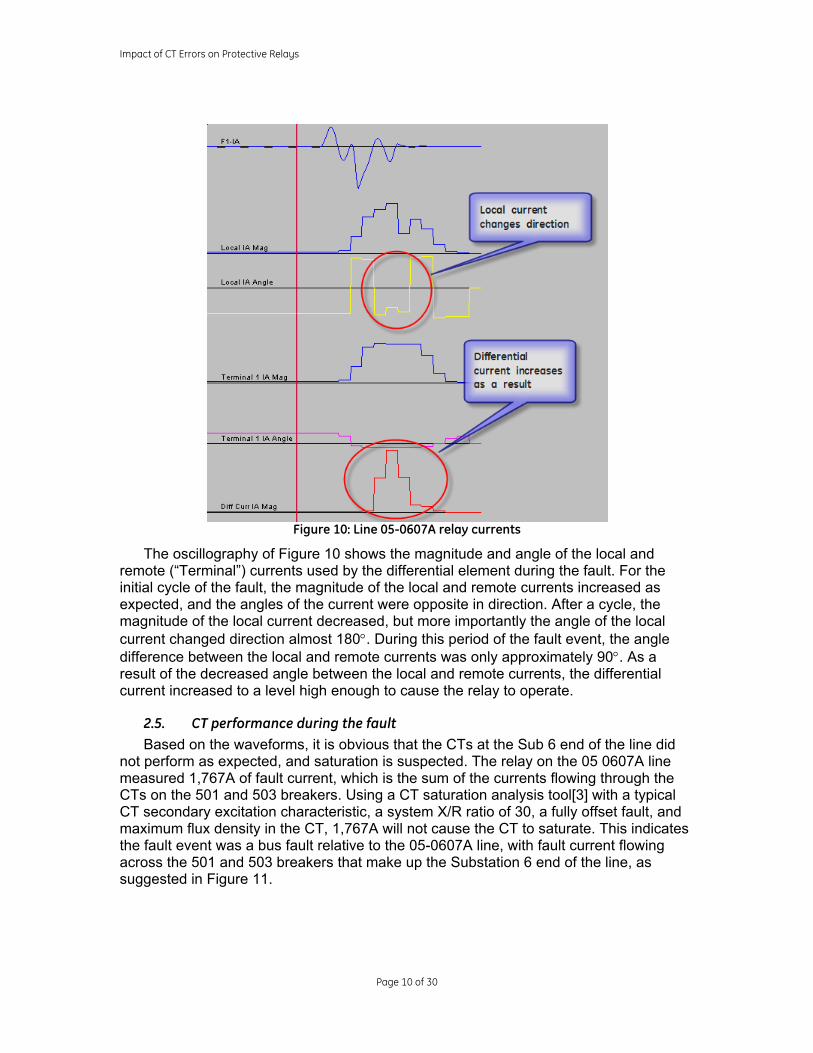
Figure 10: Line 05-0607A relay currents
The oscillography of Figure 10 shows the magnitude and angle of the local and remote (“Terminal”) currents used by the differential element during the fault. For the initial cycle of the fault, the magnitude of the local and remote currents increased as expected, and the angles of the current were opposite in direction. After a cycle, the magnitude of the local current decreased, but more importantly the angle of the local current changed direction almost 180°. During this period of the fault event, the angle difference between the local and remote currents was only approximately 90°. As a result of the decreased angle between the local and remote currents, the differential current increased to a level high enough to cause the relay to operate.
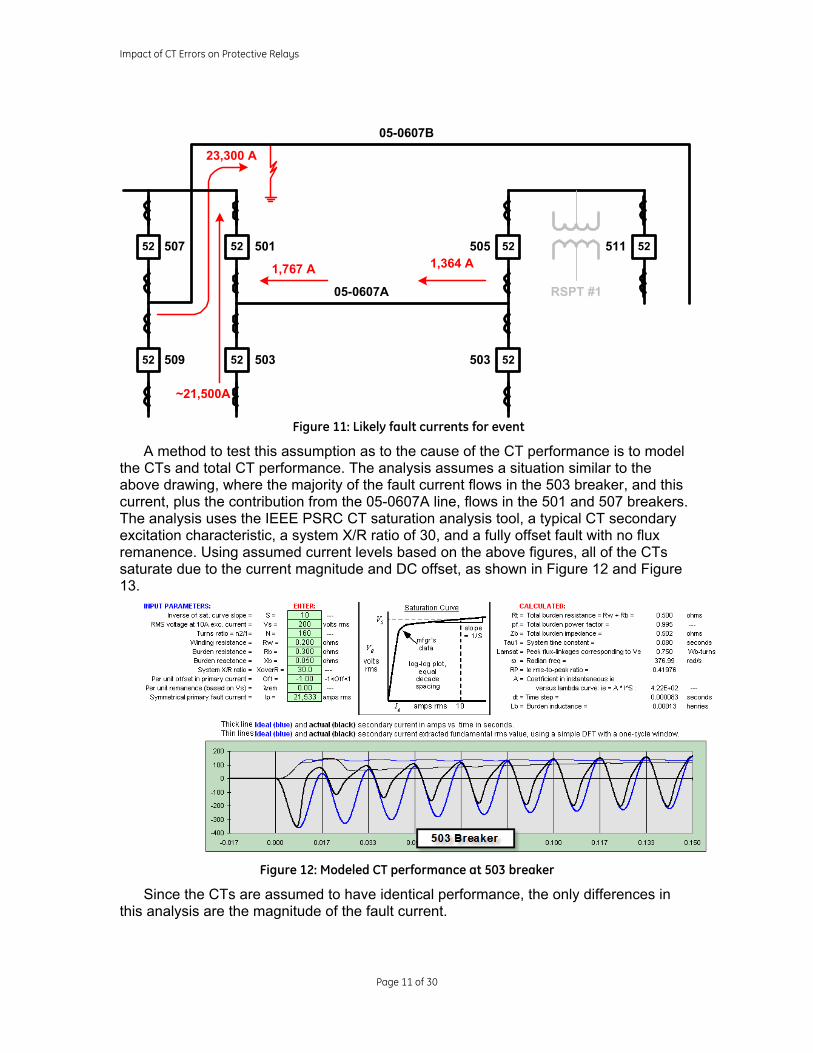
2.5. CT performance during the fault Based on the waveforms, it is obvious that the CTs at the Sub 6 end of the line did
not perform as expected, and saturation is suspected. The relay on the 05 0607A line measured 1,767A of fault current, which is the sum of the currents flowing through the CTs on the 501 and 503 breakers. Using a CT saturation analysis tool[3] with a typical CT secondary excitation characteristic, a system X/R ratio of 30, a fully offset fault, and maximum flux density in the CT, 1,767A will not cause the CT to saturate. This indicates the fault event was a bus fault relative to the 05-0607A line, with fault current flowing across the 501 and 503 breakers that make up the Substation 6 end of the line, as suggested in Figure 11.
Impact of CT Errors on Protective Relays
Page 11 of 30
Figure 11: Likely fault currents for event
A method to test this assumption as to the cause of the CT performance is to model the CTs and total CT performance. The analysis assumes a situation similar to the above drawing, where the majority of the fault current flows in the 503 breaker, and this current, plus the contribution from the 05-0607A line, flows in the 501 and 507 breakers. The analysis uses the IEEE PSRC CT saturation analysis tool, a typical CT secondary excitation characteristic, a system X/R ratio of 30, and a fully offset fault with no flux remanence. Using assumed current levels based on the above figures, all of the CTs saturate due to the current magnitude and DC offset, as shown in Figure 12 and Figure 13.
Figure 12: Modeled CT performance at 503 breaker
Since the CTs are assumed to have identical performance, the only differences in this analysis are the magnitude of the fault current.
52
52
52
52
501
503
507
509
52
52
52511505
503
05-0607A
05-0607B
RSPT #1
23,300 A
1,364 A1,767 A
~21,500A
Impact of CT Errors on Protective Relays
Page 12 of 30
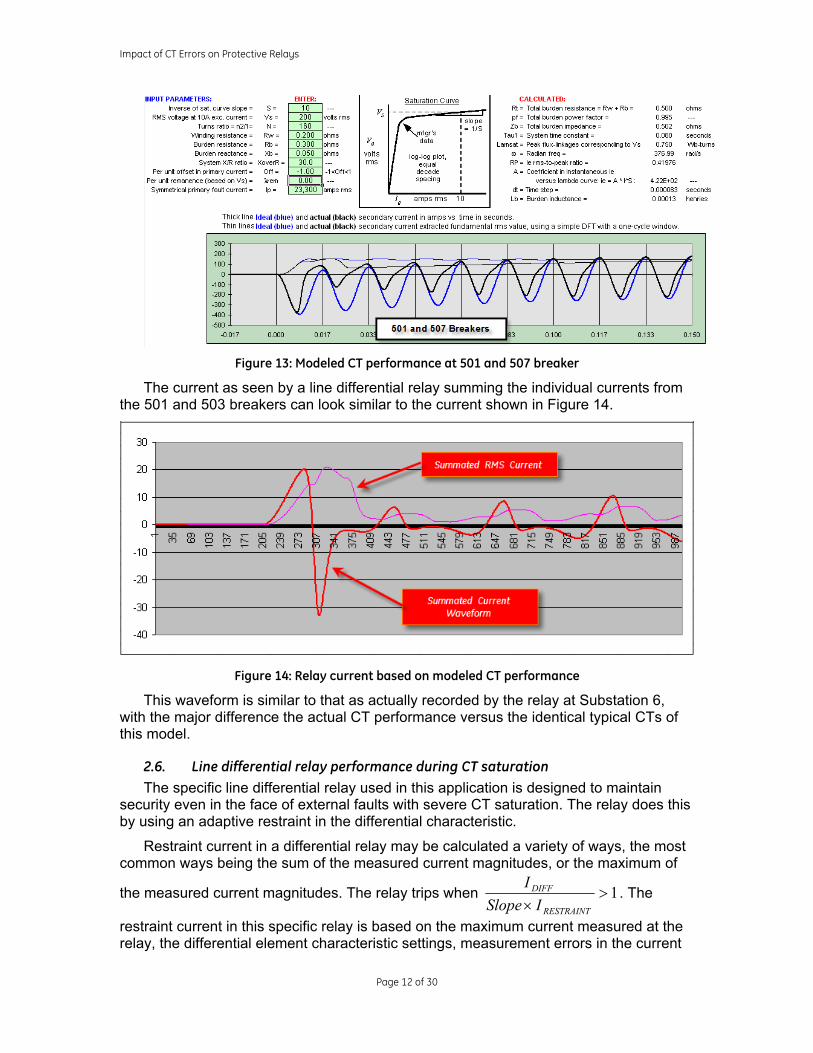
Figure 13: Modeled CT performance at 501 and 507 breaker
The current as seen by a line differential relay summing the individual currents from the 501 and 503 breakers can look similar to the current shown in Figure 14.
Figure 14: Relay current based on modeled CT performance
This waveform is similar to that as actually recorded by the relay at Substation 6, with the major difference the actual CT performance versus the identical typical CTs of this model.
2.6. Line differential relay performance during CT saturation The specific line differential relay used in this application is designed to maintain
security even in the face of external faults with severe CT saturation. The relay does this by using an adaptive restraint in the differential characteristic.
Restraint current in a differential relay may be calculated a variety of ways, the most common ways being the sum of the measured current magnitudes, or the maximum of
the measured current magnitudes. The relay trips when 1>× RESTRAINT
DIFF
ISlopeI
. The
restraint current in this specific relay is based on the maximum current measured at the relay, the differential element characteristic settings, measurement errors in the current
Impact of CT Errors on Protective Relays
Page 13 of 30
signal, and the likelihood of CT saturation. The differential element operates whenever the differential current is greater than the restraint current, so the adaptive restraint current attempts to maximize restraint as measurement uncertainty increases, such as during high magnitude fault events. However, the restraint is based on the measured input current to the relay, which is the sum of the two parallel circuits. At the time of operation, the differential current in this relay was 2,194 amps. The relay was not configured to record restraint current, but the restraint current can be estimated to be from 1536 amps (0.70 slope x 2,194 amps current) to approximately 2,000 amps with
significant measurement error. Since 1000,2194,2
>=RESTRAINT
DIFF
II
, the relay operated.
2.7. Options to prevent future operations Obviously, line differential relays should not operate for external faults, even when
CT saturation is present. The challenge for this application is the fault current seen by the CTs is significantly larger than the fault current seen by the relay algorithm, and can result in undesirable operation of the differential element. The overall goal of any changes to the protection scheme must be to increase the amount of restraint current or to reduce the amount of differential current presented to the relay. There are three options worth exploring: upgrading the CTs, changing the relay settings, and reviewing the relay application.
Upgrading the CTs is a matter of using a higher accuracy class CT, and a higher connected turns ratio, to improve CT performance during high magnitude faults. In this case, the CTs are already C800 CTs, with a 800:5 turns ratio. Using a higher turns ration will lessen the likelihood of CT saturation, but the CT will still saturate for 23,300 amps of fault current with 1200:5 CTs.
Changing the relay settings to desensitize the relay may prevent mis-operations, with the tradeoff of possibly missing internal faults with significant fault resistance. However, the relay in this application was already set at the maximum slope setting, so no change is possible.
Reviewing the relay application may be the best choice in this specific application. Line differential relaying was originally selected for the application, as the protected lines are short underground cables. The unequal saturation of CTs was not adequately considered during the selection process. Clearly, line differential relaying with paralleled CTs is not adequate. There are two options to consider: pilot protection relaying using directional overcurrent relays, and multiple input line differential relaying.
Directional overcurrent relays may not be reliable in this application. The unequal CT performance of paralleled CTs could impact the directional measurement of the relay.
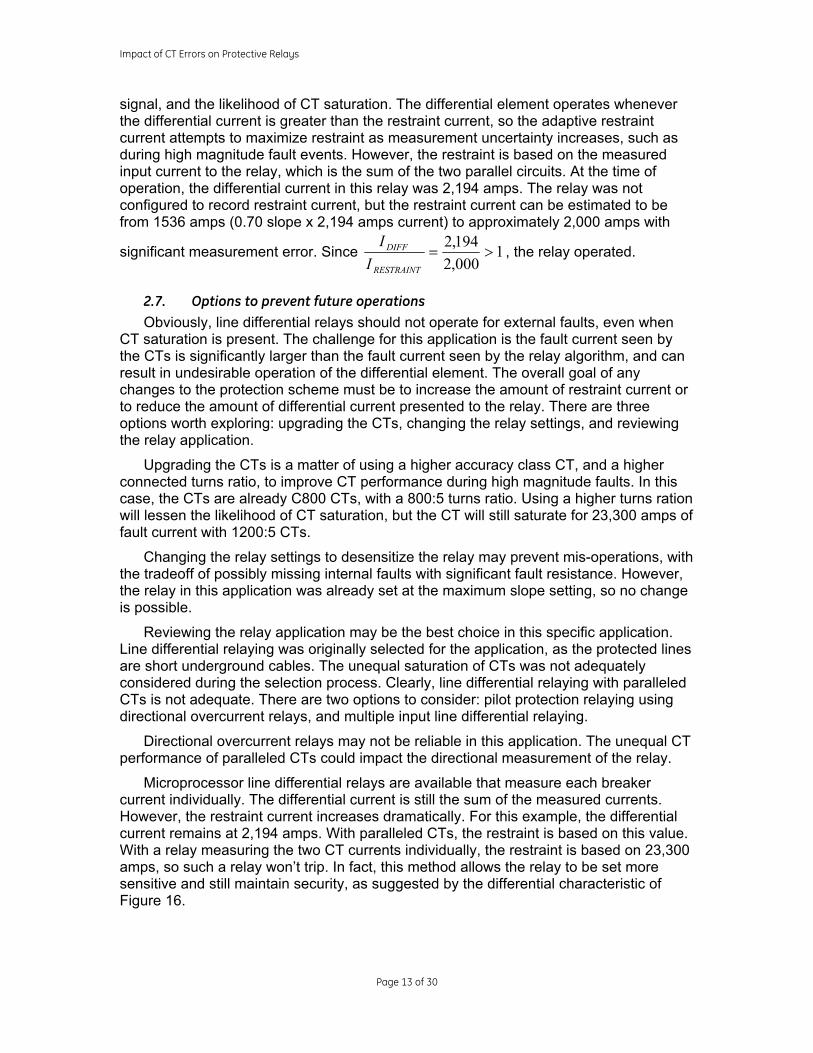
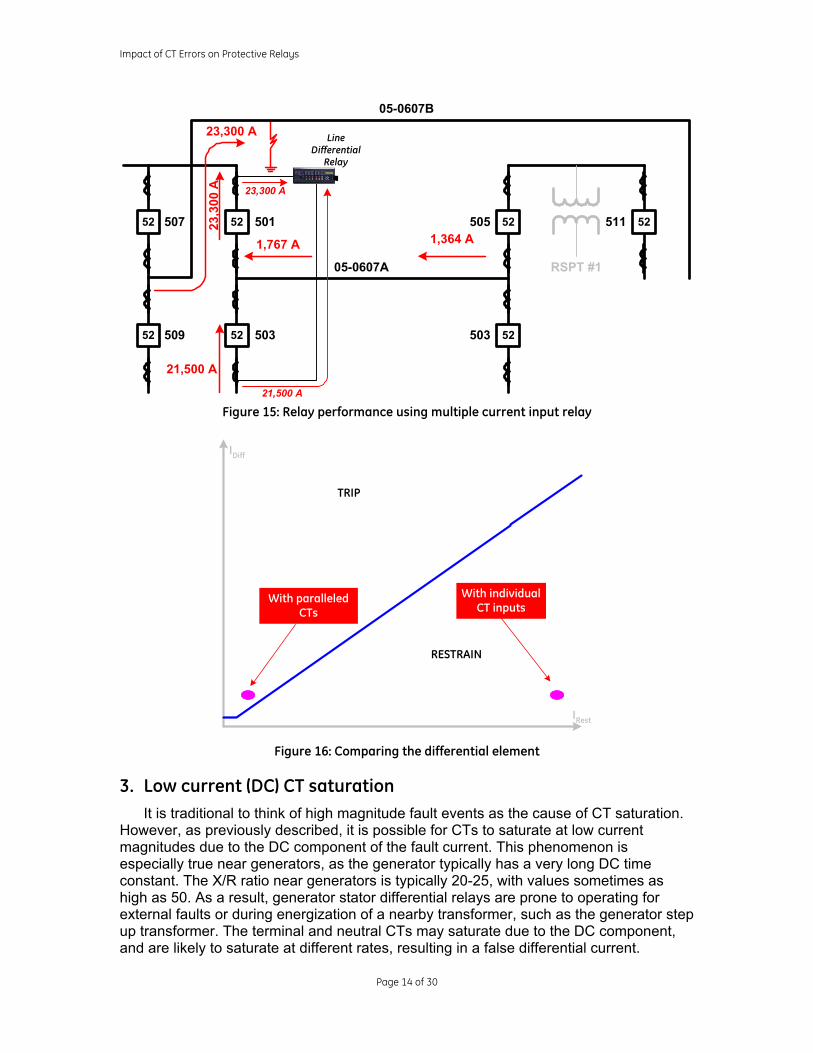
Microprocessor line differential relays are available that measure each breaker current individually. The differential current is still the sum of the measured currents. However, the restraint current increases dramatically. For this example, the differential current remains at 2,194 amps. With paralleled CTs, the restraint is based on this value. With a relay measuring the two CT currents individually, the restraint is based on 23,300 amps, so such a relay won’t trip. In fact, this method allows the relay to be set more sensitive and still maintain security, as suggested by the differential characteristic of Figure 16.
Impact of CT Errors on Protective Relays
Page 14 of 30
LineDifferential
Relay
52
52
52
52
501
503
507
509
52
52
52511505
503
05-0607A
05-0607B
RSPT #1
23,300 A
1,364 A1,767 A
21,500 A
23,300 A
21,500 A
23,3
00 A
Figure 15: Relay performance using multiple current input relay
Figure 16: Comparing the differential element
3. Low current (DC) CT saturation It is traditional to think of high magnitude fault events as the cause of CT saturation.
However, as previously described, it is possible for CTs to saturate at low current magnitudes due to the DC component of the fault current. This phenomenon is especially true near generators, as the generator typically has a very long DC time constant. The X/R ratio near generators is typically 20-25, with values sometimes as high as 50. As a result, generator stator differential relays are prone to operating for external faults or during energization of a nearby transformer, such as the generator step up transformer. The terminal and neutral CTs may saturate due to the DC component, and are likely to saturate at different rates, resulting in a false differential current.
IDiff
IRest
With paralleledCTs
With individualCT inputs
TRIP
RESTRAIN
Impact of CT Errors on Protective Relays
Page 15 of 30
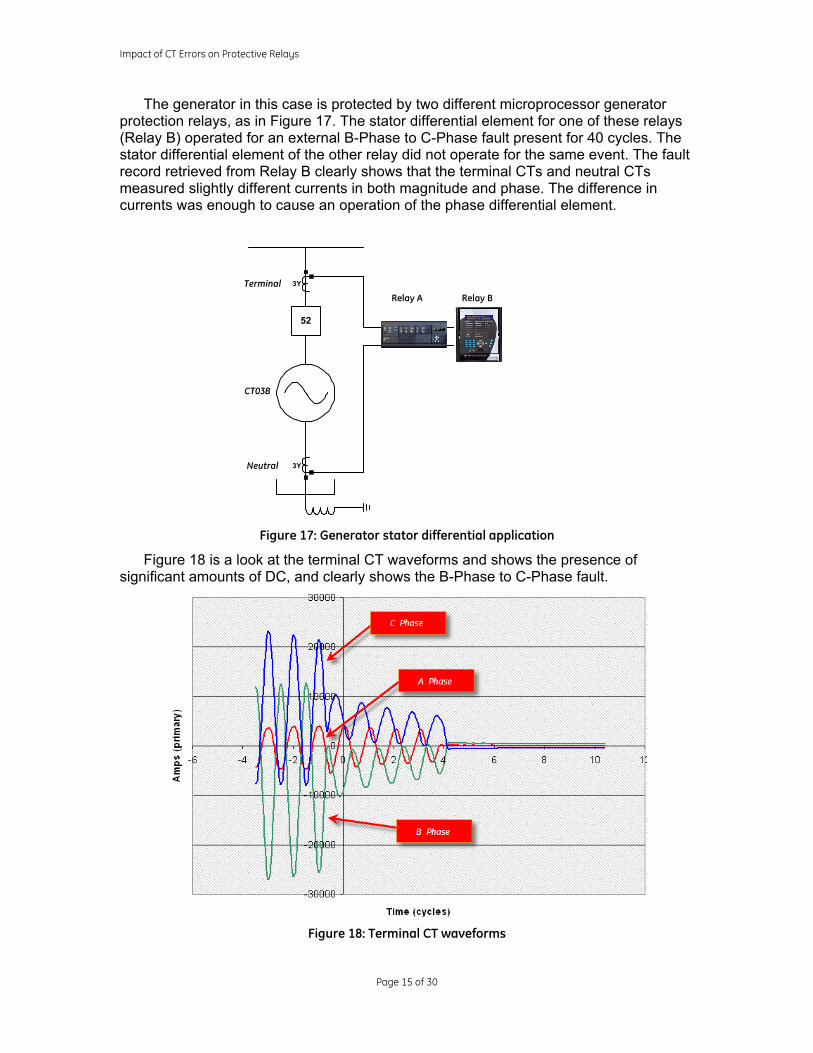
The generator in this case is protected by two different microprocessor generator protection relays, as in Figure 17. The stator differential element for one of these relays (Relay B) operated for an external B-Phase to C-Phase fault present for 40 cycles. The stator differential element of the other relay did not operate for the same event. The fault record retrieved from Relay B clearly shows that the terminal CTs and neutral CTs measured slightly different currents in both magnitude and phase. The difference in currents was enough to cause an operation of the phase differential element.
Figure 17: Generator stator differential application
Figure 18 is a look at the terminal CT waveforms and shows the presence of significant amounts of DC, and clearly shows the B-Phase to C-Phase fault.
Figure 18: Terminal CT waveforms
52
Relay A Relay BTerminal
Neutral
3Y
3Y
CT03B
Impact of CT Errors on Protective Relays
Page 16 of 30
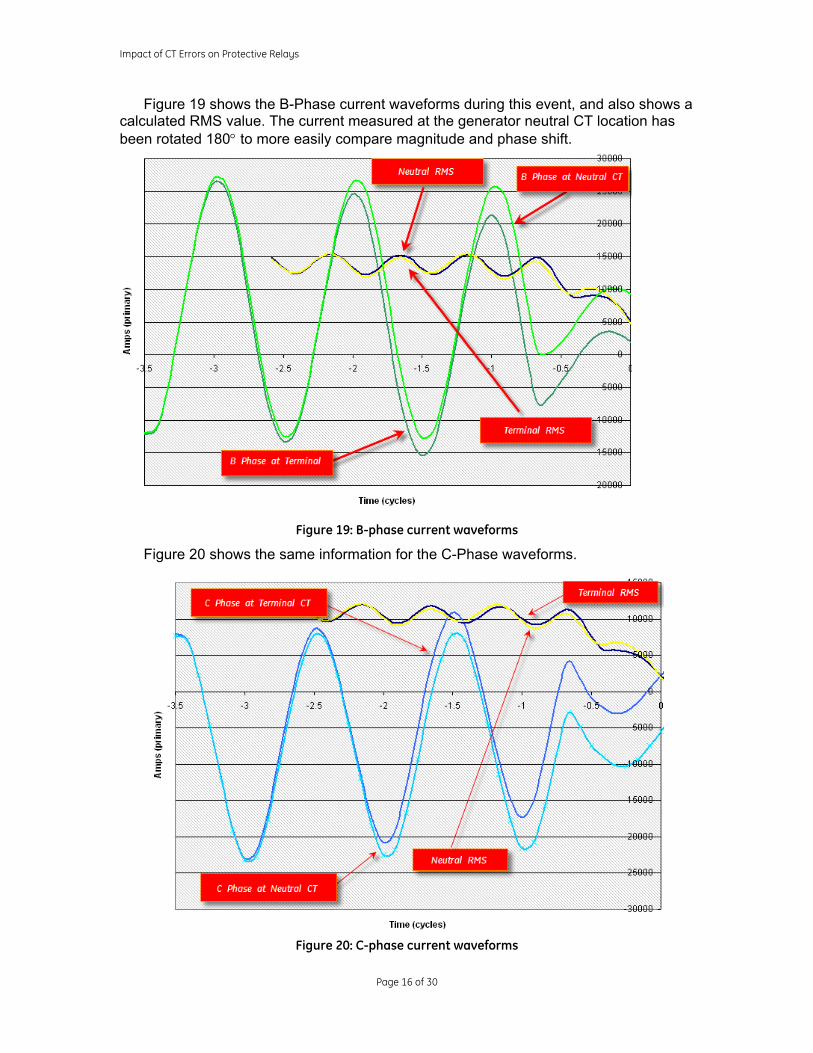
Figure 19 shows the B-Phase current waveforms during this event, and also shows a calculated RMS value. The current measured at the generator neutral CT location has been rotated 180° to more easily compare magnitude and phase shift.
Figure 19: B-phase current waveforms
Figure 20 shows the same information for the C-Phase waveforms.
Figure 20: C-phase current waveforms
Impact of CT Errors on Protective Relays
Page 17 of 30
The B-Phase and C-Phase currents clearly show the difference in performance between the terminal and neutral CTs. These differences are in both magnitude and phase angle. Even these slight differences may be enough to cause an incorrect operation of the phase differential element.
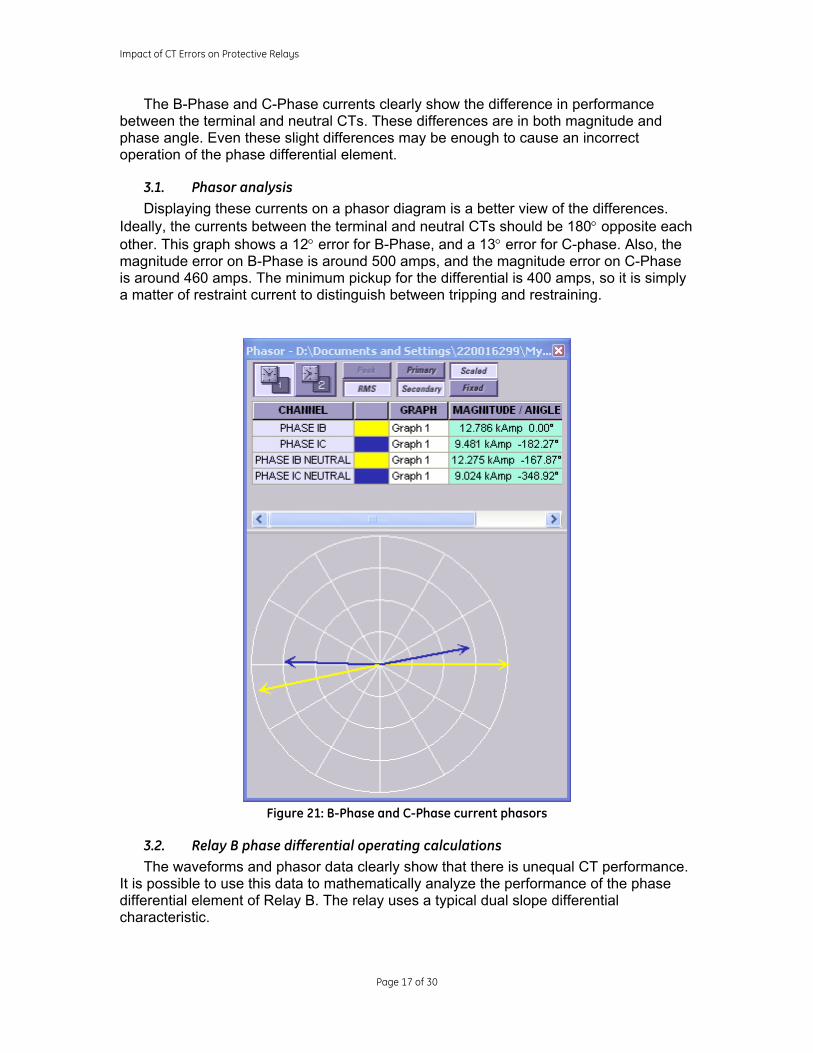
3.1. Phasor analysis Displaying these currents on a phasor diagram is a better view of the differences.
Ideally, the currents between the terminal and neutral CTs should be 180° opposite each other. This graph shows a 12° error for B-Phase, and a 13° error for C-phase. Also, the magnitude error on B-Phase is around 500 amps, and the magnitude error on C-Phase is around 460 amps. The minimum pickup for the differential is 400 amps, so it is simply a matter of restraint current to distinguish between tripping and restraining.
Figure 21: B-Phase and C-Phase current phasors
3.2. Relay B phase differential operating calculations The waveforms and phasor data clearly show that there is unequal CT performance.
It is possible to use this data to mathematically analyze the performance of the phase differential element of Relay B. The relay uses a typical dual slope differential characteristic.
Impact of CT Errors on Protective Relays
Page 18 of 30
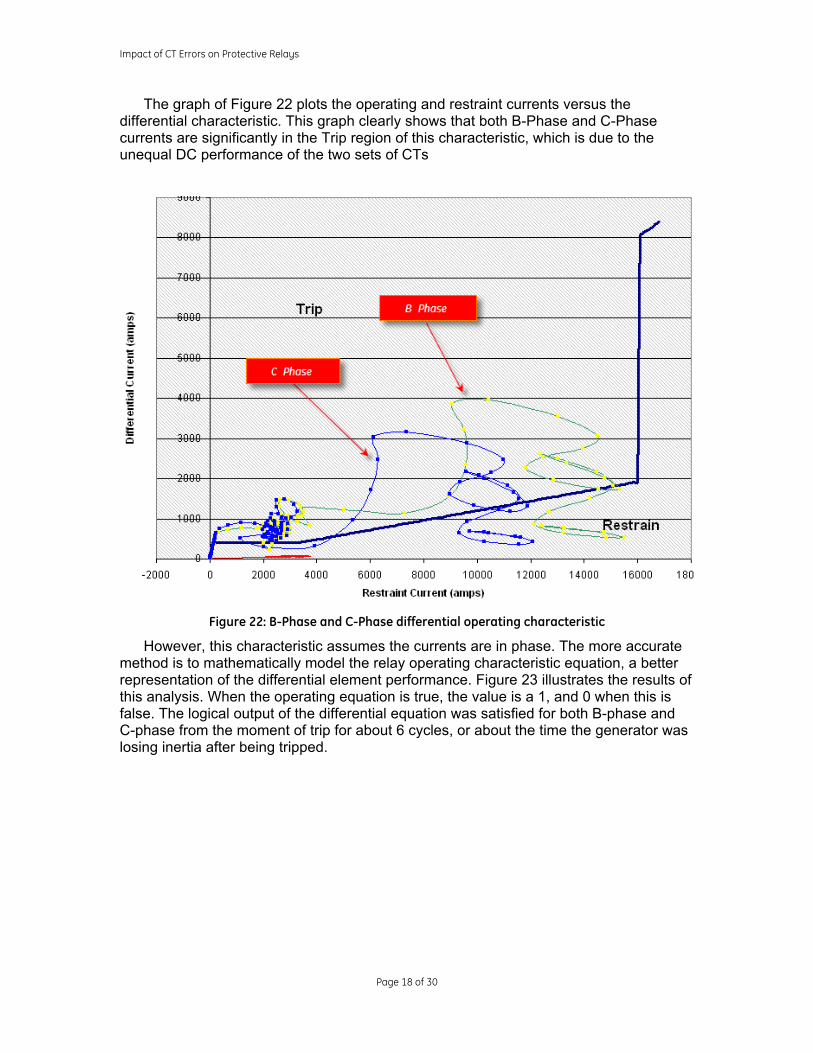
The graph of Figure 22 plots the operating and restraint currents versus the differential characteristic. This graph clearly shows that both B-Phase and C-Phase currents are significantly in the Trip region of this characteristic, which is due to the unequal DC performance of the two sets of CTs
Figure 22: B-Phase and C-Phase differential operating characteristic
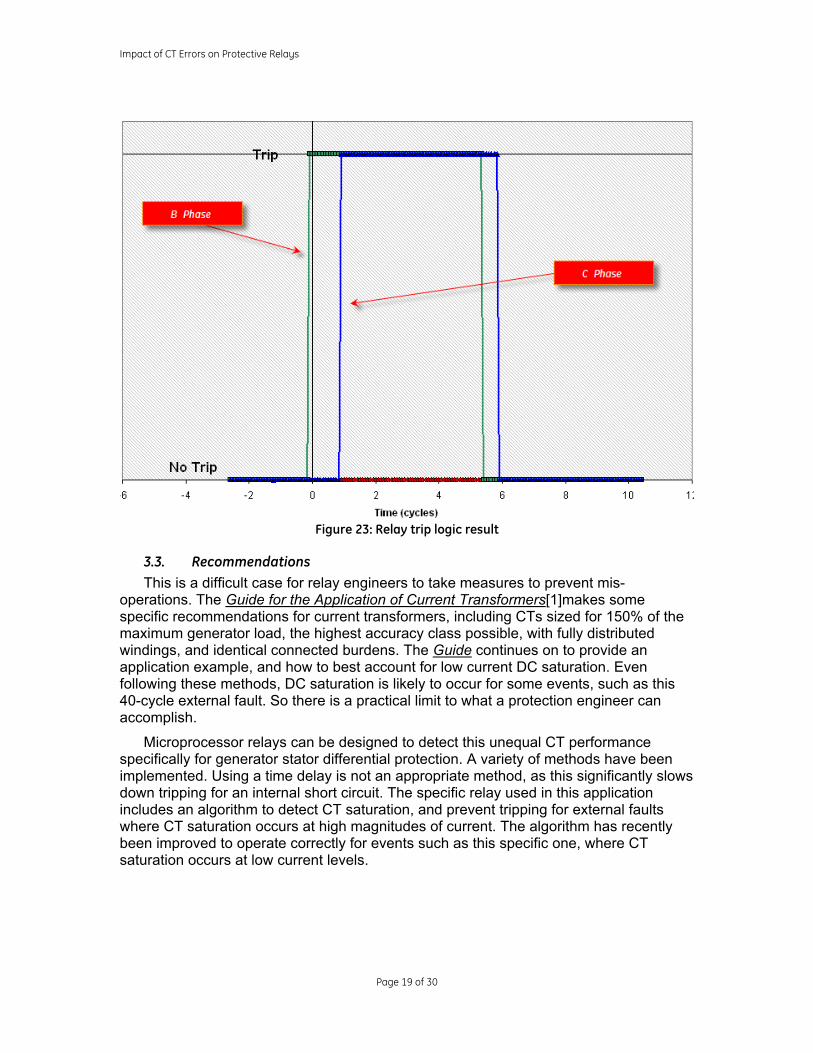
However, this characteristic assumes the currents are in phase. The more accurate method is to mathematically model the relay operating characteristic equation, a better representation of the differential element performance. Figure 23 illustrates the results of this analysis. When the operating equation is true, the value is a 1, and 0 when this is false. The logical output of the differential equation was satisfied for both B-phase and C-phase from the moment of trip for about 6 cycles, or about the time the generator was losing inertia after being tripped.
Impact of CT Errors on Protective Relays
Page 19 of 30
Figure 23: Relay trip logic result
3.3. Recommendations This is a difficult case for relay engineers to take measures to prevent mis-
operations. The Guide for the Application of Current Transformers[1]makes some specific recommendations for current transformers, including CTs sized for 150% of the maximum generator load, the highest accuracy class possible, with fully distributed windings, and identical connected burdens. The Guide continues on to provide an application example, and how to best account for low current DC saturation. Even following these methods, DC saturation is likely to occur for some events, such as this 40-cycle external fault. So there is a practical limit to what a protection engineer can accomplish.
Microprocessor relays can be designed to detect this unequal CT performance specifically for generator stator differential protection. A variety of methods have been implemented. Using a time delay is not an appropriate method, as this significantly slows down tripping for an internal short circuit. The specific relay used in this application includes an algorithm to detect CT saturation, and prevent tripping for external faults where CT saturation occurs at high magnitudes of current. The algorithm has recently been improved to operate correctly for events such as this specific one, where CT saturation occurs at low current levels.
Impact of CT Errors on Protective Relays
Page 20 of 30
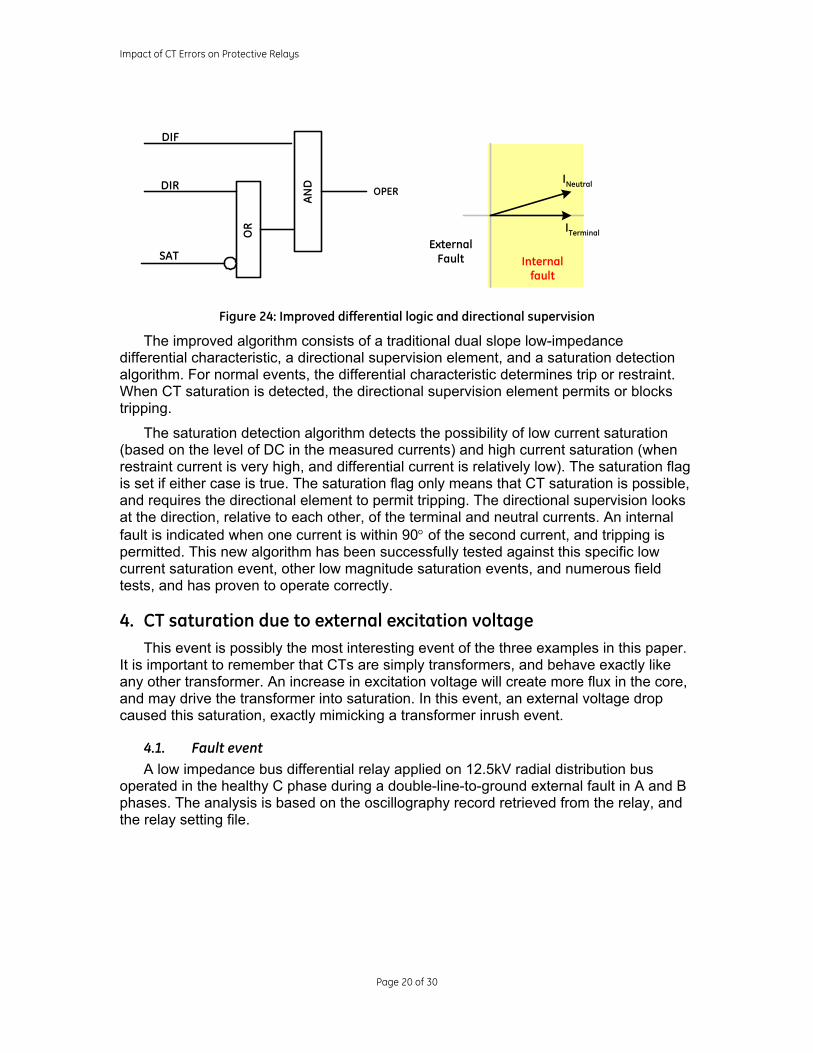
Figure 24: Improved differential logic and directional supervision
The improved algorithm consists of a traditional dual slope low-impedance differential characteristic, a directional supervision element, and a saturation detection algorithm. For normal events, the differential characteristic determines trip or restraint. When CT saturation is detected, the directional supervision element permits or blocks tripping.
The saturation detection algorithm detects the possibility of low current saturation (based on the level of DC in the measured currents) and high current saturation (when restraint current is very high, and differential current is relatively low). The saturation flag is set if either case is true. The saturation flag only means that CT saturation is possible, and requires the directional element to permit tripping. The directional supervision looks at the direction, relative to each other, of the terminal and neutral currents. An internal fault is indicated when one current is within 90° of the second current, and tripping is permitted. This new algorithm has been successfully tested against this specific low current saturation event, other low magnitude saturation events, and numerous field tests, and has proven to operate correctly.
4. CT saturation due to external excitation voltage This event is possibly the most interesting event of the three examples in this paper.
It is important to remember that CTs are simply transformers, and behave exactly like any other transformer. An increase in excitation voltage will create more flux in the core, and may drive the transformer into saturation. In this event, an external voltage drop caused this saturation, exactly mimicking a transformer inrush event.
4.1. Fault event A low impedance bus differential relay applied on 12.5kV radial distribution bus
operated in the healthy C phase during a double-line-to-ground external fault in A and B phases. The analysis is based on the oscillography record retrieved from the relay, and the relay setting file.
OR
DIF
DIR
AND
OPER
SAT
ITerminal
INeutral
Internalfault
ExternalFault
Impact of CT Errors on Protective Relays
Page 21 of 30
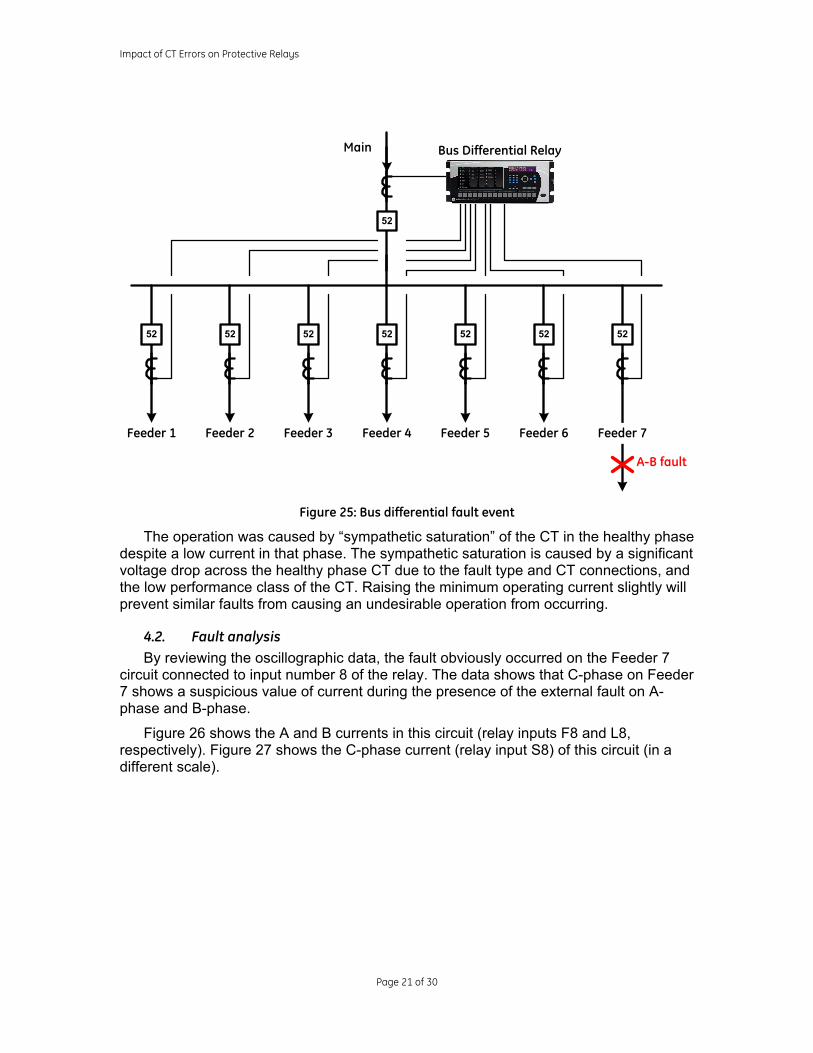
Figure 25: Bus differential fault event
The operation was caused by “sympathetic saturation” of the CT in the healthy phase despite a low current in that phase. The sympathetic saturation is caused by a significant voltage drop across the healthy phase CT due to the fault type and CT connections, and the low performance class of the CT. Raising the minimum operating current slightly will prevent similar faults from causing an undesirable operation from occurring.
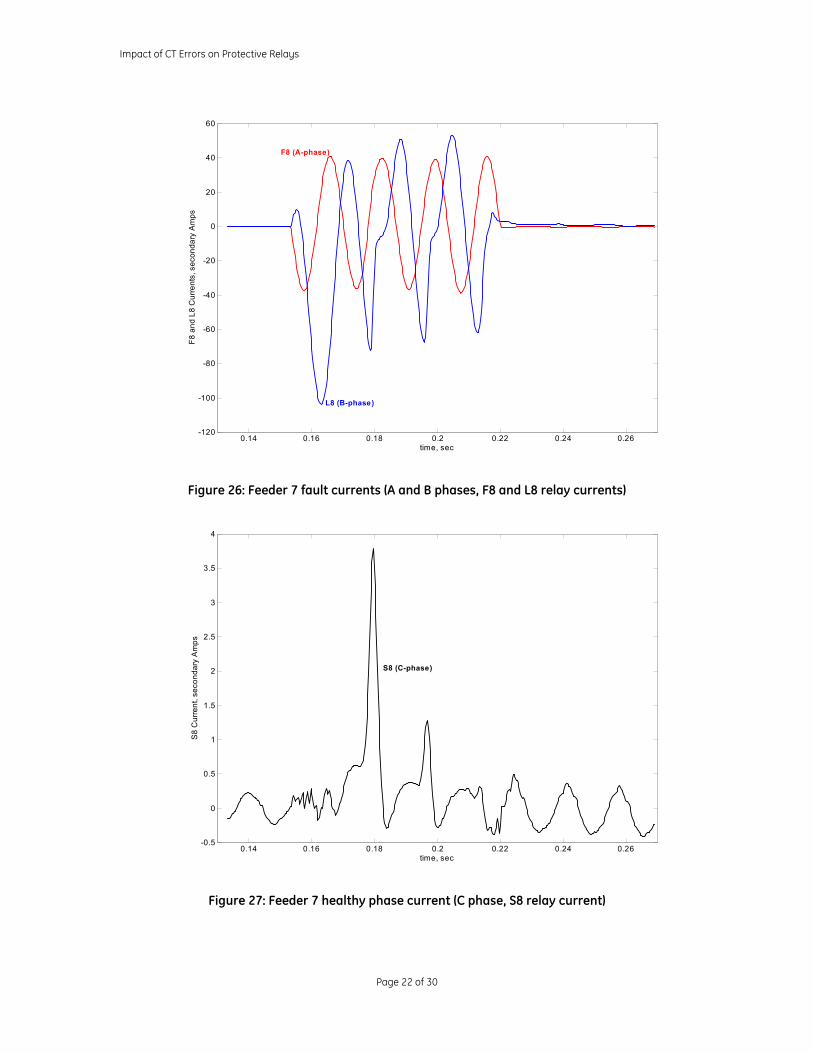
4.2. Fault analysis By reviewing the oscillographic data, the fault obviously occurred on the Feeder 7
circuit connected to input number 8 of the relay. The data shows that C-phase on Feeder 7 shows a suspicious value of current during the presence of the external fault on A-phase and B-phase.
Figure 26 shows the A and B currents in this circuit (relay inputs F8 and L8, respectively). Figure 27 shows the C-phase current (relay input S8) of this circuit (in a different scale).
52
52 52 52 52 52 52 52
Main
Feeder 1 Feeder 2 Feeder 3 Feeder 4 Feeder 5 Feeder 6 Feeder 7
Bus Differential Relay
A-B fault
Impact of CT Errors on Protective Relays
Page 22 of 30
0.14 0.16 0.18 0.2 0.22 0.24 0.26-120
-100
-80
-60
-40
-20
0
20
40
60
time, sec
F8 a
nd L
8 C
urre
nts,
sec
onda
ry A
mps
F8 (A-phase)
L8 (B-phase)
Figure 26: Feeder 7 fault currents (A and B phases, F8 and L8 relay currents)
0.14 0.16 0.18 0.2 0.22 0.24 0.26-0.5
0
0.5
1
1.5
2
2.5
3
3.5
4
time, sec
S8
Cur
rent
, sec
onda
ry A
mps
S8 (C-phase)
Figure 27: Feeder 7 healthy phase current (C phase, S8 relay current)
Impact of CT Errors on Protective Relays
Page 23 of 30
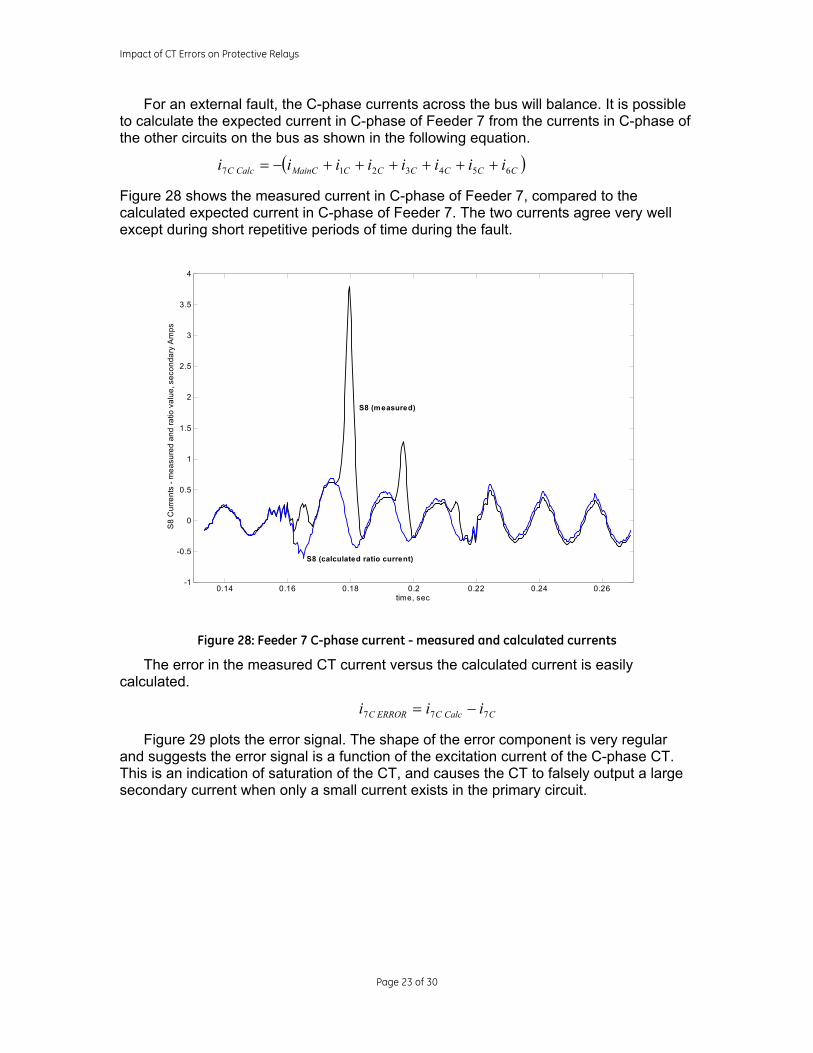
For an external fault, the C-phase currents across the bus will balance. It is possible to calculate the expected current in C-phase of Feeder 7 from the currents in C-phase of the other circuits on the bus as shown in the following equation.
( )CCCCCCMainCCalcC iiiiiiii 6543217 ++++++−=
Figure 28 shows the measured current in C-phase of Feeder 7, compared to the calculated expected current in C-phase of Feeder 7. The two currents agree very well except during short repetitive periods of time during the fault.
0.14 0.16 0.18 0.2 0.22 0.24 0.26-1
-0.5
0
0.5
1
1.5
2
2.5
3
3.5
4
time, sec
S8
Cur
rent
s - m
easu
red
and
ratio
val
ue, s
econ
dary
Am
ps
S8 (measured)
S8 (calculated ratio current)
Figure 28: Feeder 7 C-phase current - measured and calculated currents
The error in the measured CT current versus the calculated current is easily calculated.
CCalcCERRORC iii 777 −=
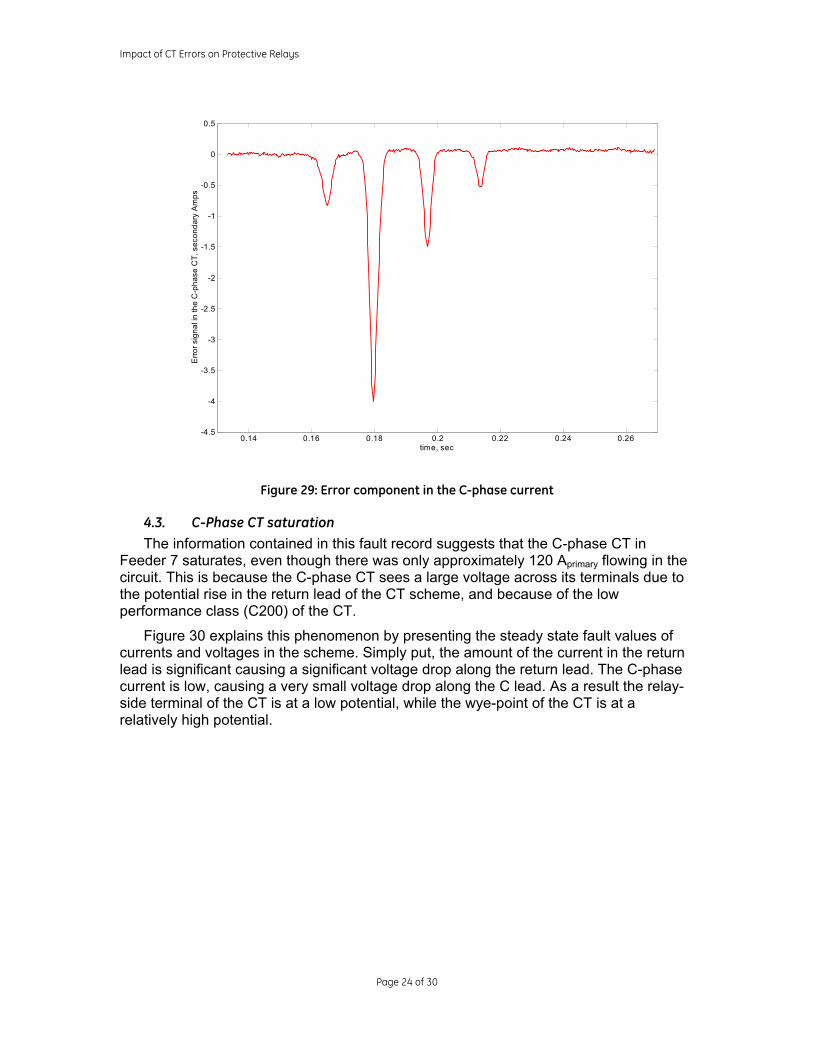
Figure 29 plots the error signal. The shape of the error component is very regular and suggests the error signal is a function of the excitation current of the C-phase CT. This is an indication of saturation of the CT, and causes the CT to falsely output a large secondary current when only a small current exists in the primary circuit.
Impact of CT Errors on Protective Relays
Page 24 of 30
0.14 0.16 0.18 0.2 0.22 0.24 0.26-4.5
-4
-3.5
-3
-2.5
-2
-1.5
-1
-0.5
0
0.5
time, sec
Erro
r sig
nal i
n th
e C
-pha
se C
T, s
econ
dary
Am
ps
Figure 29: Error component in the C-phase current
4.3. C-Phase CT saturation The information contained in this fault record suggests that the C-phase CT in
Feeder 7 saturates, even though there was only approximately 120 Aprimary flowing in the circuit. This is because the C-phase CT sees a large voltage across its terminals due to the potential rise in the return lead of the CT scheme, and because of the low performance class (C200) of the CT.
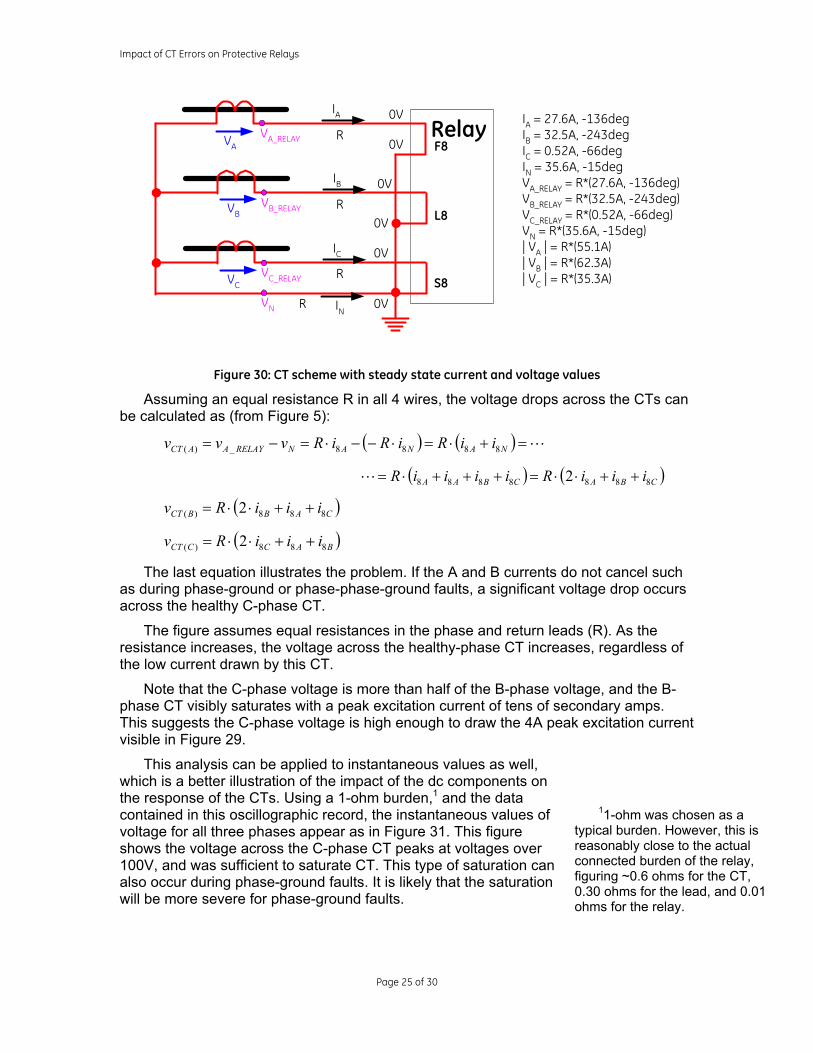
Figure 30 explains this phenomenon by presenting the steady state fault values of currents and voltages in the scheme. Simply put, the amount of the current in the return lead is significant causing a significant voltage drop along the return lead. The C-phase current is low, causing a very small voltage drop along the C lead. As a result the relay-side terminal of the CT is at a low potential, while the wye-point of the CT is at a relatively high potential.
Impact of CT Errors on Protective Relays
Page 25 of 30
Relay IA = 27.6A, -136degIB = 32.5A, -243degIC = 0.52A, -66degIN = 35.6A, -15degVA_RELAY = R*(27.6A, -136deg)VB_RELAY = R*(32.5A, -243deg)VC_RELAY = R*(0.52A, -66deg)VN = R*(35.6A, -15deg)| VA | = R*(55.1A)| VB | = R*(62.3A)| VC | = R*(35.3A)
VA_RELAY
IA
VB_RELAY
IB
VC_RELAY
IC
IN
VA
VB
VC
F8
L8
S8
0V
0V
0V
0V
0V
0VVN
R
R
R
R
Figure 30: CT scheme with steady state current and voltage values
Assuming an equal resistance R in all 4 wires, the voltage drops across the CTs can be calculated as (from Figure 5):
( ) ( ) L=+⋅=⋅−−⋅=−= NANANRELAYAACT iiRiRiRvvv 8888_)(
( ) ( )CBACBAA iiiRiiiiR 8888888 2 ++⋅⋅=+++⋅=L
( )CABBCT iiiRv 888)( 2 ++⋅⋅=
( )BACCCT iiiRv 888)( 2 ++⋅⋅=
The last equation illustrates the problem. If the A and B currents do not cancel such as during phase-ground or phase-phase-ground faults, a significant voltage drop occurs across the healthy C-phase CT.
The figure assumes equal resistances in the phase and return leads (R). As the resistance increases, the voltage across the healthy-phase CT increases, regardless of the low current drawn by this CT.
Note that the C-phase voltage is more than half of the B-phase voltage, and the B-phase CT visibly saturates with a peak excitation current of tens of secondary amps. This suggests the C-phase voltage is high enough to draw the 4A peak excitation current visible in Figure 29.
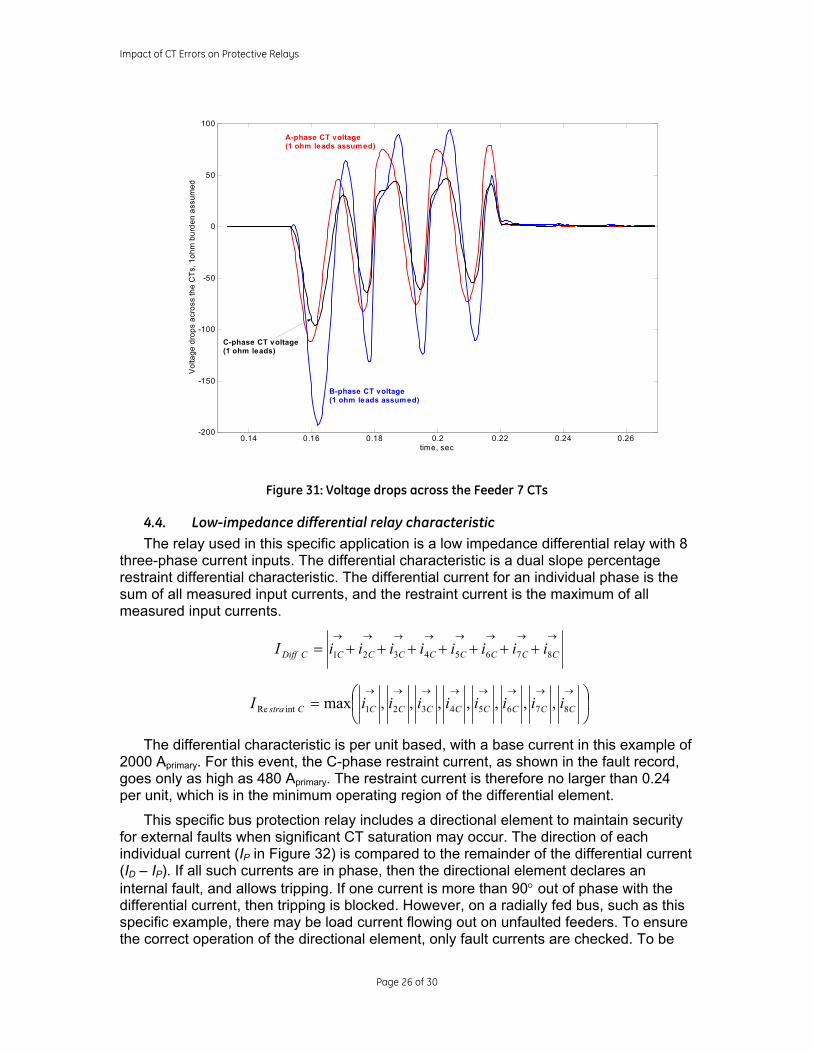
This analysis can be applied to instantaneous values as well, which is a better illustration of the impact of the dc components on the response of the CTs. Using a 1-ohm burden,1 and the data contained in this oscillographic record, the instantaneous values of voltage for all three phases appear as in Figure 31. This figure shows the voltage across the C-phase CT peaks at voltages over 100V, and was sufficient to saturate CT. This type of saturation can also occur during phase-ground faults. It is likely that the saturation will be more severe for phase-ground faults.
11-ohm was chosen as a typical burden. However, this is reasonably close to the actual connected burden of the relay, figuring ~0.6 ohms for the CT, 0.30 ohms for the lead, and 0.01ohms for the relay.
Impact of CT Errors on Protective Relays
Page 26 of 30
0.14 0.16 0.18 0.2 0.22 0.24 0.26-200
-150
-100
-50
0
50
100
time, sec
Vol
tage
dro
ps a
cros
s th
e C
Ts, 1
ohm
bur
den
assu
med
B-phase CT voltage(1 ohm leads assumed)
A-phase CT voltage(1 ohm leads assumed)
C-phase CT voltage(1 ohm leads)
Figure 31: Voltage drops across the Feeder 7 CTs
4.4. Low-impedance differential relay characteristic The relay used in this specific application is a low impedance differential relay with 8
three-phase current inputs. The differential characteristic is a dual slope percentage restraint differential characteristic. The differential current for an individual phase is the sum of all measured input currents, and the restraint current is the maximum of all measured input currents.
→→→→→→→→
+++++++= CCCCCCCCCDiff iiiiiiiiI 87654321
⎟⎠
⎞⎜⎝
⎛=→→→→→→→→
CCCCCCCCCstra iiiiiiiiI 87654321intRe ,,,,,,,max
The differential characteristic is per unit based, with a base current in this example of 2000 Aprimary. For this event, the C-phase restraint current, as shown in the fault record, goes only as high as 480 Aprimary. The restraint current is therefore no larger than 0.24 per unit, which is in the minimum operating region of the differential element.
This specific bus protection relay includes a directional element to maintain security for external faults when significant CT saturation may occur. The direction of each individual current (IP in Figure 32) is compared to the remainder of the differential current (ID – IP). If all such currents are in phase, then the directional element declares an internal fault, and allows tripping. If one current is more than 90° out of phase with the differential current, then tripping is blocked. However, on a radially fed bus, such as this specific example, there may be load current flowing out on unfaulted feeders. To ensure the correct operation of the directional element, only fault currents are checked. To be
Impact of CT Errors on Protective Relays
Page 27 of 30
considered a fault current, an individual current must be a significant percentage of the restraint current.
Figure 32: Differential relay directional element
4.5. Low-impedance differential relay operation The directional element worked as described in A-phase and B-phase for this
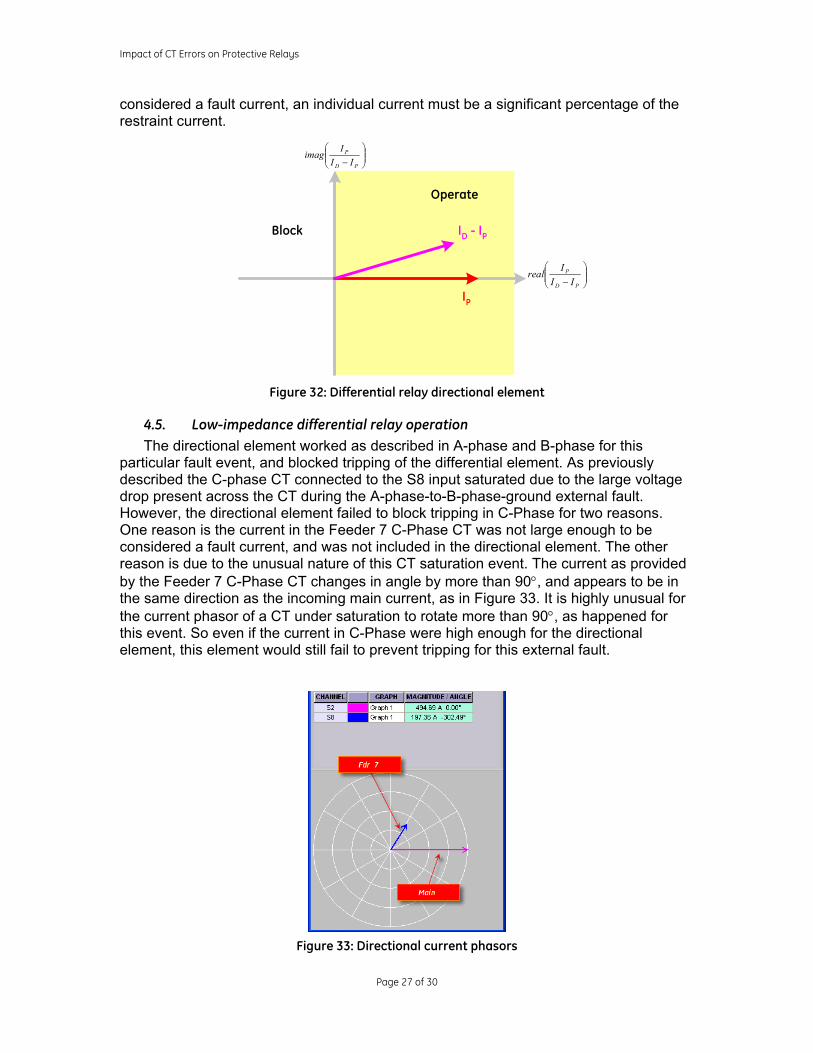
particular fault event, and blocked tripping of the differential element. As previously described the C-phase CT connected to the S8 input saturated due to the large voltage drop present across the CT during the A-phase-to-B-phase-ground external fault. However, the directional element failed to block tripping in C-Phase for two reasons. One reason is the current in the Feeder 7 C-Phase CT was not large enough to be considered a fault current, and was not included in the directional element. The other reason is due to the unusual nature of this CT saturation event. The current as provided by the Feeder 7 C-Phase CT changes in angle by more than 90°, and appears to be in the same direction as the incoming main current, as in Figure 33. It is highly unusual for the current phasor of a CT under saturation to rotate more than 90°, as happened for this event. So even if the current in C-Phase were high enough for the directional element, this element would still fail to prevent tripping for this external fault.
Figure 33: Directional current phasors
Operate
Block
⎟⎟⎠
⎞⎜⎜⎝
⎛− PD
P
IIIreal
⎟⎟⎠
⎞⎜⎜⎝
⎛− PD
P
IIIimag
IP
ID - IP
Impact of CT Errors on Protective Relays
Page 28 of 30
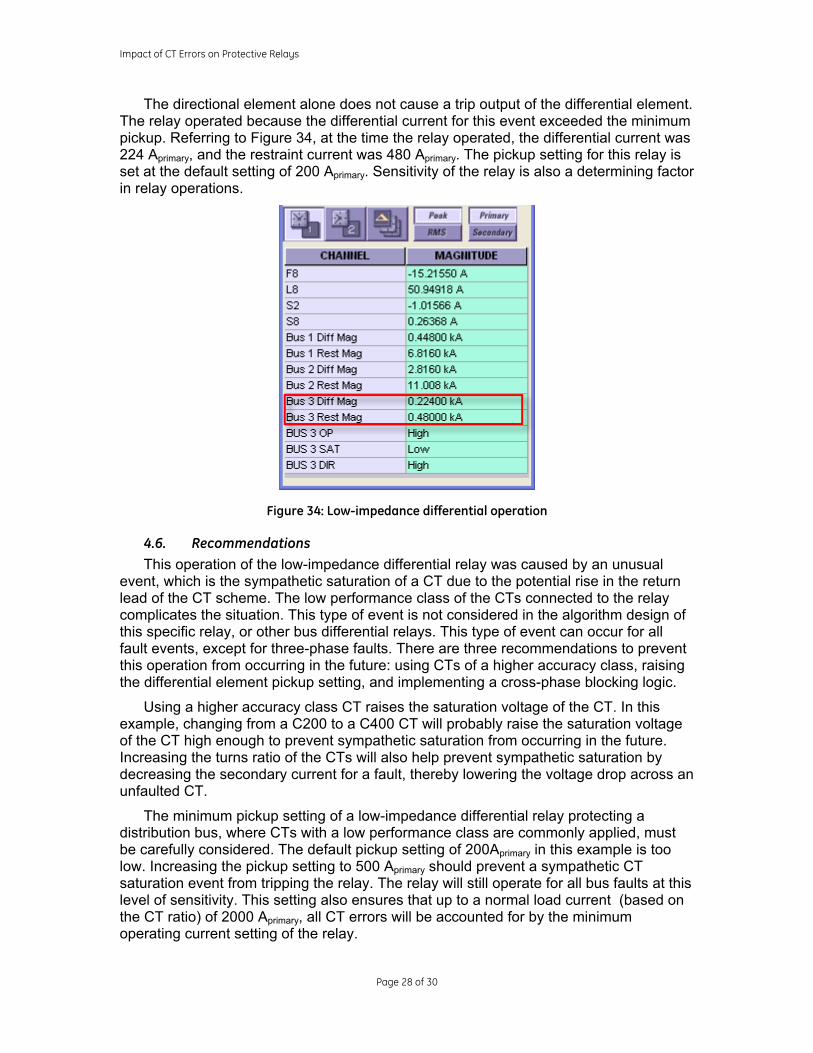
The directional element alone does not cause a trip output of the differential element. The relay operated because the differential current for this event exceeded the minimum pickup. Referring to Figure 34, at the time the relay operated, the differential current was 224 Aprimary, and the restraint current was 480 Aprimary. The pickup setting for this relay is set at the default setting of 200 Aprimary. Sensitivity of the relay is also a determining factor in relay operations.
Figure 34: Low-impedance differential operation
4.6. Recommendations This operation of the low-impedance differential relay was caused by an unusual
event, which is the sympathetic saturation of a CT due to the potential rise in the return lead of the CT scheme. The low performance class of the CTs connected to the relay complicates the situation. This type of event is not considered in the algorithm design of this specific relay, or other bus differential relays. This type of event can occur for all fault events, except for three-phase faults. There are three recommendations to prevent this operation from occurring in the future: using CTs of a higher accuracy class, raising the differential element pickup setting, and implementing a cross-phase blocking logic.
Using a higher accuracy class CT raises the saturation voltage of the CT. In this example, changing from a C200 to a C400 CT will probably raise the saturation voltage of the CT high enough to prevent sympathetic saturation from occurring in the future. Increasing the turns ratio of the CTs will also help prevent sympathetic saturation by decreasing the secondary current for a fault, thereby lowering the voltage drop across an unfaulted CT.
The minimum pickup setting of a low-impedance differential relay protecting a distribution bus, where CTs with a low performance class are commonly applied, must be carefully considered. The default pickup setting of 200Aprimary in this example is too low. Increasing the pickup setting to 500 Aprimary should prevent a sympathetic CT saturation event from tripping the relay. The relay will still operate for all bus faults at this level of sensitivity. This setting also ensures that up to a normal load current (based on the CT ratio) of 2000 Aprimary, all CT errors will be accounted for by the minimum operating current setting of the relay.
Impact of CT Errors on Protective Relays
Page 29 of 30
Cross-phase blocking logic is another possibility to prevent relay operation due to sympathetic CT saturation. There could be some applications where raising the pickup setting to a level high enough to prevent operation during sympathetic inrush is not desirable. In these cases, maintain security by implementing a cross-phase blocking element in logic for each phase. The logic is straightforward. When any phase restrains for a high magnitude external fault, the other 2 phases are blocked if the current in these phases is below a fault threshold.
5. Summary The performance of CTs impacts the design of protective relays, protective relay
systems, and protective relay settings. Saturation of CTs can be difficult to predict and can sometimes lead to undesired operation of relays. The three examples in these papers show different events where CTs saturated and caused relay operations. It is common to think of CT saturation for only an individual CT, and that high magnitude fault currents are the cause of CT saturation. The examples presented in this paper discuss other impacts of CT saturation than the commonly understood impacts.
The first example does cover CT saturation due to high magnitude fault currents. When two CTs transform the same fault current, even CTs nominally identical in performance, the response of each CT will be different. When these two CTs, with different responses, are paralleled together, relaying will be impacted. In this example, a line differential relay operated for an external fault due to this unequal CT performance.
The second example discusses CT saturation due to the DC component of a fault. With DC offset, and a long system time constant, flux will build up in the CT core to the point the CT will saturate, even at low levels of current. The example in this case is for a generator stator differential, where the X/R ratio of the system can be greater than 25. Once again, unequal saturation of the CTs, this time at a low current level, led to the operation of the stator differential on an external fault.
The final example is for a type of CT saturation not typically considered. An external phase-to-phase fault on wye-connected CTs caused a large voltage drop across the CT on the unfaulted phase. This voltage drop was large enough to drive the CT in to saturation through secondary excitation of the CT. The differential relay operated for this external fault due to the false differential current created.
When choosing CTs for an application, the general rule is to use the highest accuracy class possible, the highest connected turns ratio possible, and connect the smallest burden possible. There are obvious practical limits in size, cost, and commitment to standards. However, comparing the saturation voltage of the CT to the voltage drop across the CT secondary burden for the maximum fault current is not the only step the protection engineer must take to properly select CTs, and to properly design a protective relaying scheme.
As these three examples show, protection engineers must consider how CT performance will impact the protective relays they plan to use. The protective scheme chosen for an application must be secure, and a methodology to develop reasonable settings must be used. Analysis must include the likelihood of CT saturation due to both AC and DC components in the system, and the performance of CTs in parallel. In addition, understanding how the relays themselves respond to CT saturation is necessary.
Impact of CT Errors on Protective Relays
Page 30 of 30
6. References [1] “IEEE Guide for the Application of Current Transformers Used for Protective Relaying
Purposes”, IEEE Std. C37.110-1996, The Institute of Electrical and Electronic Engineers, Inc., New York, NY, 1996.
[2] A. E. Fitzgerald, C. Kingsley, Jr., S. D. Umans, “Electric Machinery, 4th edition”, McGraw-Hill Book Company, New York, NY, 1983, pp. 4-24.
[3] “IEEE PSRC CT Saturation Calculator”, IEEE Power Engineering Society Protective Relaying Subcommittee, www.pes-psrc.org.
[4] B. Kasztenny, D. Finney, “Generator Protection and CT Saturation”, Presented at the Texas A&M Protective Relay Conference, April 5, 2005.
[5] J. L. Blackburn, “Protective Relaying Principles and Applications”, 2nd edition, Marcel Dekker, Inc., New York, NY, 1998.
Author
Rich Hunt, Application Engineer, GE Multilin Rich Hunt is an Application Engineer with GE Multilin, responsible for technical sales, technical marketing, and technical support of GE Multilin products. Rich has 20 years experience in electric utility systems, including 10 years with Virginia Power, and 10 years experience as an Application Engineer for relay manufacturers. Rich earned the B.S.E.E. and M.S.E.E at Virginia Tech, with a master’s thesis on applications of protective relays. He is registered Professional Engineer in the Commonwealth of Virginia, and is a member of the Main Committee of the IEEE Power System Relaying Committee.
Acknowledgements This paper discusses several actual relay operations, and the root cause of the
events behind the relay operations. My colleagues Dale Finney, Bogdan Kasztenny, Lubo Sevov, and Ilia Voloh, did most of the basic analysis presented in this paper. The paper would be less successful without their contributions.