Immune landscape of papillary thyroid cancer and ...
9
https://doi.org/10.1530/ERC-17-0532 http://erc.endocrinology-journals.org © 2018 Society for Endocrinology Printed in Great Britain Published by Bioscientifica Ltd. 25:5 Endocrine-Related Cancer K J Na and H Choi Immune landscape and differentiation of PTC 523–531 RESEARCH Immune landscape of papillary thyroid cancer and immunotherapeutic implications Kwon Joong Na 1,2, * and Hongyoon Choi 3,4, * 1 Department of Community Health, Korea Health Promotion Institute, Seoul, Republic of Korea 2 Department of Clinical Medical Sciences, Seoul National University, College of Medicine, Seoul, Republic of Korea 3 Department of Nuclear Medicine, Seoul National University Hospital, Seoul, Republic of Korea 4 Cheonan Public Health Center, Chungnam, Republic of Korea Correspondence should be addressed to K J Na or H Choi: [email protected] or [email protected] *(K J Na and H Choi contributed equally to this work) Abstract Although papillary thyroid cancer (PTC) is curable with excellent survival rate, patients with dedifferentiated PTC suffer the recurrence or death. As cancer immune escape plays a critical role in cancer progression, we aimed to investigate the relationship between differentiation and immune landscape of PTC and its implications for immunotherapy. Using The Cancer Genome Atlas data, we estimated the immune cell enrichment scores and overall immune infiltration, ImmuneScore, to characterize the immune landscape of PTC. Thyroid differentiation score (TDS) was calculated from 16 thyroid function genes. We demonstrated that ImmuneScore had a significant negative correlation with TDS, and BRAF V600E+ tumors showed significantly low TDS and high ImmuneScore. Enrichment scores of myeloid cells and B-cells were negatively correlated with TDS, while those of plasma cells were positively correlated with TDS. In addition, the association between TDS, ImmuneScore and immunosuppressive markers (CTLA-4, PD-L1, HLA-G) were evaluated according to BRAF V600E status. All immunosuppressive markers expression had a significant negative correlation with TDS, and they were significantly higher in BRAF V600E+ status. Subgroups were divided by median values of TDS and ImmuneScore, and immunosuppressive markers of these subgroups were compared. The immunosuppressive markers expression was the highest in high ImmuneScore and low TDS subgroup. Furthermore, ImmuneScore had a significant association with recurrence-free survival, irrespective of clinicopathologic factors including BRAF V600E status. These findings based on gene expression data illuminate the immune landscape of PTC and its association with TDS, immunosuppressive markers and recurrence. Our results would be extended to investigate immunotherapeutic approaches in PTC. Introduction Thyroid cancer is the most common endocrine malignancy, and its incidence has increased almost 3-fold over the past decades (Chen et al. 2009, Siegel et al. 2016). Papillary thyroid cancer (PTC) is the predominant histologic subtype (~90%) and is usually curable with a 10-year survival rate of greater than 90% (Haugen et al. 2016). However, some of PTC dedifferentiate into more aggressive thyroid cancers, so that 10% of patients Endocrine-Related Cancer (2018) 25, 523–531 Key Words f papillary thyroid cancer f tumor microenvironment f immune landscape f cancer immunoediting f next generation sequencing Downloaded from Bioscientifica.com at 11/01/2021 07:09:48AM via free access
Transcript of Immune landscape of papillary thyroid cancer and ...
https://doi.org/10.1530/ERC-17-0532http://erc.endocrinology-journals.org © 2018 Society for Endocrinology
Printed in Great BritainPublished by Bioscientifica Ltd.
25:5Endocrine-Related Cancer
K J Na and H Choi Immune landscape and differentiation of PTC
523–531
10.1530/ERC-17-0532
RESEARCH
Immune landscape of papillary thyroid cancer and immunotherapeutic implications
Kwon Joong Na1,2,* and Hongyoon Choi3,4,*
1Department of Community Health, Korea Health Promotion Institute, Seoul, Republic of Korea2Department of Clinical Medical Sciences, Seoul National University, College of Medicine, Seoul, Republic of Korea3Department of Nuclear Medicine, Seoul National University Hospital, Seoul, Republic of Korea4Cheonan Public Health Center, Chungnam, Republic of Korea
Correspondence should be addressed to K J Na or H Choi: [email protected] or [email protected]
*(K J Na and H Choi contributed equally to this work)
Abstract
Although papillary thyroid cancer (PTC) is curable with excellent survival rate, patients
with dedifferentiated PTC suffer the recurrence or death. As cancer immune escape plays
a critical role in cancer progression, we aimed to investigate the relationship between
differentiation and immune landscape of PTC and its implications for immunotherapy.
Using The Cancer Genome Atlas data, we estimated the immune cell enrichment scores
and overall immune infiltration, ImmuneScore, to characterize the immune landscape of
PTC. Thyroid differentiation score (TDS) was calculated from 16 thyroid function genes.
We demonstrated that ImmuneScore had a significant negative correlation with TDS,
and BRAFV600E+ tumors showed significantly low TDS and high ImmuneScore. Enrichment
scores of myeloid cells and B-cells were negatively correlated with TDS, while those of
plasma cells were positively correlated with TDS. In addition, the association between
TDS, ImmuneScore and immunosuppressive markers (CTLA-4, PD-L1, HLA-G) were
evaluated according to BRAFV600E status. All immunosuppressive markers expression had a
significant negative correlation with TDS, and they were significantly higher in BRAFV600E+
status. Subgroups were divided by median values of TDS and ImmuneScore, and
immunosuppressive markers of these subgroups were compared. The immunosuppressive
markers expression was the highest in high ImmuneScore and low TDS subgroup.
Furthermore, ImmuneScore had a significant association with recurrence-free survival,
irrespective of clinicopathologic factors including BRAFV600E status. These findings based
on gene expression data illuminate the immune landscape of PTC and its association
with TDS, immunosuppressive markers and recurrence. Our results would be extended to
investigate immunotherapeutic approaches in PTC.
Introduction
Thyroid cancer is the most common endocrine malignancy, and its incidence has increased almost 3-fold over the past decades (Chen et al. 2009, Siegel et al. 2016). Papillary thyroid cancer (PTC) is the predominant
histologic subtype (~90%) and is usually curable with a 10-year survival rate of greater than 90% (Haugen et al. 2016). However, some of PTC dedifferentiate into more aggressive thyroid cancers, so that 10% of patients
Endocrine-Related Cancer (2018) 25, 523–531
5
Key Words
f papillary thyroid cancer
f tumor microenvironment
f immune landscape
f cancer immunoediting
f next generation sequencing
25
Downloaded from Bioscientifica.com at 11/01/2021 07:09:48AMvia free access

Printed in Great BritainPublished by Bioscientifica Ltd.https://doi.org/10.1530/ERC-17-0532
http://erc.endocrinology-journals.org © 2018 Society for Endocrinology
524K J Na and H Choi Immune landscape and differentiation of PTC
25:5Endocrine-Related Cancer
experience the recurrence of PTC, and 5–10% of patients experience distant metastasis (Sipos & Mazzaferri 2010). Most of the differentiated PTC responds well to current treatment options including surgery, and radioactive iodine therapies, alone or in combination; however, dedifferentiated tumors exhibit 5-year survival rate of only 50–55% (Sherma 2003).
The close relationship between the tumor microenvironment (TME) and cancer cells are well demonstrated. Especially, the dynamic interaction between immune cells within TME and cancer cells contributes to all stages of carcinogenesis from the early state of tumorigenesis to cancer progression and metastasis (Crespo et al. 2013, Joyce & Fearon 2015). It is now well recognized that immune cells within TME could recognize and eliminate cancer cells; however, they also modulate host immune system to escape their surveillance by change of immune cell composition including recruitment of suppressor immune cell populations, downregulation of neoantigen recognition, and expression of immune-inhibitory ligands, known as cancer immunoediting (Schreiber et al. 2011). To this end, modulations of the immune system within TME are of enormous interest among oncologists and cancer immunologists, and it leads to the development of the immunotherapy. In recent years, some immunotherapeutic agents including immune checkpoint inhibitors have demonstrated promising clinical results in patients with metastatic melanoma, non-small-cell lung carcinoma, and renal cell carcinoma (Postow et al. 2015). In the light of these successes, there has been interest in the investigation of cancer immunotherapeutics across other solid cancers, especially for a broad range of therapeutically refractory cancers including dedifferentiated PTC (French et al. 2017).
Here, we aimed to investigate the immune landscape of PTC and its association with differentiation and to evaluate the potential immunotherapeutic implications. To gain insights into tumor immune landscape according to differentiation of PTC, we performed integrative immune cell types enrichment analysis using gene expression profiles. We also assessed the association between immune landscape and the most common genetic alteration of PTC, the BRAFV600E mutation. From the comprehensive analysis, we focused on the clinical utility of immune landscape on prognostic stratification and potential implication as a biomarker reflecting immune microenvironment.
Materials and methods
The preprocessing step for transcriptome and clinical data
We used mRNA transcriptome data of PTCs from The Cancer Genome Atlas projects (TCGA) (Cancer Genome Atlas Research Network 2014). Using ‘TCGABiolinks’ R package (Colaprico et al. 2016), we downloaded the level three RNA sequence data of PTC from TCGA data portal (https://portal.gdc.cancer.gov/) on Oct 12th, 2017, obtained with Illumina HiSeq RNASeqV2 (Illumina, San Diego, CA, USA). We then normalized mRNA transcripts using ‘TCGAAnalyze_Normalization’ function and the expression data of 19303 genes from 505 samples were used to estimate two key variables – immune cell enrichment score and thyroid differentiation score – for further analysis.
The corresponding clinicopathological data from TCGA dataset including stage, follow-up time and time of recurrence were downloaded from the website of The cBioPortal for Cancer Genomics (http://www.cbioportal.org/) on Oct 12th, 2017 (Gao et al. 2013). PTC recurrence was defined based on the histological/cytological/radiographical/biochemical criteria of new thyroid cancer tumor-related events. More specifically, patients with any types of new tumor events, including locoregional recurrent tumor, distant recurrent tumor and biochemical recurrent tumor, were identified as having disease recurrence (Haugen et al. 2016). The recurrence time was defined as the time interval from the date of disease recurrence or progression to the date of initial pathologic diagnosis. Patients who had no new thyroid tumor were treated as having no disease recurrence. The duration to the last follow-up was defined as time interval from the date the patient was seen or contacted at follow-up to the date of initial pathologic diagnosis.
Cell types enrichment analysis
The xCell tool (http://xcell.ucsf.edu/), a gene-signature-based method for inferring cell types from tissue transcriptome profiles, was used to evaluate the heterogeneous cellular landscape of TME of PTC (Aran et al. 2017). Using the normalized mRNA transcriptome data of 505 PTC samples, the xCell tool inferred immune and stroma cell types enrichment scores of TME. The log2-transformed composite score of overall immune cells, ImmuneScore, was also obtained. More
Downloaded from Bioscientifica.com at 11/01/2021 07:09:48AMvia free access

http://erc.endocrinology-journals.org © 2018 Society for Endocrinology
Printed in Great BritainPublished by Bioscientifica Ltd.https://doi.org/10.1530/ERC-17-0532
525K J Na and H Choi Immune landscape and differentiation of PTC
25:5Endocrine-Related Cancer
specifically, to obtain ImmuneScore, the sum of cell enrichment scores of B-cells, CD4+ T-cells, CD8+ T-cells, dendritic cells, eosinophils, macrophages, monocytes, mast cells, neutrophils and NK cells was calculated and log2-transformed.
TDS calculation
Loss of expression of thyroid differentiation markers is one of the hallmarks of advanced PTC and has profound consequences for the clinical management of these patients. TDS, which was developed to quantify relationships between thyroid differentiation and other genetic and clinicopathologic features by the TCGA group (Cancer Genome Atlas Research Network 2014), was calculated across all 505 PTC samples. The mRNA expression level of sixteen thyroid function genes (DIO1, DIO2, DUOX1, DUOX2, FOXE1, GLIS3, NKX2-1, PAX8, SLC26A4, SLC5A5, SLC5A8, TG, THRA, THRB, TPO, TSHR) were used to derive the TDS. The log2-normalized RSEM values, transcript values quantified by RSEM software package (Li & Dewey 2011), were first centered at the median across samples, and then summed across the 16 genes for each sample.
Statistical analysis
The correlation between ImmuneScore and TDS was calculated using the Pearson’s correlation. Correlation coefficients between ImmuneScore and TDS were calculated for BRAFV600E+ and BRAFV600E− groups, and they were statistically compared using Fisher r-to-z transformation. We compared ImmuneScore and TDS according to the BRAFV600E mutation by the Student’s t-test.
The correlation between immune cell enrichment scores and TDS was conducted by the Spearman’s correlation test as the distribution of each immune cell enrichment score was skewed. The Spearman’s correlation coefficients of BRAFV600E-positive and -negative groups were compared by a permutation test. Subjects were randomly permuted into two groups and the distribution of the difference of correlation coefficients was obtained. Statistical significance of the difference of correlation coefficients between two groups was directly calculated by the comparison with the distribution obtained by iteratively permuted samples. The multiple testing corrections were performed using the Bonferroni’s method. Each immune cell enrichment score of subgroups according to the BRAFV600E mutation was statistically compared using Mann–Whitney test with Bonferroni’s multiple testing corrections.
Expression of immunosuppressive molecular markers, CTLA-4, PD-L1 and HLA-G, was statistically compared according to TDS and the BRAFV600E mutation status. The correlation between TDS and immunosuppressive markers was conducted by the Pearson’s correlation test. We further divided subjects based on the median value of TDS and ImmuneScore to characterize the expression pattern of immunosuppressive markers. The expression of immunosuppressive markers between four groups was compared by one-way ANOVA, followed by the post hoc Tukey’s test. The expression level of immunosuppressive markers was also compared according to the BRAFV600E mutation status. The log2-transformed expression value of immunosuppressive markers was used for the aforementioned analysis.
The recurrence-free survival (RFS) rate was depicted with the Kaplan–Meier’s method and compared with the log-rank test. The survival analyses were performed in all subjects and in subgroups defined by T-stage, the existence of lymph node metastasis and the presence of the BRAFV600E mutation. Prognostic property of ImmuneScore for RFS was evaluated by univariate and multivariate Cox regression analysis. For all survival analysis, the subjects were divided into two groups based on the median value of ImmuneScore and RFS was compared between two groups.
Results
Baseline characteristics
The subjects were 369 female (73.1%) and 136 male (26.9%) with a mean age of 47.8 ± 15.8 years (range, 15.4–89.6). The distribution of stage according to the criteria established by the American Joint Committee on Cancer was as follows: T-stage distribution – T1 (28.9%), T2 (33.9%), T3 (33.3%), and T4 (3.9%); N stage distribution – N0 (50.8%), and N1 (49.2%); M stage distribution – M0 (96.9%) and M1 (3.1%). The BRAFV600E mutation was identified in 235 patients (46.5%). Median recurrence-free time was 14.3 months (0.0–158.7), and 28 subjects (6.6%) among 423 subjects with available survival data experienced recurrence. The detailed baseline characteristics are listed in Table 1.
ImmuneScore associated with TDS and the BRAFV600E mutation
ImmuneScore had significant negative correlation with TDS (r = −0.44, P < 1 × 10⁻¹⁵; Fig. 1A). The negative correlation was conserved independent of the presence
Downloaded from Bioscientifica.com at 11/01/2021 07:09:48AMvia free access

Printed in Great BritainPublished by Bioscientifica Ltd.https://doi.org/10.1530/ERC-17-0532
http://erc.endocrinology-journals.org © 2018 Society for Endocrinology
526K J Na and H Choi Immune landscape and differentiation of PTC
25:5Endocrine-Related Cancer
of the BRAFV600E mutation, but the correlation was significantly stronger for BRAFV600E− group (r = −0.18 and P = 0.005 for BRAFV600E+ group; r = −0.39 and P < 1 × 10⁻¹⁰ for BRAFV600E− group; P = 0.01 for comparison of correlation coefficients, Fig. 1A). ImmuneScore was significantly higher in BRAFV600E+ group (BRAFV600E+ group −4.41 ± 1.24 vs BRAFV600E− group −5.57 ± 1.84; P < .001; 95% CI 0.88–1.44; Fig. 1B). Moreover, TDS was significantly lower in BRAFV600E+ group (BRAFV600E+ group −0.70 ± 0.78 vs BRAFV600E− group 0.50 ± 1.15; P < 1 × 10⁻¹⁵; 95% CI 1.03–1.38; Fig. 1C). Conclusively, high ImmuneScore, which represents enriched immune cells in TME, were associated with low TDS and the BRAFV600E mutation.
Immune cell enrichment scores according to TDS
In order to investigate immune landscape according to PTC profiles, individual immune cell enrichment scores
according to TDS was visualized by a heatmap (Fig. 2A). We further analyzed the correlation between individual immune cell enrichment scores and TDS (Fig. 2B). There was a strong negative correlation between TDS and myeloid cells such as macrophage, dendritic cells and mast cells (r = −0.35, −0.49 and −0.35, respectively; Bonferroni corrected P < 0.05). This relationship was only demonstrated in BRAFV600E− group (r = −0.37, −0.49, and −0.233, respectively). Plasma cell showed strong positive correlation with TDS, especially in BRAFV600E− group (r = 0.34 for all samples and r = 0.44 for BRAFV600E− group; Bonferroni corrected P < 0.05), while B-cells showed significant negative correlation with TDS (r = −0.34 for all samples). Statistical comparison showed that correlation coefficients of plasma cells (P < 0.001), macrophages (P = 0.004), dendritic cells (P = 0.001) and mast cells (P = 0.01) were significantly different between BRAFV600E+ and BRAFV600E− groups.
In addition, individual immune cell enrichment scores were compared according to the presence of the BRAFV600E mutation. Myeloid cells (macrophage, dendritic cell, neutrophil and mast cell), B-cell and regulatory T-cells were significantly higher in BRAFV600E+ group and plasma cells were significantly higher in BRAFV600E− group (Supplementary Fig. 1, see section on supplementary data given at the end of this article). Briefly, relatively low differentiation of PTC was associated with higher immune infiltration particularly for myeloid subtypes and relatively lower effector lymphocytes such as plasma cells.
TDS and expression of immunosuppressive markers
We investigated whether TDS is associated with expression of immunosuppressive markers including CTLA-4, PD-L1 and HLA-G. TDS was significantly associated with decreased expression of immunosuppressive markers (Fig. 3A, B and C). TDS demonstrated strong negative correlation with CTLA-4 (r = −0.47, P < 1 × 10⁻¹⁵), PD-L1 (r = −0.33, P < 1 × 10⁻¹³) and HLA-G (r = −0.50, P < 1 × 10⁻¹⁵). The immunosuppressive markers were significantly different according to the BRAFV600E mutation status (Fig. 3D, E and F). The three markers were significantly higher in BRAFV600E+ group (t = −6.45, P < 1 × 10⁻⁹ for CTLA-4; t = −7.66, P < 1 × 10⁻¹³ for PD-L1; t = −5.54, P < 1 × 10⁻⁷ for HLA-G).
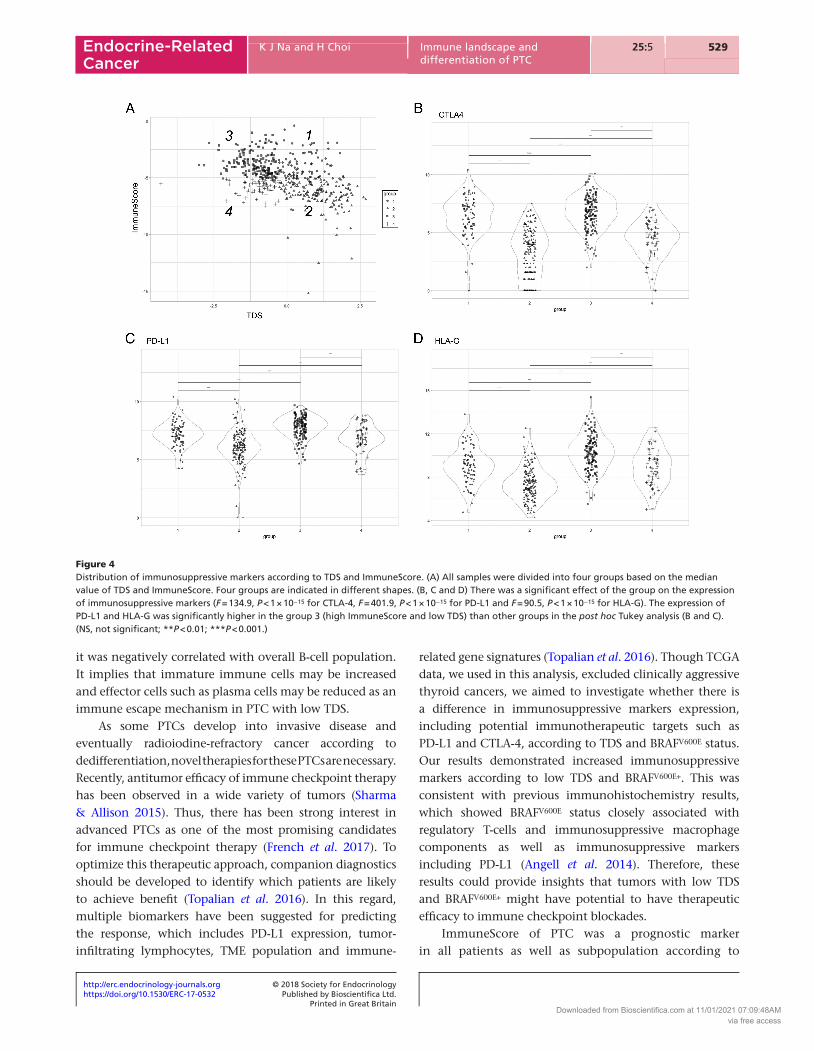
Immunosuppressive markers were compared between four groups divided by the median values of TDS and ImmuneScore (Fig. 4A). There was a significant effect
Table 1 Demographic and baseline clinical characteristics of
TCGA PTC data used in this study.
Variables
TCGA PTC data (n = 505)
Available data
Sex Female:Male 369:136 (73.1%:26.9%) 505Age (years) 47.8 ± 15.8 (15.4–89.6) 505T stage T1 134 (28.9%) 463 T2 157 (33.9%) T3 154 (33.3%) T4 18 (3.9%)N stage N0 213 (50.8%) 419 N1 206 (49.2%)M stage M0 249 (96.9%) 257 M1 8 (3.1%)BRAFV600E
Negative 270 (53.5%) 505 Positive 235 (46.5%)Histologic Classical 323 (69.5%) 465Subtypes Follicular 99 (21.3%) Tall cell 34 (7.3%) Others 9 (1.9%)Stage 1 284 (56.5%) 503 2 52 (10.3%) 3 112 (22.3%) 4 55 (10.9%)Status Recurrence 28 (6.6%) 423Recurrence-free time
(months)14.3 (0.0–158.7) 423
PTC, papillary thyroid cancer; TCGA, The Cancer Genome Atlas.
Downloaded from Bioscientifica.com at 11/01/2021 07:09:48AMvia free access

http://erc.endocrinology-journals.org © 2018 Society for Endocrinology
Printed in Great BritainPublished by Bioscientifica Ltd.https://doi.org/10.1530/ERC-17-0532
527K J Na and H Choi Immune landscape and differentiation of PTC
25:5Endocrine-Related Cancer
of the group on immunosuppressive markers (F = 134.9, P < 1 × 10⁻¹⁵ for CTLA-4, F = 401.9, P < 1 × 10⁻¹⁵ for PD-L1 and F = 90.5, P < 1 × 10⁻¹⁵ for HLA-G; Fig. 4B, C and D). Post hoc analyses revealed that all between-group differences were statistically significant except CTLA-4 expression between groups 1 and 3 (Fig. 4B, C and D). Specifically, expression of PD-L1 and HLA-G was significantly higher in the group 3 (high ImmuneScore and low TDS) than the other groups (post hoc Tukey multiple comparison P < .001; Fig. 4C and D).
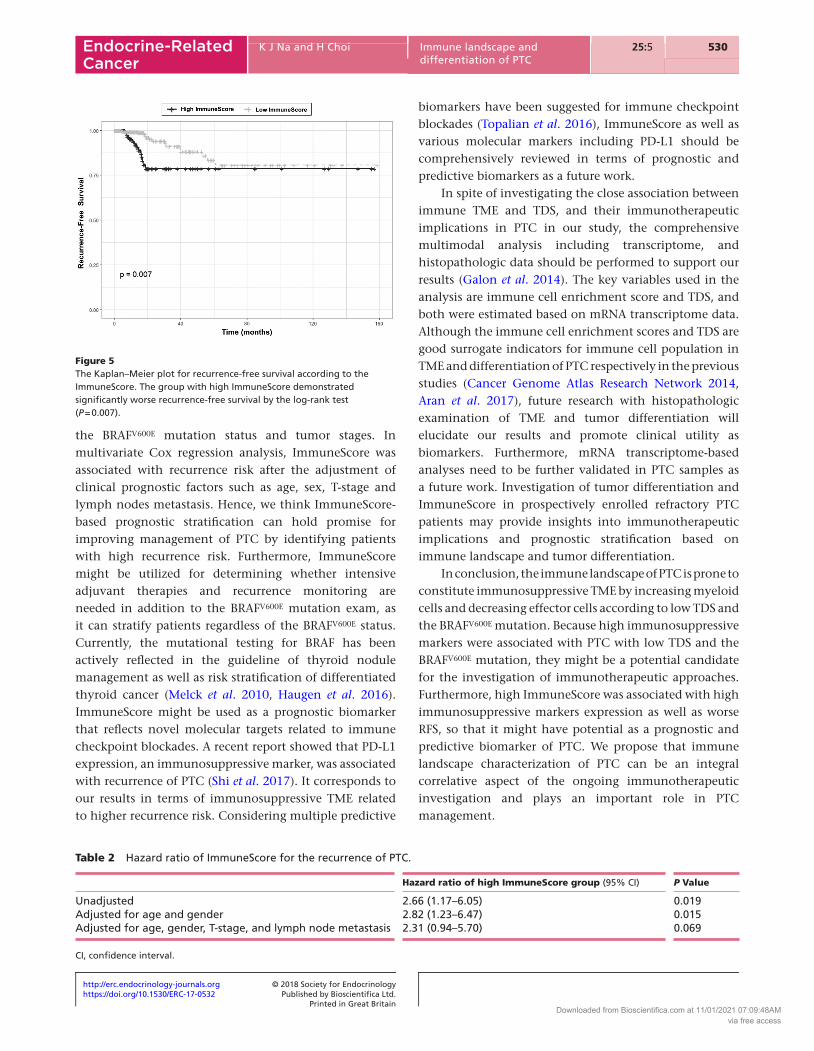
Recurrence-free survival analysis
In all patients, the high ImmuneScore groups demonstrated worse RFS than the low ImmuneScore group (P = 0.007; Fig. 5). We further analyzed whether ImmuneScore was associated with RFS in subgroups according to other clinical variables (Supplementary Fig. 2). ImmuneScore was significantly associated with RFS in the subgroup with T1 and T2 stages and the subgroup with lymph node metastasis (P = 0.04 and 0.007, respectively). In addition,
Figure 1Tumor differentiation score (TDS) and ImmuneScore. (A) TDS and ImmuneScore revealed significant negative correlation (r = −0.44, P < 1 × 10⁻¹⁵), especially in BRAFV600E− group (r = −0.39 and P < 1 × 10⁻¹⁰; red line). (B and C) ImmuneScore was significantly higher in BRAFV600E+ group (P < 0.001), whereas TDS was significantly lower in BRAFV600E+ group (P < 1 × 10⁻¹⁵). (***P < 0.001; BRAFV600E+ group (n = 235); BRAFV600E− group (n = 270)).
Figure 2Immune cell enrichment score and its association with TDS. (A) The heatmap representing immune cell enrichment scores of PTC samples from The Cancer Genome Atlas. TDS, the presence of the BRAFV600E mutation, histologic subtypes and ImmuneScore are shown for each sample in different color scales (above the heatmap). (B) The Spearman’s rank correlation matrix representing the relationship between TDS and individual immune cell enrichment scores. The colors of the scale bar denote the nature of the correlation with a positive correlation in blue scale and negative correlation in red scale, and the ellipse with asterisks means statistically significant. The ellipses have their eccentricity parametrically scaled to the correlation coefficient value. Note that † represents the cell types which show significantly different correlation with TDS between BRAFV600E+ and BRAFV600E− subgroups. (DC, dendritic cell; Treg, regulatory T-cell.)
Downloaded from Bioscientifica.com at 11/01/2021 07:09:48AMvia free access

Printed in Great BritainPublished by Bioscientifica Ltd.https://doi.org/10.1530/ERC-17-0532
http://erc.endocrinology-journals.org © 2018 Society for Endocrinology
528K J Na and H Choi Immune landscape and differentiation of PTC
25:5Endocrine-Related Cancer
there was a trend of the association between ImmuneScore and RFS regardless of the BRAFV600E mutation status. (Supplementary Fig. 3; P = 0.04 for BRAFV600E− group and P = 0.16 for BRAFV600E+ group). Table 2 shows the hazard ratios of the impacts of ImmuneScore on PTC recurrence. The high ImmuneScore group alone demonstrated significant impact on PTC recurrence (HR = 2.66; CI 1.17–60.5; P = 0.019) and maintained the significance after adjustment for age and gender (HR = 2.82; CI 1.23–6.47; P = 0.012). After the additional adjustment for T-stage and lymph node metastasis, the high ImmuneScore group showed a trend of worse RFS with borderline significance (HR = 2.31; CI 0.94–5.70; P = 0.069).
Discussion
In this study, we estimated immune cell enrichment scores and differentiation of PTC using gene expression data and analyzed the immune landscape of PTC in accordance with TDS and BRAFV600E mutations. As a result, the BRAFV600E mutation was associated with increased overall immune infiltration signature, ImmuneScore. In addition, ImmuneScore was positively correlated with TDS. The principle of immunosurveillance of tumors can be summarized by tumor regression mediated by immunological effector cells, while progression of cancers
mediated by immunosuppressive cells (Schreiber et al. 2011, Landa et al. 2016). In terms of the immunoediting in accordance with oncogenesis, thyroid cancers with relatively worse prognosis can constitute TME that enables escape from immunosurveillance by evolving into genetically modified cancer cells. In this regard, we showed that immune cell enrichment scores were increased in the PTCs with low TDS and BRAFV600E mutation. This result corresponds to the recent report of the association between the BRAFV600E mutation in PTC and suppressive immune cell infiltration (Angell et al. 2014). To further elaborate, we elucidated specific types of immune cell populations contributed to immunosuppressive TME. Enrichment scores of myeloid cells including dendritic cells, macrophages and mast cells were increased in PTC with low TDS and PTC with the BRAFV600E mutation. These findings were consistent with some previous experimental studies aiming at the association between each cell type and aggressiveness of PTC (Hilly et al. 2013, Yu et al. 2013, Angell et al. 2014, Tran Janco et al. 2015). Although dendritic cells are rarely found in normal thyroid tissues, they are increased in PTC and often adopt immature phenotypes, which inhibit immune responses (Hilly et al. 2013, Tran Janco et al. 2015). Tumor-associated macrophages are also associated with tumor invasiveness and decreased survival (Ryder et al. 2008). Of note, TDS was positively correlated with plasma cells, while
Figure 3Correlation of immunosuppressive markers with TDS and the BRAFV600E status in papillary thyroid cancer. (A, B and C) TDS demonstrated significant negative correlation with the expression of CTLA-4 (A), PD-L1 (B) and HLA-G (C). The linear regression line (solid) and 95% confidence interval (gray area) are shown. (D, E and F) The expression of immunosuppressive markers is significantly high in BRAFV600E+ group (***P < 0.001).
Downloaded from Bioscientifica.com at 11/01/2021 07:09:48AMvia free access
http://erc.endocrinology-journals.org © 2018 Society for Endocrinology
Printed in Great BritainPublished by Bioscientifica Ltd.https://doi.org/10.1530/ERC-17-0532
529K J Na and H Choi Immune landscape and differentiation of PTC
25:5Endocrine-Related Cancer
it was negatively correlated with overall B-cell population. It implies that immature immune cells may be increased and effector cells such as plasma cells may be reduced as an immune escape mechanism in PTC with low TDS.
As some PTCs develop into invasive disease and eventually radioiodine-refractory cancer according to dedifferentiation, novel therapies for these PTCs are necessary. Recently, antitumor efficacy of immune checkpoint therapy has been observed in a wide variety of tumors (Sharma & Allison 2015). Thus, there has been strong interest in advanced PTCs as one of the most promising candidates for immune checkpoint therapy (French et al. 2017). To optimize this therapeutic approach, companion diagnostics should be developed to identify which patients are likely to achieve benefit (Topalian et al. 2016). In this regard, multiple biomarkers have been suggested for predicting the response, which includes PD-L1 expression, tumor-infiltrating lymphocytes, TME population and immune-
related gene signatures (Topalian et al. 2016). Though TCGA data, we used in this analysis, excluded clinically aggressive thyroid cancers, we aimed to investigate whether there is a difference in immunosuppressive markers expression, including potential immunotherapeutic targets such as PD-L1 and CTLA-4, according to TDS and BRAFV600E status. Our results demonstrated increased immunosuppressive markers according to low TDS and BRAFV600E+. This was consistent with previous immunohistochemistry results, which showed BRAFV600E status closely associated with regulatory T-cells and immunosuppressive macrophage components as well as immunosuppressive markers including PD-L1 (Angell et al. 2014). Therefore, these results could provide insights that tumors with low TDS and BRAFV600E+ might have potential to have therapeutic efficacy to immune checkpoint blockades.
ImmuneScore of PTC was a prognostic marker in all patients as well as subpopulation according to
Figure 4Distribution of immunosuppressive markers according to TDS and ImmuneScore. (A) All samples were divided into four groups based on the median value of TDS and ImmuneScore. Four groups are indicated in different shapes. (B, C and D) There was a significant effect of the group on the expression of immunosuppressive markers (F = 134.9, P < 1 × 10⁻¹⁵ for CTLA-4, F = 401.9, P < 1 × 10⁻¹⁵ for PD-L1 and F = 90.5, P < 1 × 10⁻¹⁵ for HLA-G). The expression of PD-L1 and HLA-G was significantly higher in the group 3 (high ImmuneScore and low TDS) than other groups in the post hoc Tukey analysis (B and C). (NS, not significant; **P < 0.01; ***P < 0.001.)
Downloaded from Bioscientifica.com at 11/01/2021 07:09:48AMvia free access
Printed in Great BritainPublished by Bioscientifica Ltd.https://doi.org/10.1530/ERC-17-0532
http://erc.endocrinology-journals.org © 2018 Society for Endocrinology
530K J Na and H Choi Immune landscape and differentiation of PTC
25:5Endocrine-Related Cancer
the BRAFV600E mutation status and tumor stages. In multivariate Cox regression analysis, ImmuneScore was associated with recurrence risk after the adjustment of clinical prognostic factors such as age, sex, T-stage and lymph nodes metastasis. Hence, we think ImmuneScore-based prognostic stratification can hold promise for improving management of PTC by identifying patients with high recurrence risk. Furthermore, ImmuneScore might be utilized for determining whether intensive adjuvant therapies and recurrence monitoring are needed in addition to the BRAFV600E mutation exam, as it can stratify patients regardless of the BRAFV600E status. Currently, the mutational testing for BRAF has been actively reflected in the guideline of thyroid nodule management as well as risk stratification of differentiated thyroid cancer (Melck et al. 2010, Haugen et al. 2016). ImmuneScore might be used as a prognostic biomarker that reflects novel molecular targets related to immune checkpoint blockades. A recent report showed that PD-L1 expression, an immunosuppressive marker, was associated with recurrence of PTC (Shi et al. 2017). It corresponds to our results in terms of immunosuppressive TME related to higher recurrence risk. Considering multiple predictive
biomarkers have been suggested for immune checkpoint blockades (Topalian et al. 2016), ImmuneScore as well as various molecular markers including PD-L1 should be comprehensively reviewed in terms of prognostic and predictive biomarkers as a future work.
In spite of investigating the close association between immune TME and TDS, and their immunotherapeutic implications in PTC in our study, the comprehensive multimodal analysis including transcriptome, and histopathologic data should be performed to support our results (Galon et al. 2014). The key variables used in the analysis are immune cell enrichment score and TDS, and both were estimated based on mRNA transcriptome data. Although the immune cell enrichment scores and TDS are good surrogate indicators for immune cell population in TME and differentiation of PTC respectively in the previous studies (Cancer Genome Atlas Research Network 2014, Aran et al. 2017), future research with histopathologic examination of TME and tumor differentiation will elucidate our results and promote clinical utility as biomarkers. Furthermore, mRNA transcriptome-based analyses need to be further validated in PTC samples as a future work. Investigation of tumor differentiation and ImmuneScore in prospectively enrolled refractory PTC patients may provide insights into immunotherapeutic implications and prognostic stratification based on immune landscape and tumor differentiation.
In conclusion, the immune landscape of PTC is prone to constitute immunosuppressive TME by increasing myeloid cells and decreasing effector cells according to low TDS and the BRAFV600E mutation. Because high immunosuppressive markers were associated with PTC with low TDS and the BRAFV600E mutation, they might be a potential candidate for the investigation of immunotherapeutic approaches. Furthermore, high ImmuneScore was associated with high immunosuppressive markers expression as well as worse RFS, so that it might have potential as a prognostic and predictive biomarker of PTC. We propose that immune landscape characterization of PTC can be an integral correlative aspect of the ongoing immunotherapeutic investigation and plays an important role in PTC management.
Figure 5The Kaplan–Meier plot for recurrence-free survival according to the ImmuneScore. The group with high ImmuneScore demonstrated significantly worse recurrence-free survival by the log-rank test (P = 0.007).
Table 2 Hazard ratio of ImmuneScore for the recurrence of PTC.
Hazard ratio of high ImmuneScore group (95% CI) P Value
Unadjusted 2.66 (1.17–6.05) 0.019Adjusted for age and gender 2.82 (1.23–6.47) 0.015Adjusted for age, gender, T-stage, and lymph node metastasis 2.31 (0.94–5.70) 0.069
CI, confidence interval.
Downloaded from Bioscientifica.com at 11/01/2021 07:09:48AMvia free access

http://erc.endocrinology-journals.org © 2018 Society for Endocrinology
Printed in Great BritainPublished by Bioscientifica Ltd.https://doi.org/10.1530/ERC-17-0532
531K J Na and H Choi Immune landscape and differentiation of PTC
25:5Endocrine-Related Cancer
Supplementary dataThis is linked to the online version of the paper at https://doi.org/10.1530/ERC-17-0532.
Declaration of interestThe authors declare that there is no conflict of interest that could be perceived as prejudicing the impartiality of the research reported.
FundingThis research received no specific grant from any funding agency in the public, commercial, or not-for-profit sectors.
AcknowledgementThe results here are in whole based upon data generated by the TCGA Research Network: ‘http://cancergenome.nih.gov/’.
ReferencesAngell TE, Lechner MG, Jang JK, Correa AJ, LoPresti JS & Epstein AL
2014 BRAF V600E in papillary thyroid carcinoma is associated with increased programmed death ligand 1 expression and suppressive immune cell infiltration. Thyroid 24 1385–1393. (https://doi.org/10.1089/thy.2014.0134)
Aran D, Hu Z & Butte AJ 2017 xCell: digitally portraying the tissue cellular heterogeneity landscape. Genome Biology 18 220. (https://doi.org/10.1186/s13059-017-1349-1)
Cancer Genome Atlas Research Network 2014 Integrated genomic characterization of papillary thyroid carcinoma. Cell 159 676–690. (https://doi.org/10.1016/j.cell.2014.09.050)
Chen AY, Jemal A & Ward EM 2009 Increasing incidence of differentiated thyroid cancer in the United States, 1988–2005. Cancer 115 3801–3807. (https://doi.org/10.1002/cncr.24416)
Colaprico A, Silva TC, Olsen C, Garofano L, Cava C, Garolini D, Sabedot TS, Malta TM, Pagnotta SM & Castiglioni I 2016 TCGAbiolinks: an R/Bioconductor package for integrative analysis of TCGA data. Nucleic Acids Research 44 e71. (https://doi.org/10.1093/nar/gkv1507)
Crespo J, Sun H, Welling TH, Tian Z & Zou W 2013 T cell anergy, exhaustion, senescence, and stemness in the tumor microenvironment. Current Opinion in Immunology 25 214–221. (https://doi.org/10.1016/j.coi.2012.12.003)
French JD, Bible K, Spitzweg C, Haugen BR & Ryder M 2017 Leveraging the immune system to treat advanced thyroid cancers. Lancet Diabetes and Endocrinology 5 469–481. (https://doi.org/10.1016/S2213-8587(16)30277-7)
Galon J, Mlecnik B, Bindea G, Angell HK, Berger A, Lagorce C, Lugli A, Zlobec I, Hartmann A & Bifulco C 2014 Towards the introduction of the ‘Immunoscore’ in the classification of malignant tumours. Journal of Pathology 232 199–209. (https://doi.org/10.1002/path.4287)
Gao J, Aksoy BA, Dogrusoz U, Dresdner G, Gross B, Sumer SO, Sun Y, Jacobsen A, Sinha R & Larsson E 2013 Integrative analysis of complex cancer genomics and clinical profiles using the cBioPortal. Science Signaling 6 pl1. (https://doi.org/10.1126/scisignal.2004088)
Haugen BR, Alexander EK, Bible KC, Doherty GM, Mandel SJ, Nikiforov YE, Pacini F, Randolph GW, Sawka AM & Schlumberger M 2016 2015 American Thyroid Association management guidelines for adult patients with thyroid nodules and differentiated thyroid
cancer: the American Thyroid Association guidelines task force on thyroid nodules and differentiated thyroid cancer. Thyroid 26 1–133. (https://doi.org/10.1089/thy.2015.0020)
Hilly O, Koren R, Raz R, Rath-Wolfson L, Mizrachi A, Hamzany Y, Bachar G & Shpitzer T 2013 The role of s100-positive dendritic cells in the prognosis of papillary thyroid carcinoma. American Journal of Clinical Pathology 139 87–92. (https://doi.org/10.1309/AJCPAKYDO56NKMYZ)
Joyce JA & Fearon DT 2015 T cell exclusion, immune privilege, and the tumor microenvironment. Science 348 74–80. (https://doi.org/10.1126/science.aaa6204)
Landa I, Ibrahimpasic T, Boucai L, Sinha R, Knauf JA, Shah RH, Dogan S, Ricarte-Filho JC, Krishnamoorthy GP, Xu B, et al. 2016 Genomic and transcriptomic hallmarks of poorly differentiated and anaplastic thyroid cancers. Journal of Clinical Investigation 126 1052–1066. (https://doi.org/10.1172/JCI85271)
Li B & Dewey CN 2011 RSEM: accurate transcript quantification from RNA-Seq data with or without a reference genome. BMC Bioinformatics 12 323. (https://doi.org/10.1186/1471-2105-12-323)
Melck AL, Yip L & Carty SE 2010 The utility of BRAF testing in the management of papillary thyroid cancer. Oncologist 15 1285–1293. (https://doi.org/10.1634/theoncologist.2010-0156)
Postow MA, Callahan MK & Wolchok JD 2015 Immune checkpoint blockade in cancer therapy. Journal of Clinical Oncology 33 1974–1982. (https://doi.org/10.1200/JCO.2014.59.4358)
Ryder M, Ghossein RA, Ricarte-Filho JC, Knauf JA & Fagin JA 2008 Increased density of tumor-associated macrophages is associated with decreased survival in advanced thyroid cancer. Endocrine-Related Cancer 15 1069–1074. (https://doi.org/10.1677/ERC-08-0036)
Schreiber RD, Old LJ & Smyth MJ 2011 Cancer immunoediting: integrating immunity’s roles in cancer suppression and promotion. Science 331 1565–1570. (https://doi.org/10.1126/science.1203486)
Sharma P & Allison JP 2015 Immune checkpoint targeting in cancer therapy: toward combination strategies with curative potential. Cell 161 205–214. (https://doi.org/10.1016/j.cell.2015.03.030)
Sherma SI 2003 Thyroid carcinoma. Lancet 361 501–511. (https://doi.org/10.1016/S0140-6736(03)12488-9)
Shi RL, Qu N, Luo TX, Xiang J, Liao T, Sun GH, Wang Y, Wang YL, Huang CP & Ji QH 2017 Programmed death-ligand 1 expression in papillary thyroid cancer and its correlation with clinicopathologic factors and recurrence. Thyroid 27 537–545. (https://doi.org/10.1089/thy.2016.0228)
Siegel RL, Miller KD & Jemal A 2016 Cancer statistics, 2016. CA: A Cancer Journal for Clinicians 66 7–30. (https://doi.org/10.3322/caac.21332)
Sipos J & Mazzaferri E 2010 Thyroid cancer epidemiology and prognostic variables. Clinical Oncology 22 395–404. (https://doi.org/10.1016/j.clon.2010.05.004)
Topalian SL, Taube JM, Anders RA & Pardoll DM 2016 Mechanism-driven biomarkers to guide immune checkpoint blockade in cancer therapy. Nature Reviews Cancer 16 275–287. (https://doi.org/10.1038/nrc.2016.36)
Tran Janco JM, Lamichhane P, Karyampudi L & Knutson KL 2015 Tumor-infiltrating dendritic cells in cancer pathogenesis. Journal of Immunology 194 2985–2991. (https://doi.org/10.4049/jimmunol.1403134)
Yu H, Huang X, Liu X, Jin H, Zhang G, Zhang Q & Yu J 2013 Regulatory T cells and plasmacytoid dendritic cells contribute to the immune escape of papillary thyroid cancer coexisting with multinodular non-toxic goiter. Endocrine 44 172–181. (https://doi.org/10.1007/s12020-012-9853-2)
Received in final form 22 February 2018Accepted 5 March 2018Accepted Preprint published online 5 March 2018
Downloaded from Bioscientifica.com at 11/01/2021 07:09:48AMvia free access


![Papillary thyroid carcinoma coexists with undifferentiated ... · Papillary thyroid carcinoma (PTC) is the commonest thyroid carcinoma worldwide [1], while undifferentiated thyroid](https://static.fdocuments.net/doc/165x107/605714f9a806da25134f71a8/papillary-thyroid-carcinoma-coexists-with-undifferentiated-papillary-thyroid.jpg)