IMMUNE ESCAPE MECHANISMS IN HEMATOLOGICAL DISEASES: …
68
1 UNIVERSITÀ DEGLI STUDI DI CATANIA DOTTORATO DI RICERCA IN BASIC AND APPLIED BIOMEDICAL SCIENCES XXX CICLO Coordinatore: Prof. Massimo Libra IMMUNE ESCAPE MECHANISMS IN HEMATOLOGICAL DISEASES: ROLE OF THE MYELOID DERIVED SUPPRESSOR CELLS AND TUMOR MICROENVIRONMENT Dottorando: Dott.ssa Cesarina Giallongo Docente: Chiar.mo Prof. Roberto Avola ANNO ACCADEMICO 2016-2017
Transcript of IMMUNE ESCAPE MECHANISMS IN HEMATOLOGICAL DISEASES: …

1
UNIVERSITÀ DEGLI STUDI DI CATANIA
DOTTORATO DI RICERCA
IN
BASIC AND APPLIED BIOMEDICAL SCIENCES
XXX CICLO
Coordinatore: Prof. Massimo Libra
IMMUNE ESCAPE MECHANISMS IN
HEMATOLOGICAL DISEASES:
ROLE OF THE MYELOID DERIVED SUPPRESSOR CELLS
AND TUMOR MICROENVIRONMENT
Dottorando: Dott.ssa Cesarina Giallongo
Docente: Chiar.mo Prof. Roberto Avola
ANNO ACCADEMICO 2016-2017

2
SUMMARY BACKGROUND .................................................................................................................. 3
The tumor microenvironment as immunological barrier ................................................ 5
1. Myeloid-derived suppressor cells (MDSC) .................................................................. 5
2. Neutrophils.................................................................................................................. 7
3. Mesenchymal stem cells (MSC) and Cancer associated fibroblasts (CAF) ................. 9
Immune escape in haematological diseases .................................................................. 10
1.1 Chronic myeloid leukemia ....................................................................................... 14
1.2 Multiple Myeloma ................................................................................................... 15
AIM .................................................................................................................................... 17
MATERIAL AND METHODS ......................................................................................... 18
SECTION-1 (S-1) .......................................................................................................... 18
SECTION-2 (S-2) .......................................................................................................... 23
RESULTS ........................................................................................................................... 28
1. SECTION 1 ................................................................................................................. 28
1.1 MDSC are increased in CML patients ..................................................................... 28
1.2 M-MDSC percentage correlates with MMR in dasatinb treated patients .................. 30
1.3 CML cells are able to induce M-MDSC by secreting soluble factors ......................... 32
1.4 CML-derived exosomes promote M-MDSC expansion .............................................. 33
2. SECTION 2 ................................................................................................................. 34
2.1 CML-MSC activate immature myeloid cells (IMC) in immunosuppressive
neutrophils ......................................................................................................................... 34
2.1.1 N2 polarization is driven by disfunctional MSC .................................................. 34
2.1.2 CML-MSC up-regulate immunomodulatory factors ............................................ 36
2.1.3 Gene expression of immunomodulatory factors in CML-MSC educated-neutrophils
............................................................................................................................................ 37
2.2 Mesenchymal Stromal Cells (MSC) as key players in promoting immunune
escape and tumor microenvironment transformation from MGUS to Myeloma ............ 37
2.2.1 MM-MSC polarized neutrophils versus a “N2” phenotype .................................. 37
2.2.2 Molecular regulators of MM-MSC-mediated neutrophils activation .................... 39
2.2.3 MM-MSC educated neutrophils promote angiogenesis in vitro ............................. 40
2.2.4 TLR4 signaling activates healthy MSC in stromal cells with the same functional
alteration of MM-MSC ......................................................................................................... 40
2.2.5 MSC “activation” is induced by MM cells ............................................................. 42

3
2.2.6 MM-MSC favour tumor engraftment and immune escape in vivo ........................... 44
DISCUSSION ..................................................................................................................... 46
SUPPLENTARY FIGURES ............................................................................................. 56
REFERENCES .................................................................................................................. 58

4
BACKGROUND The interactions between the immune system and the tumor cells occur through complex
events that lead to tumor eradication or immune evasion by cancer [1]. Generally, CD8+
cytotoxic T and CD4+ helper T lymphocytes inhibit tumor development by production of
interferon (IFN)- and cytotoxins [2], but chronic inflammation and immune suppressive
factors may promote cancer development [3]. In fact, chronic inflammation within the tumor
microenvironment inhibits tumor elimination and enhance transformation of cancer. NFKB
signaling in hematopoietic cells has been reported to play a critical pro-carcinogenic role
producing various pro-inflammatory cytokines and chemokines (such as TNF, IL1, IL6, and
CSF1, type I interferons and IL8) that promote carcinogenesis [4]. Immune system plays a
critical role with a dual capacity to both promote and suppress tumor growth. It is well
established that tumor cells differ from their normal counterparts in antigenic composition.
The immune system is able to recognize and destroy the most vulnerable cancer cells [5], but,
on the contrary of not transformed cells which maintain a stable antigenic profile, new
antigens are constantly generated in tumor cells as a consequence of genetic instability. Until
there is a balance between immune control and tumor growth, the tumor dormancy is
maintained [6]. However, tumor cells can evade the immune response through multiple
mechanisms, resulting in overt clinical cancer.
Inhibition of tumor antigen presentation
Genetic and epigenetic alterations that are characteristic of all cancers provide a diverse set of
antigens that the immune system can use to distinguish tumour cells from their normal
counterparts [7]. In addition to antigen loss, downregulation of proteosome subunits
transporter associated with antigen presentation (TAP) [8, 9] or mutation or deletion of B2-
microglobulin genes [10, 11] can inhibit presentation of MHC-peptide complexes on surface
of tumor cells [12].
Immune checkpoints
Immune checkpoints are crucial for the maintenance of self-tolerance to avoid autoimmunity
and protect tissues from damage when the immune system is responding to infection [7].
Tumors dysregulate expression of immune-checkpoint proteins which are co-stimulatory and
inhibitory signals that regulate T cell receptors (TCR)[13]. Indeed, inhibitory ligands
regulating T cell effector functions are commonly overexpressed on tumour cells or on non-
transformed cells in the tumour microenvironment (fig1).

5
Pardoll. Nat Rev Cancer;2012
Figure 1. Co-stimulatory and inhibitory interactions which regulate T cell responses. Communication
between T cells and antigen presenting cells (APC) is bidirectional. A2aR, adenosine A2a receptor; B7RP1, B7-
related protein 1; BTLA, B and T lymphocyte attenuator; GAL9, galectin 9; HVEM, herpes virus entry
mediator; ICOS, inducible T cell co-stimulator; IL, interleukin; KIR, killer cell immunoglobulin-like receptor;
LAG3, lymphocyte activation gene 3; PD1, programmed cell death protein 1; PDL, PD1 ligand; TGFβ,
transforming growth factor-β; TIM3, T cell membrane protein 3.
PD1 is one of the most studied immune checkpoint; it is expressed on a large proportion of
tumour-infiltrating lymphocytes. By upregulating ligands for PD1 (PDL1), cancer cells inhibit
antitumour immune responses. Several clinical trials of PD-1/PD-L1 signal-blockade agents
have exhibited dramatic antitumor efficacy in patients with certain types of solid or
hematological malignancies [14].

6
Enzymes as immune-inhibitory molecules
Another category of immune-inhibitory molecules includes metabolic enzymes, such as
arginase 1 and indoleamine 2,3-dioxygenase (IDO). IDO is expressed by both tumour cells
and infiltrating myeloid cells and inhibits immune responses through depletion of aminoacids
essential for T cells activation and proliferation.
The tumor microenvironment as immunological barrier
The tumor microenvironment, once established, represents a consistently effective barrier to
immune cell functions. Some mechanisms responsible for immune suppression are directly
mediated by factors produced by tumors, whereas others result from alterations of normal
tissue homeostasis occurring in the presence of cancer. Immune cells have also been
identified as contributing to the tumor-associated microenvironment via dysregulation of
immune-mediated responses. Macrophages, dendritic cells, natural killer (NK) cells, myeloid-
derived suppressor cells, and regulatory T cells (T regs) are the first cells attracted and recruited
in the site of injury and have all been shown to contribute toward the polarization of a pro-
tumorigenic microenvironment [15].
1. Myeloid-derived suppressor cells (MDSC)
MDSCs have myeloid origin, an immature state and are characterized by their potent ability
to suppress immune responses, especially T cell proliferation and cytokine production [16].
MDSC were firstly identified in tumor-bearing mice by the expression of CD11b and Gr-1.
The mAb used to identify Gr1, however, is able to bind the same epitope of two different
molecules belonging to the lymphocyte superfamily (Ly)-6, Ly-6C and Ly-6G, mainly
expressed on monocytes and neutrophils respectively, resulting in the identification of two
subtypes of murine MDSC: CD11b + Ly-6C+ Ly-6G - monocytic-like MDSC and CD11b + Ly-
6C- Ly-6G+ granulocytic-like MDSC [17, 18]. As in mice, two main subsets of human MDSC
have been identified: CD14+HLA-DRlow/- M-MDSC and CD15+
CD14-
CD11b+
CD33+
HLA-DRlow/-
G-MDSC. However, on the contrary of M-MDSC subset, human G-MDSC
represent a more heterogeneous population identified by a set of antigens (CD11b, CD14,
CD15, CD33, CD66b, CD16 and HLA-DR) which are well established markers for mature
neutrophils or polymorphonuclear neutrophils (PMN) [19, 20]. In contrast to conventional
PMN collected from the normal density neutrophil fraction on top of red cells after ficoll
separation, G-MDSC are purified from the mononuclear cell fraction (fig.2). Therefore, G-
MDSCs are defined as low-density immature cells with neutrophil-like morphology [21, 22].

7
Scapini and Cassatella. Blood; 2014.
Figure 2. Circulating immature neutrophils (LDNs) and mature neutrophils (NDNs) isolation after ficoll
separation.
Both M-MDSC and G-MDSC apply antigen-specific and antigen non-specific mechanisms to
regulate immune responses, although these mechanisms are not exclusively used by one of the
two subtypes [16, 23]. MDSC-induced immune suppression is mediated primarily by the
upregulation of nitric oxide synthase 2 (NOS2), reactive oxygen species (ROS) and
overexpression of arginase 1 [24, 25] (fig.3). Moreover, up-regulation of cyclooxigenase-2
and prostaglandin E2 [26], induction of regulatory T cells [27-29], up-regulation of TGF-β
[30], depletion of cystein [31], down-regulation of T cell L-selectin expression [32],
inhibition of NK function via downregulation of the activating receptor NKG2D [33] have
been described. The specific mechanisms used by MDSC are dependent on the context of the
microenvironment [34].
Accumulation of MDSC has been described in both solid tumors and hematological
malignancies [35]. Tumor progression is frequently associated with their expansion in the
peripheral blood (PB), spleen, and tumor [36].
8
I. Poschke, R. Kiessling; Clinical Immunology 2012
Figure 3. Model of MDSC function in cancer patients. MDSC suppress immune cells by using several
mechanisms dependent on the context of the tumor microenvironment.
2. Neutrophils
Neutrophils are the most abundant white blood cells (WBC). They are classically viewed as
short-lived effector cells of the innate immune system. They are important in host defense and
infectious diseases with intracellular bacteria (such as mycobacteria or Brucella abortus)[37,
38], parasites [39, 40] and viruses (such as human immunodeficiency virus-1 or influenza
virus) [41, 42].
In the last few years, it has been demonstrated that human neutrophils are extremely dynamic
and adaptable cells. They can acquire antigen presenting (APC)-like properties and dendritic
cell (DC) characteristics or be reprogrammed into macrophages [43, 44]. It has been
demonstrated that human neutrophils, other than interacting with nonimmune cell types such
as platelets [45] and mesenchimal stem cells [43], can establish, in vitro and in vivo, cross-

9
talk with innate immune cells, such as DCs, monocytes, macrophages, and natural killer (NK)
cells, as well as with adaptive immune cells, such as T and B cells, or related subpopulations
[22]. Moreover, longevity of neutrophils increases several-fold during inflammation [46] and
there is growing evidences of the key role of neutrophils in tumour transformation, including
orchestration of the immune response. In fact into cancer microenvironment, neutrophils have
been linked with immunosuppression, angiogenesis, tumor development and metastasis [47-
49].
The neutrophils found in the tumor are often referred to as tumor-associated neutrophils
(TAN). Recent data have suggested that tumours manipulate neutrophils, sometimes early in
their differentiation process, to create diverse phenotypic and functional polarization states
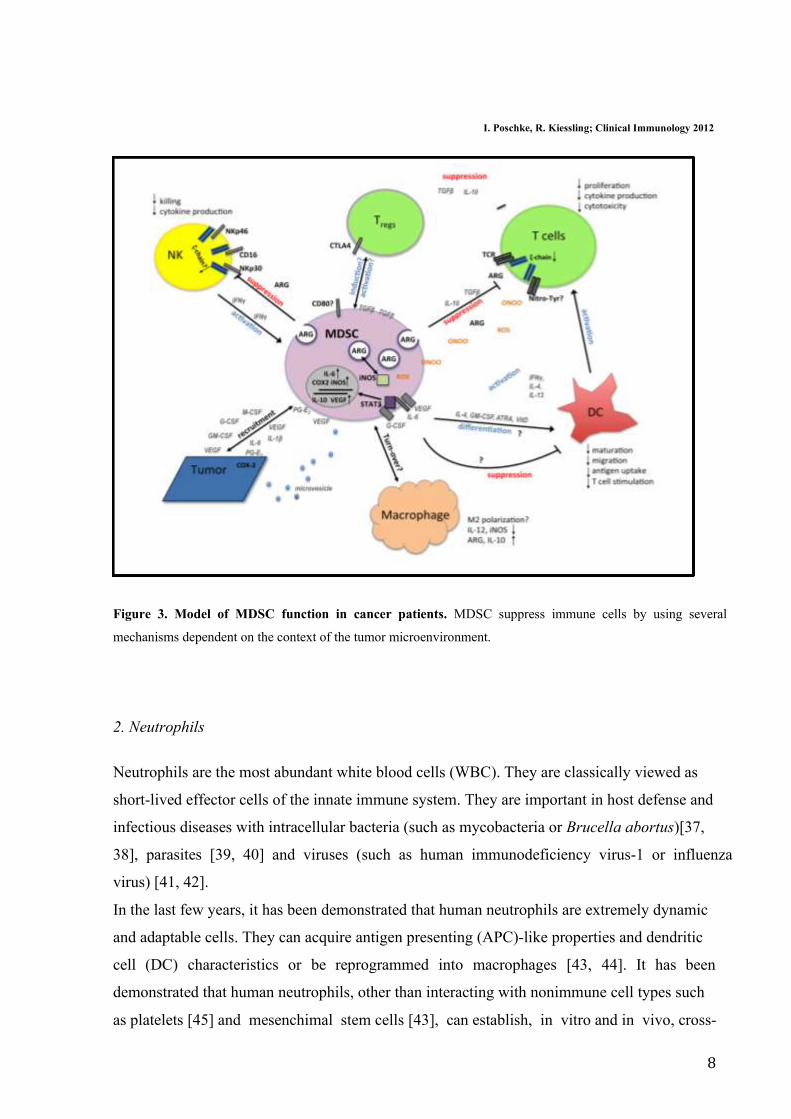
able to alter tumour behaviour [50]. Neutrophil polarization states have been divided into N1
or N2 [51]. In fact, TAN can have an anti-tumorigenic (N1) or a pro-tumorigenic (N2)
phenotype (fig.4). It has been shown that blockade of TGFβ polarize the protumoral,
immunosuppressive N2 to the antitumor, immunostimulatory N1 neutrophils [51]. The most
TAN within the tumour microenvironment appear to have an N2 phenotype and thus
contribute to tumor growth and immunosuppression producing large amounts of arginase 1,
which inactivates T cell activation [52]. Moreover, neutrophils also exert their
immunosuppressive function through production of ROS that at high concentrations, induce
apoptosis in T cells [53]. Compared with healthy subjects, neutrophils isolated from patients
with hepatocellular carcinoma release more CCL2 (C-C Motif Chemokine Ligand 2) that
inhibits the production of IFNγ [54]. In addition, N2 TAN recruit immunosuppressive
regulatory T cells (Treg) into tumors through secretion of CCL17 (C-C Motif Chemokine
Ligand 17) [55].
10
Granot Z. et al. Mediators of Inflammation; 2015
Figure 4. Neutrophil polarization. Neutrophils may be divided into N1 antitumor and N2 protumor cells.
TGFβ is a potent driver of the transition from N1 to N2 phenotype whereas IFN-β is a potent driver of the
transition in the opposite direction.
Since we have no definitive markers yet, we do not know whether the N2 neutrophils within
the tumors are actually granulocytic like MDSC or whether they are mature neutrophils
converted to an N2 phenotype by the tumor microenvironment [51]. Therefore, the restrictive
term MDSC may be re-evaluated because self-limiting. For this reason we consider MDSC as
neutrophils with immunosuppressive capabilities (N2 neutrophils).
3. Mesenchymal stem cells (MSC) and Cancer associated fibroblasts (CAF)
MSC is a subset of non hematopoietic stem cells existed in bone marrow (BM) and
originating from the mesodermal germ layer [56]. They have the ability to differentiate into
multiple lineages such as chondrocytes, osteocytes, adipocytes, myocytes, and astrocytes; so
MSC could be considered as a potential source of stem cells for cellular and genetic therapy
[57].
MSC are identified by the absence of the CD34 and CD45 hematopoietic cell markers and
expression of CD29, CD90 and CD105 [58]. MSCs express the major histocompatibility
complex (MHC) class I but do not express MHC class II, B7-1, B7-2, CD40 and CD40L
molecules [59].
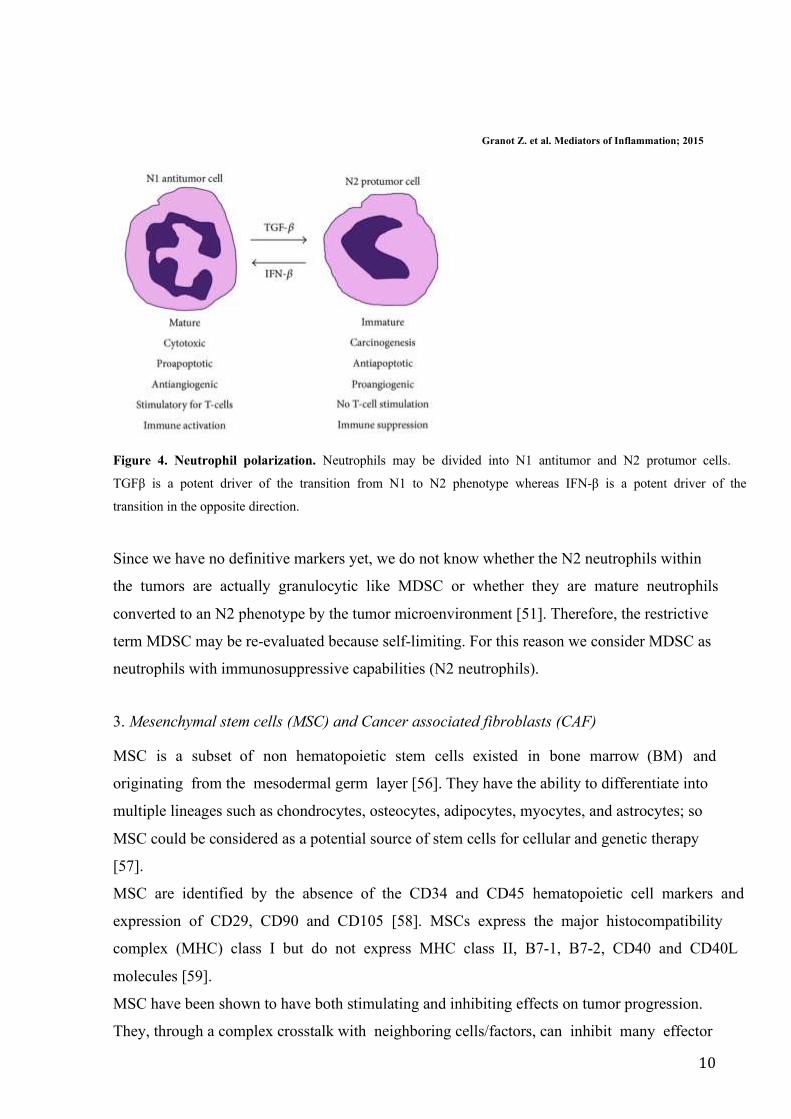
MSC have been shown to have both stimulating and inhibiting effects on tumor progression.
They, through a complex crosstalk with neighboring cells/factors, can inhibit many effector
11
functions of immune cells, thereby promoting an immunosuppressive state in the tumor
microenvironment that allows tumor cells and their associated stroma to overcome the
immune surveillance (fig.5) [60].
Han et al. Cell & Bioscience 2012
Figure 5. MSC have a tropism for tumors. MSC in tumor inflammatory microenvironment may be elicited of
immunosuppressive function, which will help tumor to escape from the immunity surveillance.
MSC can home and engraft to cancer, including breast [61-63], lung [64, 65], pancreatic [66],
colon [67], ovarian [68] and prostate carcinomas [69, 70], melanoma [71], glioma [72],
Kaposi's sarcoma [73] and osteosarcoma [74]. Their chemotactic responses resemble those of
immune cells. MSC express chemokine receptors, growth hormone receptors, adhesion
molecules and Toll-like receptors (TLR) [68]. Recently, it has been demonstrated a
connection between the stimulation of specific TLR and MSC activation status. They are
type-I transmenbrane glycoproteins that recognize ‘‘danger’’ signals leading to profound
12
cellular and systemic responses that mobilize innate and adaptive host immune cells [75].
MSC express several TLR and their ability to migrate, invade and secrete immune modulating
factors was drastically affected by specific TLR-agonist engagement [76]. In the last few
years, in a clear parallel with macrophage polarization, it has been demonstrated that MSC
can polarize into two different types with distinct phenotypes defined MSC1 and MSC2 [77].
In particular, TLR4 stimulation polarizes MSC toward a pro-inflammatory MSC1 phenotype,
while stimulation of TLR3 results in the polarization toward an immunosuppressive MSC2
phenotype. Accordingly, the in vitro co-culture of MSC1 with several cancer cell lines
inhibited tumor growth, whereas co-cultures with MSC2 had opposite effects. Moreover, in
immunecompetent models the treatment of tumors with MSC1 resulted in reduction of tumor
growth and metastasis while an MSC2-treatment led to tumor growth [77].
It has been shown that engrafted MSC can develop into α-smooth muscle actin (SMA)-
expressing myofibroblasts, usually recognized as cancer associated fibroblasts (CAF), in the
tumor microenvironment [78]. In particular, BM-MSC co-cultured in vitro with cancer cells
can be activated and may have a CAF-like phenotype. CAF have the capacity to promote
tumor growth and metastasis, either via direct interaction with tumor epithelial cells or via the
recruitment of inflammatory cells [79]. MSC and CAF show more similarities than
differences including the expression of cell surface markers (HLA-DR, CD29, CD90, CD44,
CD73, CD106 and CD117), expression of cytoskeleton proteins like vimentin, αSMA and
nestin, and trilineage differentiation potential (to adipocytes, chondrocytes and osteoblasts)
(tab.1) [80].

13
Panescu V. et al J. Cell. Mol. Med.; 2011
CAF and MSC exhibit major differences in their ultrastructural features. On the contrary of
MSC, CAF have nuclei with lobulated morphology, few mitochondria, highly developed
endoplasmic reticulum with dilated cisternae and lamellar content lysosomes [80]. The
function of the peculiar lysosomal structures might be involved in the capture and
sequestration of tumor derived antigens, thus becoming unavailable to the anticancer immune
cells. In fact, CAF have potent immunosuppressive ability like MSC, with also pro-tumoral
effects. Therefore, since the differences between CAF and MSC are only functional (i.e.
14
cytokines production, proliferation rate), CAF could be MSC bearing an activated status that
better ‘serve’ the cancer cell.
Immune escape in haematological diseases
Hematological malignancies are cancers that affect blood, bone marrow and lymphonodes,
thus maintaining a slight contact with immune system cells. Multipotent, hematopoietic
stem/progenitor cells (HSC/HPC), which are the dominant hematopoietic population in the
BM, possess both self-renewal and differentiation abilities; their growth and maintenance is
dependent on cytokine and niche factors. BM microenvironment involved in regulation and
control of maintenance of HSCs is called ‘niche’ [81]. It is a dynamic system with
bidirectional signals that ensure the regulation of normal HSCs numbers [82] and
maintenance of the quiescent long-term HSC pool [83].
Overall, leukemias are malignant disorders of hematologic cells that result in the
overproduction of undifferentiated and immature leukocytes that function abnormally within
the BM, the circulation and at extramedullary sites. HSC/HPC are the source of leukemic
cells and immune evasion mechanisms play a central role supporting tumor
microenvironment transformation [84].
As in a variety of solid cancers, MDSC have been shown to play a central role in anti-tumor
immune response in hematological malignances including acute and chronic myeloid
leukemia (AML and CML), chronic lymphocytic leukemia (CLL), multiple myeloma and
lymphoma [85-90]. Moreover, our group demonstrated that neutrophils isolated from
myeloma and CML patients are immunosuppressive cells indicating a common altered
pathway of myeloid maturation [91].
Proliferation, survival and drug-resistance of leukemic cells are largely dependent on their
interplay with the bone marrow (BM) microenvironment, in which mesenchymal stromal cells
(MSC) are important components. Indeed, MSC favor or impede LSC expansion representing
a possible target for treatment of leukemias [92]. Since BM is a store of undifferentiated
MSC, tumor cells may affect MSC activity in the tumor niche favouring a deep cross-talk
between LSC and MSC [93].
Into the tumor milieu, MSC also play an important role for their immunological regulation
ability that can interfere with the immune recognition of tumor cells creating an “immune
protection site” in the cell microenvironemnt. Indeed, MSC can interfere with the recognition
of tumor cells by immune system producing and releasing immunoregulatory factors as
TGFβ, prostaglandin E2 (PGE2), tumor necrosis factor α (TNFα), indolamine 2,3-
dioxygenase (IDO), hemeoxygenase (HO), NOS2, ARG1-2, IL10 [94-96]. MSC express

15
programmed death ligand 1 (PD-L1) that after its engagement with PD-1 expressed on T
lymphocytes lead to the inhibition of T cell activation and proliferation with an inefficient
immune response [97].
1.1 Chronic myeloid leukemia
Chronic myeloid leukemia (CML) is a myeloproliferative disease that originates from a
haemopoietic stem cell (HSC) as a result of the t(9;22) leading to the Philadelphia
chromosome and expression of the oncogenic tyrosine kinase BCR/ABL [98, 99]. The
oncoprotein is central to the pathogenesis of CML and is the target of tyrosine kinase
inhibitors (TKI) used for CML treatment. These drugs have drastically changed the treatment
outcome of CML patients. More than 85% of CML treated patients achieve a complete
cytogenetic response and approximately 40% of these patients achieve a complete molecular
remission (CMR) [100]. Imatinib was the first TKI approved and has been considered the
standard of care. Although the therapy with Imatinib is considered a major advance in
oncology, a significant group of patients still develops drug resistance. Second generation
TKI, Dasatinib and Nilotinib, are highly effective in those who fail imatinib as well as in
newly diagnosed patients [101]. RQ-PCR–based molecular monitoring of BCR-ABL
transcripts is the most sensitive tool for assessing disease burden in patients with CML. The
European LeukemiaNet and the National Comprehensive Cancer Network recommend RQ-
PCR–based molecular monitoring every 3 months until a deep response (i.e., major molecular
response [MMR] or CCyR) occurs and every 3–6 months thereafter [102]. Achieving MMR is
extremely important in the course of CML in order to avoid relapse.
In CML patients, immune system is dysfunctional. CD4+ T cells which are central
components of effective immune response against cancer cells, are anergic against leukemic
cells [103, 104] showing the downregulation of the TCR-ζ chain [105]. Furthermore, the
number of NK cells is decreased and their function is impaired [106]. T-reg are significantly
increased in CML patients with intermediate or high-risk Sokal scores compared to the low
risk patients [107]. In addition, CML myeloid cells (including also CD34+ stem cells) over-
expressed programmed death receptor ligand 1 (PD-L1) that binding its receptor PD-1
expressed on T lymphocytes lead to inactivation of T cells [108]. Recently, we observed
higher levels of G-MDSC and M-MDSC in patients at diagnosis which decreased to normal
levels after treatment with Imatinib [91]. Their percentage did not correlate neither with age,
nor with leukocytosis or Sokal risk. In addition, no correlation was observed between MDSC
and the response to Imatinib. Both subpopulations expressed BCR/ABL confirming that they
are part of the tumor clone. Expression of arginase 1 and its circulating levels in the serum
16
resulted higher in patients at diagnosis in respect to healthy controls and decreased during
TKI treatment. Furthermore, the percentage of G-MDSC correlated with arginase 1 protein
levels in the serum. We demonstrated also an immunosuppressive activity of CML
neutrophils, suggesting a strong potential immune escape mechanism created by CML cells,
which control the anti-tumor reactive T cells [91].
Although the therapy with TKI have drastically changed the treatment outcome of CML
patients, the therapy is hampered by chronic mild toxicities that may have, especially in a
long time frame, a significant impact on patient quality of life [109]. In recent years, several
studies have been conducted to evaluate the safety of imatinib discontinuation in patients who
have reached durable CMR [110, 111]. Campiotti et al reported that CML molecular relapse
occurs mainly during the first 6 months after imatinib discontinuation. Fifty-five percent and
80% of cumulative molecular relapses occurred in the first 3 months and in first 6 months,
respectively [109]. However, late molecular relapses, up to 22 months post discontinuation,
were also observed. Molecular relapse is presumably due to the reactivation of dormant CML
LSC that are resistant to TKI-induced leukemic cell ablation. Unfortunatly, there is a lack of
specific prognostic factors and a follow-up strategy which could determine the restarting of
the leukemic growth in imatinib-discontinuing patients [112]. There is increasing evidence
suggesting that NK-cells are important in controlling the leukemic cells: increased NK-cell
counts seem to correlate with the successful imatinib discontinuation [113]. It could be of
interest the monitoring of MDSC in patients who have discontinued imatinib treatment in
order to see if their increase could correlate with the restarting of the leukemic growth.
1.2 Multiple Myeloma
Multiple Myeloma (MM) is a malignant plasma cell disorder characterized by the
accumulation of neoplastic plasma cells (PC) in the bone marrow (BM) and the presence of
monoclonal immunoglobulin in the blood and/or urine. MM is the second most common
hematological malignancy and constitutes 1% of all cancers and 13% of all hematological
cancers. It is a multistep progressing disease starting with an asymptomatic monoclonal
gammopathy of undetermined significance (MGUS) through smoldering Multiple Myeloma
(SMM), up to the most aggressive, symptomatic MM and plasma cell leukemia. Clinical
features of this disease include anemia, bone resorption, renal failure, frequent occurrence of
infections and hypercalcemia [114]. Osteolytic lesions are caused by rapid bone turnover,
which occurs as a result of increased osteoclastic resorption that is not accompanied by a
comparable increase in bone formation [115].

17
The development of MM is due not only to uncontrolled proliferation of PC but also BM
microenvironment play a crucial role in disease progression to symptomatic myeloma. Here
PC are hosted in niches that maintain their long survival and exert a protective effect on drug-
induced apoptosis [116, 117]. Immune cells and BM mesenchymal stromal cells (MSC) are
important components of this microenvironment.
Within the microenvironment, the host immune system has a pivotal role for the PC growth,
proliferation, survival, migration and resistance to drugs and is responsible for some clinical
manifestations of MM. In fact, Dysfunction of immune system is an important feature of MM
patients and leads to infections and increased tumor growth [118-120]. Dendritic cells (DC)
express lower levels of human leukocyte antigen (HLA) molecules and a reduced capacity in
stimulating T cells [121]. Furthermore, MM cells are able to inhibit DC function through the
secretion of IL-6, IL-10, and TGF-β [122, 123]. Immune responses are also impaired by
immunosuppressive cell subpopulations including regulatory T cells, tumor-associated
macrophages (TAM) and MDSC [124]. Different authors demonstrated an increase of MDSC
in both peripheral blood and BM of MM patients [125, 126]. In addition to their
immunosuppressive activity, MDSC show the potential to differentiate in functional
osteoclasts thus contributing to osteolytic lesions which are a recognized hallmarks of MM
[127, 128].
As MDSC, also mature MM neutrophils (N) have immune suppressive ability supporting the
hypothesis of a functional alteration of the whole myeloid lineage (Romano et al, in
submission). MM-N overexpressed ARG1 inhibiting T cells activaction and the addition of an
ARG1-specific inhibitor partially reversed this inhibition.

18
AIM
SECTION-1/AIM1
MONOCYTIC MYELOID DERIVED SUPPRESSOR CELLS (M-MDSC) AS
PROGNOSTIC FACTOR IN CHRONIC MYELOID LEUKEMIA PATIENTS
TREATED WITH DASATINIB
Recently, the prognostic role of MDSC accumulation has been documented for some
hematological malignancies such as Hodgkin lymphoma, multiple myeloma, and acute
leukemia patients, where they correlates with disease progression and persistence of minimal
residual disease [15, 129]. This first study focused on defining the change of MDSC
frequency in CML patients during therapy with imatinib (IM), nilotinib (NIL) or dasatinib
(DAS). We also evaluated the ability of serum from CML patients and exosomes released
from leukemic cells to generate CD14+HLADR- cells from healthy donor derived
monocytes.
SECTION-2/AIM2
MESENCHYMAL STROMAL CELLS (MSC) AS KEY PLAYERS IN THE TUMOR
MICROENVIRONMENT TRANSFORMATION
It is well known that MSC have a role in promotion of tumor growth, survival and drug-
resistance. Recent reports indicated that granulocyte-like MDSC are increased in CML and
MM patients and also mature neutrophils show immunosuppressive ability [34, 91]. Generally
speaking, we name these myeloid immunosuppressive cells as neutrophils with a “N2”
phenotype. To examine the role of MSC in promoting N2 polarization, we use a specific
experimental model in vitro, co-culturing MSC with peripheral blood mononucleated cells
(PBMC) from healthy individuals, in order to generate MSC-educated neutrophils and
elucidate the different role of tumor-associated versus healthy MSC in promoting immune
evasion.
19
MATERIAL AND METHODS
SECTION-1 (S-1)
(S-1) Patients and sample collection
This study has been approved by the local ethical committee (Azienda ospedaliero
Universitaria Policlinico-Vittorio Emanuele, #34/2013/VE). After written informed consent,
samples were collected from CML patients and age-matched healthy donors (HD) at Division
of Hematology, AOU Policlinico – OVE, University of Catania. This study enrolled 59 CML
patients and for 42 of them samples were collected at diagnosis too. Twenty patients were
treated with IM (14 of whom evaluated also at diagnosis), 20 with NIL (15 evaluated at
diagnosis) and 19 with DAS (13 evaluated at diagnosis). Among NIL treated patients, 6 were
in second-line, while for DAS 5 patients were in second-line and 1 in third-line of treatment
(all 6 patients changed TKI because of IM resistance). During treatment, all patients were
followed with a monthly CBC count, molecular evaluation of the BCR/ABL transcript every
3 months and cytogenetic evaluation every 6 months, according to ELN guidelines. Clinical
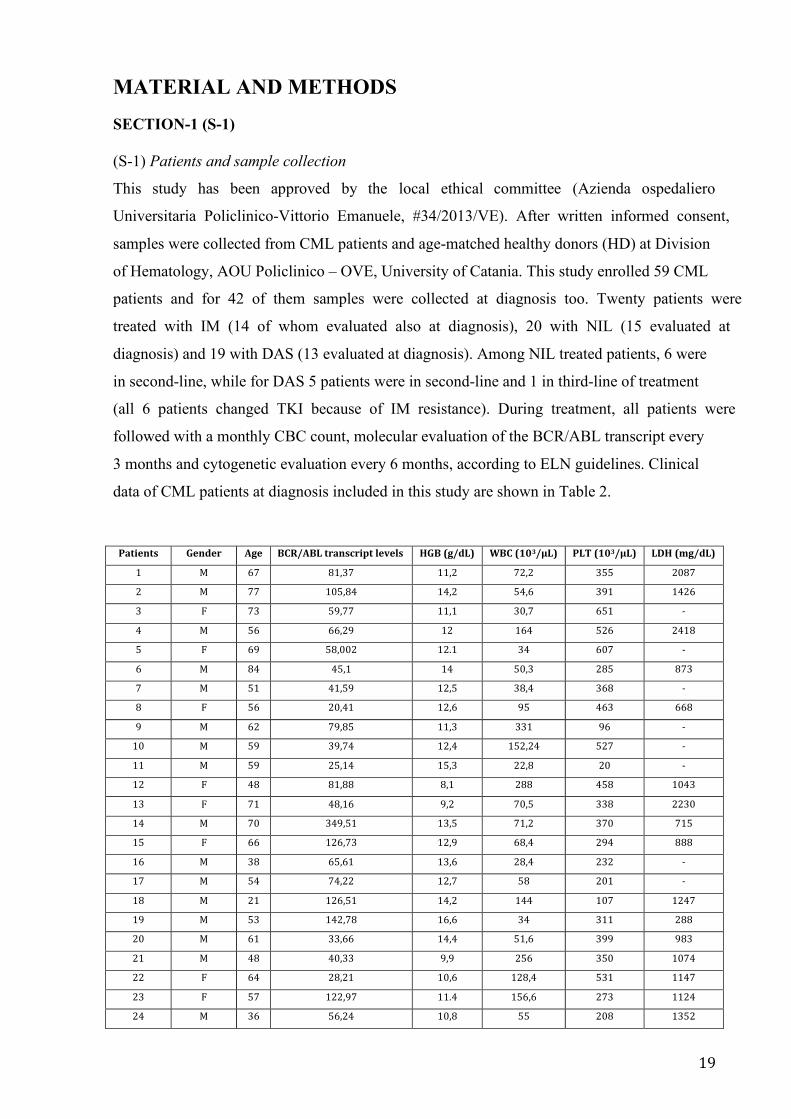
data of CML patients at diagnosis included in this study are shown in Table 2.
Patients Gender Age BCR/ABL transcript levels HGB (g/dL) WBC (103/µL) PLT (103/µL) LDH (mg/dL)
1 M 67 81,37 11,2 72,2 355 2087
2 M 77 105,84 14,2 54,6 391 1426
3 F 73 59,77 11,1 30,7 651 -
4 M 56 66,29 12 164 526 2418
5 F 69 58,002 12.1 34 607 -
6 M 84 45,1 14 50,3 285 873
7 M 51 41,59 12,5 38,4 368 -
8 F 56 20,41 12,6 95 463 668
9 M 62 79,85 11,3 331 96 -
10 M 59 39,74 12,4 152,24 527 -
11 M 59 25,14 15,3 22,8 20 -
12 F 48 81,88 8,1 288 458 1043
13 F 71 48,16 9,2 70,5 338 2230
14 M 70 349,51 13,5 71,2 370 715
15 F 66 126,73 12,9 68,4 294 888
16 M 38 65,61 13,6 28,4 232 -
17 M 54 74,22 12,7 58 201 -
18 M 21 126,51 14,2 144 107 1247
19 M 53 142,78 16,6 34 311 288
20 M 61 33,66 14,4 51,6 399 983
21 M 48 40,33 9,9 256 350 1074
22 F 64 28,21 10,6 128,4 531 1147
23 F 57 122,97 11.4 156,6 273 1124
24 M 36 56,24 10,8 55 208 1352

20
25 M 52 14,89 10,2 46 418 1820
26 F 58 150,04 10,7 122,5 361 1683
27 F 65 191,66 15,3 87 252 688
28 F 72 71,98 13 111 168 345
29 F 78 48,26 11,7 77 651 -
30 M 37 153,59 12,8 91,6 344 1635
31 M 60 47 11 70 368 873
32 M 53 23,8 13 44 343 1820
33 F 62 31,5 11 22 98 -
34 F 73 68,8 14 315 543 723
35 F 67 58,7 12,6 120 521 -
36 M 58 23,00 12,4 23 44 -
37 M 47 78,2 11,9 98 98 1043
38 M 47 63 13,3 195 345 668
39 M 55 21 12.1 54 430 -
40 F 63 120 10,7 70 370 1683
41 M 43 44,6 12 122 333 2230
42 M 69 328 9 71 370 715
Table 2 part I
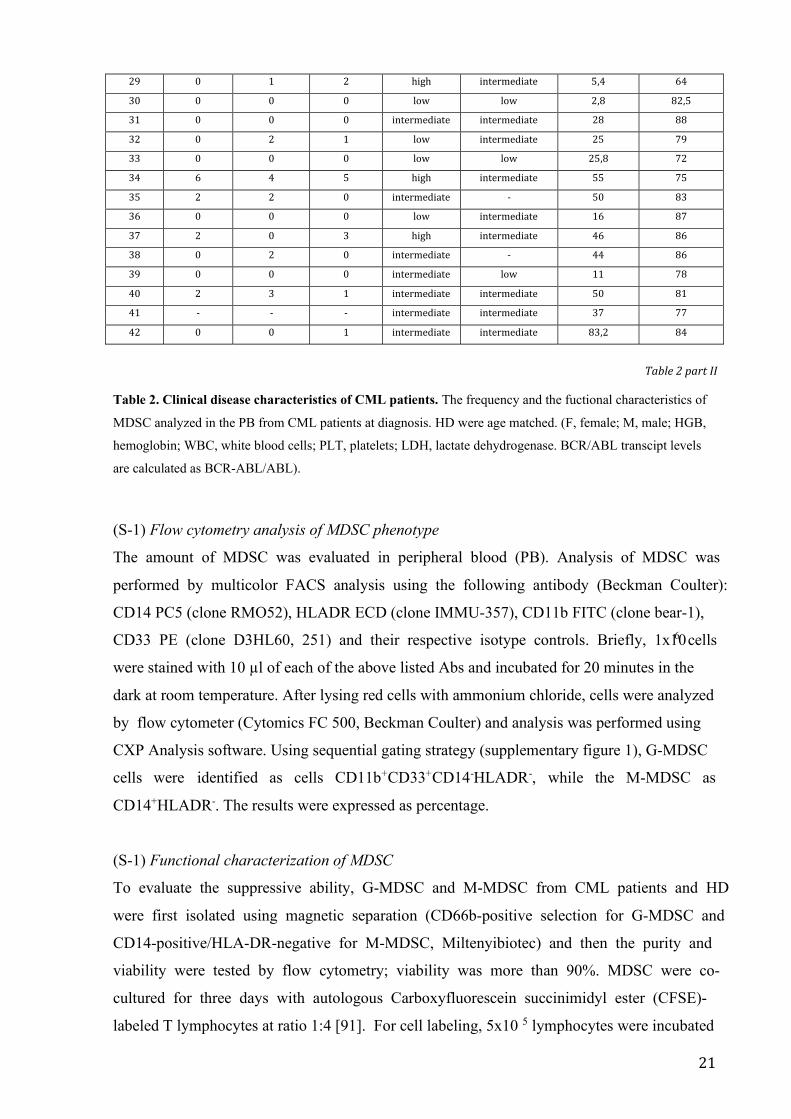
Patients Liver (cm) Spleen (cm) blast count Sokal score HASFORD score M-MDSC (%) Gr-MDSC (%)
1 0 0 0 low int 5,3 86,9
2 0 0 0 intermediate low 31 85
3 0 0 0 low - 0,7 72,7
4 2 0 0 high intermediate 20,02 82
5 0 0 0 intermediate low 10,2 81,4
6 0 0 0 intermediate intermediate 23 79
7 0 0 0 low low 26,9 87
8 0 - 0 intermediate - 29,8 79,4
9 6 4 5 high intermediate 37,7 85,4
10 2 3,5 0 intermediate - 50 88,7
11 0 0 0 low intermediate 18,9 87
12 2 14 3 high intermediate 41 86
13 - - - intermediate intermediate 46,8 89
14 0 0 1 intermediate intermediate 81,2 79
15 2 3 0 intermediate intermediate 12,4 82
16 0 0 0 low low 28,5 83,4
17 - - - low low 14,7 82
18 0 6 1 low low 81,6 83,7
19 0 3 0 low intermediate 63 83
20 0 0 1 low low 25 81
21 7 14 1 intermediate low 41 90
22 0 2 1 intermediate intermediate 1 58,3
23 2 1 1 low intermediate 61 88
24 7 8 1 low low 42,4 87
25 0 2 1 low intermediate 25 78
26 0 3 1 intermediate intermediate 50 75
27 0 0 0 low low 91,2 50
28 4 2 2 intermediate intermediate 14,4 75
21
29 0 1 2 high intermediate 5,4 64
30 0 0 0 low low 2,8 82,5
31 0 0 0 intermediate intermediate 28 88
32 0 2 1 low intermediate 25 79
33 0 0 0 low low 25,8 72
34 6 4 5 high intermediate 55 75
35 2 2 0 intermediate - 50 83
36 0 0 0 low intermediate 16 87
37 2 0 3 high intermediate 46 86
38 0 2 0 intermediate - 44 86
39 0 0 0 intermediate low 11 78
40 2 3 1 intermediate intermediate 50 81
41 - - - intermediate intermediate 37 77
42 0 0 1 intermediate intermediate 83,2 84
Table 2 part II
Table 2. Clinical disease characteristics of CML patients. The frequency and the fuctional characteristics of
MDSC analyzed in the PB from CML patients at diagnosis. HD were age matched. (F, female; M, male; HGB,
hemoglobin; WBC, white blood cells; PLT, platelets; LDH, lactate dehydrogenase. BCR/ABL transcipt levels
are calculated as BCR-ABL/ABL).
(S-1) Flow cytometry analysis of MDSC phenotype
The amount of MDSC was evaluated in peripheral blood (PB). Analysis of MDSC was
performed by multicolor FACS analysis using the following antibody (Beckman Coulter):
CD14 PC5 (clone RMO52), HLADR ECD (clone IMMU-357), CD11b FITC (clone bear-1),
CD33 PE (clone D3HL60, 251) and their respective isotype controls. Briefly, 1x10⁶ cells
were stained with 10 µl of each of the above listed Abs and incubated for 20 minutes in the
dark at room temperature. After lysing red cells with ammonium chloride, cells were analyzed
by flow cytometer (Cytomics FC 500, Beckman Coulter) and analysis was performed using
CXP Analysis software. Using sequential gating strategy (supplementary figure 1), G-MDSC
cells were identified as cells CD11b+CD33+CD14-HLADR-, while the M-MDSC as
CD14+HLADR-. The results were expressed as percentage.
(S-1) Functional characterization of MDSC
To evaluate the suppressive ability, G-MDSC and M-MDSC from CML patients and HD
were first isolated using magnetic separation (CD66b-positive selection for G-MDSC and
CD14-positive/HLA-DR-negative for M-MDSC, Miltenyibiotec) and then the purity and
viability were tested by flow cytometry; viability was more than 90%. MDSC were co-
cultured for three days with autologous Carboxyfluorescein succinimidyl ester (CFSE)-
labeled T lymphocytes at ratio 1:4 [91]. For cell labeling, 5x10 5 lymphocytes were incubated
22
at 37°C for 20 min in 1 ml PBS containing 1 µM CFSE (BD Pharmingen). T cells were
stimulated with 5 mg/mL phytohemagglutinin (PHA) and incubated for 72 hours prior to flow
cytometry. Controls included a positive T cell proliferation control (T cells plus PHA) and a
negative one (T cells only). After three days, T cell proliferation was measured by CFSE
dilution and analyzed using flow cytometry.
(S-1) Western Blot Analysis
Western Blot Analysis was performed according to the manufacturer‘s recommendations. The
antibodies directed against the human Tsg101 and CD63 were obtained from Santa Cruz
Biothecnology. The blots were scanned, and determinated using Scion Image software (New
York, NY).
(S-1) Soluble factors and exosomes for the generation of M-MDSC
Purification of monocytes from PB of 4 HD was performed by a positive selection of these
cells using a magnetic separation kit (EasySep, STEMCELL Technologies, Vancouver, BC,
Canada). Cell purity was determined by flow cytometry and was >90%. Monocytes were
cultured with RPMI-1640 medium with 1% penicillin-streptomycin supplemented with 20%
FBS or HD (n=4) or CML sera (n=6). After 72 h of incubation, cells were stained with M-
MDSC Abs for flow cytometry analysis.
HD monocyets were also cultured in the presence of exosomes (30 µg protein/10 6 monocytes)
isolated from 5 CML serum patients at diagnosis.
(S-1) Isolation of serum exosomes
Serum exosomes were isolated and purified by differential ultracentrifugation according to a
standard protocol for isolation of exosomes from viscous bodily fluids [130]. Serum was
derived from heparinised blood, diluted 1:2 with PBS (phosphate -buffered saline) and
centrifuged for 30 min at 2,000 x g at 4 C°. The supernatant was transferred to ultracentrifuge
tubes and centrifuged using a 13.1 JS rotor (Beckman Instruments, Inc., Fullerton, CA) for
30 min at 12,000 x g, 4 C°. Supernatant was carefully transferred into fresh ultracentrifuge
tubes and centrifuged using a SW28 rotor (Beckman Instruments, Inc., Fullerton, CA) at
110,000 x g for 2 h at 4°C. The resulting pellet , resuspended in 1 ml of PBS, was diluted
with PBS, filtered through a 0.22-μm filter (Millex GP filter unit, Millipore, Billerica, MA)
into fresh ultracentrifuge tubes and centrifuged in a SW28 rotor at 110,000 x g for 70 min at
4°C. Then the tube containing the pellet was resuspended in 1 ml of PBS, filled with PBS
and centrifuged at 110,000 x g for 70 min at 4°C. The crude exosomes were resuspended in
23
50-100 μl of PBS for their characterization by scanning transmission and immunoelectron
microscopy.
(S-1) Scanning Electron Microscopy (SEM)
Exosomes (20 µl) were fixed in 80 µl of 2% glutaraldehyde-0.1 M phosphate buffer and fixed
overnight at 4°C. A drop of suspension was layered on a sterile cover glass coated with 0,1%
poly-L-Lysine, postfixed in 1% osmium tetroxide (Merck, Darmstadt, Germany) in the same
buffer for 1h at 4°C and washed in phosphate buffer. After dehydrating in a graded ethanol
and critical point drying, the samples were sputtered with a 5nm gold layer using an Emscope
SM 300 (Emscope Laboratories, Ashford, UK) and then observed. A Hitachi S-4000 (Hitachi
High-Technologies America, Inc., Schaumburg, IL) field emission scanning electron
microscope was used for the observations.
(S-1) Transmission Electron Microscopy (TEM)
Exosomes (20 µl) were fixed in 80 µl of 3% formaldehyde-0.1% glutaraldehyde overnight at
4°C. 5 µl of the above suspension was layered on a formvar copper coated nickel grids
(Electron Microscopy Sciences, Fort Washington, PA) and allow to dry for 20 min to absorb
exosomes. The grids, washed in PBS, were negatively stained with 4% uranyl acetate for 5
min and viewed using a Hitachi H-7000 transmission electron microscope (Hitachi High-
Technologies Europe GmbH, Krefeld, Germany). For immunogold labeling the grids were
rinsed for 2x2 min with PBS and transferred in a TBS (Tris-buffered saline pH 7,4) solution
containing 1% BSA (bovine serum albumin) (TBS/BSA) for 10 min at room temperature.
Then the grids were incubated in blocking solution 5% BSA for 1,30 h at room temperature,
rinsed with PBS, and incubated in a humid chamber overnight at 4°C with a mouse
monoclonal antibody CD81 (Santa Cruz Biotechnology, Heidelberg, Germany) in a dilution
1:50 with TBS/BSA. After wash for 3x3 min with TBS/BSA, the grids were stained with a 10
nm gold-labeled secondary antibody Anti-mouse IgG (Sigma Aldrich) in a dilution 1:5 with
TBS/BSA at 37°C for 1h in the dark. The grids were rinsed 2x2 with TBS/BSA, 2x2 with
water and fixed with 1,5% glutaraldehyde in PBS for 10 min at room temperature. After
rinsed again with water the grids were post-stained with 4% uranyl acetate for 5 min and
allow to air drying. Observations were carried out using the transmission electron microscope.
Negative controls were prepared in the absence of primary antibody but with secondary
antibody-conjugate.
24
SECTION-2 (S-2)
(S-2) MSC harvest, culture and characterization
After written informed consent, BM samples were collected from patients with diagnosis of
CML (n=10), of MGUS (n=10), smoldering (n=6) or active MM at first diagnosis (n=11) or
relapse (n=5), and age-matched HD (n=10). Also MM-MSC from 3 refractory patients were
collected. Clinical data of MM and MGUS patients included in this study are shown in Table
3-4.
BM mononuclear cells were obtained after density gradient centrifugation on Ficoll and
cultured in low-glucose Dulbecco’s modified Eagle’s medium supplemented with 10% heat-
inactivated FBS, 100 U/ml penicillin, 100 mg/ml streptomycin and 1% L-glutamine. After 3
days in culture, non-adherent cells were removed, whereas MSC were selected by their
adherence to the plastic-ware. The cultures were maintained at 7°C and 5% CO 2. MSC were
expanded until the third or fourth passage and then trypsinized to be used for experiments.
Selected MSC from both patients and HD at the third passage were also tested for MSC
specific surface antigen expression (supplentary figure 2). Therefore, cells were labeled using
combinations of monoclonal antibodies: anti-CD34-ECD (clone 581), anti-CD90-FITC (clone
F15.42.1.5), anti-CD105-PE (clone 1G2) and anti-CD45-PC5 (clone J.33). The appropriate
isotopic control was also included. Labeled MSC were acquired using a Beckman Coulter FC-
500 flow cytometer.
Moreover, MSC osteogenic and adipogenic ability differentiation was confirmed in two
CML-, MGUS-, MM- and HD-MSC. In brief, for osteoblastic and adipocytic differentiations,
80% confluent MSCs were grown in medium supplemented with 10mM b-glycerol phosphate
(Sigma-Aldrich, St Louis, MO, USA), 50 mg/ml ascorbic acid and 10nM dexamethasone for
osteoblasts, or with 10 μg/ml insulin, 0.5 mM dexamethasone, 0.5 mM
isobutylmethylxanthine and 0.1 mM indomethacin for adipocytes [131, 132]. Osteocytic and
adipocytic differentiation of MSC was evaluated using alkaline phosphatase and Oil-Red-O
respectively (data not showed).
25
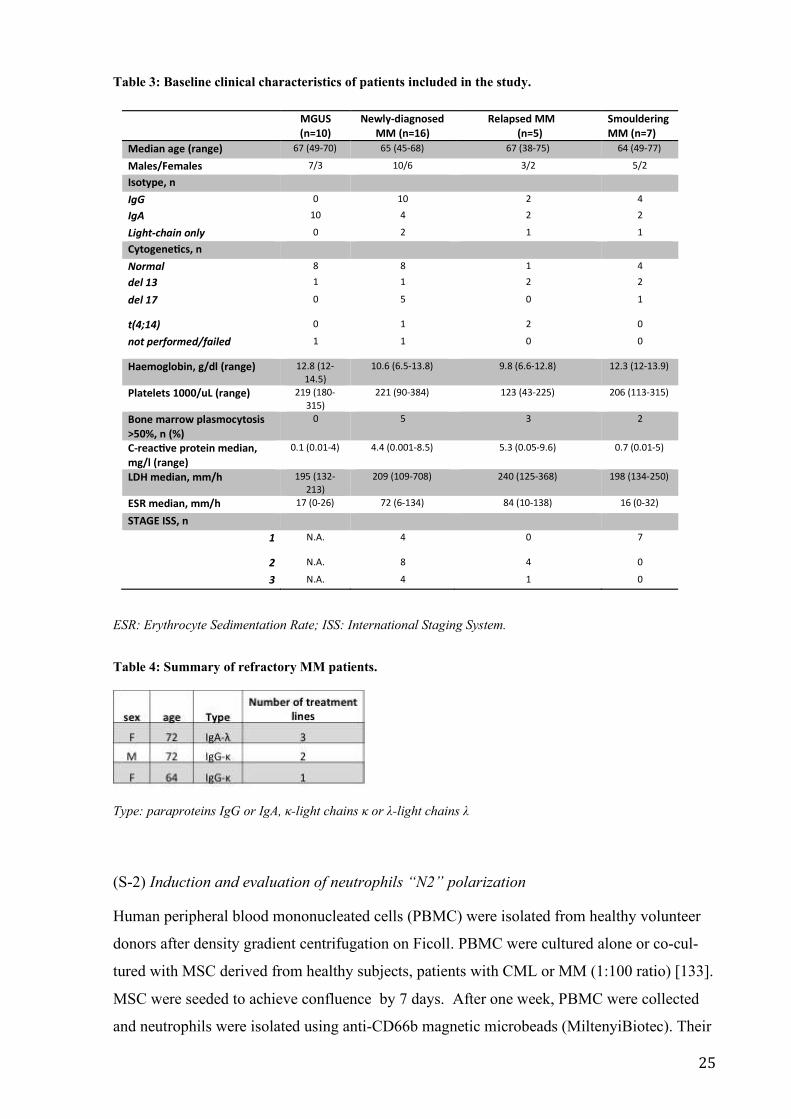
Table 3: Baseline clinical characteristics of patients included in the study.
ESR: Erythrocyte Sedimentation Rate; ISS: International Staging System.
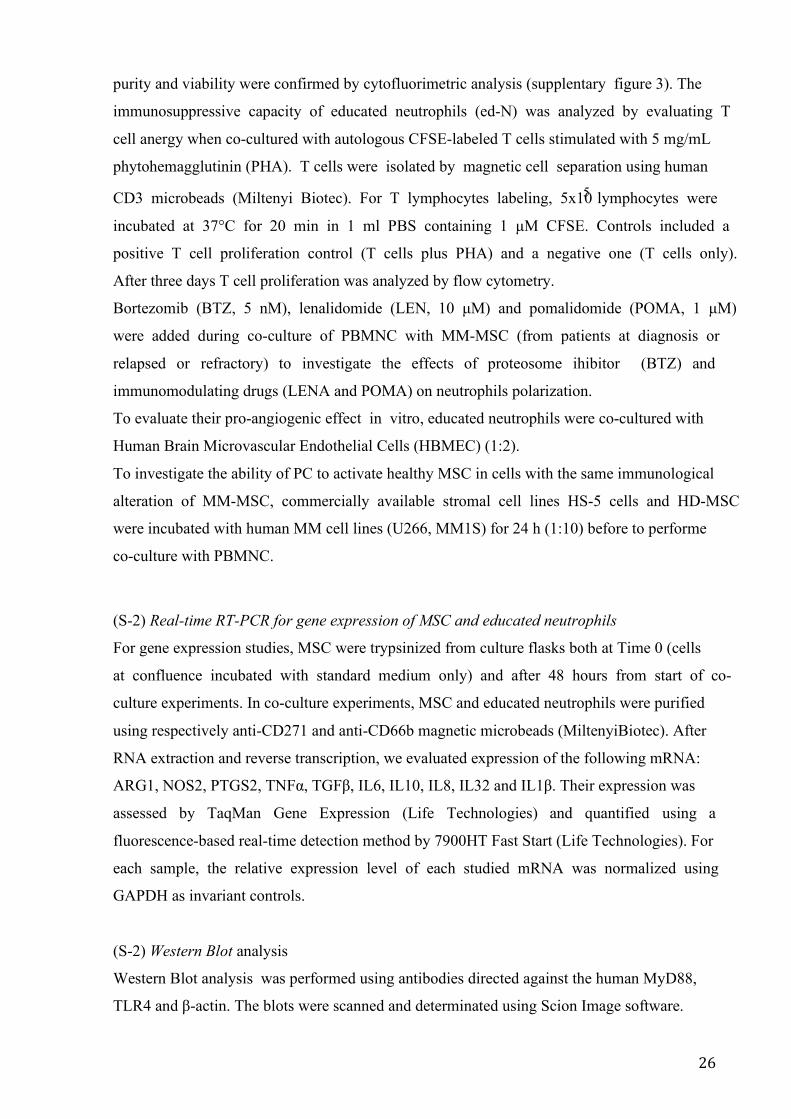
Table 4: Summary of refractory MM patients.
Type: paraproteins IgG or IgA, κ-light chains κ or λ-light chains λ
(S-2) Induction and evaluation of neutrophils “N2” polarization
Human peripheral blood mononucleated cells (PBMC) were isolated from healthy volunteer
donors after density gradient centrifugation on Ficoll. PBMC were cultured alone or co-cul-
tured with MSC derived from healthy subjects, patients with CML or MM (1:100 ratio) [133].
MSC were seeded to achieve confluence by 7 days. After one week, PBMC were collected
and neutrophils were isolated using anti-CD66b magnetic microbeads (MiltenyiBiotec). Their
MGUS(n=10)
Newly-diagnosedMM (n=16)
Relapsed MM(n=5)
SmoulderingMM (n=7)
Median age (range) 67 (49-70) 65 (45-68) 67 (38-75) 64 (49-77)
Males/Females 7/3 10/6 3/2 5/2
Isotype, nIgG 0 10 2 4
IgA 10 4 2 2
Light-chain only 0 2 1 1
Cytogenetcs, nNormal 8 8 1 4
del 13 1 1 2 2
del 17 0 5 0 1
t(4;14) 0 1 2 0
not performed/failed 1 1 0 0
Haemoglobin, g/dl (range) 12.8 (12-14.5)
10.6 (6.5-13.8) 9.8 (6.6-12.8) 12.3 (12-13.9)
Platelets 1000/uL (range) 219 (180-315)
221 (90-384) 123 (43-225) 206 (113-315)
Bone marrow plasmocytosis>50%, n (%)
0 5 3 2
C-reactve protein median,mg/l (range)
0.1 (0.01-4) 4.4 (0.001-8.5) 5.3 (0.05-9.6) 0.7 (0.01-5)
LDH median, mm/h 195 (132-213)
209 (109-708) 240 (125-368) 198 (134-250)
ESR median, mm/h 17 (0-26) 72 (6-134) 84 (10-138) 16 (0-32)
STAGE ISS, n1 N.A. 4 0 7
2 N.A. 8 4 0
3 N.A. 4 1 0
26
purity and viability were confirmed by cytofluorimetric analysis (supplentary figure 3). The
immunosuppressive capacity of educated neutrophils (ed-N) was analyzed by evaluating T
cell anergy when co-cultured with autologous CFSE-labeled T cells stimulated with 5 mg/mL
phytohemagglutinin (PHA). T cells were isolated by magnetic cell separation using human
CD3 microbeads (Miltenyi Biotec). For T lymphocytes labeling, 5x10⁵ lymphocytes were
incubated at 37°C for 20 min in 1 ml PBS containing 1 μM CFSE. Controls included a
positive T cell proliferation control (T cells plus PHA) and a negative one (T cells only).
After three days T cell proliferation was analyzed by flow cytometry.
Bortezomib (BTZ, 5 nM), lenalidomide (LEN, 10 μM) and pomalidomide (POMA, 1 μM)
were added during co-culture of PBMNC with MM-MSC (from patients at diagnosis or
relapsed or refractory) to investigate the effects of proteosome ihibitor (BTZ) and
immunomodulating drugs (LENA and POMA) on neutrophils polarization.
To evaluate their pro-angiogenic effect in vitro, educated neutrophils were co-cultured with
Human Brain Microvascular Endothelial Cells (HBMEC) (1:2).
To investigate the ability of PC to activate healthy MSC in cells with the same immunological
alteration of MM-MSC, commercially available stromal cell lines HS-5 cells and HD-MSC
were incubated with human MM cell lines (U266, MM1S) for 24 h (1:10) before to performe
co-culture with PBMNC.
(S-2) Real-time RT-PCR for gene expression of MSC and educated neutrophils
For gene expression studies, MSC were trypsinized from culture flasks both at Time 0 (cells
at confluence incubated with standard medium only) and after 48 hours from start of co-
culture experiments. In co-culture experiments, MSC and educated neutrophils were purified
using respectively anti-CD271 and anti-CD66b magnetic microbeads (MiltenyiBiotec). After
RNA extraction and reverse transcription, we evaluated expression of the following mRNA:
ARG1, NOS2, PTGS2, TNFα, TGFβ, IL6, IL10, IL8, IL32 and IL1β. Their expression was
assessed by TaqMan Gene Expression (Life Technologies) and quantified using a
fluorescence-based real-time detection method by 7900HT Fast Start (Life Technologies). For
each sample, the relative expression level of each studied mRNA was normalized using
GAPDH as invariant controls.
(S-2) Western Blot analysis
Western Blot analysis was performed using antibodies directed against the human MyD88,
TLR4 and β-actin. The blots were scanned and determinated using Scion Image software.
27
(S-2) Immunofluorescence
Cells were grown directly on coverslips before immunofluorescence. After washing with
phosphate-buffered saline (PBS), cells were fixed in in 4% paraformaldehyde for 20 minutes
at room temperature. After fixation, cells were three times washed in PBS for 5 minutes.
Subsequently, the cells were incubated with primary antibody against IRF3 (anti-rabbit) and
NFKB (anti-mouse) at dilution 1:100, overnight at 4°C. Next day, cells were three times
washed in PBS for 5 minutes and incubated with secondary antibodies: TRITC (anti-rabbit) at
dilution 1:200, and FITC (anti-mouse) at dilution 1:200 for 1h at room temperature. The
slides were mounted with medium containing DAPI (4′,6-diamidino-2-phenylindole) to
visualize nuclei. The fluorescent images were obtained using a Zeiss Axio Imager Z1
Microscope with Apotome 2 system and was performed by Image J Software.
(S-2) Zebrafish as in vivo model
1. Zebrafish husbandry
Adult (5–8 month-old) wild-type AB zebrafish (Danio rerio) were maintained under
conditions according to the Organisation for Economic Cooperation and Development
guidelines. Fish were kept in a flow-through system with a light/dark cycle of 14 h/10 h and
were fed with SDS 400 food twice daily.
2. Xenotransplantation procedure
Zebrafish were anesthetized with 0.02% tricaine (Sigma-Aldrich) and injected with
suspensions of MM cell lines (U266 or MM1S) mixed with HD- or MM-MSC in a 1:1 ratio
[134, 135] in PBS (5x10⁴/5x104) using a borosilicate glass capillary and a MICROINJECTOR
system.
Prior to implantation, MM cells were labeled for coimplantation with MSC with DiIC18(5)-
DS (1,1'-Dioctadecyl-3,3,3',3'-Tetramethylindodicarbocyanine-5,5'-Disulfonic Acid)
(ThermoFisher) at a final concentration of 1 mmol/L for 5 minutes at 37°C in a 5% CO2
atmosphere and 15 minutes at 4°C.
We evaluated the tumor xenografts by tomography 6 days post-injection, measuring the tumor
volume and intensity of fluorescence with ImageJ software [136].
3. Flow cytometry analysis
MM cell xenograft was determined by flow cytometry. Wild-type adult zebrafish were
anaesthetized with 0.02% tricaine and the kidney/marrow and other extracted organs were
dissected and placed in PBS as described. Single cell suspensions were generated by passing
through a nylon mesh and stained with propidium iodide (Sigma) was to exclude dead cells.
Staining with the human monoclonal antobodies against CD138 was performed. To evaluate

28
MSC xenograft, human CD90 antibody was also used. All These human mAb did not show
cross-reactivity with Zebrafish cells.
4. Real time PCR
By using Trizol reagent, total RNA was extracted from kidney/marrow and total of organs.
After reverse transcription, we evaluated expression of the following mRNA: TBX21,
GATA3, INFγ, IL4, IL13. Their expression was assessed by TaqMan Gene Expression (Life
Technologies) and quantified using a fluorescence-based real-time detection method by
7900HT Fast Start (Life Technologies). Expression was normalized to the expression of the
housekeeping gene, GAPDH.
Statistical analysis
The data are expressed as mean ± SD. Statistical analysis was carried out by paired Student's
t-test, ANOVA test or Mann-Whitney test. For correlation analysis, the Pearson’s correlation
was assessed. A p value <0.05 was considered to indicate a statistically significant difference
between experimental and control groups.
29
RESULTS
1. MONOCYTIC MYELOID DERIVED SUPPRESSOR CELLS (M-MDSC) AS
PROGNOSTIC FACTOR IN CHRONIC MYELOID LEUKEMIA PATIENTS
TREATED WITH DASATINIB (SECTION 1)
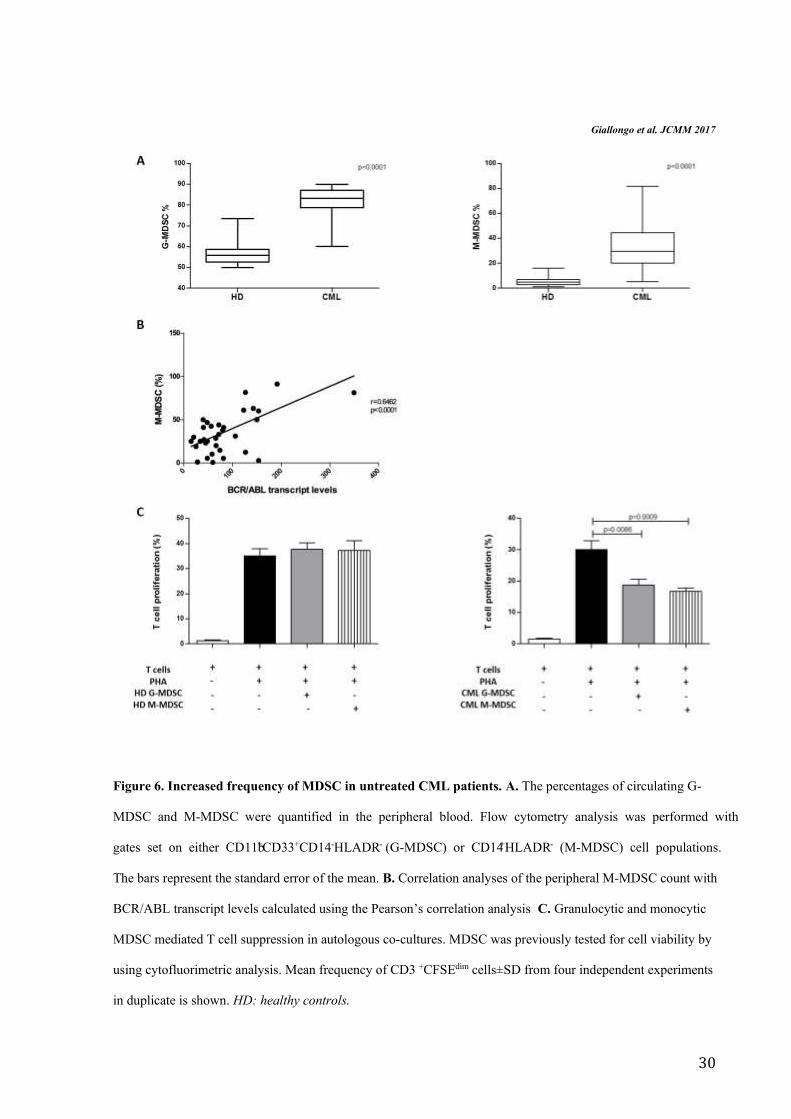
1.1 MDSC are increased in CML patients
G-MDSC and M-MDSC percentages in CML patients at diagnosis were greater than HD
subjects (respectively 84±9% vs 56.2±5.4% and 32±20% vs 5.9±4%, p<0.0001) (Figure 6A).
Moreover, the frequency of M-MDSC significantly correlated with BCR/ABL transcript
levels (r=0.64, p<0.0001) (Figure 6B). The percentages of G-MDSC and M-MDSC did not
correlate neither with age, nor with leukocytosis or Sokal risk. To validate whether these
increased myeloid subpopulations were MDSC cells, their immunosuppressive activity was
investigated. For this purpose, we isolated by magnetic separation CD14-negative
(representative of M-MDSC) and CD66b-positive (representative of G-MDSC) cells from
both CML patients at diagnosis and healthy controls and incubated them with autologous
CFSE-labeled T cells.
On the contrary of immature myeloid cells with G-MDSC or M-MDSC phenotype isolated
from healthy donors, both G-MDSC and M-MDSC from CML patients were able to inhibit T
cells proliferation in comparison to positive control (from 30±4.8% to 18.7±3.8% for G-
MDSC, p=0.0086 and to 16.7±2.5% for M-MDSC, p=0.0009) (Figure 6C).
30
Giallongo et al. JCMM 2017
Figure 6. Increased frequency of MDSC in untreated CML patients. A. The percentages of circulating G-
MDSC and M-MDSC were quantified in the peripheral blood. Flow cytometry analysis was performed with
gates set on either CD11b+CD33+CD14-HLADR- (G-MDSC) or CD14+HLADR- (M-MDSC) cell populations.
The bars represent the standard error of the mean. B. Correlation analyses of the peripheral M-MDSC count with
BCR/ABL transcript levels calculated using the Pearson’s correlation analysis C. Granulocytic and monocytic
MDSC mediated T cell suppression in autologous co-cultures. MDSC was previously tested for cell viability by
using cytofluorimetric analysis. Mean frequency of CD3 +CFSEdim cells±SD from four independent experiments
in duplicate is shown. HD: healthy controls.

31
1.2 M-MDSC percentage correlates with MMR in dasatinb treated patients
CML patients were followed during therapy with IM, NIL or DAS. All TKI decreased the
levels of G-MDSC at 3-6 months (from 82.5±9.6% to 55±17.3% after IM, to 60.9±9% after
NIL and to 48.7±13% after DAS, p<0.0001) and 9-12 months (64±8% after IM, 61±6.3%
after NIL and 32±15% after DAS, p<0.0001) of treatment (Figure 7A). The percentage of M-
MDSC significantly decreased after DAS therapy only (from 33.6±19% to 6.8±12.6% at 6
months, p=0.014 and to 12±11.8% at 12 months, p=0.004). In fact, M-MDSC reduction was
also observed but did not reach statistical significance after IM (22.2±24.5% and 20.8±18.6%
respectively at 6 and 12 months) and after NIL treatment (21±19.9% and 19±17% at 6 and 12
months)with a great variability among patients.
MDSC accumulation correlates with disease progression and minimal residual disease in
myeloma and leukemia patients [15, 129]. Therefore, we analyzed the correlation of MDSC
with clinical response to TKI. On the contrary of IM and NIL treated patients (data not
shown), we found a correlation between the MMR values and the number of persistent M-
MDSC at 12 months. Indeed, a significant difference was observed comparing the percentage
of M-MDSC in the MMR group (n=8) versus no MMR (n=11) (p=0.0025) (Figure 7B).
Figure 7C shows the frequency of M-MDSC for patients evaluated both at diagnosis and after
12 months of treatment with dasatinib.

32
Giallongo et al. JCMM 2017
Figure 7. MDSC after TKI therapy. A. Changes in circulating G-MDSC and M-MDSC in CML patients
treated with IM, NIL or DAS. The bars represent the standard error of the mean. G-MDSC at 3-6 and 9-12
months after IM, NIL and DAS: p<0.0001. M-MDSC after 3-6 months of DAS therapy: p<0.05; after 9-12

33
months of DAS treatment: p<0.01. B. The percentage of M-MDSC was compared between the MMR and no
MMR groups. The bars represent the standard error of the mean. Statistical difference was calculated using
Mann-Whitney test. C. M-MDSC count for 15 patients at diagnosis and after 12 months of therapy with DAS.
Lines with empty circle represent patients no in MMR at 12 months. MMR, major molecular response; BCR-
ABL is ≤0.1%.
1.3 CML cells are able to induce M-MDSC by secreting soluble factors
To evaluate whether leukemic cells were able to expand MDSC, we cultured monocytes
isolated from healthy controls with sera from healthy subjects or CML patients at diagnosis.
Monocytes displayed phenotypic conversion into CD14+HLADR- only in conditions with
CML sera where the percentage of M-MDSC increased by 29±13%, p=0.0006 (Figure 8A).
No changes were observed by incubating monocytes with serum from healthy subjects. On
the contrary, G-MDSC percentage did not change by addition of neither CML or healthy
donor (HD) serum (data not showed). In line with their MDSC-like phenotype, CML serum-
educated monocytes showed suppressive ability after incubation with autologous T
lymphocytes (Figure 8B).
Giallongo et al. JCMM 2017
Figure 8. CML serum induces M-MDSC with T cell suppressive ability. A. Monocytes displayed phenotypic
conversion into CD14+HLADR- after incubation with CML serum for 3 days. Results represent the means of
four independent experiment; error bars denote SD. B. Suppressive activity of CML serum-educated M-MDSC
34
(CML s-ed M-MDSC) was evaluated in co-culture experiments with CFSE-labeled autologous T lymphocytes.
Mean frequency of CD3+CFSEdim cells±SD from four independent experiments in duplicate is shown.
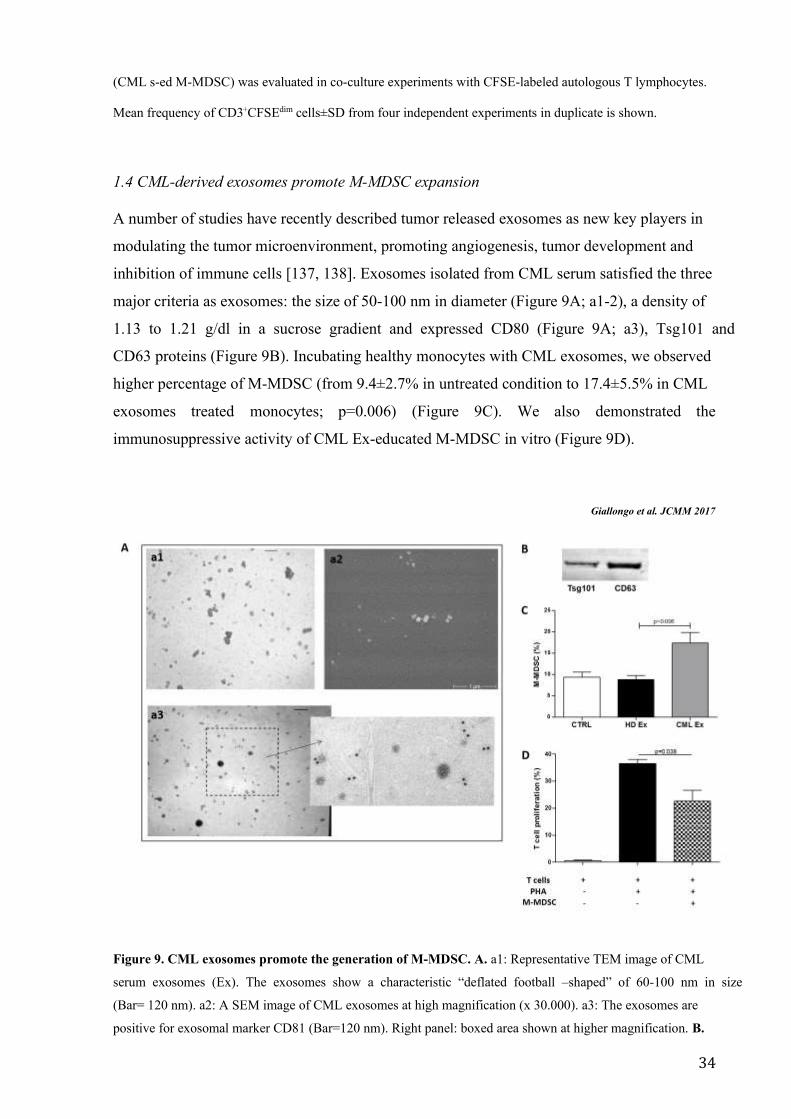
1.4 CML-derived exosomes promote M-MDSC expansion
A number of studies have recently described tumor released exosomes as new key players in
modulating the tumor microenvironment, promoting angiogenesis, tumor development and
inhibition of immune cells [137, 138]. Exosomes isolated from CML serum satisfied the three
major criteria as exosomes: the size of 50-100 nm in diameter (Figure 9A; a1-2), a density of
1.13 to 1.21 g/dl in a sucrose gradient and expressed CD80 (Figure 9A; a3), Tsg101 and
CD63 proteins (Figure 9B). Incubating healthy monocytes with CML exosomes, we observed
higher percentage of M-MDSC (from 9.4±2.7% in untreated condition to 17.4±5.5% in CML
exosomes treated monocytes; p=0.006) (Figure 9C). We also demonstrated the
immunosuppressive activity of CML Ex-educated M-MDSC in vitro (Figure 9D).
Giallongo et al. JCMM 2017
Figure 9. CML exosomes promote the generation of M-MDSC. A. a1: Representative TEM image of CML
serum exosomes (Ex). The exosomes show a characteristic “deflated football –shaped” of 60-100 nm in size
(Bar= 120 nm). a2: A SEM image of CML exosomes at high magnification (x 30.000). a3: The exosomes are
positive for exosomal marker CD81 (Bar=120 nm). Right panel: boxed area shown at higher magnification. B.
35
Western blot analysis of protein extracted from exosomes. C. An increase of the percentage of CD14+/HLADR-
cells was observed in vitro after incubation of HD monocytes with CML exosomes (p<0.05). Results represent
the means of four independent experiment; error bars denote SD. D. Suppressive activity of CML exosomes-
educated M-MDSC (CML Ex-ed M-MDSC) was evaluated in co-culture experiments with CFSE-labeled
autologous T lymphocytes. Mean frequency of CD3+CFSEdim cells±SD from four independent experiments in
duplicate is shown.
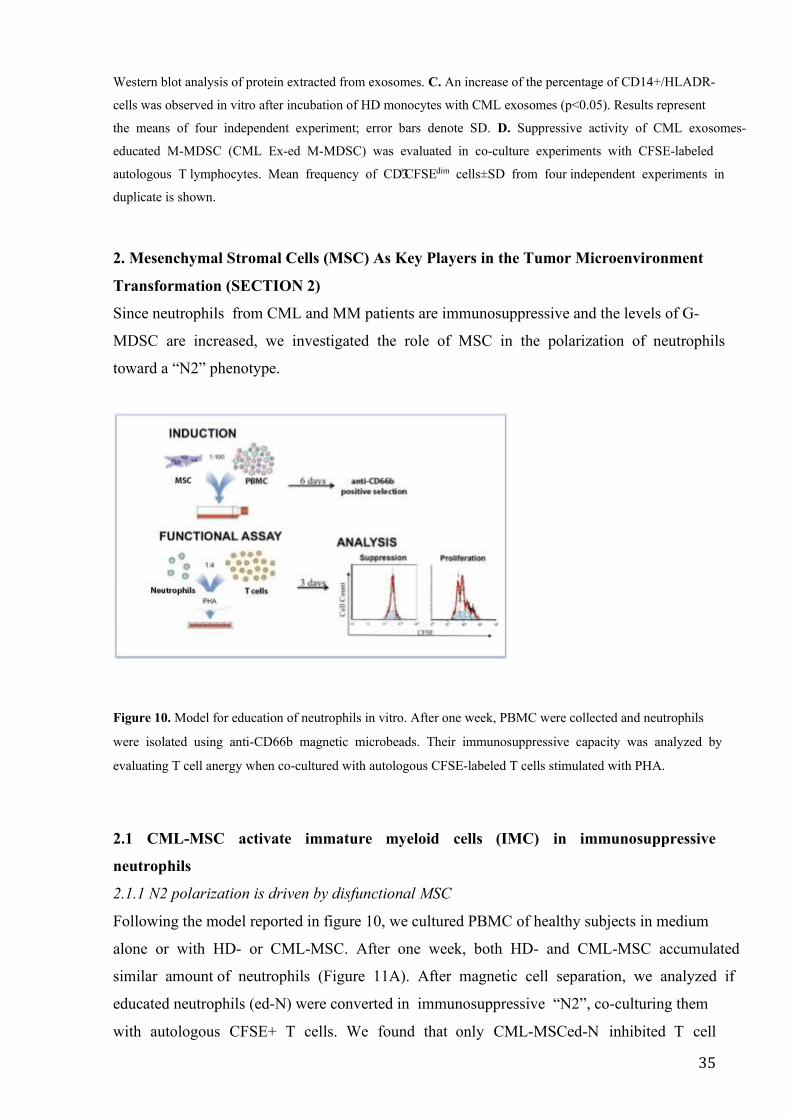
2. Mesenchymal Stromal Cells (MSC) As Key Players in the Tumor Microenvironment
Transformation (SECTION 2)
Since neutrophils from CML and MM patients are immunosuppressive and the levels of G-
MDSC are increased, we investigated the role of MSC in the polarization of neutrophils
toward a “N2” phenotype.
Figure 10. Model for education of neutrophils in vitro. After one week, PBMC were collected and neutrophils
were isolated using anti-CD66b magnetic microbeads. Their immunosuppressive capacity was analyzed by
evaluating T cell anergy when co-cultured with autologous CFSE-labeled T cells stimulated with PHA.
2.1 CML-MSC activate immature myeloid cells (IMC) in immunosuppressive
neutrophils
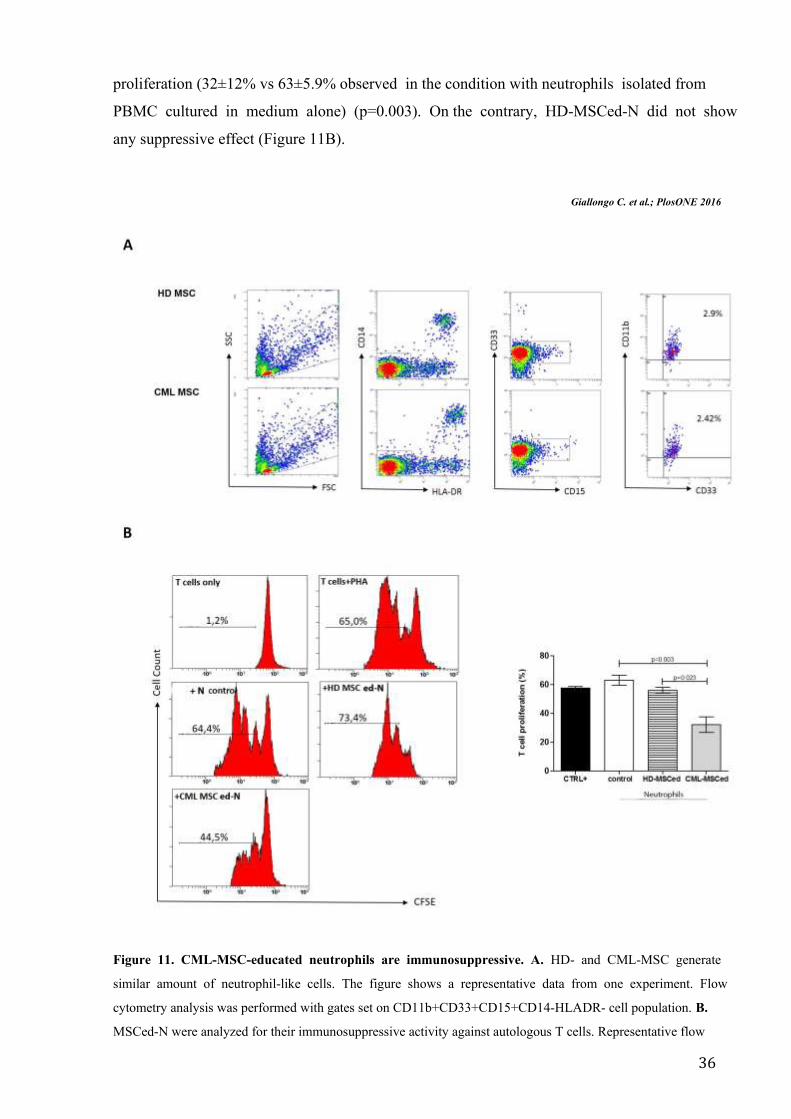
2.1.1 N2 polarization is driven by disfunctional MSC
Following the model reported in figure 10, we cultured PBMC of healthy subjects in medium
alone or with HD- or CML-MSC. After one week, both HD- and CML-MSC accumulated
similar amount of neutrophils (Figure 11A). After magnetic cell separation, we analyzed if
educated neutrophils (ed-N) were converted in immunosuppressive “N2”, co-culturing them
with autologous CFSE+ T cells. We found that only CML-MSCed-N inhibited T cell
36
proliferation (32±12% vs 63±5.9% observed in the condition with neutrophils isolated from
PBMC cultured in medium alone) (p=0.003). On the contrary, HD-MSCed-N did not show
any suppressive effect (Figure 11B).
Giallongo C. et al.; PlosONE 2016
Figure 11. CML-MSC-educated neutrophils are immunosuppressive. A. HD- and CML-MSC generate
similar amount of neutrophil-like cells. The figure shows a representative data from one experiment. Flow
cytometry analysis was performed with gates set on CD11b+CD33+CD15+CD14-HLADR- cell population. B.
MSCed-N were analyzed for their immunosuppressive activity against autologous T cells. Representative flow

37
cytometry dot-plots show the gating strategy for each experimental condition. The data represent mean±SD of all
analyzed co-cultures in triplicate.
2.1.2 CML-MSC up-regulate immunomodulatory factors
It is well known that polarization of neutrophils in “N2” can be induced by multiple factors
present in the tumor microenvironment. Immunomodulatory factors, including TNFα, TGFβ,
IL6, IL10, IL1β, ARG1, NOS2 and COX2 are important to reprogram immature myeloid cells
to become immunosuppressive neutrophils [23]. Therefore, we first analyzed their expression
by MSC at Time 0. Despite a great variability among patients, we found a significant up-
regulation of IL6 (5±2.8, p=0.04), COX2 (19±4.4, p=0.04) and TGFβ (6±3, p=0.01) by CML-
MSC compared to HD- ones (Figure 12A). Expression of TNFα gene was down-regulated
(0.55±1, p=0.027). After 48 h of co-culture with PBMC, CML MSC showed up-regulation of
IL6 (54.3±23, p=0.003), TGFβ (4.8±3, p=0.04) and IL10 (5.6±2.8, p=0.03) expression
(Figure 12B), suggesting that multiple mechanisms are involved in neutrophils polarization
by CML-MSC.
Giallongo C. et al.; PlosONE 2016
Figure 12. Expression of immunomodulatory factors by CML-MSC. Compared to HD-MSC, CML-MSC
up-regulated IL6, COX2 and TGFβ at Time 0 (A) and overexpressed IL6, TGFβ and IL10 after 48 h of co-
culture with PBMC (B). Calculated value of 2^-ΔΔCt in HD-MSC was 1.

38
2.1.3 Gene expression of immunomodulatory factors in CML-MSC educated-neutrophils
To test whether the changes of gene expression in CML-MSC during co-culture also occurred
in CML-MSCed-N, we examined the expression of the same genes in neutrophils isolated
after co-culture. Compared to neutrophils educated in co-culture with HD-MSC, CML-
MSCed-N showed higher levels of ARG1 (23.5±11.9, p=0.02), IL6 (33.8±13.9, p=0.004),
IL1β (47.3±25.2, p=0.001), COX2 (20.7±10.9, p=0.002) and TNFα (20.8±19.3, p=0.006)
(Figure 13).
Giallongo C. et al.; PlosONE 2016
Figure 13. Expression of immunomodulatory factors by MSC educated-neutrophils. Compared to HD-,
CML-MSCed-N expressed higher levels of ARG1, IL6, IL1β, COX2 and TNFα in respect with HD-MSCed-N.
Calculated value of 2^- ΔΔCt in HD-MSCedG-MDSC was 1.
2.2 Mesenchymal Stromal Cells (MSC) as key players in promoting immunune escape
and tumor microenvironment transformation from MGUS to Myeloma
2.2.1 MM-MSC polarized neutrophils versus a “N2” phenotype
Following the model reported in figure 10 and used to analyze CML-MSC, PBMC from
healthy donors were co-cultured with healthy controls (HC)-, MGUS- or MM-MSC for one
week. After magnetic cell separation, we found that only SMM-MSCed-N and MM-MSCed-
N were able to suppress T cell proliferation (Figure 14A). No effects were observed after
incubation of T lymphocytes with MGUS-MSCed-N or HC-MSCed-N or N control (isolated
from PBMC cultured in medium alone). As MM-MSC from patients at diagnosis, also MM-
MSC from subject with refractory MM induced neutrophils to become immunosuppressive.

39
Adding Bortezomib, Lenalidomide or Pomalidomide during co-culture with MM-MSC,
isolated neutrophils did not lose immunosuppressive ability (Figure 14C).
Before incubation with T cells, the expression of our set of immune modulatory factors was
investigated in MM-, SMM- and MGUS-MSCed-N using HC-MSCed-N as control. On the
contrary of MGUS-MSCed-N, SMM- and MM-MSCed-N significantly up-regulated ARG1,
NOS2 and TNFα (figure 14B). Up-regulation of ARG1 and NOS2 is the main mechanisms of
MDSC-induced immune-suppression [34], while TNFα has been shown to arrest
differentiation of immature myeloid cells and increase neutrophils suppressive activity [139].
Figure 14. SMM- and MM MSC have the same immunological functional alterations. A. Only SMM- and
MM-MSCed-N exhibited suppressive effects compared to N control (isolated from PBMC cultured without
MSC). CTRL+: T lymphocytes incubated only with PHA (positive control). B. Expresssion of
immunomodulatory factors by neutrophils educated with MGUS-, SMM- or MM-MSC in respect with HC-MSC
ed-N. Calculated value of 2^-ΔΔCt in control (HC-MSC educated-neutrophils) was 1. *p<0.05; **p<0.001. C.

40
Adding BTZ (5 nM), LENA (10 uM) or POMA (1 uM) during co-culture with MM-MSC, isolated neutrophils
did not lose immunosuppressive ability.
2.2.2 Molecular regulators of MM-MSC-mediated neutrophils activation
In many cancers, it has been demonstrated that tumor-associated microenvironment produces
a large amount of immune-modulating factors involved in reprogramming immature myeloid
cells to become immunosuppressive neutrophils and to attract them at the tumor sites. These
immunomodulatory factors include PTGS2, TGFβ, NOS2, IL10, TNFα, IL1β, and IL6.
Therefore, we analyzed their expression by MM-MSC in respect with HD-MSC at Time 0. A
great variability of expression was observed among the patients, but no up-regulation of the
genes above described was observed (Figure 15A). On the contrary after 48h from the start of
co-culture with PBMC, MM-MSC showed higher expression of PTGS2 (5.8±5, p=0.018),
TGFβ (27.8±34, p=0.03), NOS2 (20±25.8, p=0.04) and IL6 (20.7±22, p=0.02) expression
(Figure 15B), suggesting that MM-MSC are functionally different from HD-MSC and are
able to produce higher amount of immunomodulatory factors that could be involved in
neutrophils activation versus a “N2” phenotype.
Giallongo et al.; Oncotarget 2016
Figure 15: Expression of immune-modulatory factors by MM-MSC at Time 0 (A) and after 48 h of co-
culture with PBMC (B). Only after incubation with PBMC, MM-MSC showed statistically signicant up-
regulation of PTGS2, TGFβ, NOS2 and IL6 expression (p<0.05) compared with HD-MSC (calculated value of
2^-ΔΔCt in HD-MSC was 1).
41
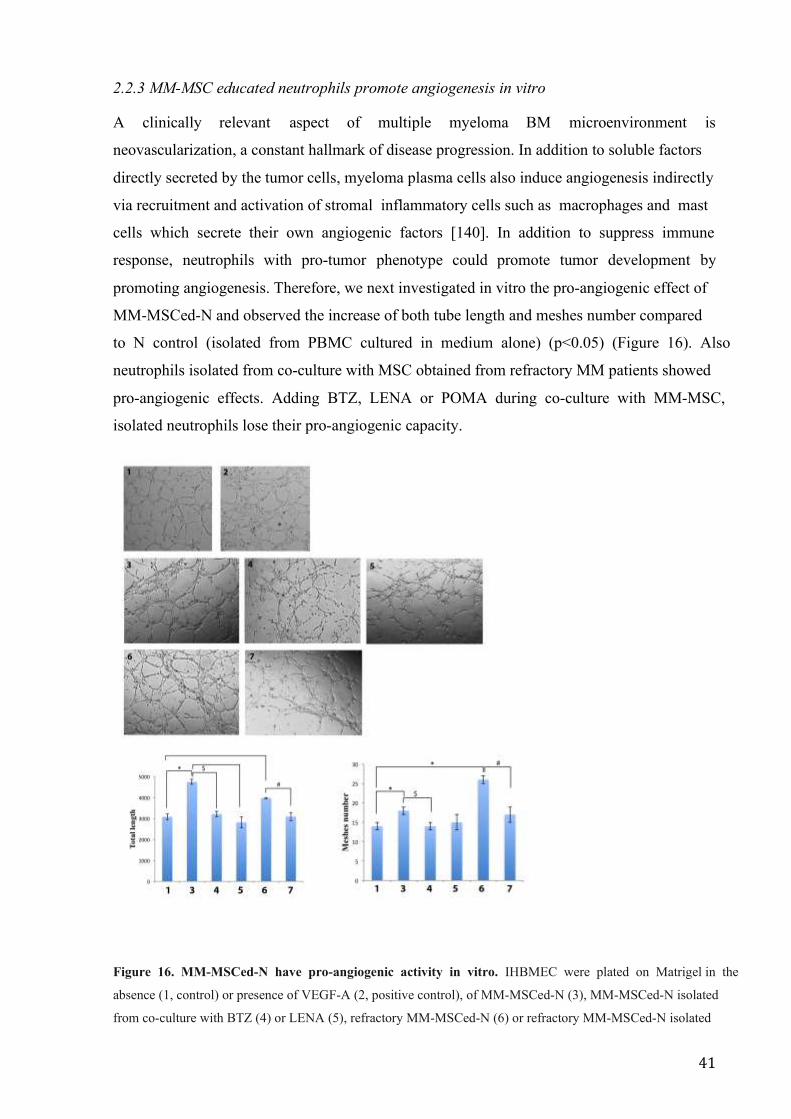
2.2.3 MM-MSC educated neutrophils promote angiogenesis in vitro
A clinically relevant aspect of multiple myeloma BM microenvironment is
neovascularization, a constant hallmark of disease progression. In addition to soluble factors
directly secreted by the tumor cells, myeloma plasma cells also induce angiogenesis indirectly
via recruitment and activation of stromal inflammatory cells such as macrophages and mast
cells which secrete their own angiogenic factors [140]. In addition to suppress immune
response, neutrophils with pro-tumor phenotype could promote tumor development by
promoting angiogenesis. Therefore, we next investigated in vitro the pro-angiogenic effect of
MM-MSCed-N and observed the increase of both tube length and meshes number compared
to N control (isolated from PBMC cultured in medium alone) (p<0.05) (Figure 16). Also
neutrophils isolated from co-culture with MSC obtained from refractory MM patients showed
pro-angiogenic effects. Adding BTZ, LENA or POMA during co-culture with MM-MSC,
isolated neutrophils lose their pro-angiogenic capacity.
Figure 16. MM-MSCed-N have pro-angiogenic activity in vitro. IHBMEC were plated on Matrigel in the
absence (1, control) or presence of VEGF-A (2, positive control), of MM-MSCed-N (3), MM-MSCed-N isolated
from co-culture with BTZ (4) or LENA (5), refractory MM-MSCed-N (6) or refractory MM-MSCed-N isolated

42
from co-culture with POMA (7). After 5 hours, refreactory MM- and MM-MSCed-N induced tube formation.
The pro-angiogenic effect was significantly reduced by the proteasome inhibitor and the immunomodulatory
drugs. *p<0.05; **p<0.001; $ p<0.05; # p<0.05.
2.2.4 TLR4 signaling activates healthy MSC in stromal cells with the same functional
alteration of MM-MSC
Since it has been demonstrated a connection between the stimulation of specific Toll-like
receptors (TLR) and MSC activation status, including two distinct phenotypes defined MSC1
(TLR4-dependent) or MSC2 (TLR3-dependent), we hypothesized that MM-MSC could be
stromal cells activated to better “serve” the cancer cells. Therefore, to investigate whether
MSC polarization (MSC1/MSC2) may explain the immune alteration observed in MM-MSC,
we pre-treated HC-MSC with LPS (lipopolysaccharide) or poly(I:C) as agonists, respectively,
for TLR4 and TLR3. After 24h, HC-MSC were then cultured with PBMC from healthy
donor. Only educated neutrophils isolated from co-cultures with HC-MSC pre-treated with
LPS showed in vitro N2 phenotype with suppressive effects on T cell proliferation (p<0.001)
(Fig.17A). No effects were observed after TLR3 stimulation. Therefore, we next investigated
the ability of these ed-N isolated from co-culture with HC-MSC pre-tretaed with LPS to
induce angiogenesis in vitro. As shown in figure 17B, only these neutrophils were able to
increase the meshes number (p<0.05) and the total lenght (p<0.05) after incubation with
IHBMEC. These data confirmed that LPS “activate” MSC inducing their commitment
towards an inflammatory phenotype associated with polarization of neutrophils toward a N2
phenotype.
Moreover, western blotting analysis showed the up-regulation of myeloid differentiation 88
(MyD88), an important contributing protein in the TLR4 signaling cascade, in MM-MSC in
respect with HC-MSC (p<0.0001; fig.17C). These data indicated that TLR4 signaling may
play a role in tumor microenvironment transformation promoted by MSC.

43
Figure17. LPS activate MSC toward an inflammatory phenotype associated with polarization of
neutrophils versus a N2 phenotype. (A) Neutrophils isolated from co-culture with HC-MSC pre-treated with
LPS are able to inhibit T cell proliferation. (B) After the pre-treatment with LPS, HC-MSC educated-neutrophils
showed pro-angiogenic capacity in vitro. 1: IHBMEC control; 2: IHBMEC in presence of VEGF-A (positive
control); 3: HC-MSCed-N; 4: plus ed-N isolated from co-culture of PBMC with HC-MSC pre-treated with LPS.
(C) MyD88 expression was increased in MM-MSC in respect with HC-MSC. For analysis of western blot the
optical density of the bands was measured using Scion Image software. All showed results represent the means
of four independent experiments; error bars denote SD. *p<0.05; ***p<0.001.
2.2.5 MSC “activation” is induced by MM cells
To examine if plasma cells play a role in MSC polarization, before performing co-cultures
with PBMC, we pre-treated HC-MSC or HS-5 cell line with MM cells (U266, MM1S). PC
pre-treatment drives healthy MSC to activate neutrophils in immunosuppressive (Figure 18A)
and pro-angiogenic cells just like SMM- and MM-MSC (Figure 18C). Moreover, exposure to
PC induced up-regulation of pro-inflammatory factors as IL8, IL32 and PTGS2 (Figure 18B).
We also observed an over-expression of CCL2 that regulates the recruitment of G-MDSC and
enhances their immunosuppressive ability [141].
To confirm the role of TLR4 in MSC “activation”, this pathway was investigated after
exposure of HC-MSC to MM cell lines. Mitogen-activated Kinase (MAPK) cascade was not

44
activated and NF-kB did not translocate into the nucleus. Surplisingly, we found the
activation of the transcription factor IRF3, indicating the involvement of the TLR4-MyD88-
independent pathway (Figure 18D).

45
Figure18. PC activate MSC towards an inflammatory phenotype. (A) Neutrophils isolated from co-culture
with HS-5 or HC-MSC pre-treated with MM cells were able to inhibit T cell proliferation. (B) Compared to HC-
MSC not pre-treated, HC-MSC “educated” by MM cells up-regulated IL8, IL32, PTGS2 and CCL2. (C) After
the pre-treatment with MM cells, HC-MSC-educated neutrophils showed pro-angiogenic capacity in vitro. 1:
IHBMEC control; 2: IHBMEC in presence of VEGF-A (positive control); 3: plus N control (isolated from
PBMC cultured without MSC); 4: plus HC-MSCed-N; 5: plus HC-MSCed-N isolated from co-culture with HC-
MSC pre-treated with MM cells. (D) Western blotting analysis of MAPK cascade. Detection of NF-kB and IRF3
nuclear translocation was performed by incubation respectively with anti-mouse and anti-rabbit monoclonal
antibodies followed by secondary antibodies conjugated to FITC (green) or TRITC (red). Counterstaining of
cells was performed by using the nuclear dye, DAPI (blue). The photographs result from sequential analysis of
the same microscopic field, followed by merging of different images with specific staining. All showed results
represent the means of four independent experiments; error bars denote SD.*p<0.05; **p<0.001.
2.2.6 MM-MSC favour tumor engraftment and immune escape in vivo
We next explored in vivo the pro-tumor role of MM-MSC with respect to HC-MSC. After 7
days from implanting of mixtures of fluorescently labeled MM cells and HC- or MM-MSC
into immunocompetent zebrafish, animals co-injected with U266 cells and MM-MSC showed
higher human tumor cell engraftment calculated as tumor volume and fluorescence intensity
compared with those injected with PC and HC-MSC (p<0.05) (Figure 19A). Cytofluorimetric
analysis confirmed higher localization of human CD138+ and human CD90+ cells in organs
(kidney marrow, spleen and liver) of zebrafish injected with PC and MM-MSC (respectively
36,4%±14,6 vs 4,9%±3,1 and 8,3%±0,35 vs 0,4%±0,2; p=0.0039 and p=0.0007; figure 19B).
To examine changes in the Th1/Th2 balance in zebrafish after injection, we evaluated mRNA
levels of master regulator transcription factors for Th1/Th2 lineage development: T-box
transcription factor 21 (tbx21) and gata3. Tbx21 is a Th1 cell transcription factor important
for Th1 lineage commitment and gata3 is a well-known regulator of Th2 cell differentiation.
In addition, we evaluated the expression of IL-4 (IL4b) and IL-13 (Th2-type cytokines) and
IFN-γ (ifnγ1-2) (a Th1-type cytokine) genes [142, 143]. Compared to animals co-injected
with PC and HC-MSC, gata3, IL-4 and IL-13 were significantly up-regulated in zebrafish
injected with PC plus MM-MSC (figure 19C), indicating that MSC from MM patients
enhance mechanisms that circumvent the immune response.

46
Figure18. MM-MSC enhance PC engraftment and immune escape mechanisms in immunocompetent
Zebrafish. 3 animals were engrafted for every combination of PC with MM-MSC (n=6) or HC-MSC (n=4). (A)
Evaluation of tumor xenografts by tomography. Prior to implantation, MM cells were labeled for co-
implantation with MSC with DiIC18(5)-DS. The tumor volume and the intensity of fluorescence were measured
using ImageJ software. (B) Detection of human U266 cells and human MSC in adult zebrafish using flow
cytometry. (C) Analysis of changes in the Th1/Th2 balance in zebrafish using real time PCR. Results for animals
co-injected with PC and MM-MSC are shown; calculated value of 2^-ΔΔCt in zebrafish injected with U266 and
HC-MSC was 1. All analysis were performed 6 days after cellular mixture inhiection. *p<0.05;**
p<0.001;***p<0.001.
47
DISCUSSION
The BM microenvironment consists of a cellular compartment, the extracellular matrix and
soluble factors such as cytokines, chemokines and growth factors [144]. The cellular
compartment is made up of ematopoietic cells including immune cells and non hematopoietic
cells such as fibroblasts, endothelial cells, osteoblasts, osteoclasts and adipocytes. Complex
interactions within the BM microenvironemnt between immune, non-immune and tumor cells
influence the development and the progression of the hematological cancer, such as CML and
MM. The theory of cancer immunoediting postulates that effector mechanisms of the immune
system exert a dual role, eliminating cancer cells and promoting cancer progression through
the selection of those cells whose genetic alterations allow tumor to progress in immuno-
competent host [145, 146].
The ability of MDSC to support tumor growth and metastases can be divided into four
functions: (a) protection of tumor cells from immune-mediated killing, (b) remodeling of the
tumor microenvironment, (c) establishment of a premetastatic niche, and (d) interaction with
tumor cells to induce “stemness” and facilitate the epithelial-to-mesenchymal transition
(EMT) [147]. A large number of studies have demonstrated improvement of immune
responses and antitumor immunity following depletion of GMDSC with a Ly6G-specific
antibody in murine models [148-150].
We and other groups have previously demonstrated that there is a significant accumulation of
MDSC in CML and MM patients which exert immunosuppression by releasing Arg1 [91]. As
in other hematological malignancies, the prognostic role of MDSC accumulation has been
documented in MM where they correlates with tumor progression and outcome of therapy
[151]. For CML disease, a recent study demonstrated that both imatinib and dasatinib
treatment efficiently decreased the amount of G-MDSC in CML patients, but it did not find a
correlation between major molecular response (MMR) value and MDSC count [152]. Also
our data (section 1) showed no correlation between G-MDSC number and MMR value both in
IM, DAS and NIL treated patients. Nevertheless, a significant correlation was found between
the number of persistent M-MDSC and MMR value in dasatinib treated patients. MDSC are
supposed to provide a favorable microenvironment in which leukemia cells can evade host
immunosurveillance and proliferate. Therefore, increased levels of M-MDSC in the follow-up
of CML patients treated with dasatinib may indicate the delayed immune control and higher
levels of residual leukemia cells. Studies by Sun et colleagues reported a similar observation
in adult acute myeloid leukemia (AML) [153]. The authors found that the number of MDSC
(identified as CD33highCD11b+ HLADRlow cells) was significantly higher in the high minimal
residual disease (MRD) group than that in the middle and low MRD groups. Moreover,
48
Gustafson et al. found that chronic lymphocytic leukemia (CLL) patients with higher levels of
M-MDSC had a shorter time to disease progression compared to patients with lower levels
[154]. These data suggest that M-MDSC could be predictive of poorer prognosis in different
hematological malignancies. On the contrary of dasatinib therapy, the reduction of M-MDSC
subset was not significant during imatinib and nilotinib treatment. This difference may be due
in part to down-regulation of Src and NF-KB signal cascades as demonstrated for the
inhibition of Treg [155] and MDSC in head and neck cancer [156]. Moreover, some studies
reported that after dasatinib treatment, an immunostimulation can be observed with increased
numbers of CD8+ T cells, NK cells and decreased numbers of Treg [157, 158]. These effects
seem to be dasatinib-specific because they were not observed with imatinib, nilotinib or
bosutinib. Therefore, immunostimulatory ability of dasatinib may be in line with our data.
CML patients can stop imatinib treatment without suffering disease relapse after achieving a
complete molecular response (CMR) [111], suggesting that the immunesurveillance, whereby
the immune cells inhibit tumor cell growth, plays a central role in restraining CML cells even
in the absence of TKI treatment. The presence of relatively abundant NK cells and cytotoxic
T lymphocytes (CTL) specific for CML antigens such as BCR-ABL1 or proteinase-3 are
good candidates for predictive markers of safe TKI discontinuation [113, 159, 160]. It
remains to be elucidated if MDSC might be candidate predictive markers of relapse risk
following TKI discontinuation and their evaluation before and after discontinuation of
imatinib involving a large patient cohort might be important. Moreover, this first study
suggest the possible development in CML patients of a circuit primed by tumor cells that,
through the release of soluble factors and exosomes, are able to expand M-MDSC, creating an
immunotolerant environment that results in T cell anergy and facilitates tumor growth
(Fig.19).

49
Figure 19. CML cells through the release of soluble factors and exosomes are able to expand M-MDSC, which
in turn create an immunotolerant environment facilitating tumor growth.
(SECTION 2)
Although neutrophils are traditionally considered in the context of their antibacterial
functions, it is becoming increasingly clear that tumor-associated neutrophils (TAN) play a
major role in cancer biology. TAN can have an antitumorigenic (N1) phenotype or pro-
tumorigenic (N2) phenotype capable of supporting tumor growth and suppressing the
antitumor immune response. In untreated tumors, TAN develop a pro-tumorigenic phenotype
termed ‘N2 TAN’ in analogy to the M2 macrophage phenotype. Depletion of these ‘pro-
tumorigenic’ N2 neutrophils, therefore, inhibits tumor growth [47, 161] and reduces the level
of immunosuppression in the tumor microenvironment [51, 162].
It has been demonstrated that both in CML and MM patients mature neutrophils are
immunosuppressive cells as G-MDSC [91, 163], indicating a pro-tumoral role of both
immature and mature neutrophils in cancer. Therefore, we named them N2 neutrophils.
Studies have demonstrated specific examples of tumor-mediated signals (such as TGFβ) that
induce N2 phenotype. We focused our attention on the role of MSC in tumor
microenvironment transformation. They are an important component of BM niche and play an
important role whitin an inflammatory milieu for their immunosuppressive ability which may
50
display negative effects in certain circumstances, promoting tumor evasion of immune
surveillance [164, 165].
Even though their contribution in promoting tumor growth, survival and drug-resistance has
been widely studied, the role of MSC in N2 phenotype activation and in promoting tumor
immune escape within the microenvironemnt remains unexplored. Our present experiments
demonstrated that MSC contribute to transform both the CML and MM microenvironment
into an immune suppressive one by orchestrating neutrophils. Indeed, only CML- and MM-
and SMM-MSC activate neutrophils into immunosuppressive N2. No suppressive effect was
ever observed incubating T lymphocytes with HD- or MGUS-MSCed-N, demonstrating that
tumor-associated MSC are functionally different from HD-MSC. Sa ́́nchez et colleagues
showed that immunosuppressive properties of MSC evolve along neoplastic transformation
[166]. Using a murine model, the authors demonstrated that both normal and in vitro
transformed MSC accumulated similar percentage of G-MDSC, but murine MDSC
(IL4Rαhigh/GR1low) differentiated in presence of transformed MSC, exhibited an enhanced
inhibitory effect on T cell proliferation. In human, it is still an open question to define a
different role of tumor versus healthy MSC. Our data contribute to elucidate the different role
of CML- and MM-MSC versus healthy MSC, confirming the alteration of their immune
modulatory ability in CML and MM patients. Since this difference has been found for isolated
CML- and MM-MSC after in vitro expansion, these stromal cells have a constitutive
functional alteration in immune regulation.
Exploring the immunomodulatory factors expressed by CML-MSC at Time 0, we found a
significant up-regulation of COX2, TGFβ, and IL6 compared to HD-MSC. These results
reveal an acquired impairment by CML-MSC in their immunomodulatory functions.
Moreover, during co-culture with PBMC, CML-MSC significantly up-regulated TGFβ, IL6,
and IL10 expression, that reprogram immature myeloid cells to become immunosuppressive
neutrophils [91, 167, 168]. Next, we examined the expression of immunomodulatory genes in
MSC educated-neutrophils before incubation with T lymphocytes. Compared to HD-, CML-
MSC ed-N up-regulated expression of ARG1, TNFα, IL1β, COX2 and IL6, providing thus
evidence that CML-MSC transform myeloid cells in immunosuppressive neutrophils. Indeed,
up-regulation of ARG1 is one of the main mechanisms of immunosuppression [34] and is
highly expressed by both MDSC and polymorphonuclear leukocytes in CML patients [168].
TNFα has been shown to arrest differentiation of immature myeloid cells and increase MDSC
suppressive activity [26, 139]. Also up-regulation of COX2 has been reported as mechanism
of MDSC-mediated immunosuppression [26]. In addition, more recently, IL-6 has been found
to stimulate NF-κB- mediated IDO upregulation in MDSC [169].

51
Similar results have been observed for MM-MSC. Exploring expression of
immunomodulatory factors, we found a statistically signicant upregulation of PTGS2, TGFβ,
NOS2, IL10 and IL6 expression in MM-MSC, suggesting that multiple mechanisms are
involved in the activation of N2 phenotype. Since gene expression changes were not found at
t0, the expression of the immune modulatory factors is influenced by interaction with PBMC
in vitro.
Collectively, all these data show how CML-MSC and MM-MSC directly orchestrate
neutrophils by driving activation of a N2 phenotype. Whether the alteration of the
immunoregulatory abilities of MSC reveals an acquired capacity by MSC themselves, as
consequence of a neoplastic transformation, or derived by interaction with tumor cells is a
relevant question for clinical oncology. Zhanget and colleagues demonstrated the contribution
of leukemia-induced alterations in the BM microenvironment that suppress normal HSC and
provide a selective advantage to LSC [170]. Although the TKI reduce normal HSC inhibition
by leukemic cells and facilitate their regrowth, it does not completely reverse leukemia-
associated changes in the microenvironment [170]. Therefore, it is important to determine the
mechanisms underlying these persistent changes and how leukemia-related alterations affect
LSC response to TKI. Activating a N2 phenotype, CML-MSC are relevant in regulating T
lymphocytes-mediated leukemia surveillance, becoming a potential target to act on leukemia
microenvironment. When compared with HD-MSC, MM-MSC differ in cytokine production,
show a decreased proliferative ability, a premature senescence and reduced ability to inhibit
T cell proliferation [171, 172]. MM-MSC exhibit a distinctive gene expression profile
compared to HD-MSC [173], suggesting that these differences could be attributed to the
presence of genomic alterations in MM counterpart [174].
Patients affected by MM show increased neovascularization of the bone marrow stroma[175].
The grade of this neovascularization seems to increase during the evolution from MGUS to
MM [176]. Our data show that MM-MSC are able to activate neutrophils in pro-angiogenic
cells. Therefore they contribute both directly [135] and indirectly to the “angiogenic switch”
that characterizes the transition from MGUS to MM. Moreover, since SMM-MSC have the
same immunological functional alterations observed for MM-MSC, the activaction of an
immunosuppressive microenvironemnt directed by MSC may contribute to the transition from
MGUS to MM.
Toll-like receptors (TLR) are type I integral membrane glycoproteins with a crucial role in
early host defence against invading pathogens [177, 178]. They are members of a larger
superfamily that includes the interleukin-1 receptors (IL-1R) with a conserved cytoplasmic
domain, that is known as the Toll/IL-1R (TIR) domain. Stimulation of TLR triggers the
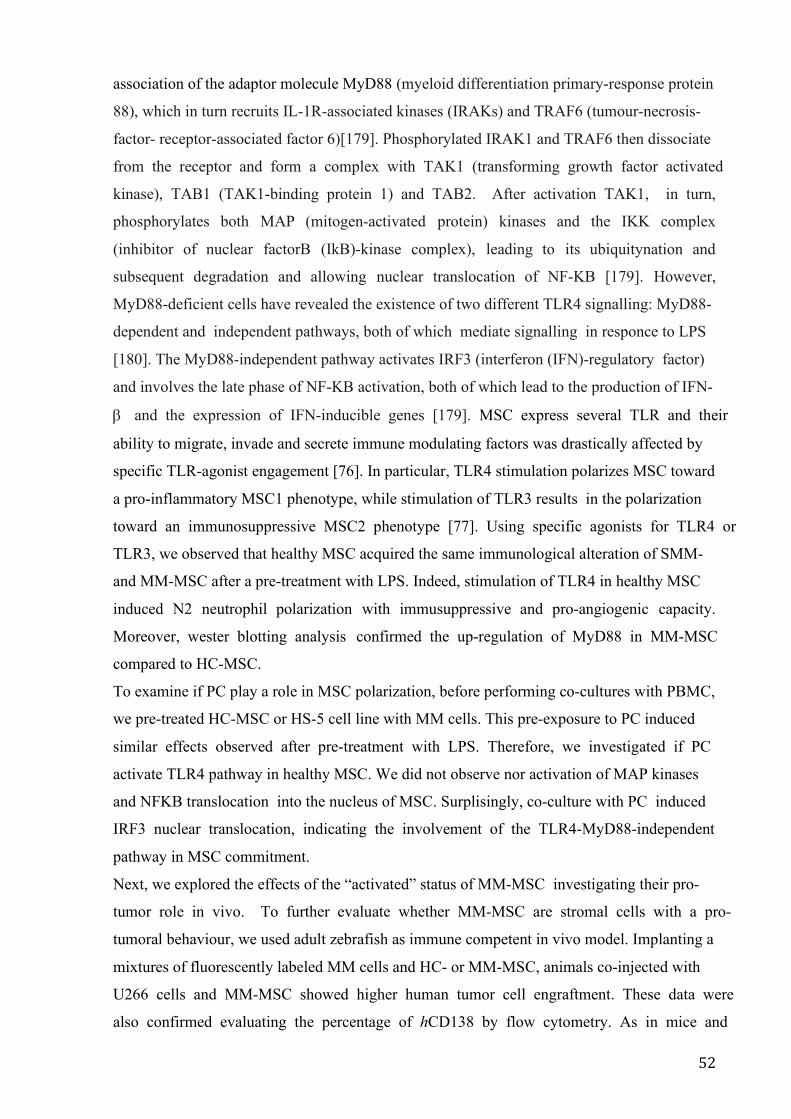
52
association of the adaptor molecule MyD88 (myeloid differentiation primary-response protein
88), which in turn recruits IL-1R-associated kinases (IRAKs) and TRAF6 (tumour-necrosis-
factor- receptor-associated factor 6)[179]. Phosphorylated IRAK1 and TRAF6 then dissociate
from the receptor and form a complex with TAK1 (transforming growth factor activated
kinase), TAB1 (TAK1-binding protein 1) and TAB2. After activation TAK1, in turn,
phosphorylates both MAP (mitogen-activated protein) kinases and the IKK complex
(inhibitor of nuclear factorB (IkB)-kinase complex), leading to its ubiquitynation and
subsequent degradation and allowing nuclear translocation of NF-KB [179]. However,
MyD88-deficient cells have revealed the existence of two different TLR4 signalling: MyD88-
dependent and independent pathways, both of which mediate signalling in responce to LPS
[180]. The MyD88-independent pathway activates IRF3 (interferon (IFN)-regulatory factor)
and involves the late phase of NF-KB activation, both of which lead to the production of IFN-
and the expression of IFN-inducible genes [179]. MSC express several TLR and their
ability to migrate, invade and secrete immune modulating factors was drastically affected by
specific TLR-agonist engagement [76]. In particular, TLR4 stimulation polarizes MSC toward
a pro-inflammatory MSC1 phenotype, while stimulation of TLR3 results in the polarization
toward an immunosuppressive MSC2 phenotype [77]. Using specific agonists for TLR4 or
TLR3, we observed that healthy MSC acquired the same immunological alteration of SMM-
and MM-MSC after a pre-treatment with LPS. Indeed, stimulation of TLR4 in healthy MSC
induced N2 neutrophil polarization with immusuppressive and pro-angiogenic capacity.
Moreover, wester blotting analysis confirmed the up-regulation of MyD88 in MM-MSC
compared to HC-MSC.
To examine if PC play a role in MSC polarization, before performing co-cultures with PBMC,
we pre-treated HC-MSC or HS-5 cell line with MM cells. This pre-exposure to PC induced
similar effects observed after pre-treatment with LPS. Therefore, we investigated if PC
activate TLR4 pathway in healthy MSC. We did not observe nor activation of MAP kinases
and NFKB translocation into the nucleus of MSC. Surplisingly, co-culture with PC induced
IRF3 nuclear translocation, indicating the involvement of the TLR4-MyD88-independent
pathway in MSC commitment.
Next, we explored the effects of the “activated” status of MM-MSC investigating their pro-
tumor role in vivo. To further evaluate whether MM-MSC are stromal cells with a pro-
tumoral behaviour, we used adult zebrafish as immune competent in vivo model. Implanting a
mixtures of fluorescently labeled MM cells and HC- or MM-MSC, animals co-injected with
U266 cells and MM-MSC showed higher human tumor cell engraftment. These data were
also confirmed evaluating the percentage of hCD138 by flow cytometry. As in mice and
53
humans, also zebrafish has a genetically defined Th1/Th2 bias [143]. Therefore, we analyzed
the expression of the master regulator transcription factors for Th1/Th2 and Th1- and Th2-
type cytokines to better assess in vivo the involvement of the immune escape mechanisms
promoted by co-injection of PC with MM-MSC. Our data revealed that MM-MSC and PC
mixture promoted a Th2 responce, indicating that MSC from MM patients enhance
mechanisms that circumvent the immune response.
In conclusion, our results highlight an important interplay between tumor cells, MSC and
immune cells (Fig. 20). Indeed, tumor cells are able to promote MDSC proliferation and
immune dysfunction in MSC with their consequent commitment toward an “activated” status
to better ‘serve’ the cancer cells. Tumor microenvironment transformation from MGUS to
MM is associated with progressive activation of MSC and TLR4 signaling may play a pivotal
role inducing MSC commitment towards an inflammatory phenotype.
Figure 20. Tumor microenvironment transformation.
54
INFγ: interferon gamma TNFα: tumor necrosis factor α IL1: interleukin 1 IL6: interleukin 6 IL8: interleukin 8 IL10: interleukin 10 IL32: interleukin 32 IL1β: interleukin 1β CSF1: colony stimulating factor 1 APC: antigen presenting cells A2aR: adenosine A2a receptor B7RP1: B7-related protein BTLA: B and T lymphocyte attenuator GAL9: galectin 9 HVEM: herpes virus entry mediator ICOS: inducible T cell co-stimulator KIR: killer cell immunoglobulin-like receptor LAG3: lymphocyte activation gene 3 PD-1: programmed cell death protein 1 PDL-1: PD1 ligand TGFβ: transforming growth factor-β TIM3: T cell membrane protein 3 Arg1: arginase 1 IDO: indoleamine 2,3-dioxygenase NK: natural killer Treg: regulatory T cell MDSC: myeloid derived suppressor cells M-MDSC: monocytic-like MDSC G-MDSC: granulocytic-like MDSC PMN: polymorphonuclear neutrophils LDN: low-density neutrophils NDN: normal-density neutrophils NOS2: nitric oxide synthase 2 ROS: reactive oxygen species WBC: white blood cells DC: dendritic cell N1: anti-tumorigenic neutrophils N2: pro-tumorigenic neutrophils TAN: tumor-associated neutrophils CCL2: C-C Motif Chemokine Ligand 2 CCL17: C-C Motif Chemokine Ligand 17 MSC: mesenchymal stromal cells CAF: cancer associated fibroblasts MHC: major histocompatibility complex TLR: Toll-like receptors αSMA: α-smooth muscle actin HSC/HPC: hematopoietic stem/progenitor cells BM: bone marrow AML: acute myeloid leukemia CML: chronic myeloid leukemia CLL: chronic lymphocytic leukemia PGE2: prostaglandin 2

55
HSC: haematopoietic stem cell TKI: tyrosine kinase inhibitor CMR: complete molecular response TCR: T cell receptor MM: multiple myeloma MGUS: monoclonal gammopathy of undeterminated significance SMM: smoldering multiple myeloma HLA: human leukocyte antigen TAM: tumor-associated macrophages IM: imatinb NIL: nilotinib DAS: dasatinib PBMC: peripheral blood mononucleated cells HD: healthy donor HGB: hemoglobin PLT: platelet LDH: lactate dehydrogenase CFSE: carboxyfluorescein succinimidyl ester PHA: phytohemagglutinin SEM: Scanning Electron Microscopy TEM: Transmission Electron Microscopy Ed-N: educated neutrophils MSCed-N: MSC educated neutrophils BTZ: bortezomib LEN: lenalidomide POMA: pomalidomide HBMEC: human brain microvascular endothelial cells MyD88: myeloid differentiation 88 IRF3: interferon regulatory factor 3 NFKB: nuclear factor kappa-light-chain-enhancer of activated B cells DAPI: 4′,6-diamidino-2-phenylindole DiIC18(5)-DS: 1,1'-Dioctadecyl-3,3,3',3'-Tetramethylindodicarbocyanine-5,5'-Disulfonic Acid zIL4: zebrafish interleukin 4 zIL13: interleukin 13 zTBX21: zebrafish T-box transcription factor zGATA3: zebrafish GATA binding protein 3 GAPDH: Glyceraldeyde-3-Phosphate Dehydrogenase COX2/PTGS2: cyclooxygenase-2/ Prostaglandin-Endoperoxide Synthase 2 LPS: lipopolysaccharide Poly(I:C): Polyinosinic-polycytidylic acid VEGFA: vascular endothelial growth factor A Th1: T helper 1 Th2: T helper 2 hCD138: human CD138 hCD90: human CD90 MRD: minimal residual disease CTL: cytotoxic T lymphocytes IRAK: IL-1R-associated kinases IL-1R: interleukin-1 receptor TIR: Toll/IL-1R TRAF6: tumour-necrosis-factor- receptor-associated factor 6

56
TAK1: transforming growth factor activated kinase TAB1: TAK1-binding protein 1

57
SUPPLENTARY FIGURES Giallongo et al. JCMM 2017
S-Figure 1. Flow cytometry plots with gating strategies for the identification of MDSC cells. The figure
shows a representative cytoflorimetric analysis with gates set on CD11b +CD33+CD14-HLADR- (G-MDSC) (A)
and CD14+HLADR- (M-MDSC) (B) cell populations.
Giallongo et al.; Oncotarget 2016

58
S-Figure 2: Evaluation of MSC specific surface antigen expression. Representative data from one MM-MSC
sample. Flow cytometry analysis shows that MSC are positive for CD90 and CD105 and negative for CD34 and
CD45.
Giallongo et al.; Oncotarget 2016
S-Figure 3: Purity of educated neutrophils after magnetic cell separation. After separation, the cells were
incubated with fuorescently labeled anti-CD11b, anti-CD15, anti-CD14 and anti-HLADR antibodies, and the
purity of the cells was analyzed by flow cytometry. The figure reports the representative flow cytometry dot
plots showing the purity of educated neutrophils.
59
REFERENCES
1. Vinay DS, Ryan EP, Pawelec G et al. Immune evasion in cancer: Mechanistic basis and therapeutic strategies. Semin Cancer Biol 2015; 35 Suppl: S185-198. 2. Zamarron BF, Chen W. Dual roles of immune cells and their factors in cancer development and progression. Int J Biol Sci 2011; 7: 651-658. 3. Balkwill F, Mantovani A. Inflammation and cancer: back to Virchow? Lancet 2001; 357: 539-545. 4. Grivennikov SI, Greten FR, Karin M. Immunity, inflammation, and cancer. Cell 2010; 140: 883-899. 5. Dunn GP, Old LJ, Schreiber RD. The three Es of cancer immunoediting. Annu Rev Immunol 2004; 22: 329-360. 6. Swann JB, Smyth MJ. Immune surveillance of tumors. J Clin Invest 2007; 117: 1137-1146. 7. Pardoll DM. The blockade of immune checkpoints in cancer immunotherapy. Nat Rev Cancer 2012; 12: 252-264. 8. Alpan RS, Zhang M, Pardee AB. Cell cycle-dependent expression of TAP1, TAP2, and HLA-B27 messenger RNAs in a human breast cancer cell line. Cancer Res 1996; 56: 4358-4361. 9. Seliger B, Hohne A, Knuth A et al. Reduced membrane major histocompatibility complex class I density and stability in a subset of human renal cell carcinomas with low TAP and LMP expression. Clin Cancer Res 1996; 2: 1427-1433. 10. Benitez R, Godelaine D, Lopez-Nevot MA et al. Mutations of the beta2-microglobulin gene result in a lack of HLA class I molecules on melanoma cells of two patients immunized with MAGE peptides. Tissue Antigens 1998; 52: 520-529. 11. D'Urso CM, Wang ZG, Cao Y et al. Lack of HLA class I antigen expression by cultured melanoma cells FO-1 due to a defect in B2m gene expression. J Clin Invest 1991; 87: 284-292. 12. Drake CG, Jaffee E, Pardoll DM. Mechanisms of immune evasion by tumors. Adv Immunol 2006; 90: 51-81. 13. Greenwald RJ, Freeman GJ, Sharpe AH. The B7 family revisited. Annu Rev Immunol 2005; 23: 515-548. 14. Hamanishi J, Mandai M, Matsumura N et al. PD-1/PD-L1 blockade in cancer treatment: perspectives and issues. Int J Clin Oncol 2016; 21: 462-473. 15. Botta C, Gulla A, Correale P et al. Myeloid-derived suppressor cells in multiple myeloma: pre-clinical research and translational opportunities. Front Oncol 2014; 4: 348. 16. Gabrilovich DI, Nagaraj S. Myeloid-derived suppressor cells as regulators of the immune system. Nat Rev Immunol 2009; 9: 162-174. 17. Youn JI, Nagaraj S, Collazo M, Gabrilovich DI. Subsets of myeloid-derived suppressor cells in tumor-bearing mice. J Immunol 2008; 181: 5791-5802. 18. Peranzoni E, Zilio S, Marigo I et al. Myeloid-derived suppressor cell heterogeneity and subset definition. Curr Opin Immunol 2010; 22: 238-244. 19. Montero AJ, Diaz-Montero CM, Kyriakopoulos CE et al. Myeloid-derived suppressor cells in cancer patients: a clinical perspective. J Immunother 2012; 35: 107-115. 20. Dumitru CA, Moses K, Trellakis S et al. Neutrophils and granulocytic myeloid-derived suppressor cells: immunophenotyping, cell biology and clinical relevance in human oncology. Cancer Immunol Immunother 2012; 61: 1155-1167.
60
21. Brandau S, Moses K, Lang S. The kinship of neutrophils and granulocytic myeloid-derived suppressor cells in cancer: cousins, siblings or twins? Semin Cancer Biol 2013; 23: 171-182. 22. Scapini P, Cassatella MA. Social networking of human neutrophils within the immune system. Blood 2014; 124: 710-719. 23. Gabrilovich DI, Ostrand-Rosenberg S, Bronte V. Coordinated regulation of myeloid cells by tumours. Nat Rev Immunol 2012; 12: 253-268. 24. Corzo CA, Cotter MJ, Cheng P et al. Mechanism regulating reactive oxygen species in tumor-induced myeloid-derived suppressor cells. J Immunol 2009; 182: 5693-5701. 25. Schmid MC, Varner JA. Myeloid cells in the tumor microenvironment: modulation of tumor angiogenesis and tumor inflammation. J Oncol 2010; 2010: 201026. 26. Rodriguez PC, Hernandez CP, Quiceno D et al. Arginase I in myeloid suppressor cells is induced by COX-2 in lung carcinoma. J Exp Med 2005; 202: 931-939. 27. Huang B, Pan PY, Li Q et al. Gr-1+CD115+ immature myeloid suppressor cells mediate the development of tumor-induced T regulatory cells and T-cell anergy in tumor-bearing host. Cancer Res 2006; 66: 1123-1131. 28. Serafini P, Mgebroff S, Noonan K, Borrello I. Myeloid-derived suppressor cells promote cross-tolerance in B-cell lymphoma by expanding regulatory T cells. Cancer Res 2008; 68: 5439-5449. 29. Pan PY, Ma G, Weber KJ et al. Immune stimulatory receptor CD40 is required for T-cell suppression and T regulatory cell activation mediated by myeloid-derived suppressor cells in cancer. Cancer Res 2010; 70: 99-108. 30. Yang L, Huang J, Ren X et al. Abrogation of TGF beta signaling in mammary carcinomas recruits Gr-1+CD11b+ myeloid cells that promote metastasis. Cancer Cell 2008; 13: 23-35. 31. Srivastava MK, Sinha P, Clements VK et al. Myeloid-derived suppressor cells inhibit T-cell activation by depleting cystine and cysteine. Cancer Res 2010; 70: 68-77. 32. Hanson EM, Clements VK, Sinha P et al. Myeloid-derived suppressor cells down-regulate L-selectin expression on CD4+ and CD8+ T cells. J Immunol 2009; 183: 937-944. 33. Li H, Han Y, Guo Q et al. Cancer-expanded myeloid-derived suppressor cells induce anergy of NK cells through membrane-bound TGF-beta 1. J Immunol 2009; 182: 240-249. 34. Giallongo C, Parrinello N, Brundo MV et al. Myeloid derived suppressor cells in chronic myeloid leukemia. Front Oncol 2015; 5: 107. 35. Tadmor T, Attias D, Polliack A. Myeloid-derived suppressor cells--their role in haemato-oncological malignancies and other cancers and possible implications for therapy. Br J Haematol 2011; 153: 557-567. 36. Talmadge JE. Pathways mediating the expansion and immunosuppressive activity of myeloid-derived suppressor cells and their relevance to cancer therapy. Clin Cancer Res 2007; 13: 5243-5248. 37. Mocsai A. Diverse novel functions of neutrophils in immunity, inflammation, and beyond. J Exp Med 2013; 210: 1283-1299. 38. Lowe DM, Redford PS, Wilkinson RJ et al. Neutrophils in tuberculosis: friend or foe? Trends Immunol 2012; 33: 14-25. 39. Abi Abdallah DS, Denkers EY. Neutrophils cast extracellular traps in response to protozoan parasites. Front Immunol 2012; 3: 382. 40. Makepeace BL, Martin C, Turner JD, Specht S. Granulocytes in helminth infection -- who is calling the shots? Curr Med Chem 2012; 19: 1567-1586. 41. Drescher B, Bai F. Neutrophil in viral infections, friend or foe? Virus Res 2013; 171: 1-7.
61
42. Gabriel C, Her Z, Ng LF. Neutrophils: neglected players in viral diseases. DNA Cell Biol 2013; 32: 665-675. 43. Mantovani A, Cassatella MA, Costantini C, Jaillon S. Neutrophils in the activation and regulation of innate and adaptive immunity. Nat Rev Immunol 2011; 11: 519-531. 44. Araki H, Katayama N, Yamashita Y et al. Reprogramming of human postmitotic neutrophils into macrophages by growth factors. Blood 2004; 103: 2973-2980. 45. Ghasemzadeh M, Hosseini E. Platelet-leukocyte crosstalk: Linking proinflammatory responses to procoagulant state. Thromb Res 2013; 131: 191-197. 46. Witko-Sarsat V, Pederzoli-Ribeil M, Hirsch E et al. Regulating neutrophil apoptosis: new players enter the game. Trends Immunol 2011; 32: 117-124. 47. Pekarek LA, Starr BA, Toledano AY, Schreiber H. Inhibition of tumor growth by elimination of granulocytes. J Exp Med 1995; 181: 435-440. 48. Shojaei F, Singh M, Thompson JD, Ferrara N. Role of Bv8 in neutrophil-dependent angiogenesis in a transgenic model of cancer progression. Proc Natl Acad Sci U S A 2008; 105: 2640-2645. 49. Tazawa H, Okada F, Kobayashi T et al. Infiltration of neutrophils is required for acquisition of metastatic phenotype of benign murine fibrosarcoma cells: implication of inflammation-associated carcinogenesis and tumor progression. Am J Pathol 2003; 163: 2221-2232. 50. Coffelt SB, Wellenstein MD, de Visser KE. Neutrophils in cancer: neutral no more. Nat Rev Cancer 2016; 16: 431-446. 51. Fridlender ZG, Sun J, Kim S et al. Polarization of tumor-associated neutrophil phenotype by TGF-beta: "N1" versus "N2" TAN. Cancer Cell 2009; 16: 183-194. 52. Bronte V, Zanovello P. Regulation of immune responses by L-arginine metabolism. Nat Rev Immunol 2005; 5: 641-654. 53. Lu T, Gabrilovich DI. Molecular pathways: tumor-infiltrating myeloid cells and reactive oxygen species in regulation of tumor microenvironment. Clin Cancer Res 2012; 18: 4877-4882. 54. Tsuda Y, Fukui H, Asai A et al. An immunosuppressive subtype of neutrophils identified in patients with hepatocellular carcinoma. J Clin Biochem Nutr 2012; 51: 204-212. 55. Mishalian I, Bayuh R, Eruslanov E et al. Neutrophils recruit regulatory T-cells into tumors via secretion of CCL17--a new mechanism of impaired antitumor immunity. Int J Cancer 2014; 135: 1178-1186. 56. Deans RJ, Moseley AB. Mesenchymal stem cells: biology and potential clinical uses. Exp Hematol 2000; 28: 875-884. 57. Barry FP, Murphy JM. Mesenchymal stem cells: clinical applications and biological characterization. Int J Biochem Cell Biol 2004; 36: 568-584. 58. Noel D, Djouad F, Jorgense C. Regenerative medicine through mesenchymal stem cells for bone and cartilage repair. Curr Opin Investig Drugs 2002; 3: 1000-1004. 59. Han Z, Jing Y, Zhang S et al. The role of immunosuppression of mesenchymal stem cells in tissue repair and tumor growth. Cell Biosci 2012; 2: 8. 60. Barcellos-de-Souza P, Gori V, Bambi F, Chiarugi P. Tumor microenvironment: bone marrow-mesenchymal stem cells as key players. Biochim Biophys Acta 2013; 1836: 321-335. 61. Karnoub AE, Dash AB, Vo AP et al. Mesenchymal stem cells within tumour stroma promote breast cancer metastasis. Nature 2007; 449: 557-563. 62. Dwyer RM, Potter-Beirne SM, Harrington KA et al. Monocyte chemotactic protein-1 secreted by primary breast tumors stimulates migration of mesenchymal stem cells. Clin Cancer Res 2007; 13: 5020-5027.

62
63. Rattigan Y, Hsu JM, Mishra PJ et al. Interleukin 6 mediated recruitment of mesenchymal stem cells to the hypoxic tumor milieu. Exp Cell Res 2010; 316: 3417-3424. 64. Suzuki K, Sun R, Origuchi M et al. Mesenchymal stromal cells promote tumor growth through the enhancement of neovascularization. Mol Med 2011; 17: 579-587. 65. Gutova M, Najbauer J, Frank RT et al. Urokinase plasminogen activator and urokinase plasminogen activator receptor mediate human stem cell tropism to malignant solid tumors. Stem Cells 2008; 26: 1406-1413. 66. Beckermann BM, Kallifatidis G, Groth A et al. VEGF expression by mesenchymal stem cells contributes to angiogenesis in pancreatic carcinoma. Br J Cancer 2008; 99: 622-631. 67. Shinagawa K, Kitadai Y, Tanaka M et al. Mesenchymal stem cells enhance growth and metastasis of colon cancer. Int J Cancer 2010; 127: 2323-2333. 68. Spaeth EL, Dembinski JL, Sasser AK et al. Mesenchymal stem cell transition to tumor-associated fibroblasts contributes to fibrovascular network expansion and tumor progression. PLoS One 2009; 4: e4992. 69. Ye H, Cheng J, Tang Y et al. Human bone marrow-derived mesenchymal stem cells produced TGFbeta contributes to progression and metastasis of prostate cancer. Cancer Invest 2012; 30: 513-518. 70. Jung Y, Kim JK, Shiozawa Y et al. Recruitment of mesenchymal stem cells into prostate tumours promotes metastasis. Nat Commun 2013; 4: 1795. 71. Studeny M, Marini FC, Champlin RE et al. Bone marrow-derived mesenchymal stem cells as vehicles for interferon-beta delivery into tumors. Cancer Res 2002; 62: 3603-3608. 72. Nakamizo A, Marini F, Amano T et al. Human bone marrow-derived mesenchymal stem cells in the treatment of gliomas. Cancer Res 2005; 65: 3307-3318. 73. Khakoo AY, Pati S, Anderson SA et al. Human mesenchymal stem cells exert potent antitumorigenic effects in a model of Kaposi's sarcoma. J Exp Med 2006; 203: 1235-1247. 74. Xu WT, Bian ZY, Fan QM et al. Human mesenchymal stem cells (hMSCs) target osteosarcoma and promote its growth and pulmonary metastasis. Cancer Lett 2009; 281: 32-41. 75. Akira S. Toll-like receptor signaling. J Biol Chem 2003; 278: 38105-38108. 76. Tomchuck SL, Zwezdaryk KJ, Coffelt SB et al. Toll-like receptors on human mesenchymal stem cells drive their migration and immunomodulating responses. Stem Cells 2008; 26: 99-107. 77. Waterman RS, Henkle SL, Betancourt AM. Mesenchymal stem cell 1 (MSC1)-based therapy attenuates tumor growth whereas MSC2-treatment promotes tumor growth and metastasis. PLoS One 2012; 7: e45590. 78. Zhao H, Peehl DM. Tumor-promoting phenotype of CD90hi prostate cancer-associated fibroblasts. Prostate 2009; 69: 991-1000. 79. Wen S, Niu Y, Yeh S, Chang C. BM-MSCs promote prostate cancer progression via the conversion of normal fibroblasts to cancer-associated fibroblasts. Int J Oncol 2015; 47: 719-727. 80. Paunescu V, Bojin FM, Tatu CA et al. Tumour-associated fibroblasts and mesenchymal stem cells: more similarities than differences. J Cell Mol Med 2011; 15: 635-646. 81. Zhang J, Niu C, Ye L et al. Identification of the haematopoietic stem cell niche and control of the niche size. Nature 2003; 425: 836-841. 82. Calvi LM, Adams GB, Weibrecht KW et al. Osteoblastic cells regulate the haematopoietic stem cell niche. Nature 2003; 425: 841-846.

63
83. Fleming HE, Janzen V, Lo Celso C et al. Wnt signaling in the niche enforces hematopoietic stem cell quiescence and is necessary to preserve self-renewal in vivo. Cell Stem Cell 2008; 2: 274-283. 84. Younos IH, Abe F, Talmadge JE. Myeloid-derived suppressor cells: their role in the pathophysiology of hematologic malignancies and potential as therapeutic targets. Leuk Lymphoma 2015; 56: 2251-2263. 85. Ramachandran IR, Martner A, Pisklakova A et al. Myeloid-derived suppressor cells regulate growth of multiple myeloma by inhibiting T cells in bone marrow. J Immunol 2013; 190: 3815-3823. 86. Van Valckenborgh E, Schouppe E, Movahedi K et al. Multiple myeloma induces the immunosuppressive capacity of distinct myeloid-derived suppressor cell subpopulations in the bone marrow. Leukemia 2012; 26: 2424-2428. 87. Chen X, Eksioglu EA, Zhou J et al. Induction of myelodysplasia by myeloid-derived suppressor cells. J Clin Invest 2013; 123: 4595-4611. 88. Gao L, Yu S, Zhang X. Hypothesis: Tim-3/galectin-9, a new pathway for leukemia stem cells survival by promoting expansion of myeloid-derived suppressor cells and differentiating into tumor-associated macrophages. Cell Biochem Biophys 2014; 70: 273-277. 89. Zirlik K. MDSCs: the final frontier of the microenvironment in CLL? Blood 2014; 124: 666-668. 90. Romano A, Parrinello NL, Vetro C et al. Circulating myeloid-derived suppressor cells correlate with clinical outcome in Hodgkin Lymphoma patients treated up-front with a risk-adapted strategy. Br J Haematol 2014. 91. Giallongo C, Parrinello N, Tibullo D et al. Myeloid derived suppressor cells (MDSCs) are increased and exert immunosuppressive activity together with polymorphonuclear leukocytes (PMNs) in chronic myeloid leukemia patients. PLoS One 2014; 9: e101848. 92. Poggi A, Musso A, Dapino I, Zocchi MR. Mechanisms of tumor escape from immune system: role of mesenchymal stromal cells. Immunol Lett 2014; 159: 55-72. 93. Yamazaki S, Iwama A, Takayanagi S et al. TGF-beta as a candidate bone marrow niche signal to induce hematopoietic stem cell hibernation. Blood 2009; 113: 1250-1256. 94. Nauta AJ, Fibbe WE. Immunomodulatory properties of mesenchymal stromal cells. Blood 2007; 110: 3499-3506. 95. Mougiakakos D, Jitschin R, Johansson CC et al. The impact of inflammatory licensing on heme oxygenase-1-mediated induction of regulatory T cells by human mesenchymal stem cells. Blood 2011; 117: 4826-4835. 96. Soleymaninejadian E, Pramanik K, Samadian E. Immunomodulatory properties of mesenchymal stem cells: cytokines and factors. Am J Reprod Immunol 2012; 67: 1-8. 97. Wang G, Zhang S, Wang F et al. Expression and biological function of programmed death ligands in human placenta mesenchymal stem cells. Cell Biol Int 2013; 37: 137-148. 98. Groffen J, Stephenson JR, Heisterkamp N et al. The human c-abl oncogene in the Philadelphia translocation. J Cell Physiol Suppl 1984; 3: 179-191. 99. de Klein A, van Kessel AG, Grosveld G et al. A cellular oncogene is translocated to the Philadelphia chromosome in chronic myelocytic leukaemia. Nature 1982; 300: 765-767. 100. Gambacorti-Passerini C, Antolini L, Mahon FX et al. Multicenter independent assessment of outcomes in chronic myeloid leukemia patients treated with imatinib. J Natl Cancer Inst 2011; 103: 553-561.

64
101. Marin D, Rotolo A, Milojkovic D, Goldman J. The next questions in chronic myeloid leukaemia and their answers. Curr Opin Hematol 2013; 20: 163-168. 102. Press RD. Major molecular response in CML patients treated with tyrosine kinase inhibitors: the paradigm for monitoring targeted cancer therapy. Oncologist 2010; 15: 744-749. 103. Muller L, Pawelec G. Chronic phase CML patients possess T cells capable of recognising autologous tumour cells. Leuk Lymphoma 2002; 43: 943-951. 104. Bertazzoli C, Marchesi E, Passoni L et al. Differential recognition of a BCR/ABL peptide by lymphocytes from normal donors and chronic myeloid leukemia patients. Clin Cancer Res 2000; 6: 1931-1935. 105. Chen X, Woiciechowsky A, Raffegerst S et al. Impaired expression of the CD3-zeta chain in peripheral blood T cells of patients with chronic myeloid leukaemia results in an increased susceptibility to apoptosis. Br J Haematol 2000; 111: 817-825. 106. Chen CI, Koschmieder S, Kerstiens L et al. NK cells are dysfunctional in human chronic myelogenous leukemia before and on imatinib treatment and in BCR-ABL-positive mice. Leukemia 2012; 26: 465-474. 107. Bachy E, Bernaud J, Roy P et al. Quantitative and functional analyses of CD4(+) CD25(+) FoxP3(+) regulatory T cells in chronic phase chronic myeloid leukaemia patients at diagnosis and on imatinib mesylate. Br J Haematol 2011; 153: 139-143. 108. Christiansson L, Soderlund S, Svensson E et al. Increased level of myeloid-derived suppressor cells, programmed death receptor ligand 1/programmed death receptor 1, and soluble CD25 in Sokal high risk chronic myeloid leukemia. PLoS One 2013; 8: e55818. 109. Campiotti L, Suter MB, Guasti L et al. Imatinib discontinuation in chronic myeloid leukaemia patients with undetectable BCR-ABL transcript level: A systematic review and a meta-analysis. Eur J Cancer 2017; 77: 48-56. 110. Ross DM, Branford S, Seymour JF et al. Safety and efficacy of imatinib cessation for CML patients with stable undetectable minimal residual disease: results from the TWISTER study. Blood 2013; 122: 515-522. 111. Mahon FX, Rea D, Guilhot J et al. Discontinuation of imatinib in patients with chronic myeloid leukaemia who have maintained complete molecular remission for at least 2 years: the prospective, multicentre Stop Imatinib (STIM) trial. Lancet Oncol 2010; 11: 1029-1035. 112. Mahon FX. Discontinuation of tyrosine kinase therapy in CML. Ann Hematol 2015; 94 Suppl 2: S187-193. 113. Ohyashiki K, Katagiri S, Tauchi T et al. Increased natural killer cells and decreased CD3(+)CD8(+)CD62L(+) T cells in CML patients who sustained complete molecular remission after discontinuation of imatinib. Br J Haematol 2012; 157: 254-256. 114. Caers J, Vande broek I, De Raeve H et al. Multiple myeloma--an update on diagnosis and treatment. Eur J Haematol 2008; 81: 329-343. 115. Miceli TS, Colson K, Faiman BM et al. Maintaining bone health in patients with multiple myeloma: survivorship care plan of the International Myeloma Foundation Nurse Leadership Board. Clin J Oncol Nurs 2011; 15 Suppl: 9-23. 116. Pfreundschuh M. Inheritance in MGUS and MM. Oncotarget 2015; 6: 32287-32288. 117. Guglielmelli T, Giugliano E, Brunetto V et al. mTOR pathway activation in multiple myeloma cell lines and primary tumour cells: pomalidomide enhances cytoplasmic-nuclear shuttling of mTOR protein. Oncoscience 2015; 2: 382-394. 118. Gao Y, Workman S, Gadola S et al. Common variable immunodeficiency is associated with a functional deficiency of invariant natural killer T cells. J Allergy Clin Immunol 2014; 133: 1420-1428, 1428 e1421.
65
119. Dhodapkar MV, Geller MD, Chang DH et al. A reversible defect in natural killer T cell function characterizes the progression of premalignant to malignant multiple myeloma. J Exp Med 2003; 197: 1667-1676. 120. Nur H, Fostier K, Aspeslagh S et al. Preclinical evaluation of invariant natural killer T cells in the 5T33 multiple myeloma model. PLoS One 2013; 8: e65075. 121. Brimnes MK, Svane IM, Johnsen HE. Impaired functionality and phenotypic profile of dendritic cells from patients with multiple myeloma. Clin Exp Immunol 2006; 144: 76-84. 122. Ratta M, Fagnoni F, Curti A et al. Dendritic cells are functionally defective in multiple myeloma: the role of interleukin-6. Blood 2002; 100: 230-237. 123. Brown RD, Pope B, Murray A et al. Dendritic cells from patients with myeloma are numerically normal but functionally defective as they fail to up-regulate CD80 (B7-1) expression after huCD40LT stimulation because of inhibition by transforming growth factor-beta1 and interleukin-10. Blood 2001; 98: 2992-2998. 124. De Veirman K, Van Valckenborgh E, Lahmar Q et al. Myeloid-derived suppressor cells as therapeutic target in hematological malignancies. Front Oncol 2014; 4: 349. 125. Favaloro J, Liyadipitiya T, Brown R et al. Myeloid derived suppressor cells are numerically, functionally and phenotypically different in patients with multiple myeloma. Leuk Lymphoma 2014; 55: 2893-2900. 126. Gorgun GT, Whitehill G, Anderson JL et al. Tumor-promoting immune-suppressive myeloid-derived suppressor cells in the multiple myeloma microenvironment in humans. Blood 2013; 121: 2975-2987. 127. Sawant A, Deshane J, Jules J et al. Myeloid-derived suppressor cells function as novel osteoclast progenitors enhancing bone loss in breast cancer. Cancer Res 2013; 73: 672-682. 128. Zhuang J, Zhang J, Lwin ST et al. Osteoclasts in multiple myeloma are derived from Gr-1+CD11b+myeloid-derived suppressor cells. PLoS One 2012; 7: e48871. 129. Sun H, Li Y, Zhang ZF et al. Increase in myeloid-derived suppressor cells (MDSCs) associated with minimal residual disease (MRD) detection in adult acute myeloid leukemia. Int J Hematol 2015; 102: 579-586. 130. McDonald MK, Capasso KE, Ajit SK. Purification and microRNA profiling of exosomes derived from blood and culture media. J Vis Exp 2013; e50294. 131. Tibullo D, Barbagallo I, Giallongo C et al. Effects of second-generation tyrosine kinase inhibitors towards osteogenic differentiation of human mesenchymal cells of healthy donors. Hematol Oncol 2012; 30: 27-33. 132. Vanella L, Kim DH, Sodhi K et al. Crosstalk between EET and HO-1 downregulates Bach1 and adipogenic marker expression in mesenchymal stem cell derived adipocytes. Prostaglandins Other Lipid Mediat 2011; 96: 54-62. 133. Lechner MG, Megiel C, Russell SM et al. Functional characterization of human Cd33+ and Cd11b+ myeloid-derived suppressor cell subsets induced from peripheral blood mononuclear cells co-cultured with a diverse set of human tumor cell lines. J Transl Med 2011; 9: 90. 134. Vittori M, Breznik B, Gredar T et al. Imaging of human glioblastoma cells and their interactions with mesenchymal stem cells in the zebrafish (Danio rerio) embryonic brain. Radiol Oncol 2016; 50: 159-167. 135. Frassanito MA, Rao L, Moschetta M et al. Bone marrow fibroblasts parallel multiple myeloma progression in patients and mice: in vitro and in vivo studies. Leukemia 2014; 28: 904-916. 136. Lin J, Zhang W, Zhao JJ et al. A clinically relevant in vivo zebrafish model of human multiple myeloma to study preclinical therapeutic efficacy. Blood 2016; 128: 249-252.

66
137. Anderson HC, Mulhall D, Garimella R. Role of extracellular membrane vesicles in the pathogenesis of various diseases, including cancer, renal diseases, atherosclerosis, and arthritis. Lab Invest 2010; 90: 1549-1557. 138. Wieckowski EU, Visus C, Szajnik M et al. Tumor-derived microvesicles promote regulatory T cell expansion and induce apoptosis in tumor-reactive activated CD8+ T lymphocytes. J Immunol 2009; 183: 3720-3730. 139. Sade-Feldman M, Kanterman J, Ish-Shalom E et al. Tumor necrosis factor-alpha blocks differentiation and enhances suppressive activity of immature myeloid cells during chronic inflammation. Immunity 2013; 38: 541-554. 140. Ria R, Reale A, De Luisi A et al. Bone marrow angiogenesis and progression in multiple myeloma. Am J Blood Res 2011; 1: 76-89. 141. Chun E, Lavoie S, Michaud M et al. CCL2 Promotes Colorectal Carcinogenesis by Enhancing Polymorphonuclear Myeloid-Derived Suppressor Cell Population and Function. Cell Rep 2015; 12: 244-257. 142. Zhu LY, Pan PP, Fang W et al. Essential role of IL-4 and IL-4Ralpha interaction in adaptive immunity of zebrafish: insight into the origin of Th2-like regulatory mechanism in ancient vertebrates. J Immunol 2012; 188: 5571-5584. 143. Hammaren MM, Oksanen KE, Nisula HM et al. Adequate Th2-type response associates with restricted bacterial growth in latent mycobacterial infection of zebrafish. PLoS Pathog 2014; 10: e1004190. 144. Lemaire M, Deleu S, De Bruyne E et al. The microenvironment and molecular biology of the multiple myeloma tumor. Adv Cancer Res 2011; 110: 19-42. 145. Schreiber RD, Old LJ, Smyth MJ. Cancer immunoediting: integrating immunity's roles in cancer suppression and promotion. Science 2011; 331: 1565-1570. 146. Miranda A, Funes JM, Sanchez N et al. Oncogenic Transformation Can Orchestrate Immune Evasion and Inflammation in Human Mesenchymal Stem Cells Independently of Extrinsic Immune-Selective Pressure. Cancer Res 2015; 75: 3032-3042. 147. Marvel D, Gabrilovich DI. Myeloid-derived suppressor cells in the tumor microenvironment: expect the unexpected. J Clin Invest 2015; 125: 3356-3364. 148. Srivastava MK, Zhu L, Harris-White M et al. Myeloid suppressor cell depletion augments antitumor activity in lung cancer. PLoS One 2012; 7: e40677. 149. Tsukamoto H, Nishikata R, Senju S, Nishimura Y. Myeloid-derived suppressor cells attenuate TH1 development through IL-6 production to promote tumor progression. Cancer Immunol Res 2013; 1: 64-76. 150. Fischer MA, Davies ML, Reider IE et al. CD11b(+), Ly6G(+) cells produce type I interferon and exhibit tissue protective properties following peripheral virus infection. PLoS Pathog 2011; 7: e1002374. 151. Wang Z, Zhang L, Wang H et al. Tumor-induced CD14+HLA-DR (-/low) myeloid-derived suppressor cells correlate with tumor progression and outcome of therapy in multiple myeloma patients. Cancer Immunol Immunother 2015; 64: 389-399. 152. Christiansson L, Soderlund S, Mangsbo S et al. The tyrosine kinase inhibitors imatinib and dasatinib reduce myeloid suppressor cells and release effector lymphocyte responses. Mol Cancer Ther 2015; 14: 1181-1191. 153. Sun H, Li Y, Zhang ZF et al. Increase in myeloid-derived suppressor cells (MDSCs) associated with minimal residual disease (MRD) detection in adult acute myeloid leukemia. Int J Hematol 2015. 154. Gustafson MP, Abraham RS, Lin Y et al. Association of an increased frequency of CD14+ HLA-DR lo/neg monocytes with decreased time to progression in chronic lymphocytic leukaemia (CLL). Br J Haematol 2012; 156: 674-676. 155. Fei F, Yu Y, Schmitt A et al. Dasatinib inhibits the proliferation and function of CD4+CD25+ regulatory T cells. Br J Haematol 2009; 144: 195-205.
67
156. Mao L, Deng WW, Yu GT et al. Inhibition of SRC family kinases reduces myeloid-derived suppressor cells in head and neck cancer. Int J Cancer 2017; 140: 1173-1185. 157. Mustjoki S, Ekblom M, Arstila TP et al. Clonal expansion of T/NK-cells during tyrosine kinase inhibitor dasatinib therapy. Leukemia 2009; 23: 1398-1405. 158. Rohon P, Porkka K, Mustjoki S. Immunoprofiling of patients with chronic myeloid leukemia at diagnosis and during tyrosine kinase inhibitor therapy. Eur J Haematol 2010; 85: 387-398. 159. Mizoguchi I, Yoshimoto T, Katagiri S et al. Sustained upregulation of effector natural killer cells in chronic myeloid leukemia after discontinuation of imatinib. Cancer Sci 2013; 104: 1146-1153. 160. Yoshimoto T, Mizoguchi I, Katagiri S et al. Immunosurveillance markers may predict patients who can discontinue imatinib therapy without relapse. Oncoimmunology 2014; 3: e28861. 161. Nozawa H, Chiu C, Hanahan D. Infiltrating neutrophils mediate the initial angiogenic switch in a mouse model of multistage carcinogenesis. Proc Natl Acad Sci U S A 2006; 103: 12493-12498. 162. Fridlender ZG, Albelda SM. Tumor-associated neutrophils: friend or foe? Carcinogenesis 2012; 33: 949-955. 163. Ramachandran IR, Condamine T, Lin C et al. Bone marrow PMN-MDSCs and neutrophils are functionally similar in protection of multiple myeloma from chemotherapy. Cancer Lett 2016; 371: 117-124. 164. Han Z, Tian Z, Lv G et al. Immunosuppressive effect of bone marrow-derived mesenchymal stem cells in inflammatory microenvironment favours the growth of B16 melanoma cells. J Cell Mol Med 2011; 15: 2343-2352. 165. Hall BM, Fortney JE, Taylor L et al. Stromal cells expressing elevated VCAM-1 enhance survival of B lineage tumor cells. Cancer Lett 2004; 207: 229-239. 166. Sanchez N, Miranda A, Funes JM et al. Oncogenic transformation tunes the cross-talk between mesenchymal stem cells and T lymphocytes. Cell Immunol 2014; 289: 174-184. 167. Filipazzi P, Valenti R, Huber V et al. Identification of a new subset of myeloid suppressor cells in peripheral blood of melanoma patients with modulation by a granulocyte-macrophage colony-stimulation factor-based antitumor vaccine. J Clin Oncol 2007; 25: 2546-2553. 168. Chen MF, Kuan FC, Yen TC et al. IL-6-stimulated CD11b+ CD14+ HLA-DR- myeloid-derived suppressor cells, are associated with progression and poor prognosis in squamous cell carcinoma of the esophagus. Oncotarget 2014; 5: 8716-8728. 169. Yu J, Wang Y, Yan F et al. Noncanonical NF-kappaB activation mediates STAT3-stimulated IDO upregulation in myeloid-derived suppressor cells in breast cancer. J Immunol 2014; 193: 2574-2586. 170. Wang L, Wang H, Chen H et al. Serum levels of soluble programmed death ligand 1 predict treatment response and progression free survival in multiple myeloma. Oncotarget 2015; 6: 41228-41236. 171. Andre T, Meuleman N, Stamatopoulos B et al. Evidences of early senescence in multiple myeloma bone marrow mesenchymal stromal cells. PLoS One 2013; 8: e59756. 172. Li B, Fu J, Chen P, Zhuang W. Impairment in immunomodulatory function of mesenchymal stem cells from multiple myeloma patients. Arch Med Res 2010; 41: 623-633. 173. Corre J, Mahtouk K, Attal M et al. Bone marrow mesenchymal stem cells are abnormal in multiple myeloma. Leukemia 2007; 21: 1079-1088.

68
174. Arnulf B, Lecourt S, Soulier J et al. Phenotypic and functional characterization of bone marrow mesenchymal stem cells derived from patients with multiple myeloma. Leukemia 2007; 21: 158-163. 175. Vacca A, Ribatti D, Presta M et al. Bone marrow neovascularization, plasma cell angiogenic potential, and matrix metalloproteinase-2 secretion parallel progression of human multiple myeloma. Blood 1999; 93: 3064-3073. 176. Mondello P, Cuzzocrea S, Navarra M, Mian M. Bone marrow micro-environment is a crucial player for myelomagenesis and disease progression. Oncotarget 2017; 8: 20394-20409. 177. Woo SR, Corrales L, Gajewski TF. Innate immune recognition of cancer. Annu Rev Immunol 2015; 33: 445-474. 178. Beutler B, Rietschel ET. Innate immune sensing and its roots: the story of endotoxin. Nat Rev Immunol 2003; 3: 169-176. 179. Akira S, Takeda K. Toll-like receptor signalling. Nat Rev Immunol 2004; 4: 499-511. 180. Kawai T, Adachi O, Ogawa T et al. Unresponsiveness of MyD88-deficient mice to endotoxin. Immunity 1999; 11: 115-122.