Immigrants, the Labour Market, and Potential Impacts of Skilled Migration Policy Changes
33
Immigrants, the Labour Market, and Potential Impacts of Skilled Migration Policy Changes Lesleyanne Hawthorne Professor – International Workforce Second Canada-Australia Round Table on Foreign Qualification Recognition VANCOUVER 20-22 March 2013
-
Upload
institute-for-research-on-public-policy-irpp -
Category
Documents
-
view
22 -
download
0
description
Lesleyanne Hawthorne, Professor – International Workforce at Second Canada-Australia Round Table onForeign Qualification Recognitionin Vancouver, 20-22 March 2013.
Transcript of Immigrants, the Labour Market, and Potential Impacts of Skilled Migration Policy Changes
Immigrants, the Labour Market, and Potential
Impacts of Skilled Migration Policy Changes
Lesleyanne Hawthorne
Professor – International Workforce
Second Canada-Australia Round Table on
Foreign Qualification Recognition
VANCOUVER
20-22 March 2013
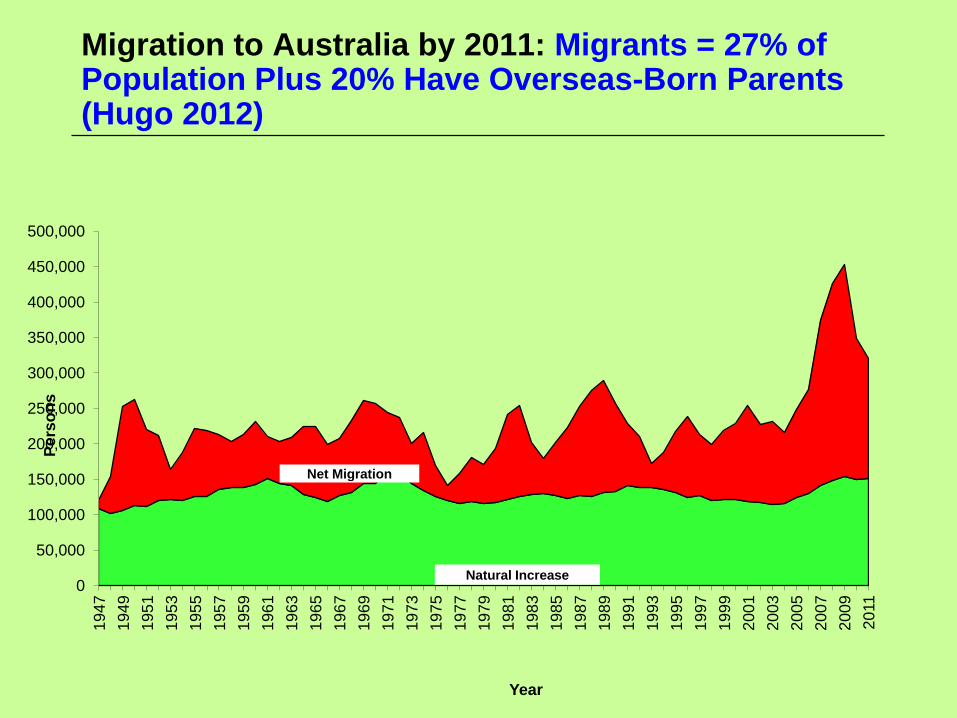
Migration to Australia by 2011: Migrants = 27% of Population Plus 20% Have Overseas-Born Parents (Hugo 2012)
0
50,000
100,000
150,000
200,000
250,000
300,000
350,000
400,000
450,000
500,000
1947
1949
1951
1953
1955
1957
1959
1961
1963
1965
1967
1969
1971
1973
1975
1977
1979
1981
1983
1985
1987
1989
1991
1993
1995
1997
1999
2001
2003
2005
2007
2009
2011
Pers
on
s
Year
Natural Increase
Net Migration
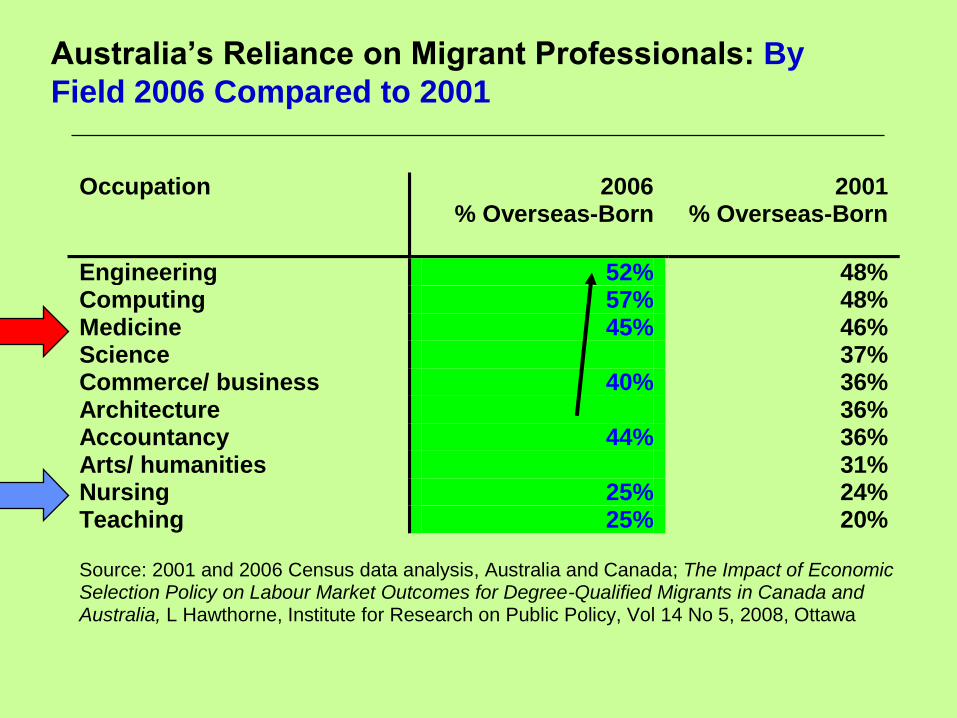
Australia’s Reliance on Migrant Professionals: By
Field 2006 Compared to 2001
Occupation 2006 % Overseas-Born
2001 % Overseas-Born
Engineering 52% 48% Computing 57% 48% Medicine 45% 46% Science 37% Commerce/ business 40% 36% Architecture 36% Accountancy 44% 36% Arts/ humanities 31% Nursing 25% 24% Teaching 25% 20% Source: 2001 and 2006 Census data analysis, Australia and Canada; The Impact of Economic Selection Policy on Labour Market Outcomes for Degree-Qualified Migrants in Canada and Australia, L Hawthorne, Institute for Research on Public Policy, Vol 14 No 5, 2008, Ottawa
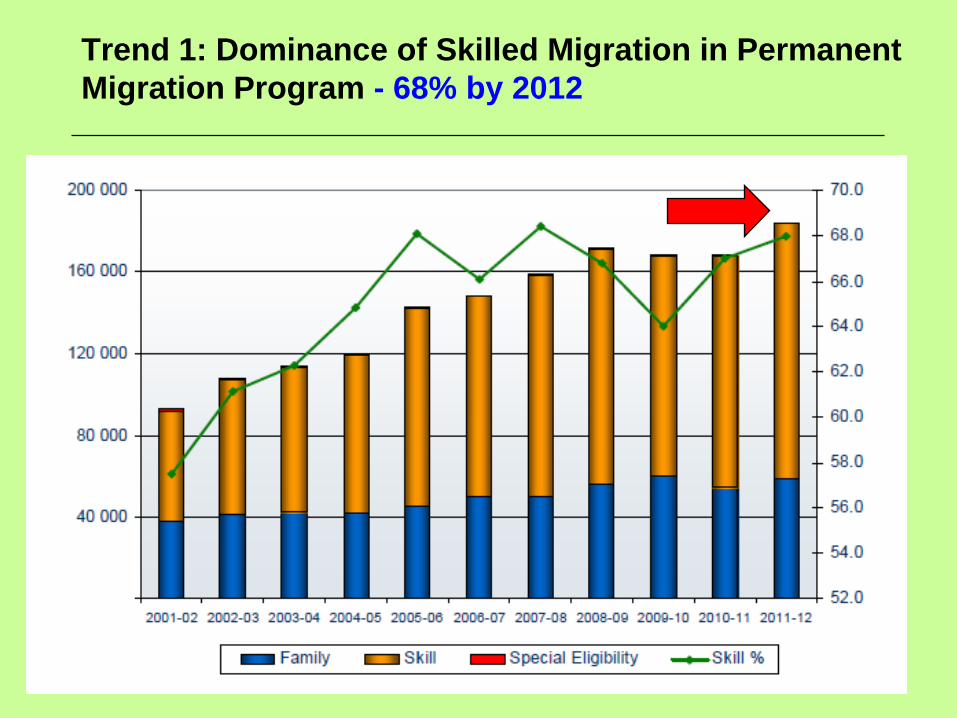
Trend 1: Dominance of Skilled Migration in Permanent
Migration Program - 68% by 2012
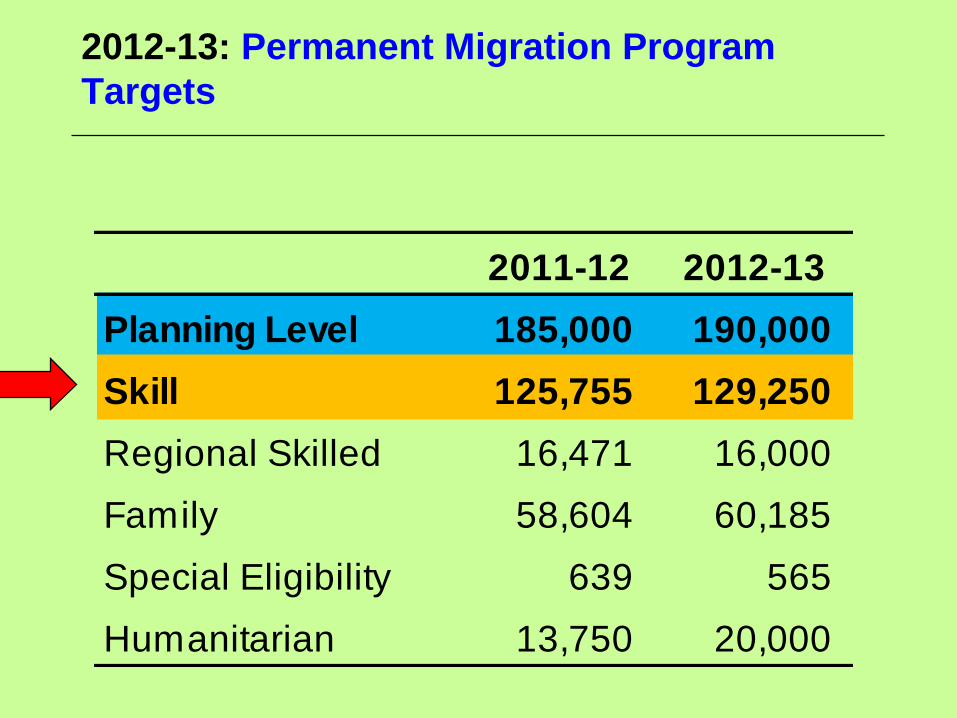
2012-13: Permanent Migration Program
Targets
2011-12 2012-13
Planning Level 185,000 190,000
Skill 125,755 129,250
Regional Skilled 16,471 16,000
Family 58,604 60,185
Special Eligibility 639 565
Humanitarian 13,750 20,000
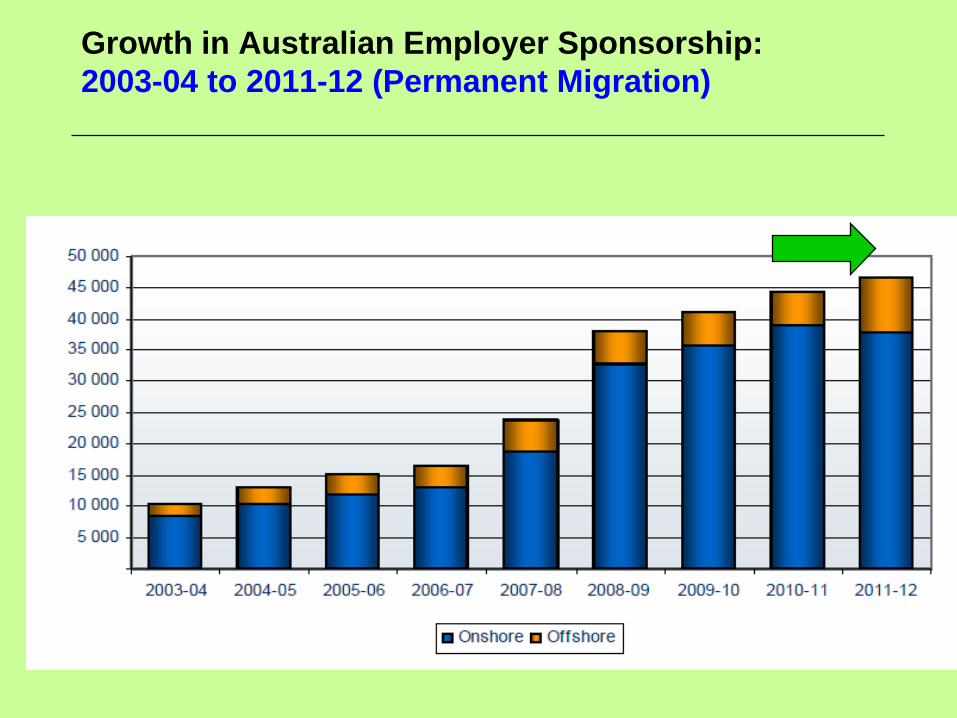
Growth in Australian Employer Sponsorship:
2003-04 to 2011-12 (Permanent Migration)
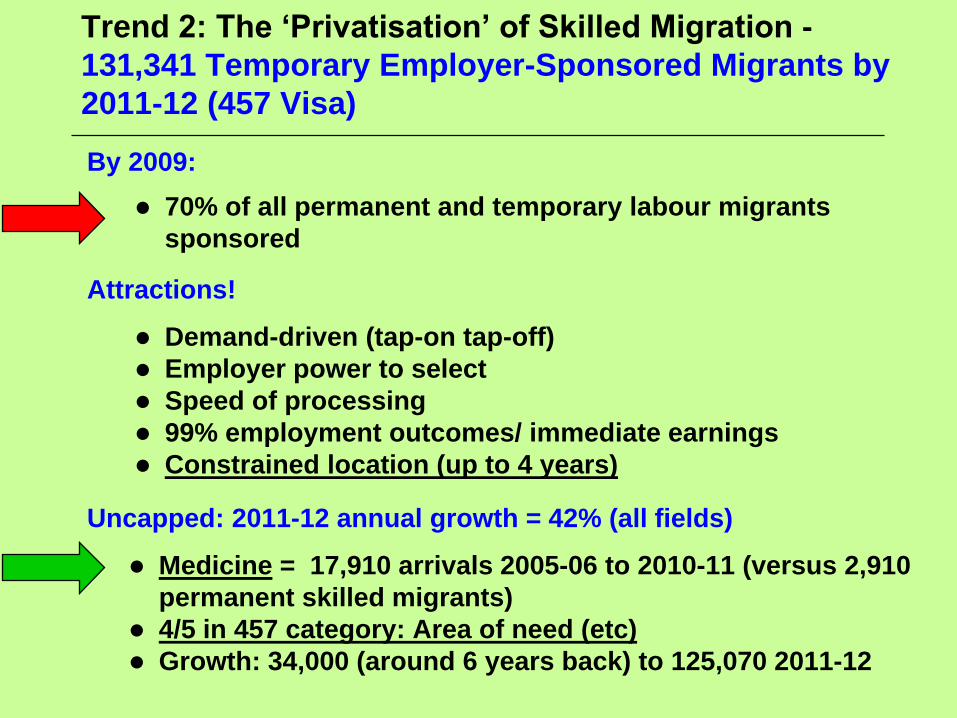
Trend 2: The ‘Privatisation’ of Skilled Migration -
131,341 Temporary Employer-Sponsored Migrants by
2011-12 (457 Visa)
By 2009:
70% of all permanent and temporary labour migrants
sponsored
Attractions!
Demand-driven (tap-on tap-off)
Employer power to select
Speed of processing
99% employment outcomes/ immediate earnings
Constrained location (up to 4 years)
Uncapped: 2011-12 annual growth = 42% (all fields)
Medicine = 17,910 arrivals 2005-06 to 2010-11 (versus 2,910
permanent skilled migrants)
4/5 in 457 category: Area of need (etc)
Growth: 34,000 (around 6 years back) to 125,070 2011-12
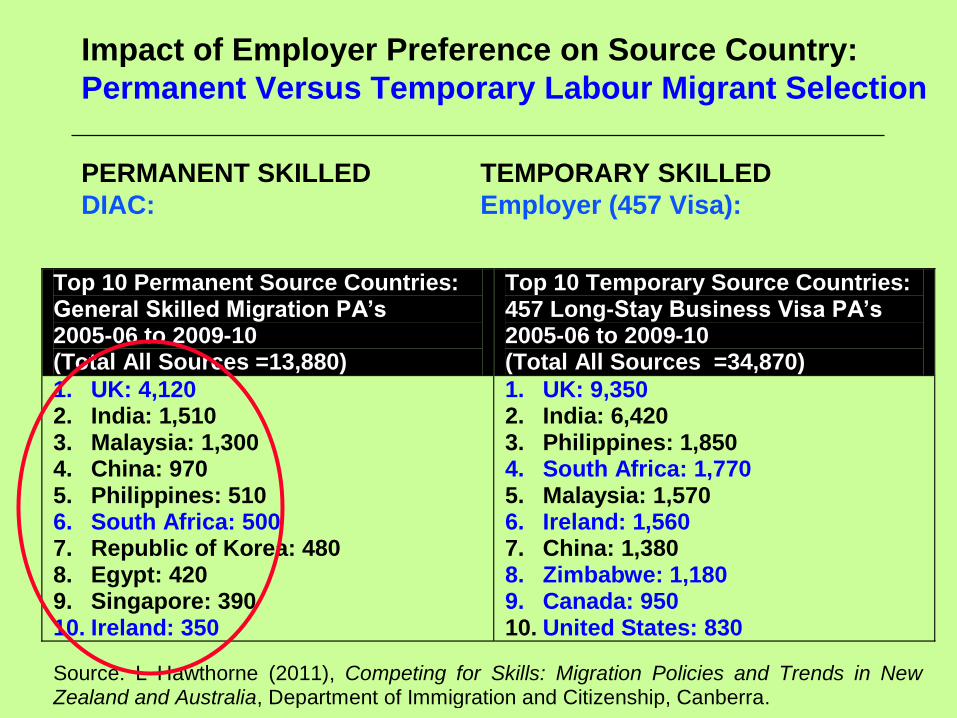
Impact of Employer Preference on Source Country:
Permanent Versus Temporary Labour Migrant Selection
PERMANENT SKILLED TEMPORARY SKILLED
DIAC: Employer (457 Visa):
Top 10 Permanent Source Countries: General Skilled Migration PA’s 2005-06 to 2009-10 (Total All Sources =13,880)
Top 10 Temporary Source Countries: 457 Long-Stay Business Visa PA’s 2005-06 to 2009-10 (Total All Sources =34,870)
1. UK: 4,120 2. India: 1,510 3. Malaysia: 1,300 4. China: 970 5. Philippines: 510 6. South Africa: 500 7. Republic of Korea: 480 8. Egypt: 420 9. Singapore: 390 10. Ireland: 350
1. UK: 9,350 2. India: 6,420 3. Philippines: 1,850 4. South Africa: 1,770 5. Malaysia: 1,570 6. Ireland: 1,560 7. China: 1,380 8. Zimbabwe: 1,180 9. Canada: 950 10. United States: 830
Source: L Hawthorne (2011), Competing for Skills: Migration Policies and Trends in New Zealand and Australia, Department of Immigration and Citizenship, Canberra.
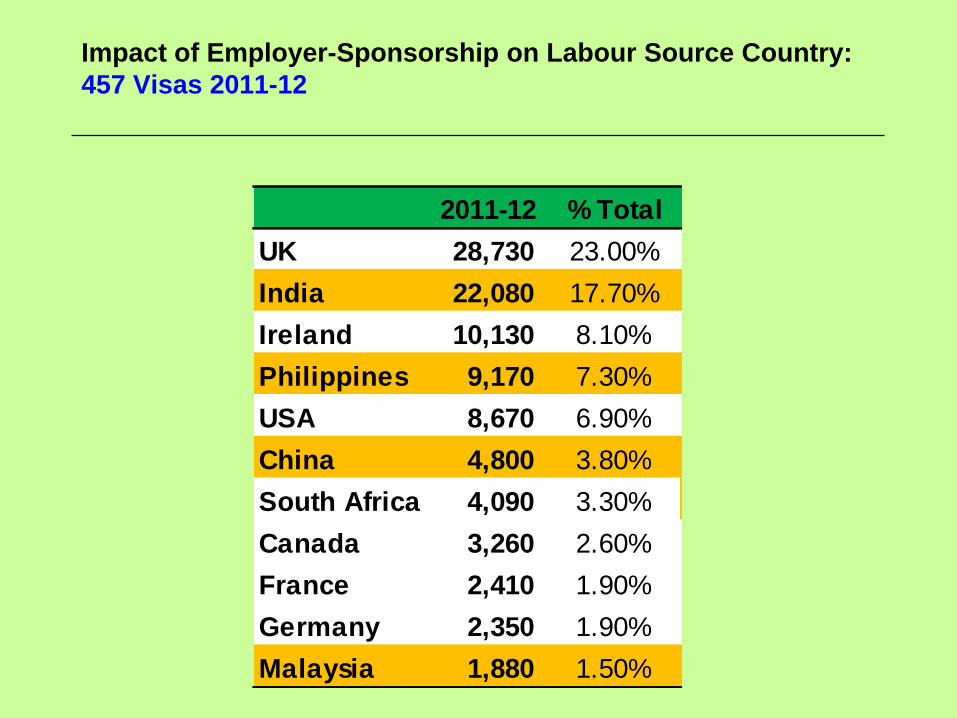
Impact of Employer-Sponsorship on Labour Source Country:
457 Visas 2011-12
2011-12 % Total
UK 28,730 23.00%
India 22,080 17.70%
Ireland 10,130 8.10%
Philippines 9,170 7.30%
USA 8,670 6.90%
China 4,800 3.80%
South Africa 4,090 3.30%
Canada 3,260 2.60%
France 2,410 1.90%
Germany 2,350 1.90%
Malaysia 1,880 1.50%
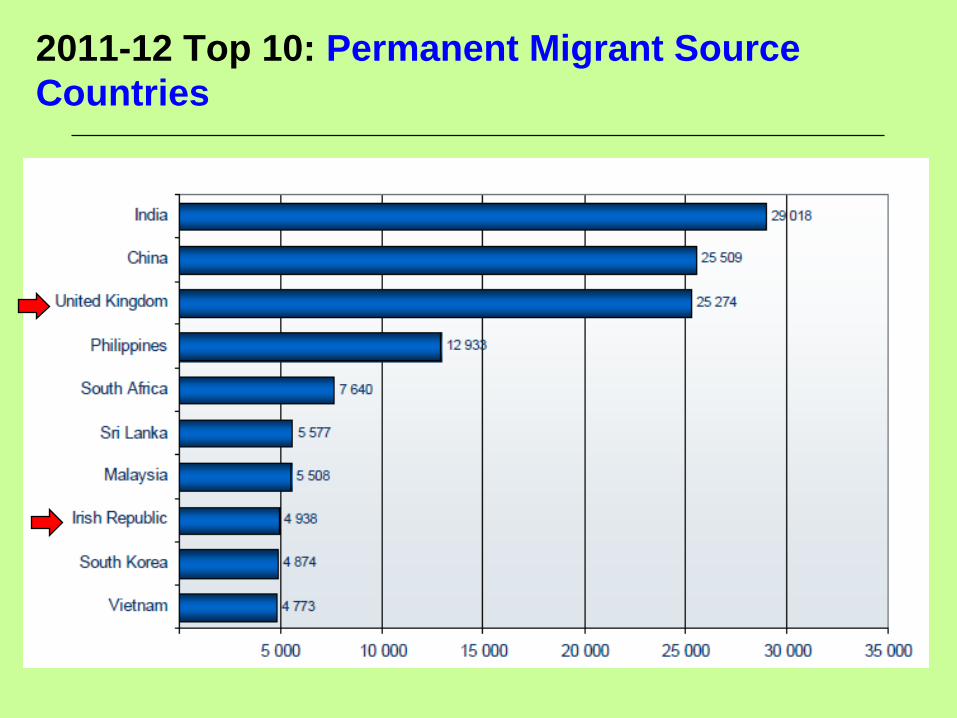
2011-12 Top 10: Permanent Migrant Source
Countries
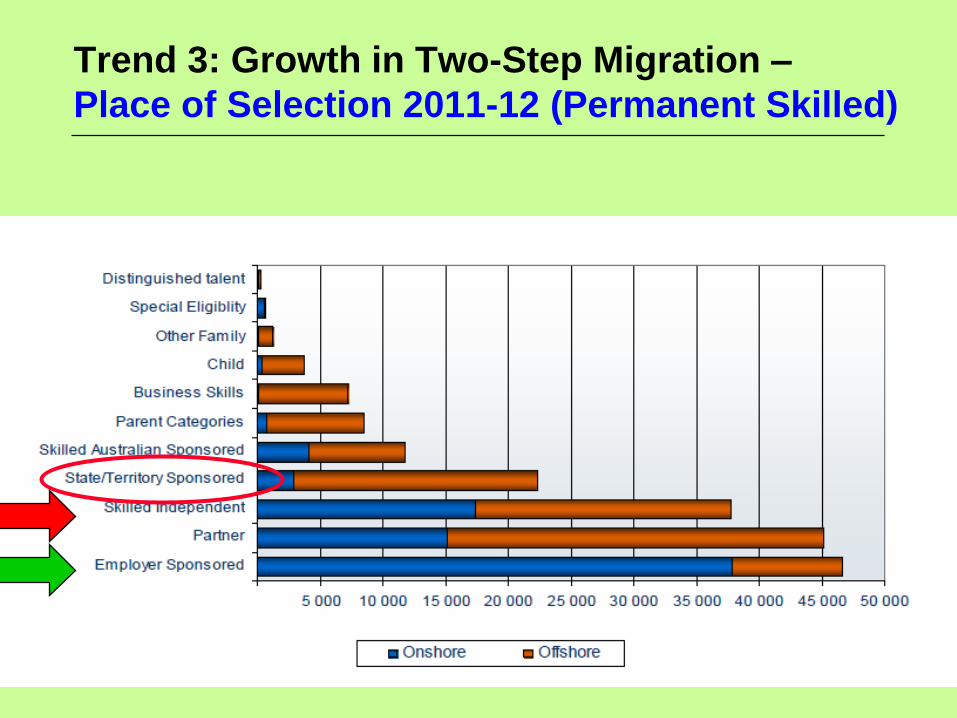
Trend 3: Growth in Two-Step Migration –
Place of Selection 2011-12 (Permanent Skilled)
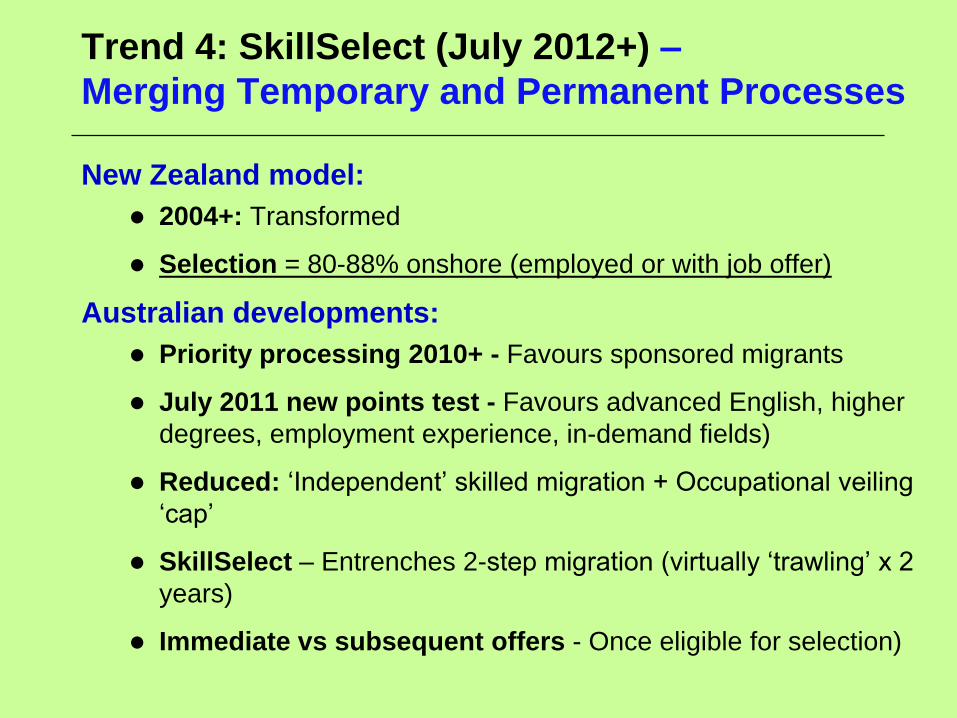
Trend 4: SkillSelect (July 2012+) –
Merging Temporary and Permanent Processes
New Zealand model:
2004+: Transformed
Selection = 80-88% onshore (employed or with job offer)
Australian developments:
Priority processing 2010+ - Favours sponsored migrants
July 2011 new points test - Favours advanced English, higher
degrees, employment experience, in-demand fields)
Reduced: ‘Independent’ skilled migration + Occupational veiling
‘cap’
SkillSelect – Entrenches 2-step migration (virtually ‘trawling’ x 2
years)
Immediate vs subsequent offers - Once eligible for selection)
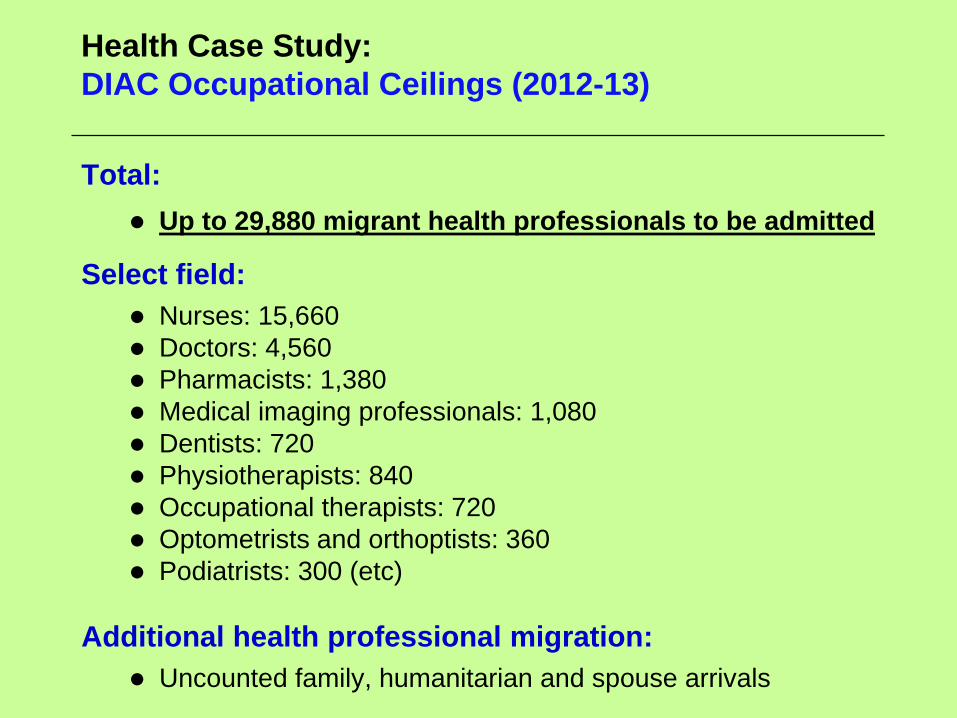
Health Case Study:
DIAC Occupational Ceilings (2012-13)
Total:
Up to 29,880 migrant health professionals to be admitted
Select field:
Nurses: 15,660
Doctors: 4,560
Pharmacists: 1,380
Medical imaging professionals: 1,080
Dentists: 720
Physiotherapists: 840
Occupational therapists: 720
Optometrists and orthoptists: 360
Podiatrists: 300 (etc)
Additional health professional migration:
Uncounted family, humanitarian and spouse arrivals
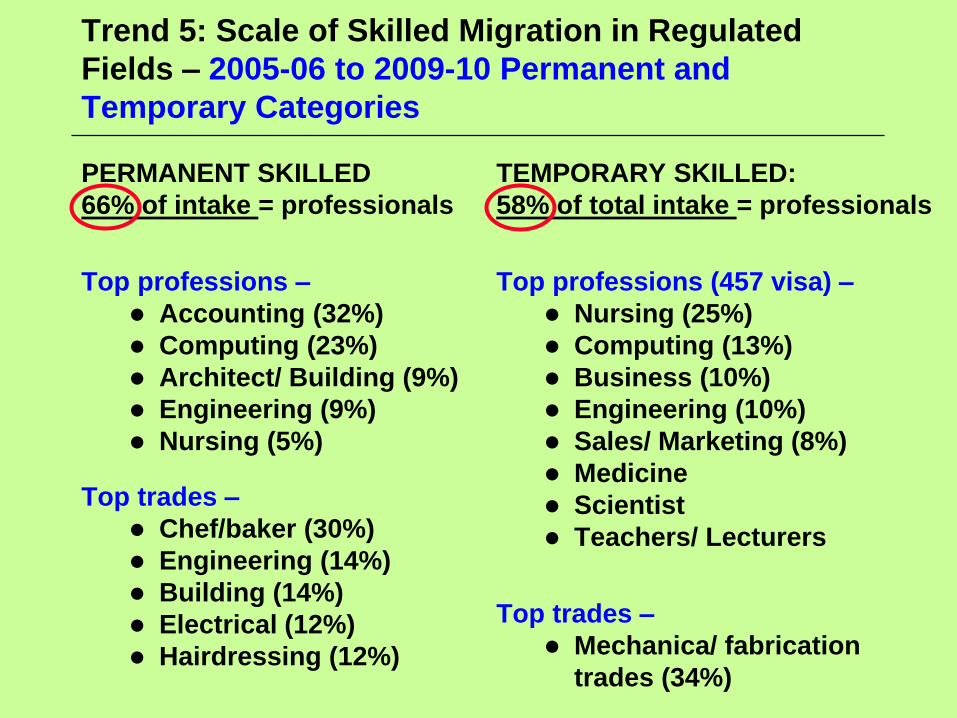
Trend 5: Scale of Skilled Migration in Regulated
Fields – 2005-06 to 2009-10 Permanent and
Temporary Categories
PERMANENT SKILLED
66% of intake = professionals
Top professions –
Accounting (32%)
Computing (23%)
Architect/ Building (9%)
Engineering (9%)
Nursing (5%)
Top trades –
Chef/baker (30%)
Engineering (14%)
Building (14%)
Electrical (12%)
Hairdressing (12%)
TEMPORARY SKILLED:
58% of total intake = professionals
Top professions (457 visa) –
Nursing (25%)
Computing (13%)
Business (10%)
Engineering (10%)
Sales/ Marketing (8%)
Medicine
Scientist
Teachers/ Lecturers
Top trades –
Mechanica/ fabrication
trades (34%)
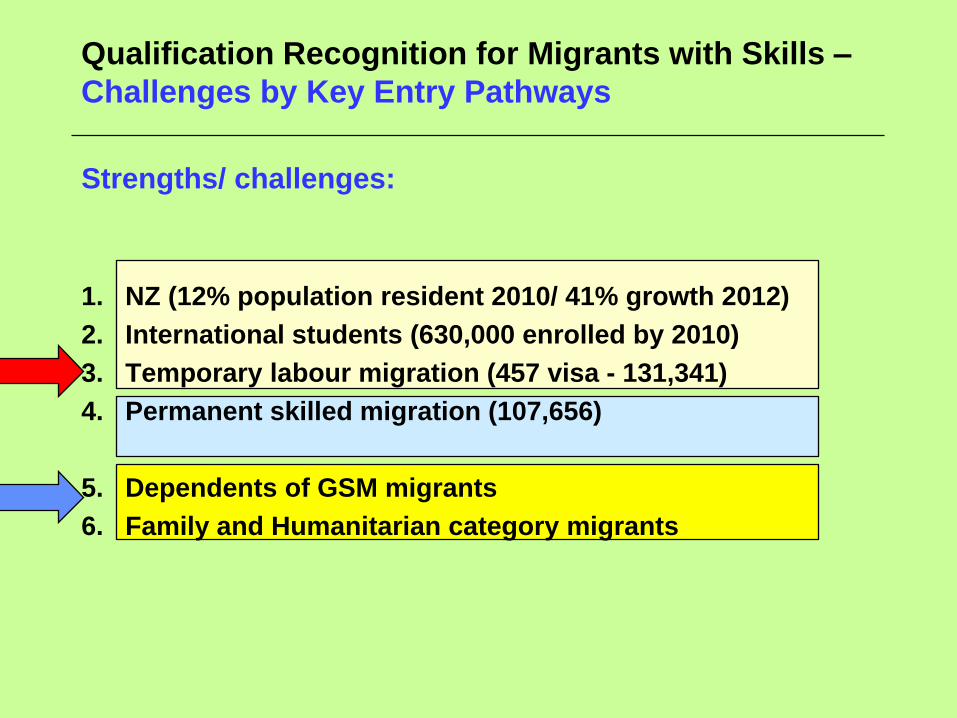
Strengths/ challenges:
1. NZ (12% population resident 2010/ 41% growth 2012)
2. International students (630,000 enrolled by 2010)
3. Temporary labour migration (457 visa - 131,341)
4. Permanent skilled migration (107,656)
5. Dependents of GSM migrants
6. Family and Humanitarian category migrants
Qualification Recognition for Migrants with Skills –
Challenges by Key Entry Pathways
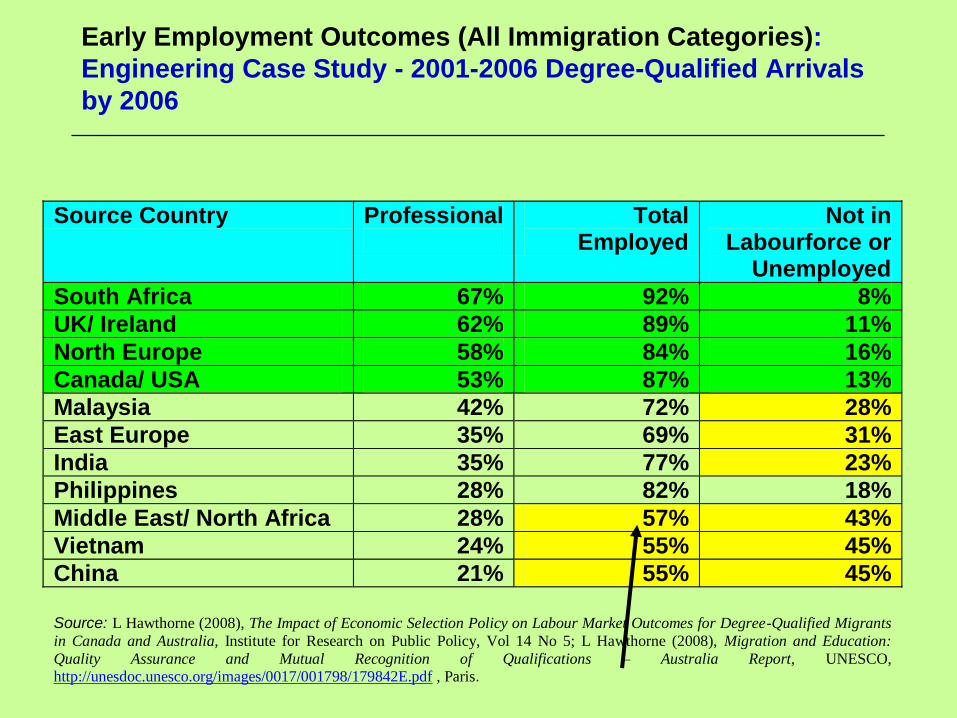
Early Employment Outcomes (All Immigration Categories):
Engineering Case Study - 2001-2006 Degree-Qualified Arrivals
by 2006
Source Country Professional
Total Employed
Not in Labourforce or
Unemployed
South Africa 67% 92% 8%
UK/ Ireland 62% 89% 11%
North Europe 58% 84% 16%
Canada/ USA 53% 87% 13%
Malaysia 42% 72% 28%
East Europe 35% 69% 31%
India 35% 77% 23%
Philippines 28% 82% 18%
Middle East/ North Africa 28% 57% 43%
Vietnam 24% 55% 45%
China 21% 55% 45%
Source: L Hawthorne (2008), The Impact of Economic Selection Policy on Labour Market Outcomes for Degree-Qualified Migrants
in Canada and Australia, Institute for Research on Public Policy, Vol 14 No 5; L Hawthorne (2008), Migration and Education:
Quality Assurance and Mutual Recognition of Qualifications – Australia Report, UNESCO, http://unesdoc.unesco.org/images/0017/001798/179842E.pdf , Paris.
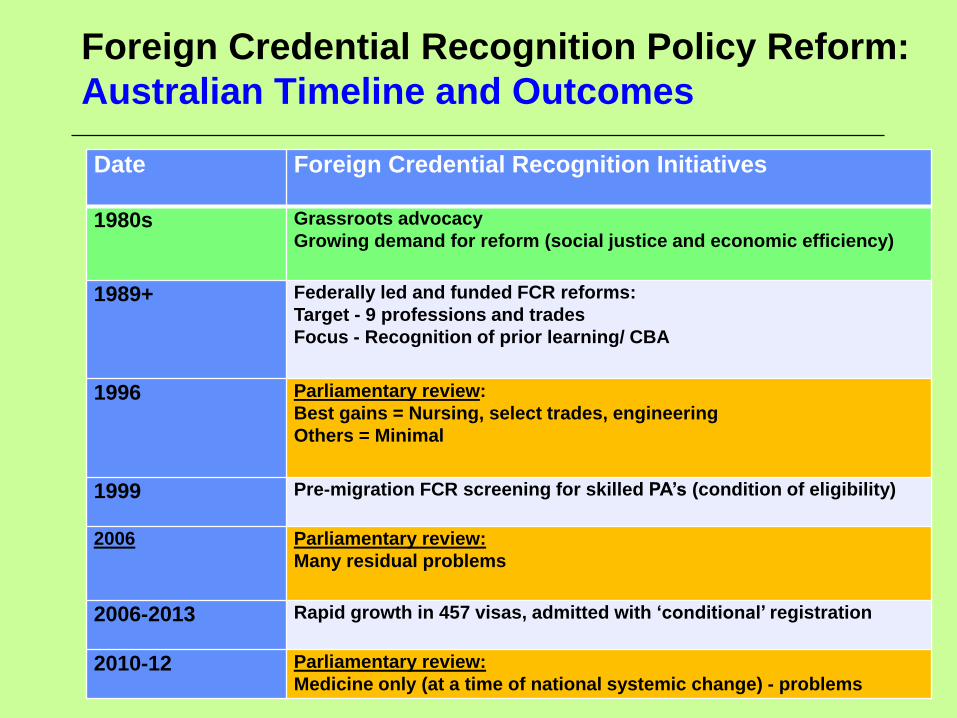
Foreign Credential Recognition Policy Reform:
Australian Timeline and Outcomes
Date
Foreign Credential Recognition Initiatives
1980s
Grassroots advocacy
Growing demand for reform (social justice and economic efficiency)
1989+ Federally led and funded FCR reforms:
Target - 9 professions and trades
Focus - Recognition of prior learning/ CBA
1996 Parliamentary review:
Best gains = Nursing, select trades, engineering
Others = Minimal
1999 Pre-migration FCR screening for skilled PA’s (condition of eligibility)
2006 Parliamentary review:
Many residual problems
2006-2013 Rapid growth in 457 visas, admitted with ‘conditional’ registration
2010-12 Parliamentary review:
Medicine only (at a time of national systemic change) - problems
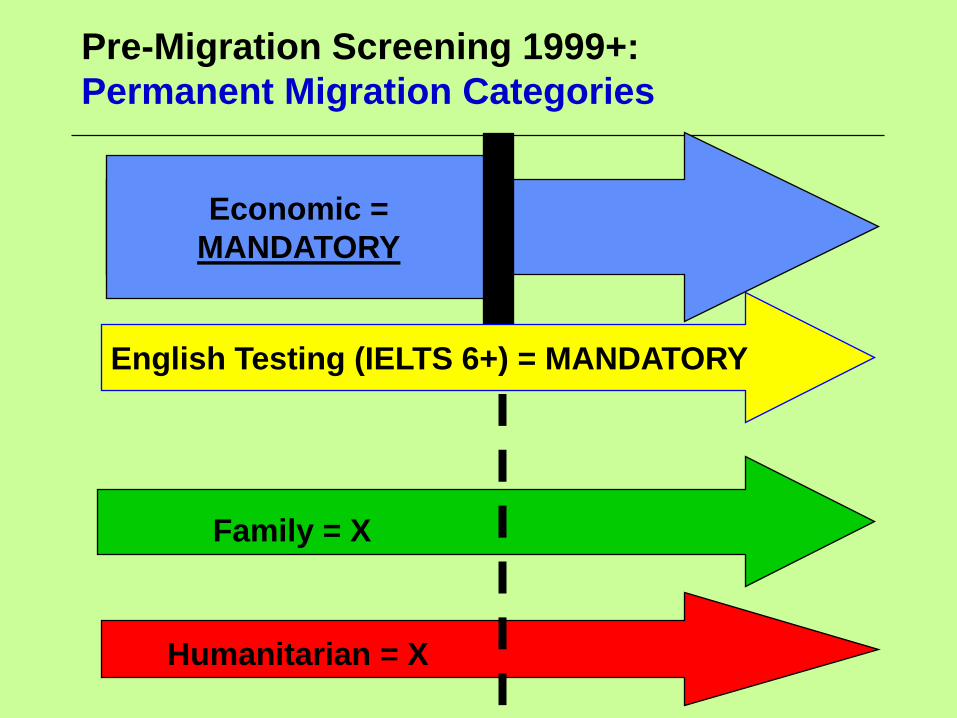
Pre-Migration Screening 1999+:
Permanent Migration Categories
Re Economic =
MANDATORY
Family = X
Humanitarian = X
English Testing (IELTS 6+) = MANDATORY

Benefits of Changed Selection Criteria by 2006:
Skilled Category Employment Outcomes @ 6
Months
72%77%
82%
69%
99%
83%
20%11% 13%
23%
1%12%
0%10%20%30%40%50%60%70%80%90%
100%
OffshoreAustralian
Sponsored
OffshoreBusiness
ENS/RSMS
OffshoreIndependent
SkilledDesignated
AreaSponsored
OnshoreBusiness
andENS/RSMS
OnshoreFormer
OverseasStudents
Employed Unemployed
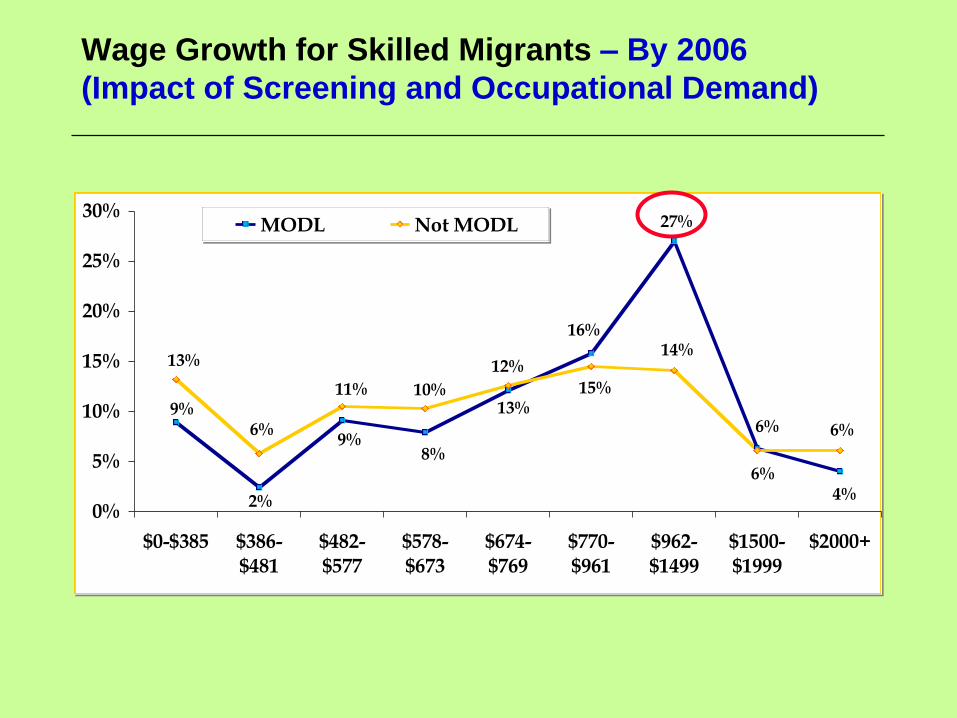
Wage Growth for Skilled Migrants – By 2006
(Impact of Screening and Occupational Demand)
4%6%
27%
16%
12%
8%9%
2%
9%
6%
14%
6%
15%13%
10%11%
6%
13%
0%
5%
10%
15%
20%
25%
30%
$0-$385 $386-$481
$482-$577
$578-$673
$674-$769
$770-$961
$962-$1499
$1500-$1999
$2000+
MODL Not MODL
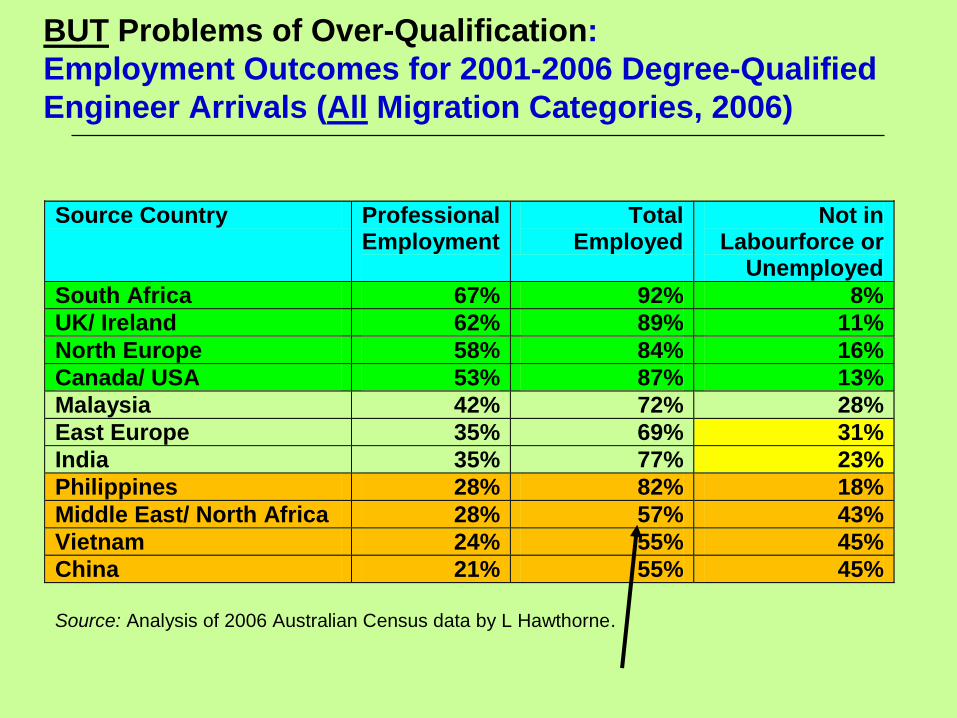
BUT Problems of Over-Qualification:
Employment Outcomes for 2001-2006 Degree-Qualified
Engineer Arrivals (All Migration Categories, 2006)
Source Country Professional Employment
Total Employed
Not in Labourforce or
Unemployed
South Africa 67% 92% 8%
UK/ Ireland 62% 89% 11%
North Europe 58% 84% 16%
Canada/ USA 53% 87% 13%
Malaysia 42% 72% 28%
East Europe 35% 69% 31%
India 35% 77% 23%
Philippines 28% 82% 18%
Middle East/ North Africa 28% 57% 43%
Vietnam 24% 55% 45%
China 21% 55% 45%
Source: Analysis of 2006 Australian Census data by L Hawthorne.

Policy Response 1 – Investing in Strategies to
Bridge Professionals into Work:
Engineering Case Study (10 Models including….)
1. Language training: English for engineers
2. Accreditation barriers: Taking additional subjects in local engineering standards; completing mandatory internships
3. Examination preparation: Intensive training to prepare for pre-registration examinations
4. Technical upgrades: Computer skills for engineers (eg AutoCAD)
5. Employment: Job-seeking strategies for engineers, including orientation to professional engineering in the host country
6. Further engineering study: eg Masters of Computer Engineering, PhD
7. Career conversion: IT graduate diplomas or management degrees
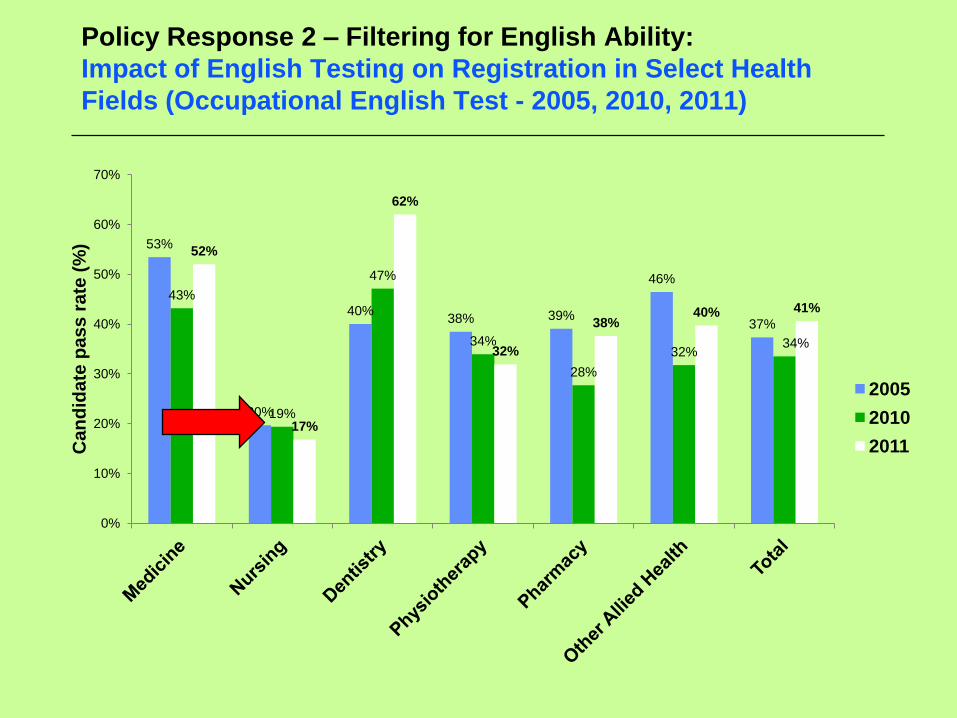
Policy Response 2 – Filtering for English Ability:
Impact of English Testing on Registration in Select Health
Fields (Occupational English Test - 2005, 2010, 2011)
53%
20%
40% 38% 39%
46%
37%
43%
19%
47%
34%
28%
32% 34%
52%
17%
62%
32%
38% 40% 41%
0%
10%
20%
30%
40%
50%
60%
70%
Can
did
ate
pass
ra
te (
%)
2005
2010
2011
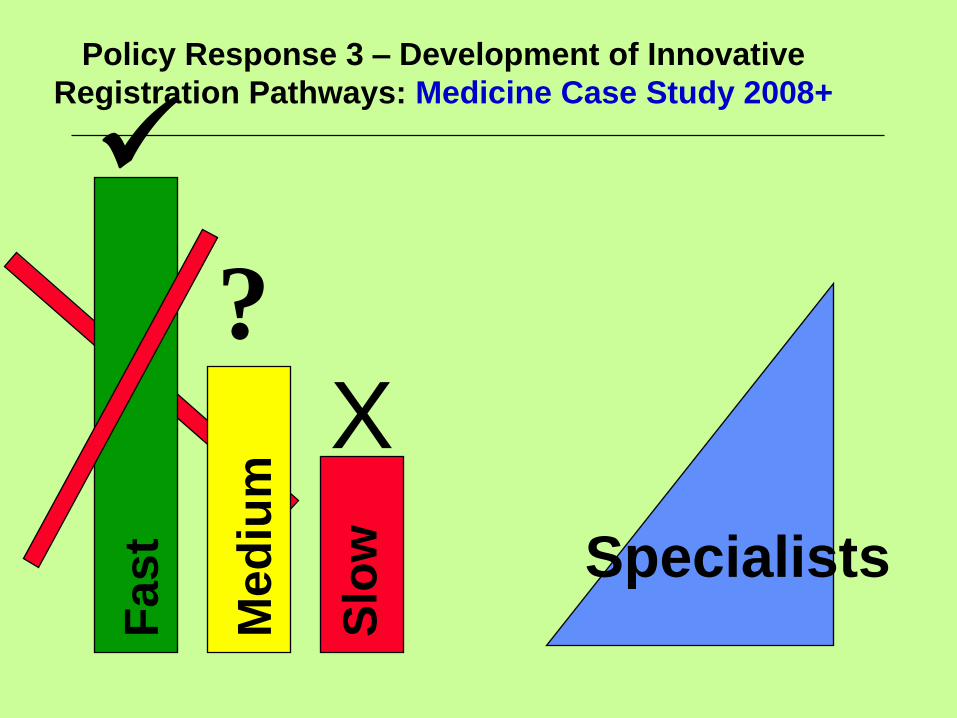
Policy Response 3 – Development of Innovative
Registration Pathways: Medicine Case Study 2008+
Specialists
? X
Fa
st
Med
ium
Slo
w
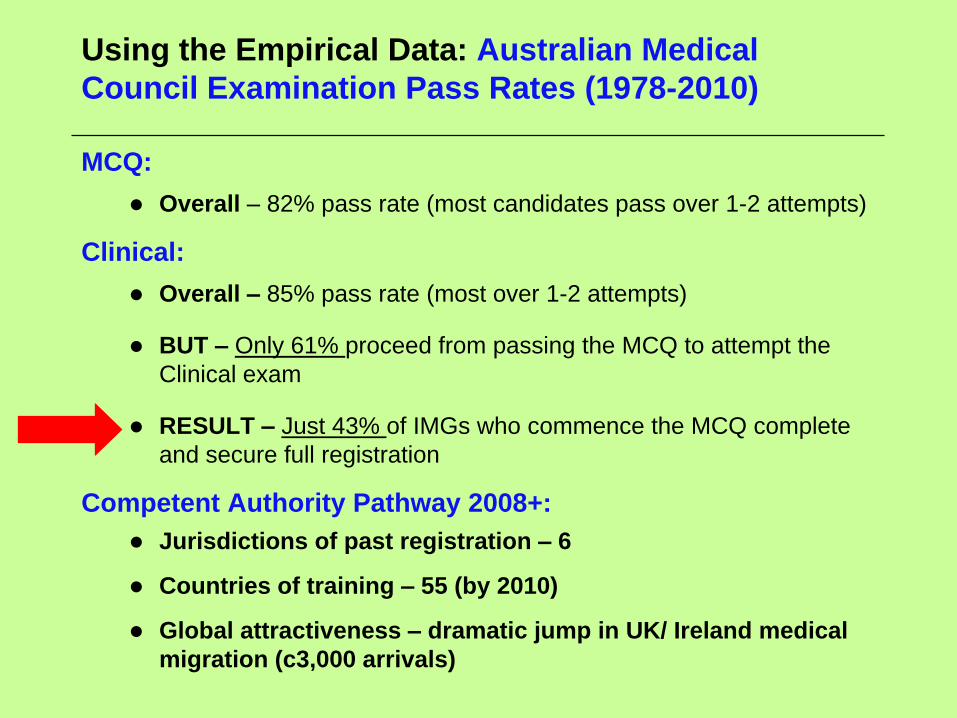
Using the Empirical Data: Australian Medical
Council Examination Pass Rates (1978-2010)
MCQ:
Overall – 82% pass rate (most candidates pass over 1-2 attempts)
Clinical:
Overall – 85% pass rate (most over 1-2 attempts)
BUT – Only 61% proceed from passing the MCQ to attempt the
Clinical exam
RESULT – Just 43% of IMGs who commence the MCQ complete
and secure full registration
Competent Authority Pathway 2008+:
Jurisdictions of past registration – 6
Countries of training – 55 (by 2010)
Global attractiveness – dramatic jump in UK/ Ireland medical
migration (c3,000 arrivals)
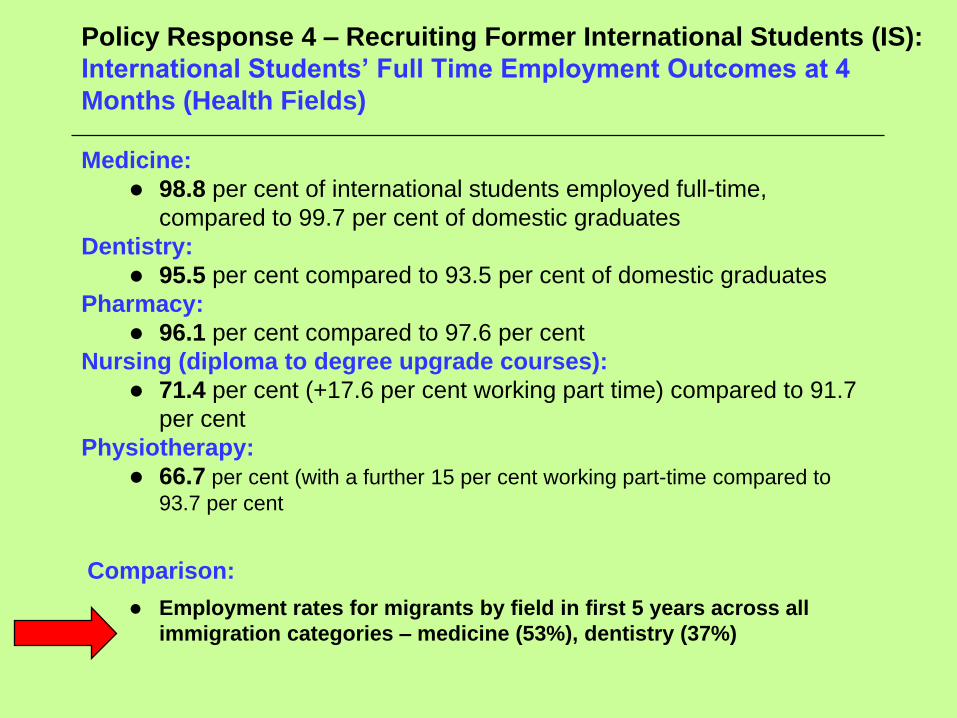
Policy Response 4 – Recruiting Former International Students (IS):
International Students’ Full Time Employment Outcomes at 4
Months (Health Fields)
Medicine:
98.8 per cent of international students employed full-time,
compared to 99.7 per cent of domestic graduates
Dentistry:
95.5 per cent compared to 93.5 per cent of domestic graduates
Pharmacy:
96.1 per cent compared to 97.6 per cent
Nursing (diploma to degree upgrade courses):
71.4 per cent (+17.6 per cent working part time) compared to 91.7
per cent
Physiotherapy:
66.7 per cent (with a further 15 per cent working part-time compared to
93.7 per cent
Comparison:
Employment rates for migrants by field in first 5 years across all
immigration categories – medicine (53%), dentistry (37%)
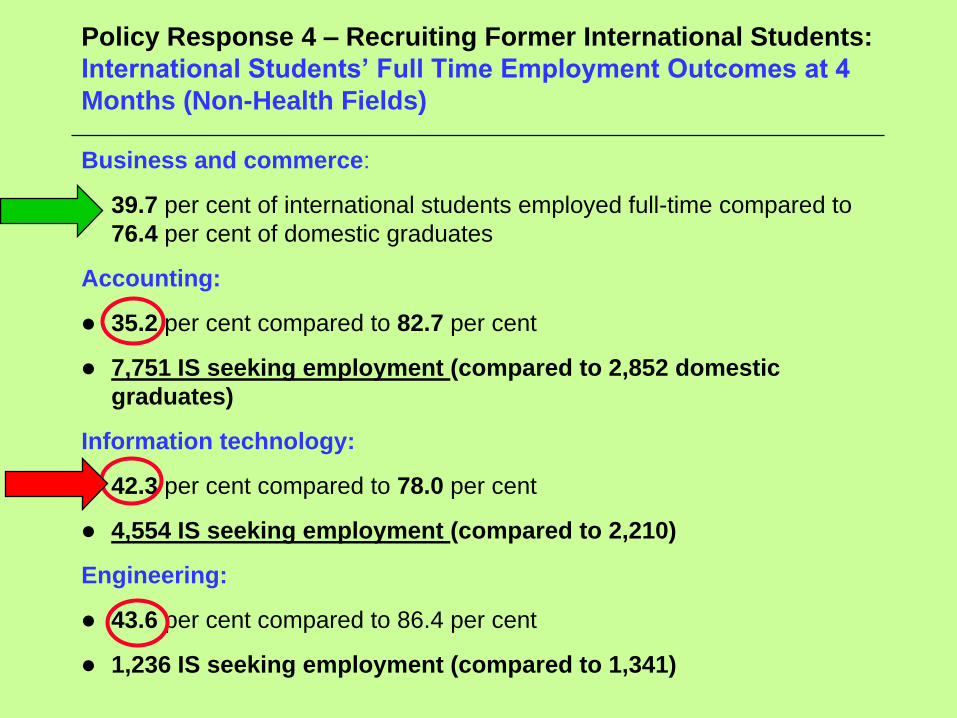
Policy Response 4 – Recruiting Former International Students:
International Students’ Full Time Employment Outcomes at 4
Months (Non-Health Fields)
Business and commerce:
39.7 per cent of international students employed full-time compared to
76.4 per cent of domestic graduates
Accounting:
35.2 per cent compared to 82.7 per cent
7,751 IS seeking employment (compared to 2,852 domestic
graduates)
Information technology:
42.3 per cent compared to 78.0 per cent
4,554 IS seeking employment (compared to 2,210)
Engineering:
43.6 per cent compared to 86.4 per cent
1,236 IS seeking employment (compared to 1,341)
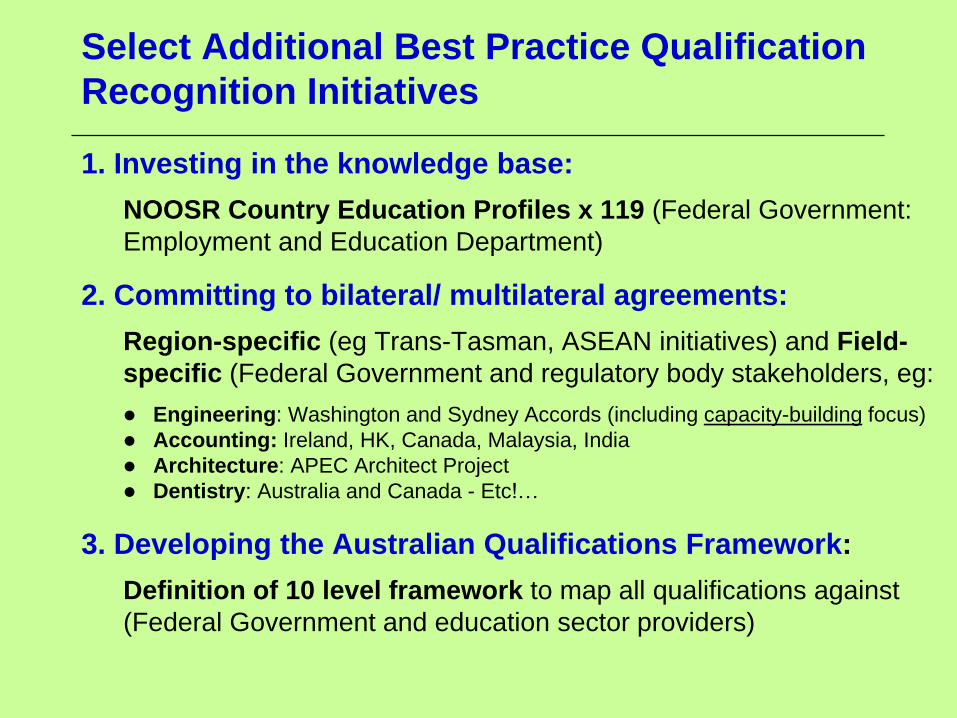
Select Additional Best Practice Qualification
Recognition Initiatives
1. Investing in the knowledge base:
NOOSR Country Education Profiles x 119 (Federal Government:
Employment and Education Department)
2. Committing to bilateral/ multilateral agreements:
Region-specific (eg Trans-Tasman, ASEAN initiatives) and Field-
specific (Federal Government and regulatory body stakeholders, eg:
Engineering: Washington and Sydney Accords (including capacity-building focus)
Accounting: Ireland, HK, Canada, Malaysia, India
Architecture: APEC Architect Project
Dentistry: Australia and Canada - Etc!…
3. Developing the Australian Qualifications Framework:
Definition of 10 level framework to map all qualifications against
(Federal Government and education sector providers)
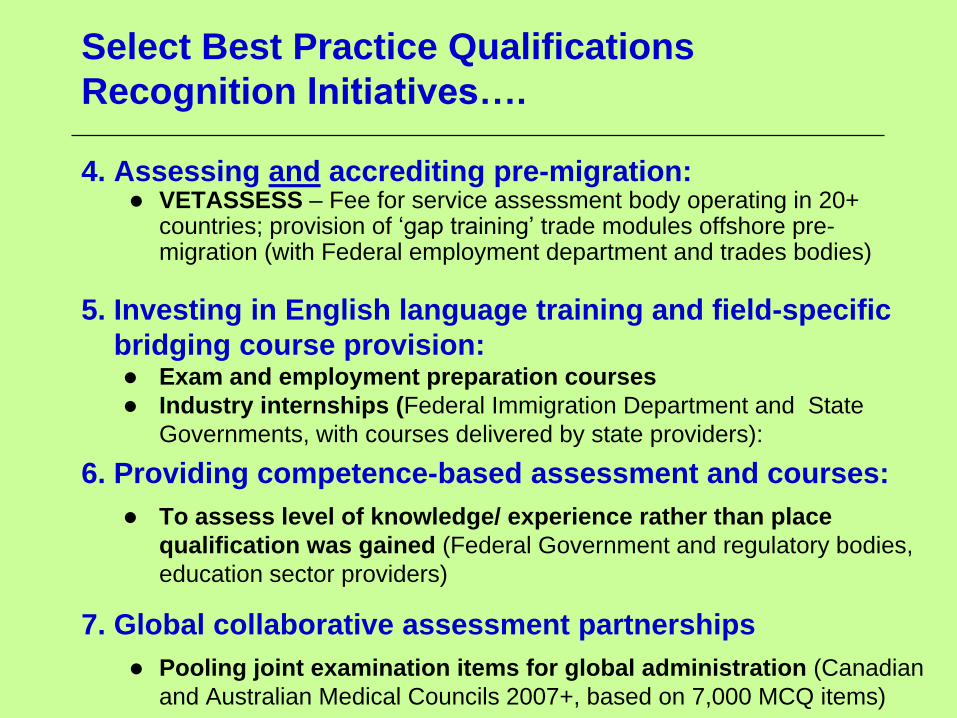
Select Best Practice Qualifications
Recognition Initiatives….
4. Assessing and accrediting pre-migration: VETASSESS – Fee for service assessment body operating in 20+
countries; provision of ‘gap training’ trade modules offshore pre-migration (with Federal employment department and trades bodies)
5. Investing in English language training and field-specific
bridging course provision: Exam and employment preparation courses
Industry internships (Federal Immigration Department and State
Governments, with courses delivered by state providers):
6. Providing competence-based assessment and courses:
To assess level of knowledge/ experience rather than place
qualification was gained (Federal Government and regulatory bodies,
education sector providers)
7. Global collaborative assessment partnerships
Pooling joint examination items for global administration (Canadian
and Australian Medical Councils 2007+, based on 7,000 MCQ items)
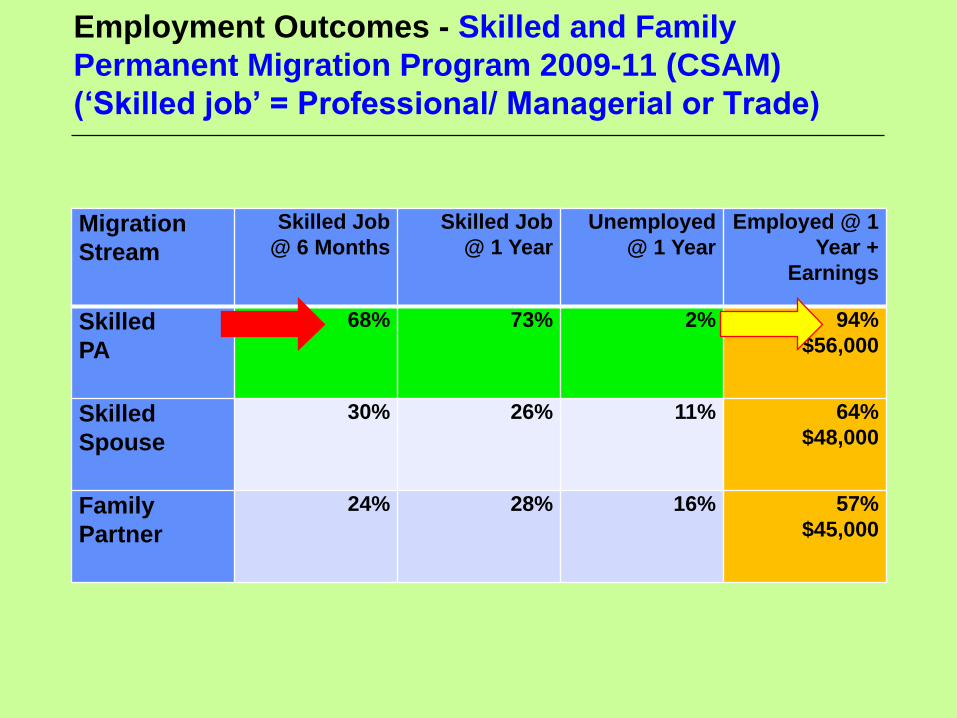
Employment Outcomes - Skilled and Family
Permanent Migration Program 2009-11 (CSAM)
(‘Skilled job’ = Professional/ Managerial or Trade)
Migration
Stream
Skilled Job
@ 6 Months Skilled Job
@ 1 Year
Unemployed
@ 1 Year Employed @ 1
Year +
Earnings
Skilled
PA
68% 73% 2% 94%
$56,000
Skilled
Spouse
30% 26% 11% 64%
$48,000
Family
Partner
24% 28% 16% 57%
$45,000
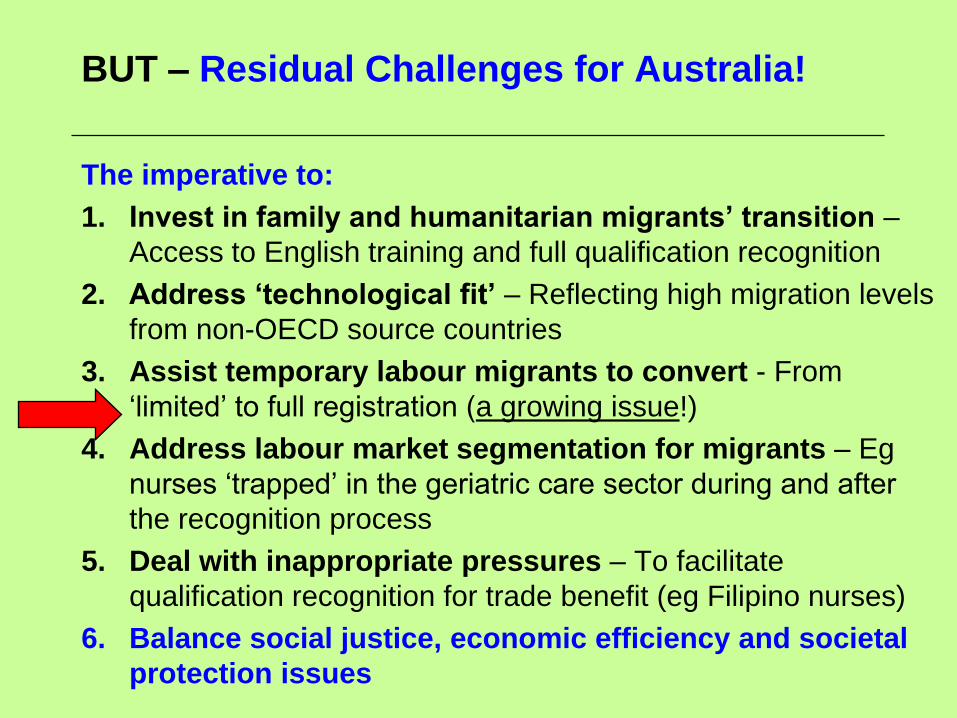
BUT – Residual Challenges for Australia!
The imperative to:
1. Invest in family and humanitarian migrants’ transition –
Access to English training and full qualification recognition
2. Address ‘technological fit’ – Reflecting high migration levels
from non-OECD source countries
3. Assist temporary labour migrants to convert - From
‘limited’ to full registration (a growing issue!)
4. Address labour market segmentation for migrants – Eg
nurses ‘trapped’ in the geriatric care sector during and after
the recognition process
5. Deal with inappropriate pressures – To facilitate
qualification recognition for trade benefit (eg Filipino nurses)
6. Balance social justice, economic efficiency and societal
protection issues
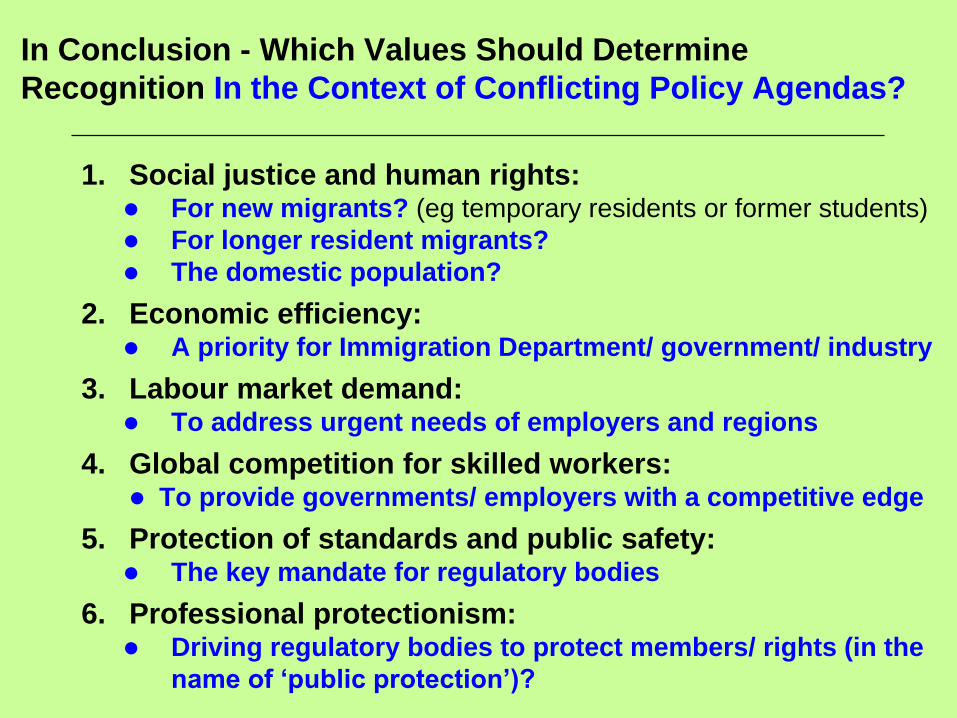
In Conclusion - Which Values Should Determine
Recognition In the Context of Conflicting Policy Agendas?
1. Social justice and human rights: For new migrants? (eg temporary residents or former students)
For longer resident migrants?
The domestic population?
2. Economic efficiency: A priority for Immigration Department/ government/ industry
3. Labour market demand: To address urgent needs of employers and regions
4. Global competition for skilled workers: To provide governments/ employers with a competitive edge
5. Protection of standards and public safety: The key mandate for regulatory bodies
6. Professional protectionism: Driving regulatory bodies to protect members/ rights (in the
name of ‘public protection’)?
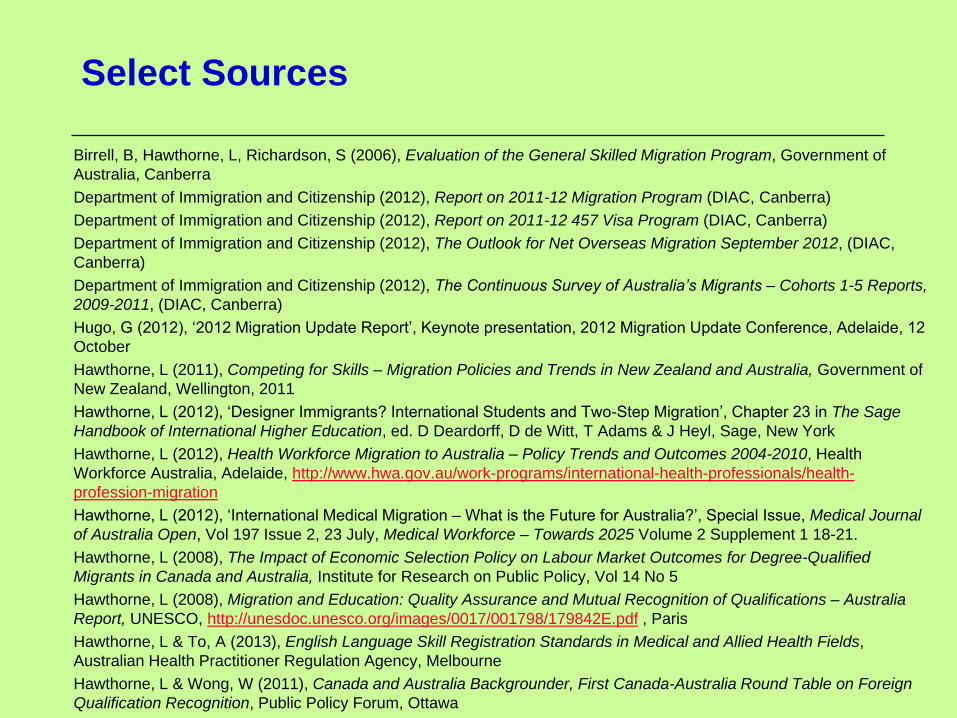
Select Sources
Birrell, B, Hawthorne, L, Richardson, S (2006), Evaluation of the General Skilled Migration Program, Government of
Australia, Canberra
Department of Immigration and Citizenship (2012), Report on 2011-12 Migration Program (DIAC, Canberra)
Department of Immigration and Citizenship (2012), Report on 2011-12 457 Visa Program (DIAC, Canberra)
Department of Immigration and Citizenship (2012), The Outlook for Net Overseas Migration September 2012, (DIAC,
Canberra)
Department of Immigration and Citizenship (2012), The Continuous Survey of Australia’s Migrants – Cohorts 1-5 Reports,
2009-2011, (DIAC, Canberra)
Hugo, G (2012), ‘2012 Migration Update Report’, Keynote presentation, 2012 Migration Update Conference, Adelaide, 12
October
Hawthorne, L (2011), Competing for Skills – Migration Policies and Trends in New Zealand and Australia, Government of
New Zealand, Wellington, 2011
Hawthorne, L (2012), ‘Designer Immigrants? International Students and Two-Step Migration’, Chapter 23 in The Sage
Handbook of International Higher Education, ed. D Deardorff, D de Witt, T Adams & J Heyl, Sage, New York
Hawthorne, L (2012), Health Workforce Migration to Australia – Policy Trends and Outcomes 2004-2010, Health
Workforce Australia, Adelaide, http://www.hwa.gov.au/work-programs/international-health-professionals/health-
profession-migration
Hawthorne, L (2012), ‘International Medical Migration – What is the Future for Australia?’, Special Issue, Medical Journal
of Australia Open, Vol 197 Issue 2, 23 July, Medical Workforce – Towards 2025 Volume 2 Supplement 1 18-21.
Hawthorne, L (2008), The Impact of Economic Selection Policy on Labour Market Outcomes for Degree-Qualified
Migrants in Canada and Australia, Institute for Research on Public Policy, Vol 14 No 5
Hawthorne, L (2008), Migration and Education: Quality Assurance and Mutual Recognition of Qualifications – Australia
Report, UNESCO, http://unesdoc.unesco.org/images/0017/001798/179842E.pdf , Paris
Hawthorne, L & To, A (2013), English Language Skill Registration Standards in Medical and Allied Health Fields,
Australian Health Practitioner Regulation Agency, Melbourne
Hawthorne, L & Wong, W (2011), Canada and Australia Backgrounder, First Canada-Australia Round Table on Foreign
Qualification Recognition, Public Policy Forum, Ottawa