Immersing yourself into the acoustic environment ...
8
Immersing yourself into the acoustic environment – “Soundscapes” “A soundscape is a sound or combination of sounds that forms or arises from an immersive environment.” (Wikipedia 2009) Just stop for a moment and listen. Shut your eyes and open your ears. What can you hear? I expect if you are reading this in the department office or classroom there is a cacophony of different sounds and noises. I also expect the majority are produced by people, their activities or the machines that they are using; some quiet, some loud; some pleasant, some offensive; some noises that appear and then disappear. Sound is normally a component of the environment that we take for granted, yet all the time the sound world is changing. Although we have a well-used geographical language to describe the visual appearance of environments, we are often less confident when describing the landscapes of sound. And yet sounds are an important tool that can be used to investigate a ‘deeper’ representation of place. This piece explores some of the ways in which people, landscapes and processes can be investigated through the fieldwork medium of sound and noise. For starters - the importance of sound Soundscapes can be urban, rural, natural or human-centred. Although we may take noise and sounds for granted, they in fact often underpin the characteristics of particular landscapes. Without these associated noises the landscape would somehow be incomplete. So these ‘collective voices’ which make up the landscape are as important as the visual markers which help us to identify place. There is an excellent audio map of the world available from the BBC World Service website. Figure 1: Save our Sounds! The Sounds Diary from the BBC World Service.
Transcript of Immersing yourself into the acoustic environment ...
Immersing yourself into the acoustic environment – “Soundscapes”
“A soundscape is a sound or combination of sounds that forms or arises from an
immersive environment.” (Wikipedia 2009)
Just stop for a moment and listen. Shut your eyes and open your ears. What can you hear? I expect
if you are reading this in the department office or classroom there is a cacophony of different sounds
and noises. I also expect the majority are produced by people, their activities or the machines that
they are using; some quiet, some loud; some pleasant, some offensive; some noises that appear and
then disappear.
Sound is normally a component of the environment that we take for granted, yet all the time the
sound world is changing. Although we have a well-used geographical language to describe the visual
appearance of environments, we are often less confident when describing the landscapes of sound.
And yet sounds are an important tool that can be used to investigate a ‘deeper’ representation of
place. This piece explores some of the ways in which people, landscapes and processes can be
investigated through the fieldwork medium of sound and noise.
For starters - the importance of sound
Soundscapes can be urban, rural, natural or human-centred. Although we may take noise and
sounds for granted, they in fact often underpin the characteristics of particular landscapes. Without
these associated noises the landscape would somehow be incomplete. So these ‘collective voices’
which make up the landscape are as important as the visual markers which help us to identify place.
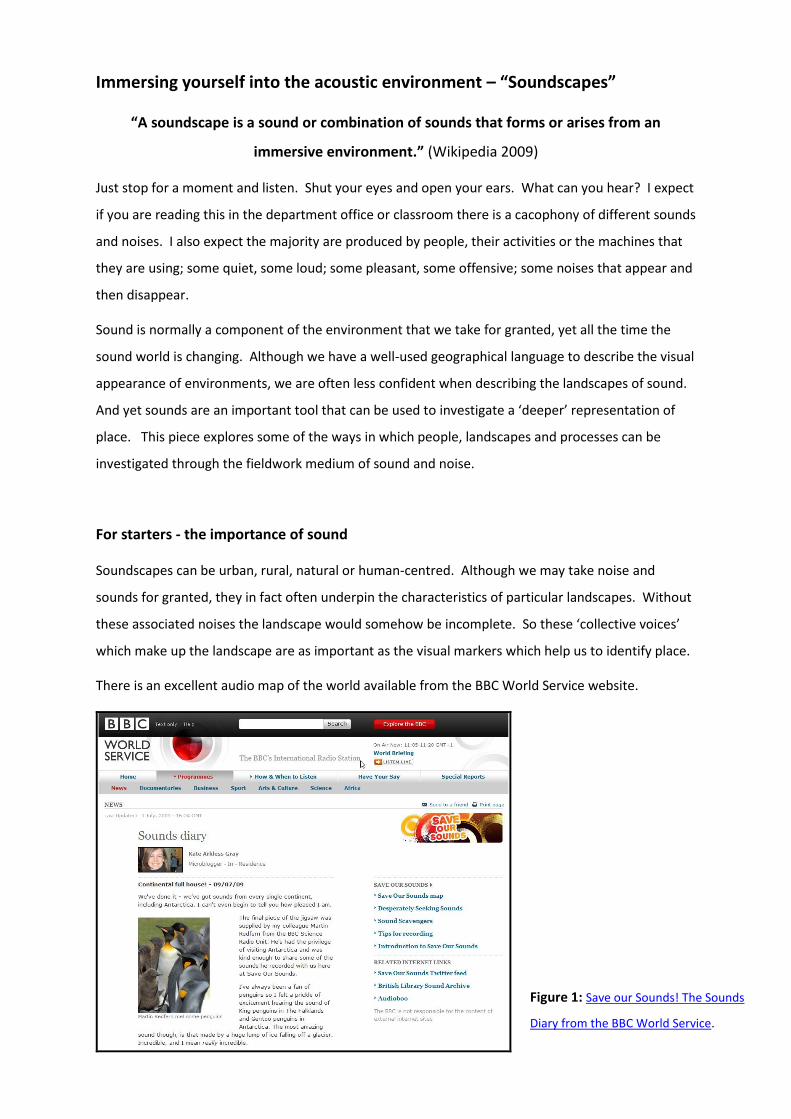
There is an excellent audio map of the world available from the BBC World Service website.
Figure 1: Save our Sounds! The Sounds
Diary from the BBC World Service.
Here users can explore this ‘snapshot of the world in sound’ and there is some fascinating diversity.
The website could be used to introduce a basic classification of sounds based on their origins (get
the students to work in small groups). This classification is important in the context of fieldwork as it
can be used to help ‘quantify’ a soundscape, i.e. what proportions of sounds are biophony, geophony
and anthrophony.
Classification Examples
Biophony Related to ecology / ecosystems: e.g. sound of trees moving in wind, sound of birds, sounds from animals etc.
Geophony Related to physical environment: e.g. running water, crashing waves, sound of wind, rain / precipitation etc.
Anthrophony Related to people and their activities: e.g. cars / planes / trains, farm and other machinery, wind round buildings, footsteps, breathing, talking, music, phones etc.
Table 1: A sound classification.
Application in geographical fieldwork
Recording of the soundscape can be used with a range of other fieldwork approaches as a way to
help describe the more qualitative or aesthetic representation of places. It may be particularly
valuable when making comparisons between places, e.g. beach resort vs. rural coastal strip, or town
vs. urban fringe vs. rural vs. remote rural. Soundscapes may also help to reveal how places change
over time, for example day vs. eve vs. night or high and low season, summer, winter, spring etc.
This can be particularly useful when exploring the local school grounds or a small park.
A big advantage with this type of sound fieldwork is that it requires limited equipment or expertise.
All that is needed is a willingness to observe, participate and engage; although you and the students
will have to be prepared to try new techniques and approaches. Most important, however is the
ability to actively ‘listen’, rather than to just passively ‘hear’. You will have to support students in
their ability to unpack and synthesise the auditory complexities of both natural and built
environments. And remember that soundscape recording can be about recording the nature of the
sound(s) itself, or perhaps more importantly an interpretation of the geography of the sound.
So first of all it becomes important to record the key characteristics of sounds - in a kind of ‘sound
taxonomy’. Figure 2 tries to illustrate this idea, describing sounds in terms of: origin / location,
loudness, pitch, duration, rate of change and attack / decay. Not all these variables can or should be
recorded as a routine element of describing places through their sound, but it does give some idea
of the scope and possibilities.

Figure 2: Sound characteristics –
adapted from Making Maps.net
Figure 3 illustrates the idea of a sound spectrum or image, again based on categories and
interpretations of noise. This can be used as an initial exercise (e.g. homework) to get students’
used to some recording techniques and the classification of different levels of noise.
Figure 3: An example
sound ‘image’, whereby
noise has been classified
according to one of four
categories: loud, dull,
quiet, high-pitch.

Below are some ‘pick and mix’ ideas for fieldwork. They start very straightforwardly and gradually
become slightly more involved and requiring more skills / equipment / set-up. In this respect they
could be differentiated according to age, ability or experience.
EXAMPLE ONE: VERY EASY - Making a qualitative personal sound map.
Figure 4a - an example of a ‘sound CD’ map from a rural part of Somerset.
Figure 4b - an accompanying GIS web-based map showing the location from which the sound CD was
taken (Source: Where’s the path?).
How to make a sound CD:
e) Find a comfortable spot to sit outdoors. Try to pick a location with an uninterrupted
360˚ ‘sound vista’.
f) Mark an "X" in the centre of the paper which contains a circle about the same size as a

How to make a sound CD:
a) Find a comfortable spot to sit outdoors. Try to pick a location with an uninterrupted
360˚ ‘sound vista’.
b) Mark an "X" in the centre of the paper which contains a circle about the same size as a
CD. This shows your relative location on the map.
c) Close your eyes and listen for at least one minute. Listen for sounds from animals, birds,
people, machinery and other human activities.
d) Keep listening, but now draw pictures or symbols on the map representing all the sounds
you hear, and where they are coming from. It is also possible to reflect the relative
distances of the sounds by using the periphery of the page as a scale. Sounds that seem
close should be near the ‘X’, whereas distant sounds should be represented on the
outside of the page.
The basic qualitative approach can be made more objective through the introduction of
quantitative data, for example by using a compass to record sound direction and or a semi-
quantitative sound scale as in Figure 5. Alternatively, a sound meter can be used to record the
volume of particular noises.
Figure 5: An example of a sound scale.
This idea can be further developed so that sounds are classified into different groups according to
Table 1.
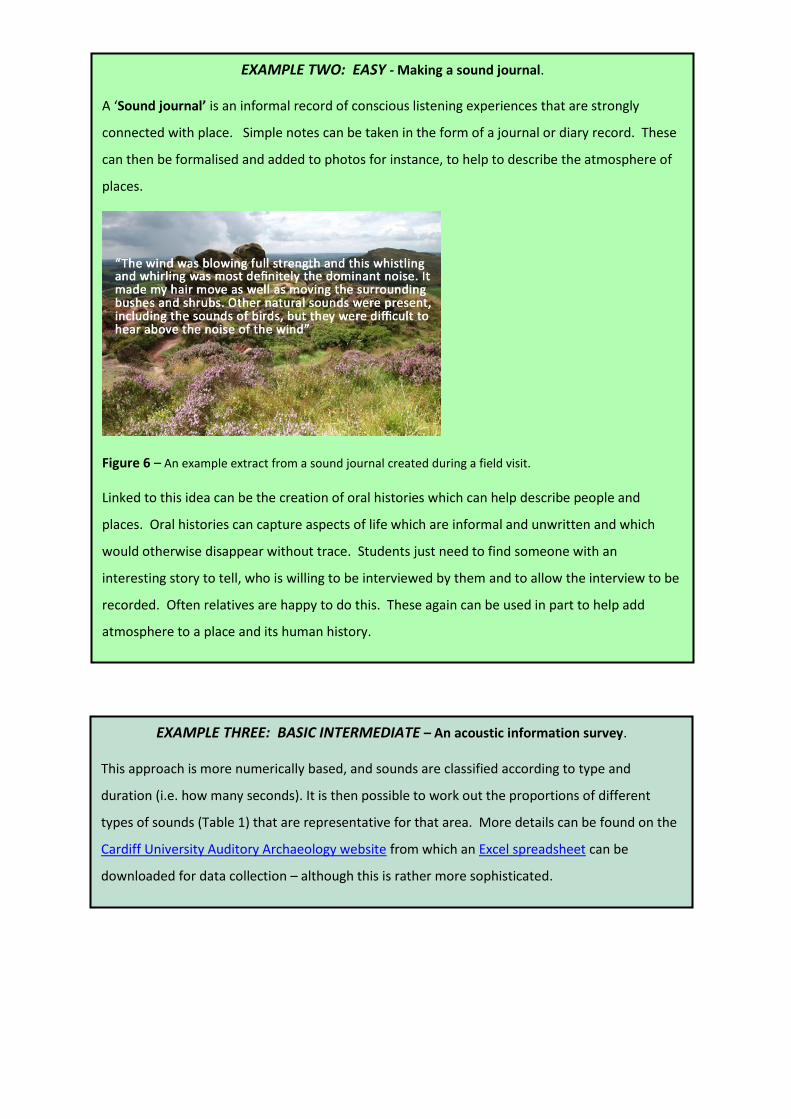
EXAMPLE THREE: BASIC INTERMEDIATE – An acoustic information survey.
This approach is more numerically based, and sounds are classified according to type and
duration (i.e. how many seconds). It is then possible to work out the proportions of different
types of sounds (Table 1) that are representative for that area. More details can be found on the
Cardiff University Auditory Archaeology website from which an Excel spreadsheet can be
downloaded for data collection – although this is rather more sophisticated.
EXAMPLE TWO: EASY - Making a sound journal.
A ‘Sound journal’ is an informal record of conscious listening experiences that are strongly
connected with place. Simple notes can be taken in the form of a journal or diary record. These
can then be formalised and added to photos for instance, to help to describe the atmosphere of
places.
Figure 6 – An example extract from a sound journal created during a field visit.
Linked to this idea can be the creation of oral histories which can help describe people and
places. Oral histories can capture aspects of life which are informal and unwritten and which
would otherwise disappear without trace. Students just need to find someone with an
interesting story to tell, who is willing to be interviewed by them and to allow the interview to be
recorded. Often relatives are happy to do this. These again can be used in part to help add
atmosphere to a place and its human history.

EXAMPLE FOUR: INTERMEDIATE – A sound transect or sound walk.
This example uses the concept of a sound transect or sound walk using mp3 audio mapping. The
idea is based on a systematic or regular survey technique whereby sounds and noises are
recorded. The fieldwork can be developed to create a systematic (regular) sound map using
photos and video recordings to create a more complex sound map. This would work best with a
larger team of people who are able to cover a greater number of systematic / regular points in a
survey area.
EXAMPLE FIVE: HARDER INTERMEDIATE – A sound portrait.
Sound portraits can be used to create and audio 2-3 minute sound representations and
descriptions of places and communities. Noises and sounds can be recorded using a mobile
phone and then ‘mixed’ on a computer (use Audacity (Figure 8) to give an acoustic image).
Figure 7 – A screengrab of the Audacity website.
There is more information on the idea of sound portraits available on the NPR website. This
approach is a good way of piecing together the three different types of sounds that were
discussed at the beginning of the article.

Sounds fieldwork – what to look out for
Whilst there may be equipment worries and uncertainties of approach, another thing to bear in
mind when undertaking sounds fieldwork is the potential difficulty of presenting and analysing the
data. Remember, the idea of soundscapes is to give ‘deeper’ additional information about place so
that this work is intended to compliment other data that has already been collected in an area.
Soundscapes are inevitably more personal interpretations so comparisons between different areas
can be difficult unless the same person or groups are making the judgements. The techniques
described here at the very least can be used to supplement visual information from photos and
sketches, as well as field notes and sketches. It is also easy to share mp3 files electronically, e.g. via
a school or group intranet. It is also possible for students to make their own digital sound maps, e.g.
by using Google maps.
References and further reading
An example sound map of the Hudson River
Mediascape: a multimedia experience which uses GPS technology to input sounds, images and video
into a map. These are automatically revealed as the user moves around the map.
BBC World Service ‘Save our Sounds Campaign’ includes an excellent interactive map.
Favourite Manchester Sounds website
Positive Soundcapes website
Krause, B.L. 2002. Wild Soundscapes: Discovering the voice of the natural world. Berkeley:
Wilderness Press.
David Holmes is a Principal Examiner for both GCSE and A-level Geography. He also teaches part
time at Queens College, Taunton. He can be contacted on [email protected].