IMMERSING STUDENTS IN AUTHENTIC EXPERIENCES AND …
78
IMMERSING STUDENTS IN AUTHENTIC EXPERIENCES AND SCIENTIFIC PRACTICES TO INCREASE ACHIEVEMENT, MOTIVATION, AND ATTITUDES TOWARDS SCIENCE by Matthew Rath Fisher A professional paper submitted in partial fulfillment of the requirements for the degree of Master of Science in Science Education MONTANA STATE UNIVERSITY Bozeman, Montana July 2016
Transcript of IMMERSING STUDENTS IN AUTHENTIC EXPERIENCES AND …

IMMERSING STUDENTS IN AUTHENTIC EXPERIENCES AND SCIENTIFIC
PRACTICES TO INCREASE ACHIEVEMENT, MOTIVATION,
AND ATTITUDES TOWARDS SCIENCE
by
Matthew Rath Fisher
A professional paper submitted in partial fulfillment
of the requirements for the degree
of
Master of Science
in
Science Education
MONTANA STATE UNIVERSITY
Bozeman, Montana
July 2016

©COPYRIGHT
by
Matthew Rath Fisher
2016
All Rights Reserved

ii
TABLE OF CONTENTS
1. INTRODUCTION .......................................................................................................... 1
2. CONCEPTUAL FRAMEWORK ................................................................................... 2
3. METHODOLOGY .......................................................................................................... 7
4. DATA AND ANALYSIS ............................................................................................. 20
5. INTERPRETATION AND CONCLUSION ................................................................ 30
6. VALUE ......................................................................................................................... 34
REFERENCES CITED ..................................................................................................... 37
APPENDICES .................................................................................................................. 42
APPENDIX A Laboratory Instructions for Students ............................................ 43
APPENDIX B Lab Materials and Instructions for Preparation ............................ 46
APPENDIX C Instituitional Review Board Approval.......................................... 49
APPENDIX D Biology Motiovation Questionnaire II ......................................... 51
APPENDIX E Survey Regarding the Nature of Science ...................................... 53
APPENDIX F Interview Questions ...................................................................... 55
APPENDIX G Interview Transcripts.................................................................... 58
APPENDIX H Content Assessment ..................................................................... 65
APPENDIX I Summary of Responses from Post-Intervention Interviews .......... 70
iii
LIST OF TABLES
1. Scientific Practices as Described by the National Research Council ..............................8
2. Summary of Lab-Related Activities Occurring during the Water Treatment Unit .........9
3. Summary of Lecture-Related Activities that Focused on Scientific Practices ..............12
4. Data Triangulation Matrix .............................................................................................15
5. Comparison of Means for the Five Subscales of the Biology Motivation
Questionnaire II .................................................................................................................22
6. Likert Items from the Biology Motivation Questionnaire II (BMQ II) and
Nature of Science Survey (NOSS) for which the Median Response Changed ..................23
7. Cronbach’s Alpha and Comparison of Means for the Nature of Science
Survey (N=11) ....................................................................................................................24
iv
LIST OF FIGURES
1. Results from the Biology Motivation Questionnaire II .................................................21
2. Boxplots for the Nature of Science Survey....................................................................25
3. Boxplots for the Content Assessments ..........................................................................27
4. Boxplot of Normalized Gain on the Content Assessment .............................................28
5. Scatterplot Comparing Motivation and Normalized Gain .............................................29
6. Comparison of Normalized Gain on the Content Assessment between
Students with Decreased Versus Increased Motivation ................................................29

v
ABSTRACT
Efforts to reform science education focus on implementing constructivist teaching
strategies and engaging students in scientific practices. This paper assessed how
implementing these strategies affected student achievement, motivation, and views
towards science in a community college biology course for non-science majors. The
intervention consisted of lecture and lab activities spanning the entire semester. The lab
activities required students to collect, analyze, and interpret data and communicate their
results. A special lab unit towards the end of the semester included field trips and inquiry-
based labs that all focused on the topic of water treatment.
Data for this study were collected in the form of surveys, assessments, interviews,
and teacher observation. Survey results indicated that the intervention had no significant
change on students’ levels of motivation or views towards science. However, all students
interviewed reported that the class increased their understanding of the nature of science,
especially as it relates to empiricism. In addition, opinions expressed during
student interviews regarding motivation were positive about the fieldtrips and lab
experiments; therefore, results from interviews and surveys were sometimes
contradictory. Likert items for the nature of science survey developed specifically for this
study were highly correlated to one another. Students demonstrated remarkable and
statistically significant gains in content knowledge after the intervention. The results from
this study should be viewed cautiously due to the low sample size and the lack of a
control classroom. However, they do provide meaningful information about what aspects
of the intervention can continued to be used and which need modification.

1
INTRODUCTION
Motivating students to excel in science courses is a perennial challenge faced by
educators. College science courses are challenging, in part, because they introduce new
concepts and terminology that require persistence by the student to master. Engaging
students is especially challenging when those students are non-science majors who are
mandated to take a science course as a general education requirement. In my current
appointment at Great Falls College Montana State University (GFC MSU), I teach both
science and non-science majors. For both sets, I have observed that GFC MSU students
are more likely to struggle with learning course content than students at other colleges at
which I have taught. At GFC MSU I have observed a greater proportion of students who
have low motivation to excel academically, low interest in course content, and
deficiencies with the study skills and discipline needed to succeed. This low achievement
is demonstrated by the following statistic: During fall semester of 2014, just 25% of
students enrolled in my introductory human biology course completed the semester with
a grade higher than a D.
The reasons why students at GFC MSU struggle with achievement are
speculative, but they could be influenced by socioeconomic variables. In comparison to
the previous institutions at which I taught, the median wage in Great Falls is substantially
lower, more students qualify for financial aid, and a greater percentage of students are the
first in their family to attend college. Additionally, a greater percentage of students have
interests outside of school that strongly compete for their time, such as children and/or

2
jobs. Clearly, these students face unique challenges and can be considered to be an at-risk
student population.
To date, I have struggled to reach these students and felt outmatched by the
challenges that they present to me. This made me wonder if changing my instructional
methods would translate into increased student engagement and participation, so that
motivation, learning, curiosity, and critical thinking increased. I was motivated to
conduct this study by a desire to positively impact my students using constructivist
teaching practices that immerse students in the process of science. My main research
question was, “How will implementing active-learning strategies that focus on engaging
students in scientific practices, such as inquiry, increase student achievement, motivation,
and attitudes towards science?”
CONCEPTUAL FRAMEWORK
There has been much discussion in the last two decades about reforming science
education (e.g., Ahlgren, 1996; Wheeler, 2006). The consensus that has emerged is that
reform should be based on constructivist teaching practices (National Research Council,
2012). Inquiry-based instruction is one such constructivist strategy. It is a core tenet in
the reform of science education and is promoted as a leading method for teaching science
(National Research Council, 2012).
The roots of modern constructivist theory date back approximately 300 years ago
to Henrich Pestalozze (1746–1827), and subsequently to Jean Piaget (1896-1980). The
latter of these two is most frequently credited with fully developing constructivist
philosophy (Crowther, 1999). Constructivism is defined by Hartle, Baviskar, and Smith
3
(2012) as “a theory that describes learning as taking new ideas or experiences and fitting
them into a complex system that includes the learner’s entire prior learning” (p. 31).
Because learners must assimilate new information with old information, constructivism is
an inherently active process. Research on constructivism has moved it into the forefront
of science education reform, where it serves as a theoretical underpinning for how people
learn (Hartle et al., 2012).
The challenge that faces educators is using constructivist theory to direct
pedagogy. Notably, Crowther (1999) summarizes several attempts to transform
constructivist theory into practical applications for the classroom. For example,
Wheatley (1991; as cited in Crothwer 1999) offers a problem-centered approach that
consists of three elements: tasks, groups, and sharing. As students work together on
problems, they not only participate in cooperative learning, but also metacognition as
they compare their problem-solving to others in the class. Better yet, Saunders (1992)
provides a more elucidated and compelling strategy based on a four-part framework: 1)
investigative labs, 2) active cognitive involvement, 3) stimulating work in small groups,
and 4) alternative assessments. While there are numerous strategies for creating a
constructivist learning environment (Crowther, 1999; Hartle et al., 2012), no single
strategy is likely to work best in all situations and for all grade levels. Therefore,
individual instructors must find the strategy that best suits their students and learning
objectives.
Constructivism is at the heart of science education reform (National Research
Council, 2012) because it is regarded as the leading theory that explains how people learn

4
(Llewellyn, 2013). Despite the difference in opinions for how to implement constructivist
theory in the classroom, many seem to agree that inquiry, in particular, is a key
component. Students who engage in inquiry display inquisitiveness, pose questions,
search for answers, and seek to understand “counterintuitive phenomena” (Llewellyn,
2013, p. 6). In inquiry activities, students collect and analyze data, make evidence based-
conclusions, and communicate their findings. In other words, they engage in science
practices much in the same way that scientists go about studying the world and
generating new knowledge (National Research Council, 2012).
There is strong evidence that inquiry and other constructivist strategies improve
student achievement. For example, in a meta-analysis of 225 studies, Freeman and
colleagues (2014) found that in college courses that focused on active-learning, which
includes inquiry, students performed substantially better than students enrolled in
conventional, lecture-based courses. In some cases, while students involved in inquiry-
based courses may not report a significant increase in grades, they do report positive
increases in attitudes, the feeling that lab activities are more practically relevant and
meaningful, they have greater confidence in their skills, and have more positive
perceptions of how their studies relate to the world around them (Beck, Butler, & Burke
da Silva, 2014; Tomasik et al., 2014).
Because inquiry-based activities involve collection of data, posing questions, and
designing investigations, they are a natural fit for inclusion into the laboratory portion of
science courses. Unfortunately, many educators may think that their lab activities are
inquiry-based because they are hands-on, but these two things are not always
5
synonymous (Llewellyn, 2103). Many laboratory activities are deemed ‘cookbook’ or
‘recipe’ labs because students unthinkingly follow procedures that are designed to
produce a single correct answer. These do not meet the constructivist criteria mainly
because students are not actively engaged or invested in their work and do little reflection
upon their own learning during the activity. The false notion that any hands-on lab
activity is automatically inquiry-based appears to be common, at least in the biological
sciences. In a meta-analysis, Puttick, Drayton, and Cohen (2015) analyzed 111 articles
published between 2007 and 2012 in The American Biology Teacher journal.
Interestingly, 40% of the studies claimed that their instructional methods were inquiry-
based, but only half of those studies provided any evidence to support this because few
could demonstrate active student engagement in inquiry.
Inquiry-based activities exist along a spectrum of student and instructor
involvement (Moyer, 2012). In the lowest levels of inquiry, much of the inquiry
investigation, such as development of research questions and methodology, are
determined by the instructor. This is called guided inquiry, and as one meta-analysis
found, it is the most common type of inquiry published in the biological sciences (Beck et
al., 2014). In the highest levels, called open inquiry, nearly everything is initiated by the
student. There is debate about which level of inquiry is the best (Eastwell and
MacKenzie, 2009). Some argue that instructors should always strive for open inquiry,
which in their view is the best type of inquiry because students have the largest degree of
freedom. However, some point to the lack of evidence supporting any inherent
advantages of open inquiry, and warn against overlooking the importance and

6
effectiveness of guided inquiry practices (Eastwell and MacKenzie, 2009). As an
example, in a small study, Moyer (2012) found low achievement and high uneasiness
among students engaged in open inquiry compared to guided inquiry.
Inquiry-based lab activities, even guided inquiry, tend to give students
considerable freedom to be active learners. Students may be given a research question or
problem by the instructor, but are asked to determine the experimental methodology and
conduct their own analysis (Unsworth, 2014). Or, students might be guided through an
experiment by an instructor, but then asked to use their new knowledge to develop a
related follow-up experiment (Ketpichainarong, Panijpan, & Ruenwongsa, 2010). Even
the simple act of having students design their own data table is enough to get them to
critically think about what type of data they might expect to collect and determine the
best ways to organize it (Llewellyn, 2013).
In sum, constructivism is accepted by science educators as the leading theory of
how people learn. In this philosophy, learners acquire new knowledge only after they
assimilate new facts and experiences with prior knowledge. Educational strategies that
promote active learning and metacognition are inherently constructivist. Among these
methods is inquiry-based learning, in which learners pose questions, collect data, make
conclusions, and display inquisitiveness. Inquiry, therefore, models the process of
science. The level of student freedom in the inquiry process is the difference between
guided and open inquiry, the latter giving students more autonomy. Various studies have
shown active learning, and inquiry-based activities in particular, to boost student
achievement and attitudes.
7
METHODOLOGY
The intervention was administered to college students enrolled in an
introductory biology course for non-science majors. The course, BIOB 101 Discover
Biology, met 4 days a week for a combined weekly total of 2 hours and 50 minutes of
lecture, 1 hour and 50 minutes of lab, and 50 minutes of review. The intervention took
place over the first 15 weeks of the 16-week semester.
The broadly-defined learning objectives for this course, as developed by the
Montana University System, are as follows:
Develop an understanding of principal concepts of biology.
Experience science as a process of problem solving.
Experience science as a process of discovery and explore the balanced
interdependency of life.
The course fulfills the general education requirements for a lab science course,
which is often the primary reason for why students choose to take the class. Typically
for these students, this is their first and perhaps last college science course. During this
study, 14 students were originally enrolled but only 11 remained at the end of the
semester. Data were used from only the 11 students who completed the course.
Because most students in this course are typically non-science majors,
misconceptions about the process of science and scientific principles can sometimes
occur. Additionally, some students can lack the confidence needed to succeed in a
college-level science course. The intervention of this study sought to address these
concerns through the use of constructivist, active-learning activities that immersed
8
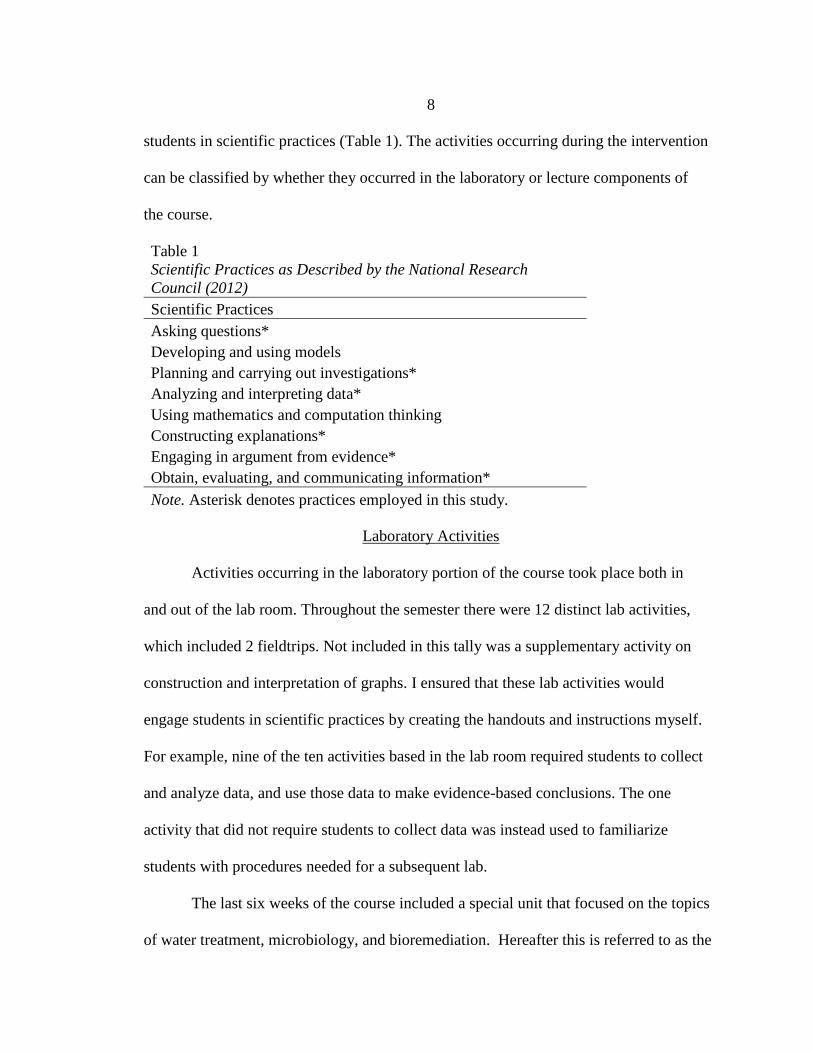
students in scientific practices (Table 1). The activities occurring during the intervention
can be classified by whether they occurred in the laboratory or lecture components of
the course.
Table 1
Scientific Practices as Described by the National Research
Council (2012)
Scientific Practices
Asking questions*
Developing and using models
Planning and carrying out investigations*
Analyzing and interpreting data*
Using mathematics and computation thinking
Constructing explanations*
Engaging in argument from evidence*
Obtain, evaluating, and communicating information*
Note. Asterisk denotes practices employed in this study.
Laboratory Activities
Activities occurring in the laboratory portion of the course took place both in
and out of the lab room. Throughout the semester there were 12 distinct lab activities,
which included 2 fieldtrips. Not included in this tally was a supplementary activity on
construction and interpretation of graphs. I ensured that these lab activities would
engage students in scientific practices by creating the handouts and instructions myself.
For example, nine of the ten activities based in the lab room required students to collect
and analyze data, and use those data to make evidence-based conclusions. The one
activity that did not require students to collect data was instead used to familiarize
students with procedures needed for a subsequent lab.
The last six weeks of the course included a special unit that focused on the topics
of water treatment, microbiology, and bioremediation. Hereafter this is referred to as the
9
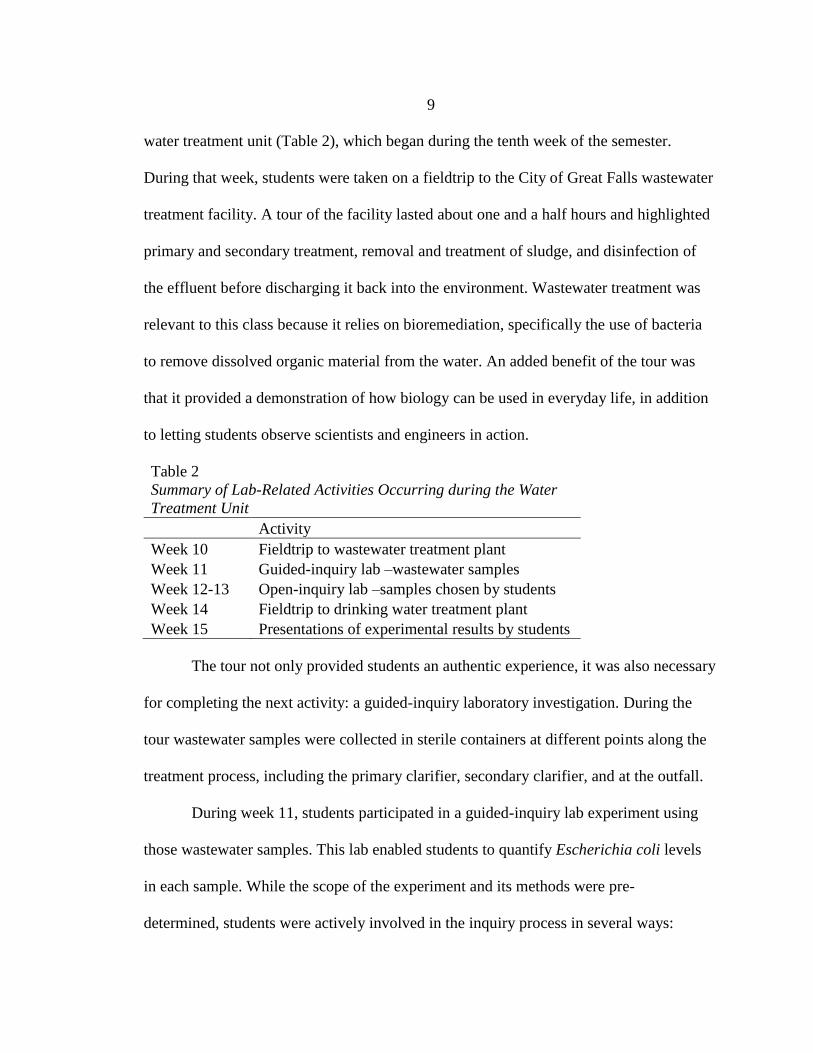
water treatment unit (Table 2), which began during the tenth week of the semester.
During that week, students were taken on a fieldtrip to the City of Great Falls wastewater
treatment facility. A tour of the facility lasted about one and a half hours and highlighted
primary and secondary treatment, removal and treatment of sludge, and disinfection of
the effluent before discharging it back into the environment. Wastewater treatment was
relevant to this class because it relies on bioremediation, specifically the use of bacteria
to remove dissolved organic material from the water. An added benefit of the tour was
that it provided a demonstration of how biology can be used in everyday life, in addition
to letting students observe scientists and engineers in action.
Table 2
Summary of Lab-Related Activities Occurring during the Water
Treatment Unit
Activity
Week 10 Fieldtrip to wastewater treatment plant
Week 11 Guided-inquiry lab –wastewater samples
Week 12-13 Open-inquiry lab –samples chosen by students
Week 14 Fieldtrip to drinking water treatment plant
Week 15 Presentations of experimental results by students
The tour not only provided students an authentic experience, it was also necessary
for completing the next activity: a guided-inquiry laboratory investigation. During the
tour wastewater samples were collected in sterile containers at different points along the
treatment process, including the primary clarifier, secondary clarifier, and at the outfall.
During week 11, students participated in a guided-inquiry lab experiment using
those wastewater samples. This lab enabled students to quantify Escherichia coli levels
in each sample. While the scope of the experiment and its methods were pre-
determined, students were actively involved in the inquiry process in several ways:

10
determining the research questions and hypotheses, creating their own data tables,
analyzing and interpreting their own data, and constructing evidence-based conclusions.
At the beginning of this activity, students were organized into small groups and
informed that they had the capacity to measure E. coli numbers in the water samples.
Knowing this, each group was instructed to brainstorm potential research questions that
could be tested. The question that usually comes to most peoples’ minds is, “How do E.
coli levels differ among the water samples?” With testable questions identified, groups
developed their hypotheses in the form of explanatory statements. By allowing students
to create research questions and hypotheses, they become active participants and
stakeholders in the investigative process.
Each group of students then tested their hypothesis while gaining experience
using the multiple tube fermentation technique. This technique has real-world
applications and uses a presumptive test, which provides evidence for the presence of
bacteria, followed by a confirmative test, which positively identifies the bacteria as E.coli
(Appendices A & B). For logistical reasons, each group of students received wastewater
from only one of the three samples. At the end of the experiment, data were pooled from
the entire class. Thus, students could work with the class data to test each group’s
hypothesis.
At the conclusion of this activity, students were given an assignment to assess
their understanding of bioremediation in wastewater treatment and the theoretical
underpinnings of the multiple tube fermentation technique. Additionally, they were

11
required to produce graphs of their results and to construct an evidence-based conclusion
to assess their hypothesis.
During weeks 12 and 13, students engaged in an open inquiry lab investigation in
which they conducted their own study. Continuing to work in small groups, they posed
research questions, formed explanatory hypotheses, and created graphs of their predicted
results. Students then planned their experimental design, which involved determining the
location of their water samples and the method of procuring them. Their experimental
designs were approved by me, allowing me to consider any potential safety issues, in
addition to making sure that students used sterile technique. Once water samples were
obtained the following week, students tested their hypotheses using the procedures
previously described for the multiple tube fermentation technique.
With data collection concluded, students were given two weeks to complete their
assignment for this activity. Student groups were asked to give presentations that
followed the standard format for scientific research: introduction, methods, results, and
discussion. The emphasis here was for students to analyze the data, make evidence-
based conclusions using their data, consult the scientific literature to support their
conclusion, reflect upon the validity of their hypothesis, and communicate their findings
to others. Students were specifically instructed to identify the potential causes for any
observed differences in E. coli levels between their water samples. Lastly, students were
asked to present a suggestion for a follow-up study.
During week 14, the week prior to the group presentations, students were taken
on a fieldtrip to the City of Great Falls drinking water treatment facility to give them
12
perspective at the opposite end of the water treatment spectrum. Drinking water
treatment relies on physicochemical methods, not bioremediation. Regardless, the
fieldtrip still exposed students to scientists and engineers in action, and further solidified
how science permeates everyday life. Immediately following the hour-long tour, I
engaged students in a group discussion in which we noted the differences between
drinking water treatment and wastewater treatment.
Lecture Activities
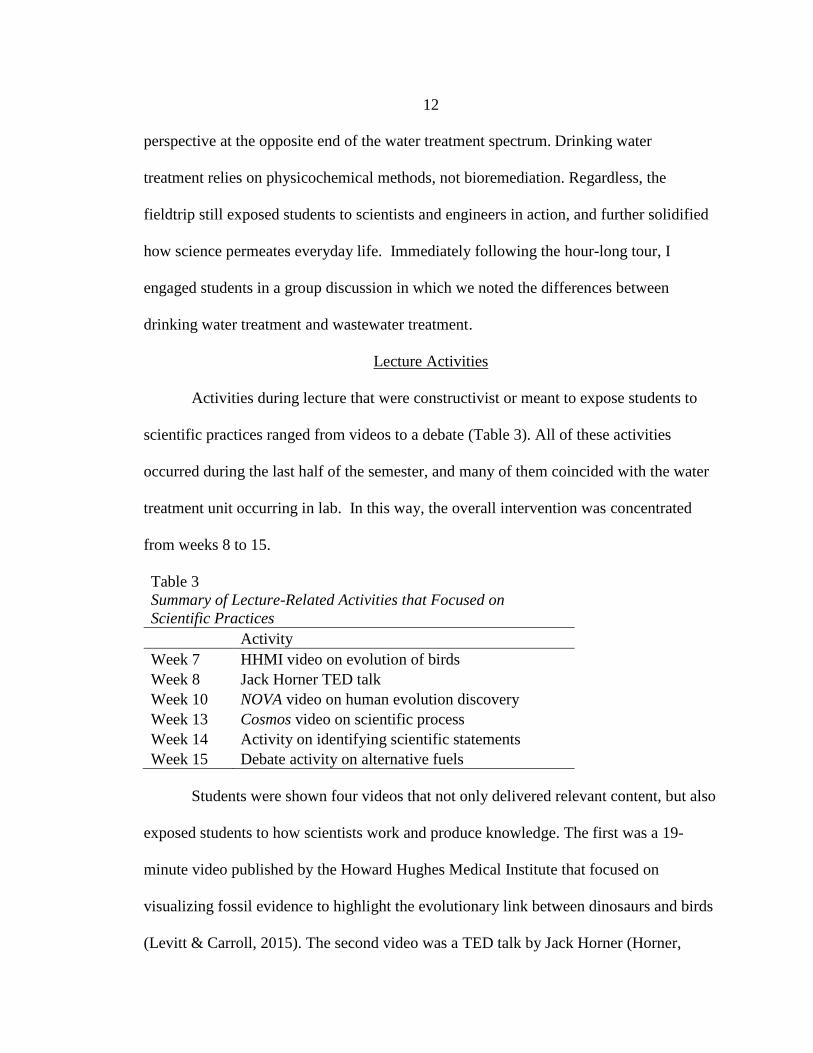
Activities during lecture that were constructivist or meant to expose students to
scientific practices ranged from videos to a debate (Table 3). All of these activities
occurred during the last half of the semester, and many of them coincided with the water
treatment unit occurring in lab. In this way, the overall intervention was concentrated
from weeks 8 to 15.
Table 3
Summary of Lecture-Related Activities that Focused on
Scientific Practices
Activity
Week 7 HHMI video on evolution of birds
Week 8 Jack Horner TED talk
Week 10 NOVA video on human evolution discovery
Week 13 Cosmos video on scientific process
Week 14 Activity on identifying scientific statements
Week 15 Debate activity on alternative fuels
Students were shown four videos that not only delivered relevant content, but also
exposed students to how scientists work and produce knowledge. The first was a 19-
minute video published by the Howard Hughes Medical Institute that focused on
visualizing fossil evidence to highlight the evolutionary link between dinosaurs and birds
(Levitt & Carroll, 2015). The second video was a TED talk by Jack Horner (Horner,

13
2011), a renowned dinosaur paleontologist and professor at Montana State University. In
the 16-minute video, Horner described scientific evidence and its meaning, in addition to
how genetic tools can be used to expose the common ancestry between dinosaurs and
birds. The third video was a two-hour episode of NOVA, a television series broadcast on
PBS, called “Dawn of Humanity” (Townsley, 2015) that gave an excellent look at the
process of scientific discovery. The video highlighted the efforts that went into finding
and extracting fossils of a new hominin species named Homo naledi. The final video
shown to students was an episode of the television mini-series, Cosmos: A Space
Odyssey, called “The Clean Room” (Druyan, Soter, & Braga, 2014). This 45-minute
video highlighted efforts by scientist Clair Patterson to date the age of the Earth. The
video provides a superb view into the process of science and the determinedness and
integrity of Patterson’s character.
During week 14, students participated in an in-class assignment designed to
increase their understanding of what constitutes scientific knowledge. This activity
provided opportunities for students to evaluate ways in which information is produced,
understand criteria for what distinguishes science from other ways of knowing, and
evaluate claims as scientific or non-scientific based on the aforementioned criteria. This
activity was adapted from Bramschreiber and Westmoreland (2015).
The final activity was an inquiry-based debate on alternative energy, which
corresponded to the lecture topic of global warming. This is an inquiry-based activity
because students collect information, make conclusions, and engage in scientific
argumentation. Students were organized into four groups. Half of those groups were
14
assigned the topic of nuclear energy and the other half were assigned the topic of
bioethanol. The two groups for each topic debated each other, however, they were not
told whether they would be arguing the pro or con side until the day of the debate. As
such, a week before the debate students were instructed to research both the pro and con
sides, using credible references, and to turn in an annotated bibliography. On the day of
the debate, I randomly assigned each group to either the pro or con viewpoint and then
gave them 15 minutes as a group to prepare. The actual debate consisted of opening
statements and one round of rebuttals, followed by a brief class discussion. Prior to
introducing the assignment, I informed students that argumentation is important to the
scientific process. But unlike people such as politicians, who argue mostly based on
ideology, scientists rely on facts. They were instructed to debate using fact-based
arguments.
Data Collection
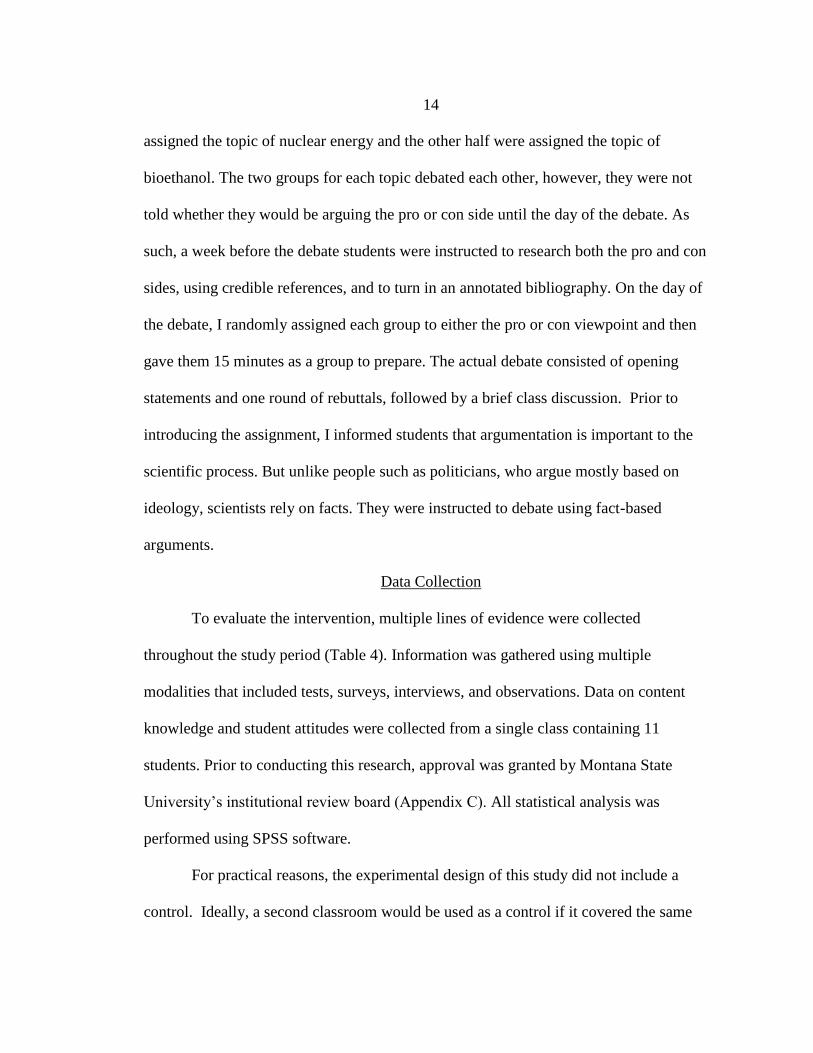
To evaluate the intervention, multiple lines of evidence were collected
throughout the study period (Table 4). Information was gathered using multiple
modalities that included tests, surveys, interviews, and observations. Data on content
knowledge and student attitudes were collected from a single class containing 11
students. Prior to conducting this research, approval was granted by Montana State
University’s institutional review board (Appendix C). All statistical analysis was
performed using SPSS software.
For practical reasons, the experimental design of this study did not include a
control. Ideally, a second classroom would be used as a control if it covered the same

15
material but did not focus heavily on engaging students in scientific practices. However,
this would have required me to teach at least two sections of the same course during the
study period, which was not possible. Lacking a control, this study does not have the
ability to address the question of whether constructivist teaching methods are superior to
traditional methods. However, the study does allow me to see if this curriculum, in
itself, is effective in reaching its goals of increasing student motivation, increasing
positive and more comprehensive attitudes toward science practices, and increasing
relevant content-knowledge.
Table 4
Data Triangulation Matrix
Surveys
Surveys were used to assess how semester-long engagement in scientific practices
and active learning changed student motivation and views towards science. For this, I
administered two types of surveys: one to assess students’ perception of motivation and
one to assess attitudes towards the nature of science. Both of these surveys were
administered together and given to all students both at the start and the end of the
semester. This method provided me the opportunity to detect changes in attitudes as a
Research Question Data Source 1 Data Source 2 Data Source 3
How has student
motivation and
interest changed?
Pre- and post-
intervention
surveys for
motivation
Instructor observations
of students
Post-intervention
randomized student
interviews
How have student
attitudes towards the
nature of science
changed?
Pre- and post-
intervention
surveys for
attitudes
Instructor observations
of students
Post-intervention
randomized student
interviews
How was student
content knowledge
affected?
Pre- and post-
intervention
assessments
Proficiency status
16
result of the intervention. Each submission was coded with a unique number to keep track
of respondents and to maintain their anonymity.
To assess student motivation, I used a validated instrument called the Biology
Motivation Questionnaire II (BMQ II; Appendix D; Glynn, Brickman, Armstrong &
Taasoobshirazi, 2011). Permission to use this copyrighted survey is granted to educators
that agree to comply with fair-use. This survey contained 25 Likert items organized into
five subscales:
intrinsic motivation, items 1, 3, 12, 17, and 19;
self-efficacy, items 9, 14, 15, 18, and 21;
self-determination, 5, 6, 11, 16, and 22;
grade motivation, 2, 4, 8, 20, and 24;
career motivation, 7, 10, 13, 23, and 25.
The second survey that I used is a non-validated instrument that I developed to
assess students’ attitudes towards the nature of science, hereafter referred to as the nature
of science survey. I was unable to find a validated instrument that fit my class and the
objectives of this study. Instead, I consulted literature on the nature of science (e.g.,
McComas, 2015) as well as validated instruments to develop my own survey. I took
inspiration, in particular, from the instrument developed by Liang et al. (2008), even
though I did not feel that their questions measured the specific items that I felt were
relevant to my study.
17
The nature of science survey (Appendix E) included 12 Likert items that fall into
three subscales. These are listed below, in addition to the Likert items that belong to
each:
Science is empirical: items 5, 7, 8, and 9;
Scientific knowledge has limits: items 2, 4, 10, and 12;
Scientific knowledge is tenable: items 1, 3, 6, and 11.
Thus, each subscale has four statements to assess one particular underlying construct,
which is the same theoretical format used by Liang et al. (2008).
To help validate the nature of science survey, I calculated Cronbach’s alpha (such
as in Liang et al., 2008) for the entire survey, in addition to each of the three subscales
mentioned above. Cronbach’s alpha is a measure of internal consistency and measures
how well Likert items correlate to one another (Laerd Statistics, 2013). Only if a
particular value was equal to or above 0.55 was I able to treat each category as a unified
Likert scale (Hatcher & Stepanski, 1995), which then allowed me to use statistical tests.
Responses for each Likert item were assigned values, zero to four and one to
five for the BMQ II and NOS survey, respectively. Scores were created by summing
these values and expressing it as a percentage of the total maximum points available.
Scores from the pre- and post-intervention surveys were compared using one-way
ANOVA when data met the assumptions of the test, such as normality and homogeneity
of variance. If they did not, I used the non-parametric Mann-Whitney U-test because it
does not rely on underlying assumptions regarding the nature of the data. Further
18
analysis included comparing individual Likert items between pre- and post-surveys by
simply comparing differences in median responses, without statistical testing.
Interviews
Students’ perceptions of motivation and attitudes towards the nature of science
were also assessed by administering post-intervention interviews. To achieve this, 5 of
the 11 students were randomly selected for an interview. Random selection occurred by
arbitrarily assigning students a number and then using a random number generator in
Excel to select the interviewees. I chose random selection because it allowed me to
extrapolate my results to the rest of the class.
The interview questions that I used were open-ended (Appendix F). This allowed
students to provide a variety of responses, some of which I was unable to anticipate. I
was concerned that interviewees might give me answers that they felt were “right”, as
opposed to their honest opinions. To help counteract this, a colleague of mine conducted
the interviews on my behalf. These interviews were audio recorded with the
interviewee’s consent. The interviews were treated as a five-point assignment as
motivation to participate. Students who were not randomly selected for an interview were
given an alternate five-point assignment. The interviews were conducted in private, away
from me and the rest of the class.
The interview questions for the topic of motivation (Appendix F) were
deliberately written to get students to think about the specific elements of class that
changed their levels of interest and motivation in biology. Two of the questions involved
the topic of relevance. From my experience, the more relevant the material and activities
19
are, the greater the interest and motivation from students. Therefore, relevance and
motivation are interrelated.
The interview questions that probed students’ attitudes on the nature of science
(Appendix F) were written to explore two things: 1) their current perceptions of how
science works, and 2) how this class has changed their viewpoints towards the nature of
science.
Data collected from the interviews were transcribed and entered into a Word file
(Appendix G). I searched for patterns among the respondents by looking at reoccurring
themes, ideas, and terms. I also looked for interesting or unique insights that provided
additional information that enabled me to assess the effectiveness of my intervention, or
gave me ways to improve curriculum for future classes.
Content Assessment
While the surveys were used to detect changes over the entire semester, the
content assessment was used for the last six weeks of semester only, which
corresponded to the water treatment unit occurring in lab. To objectively assess how
effective that curriculum was at promoting student learning, a pre-assessment was given
at week 9 while a post-assessment was administered at week 15. These identical
assessments were comprised of 18 multiple-choice and two short-answer questions that
covered topics of biochemistry, bioremediation, nutrient cycling, and wastewater
treatment (Appendix H). A key innovation employed for this assessment was use of an
“I don’t know” option for all questions. Students were instructed to select this if they
were unsure of an answer. This allowed for a more accurate reflection of students’

20
knowledge because it eliminated correct responses due solely to guessing. Overall
scores were calculated for each test, and differences for each student between the pre-
and post-assessments were calculated using normalized gain (Hake, 2002). Students
were deemed to show content proficiency of the content with a minimum score of 70%.
Difference between pre- and post-assessments were statistically tested using
one-way ANOVA, assuming that the data met the assumptions of this test. In
circumstances where the data did not meet these assumptions, I utilized the non-
parametric Mann-Whitney U test.
Instructor Observations
To supplement data collected from surveys on perceptions of self-motivation
and views towards science, I collected observations of the class. I wrote journal entries
once a week in which I recorded observations of student-to-student interactions, student
to teacher interactions, behaviors and body language exhibited during class, and
questions asked either during class or by email. These observations were analyzed by
looking for particular trends, unique or extraordinary student behaviors, and for
correlation between my observations and events that occurred during the intervention.
DATA AND ANALYSIS
Students’ motivation and attitudes towards science were assessed by surveys
administered prior to and after the semester-long intervention. Levels of motivation, in
particular, were determined by use of the Biology Motivation Questionnaire II (BMQ II;
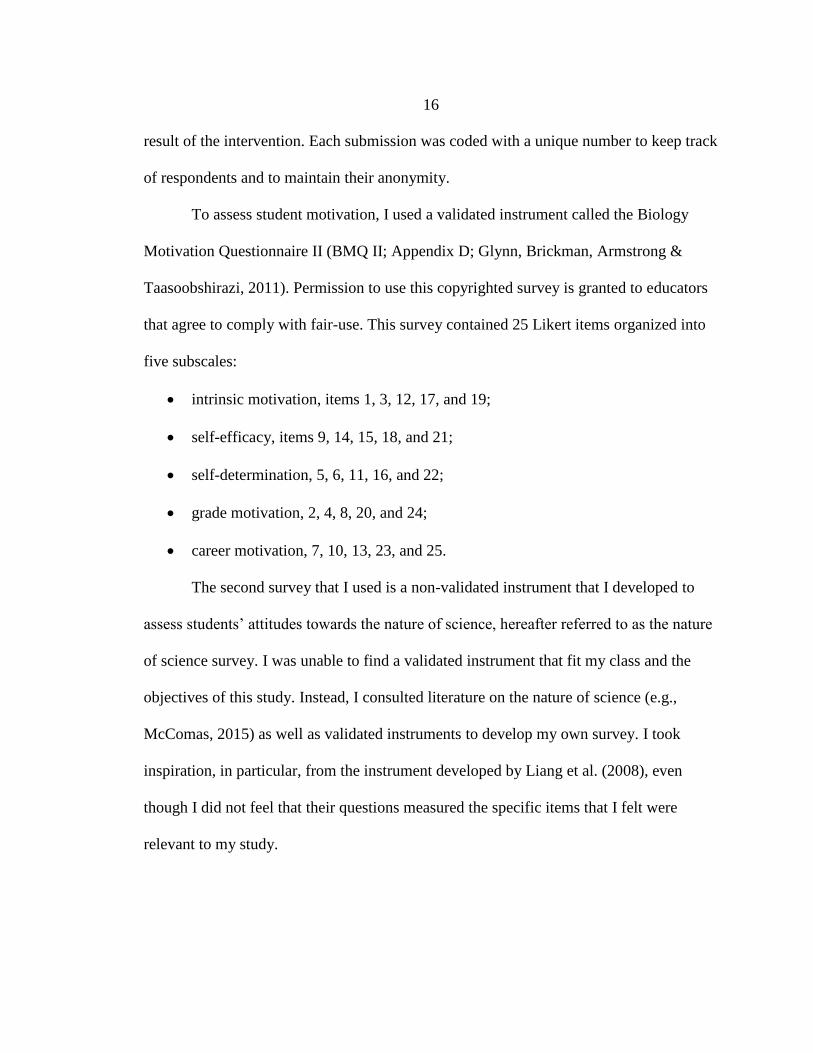
Gylnn et al., 2011). While a decrease of 1.54% in overall motivation was observed in

21
post-intervention scores (Figure 1), this difference was not significant (ANOVA; p =
0.721).
Five of 11 students exhibited a decrease in their overall post-intervention score for
the BMQ II, while the remaining 6 showed an increase. The average change for those
showing a decrease in scores was 12%, while those demonstrating an increase in score
had an average change of 8%. These differences were not statistically significant (U test;
p = 0.931). Two students had exceptionally large changes and therefore contributed
strongly to the results. Students #3 and #9 showed decreases of 25% and 23%,
respectively. These changes are more than twice that of any other student. Notably, both
Figure 1. Results from the Biology Motivation Questionnaire II (Gylnn et al.,
2011). No significant differences were found in either case; All students:
ANOVA; p = 0.721, N = 11; Outliers excluded: ANOVA, p = 0.523, N = 9.
22
of these students were randomly chosen for interviews and gave statements indicating no
change in their motivation. Specifically, student #9 stated, “I don’t think that my
motivation has really changed,” while student #3 remarked, “[the class] didn’t really
decrease my motivation it just, I didn’t see it being as easy as I thought it was going to
be.” Interestingly, both students reported exceptionally high scores on the pre-
intervention survey: 84% and 94%. If data from these two students are excluded then a
slight increase of 3% between pre- and post-intervention scores was seen (Figure 1). This
difference, however, is also not significantly different (ANOVA, p = 0.523).
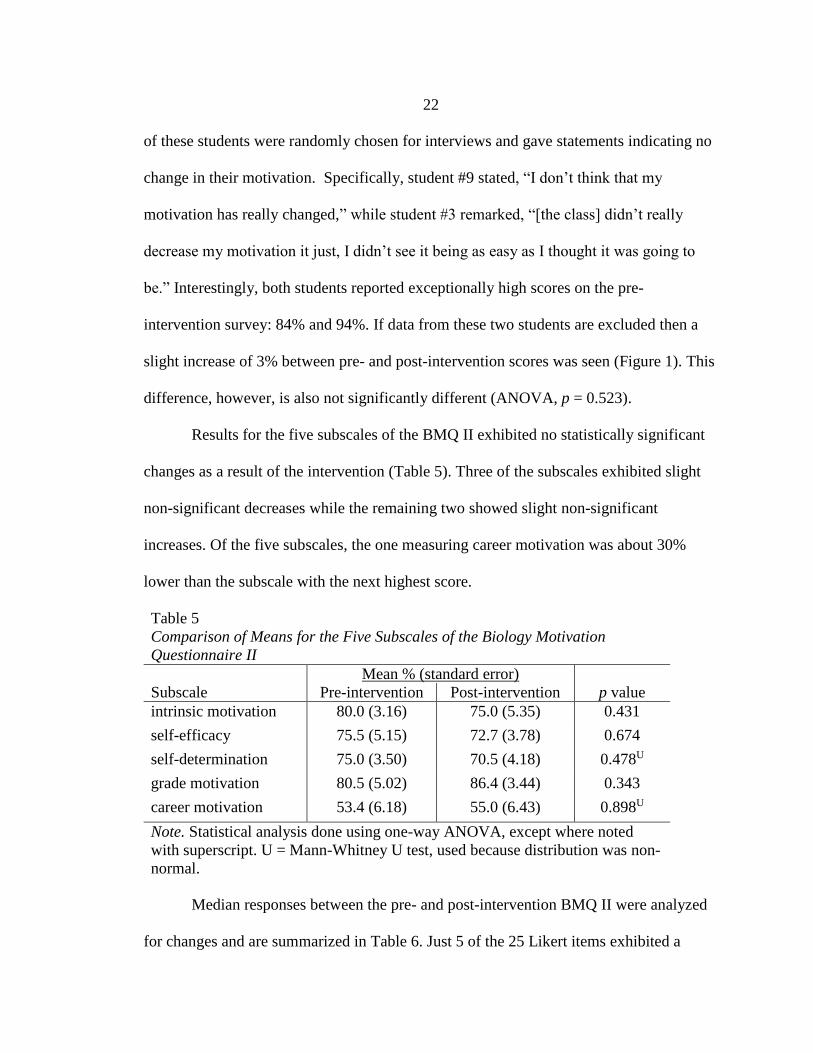
Results for the five subscales of the BMQ II exhibited no statistically significant
changes as a result of the intervention (Table 5). Three of the subscales exhibited slight
non-significant decreases while the remaining two showed slight non-significant
increases. Of the five subscales, the one measuring career motivation was about 30%
lower than the subscale with the next highest score.
Table 5
Comparison of Means for the Five Subscales of the Biology Motivation
Questionnaire II
Mean % (standard error)
Subscale Pre-intervention Post-intervention p value
intrinsic motivation 80.0 (3.16) 75.0 (5.35) 0.431
self-efficacy 75.5 (5.15) 72.7 (3.78) 0.674
self-determination 75.0 (3.50) 70.5 (4.18) 0.478U
grade motivation 80.5 (5.02) 86.4 (3.44) 0.343
career motivation 53.4 (6.18) 55.0 (6.43) 0.898U
Note. Statistical analysis done using one-way ANOVA, except where noted
with superscript. U = Mann-Whitney U test, used because distribution was non-
normal.
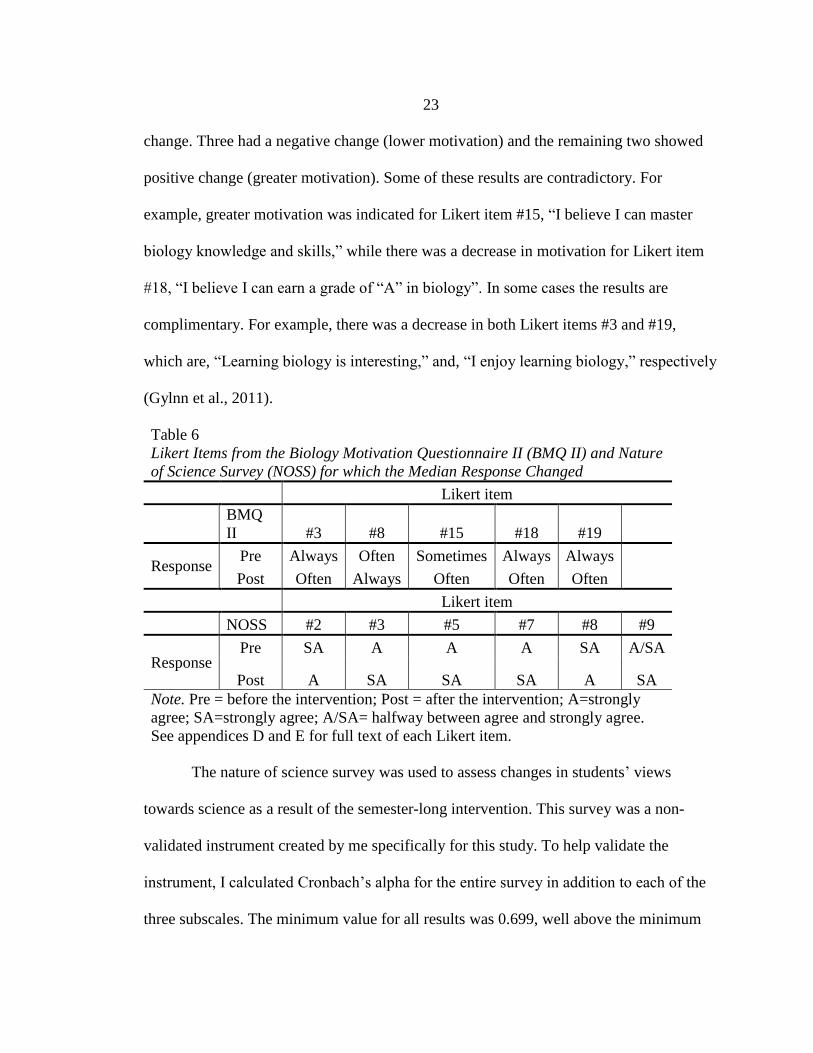
Median responses between the pre- and post-intervention BMQ II were analyzed
for changes and are summarized in Table 6. Just 5 of the 25 Likert items exhibited a
23
change. Three had a negative change (lower motivation) and the remaining two showed
positive change (greater motivation). Some of these results are contradictory. For
example, greater motivation was indicated for Likert item #15, “I believe I can master
biology knowledge and skills,” while there was a decrease in motivation for Likert item
#18, “I believe I can earn a grade of “A” in biology”. In some cases the results are
complimentary. For example, there was a decrease in both Likert items #3 and #19,
which are, “Learning biology is interesting,” and, “I enjoy learning biology,” respectively
(Gylnn et al., 2011).
Table 6
Likert Items from the Biology Motivation Questionnaire II (BMQ II) and Nature
of Science Survey (NOSS) for which the Median Response Changed
Likert item
BMQ
II #3 #8 #15 #18 #19
Response Pre Always Often Sometimes Always Always
Post Often Always Often Often Often
Likert item
NOSS #2 #3 #5 #7 #8 #9
Response Pre SA A A A SA A/SA
Post A SA SA SA A SA
Note. Pre = before the intervention; Post = after the intervention; A=strongly
agree; SA=strongly agree; A/SA= halfway between agree and strongly agree.
See appendices D and E for full text of each Likert item.
The nature of science survey was used to assess changes in students’ views
towards science as a result of the semester-long intervention. This survey was a non-
validated instrument created by me specifically for this study. To help validate the
instrument, I calculated Cronbach’s alpha for the entire survey in addition to each of the
three subscales. The minimum value for all results was 0.699, well above the minimum

24
threshold of 0.55 for validity (Table 7). This indicates high correlation, or internal
consistency, among the Likert items of the survey. These results indicated that I could
proceed with further analysis.
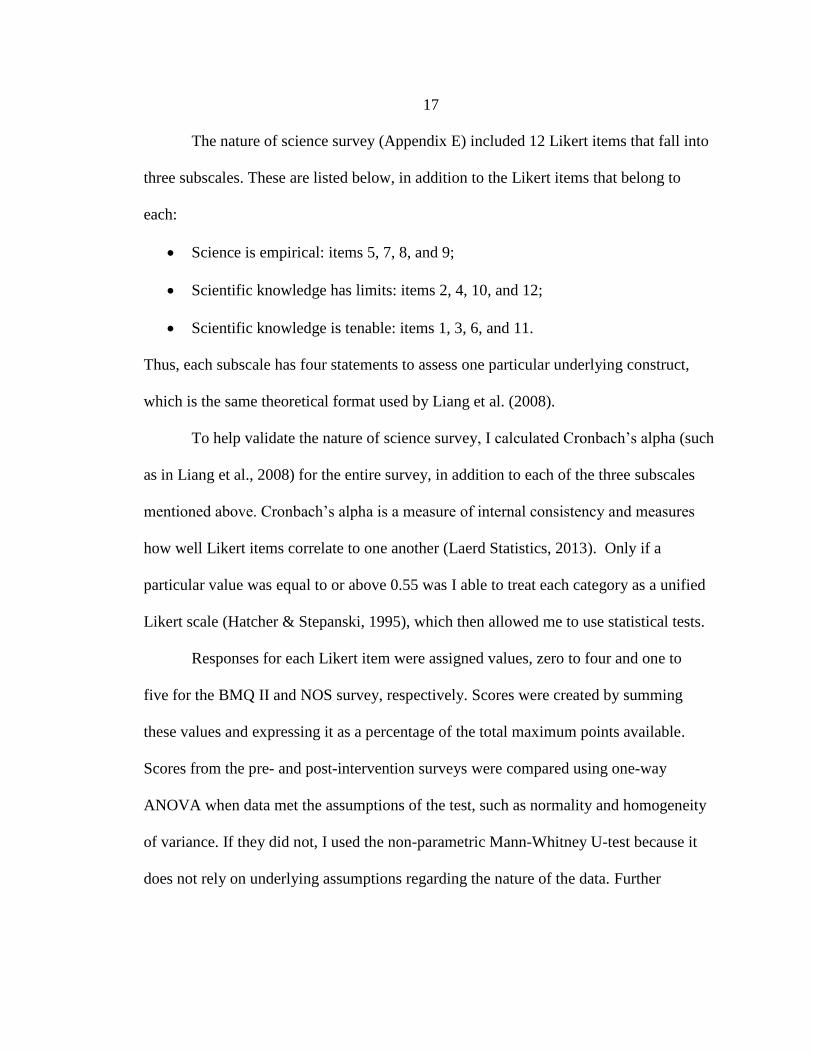
I found that average scores from the nature of science survey did not change as a
result of the intervention (Figure 2). Mean scores were slightly higher for the post-
intervention surveys, including the entire survey plus each of the three subcategories, but
these differences were not statistically significant (Table 7). All survey scores, whether
pre- or post-intervention, were relatively high in the 70% - 90% range. Unlike the survey
assessing motivation, only one person exhibited a decrease in their post-intervention
score. This person, student #9, was one of the two students that reported an exceptionally
large decrease in their motivation score. One student reported no change in score, while
the remaining nine showed an increase. The average change in score was +5%.
Table 7
Cronbach’s Alpha and Comparison of Means for the Nature of Science Survey (N=11)
Cronbach's alpha Comparison of means (%)
pre-
intervention
post-
intervention avg.
pre-
intervention
(SE)
post-
intervention
(SE) p value
Overall 0.878 0.854 0.866 77.8 (3.27) 82.9 (2.95) 0.269
Empirical 0.819 0.760 0.790 82.7 (4.59) 89.1 (3.68) 0.401U
Limits 0.725 0.755 0.740 70.0 (4.52) 71.8 (4.28) 0.773
Tenable 0.708 0.690 0.699 80.9 (3.36) 87.7 (3.26) 0.161
Note. Cronbach’s alpha values over 0.55 indicate a significant correlation (Liang et al.,
2008). “Overall” summarizes the summed scores for all survey questions. The following
are subscales: “Emprical" = questions 5 and 7- 9; “Limits” = questions 2, 4, 10, and 12;
“Tenable” = questions 1, 3, 6, and 11. “SE” = standard error; “U” denotes use of the non-
parametric Mann-Whitney U test because data failed test of normality.

25
Median responses on the pre- and post-intervention nature of science survey were
also analyzed for changes and are summarized in Table 6. Six of the 12 Likert items
exhibited such a change. Two had a negative change (less understanding) and the
remaining four showed positive change (greater understanding). For example, the median
response for the statement, “scientific knowledge is not intended to be an authority on
Figure 2. Boxplots showing median, first and third quartiles, and range for the nature of
science survey administered to students, (N=11). Clockwise from top left: "Overall"
summarizes the summed scores for all survey questions; "Science is Emprical" summaries
question 5, 7, 8, and 9; “Science is Tenable” summarizes questions 1, 3, 6, and 11; “Science
has Limits” summarizes questions 2, 4, 10, and 12. Statistical tests for each of the above
pairwise comparisions found no significant differences (see Table 6).

26
matters of spirituality and morality,” changed from “strongly agree” to “agree” following
the intervention.
The nature of science survey is similar to the Biology Motivation Questionnaire II
in that some of the results appear to contradict one another. For example, students
demonstrated a stronger belief that, “scientific knowledge is strictly based on information
that be measured and verified,” while concurrently showing decreased agreement with a
statement that said, “scientific knowledge cannot be produced without data collected
through observation and/or experimentation.”
All four Likert items in the “science is empirical” subscale of the survey exhibited
a change in the median response (items 5, 7, 8, and 9) following the intervention. In
comparison, each of the other two subcategories had only one Likert item that changed.
Of those Likert items in the “science is empirical” subcategory, three exhibited a change
towards a more positive response and one became more negative. Despite the
contradictory results noted in the previous paragraph, the students interviewed clearly
demonstrated an understanding of the importance of empiricism in science (Appendix I).
For example, all five students interviewed indicated that the course increased i) their
perception of how scientific knowledge is produced, ii) their ability to recognize
scientific statements, iii) the perceptions of science as fact-based, and iv) their skepticism
of those that present conclusions that are not evidence-based. Student #8’s response in the
interview is indicative of the other interviewees’ responses,
You don’t have to be a scientist, but you can’t just take everything for face value.
You want to look into it and investigate it …and I do that more now because of
this class than I did at the start.
27
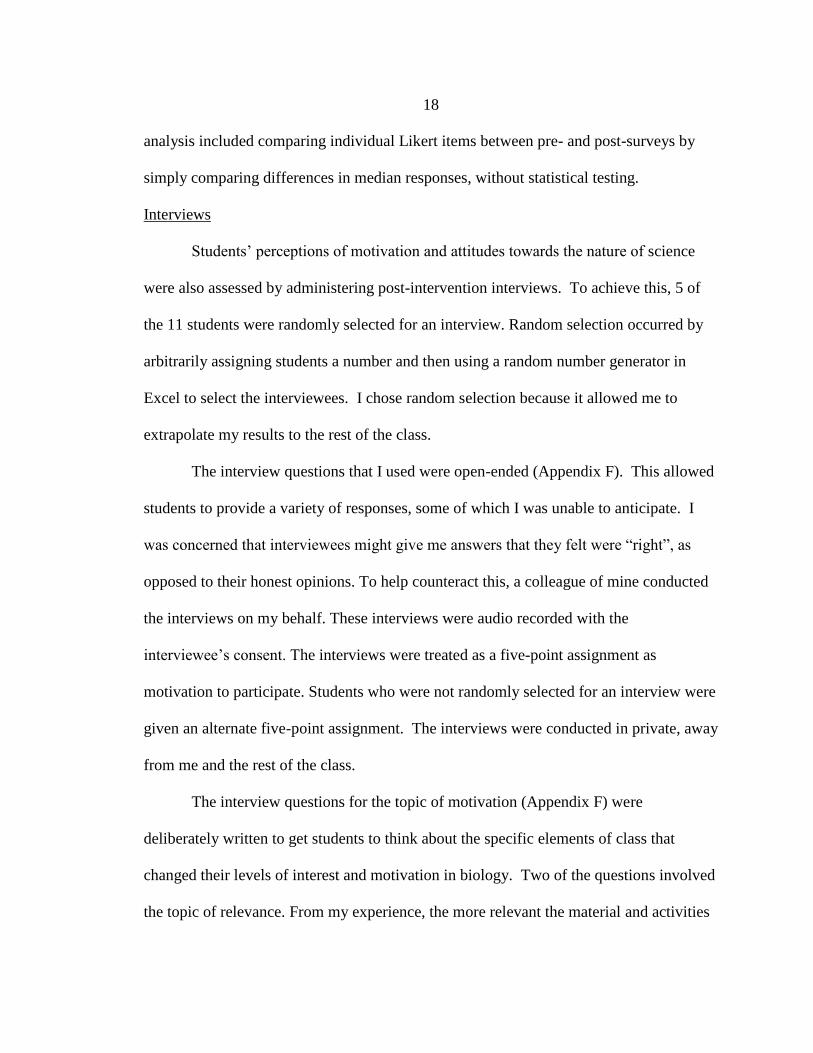
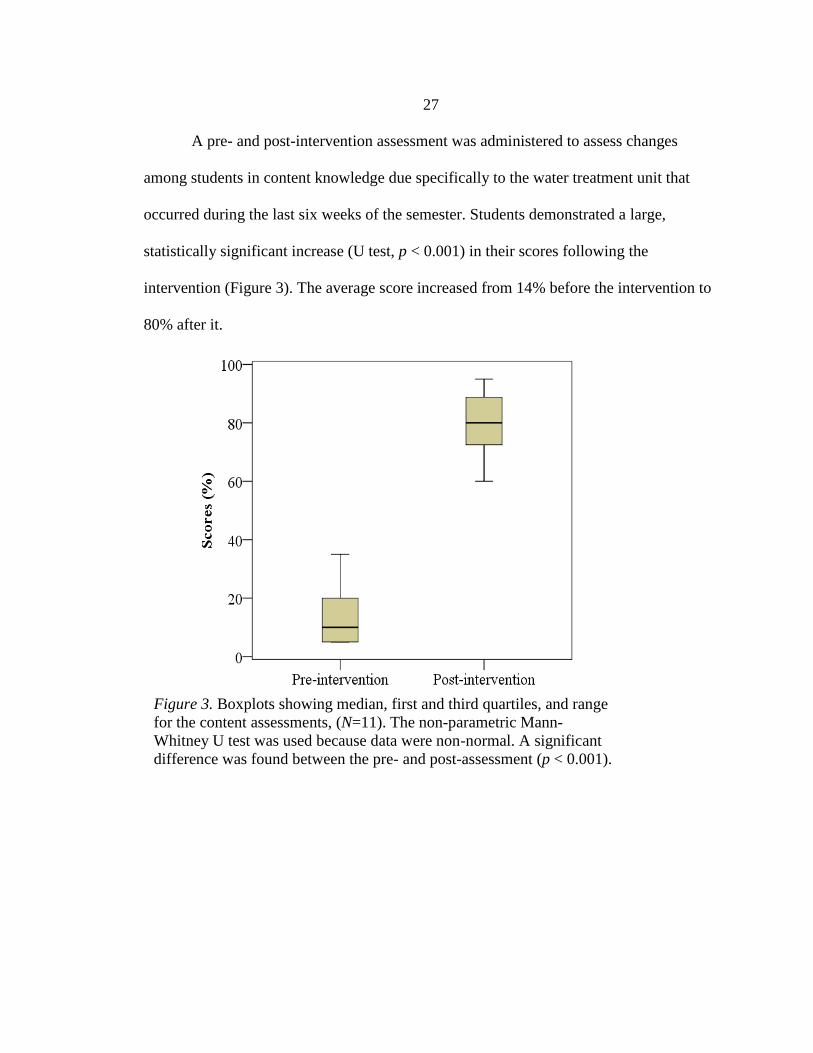
A pre- and post-intervention assessment was administered to assess changes
among students in content knowledge due specifically to the water treatment unit that
occurred during the last six weeks of the semester. Students demonstrated a large,
statistically significant increase (U test, p < 0.001) in their scores following the
intervention (Figure 3). The average score increased from 14% before the intervention to
80% after it.
Figure 3. Boxplots showing median, first and third quartiles, and range
for the content assessments, (N=11). The non-parametric Mann-
Whitney U test was used because data were non-normal. A significant
difference was found between the pre- and post-assessment (p < 0.001).

28
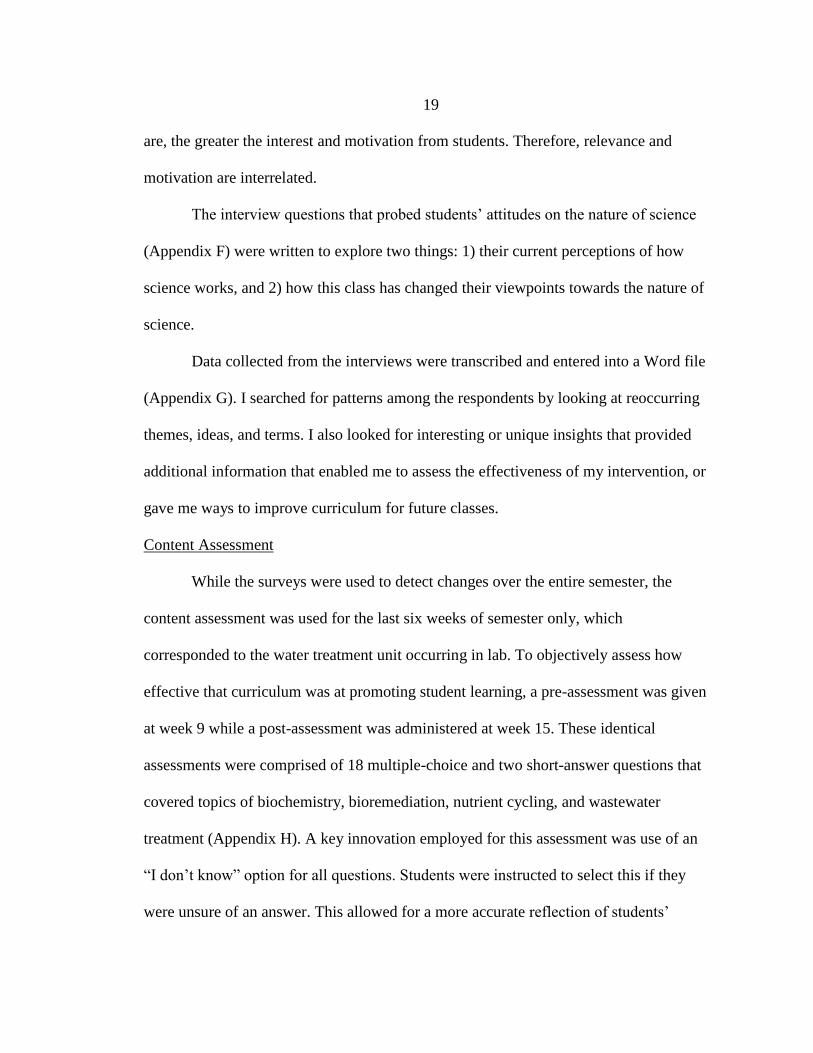
The average normalized gain between the pre- and post-intervention assessment was 0.75
(Figure 4). This indicates that, on average, students earned 75% of the maximum increase
possible. Regression analysis between normalized gain and motivation, as measured by
post-intervention BMQ II scores, found no relationship (R2 = 0.072, p = 0.426; Figure 5).
Similarly, there was no significant difference in normalized gain between students with
positive or negative changes in motivation (Figure 6). The mean normalized gain for
students with increased motivation was 80%, while those we decreased motivation had a
mean of 70%, a non-significant difference (ANOVA, p = 0.347).
Figure 4. Normalized gain between the pre- and post-test for
content knowledge, (N=11). Boxplot shows median, first and
third quartiles, and range for the content assessment.

29
Figure 6. Comparison of normalized gain on the content assessment between students that
reported a decrease, (N = 5), on the BMQ II versus those that reported an increase, (N = 6).
No statistically significant difference was discovered between the two groups (p = 0.347).
Boxplots show median, first and third quartiles, and range.
Figure 5. Scatterplot comparing motivation, as measured by post-intervention BMQ II
scores, and normalized gain on the content assessment, (N = 11). Regression analysis:
R2 = 0.072, p = 0.426.

30
When asked during the interviews what caused their interest in biology to
increase, students most frequently mentioned the activities of the water treatment unit
(Appendix I). Of the five students interviewed, four said that the field trips increased their
interest, three mentioned the inquiry-based water quality experiments, and one person
mentioned the NOVA video on human evolution that was shown during lecture. Student
#9 said, “I think in some ways it [the class] raised my level of interest in biology,
especially when we went to the wastewater treatment because it kind of showed a
different side that I hadn’t been previously exposed to.”
During the interviews, students were also asked how class affected their
perception of biology’s relevance. Again, the activities of the water treatment unit were
the most commonly mentioned (Appendix I). For example, all five students interviewed
mentioned the field trips. Student #9 added,
It definitely opened my eyes, a little more I think. When you’re not going into a
science specific field or something that is going to deal with science heavily later
on in a career, you go a little bit blind to ways the science is used in everyday life,
like the wastewater treatment for example. I don’t think many people know what
goes on there until you’ve actually gone there and explored it.
Students also attributed lecture-based activities to increasing their perceptions of
biology’s relevance. Specifically, units on global warming, human evolution, and
genetics were all mentioned.
INTERPRETATION AND CONCLUSION
A primary goal of this study was to determine how immersing students in
scientific practices impacted motivation and views towards science. Anecdotal evidence
from previous semesters suggested low motivation and poor scientific literacy because
most or all students were non-science majors. Studies have shown that non-science

31
majors report lower motivation (Glynn et al., 2011; Shell & Soh, 2013) and can
demonstrate lower understanding of the nature of science when compared to science
majors (Lin, 2014). Motivation is important because it is a key factor to student success
(Schunk, Pintrich, & Meece, 2008; as cited in Schumm & Bogner, 2016), whereas
understanding the nature of science (NOS) leads to traits such as skepticism and critical
thinking, cornerstones of scientific literacy (Lin, 2014).
In this study, the intervention appeared to have little impact on motivation and
views towards science. Surveys administered before and after the intervention indicated
no statistically significant change for both of these variables. In regard to motivation, the
class was split as approximately half increased in motivation while the other half
decreased. Meanwhile, 10 out of 11 students showed non-significant gains for the NOS
survey and 1 student exhibited a decrease. These results are not without precedent. At
least one other study found no gain in motivation following an intervention consisting of
constructivist pedagogy (Cetin-Dindar, 2016).
Results from both types of surveys in the present study are viewed with some
uncertainty, however, because of particular contradictions. For example, motivation
scores for two students profoundly decreased by more than 20%, but in the interviews
both students said that their motivation levels did not change over the semester.
Similarly, all students interviewed acknowledged that the class increased their
understanding of the NOS in at least one way, yet the differences between the pre- and
post-intervention surveys were not statistically different. Furthermore, one student
interviewed indicated that the class helped increase her understanding of NOS, but

32
nevertheless her NOS survey score decreased by 7% following the intervention. In
addition, I found contradictions within the survey results. On the BMQ II, for example, I
found the median response for one particular Likert item increased, while the median
response for a Likert item with nearly identical meaning decreased.
These issues raise doubt as to how accurately the interviews and/or surveys
captured viewpoints. The interview questions may have been too simplistic to fully assess
the complex constructs underlying motivation and views towards science. The survey
scores also appeared to be exceptionally high. When I collected the pre-intervention
BMQ II survey, in particular, I was immediately struck by the high scores. I suspected at
the time, and still do, that some students were not entirely truthful and instead provided
answers that they imagined would please me. The class average on the survey was 74%,
quite high for non-science majors taking their first college-level science course. In
comparison, Glynn et al. (2011) found that when validating the BMQ II the average
scores for 313 non-science majors was 63%. Additionally, Schumm and Bogner (2016)
tested 232 10th graders in a German college-preparatory school and found an average
score of 61%. Clearly, scores in the present study are inflated and possibly inaccurate,
which may have obscured the detection of meaningful trends.
In addition to these concerns, the small sample size of this study (N = 11) is
problematic. While anomalous results, like those described above, are to not uncommon
in a study, the impact that they have on the results is typically masked by a sufficiently
large sample size. In this study, the sample size was not large and therefore these

33
anomalies could have substantially biased the results. This could be remedied by pooling
data from future classes that receive the same intervention, and then re-analyzing it.
While there was little evidence in this study for change in both motivation and
views towards science due to the intervention, students interviewed did indicate that the
class impacted them in positive ways. For example, many students indicated that lab
activities, notably the fieldtrips, increased their motivation and helped them to see how
biology is relevant to their lives. One student described an enthusiasm for the open
inquiry lab experiment and the intellectual freedom it provided. Additionally, all students
interviewed demonstrated proficiency in certain aspects of scientific literacy, such as
skepticism and the importance of empiricism. It is likely that the semester-long habit of
collecting and analyzing data in lab, in addition to constructing evidence-based
explanations, contributed to this. In addition, two of the five students interviewed
specifically attributed the in-class activity on identifying scientific statements as having
increased their skills in this regard. Lastly, during the interviews students referenced
some of the videos shown during lecture that highlighted how scientists go about
collecting and interpreting evidence.
The other focus of this study was to determine how the water treatment unit
affected students’ achievement in content knowledge. I found that this portion of the
intervention was very successful in increasing students’ knowledge. The average score
increased from 14% to 80%, which is above the predetermined proficiency status of 70%.
The average normalized gain was 0.75, a remarkable increase. It should be noted,
however, that while this intervention was successful, the lack of a control group means
34
that I cannot conclude that the intervention worked better than any other type of
pedagogy, including those that do not immerse students in scientific practices and utilize
constructivist methods.
The large gains in content assessment scores may be attributed to the authentic
nature of the water treatment unit. This part of the intervention included two fieldtrips
and two inquiry-based lab experiments, each with real-world implications. Students
indicated in the interviews that they found these activities motivating and relevant.
Relevance (Glynn, et al., 2011) and authenticity (Hursen, 2016) positively contribute
toward motivation, and motivation is important to student achievement (Chow & Yong,
2013). A link between motivation as measured by the BMQ II and performance on the
content assessment was not observed in this study, however. Regression analysis showed
no relationship between normalized gain and BMQ II scores. Additionally, no difference
in normalized gain was found for students that exhibited increased versus decreased
motivation.
VALUE
Particular aspects of the intervention were useful to students and should continue
to be used in future classes. Information collected from interviews, content assessments,
and through my own observation indicate that the water treatment unit, in particular, was
effective in promoting learning, motivation, and biology’s relevance. The fieldtrips were
especially important in this regard. While students seemed to enjoy the open-inquiry lab,
I would like to expand the number of variables that students can test. Currently, students
measure E. coli levels only, but I believe that giving them the opportunity to measure

35
other variables of their choosing, such as pH and nitrate levels, would increase their level
of control and engagement in the experiment, promote deeper exploration of water
quality issues, and reinforce content from lecture.
Through observation and interviews, I found that the lecture activities were also
useful and will continue to be used. For example, the videos not only delivered content,
they also showcased how scientists conduct research, which is important when teaching
students about the nature of science (NOS). Students particularly liked the NOVA video
on human evolution (Townsley, 2015). This video focused on the complicated process by
which fossil evidence was collected. I thought students might get bored during the two-
hour viewing, or be off-put because human evolution can be a contentious social issue,
but neither were the case.
Substantial changes in motivation were not achieved in this study. Part of this
may be due to inaccurate survey results. In the future, having someone else administer
and collect the surveys, in addition to having students use a unique numerical code
instead of their name, might give them the sense that the surveys are anonymous and thus
lead to more truthful responses. The intervention should also be modified in ways to
increase motivation and the water treatment unit can serve as a model for this. This unit
was effective because students found it relevant and authentic, both of which can
contribute towards motivation. Greater efforts should be taken in lecture, in particular, to
highlight how content is applicable to their lives.
Modification of the intervention is also needed to enact greater gains in students
understanding of the NOS. The present study relied on engaging students in scientific

36
practices and watching videos that highlighted the work of scientists. Johnson (2016)
argues that such an approach is not enough, stating that,
If we hope to develop scientifically literate citizens, science education must
extend beyond content knowledge and scientific practices to uncover the values
and habits of mind that are specific to science (p. 371).
Requiring students to actively reflect upon the values and habits of scientists may lead to
a deeper understanding of the NOS. These reflections could be applied to videos or case
studies that showcase scientists, in addition to students’ own scientific endeavors in lab.
Some aspects of the NOS were not explicitly addressed by me during the semester, such
as the process of peer review. Spending more time in class, through instruction and
reflection, will likely increase scientific literacy.
Overall, this study implemented constructivist teaching practices that promote
active learning, such as inquiry-based labs, debates, and collaborative in-class
assignments. I will continue to implement and refine constructivist techniques because it
has been shown to positively affect many aspects of learning (Wood, 2009). Inquiry-
based learning, in particular, is especially interesting to me because it promotes deep
learning through the critical analysis of data (Minner, Levy, & Century, 2010). I want
students to learn science by doing science and therefore will continue to implement
inquiry-based strategies. Additionally, this study immersed students in scientific
practices, as recommend by National Research Council (2012), and involved them in
authentic experiences, as recommend by the American Association for the Advancement
of Science (2011). As I move forward I will strive to improve student outcomes by
implementing research-based pedagogy and following the motto: teaching science
through science.

37
REFERENCES CITED

38
Ahlgren, A. (1996). How Standards Fit Within the Framework of Science Education
Reform. In: Issues in Science Education. Rhoton, J. and Bowers, P. (Eds.), pp. 40-45.
Arlington, VA: National Science Teachers Association.
American Association for the Advancement of Science. (2011). Vision and Change in
Undergraduate Biology Education: A Call to Action. Washington, DC: AAAS.
Retrieved from http://visionandchange.org/files/2013/11/aaas-VISchange-
web1113.pdf.
Beck, C., Butler, A., & Burke da Silva, K. (2014). Promoting Inquiry-Based Teaching in
Laboratory Courses: Are We Meeting the Grade? CBE – Life Sciences Education,
13, 444–452.
Bramschreiber, T. & Westmoreland, D. (2015). Preparing Students for Science in the
Face of Social Controversy. The American Biology Teacher, 77 (4), 284-288.
Cetin-Dindar, A. (2016). Student Motivation in Constructivist Teaching Environment.
Eurasia Journal of Mathematics Science and Technology Education, 12 (2), 233-247.
Chow, S.J., & Yong, B.C.S. (2013). Secondary school students’ motivation and
achievement in combined science. US-China Education Review B, 3 (4), 213-228.
Crowther, D.T. (1999). Cooperating with constructivism: getting the word out on the
meaning of constructivism. Journal of College Science Teaching, September/October,
17-23.
Druyan, A. (Writer & Director), Soter, S. (Writer), & Braga, B. (Director). (2014). The
clean room. [Television series episode] In B. Braga (Producer), Cosmos: A Spacetime
Odyssey. Los Angeles, CA: Fox Network.
Eastwell, P. & MacKenzie, A.H. (2009). Inquiry learning: elements of confusion and
frustration. The American Biology Teacher, 71 (5), 263-266.
Freeman, S., Eddy, S.L., McDonough, M., Smith, M.K., Okoroafor, N., Jordt, H., &
Wenderoth, M.P. (2014). Active learning increases student performance in science,
engineering, and mathematics. PNAS, 111 (23), 8410-8415.
Glynn, S. M., Brickman, P., Armstrong, N., & Taasoobshirazi, G. (2011). Science
Motivation Questionnaire II: Validation with science majors and nonscience majors.
Journal of Research in Science Teaching, 48, 1159-1176.
39
Hake, R.R. (2002). Relationship of Individual Student Normalized Learning Gains in
Mechanics with Gender, High-School Physics, and Pretest Scores on Mathematics
and Spatial Visualization. Submitted to the Physics Education Research Conference;
Boise, Idaho.
Hartle, R.T., Baviskar, S., & Smith, R. (2012). A Field Guide to Constructivism in the
College Science Classroom: Four Essential Criteria and a Guide to their Usage.
Bioscene, 38 (2), 31-35.
Hatcher, L. & Stepanski, E.J. (1994). A Step-by-Step Approach to Using the SAS System
for Univariate and Multivariate Statistics. Cary, NC: SAS Institute.
Horner, Jack. (2011). Building a dinosaur from a chicken [Video file]. Retrieved from
https://www.ted.com/talks/jack_horner_building_a_dinosaur_from_a_chicken?langua
ge=en
Hursen, C. (2016). The impact of curriculum developed in line with authentic learning on
the teacher candidates’ success, attitude and self-directed learning skills. Asia Pacific
Education. Review, 17, 73–86.
Johnson, W. R. (2016). Why engaging in the practices of science is not enough to achieve
scientific literacy. The American Biology Teacher, 78 (5), 370-375.
Kahoot! (2015). www.getkahoot.com.
Ketpichainarong, W., Panijpan, B., & Ruenwongsa, P. (2010). Enhanced learning of
biotechnology students by an inquiry-based cellulase laboratory. International
Journal of Environmental and Science Education, 5 (2), 169-187.
Laerd Statistics. (2013). Cronbach’s alpha using SPSS statistics. Retrieved May 19, 2016,
from https://statistics.laerd.com/spss-tutorials/cronbachs-alpha-using-spss-
statistics.php.
Levitt, D., & Carroll, S. (2015). Great transitions: the origin of birds [Video file].
Retrieved from https://www.youtube.com/watch?v=z4nuWLd2ivc
Liang, L.L., Chen, S., Chen, X., Kaya, O.N., Adams, A.D., Macklin, M. & Ebenezer, J.
(2008). Assessing preservice elementary teachers’ views on the nature of scientific
knowledge: a dual-response instrument. Asia-Pacific Forum on Science Learning and
Teaching, 9 (1): article 1.
Lin, S. (2014). Science and non-science undergraduate students’ critical thinking and
argumentation performance in reading a science news report. International Journal of
Science and Mathematics Education, 12, 1023-1046.

40
Llewellyn, Douglas. (2013). Teaching High School Science Through Inquiry and
Argumentation. Thousand Oaks, CA: Corwin
McComas, W. F. (2015). The nature of science and the next generation of biology
education. The American Biology Teacher, 77 (7), 485-491.
Minner, D.D., Levy, A.J., & Century, J. (2010). Inquiry-based science instruction - what
is it and does it matter? Results from a research synthesis years 1984 to 2002. Journal
of Research in Science Teaching, 47 (4), 474-496.
Moyer, R. A. (2012). Evaluating different levels of inquiry in the science classroom
(Unpublished Master’s Project). Montana State University, Bozeman.
National Research Council. (2012). A Framework for K-12 Science Education.
Washington, D.C.: The National Academies Press.
Puttick, G., Drayton, B., & Cohen, E. (2015). A study of the literature on lab-based
instruction in biology. The American Biology Teacher, 77 (1), 12-18.
Saunders, W. L. (1992). The constructivist perspective: Implications and teaching
strategies for science. School Science and Mathematics, 92 (3), 136-141.
Shell, D. F., & Soh, L. 2013. Profiles of motivated self-regulation in college computer
science courses: differences in major versus required non-major courses. Journal of
Science Education and Technology, 22 (6), 899-913.
Schumm, M. F., & Bogner, F. X. (2016). Measuring adolescent science motivation.
International Journal of Science Education, 38 (3), 434–449.
Tomasik, J.H., LeCaptain, D., Murphy, S., Martin, M., Knight, R.M., Harke, M.A.,
Burke, R., Beck, K., & Acevedo-Polakovich, I.D. (2014). Island explorations:
discovering effects of environmental research-based lab activities on analytical
chemistry students. Journal of Chemical Education, 91, 1887−1894.
Townsley, G. (Director). (2015). Dawn of humanity. [Television series episode] In G.
Townsley (Producer), NOVA. Boston, MA: WGBH. Retrieved from
http://www.pbs.org/wgbh/nova/evolution/dawn-of-humanity.html
Unsworth, E. (2014). Macromolecules Inquiry: Transformation of a Standard
Biochemistry Lab. The American Biology Teacher, 76 (7), 438-441.
Wood, W.B. (2009). Innovations in teaching undergraduate biology and why we need
them. Annual Review of Cell and Developmental Biology, 25, 93–112.
41
Wheeler, G.F. (2006). Strategies for Science Education Reform. Educational Leadership,
64, 30-34.

42
APPENDICES

43
APPENDIX A
LABORATORY INSTRUCTIONS FOR STUDENTS
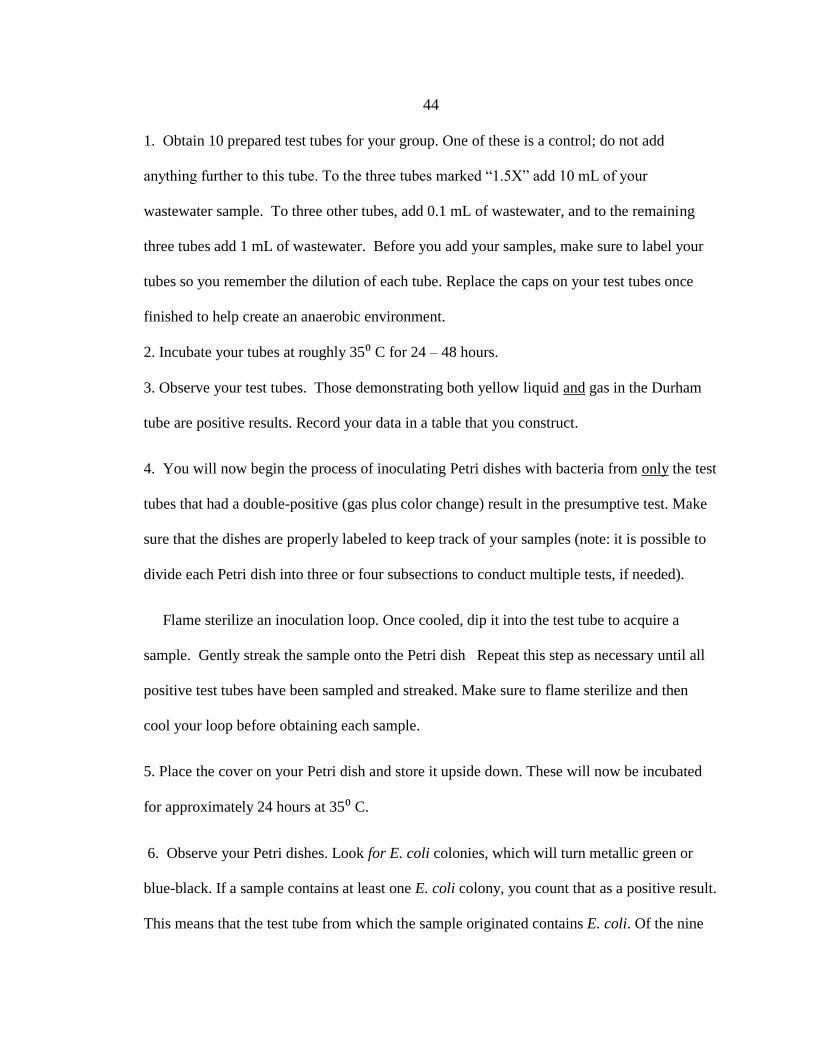
44 1. Obtain 10 prepared test tubes for your group. One of these is a control; do not add
anything further to this tube. To the three tubes marked “1.5X” add 10 mL of your
wastewater sample. To three other tubes, add 0.1 mL of wastewater, and to the remaining
three tubes add 1 mL of wastewater. Before you add your samples, make sure to label your
tubes so you remember the dilution of each tube. Replace the caps on your test tubes once
finished to help create an anaerobic environment.
2. Incubate your tubes at roughly 35⁰ C for 24 – 48 hours.
3. Observe your test tubes. Those demonstrating both yellow liquid and gas in the Durham
tube are positive results. Record your data in a table that you construct.
4. You will now begin the process of inoculating Petri dishes with bacteria from only the test
tubes that had a double-positive (gas plus color change) result in the presumptive test. Make
sure that the dishes are properly labeled to keep track of your samples (note: it is possible to
divide each Petri dish into three or four subsections to conduct multiple tests, if needed).
Flame sterilize an inoculation loop. Once cooled, dip it into the test tube to acquire a
sample. Gently streak the sample onto the Petri dish Repeat this step as necessary until all
positive test tubes have been sampled and streaked. Make sure to flame sterilize and then
cool your loop before obtaining each sample.
5. Place the cover on your Petri dish and store it upside down. These will now be incubated
for approximately 24 hours at 35⁰ C.
6. Observe your Petri dishes. Look for E. coli colonies, which will turn metallic green or
blue-black. If a sample contains at least one E. coli colony, you count that as a positive result.
This means that the test tube from which the sample originated contains E. coli. Of the nine

45 experimental test tubes that you originally started with, count which were positive for E. coli.
You will use these data and the “most probable number” table to calculate the number of
bacteria in your sample. Your instructor will ask each group to share their results so that data
can be collated for the entire class.
46
APPENDIX B
LAB MATERIALS AND INSTRUCTIONS FOR PREPARATION
47
Materials
•phenol red lactose broth •Levine eosin-methylene blue (EMB) agar •Petri dishes
•pipettes •test tubes •test tube caps •test tube racks •Durham tubes •safety
gloves •incubator •inoculator loops •Bunsen burner •biohazard bag •10% bleach
solution
Instructions
Nine experimental test tubes are needed per group of students, plus one control.
To reduce the amount of materials needed, four students per group is recommended.
Create the phenol red lactose broth using the easy-to-follow instructions on the
package. Add 5 mL of the broth to 6 of the 9 experimental test tubes, plus the control. For
the remaining three, however, you want to use 5 mL of broth that is 1.5x strength. This is
done to provide enough lactose for the tubes receiving 10 mL of the wastewater sample.
Label these tubes as “1.5x”. Thus, each group should have 7 tubes of normal strength
broth and 3 tubes of 1.5x strength. An inverted Durham tube should also be placed in
each test tube so that the open end of the tube is face down and the tube is at least
halfway submerged in the broth. Then, the test tubes should be autoclaved to be sterilized
before being used. The autoclave process will completely fill the Durham tubes with
solution. Remove the test tubes from autoclave and cover with sterile test tube caps.
These caps will later be used to create an anoxic environment for anaerobic metabolism.
Lastly, using the instructions on the package, prepare enough Levine EMB agar
for three Petri dishes per group, plus a few backups. During the lab, ensure that students
follow proper safety guidelines, including use of gloves when handling wastewater

48
samples, proper disposal or sterilization of biohazardous waste (which includes anything
that has touched wastewater; consult your institution’s specific safety protocols), and
disinfection of lab tables using a bleach solution.

49
APPENDIX C
INSTITUITIONAL REVIEW BOARD APPROVAL
50

51
APPENDIX D
BIOLOGY MOTIVATION QUESTIONNAIRE II

52
BIOLOGY MOTIVATION
QUESTIONNAIRE II (BMQ-II)
© 2011 SHAWN M. GLYNN, UNIVERSITY OF GEORGIA, USA
In order to better understand what you think and how you feel about your biology courses,
please respond to each of the following statements from the perspective of “When I am in a
biology course…”
Statements Never
0
Rarely
1
Sometimes
2
Often
3
Always
4
01. The biology I learn is relevant to my life.
02. I like to do better than other students on biology tests.
03. Learning biology is interesting.
04. Getting a good biology grade is important to me.
05. I put enough effort into learning biology.
06. I use strategies to learn biology well.
07. Learning biology will help me get a good job.
08. It is important that I get an "A" in biology.
09. I am confident I will do well on biology tests.
10. Knowing biology will give me a career advantage.
11. I spend a lot of time learning biology.
12. Learning biology makes my life more meaningful.
13. Understanding biology will benefit me in my career.
14. I am confident I will do well on biology labs and projects.
15. I believe I can master biology knowledge and skills.
16. I prepare well for biology tests and labs.
17. I am curious about discoveries in biology.
18. I believe I can earn a grade of “A” in biology.
19. I enjoy learning biology.
20. I think about the grade I will get in biology.
21. I am sure I can understand biology.
22. I study hard to learn biology.
23. My career will involve biology.
24. Scoring high on biology tests and labs matters to me.
25. I will use biology problem-solving skills in my career.

53
APPENDIX E
NATURE OF SCIENCE SURVEY

54
Survey Regarding the Nature of Science
For each one of the following statements, please choose one of the following options that best
describes your viewpoint: Strongly disagree (SD), Disagree (D), neutral (N), agree (A), strongly agree
(SA). Please be advised that there are no “right” answers.
Statements
SD
D
N
A
SA
1. Scientific knowledge can be modified as new and relevant
evidence is collected.
2. Scientific knowledge is not intended to be an authority on
matters of spirituality and morality.
3. If a scientist published erroneous conclusions from a study, it
is likely that other scientists would identify those mistakes and
seek to correct them.
4. Scientists can only study things that are based on the physical
laws of nature.
5. Scientific knowledge is strictly based on information that can
be measurable and verified.
6. Scientists are expected to publically share their methods and
conclusions so that others can scrutinize and critique their work.
7. Scientific theories, such as the theory of evolution or the
theory of plate tectonics, are developed through the accumulation
of multiple lines of supporting evidence.
8. Scientific knowledge cannot be produced without data
collected through observation and/or experimentation.
9. Science produces fact-based truths about the world.
10. Someone cannot be both scientific and religious.
11. Argumentation and debate are important process in the
construction of scientific knowledge.
12. There are limits to the types of questions that can be
answered through science.

55
APPENDIX F
INTERVIEW QUESTIONS

56
Interview Question
Participation in this research is voluntary and participation or non-participation will not
affect a student’s grades or class standing in any way.
Questions 1-5 regard students’ self-perception of motivation and interest
Opening statement: Over the last few weeks, you have participated in several lab
activities that include a field trip, a lab experiment in which you tested wastewater
samples, and a personalized experiment in which you tested water samples of your own
choosing. From this last experiment, you presented your results to the class.
1. Please explain the ways in which any of the lab activities mentioned in the opening
statement may have affected your level of interest in biology.
2. Please explain the ways in which any of the activities or content covered in the
lecture portion of the class may have affected your level of interest in biology.
3. Considering only those lab activities mentioned in the opening statement, do you feel
that any of them changed your opinion for how biology can be relevant to the lives of
non-scientists? Please explain how participating in these activities changed your
opinions, if at all.
4. Considering only the activities and content covered in lecture, do you feel that any of
it changed your opinion for how biology can be relevant to the lives of non-scientists?
Please explain how any elements of lecture may have changed your opinions
changed, if at all.
5. Do you feel that your motivation to earn a high grade in the class has changed from
the first day of class to now? If so, please discuss which specific elements of the
class, whether in lecture or lab, have most strongly contributed to this change.
Questions 6-10 regard students’ attitudes towards the nature of science
6. Do you feel that your understanding of how scientist go about studying the world and
discovering new knowledge has changed because of this class? If so, please explain
how.
7. In what ways, if any, has this class affected your ability to evaluate statements as
being scientific or not? Please explain your answer.
8. In what ways, if any, do you feel that this class has changed your viewpoints towards
the role of science, and biology in particular, to society?

57
9. Do you feel that science provides knowledge and explanations that are trustworthy?
Please explain your answer.
10. Imagine a scientist that purposes a new theory, but does not provide any supporting
evidence. How do you feel other scientists should react to this?

58
APPENDIX G
INTERVIEW TRANSCRIPTS

59
Transcript of Interview Responses
Interview 1. Student #8
Q1: “The fieldtrips and the water testing increased my interest in biology because it just
goes to prove that even though we just drink water….Knowing that we could test it
ourselves & find out things that we didn’t know about E. coli in our water…is interesting
because you kinda just assume it’s safe but when you test it yourself you kinda find out
that maybe it’s not”
Q2: “Well I changed my whole, um, career choice, because of…I’m going into biology
now…the class just opened my eyes to like, I had a lot of questions about things, but
didn’t really, I just kinda went with the flow, didn’t really think about it…you know, you
wonder things, the class brought it out for me, learning so many things I didn’t know,
like, holy crap, really, this is how it works?....This class helped me decide, like hey, I
want to do something different, and it’s about biology…I was scared to death to take this
class and now I’m glad that I did.”
Q3: “Absolutely, just like I was saying earlier, you don’t have to be a scientist ….going
on these trips opened our eyes to what we didn’t know, we just go with the flow…it
opens up that scientific part of your brain that you don’t think about on a daily basis, so
going on these fieldtrips, yes, it is important to non-scientists because it shows you what
they do, like the process taken to ensure that you’re drinking healthy water, where your
water goes when it goes down the sink and down the toilet.”
Q4: “Yeah, because we don’t think about the things that scientists think about, so taking
this class kind of opens up your mind to some of the things that maybe you should be
thinking about. You don’t know have to be a scientist, you just have to think about these
things, especially in our environment.”
Q5: “Yep, cause I mean, I always strive to try to get the best grade that I can, I always
say I’m getting an A….now that I’m going into biology, like that’s what I’m pursuing as
a career, it’s that much more important to get an A in the class. I’m trying harder that I
was, so yah…the passions that I have in my own life, how much I care for the planet”
Q6: “Yes, because I mean when you think about scientists you think about nerdy people
in lab coats and they’re sitting around in labs…they’re like total geeks, but scientists
aren’t actually and they do a lot and all the things they do go into everything that we do,
you don’t think about, oh a scientists did this, you think about they’re only solving the
huge problems in the world, but they do everything.”
Q7: “You can’t just accept things as they are, like you should probably look into it….so,
you don’t have to be a scientist, but you can’t just take everything for face value. You
want to look into it and investigate it …and I do that more now because of this class than
I did at the start”

60
Q8: “Well, I changed my whole career path because of the class.”
Q9: “Um, yes I think that …they’re the ones that go and put the proof out there, they’re
the ones that go out and investigate things, fix things, and make things better for us…so
yeah, I think they’re the ones that challenge things, they don’t just like take something at
face value, they’re the ones that actually prove it. Yeah, they are trustworthy.”
Q10: “They should prove it. They shouldn’t just, you know, so if they didn’t do any
research on it I would say you have to research it, as a scientists….Like if a scientist that
is well known just came up and said, I think this, all the other scientists should be like,
excuse me.”
Interview 2. Student #6
Q1: “I guess the thing that stood out the most was during own experiment for the
wastewater samples of our choosing. Yeah, I thought that was interesting…being able to
choose what we wanted to do and then control the experiment the way we wanted to do it
instead of being told what to do…so I just thought that was nice and interesting.”
Q2: “I guess the Kahoot! quizzes that he did really helped my interest. It helped me
understand what we were learning in that class, too. He would go over it in the lectures
and stuff and go into details but I was learning better by doing these small quizzes that
didn’t affect our grade at all, so I thought that was able to boost my interest in
biology…and doing all of those sorts of labs I think was really nice.”
Q3: “Yeah, I thought that going on the two field trips, the wastewater and the water
treatment center, because I’m from Reno, NV and we never got to do any of that stuff in
any biology classes, so when I moved up here coming up and going to those facilities,
seeing them firsthand how the process is done really boosted it up.”
Q4: “I guess so, I don’t know. I don’t know how to answer that one.”
Q5: “I guess the only thing that changed was the trying to get a better grade because at
the beginning of the semester it was a little hard, I just didn’t really put too much effort
forth, and then once I started to pay attention, like really starting to focus on the class, it
started to go up, change I guess, a little bit….It was mostly the lab activities because I
like doing all the, all the lab activities really helped boost that, too, because I like
firsthand interaction with everything instead of just being taught out of the book or
something.”
Q6: “I think it’s interesting, we learned about…a professor down in Missoula and he
would go around and do look for all these samples of dinosaurs and everything, so I
thought learning about that was really interesting.”
Q7: “We did an activity of learning of different statements of scientific, ah ways to spot
them, in scientific ways, to explain, ah, I don’t know. I don’t really know how to answer

61
it. I guess the activity was one we learned, we just reviewed other peoples’ statements
and just evaluated the statements throughout, so I guess that really helped.”
Q8: “It really didn’t change my viewpoints, I mean it opened, it just expanded on some
stuff that I already knew coming into the class, just expanding on those helped, too. We
talked a little bit about biofuels, like I knew a little about that but having us do a debate
about it really helped and I learned both the pros and cons of everything so that really
helped.”
Q9: “Yeah, I would say so. As long as you have the correct or proper sources to back it
all up and the proper information I guess.”
Q10. “They would question him I would see. Be very questionable. And I’d have to ask
to see what, where his evidence came from and stuff, and see all his supporting of that.”
Interview 3. Student #3.
Q1: “Well, I didn’t know that biology had a lot to do with water treatment, so it was
really cool seeing how it all played into it. And then when we did our own sample seeing
how much E. coli bacteria was in the Missouri river was actually, it was gross, but it was
really cool because it turned the shiny green color so I’d say that it made my interest
higher than it was before, made it seem a lot cooler.”
Q2: “We watched this video on human evolution, they found a bunch of fossils or bones
in this cave and it was really cool to see the change in skulls and bones and just how we
are built over time, so that increased by interest a lot. That was my favorite.”
Q3: “Yes, so biology affects all of us with just even water, so I didn’t really consider that
before he introduced the whole topic. It was cool to see that even little things like that
have to do with biology so it definitely applies to everyone not just biologists and
scientists.”
Q4: “Well, he talked about global warming and stuff, so that would definitely affect
everyone not just scientists, so that would definitely affect everyone. I can’t really think
of anything else specifically. That one is the main one that I noticed.”
Q5: “At the beginning I was like, it will be so easy to get an A because I really like
biology. I took it my senior year so I thought it was really cool, and then the first test, I
didn’t, well he told us we’d be tested three chapters at a time, but I didn’t know how
difficult that would be until the first test. So much information to remember, but it didn’t
really decrease my motivation it just, I didn’t see it being as easy as I thought it was
going to be. Of course, I’m going to strive for a good grade but I just felt like it got a little
harder to really set that goal to get an A.”

62
Q6: “Yeah, I didn’t know that, how much that they still do with old, old fossils, and like
bones, and then how they study so much with global warming, like I said, they just have a
lot to go over. It didn’t really occur to me before how much it’s important to everything.”
Q7: “I mean, I think I could evaluate this before, too, but just seeing if something is
backed up by other studies then it’s going to be more scientific than something that
doesn’t have any evidence with it.”
Q8: “Well, it definitely has a way bigger impact than I thought, um, just with, I didn’t
know a lot of things had to do with biology, so a lot of things that, like, I’m going to say
it again, global warming, and all of that. So that affects all us and that is definitely
science and biology related.”
Q9: “Yes. But only when it’s backed up. So if it’s just something that someone came up
with, then not really, but definitely a lot of the things are backed up by a lot and there are
proven experiments too.”
Q10: “Probably pretty wary of it, like not immediately trusting it but maybe also not
throwing it out the window, maybe coming up with a possible experiment to maybe test
that.”
Interview 4. Student #9
Q1: “I think in some ways it raised my level of interest in biology, especially when we
went to the wastewater treatment because it kind of showed a different side that I hadn’t
been previously exposed to.”
Q2: “What I found most interesting were the sections on human genetics and human
evolution. Those are kind of areas that I’ve always been interested in. And that’s about
the only part of biology that really like blows my mind. So I’ve always wanted kinda like
do more continued research in that, but I’m not going into a biology field, it’s kind of a
wash in some ways.”
Q3: “It definitely opened my eyes, a little more I think. When you’re not going into a
science specific field or something that is going to deal with science heavily later on in a
career you go a little bit blind to ways the science is used in everyday life, like the
wastewater treatment for example. I don’t think many people know what goes on there
until you actually gone there and explored it.”
Q4: “I definitely feel it did, again kind of going back to human genetics and evolution,
that’s something that obviously affects all of us. So being able to understand that a little
bit more and then be able to explain it to other people that have questions on it who didn’t
major in science or do scientific things, it’s kind of important because it helps me engage
someone else that hasn’t’ thought about science previously either.”

63
Q5: “I don’t think that my motivation has really changed, I have always wanted to be a
high grade earner, sometimes that doesn’t happen like you do bad on a test because you
didn’t study well enough or something like that, but my motivation from day one is still
the same, I still want to have high grades, I still want to do well so when I go to UGF my
tuition is knocked down because of higher grades.”
Q6: “I feel that I have a bit more information behind it, um, what we go through in the
high school courses doesn’t go as in-depth into scientific knowledge and discovery. It
gives you an overview to kind of get the gist of what you’re going to be doing when you
make your own hypothesis and design your own labs or go through labs, but it doesn’t
really help you understand why things are the way they are for scientists.”
Q7: “I think it gave me a little more clarity on it, um, we definitely all know the
difference between like a scientific journal and a tabloid, so when you see something like,
aliens visit president Obama on a tabloid you obviously know that’s not true because it’s
not coming from a scientific journal. Now if it came from science news weekly or
something like that, I’d probably be apt to read it, but it just those tabloids you should
obviously know that it’s not.”
Q8: “I’m not really sure, I mean it’s definitely opened my eyes a little bit more to how in-
depth science goes and scientific knowledge and studies and all that. And I think if more
people like read more scientific journals or things like that they’d have a better
understanding about science stuff. But I think society likes to try to be blind to it because
it doesn’t fit the norms or what we expect.”
Q9: “I do, because they have to go through really in-depth research, they have to put their
answers out their and people critique them like crazy, so that kind of makes a person
more apt to like slow down and really think about what they’re going to put out there and
be like, people are going to critique this, how will I take that criticism? So I think that it
becomes more trustworthy because more people are looking at, hey maybe you’re wrong
here why don’t we go research that a little bit more, or, I agree with you and here is a
little bit more research that we can pony up and do together.’
Q10: “I feel like they should just definitely like jump on it and um, go more in-depth to it
, like why wasn’t there any research backed up to this, are these claims factual or are they
kind of just like some misconstrued idea and that’s why they didn’t put facts up, or if
there are reasons for no facts, and then if they can find facts or any supporting evidence
they should publish those and get those out there so that the scientific world and society
in general has a better understanding of what was just mentioned.”
Interview 5. Student #1.
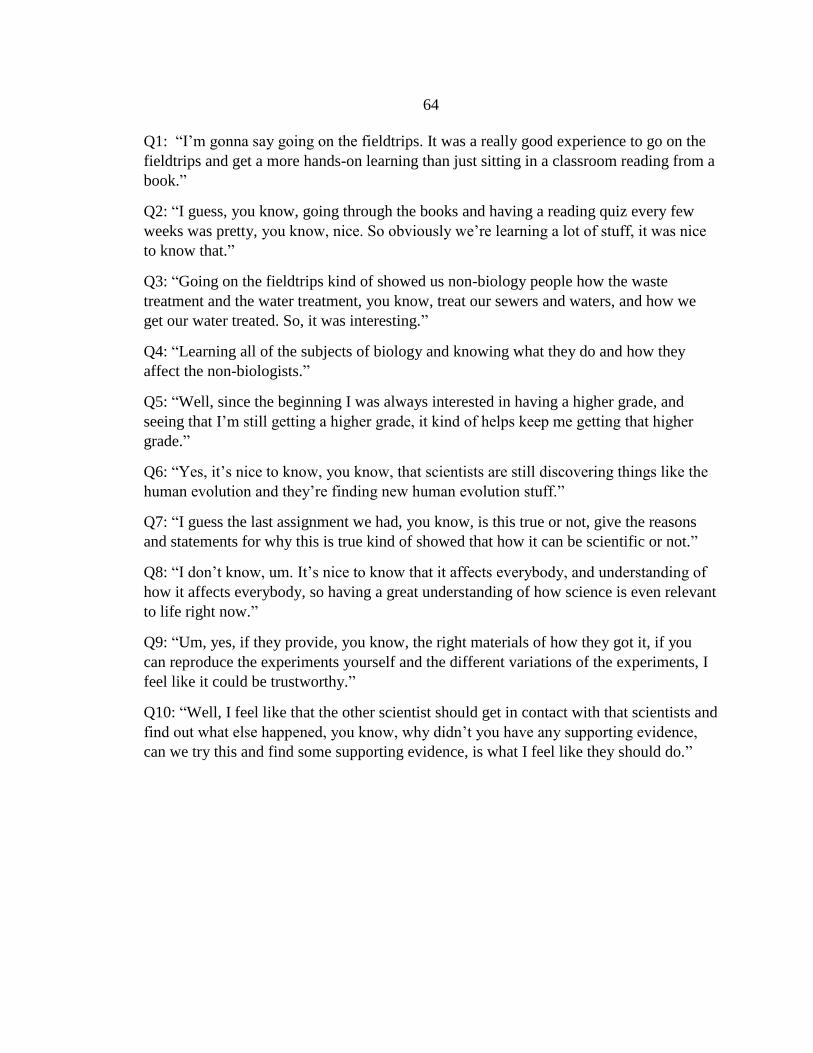
64
Q1: “I’m gonna say going on the fieldtrips. It was a really good experience to go on the
fieldtrips and get a more hands-on learning than just sitting in a classroom reading from a
book.”
Q2: “I guess, you know, going through the books and having a reading quiz every few
weeks was pretty, you know, nice. So obviously we’re learning a lot of stuff, it was nice
to know that.”
Q3: “Going on the fieldtrips kind of showed us non-biology people how the waste
treatment and the water treatment, you know, treat our sewers and waters, and how we
get our water treated. So, it was interesting.”
Q4: “Learning all of the subjects of biology and knowing what they do and how they
affect the non-biologists.”
Q5: “Well, since the beginning I was always interested in having a higher grade, and
seeing that I’m still getting a higher grade, it kind of helps keep me getting that higher
grade.”
Q6: “Yes, it’s nice to know, you know, that scientists are still discovering things like the
human evolution and they’re finding new human evolution stuff.”
Q7: “I guess the last assignment we had, you know, is this true or not, give the reasons
and statements for why this is true kind of showed that how it can be scientific or not.”
Q8: “I don’t know, um. It’s nice to know that it affects everybody, and understanding of
how it affects everybody, so having a great understanding of how science is even relevant
to life right now.”
Q9: “Um, yes, if they provide, you know, the right materials of how they got it, if you
can reproduce the experiments yourself and the different variations of the experiments, I
feel like it could be trustworthy.”
Q10: “Well, I feel like that the other scientist should get in contact with that scientists and
find out what else happened, you know, why didn’t you have any supporting evidence,
can we try this and find some supporting evidence, is what I feel like they should do.”
65
APPENDIX H
CONTENT ASSESSMENT

66
Participation in this research is voluntary and participation or non-participation
will not affect a student’s grades or class standing in any way.
Please answer these questions to the best of your ability. Record your answers for
questions 1 -18 on a Scantron form. Please put your name on it. This quiz is NOT graded.
If you don’t know the answer, do NOT guess. Instead, please pick option E.
1) An organism gets its energy from the sun and its carbon from organic molecules.
Therefore, this organism is a…
A. photoautotroph.
B. photoheterotroph.
C. chemoautotroph.
D. chemoheterotroph.
E. I don’t know
2) Which one of the following best describes the term “bioremediation”?
A. Transferring genes from one organism to another
B. Using organisms to remove pollutants
C. Inducing mutations to create new species
D. Utilizing living things to create commercially valuable products
E. I don’t know
3) The element nitrogen is important to all living things because it is…
A. found in nucleic acids and proteins.
B. found in proteins and lipids.
C. found in nucleic acids and carbohydrates.
D. a component of N2.
E. I don’t know
4) What is the purpose of primary wastewater treatment?
a) remove suspended solids.
b) remove dissolved organic material.
c) remove excess nitrogen.
d) disinfect the water.
e) I don’t know.
5) In the multiple tube fermentation technique, what causes phenol red to change
yellow?
A) increased urea concentration
B) acid production by bacteria
C) lactose production by bacteria
D) an increase in dissolved solids
E) I don’t know.

67
6) In the multiple tube fermentation technique, what causes gas to accumulate in the
Durham tubes?
A) the activity of bacteria
B) the reaction of different inorganic compounds
C) air being drawn in from the outside environment
D) photosynthesis
E) I don’t know.
7) Which of the following water sources would you expect to have the lowest amount of
bacteria?
A. outfall
B. primary clarifier
C. secondary clarifier
D. tertiary treamtment bioreactor
E. I don’t know
8) ______ convert usable nitrogen (which can be used by plants) into N2, which is
unusable.
A) Nitrifying bacteria
B) Nitrogen-fixing bacteria
C) Denitrifying bacteria
D) Fungi
E) I don’t know
9) An organism the extracts energy from chemicals and carbon from organic molecules is
a…
A) photochemotroph.
B) photoheterotroph.
C) chemoheterotroph.
D) chemophotoautotroph.
E) I don’t know.
10) What is the purpose of secondary wastewater treatment?
A) remove bacteria.
B) remove dissolved organic material.
C) remove suspended solids.
D) remove excess nitrogen.
E) I don’t know.

68
11) In an experiment testing the effects of a drug on weight loss, which one of the
following would best represent a hypothesis?
A. the drug will cause people to lose weight because it increases their metabolism
B. people that take the drug will lose weight
C. 20 people will be given the drug
D. A control is needed to make accurate conclusions
E. I don’t know.
12) Which one of the following processes would specifically target the removal of
nitrogen from wastewater?
A. primary treatment
B. secondary treatment
C. tertiary treatment
D. quaternary treatment
E. I don’t know
13) Which of the following processes rely on bioremediation?
A. primary treatment
B. secondary treatment
C. tertiary treatment
D. B and C
E. I don’t know
14) Which of the following processes involve bioremediation?
A. wastewater treatment
B. drinking water treatment
C. distilled water processing
D. all of the above
E. both I don’t know
15) Nitrogen fixation is a process that results in….
A. N2 being converted into NH3
B. NH3 converted into N2
C. NO3- being converted into NO2-
D. N being converted into C
E. I don’t know
16) During one particular step of wastewater treatment, fine organic material is removed
at the molecular level. What happens to it?
A. It is removed as a gas
B. It is filtered out
C. The matter is completely annihilated
D. It is radiated outward as excess heat
E. I don’t know
69
17) What is the purpose of the aeration basins at the Great Falls Wastewater treatment
plant?
A. To prevent blockage of drainage pipes by sludge
B. To provide gases needed for microbial metabolism
C. To blow out solid waste material
D. To increase the flow rate of the sewage
E. I don’t know
18) What removes dissolved organic material and nitrogen from the wastewater treated at
the Great Falls plant?
A. microbes
B. filters
C. animals
D. machines
E. I don’t know
For questions 19 – 20, if you don’t know the answer please do NOT guess. Instead, leave
the area blank.
19. What is the specific environmental source of the drinking water used by the City of
Great Falls?
20. After treatment, wastewater that originally came from sources like showers, sinks,
and toilets is discharged into what specific feature?
70
APPENDIX I
SUMMARY OF RESPONSES FROM POST-INTERVENTION INTERVIEWS

71
Question Summary of Response, with selected quotes
1: Which lab
activities
influenced
your level of
interest in
biology?
Four students identified the fields, while the water quality inquiry-based
labs were mentioned by three students.
“I didn’t know that biology had a lot to do with water treatment, so it was
really cool seeing how it all played into it. And then when we did our own
sample seeing how much E. coli bacteria was in the Missouri River was
actually, it was gross, but it was really cool” – Student #3
“…being able to choose what we wanted to do [in the inquiry lab] and then
control the experiment the way we wanted to do it instead of being told
what to do.” – Student #6
2: Which
lecture
activities
influenced
your level of
interest in
biology?
No common theme emerged here. The responses ranged from quizzes to a
video on evolution shown in class. One person mentioned that the class
made her change careers from education to biology.
“I changed my whole, um, career choice, because of, I’m going into
biology now…the class just opened my eyes” – Student #8
“I guess the Kahoot! quizzes that he did really helped my interest. It helped
me understand what we were learning in that class, too.” – Student #6
3: How have
labs changed
views of
biology’s
relevance?
Four of five students indicated that lab activities changed their views. The
fifth student’s answer was vague in this regard. All five students directly
mentioned or alluded to the field trips.
“Going on the fieldtrips kind of showed us non-biology people how the
waste treatment and the water treatment, you know, treat our sewers and
waters, and how we get our water treated. So, it was interesting.” – Student
#1
“[the fieldtrip are] important to non-scientists because it shows you what
they do, like the process taken to ensure that you’re drinking healthy water,
where your water goes when it goes down the sink and down the toilet.
-Student # 8
4: How has
lecture
changed
views of
biology’s
relevance?
Two students said their views towards this have increased, but did not give
any specific details regarding how class contributed to this. One student
was not able to give a response. The remaining two students had this to
say:
“he talked about global warming and stuff, so that would definitely affect
everyone not just scientists, so that would definitely affect everyone.” –
Student #3
“I definitely feel it did, again kind of going back to human genetics and
evolution, that’s something that obviously affects all of us. –Student #9
5: What
caused
levels of
motivation
to change?
Four students said motivation come from within or simply the desire to get
a good grade. One student attributed his change to lab activities.
“I don’t think that my motivation has really changed, I have always wanted
to be a high grade earner.” – Student #9
“It was mostly the lab activities because I like doing all the, all the lab
activities really helped boost that, too, because I like firsthand interaction“-
Student #6

72
6: Has class
changed
your views
regarding
how
scientific
knowledge is
produced?
All five students stated that the class increased the perception of how scientific
information is produced. Two, however, did not directly address how the class
specifically contributed to this. Two made reference to a video on an important
discovery in paleoanthropology, one made reference to a Ted Talk by paleontologist
Jack Horner. One of these students also referenced the class discussion on how
evidence of global warming is produced.
“I didn’t know that, how much that they still do with old, old fossils, and like bones,
and then how they study so much with global warming” – Student #3
“I feel that I have a bit more information behind it, um, what we go through in the high
school courses doesn’t go as in-depth into scientific knowledge and discovery” –
Student #9
7: Has class
changed
your ability
to discern
scientific
statements?
All five students felt that the course increased this ability, however three students gave
vague answers that didn’t specify which part of class contributed. The other two
students mentioned the in-class activity on classifying statements as scientific or not.
“you don’t have to be a scientist, but you can’t just take everything for face value. You
want to look into it and investigate it …and I do that more now because of this class
than I did at the start” –Student #8
“the last assignment we had, you know, is this true or not, give the reasons and
statements for why this is true, kind of showed how it can be scientific or not.” -
Student #1
8: Has class
changed
your views
regarding
role of
biology in
society?
All five students indicated that the course positively increased this perception. Three
students provided non-specific responses. The other two students are summarized
here:
“We talked a little bit about biofuels, like I knew a little about that but having us do a
debate about it really helped and I learned both the pros and cons of everything so that
really helped.” – Student #6
“it definitely has a way bigger impact than I thought…I didn’t know a lot of things had
to do with biology, so a lot of things that, like, I’m going to say it again, global
warming, and all of that.” – Student #3
9: Is
scientific
knowledge
trustworthy?
All five students indicated in the affirmative. In their explanation, all students
mentioned that it is trustworthy because there is evidence and research behind that
knowledge.
“Yes, I think that they’re the ones that go and put the proof out there, they’re the ones
that go out and investigate things, fix things, and make things better for us” – Student
#8
“I do, because they have to go through really in-depth research, they have to put their
answers out there and people critique them like crazy, so that kind of makes a person
more apt to like slow down and really think about what they’re going to put out there”
– Student #9
10: How
should
scientists
react to new
theory that
lacks
supporting
evidence?
All five students indicated that scientists should react with skepticism and require
some sort of corroborating proof.
“They would question him I would see. Be very questionable. And I’d have to ask to
see what, where his evidence came from and stuff, and see all his supporting of that.” –
Student 6
“I feel like they should…go more in-depth to it, like why wasn’t there any research
backed up to this, are these claims factual or are they kind of just like some
misconstrued idea and that’s why they didn’t put facts up?” – Student #9