IMF Country Report No. 16/35 MOROCCO Country Report No. 16/35 MOROCCO 2015 ARTICLE IV CONSULTATION...
62
© 2016 International Monetary Fund IMF Country Report No. 16/35 MOROCCO 2015 ARTICLE IV CONSULTATION—PRESS RELEASE; STAFF REPORT; AND STATEMENT BY THE EXECUTIVE DIRECTOR FOR MOROCCO Under Article IV of the IMF’s Articles of Agreement, the IMF holds bilateral discussions with members, usually every year. In the context of the 2015 Article IV consultation with Morocco, the following documents have been released and are included in this package: A Press Release summarizing the views of the Executive Board as expressed during its December 14, 2015 consideration of the staff report that concluded the Article IV consultation with Morocco. The Staff Report prepared by a staff team of the IMF for the Executive Board’s consideration on December, following discussions that ended on November 4, 2015, with the officials of Morocco on economic developments and policies. Based on information available at the time of these discussions, the staff report was completed on November 30, 2015. An Informational Annex prepared by the IMF staff. A Statement by the Executive Director for Morocco. The document listed below have been or will be separately released. Selected Issues The IMF’s transparency policy allows for the deletion of market-sensitive information and premature disclosure of the authorities’ policy intentions in published staff reports and other documents. Copies of this report are available to the public from International Monetary Fund Publication Services PO Box 92780 Washington, D.C. 20090 Telephone: (202) 623-7430 Fax: (202) 623-7201 E-mail: [email protected] Web: http://www.imf.org Price: $18.00 per printed copy International Monetary Fund Washington, D.C. February 2016
Transcript of IMF Country Report No. 16/35 MOROCCO Country Report No. 16/35 MOROCCO 2015 ARTICLE IV CONSULTATION...

© 2016 International Monetary Fund
IMF Country Report No. 16/35
MOROCCO 2015 ARTICLE IV CONSULTATION—PRESS RELEASE; STAFF REPORT; AND STATEMENT BY THE EXECUTIVE DIRECTOR FOR MOROCCO
Under Article IV of the IMF’s Articles of Agreement, the IMF holds bilateral discussions
with members, usually every year. In the context of the 2015 Article IV consultation with
Morocco, the following documents have been released and are included in this package:
A Press Release summarizing the views of the Executive Board as expressed during its
December 14, 2015 consideration of the staff report that concluded the Article IV
consultation with Morocco.
The Staff Report prepared by a staff team of the IMF for the Executive Board’s
consideration on December, following discussions that ended on November 4, 2015,
with the officials of Morocco on economic developments and policies. Based on
information available at the time of these discussions, the staff report was completed
on November 30, 2015.
An Informational Annex prepared by the IMF staff.
A Statement by the Executive Director for Morocco.
The document listed below have been or will be separately released.
Selected Issues
The IMF’s transparency policy allows for the deletion of market-sensitive information and
premature disclosure of the authorities’ policy intentions in published staff reports and
other documents.
Copies of this report are available to the public from
International Monetary Fund Publication Services
PO Box 92780 Washington, D.C. 20090
Telephone: (202) 623-7430 Fax: (202) 623-7201
E-mail: [email protected] Web: http://www.imf.org
Price: $18.00 per printed copy
International Monetary Fund
Washington, D.C.
February 2016

Press Release No. 15/568 FOR IMMEDIATE RELEASE December 16, 2015
IMF Executive Board Concludes 2015 Article IV Consultation with Morocco
On December 14, 2015, the Executive Board of the International Monetary Fund (IMF) concluded the Article IV Consultation with Morocco.1
Morocco’s macroeconomic situation continues to improve. After declining to 2.4 percent in 2014, growth is expected to recover to 4.7 percent in 2015, thanks to a good agricultural season and improvements in construction activity. However, nonagricultural growth remains sluggish, including in sectors related to tourism, which are affected by geopolitical risks, and some traditional manufacturing, such as textiles. The unemployment rate picked up slightly to 10.1 percent in Q3 2015, and youth unemployment is particularly high, at 21.4 percent. Headline inflation (y-o-y) remained low at 1.4 percent in October, reflecting lower food prices.
External imbalances have fallen substantially. The current account deficit is expected to narrow to 1.5 percent of GDP in 2015 (against 5.7 percent in 2014). Strong phosphate and newly developed industries’ exports, and lower energy and food imports, as well as strong remittances, are more than offsetting the impact of declining tourism revenues. As a result and with continued robust FDI, international reserves are now close to 6.5 month of imports.
Fiscal consolidation has continued, and the authorities appear to be on track to meet the fiscal deficit objective of 4.3 percent of GDP in 2015, down from 4.9 percent in 2014. This reflects lower wage and subsidy spending (thanks to declining oil prices and the full implementation of energy subsidy reforms), which offset the decline in grant and tax revenues due to lower VAT on imported goods.
The financial sector remains well capitalized and profitable. Banking sector capital adequacy ratios stood at 13.8 percent in June 2015, well above the Basel III requirement. Bank profitability is stable, and while nonperforming loans have increased, they are adequately provisioned. Morocco’s medium-term prospects are favorable, with growth projected to get close to 5 percent by 2020, although risks remain, such as that of lower growth in the euro area or increased
1 Under Article IV of the IMF's Articles of Agreement, the IMF holds bilateral discussions with members, usually every year. A staff team visits the country, collects economic and financial information, and discusses with officials the country's economic developments and policies. On return to headquarters, the staff prepares a report, which forms the basis for discussion by the Executive Board.
International Monetary Fund 700 19th Street, NW Washington, D. C. 20431 USA

2
international oil prices. Stronger medium term growth will hinge on continued implementation of comprehensive reforms with regard to labor participation and labor market efficiency, access to finance, quality education, efficiency of public spending, and further improvements to the business environment. Finally, better healthcare coverage, continued poverty reduction, and lower regional and gender disparities will also be crucial to achieve a sustainable and more inclusive growth. Executive Board Assessment2 Executive Directors commended the authorities for their prudent macroeconomic management and the ongoing improvements to the policy framework which have helped yield positive outcomes, including strengthened fiscal and external buffers, a recovery of growth, and progress on unemployment and poverty reduction. The medium term outlook is favorable but remains vulnerable to fragile external conditions and geopolitical risks. Directors welcomed the authorities’ continued strong commitment to sound policies and encouraged them to move forward with reforms to further reduce vulnerabilities and promote stronger job creation and more inclusive growth. Directors recognized the progress made in fiscal consolidation. They encouraged the authorities to continue their efforts to gradually reduce the level of public debt over the medium term, while preserving fiscal space for pro-growth and social spending. In this context, Directors supported steps to further reduce wage and subsidy spending, while protecting the most vulnerable segments of the society; advance tax and pension reforms; and improve the efficiency of public spending. Directors welcomed the new organic budget law which will strengthen the fiscal framework by improving accountability and transparency. They advised the authorities to move carefully with the fiscal decentralization process. Directors endorsed the current monetary policy stance in the context of low inflation and slow credit growth. They encouraged the authorities to finalize the revision of the new central bank law, which will strengthen its independence and expand its supervisory powers and mandate. Directors supported the authorities’ intention to move gradually to a more flexible exchange rate regime and new monetary policy framework, noting that this will help preserve competitiveness and better insulate the economy against shocks. Continued efforts to promote financial market deepening will strengthen monetary policy transmission. Directors noted that the banking sector remains sound and resilient to adverse economic shocks but stressed that rising non-performing loans and credit concentration risks require continued
2 At the conclusion of the discussion, the Managing Director, as Chairman of the Board, summarizes the views of Executive Directors, and this summary is transmitted to the country's authorities. An explanation of any qualifiers used in summing up can be found here: http://www.imf.org/external/np/sec/m/qualifiers.htm.

3
monitoring. They welcomed Bank Al Maghrib’s (BAM) efforts to strengthen the financial regulatory and supervisory framework by implementing the new banking law and taking steps to implement the recent Financial Sector Assessment Program recommendations. Directors looked forward to further progress in improving cross border bank supervision, tightening rules for consolidated risk management, strengthening the bank resolution framework, and fostering financial inclusion. They supported BAM’s intention to strengthen its supervisory resources in view of its expanding responsibilities. Directors emphasized the importance of sustained implementation of structural reforms to promote higher and more inclusive growth. Continued efforts to improve the business environment, as well as reform of the labor market, and increased efficiency of public spending on education, will be critical to bolster growth, reduce unemployment, especially among the youth, and strengthen competitiveness. Directors welcomed the progress made to reduce government bureaucracy and the forthcoming national strategy to fight corruption, and looked forward to further progress on promoting good governance.

4
Morocco: Selected Economic Indicators, 2011–16 Projection
2011 2012 2013 2014 2015 2016 (Annual percentage change)
Output and Prices Real GDP 5.2 3.0 4.7 2.4 4.7 3.1
Real agriculture GDP 5.7 -9.1 17.9 -2.5 15.2 -1.8 Real non-agriculture GDP 5.2 4.7 3.0 3.1 3.3 3.8
Consumer prices (end of period) 0.9 2.6 0.4 1.6 1.6 1.3 Consumer prices (period average) 0.9 1.3 1.9 0.4 1.6 1.5
(In percent of GDP) Investment and Saving
Gross capital formation 35.8 35.0 34.7 33.7 33.3 34.5 Of which: Nongovernment 30.5 29.6 29.6 28.3 28.6 29.4
Gross national savings 27.9 25.5 26.8 28.0 31.8 33.8 Of which: Nongovernment 27.6 25.9 25.3 26.0 29.9 30.6
(In percent of GDP) Public Finances
Revenue 27.2 28.0 27.7 28.0 25.6 26.4 Expenditure 33.8 35.3 32.9 33.0 29.8 29.9 Budget balance -6.6 -7.3 -5.2 -4.9 -4.3 -3.5 Primary balance (excluding grants) -4.5 -4.9 -3.3 -3.7 -2.5 -2.2 Cyclically-adjusted primary balance (excl. grants) -4.6 -5.0 -2.8 -3.7 -2.2 -2.0 Total government debt 52.5 58.3 61.5 63.4 63.6 64.4
(Annual percentage change; unless otherwise indicated) Monetary Sector
Credit to the private sector 1/ 9.8 4.8 3.8 2.5 3.3 4.3Base money 5.7 -0.5 9.0 6.2 5.5 6.5Broad money 6.4 4.5 3.1 6.2 5.5 6.5Velocity of broad money 0.9 0.9 0.9 0.9 0.9 0.9Three-month treasury bill rate (period average, in percent) 3.4 3.4 3.4 2.5 ... ...
(In percent of GDP; unless otherwise indicated) External Sector
Exports of goods and services (in U.S. dollars, percentage change) 17.0 0.4 4.0 7.4 -10.4 5.9
Imports of goods and services (in U.S. dollars, percentage change) 23.4 2.2 4.3 1.0 -18.9 4.5 Merchandise trade balance -21.0 -22.3 -20.5 -18.7 -13.5 -13.5 Current account excluding official transfers -8.2 -9.8 -8.6 -7.4 -2.4 -2.0 Current account including official transfers -7.9 -9.5 -7.9 -5.7 -1.5 -0.7
Foreign direct investment 2.4 2.4 2.8 2.8 2.6 2.7 Total external debt 26.1 28.5 29.2 32.7 31.9 32.7 Gross reserves (in billions of U.S. dollars) 20.6 17.5 19.3 20.4 23.5 28.8
In months of next year imports of goods and services 5.3 4.3 4.7 6.1 6.7 7.6In percent of Fund reserve adequacy metric 111.2 88.1 91.0 94.2 110.9 128.6
Memorandum Items: Nominal GDP (in billions of U.S. dollars) 101.4 98.3 107.2 110.0 103.5 108.4 Unemployment rate (in percent) 8.9 9.0 9.2 9.9 … … Population (millions) 32.2 32.6 33.0 33.3 33.7 34.0 Population growth (in percent) 1.1 1.1 1.1 1.1 1.0Net imports of energy products (in billions of U.S. dollars) -11.2 -12.4 -12.2 -11.0 -6.6 -6.7
Local currency per U.S. dollar (period average) 8.1 8.6 8.4 8.4 ... ... Real effective exchange rate (annual average,
percentage change) 2/ -2.3 -2.0 1.8 0.1 0.0 ...
Sources: Moroccan authorities; and IMF staff estimates. 1/ Includes credit to public enterprises. 2/ For 2015, actual value as of August 2015

MOROCCO STAFF REPORT FOR THE 2015 ARTICLE IV CONSULTATION
KEY ISSUES Context. The macro-economic situation continues to improve. Growth is recovering and should reach 4.7 percent in 2015, but non-agricultural activity remains sluggish. Inflation remains low. The authorities appear to be on track to meet the 2015 public deficit target of 4.3 percent of GDP. The external position continues to improve, benefiting from lower oil prices, the current account deficit will narrow to about 1.5 percent of GDP in 2015 and international reserves will exceed 110 percent of the Fund’s Assessing Reserve Adequacy (ARA) metric. Poverty rates, unemployment and inequalities have declined, but much remains to be done to reduce structural unemployment, increase labor force participation rates, and secure higher and more inclusive growth. Reforms have slowed down somewhat, especially pension reform and the new central bank law. The 2015 FSAP assessed that banks are well capitalized and profitable, and benefit from stable funding.
Outlook and risks. Growth should strengthen gradually in the medium term. In 2016, growth will be affected by a base effect following the very good 2015 agricultural season, but a gradual recovery is expected in 2017. Growth is expected to get close to 5 percent by 2020. Headline inflation is expected to remain low at 1.5 percent in 2016 and to stabilize around 2 percent thereafter. The external position should continue to improve. While the medium-term outlook is favorable and risks have decreased, they remain substantial, particularly because of Morocco’s strong ties to the euro zone. Key risks are lower growth in advanced and emerging countries; an increase in world energy prices due to geopolitical tensions; and a surge in global financial market volatility.
Policy discussions. Recent policy action and a more favorable external environment have yielded macroeconomic improvements, but the reform momentum needs to be maintained in order to secure longer term stability and raise growth potential. The period ahead provides an opportunity to consolidate gains in macroeconomic stabilization and “aim higher and try harder” to reduce social and regional disparities, address youth unemployment, increase labor force participation, and achieve higher and more inclusive growth. The discussions focused on securing stronger buffers and raising potential growth while significantly reducing unemployment and inequalities, and in particular on: (i) maintaining an adequate policy stance; (ii) securing macro-financial sustainability; (iii) reinforcing monetary policy transmission; and, (iv) establishing a more growth-friendly and inclusive environment.
November 30, 2015

MOROCCO
2 INTERNATIONAL MONETARY FUND
Approved By Adnan Mazarei and Mark Flanagan
The team comprised Nicolas Blancher (head), Pilar Garcia-Martinez, Jean-Frédéric Noah, Dominique Fayad (all MCD),and Calixte Ahokpossi (SPR). Jianping Zhou (head of FSAP team, MCM) joined for the concluding meetings. The discussions took place in Rabat and Casablanca during October 21 to November 4, 2015. Mr. Auclair, Ms. Cruz, and Ms. Kebet (all MCD) assisted in the preparation of the report. The mission met with the Head of Government Mr. Benkirane, the Minister of Economy and Finance Mr. Boussaïd, the Minister of Education Mr. Rachid Belmokhtar Benabdellah, the Minister of Interior Mr. Mohamed Hassad, the Minister of Industry, Trade, Investment and e-Economy Mr. Elalamy, the Minister Delegate of General Affairs and Governance Mr. Louafa, the Minister Delegate of Civil Service and Modernization of Public Administration Mr. Moubdi, the Governor of the Central Bank Mr. Jouahri, and other senior officials and representatives of the private sector and civil society. Mr. Daïri (OED) participated in most meetings. Morocco has not introduced or intensified exchange restrictions, and has not introduced or modified multiple currency practices in line with Article VIII.
CONTENTS
RECENT DEVELOPMENTS, OUTLOOK, AND RISKS _____________________________________________ 4
A. Recent Developments ___________________________________________________________________________4
B. Outlook and Risks _______________________________________________________________________________6
POLICY DISCUSSIONS ___________________________________________________________________________ 9
A. Policy Stance ____________________________________________________________________________________9
B. Securing Macro-Financial Sustainability _______________________________________________________ 11
C. Reinforcing Monetary Policy Transmission ____________________________________________________ 14
D. More Growth-Friendly and Inclusive Environment ____________________________________________ 17
STAFF APPRAISAL ______________________________________________________________________________ 21

MOROCCO
INTERNATIONAL MONETARY FUND 3
BOXES
1. Implementation of Past Fund Advice __________________________________________________________ 10
2. Fiscal Multiplier in Morocco ___________________________________________________________________ 12
3. Transition Toward a More Flexible Exchange Rate and Monetary Policy Framework __________ 16
4. The Yield Curve in Morocco: Links with Macroeconomic Policies ______________________________ 17
FIGURES
1. Real and External Developments ________________________________________________________________7
2. Fiscal and Financial Market Developments ______________________________________________________8
3. Education and Unemployment ________________________________________________________________ 19
TABLES
1. Risk Assessment Matrix ________________________________________________________________________ 24
2. Selected Economic Indicators, 2012–20 _______________________________________________________ 25
3. Budgetary Central Government Finance, 2012–20 _____________________________________________ 26
4. Budgetary Central Government Finance, 2012–20 _____________________________________________ 27
5. Balance of Payments, 2012–20 _________________________________________________________________ 28
6. Monetary Survey, 2011–15 ____________________________________________________________________ 29
7. Financial Soundness Indicators, 2008–June 2015 ______________________________________________ 30
8. Capacity to Repay Indicators, 2014–20 ________________________________________________________ 31
9. Selected FSAP Recommendations _____________________________________________________________ 32
ANNEXES
I. Public Debt Sustainability Analysis _____________________________________________________________ 33
II. External Sector Assessment ____________________________________________________________________ 39

MOROCCO
4 INTERNATIONAL MONETARY FUND
RECENT DEVELOPMENTS, OUTLOOK, AND RISKS 1. A sound policy framework and prudent macroeconomic management have served Morocco well over the last few years, even though challenges remain. In response to shocks to external demand and terms of trade, the authorities undertook fiscal consolidation and important structural reforms, including subsidy reforms. These measures have helped reduce vulnerabilities, but challenges to growth, employment, and poverty reduction remain. The IMF is supporting the authorities’ program through a two-year precautionary and liquidity line (PLL) arrangement approved in July 2014, which provides insurance against external risks.
A. Recent Developments
2. Growth is recovering and should reach 4.7 percent in 2015, but non-agricultural activity remains sluggish. The 2015 agricultural season was particularly good, while construction activity showed signs of recovery. However, the European recovery is slower than expected, rising geopolitical risks in the region have affected tourism, and activity in several traditional sectors (such as the food or textile industries) is slower than expected. In light of these recent developments, staff’s growth projection for 2015 has been revised to 4.7 percent (against 4.9 percent at the time of the second review under the PLL arrangement). The current output level is estimated to be slightly below potential, and inflation remained low at 1.6 percent in September.
3. Poverty rates, unemployment and inequalities have declined, but much remains to be done to secure higher and more inclusive growth. Unemployment increased to 10.1 percent in the third quarter of 2015, and is still very high among the youth (21.4 percent) and in particular in urban areas (39.3 percent). Multidimensional poverty is above the average for oil-importer countries in the region.1 Continued efforts are needed to reduce structural unemployment, increase female labor force participation rates (which have been below 28 percent since 2006), reduce the gender gap, and address social and regional disparities.2 In particular, better healthcare and medical coverage, improved access to quality education (the average number of schooling years is about 6 years) and increased literacy rates (currently of about 65 percent) are crucial to achieve more inclusive growth and higher potential output.
4. While the fiscal deficit has declined in recent years and fiscal developments have been positive so far in 2015. In the past several years, external shocks have affected public finances, with the overall fiscal deficit rising to 7.3 percent of GDP in 2012, putting public debt on a rising path. The authorities responded to these developments with strong policy actions, including subsidy reforms, which brought back the overall fiscal deficit to 4.9 percent in 2014, although public debt continued to increase and reached 63.4 percent of GDP (against 58.3 percent in 2012). In 2015, there
1 See Oxford Poverty & Human Development Initiative: multidimensional poverty is a poverty index including access to living standards, nutrition, child mortality and education dimensions, weighted by the intensity of deprivation. 2 For further discussion of poverty and gender and social disparities in Morocco, see the staff report for the 2014 Article IV consultation.
MOROCCO
INTERNATIONAL MONETARY FUND 5
have been improvements, including a further reduction in subsidy spending, which was sufficient to offset the lower–than-projected tax revenues and grants. Overall, the fiscal outturn through September suggests that the authorities are on track to meet the projected annual deficit of 4.3 percent, corresponding to a primary balance that would stabilize public debt at a sustainable level of less than 64 percent of GDP (Annex I).
5. External stability has strengthened further. Staff analyses suggest that the exchange rate of the dirham is in line with fundamentals, reflecting improvements in the external position over the last two years (Annex II).3 The current account deficit narrowed further in 2015 and is projected to be about 1.5 percent of GDP (against 5.7 percent of GDP in 2014), as low oil and food prices and the good agricultural season reduced fuel and food import bills, while automobile exports and remittances remained robust. Capital inflows are strong and stable, and external debt is relatively low. International reserves have increased and represent about 110 percent of the Fund’s Assessing Reserve Adequacy (ARA) metric, and 154 percent of the metric adjusted for capital controls, at end-2015. Morocco’s net international investment position started to improve in 2015: after deteriorating from -50 to -67 percent of GDP between 2010 and 2014, it is projected to reach -64 percent of GDP at end-2015 and -56 percent of GDP over the medium term. Overall competitiveness has strengthened somewhat in recent years, with Morocco now being ranked at the median in the sample of 140 countries included in the Global Competiveness Report (GCR).4
6. Credit has remained subdued under stable policy rates and monetary conditions. Bank-Al-Maghrib (BAM) has kept its policy rate unchanged at 2.5 percent in recent months, taking into consideration mixed economic developments, a moderate increase in inflation, and an uncertain economic outlook. Banking liquidity has continued to improve due to increased foreign reserves and the reduced fiscal deficit (bank liquidity needs were estimated at 30.4 billion dirhams in August 2015, against 69.2 billion dirhams at end 2013). While bank lending grew at a modest rate of 1.1 percent in September 2015 (year-on-year), there is no evidence that bank credit supply is a significant constraint to credit growth, given the soundness of the banking system, continued slow non-agricultural growth, and lower imports. Lending rates declined but other lending conditions (including collateral requirements) remained tight, especially for corporations, in view of increased credit risks. Acknowledging that the current economic environment could be particularly difficult for very small, small and medium enterprises (VSMEs), BAM raised its support to VSME credit by increasing its range of eligible collaterals and through the VSME funding support program.5
7. Overall, the banking system is sound despite financial strains in parts of the corporate sector. In recent years, Morocco’s banking system has deepened, with total bank assets reaching 140 percent of GDP, and become more complex, including through a rapid expansion in Sub-Saharan Africa. In aggregate, the regulatory capital adequacy ratio stood at 13.8 percent as of end- 3 The dirham is pegged to a currency basket including the euro (60 percent) and the dollar (40 percent). 4 Morocco ranks favorably in terms of quality of institutions, infrastructures and macroeconomic environment, but lower in the areas of education, health and labor market efficiency. 5 Liquidity injections under this program increased from about 6 billion dirhams at the end of 2013 to about to 15 billion in October 2015

MOROCCO
6 INTERNATIONAL MONETARY FUND
2014, well above Basel III requirements, and bank profitability has been stable despite slow lending activity. However, the non-performing loan (NPL) ratio has been rising since 2012, due to weak economic activity and strains in parts of the corporate sector, reaching 7.5 percent in August 2015. The highest NPL ratios are observed in sectors most affected by weak growth in Europe, such as tourism (with a NPL ratio of 21 percent in the hotel and restaurant sector), as well as transport and communications, agriculture, trade, and construction. Many corporations face liquidity difficulties due to payment delays that affect their cash flow situation. A recent decree on public procurement will limit payment delays by public enterprises to 60 days starting in January 2016.
B. Outlook and Risks
8. Growth should strengthen gradually in the medium term. In 2016, growth will be affected by a base effect following the good 2015 agricultural season, but a gradual recovery is expected in 2017, supported by improving prospects in Europe and domestic confidence, and low oil prices. Growth is expected to get close to 5 percent by 2020, slightly lower than estimated previously. This revision reflects weaker global growth prospects due to lower capital stock growth and potential output in many developed and emerging economies,6 which could affect capital investment levels and productivity gains in Morocco. Staff and the authorities agreed that raising potential growth and reducing unemployment will require steadfast efforts in a range of reform areas, including human capital and labor participation, labor market efficiency, access to finance for very small, small and medium enterprises, and the broader business environment.7 Headline inflation is expected to remain low at 1.6 percent in 2015 and 1.5 percent in 2016, and to stabilize around 2 percent thereafter.
9. The external position is also expected to improve over the medium term. With oil prices projected to remain low and external demand to strengthen, solid export performance (especially in new and fast-growing industries such as automobiles) should help reduce the current account deficit further to 0.7 percent of GDP in 2016, and stabilize it around 1.3 percent of GDP over the medium term. FDI inflows should remain strong, helping raise the reserves position above 150 percent of the ARA metric over the medium term.
10. Risks to the outlook remain tilted to the downside, but have decreased somewhat. Staff and the authorities agreed that external risks include lower-than-expected growth in Europe, volatility in global financial markets, and geopolitical risks resulting in oil price volatility. Weak growth in Europe, in particular, would affect export revenues, and FDI and remittance inflows. Higher volatility in global financial markets would affect global growth and Morocco’s growth and borrowing costs. Given Morocco’s high dependence on oil imports, increases in oil prices may also reverse some of the recent improvements in the current account. However, relative to 2014, oil prices are now much lower and Europe’s growth outlook has improved. As such, the impact of the
6 See World Economic Outlook, April 2015. 7 See The Global Competitiveness Report, 2015-2016, World Economic Forum.

MOROCCO
INTERNATIONAL MONETARY FUND 7
above shocks would also be less severe than in 2014. On the domestic front, there is a risk of lower appetite for reforms as the 2016 parliamentary elections loom.
Figure 1. Morocco: Real and External Developments Non-agricultural growth has been sluggish in 2015, while the euro area recovery remains uncertain.
Domestic demand and net exports have contributed positively while investment remains subdued.
Inflation has remained low despite increases in food prices. Exports have grown faster than imports, in part due to the recent decline in oil prices, improving the trade balance...
...and the current account, while FDI inflows remained strong. This has helped support reserves recently.
Sources: Moroccan authorities; and IMF staff estimates.
-6
-4
-2
0
2
4
6
8
10
12
2008
2009
2010
2011
2012
2013
2014
2015
Morocco and Euro Area Growth(Percent change, y-o-y)
Morocco
Euro AreaOverall
proj.Overall
Non-agricultural
Morocco
-8
-4
0
4
8
12
16
2008
2009
2010
2011
2012
2013
2014
Net Exports Investment
Public Consumption Private Consumption
Contributions to GDP Growth (Percent)
-25
-20
-15
-10
-5
0
0
10
20
30
40
50
60
2008
2009
2010
2011
2012
2013
2014
2015
Trade Balance(Percent of GDP)
Exports Imports Trade Balance (RHS)
proj.
-4
-3
-2
-1
0
1
2
3
4
5
6
Oct
-11
Dec
-11
Feb-
12Ap
r-12
Jun-
12Au
g-12
Oct
-12
Dec
-12
Feb-
13Ap
r-13
Jun-
13Au
g-13
Oct
-13
Dec
-13
Feb-
14Ap
r-14
Jun-
14Au
g-14
Oct
-14
Dec
-14
Feb-
15Ap
r-15
Jun-
15Au
g-15
CPI General Index
CPI Core
CPI Food
Inflation (Percentage change, y-o-y)
12.5
14.5
16.5
18.5
20.5
22.5
24.5
Jan-
13
Mar
-13
May
-13
Jul-1
3
Sep-
13
Nov
-13
Jan-
14
Mar
-14
May
-14
Jul-1
4
Sep-
14
Nov
-14
Jan-
15
Mar
-15
May
-15
Jul-1
5
Gross reserves (in billions of euros)
NIR at program rates
-12
-10
-8
-6
-4
-2
0
2
4
2008
2009
2010
2011
2012
2013
2014
2015
Current Account
FDI
(Percent of GDP)
proj.

MOROCCO
8 INTERNATIONAL MONETARY FUND
Figure 2. Morocco: Fiscal and Financial Market Developments Fiscal consolidation continues as planned... ...and subsidy expenditure decreased in percent of GDP.
Revenue remained broadly resilient although it has been slightly decreasing.
Credit growth has remained low.
The loan-to-deposit ratio has moderately declined. Spreads remain relatively low.
Sources: Moroccan authorities; and IMF staff estimates.
0
5
10
15
20
25
30
35
40
2008
2009
2010
2011
2012
2013
2014
2015
Q2
Investment Subsidies
G&S & Other Wages
Government Expenditure(Percent of GDP)
Est.
0
5
10
15
20
25
30
35
40
2008
2009
2010
2011
2012
2013
2014
2015
Q2
Grants Other
Income Tax G&S Tax
Government Revenue(Percent of GDP)
Est.
-4
-2
0
2
4
6
8
10
Sep-
12
Nov
-12
Jan-
13
Mar
-13
May
-13
Jul-1
3
Sep-
13
Nov
-13
Jan-
14
Mar
-14
May
-14
Jul-1
4
Sep-
14
Nov
-14
Jan-
15
Mar
-15
May
-15
Jul-1
5
Private Financial InstitutionsPublic SectorHouseholdsNon-financial Corporates
Contribution to Credit Growth (Percent change, y-o-y)
50
100
150
200
250
300
350
Sep-
10D
ec-1
0M
ar-1
1Ju
n-11
Sep-
11D
ec-1
1M
ar-1
2Ju
n-12
Sep-
12D
ec-1
2M
ar-1
3Ju
n-13
Sep-
13D
ec-1
3M
ar-1
4Ju
n-14
Sep-
14D
ec-1
4M
ar-1
5Ju
n-15
Sep-
15
Markit 5-yr MAR Sov. CDS Spread
MAR Sovereign Bond Spread80
85
90
95
100
105
110
0
10
20
30
40
Sep-
12
Nov
-12
Jan-
13
Mar
-13
May
-13
Jul-1
3
Sep-
13
Nov
-13
Jan-
14
Mar
-14
May
-14
Jul-1
4
Sep-
14
Nov
-14
Jan-
15
Mar
-15
May
-15
Jul-1
5
(Percentage change, y-o-y)
Private credit growth Deposits growth
Loan-to-deposit ratio (RHS,)

MOROCCO
INTERNATIONAL MONETARY FUND 9
POLICY DISCUSSIONS 11. Recent policy action and a more favorable external environment have yielded macroeconomic improvements, but the reform momentum needs to be maintained in order to secure longer term stability and raise growth potential (Box 1). Despite positive developments in certain sectors (industry, energy, and telecommunication), there are still mixed signals about non-agricultural growth and risks remain, in particular regarding future external demand. Securing stronger buffers and raising potential growth while significantly reducing unemployment and inequalities will require:
Maintaining an adequate policy stance;
Securing macro-financial sustainability;
Reinforcing monetary transmission;
Establishing a more growth-friendly and inclusive environment.
A. Policy Stance
12. The authorities remain committed to their fiscal deficit objective of 4.3 percent of GDP in 2015. As noted, a revenue shortfall of about 0.7 percent of GDP is expected for 2015, due mainly to lower-than-anticipated grants from Gulf countries. However, the impact would be offset by the significant under-spending expected due to continued wage bill control and reductions in subsidies and transfers. Therefore, the authorities appear to be on track to meet 2015 deficit target. Staff encouraged the authorities to engage with donors to secure the expected disbursements, and the authorities were confident that they could achieve this before the end of 2015.
13. The proposed 2016 budget continues the consolidation effort of previous years, based on strong revenue performance and modest growth in current spending. The fiscal stance, as measured by the structural fiscal deficit, will remain broadly neutral. The overall deficit is projected to decline to 3.5 percent of GDP, in line with projections at the time of the second review of the PLL arrangement. This would reflect a rapid growth in tax revenues (by more than 8 percent, or 0.6 percent of GDP), due mostly to the introduction of new corporate tax brackets (while new VAT measures would induce a net loss of 0.3 percent of GDP). At the same time, current spending would increase modestly (3.7 percent), as the authorities plan to further reduce subsidies while maintaining a relatively rapid growth in public investment spending. Staff supported the 2016 budget objectives, while noting that, like in 2015, the reliance on grant financing may require contingent measures to control public expenditures. In this regard, the authorities noted that they had already identified the sources of grant revenues for 2016 budget which should mitigate this risk.

MOROCCO
10 INTERNATIONAL MONETARY FUND
Box 1. Morocco: Implementation of Past Fund Advice
Policy implementation has been broadly in line with past Fund advice:
Fiscal policy. The authorities continued subsidy reform. The promulgation of a revised organic budget law was a critical step in improving the fiscal framework; it will start being implemented with the 2016 budget. Pension reform is now expected to be implemented in early 2017.
Monetary policy. Inflation remains low and inflation expectations are well-anchored. BAM has maintained its main policy interest rates unchanged at 2.5 percent in 2015. Preparations for a more flexible exchange rate have progressed, including with technical assistance from the Fund.
Financial policies. Solid progress has been made in upgrading the financial policy framework, including moving to Basel III norms and implementing the new banking law. Most regulations to implement the new banking law are expected to be in place by end-2015. The new central bank law has not yet been adopted.
Structural reforms. Morocco has made progress in Doing Business indicators, but much remains to be done to further improve the business climate, competition, governance and transparency. Strengthening further the functioning of the job market and the quality of education will be key in order to increase competitiveness, growth, and employment.
14. Given the existence of capital controls, the central bank has some room for maneuver to conduct monetary policy under the exchange rate peg. In the second half of 2014, BAM lowered its policy rate (unchanged since March 2012) by 0.5 percent to 2.5 percent, and has left it unchanged since then. In recent months, as noted, BAM has continued to provide liquidity and foster greater (V)SME access to credit, but such liquidity injections have been reduced overall, in line with decreasing liquidity pressures (which, on current trends, may disappear in 2016). Going forward, staff noted that in the baseline scenario, where the output gap closes only gradually, the current monetary policy stance would remain appropriate. However, in addition to the large credit support already provided by BAM, further monetary easing may be needed should non-agricultural growth stall and reserves continue to improve, and as long as inflation expectations remain well anchored. The authorities agreed but noted that BAM’s main objective is inflation, which had recently risen to close to 2 percent, and that credit growth had not increased noticeably as a result of the last two reductions in policy rates.

MOROCCO
INTERNATIONAL MONETARY FUND 11
B. Securing Macro-Financial Sustainability
Public Finances
15. While sustainable, Morocco’s public debt should be placed firmly on a downward path and reduced to at most 60 percent of GDP over the medium term. Public debt rose from 47 percent of GDP in 2009 to 63.6 percent of GDP by end 2015, and is expected to peak at 64.4 percent of GDP in 2016. The debt sustainability analysis (DSA) shows that debt remains sustainable and robust to various shocks (Annex II), as the primary fiscal balance is projected to gradually turn positive in the medium term. However, Morocco’s public debt level is relatively high for an emerging market, and generates significant public and external financing needs. Staff and the authorities agreed that gradually reducing public debt to at most 60 percent of GDP by 2020 would allow more fiscal space. Based on analyses of the fiscal multiplier in Morocco (Box 2), staff noted that this would not significantly weaken growth prospects.
16. The above public debt path will require bringing the fiscal deficit down gradually to about 2 percent of GDP by 2020. Following important reforms to rein in public spending in recent years, consolidation going forward would have to rely more on structural tax measures, including because grant revenues are expected to decline after 2017. Specifically:
Tax reforms. In line with recommendations from the 2013 national tax conference, the authorities have initiated reforms to make the tax system more equitable and better able to support competitiveness, as reflected in the 2016 budget proposal. Such reforms include removing tax exemptions on large agricultural firms, simplifying the VAT regime, gradually introducing progressivity in corporate taxation, and better enforcing tax payments from self-employed and liberal professions. Staff supported these reforms, and encouraged the authorities to pursue them expeditiously, as they could yield about 1.5–2 percent of GDP of additional public revenues over the medium term.
Pension reform. Implementing the proposed parametric reform, as planned under the medium term fiscal projections, remains urgent in order to extend the sustainability of the pension system. Staff stressed the urgency of implementing this reform, since the gap between contributions and benefits will continue to widen in the near term and, absent reform, could
0
10
20
30
40
50
60
70
80
90
100
EME Average
EME MENAP Average
General Government Gross Debt for Emerging Marketand Middle Income Countries 1/
1/ General government gross debt except when not available.

MOROCCO
12 INTERNATIONAL MONETARY FUND
exhaust pension reserves by 2022. The authorities reiterated their strong commitment to this reform, and expect that it will be approved soon and implemented at the beginning of 2017.8
Subsidies reforms. Subsidies on all liquid petroleum products (diesel, gasoline, fuel) have now been eliminated, and the authorities plans to gradually reduce subsidies on food beginning in 2016. The timing of butane subsidies reduction is still under discussion. Staff welcomed these plans while stressing the need to protect the most vulnerable populations from their impact. The authorities agreed and noted that the reduction in fuel subsidies has been accompanied by an expansion of social programs in health and education, and the introduction of a number of mitigating programs.
Box 2. Fiscal Multiplier in Morocco1
Morocco’s strong policy action on wage bill containment and subsidies reforms contributed to reduce the overall fiscal deficit from a peak of 7.3 percent in 2012 to 4.9 percent of GDP in 2014. This work assesses the impact of such a fiscal deficit reduction on aggregate demand, looking at the effects of government consumption on the economic activity.
Methodology
We estimated the size of fiscal multiplier for Morocco and explored factors explaining their magnitude. Using the Ilzetzki et al. (2012) empirical approach based on quarterly data and the Blanchard and Perotti (2002) structural identification methodology, we estimate a SVAR on government consumption, the GDP, the trade balance and the reel effective exchange rate. We then use the SVAR impulse functions to assess the size of fiscal multipliers (the change in the real GDP caused by one unit increase in the government consumption). We mostly focus on the impact multiplier (i.e., the change in the GDP at the moment the impulse to the government consumption occurs) and the cumulative multiplier (the change in the GDP over the period the impulse to government consumption vanishes).
Main conclusions
Fiscal multipliers for Morocco are relatively small: the impact multiplier varies between 0.095 and 0.3, and the cumulative multiplier is estimated to be around 0.6.
The SVAR suggests that a government consumption shock would worsen the trade balance, lead to real appreciation, and raise output. However, while the impacts on the trade balance and real effective exchange rate are statistically significant, the impact on real GDP appears limited.
The magnitude of the fiscal multipliers could be affected by several factors, including the degree of exchange rate flexibility, the openness of the economy, the monetary policy stance, and the public debt level.
Household behaviors are critical in determining the size of fiscal multipliers. Specifically, a high propensity to consume and import foreign goods dampens the impact of a government spending shock on real GDP.
Overall, the analysis tends to suggest that well-designed fiscal consolidation (i.e., tilted to public consumption) would reduce public debt with limited contractionary effect on growth.
1 See 2015 Selected Issues Paper on “Fiscal Multiplier in Morocco.”
8 For fuller discussions of the pension reform, see the staff reports for the 2012 and 2014 Article IV consultations.

MOROCCO
INTERNATIONAL MONETARY FUND 13
17. Ongoing institutional reforms remain critical to stronger fiscal outcomes, and the decentralization initiative will need to be designed and implemented carefully. The new organic budget law (OBL) will strengthen Morocco’s fiscal framework starting in 2016, since most of its provisions enter into force in January 2016 (especially with regard to fiscal performance management and transparency, and parliamentary approval process), and the remaining ones are gradually introduced by 2020. The authorities confirmed that the OBL was being implemented according to plan. In parallel, they are pursuing a major decentralization initiative that will lead to transferring a range of political and administrative responsibilities to the regional level. Key objectives are to increase efficiency in the allocation of public resources, improve governance, and facilitate economic growth and poverty reduction. The proposed 2016 budget increases the proportion of income tax revenues allocated to regions from 1 to 2 percent. Staff discussed the authorities’ intentions and noted that while such reforms may yield benefits, they also entail significant risks, including from a fiscal standpoint.9 Staff also noted that Morocco could benefit from cross-country experience in terms of key requirements, such as for coordination between different governmental levels, tax collection, spending and debt controls, and local implementation capacity and accountability. The authorities were well aware of the risks associated with fiscal decentralization, and welcomed staff suggestion to provide Fund TA support in the above areas.
Financial Stability
18. The FSAP assessed that risks to financial stability are limited, although rising NPL levels and concentration risks need to be monitored. Banks are well capitalized and profitable, and benefit from stable funding sources. FSAP stress tests show that aggregate capitalization levels would remain adequate under adverse scenarios, and that, at this juncture, spillover risks related to Moroccan banks’ expansion into SSA remain marginal.10 However, as noted, NPLs have been rising (although NPL provisioning levels, averaging 66 percent, are high), and concentration risks arising from single or group exposures are significant. Staff emphasized some of the key FSAP recommendations regarding the need to continue monitoring bank asset quality closely, including through periodic comprehensive asset quality reviews for systemic banks, a review of national loan classification and provisioning rules, and an impact study of International Financial Reporting Standards (IFRS) implementation (Table 8). The authorities noted that they were in the process of gradually reducing overall levels of concentration risk in the system, broadening the coverage of their NPL “watchlists,” and increasing related bank provisioning requirements.
19. Bank supervision is effective and has kept improving, but will require more resources going forward. A new banking law was introduced in 2014, further implementing Basel III, and enhancing systemic risk surveillance. While a lot of progress has been made, there is still room for improvement in the following areas:
9 See “Macro Policy Lessons for a Sound Design of Fiscal Decentralization,” IMF, July 2009. 10 See 2014 Selected Issues Paper: “The Sub-Saharan Expansion of Moroccan Banks: Opportunities and Challenges for Cross-Border Oversight” (FO/DIS/14/198).

MOROCCO
14 INTERNATIONAL MONETARY FUND
Central bank law. The draft law, which is being discussed in the government and has yet to be sent to Parliament for adoption, would further strengthen BAM’s independence and transparency, and extend its supervisory powers, in line with best international practices. Staff encouraged the authorities to move expeditiously, and the authorities indicated that the draft law would likely be submitted to Parliament in early 2016.
Supervisory resources. BAM needs additional supervisory resources in order to effectively handle its existing and new responsibilities, especially given the increasing complexity and cross border expansion of Morocco’s banking system. The authorities endorsed the FSAP recommendation and noted that they already have plans to reinforce supervisory resources.
Macroprudential policy framework. The 2014 banking law set up a macroprudential policy committee, the Systemic Risk Surveillance and Coordination Committee (CCSRS) in which BAM plays a leading role. However, the powers, instruments and voting arrangements of the CCSRS need to be clarified. In addition, a counter-cyclical buffer should be implemented, and the current toolkit should include targeted sectoral instruments such as provisioning requirements or loss-given-default floors for risky and nonperforming cross-border loans. The authorities agreed with these recommendations and have started implementing them.
Financial crisis management and safety net. Significant progress has been made in improving the institutional framework, but the new banking resolution regime remains untested and its legal framework needs to be strengthened, including by designating a resolution authority, incorporating the “least-cost” principle, introducing bail-in powers, and clarifying the hierarchy of creditors’ claims. The emergency liquidity assistance (ELA) framework should also be enhanced. The authorities intend to seek technical assistance from the IMF and World Bank in these areas.
C. Reinforcing Monetary Policy Transmission
20. The authorities reiterated their intention to move to a new exchange rate and monetary policy regime. A more flexible regime would help absorb external shocks and preserve competitiveness. The improved external and reserves position, together with the insurance provided by the PLL arrangement, would allow Morocco to move from a position of strength and to ensure a gradual transition. While not without risks in a global context of volatile financial conditions, staff and the authorities agreed that the current situation was appropriate for a move (Box 3):
The key requirements are in place: economic and external diversification has progressed and Morocco could benefit from a more independent monetary policy (i.e., less aimed at targeting the exchange rate); fiscal, monetary and financial policy frameworks have been strengthened (including through recent subsidy reforms); and the dirham’s alignment with fundamentals reduces the risk of a large adjustment. The Fund has contributed to the preparations through intensive technical support, including for a move to an inflation targeting regime.
MOROCCO
INTERNATIONAL MONETARY FUND 15
The economy is seen as resilient to potential exchange rate volatility. The FSAP analyses indicate that the direct effect of a dirham depreciation would be positive as banks have a positive FX open position. The indirect effects on credit quality are also likely to be limited because the share of foreign currency loans in total loans is below 4 percent (and some foreign currency borrowers hedge their foreign currency exposures).
Options for a gradual transition. In staff’s view, the authorities could choose among several options, such as a horizontal band to be widened gradually (possibly in several steps); or a flexible band (moving up or down depending for example on the authorities’ required balance in supply and demand in the FX market). The latter option is more robust to different scenarios as it allows movements in both directions, depending in particular on market pressures. Staff will continue to support the authorities in implementing their preferred option. Staff also recommended decoupling the exchange rate transition from the removal of remaining restrictions on capital outflows by residents, which would add unnecessary uncertainty.
21. As part of the transition to a new monetary regime, continued financial market deepening will help further improve monetary policy transmission. Under a more flexible exchange rate regime, the monetary policy transmission mechanisms would play a key role in supporting the authorities’ objectives of price and macro-economic stability. Reforms in the last decade led to enhanced independence and operational capacity of the central bank, stronger financial intermediation, and more developed domestic Treasury securities market.11 This also allowed to improve monetary policy transmission, including by helping better align the policy rate and the money market rate (Box 4). Going forward, ongoing deepening of domestic capital markets will help bring about further improvements in monetary transmission.
11 See “Rethinking Financial Deepening: Stability and Growth in Emerging Markets,” IMF Staff Discussion Note SDN/15/08.

MOROCCO
16 INTERNATIONAL MONETARY FUND
Box 3. Morocco: Transition Toward a More Flexible Exchange Rate and Monetary Policy Framework
This Box summarizes the main steps already taken by the authorities and the preparatory work contributed by the Fund to help the authorities finalize their plans on the next steps in the transition toward greater exchange rate flexibility.
Morocco meets the necessary preconditions
Supportive macroeconomic policies. Fiscal, monetary and financial frameworks have been strengthened (such as, recently, through subsidy reform) and would be supportive of a move toward more flexibility.
Foreign exchange market. As the dirham is pegged to a EUR/USD basket rather than to a single currency, changes in bilateral rates have already incentivized banks and corporations to put in place systems to manage exchange risk. An active foreign exchange market has already developed as result.
Operational exchange rate management. Options in designing a policy framework for foreign exchange market interventions and operational management were extensively discussed during past Fund technical assistance.
Operational framework for monetary policy. An alternative anchor to the exchange rate is in place to some extent: BAM’s use of interest rate instruments and its focus on inflation have already led economic agents to focus on inflation rather than the exchange rate. The Fund has provided technical assistance to help BAM in strengthening its macro modeling capacity; building a new forecasting and policy analysis system; and using the models for macroeconomic projections, policy advice, and communications with the public and financial markets.
The move is not without risks, but risks appear contained and manageable
Pass-through. The potential pass-through of exchange rate movements to consumer prices is expected to be relatively low on average. Staff estimated at end 2013 that such pass-through elasticity was about 0.25 in the short term and 0.18 in the long term.
Banks. The direct effect of a 30 percent dirham depreciation on bank balance sheets would be positive because banks have more FX assets than liabilities. The indirect effects on credit quality are also likely to be limited because the share of foreign currency loans in total loans in the economy is below 4 percent (and foreign currency borrowers may hedge their FX exposures).
Public debt: Public debt is sustainable and its foreign currency denominated share is limited (and actively managed in terms of currency and interest rate structure), and therefore it does not constitute a major source of risks.
Capital outflows: Greater exchange rate flexibility is unlikely to lead to large-scale capital outflows due to the existence of capital controls limiting the ability of residents to convert dirham balances into foreign currency or to move funds offshore.

MOROCCO
INTERNATIONAL MONETARY FUND 17
Box 4. The Yield Curve in Morocco: Links with Macroeconomic Policies1
The monetary policy framework and fiscal policy actions in Morocco have evolved over time and their impact on the economy is transmitted in particular through the yield curve. This work documents such dynamics in Morocco and draw relevant policy implications.
We analyzed the relation between macroeconomic policies and the yield curve in Morocco. Changes in the monetary policy framework and reforms of the government security market in the mid-2000s have made the yield curve more responsive to macroeconomic policies. Using a Nelson-Siegel model, we derived the factors that characterize the yield curve. We then used a vector auto-regression (VAR) model to explore the link between the factors of the yield curve and different variables of macroeconomic policy. Main conclusions and policy lessons:
Improvements in the monetary policy and fiscal/debt management frameworks have help improved the functioning of the government securities market, as demonstrated by the tighter range of interest rates at short and long maturities.
The VAR estimation suggests that policy transmission channels work properly. Monetary policy autonomy has been enhanced by the improved credibility of the central bank.
Improvements in the fiscal position result in improvements in the financial sector, lower interest rates and higher growth, albeit with a delay.
Financial deepening would improve monetary policy transmission.
Overall, the monetary policy framework should keep improving so as to reinforce the credibility of the central bank, particularly as Morocco contemplates a move to a flexible exchange rate regime.
1 See “Dynamics of the Yield Curve in Morocco: Links with Macroeconomic Variables,” by Ahokpossi, Garcia-Martinez, and Kemoe, forthcoming IMF Working Paper.
D. More Growth-Friendly and Inclusive Environment
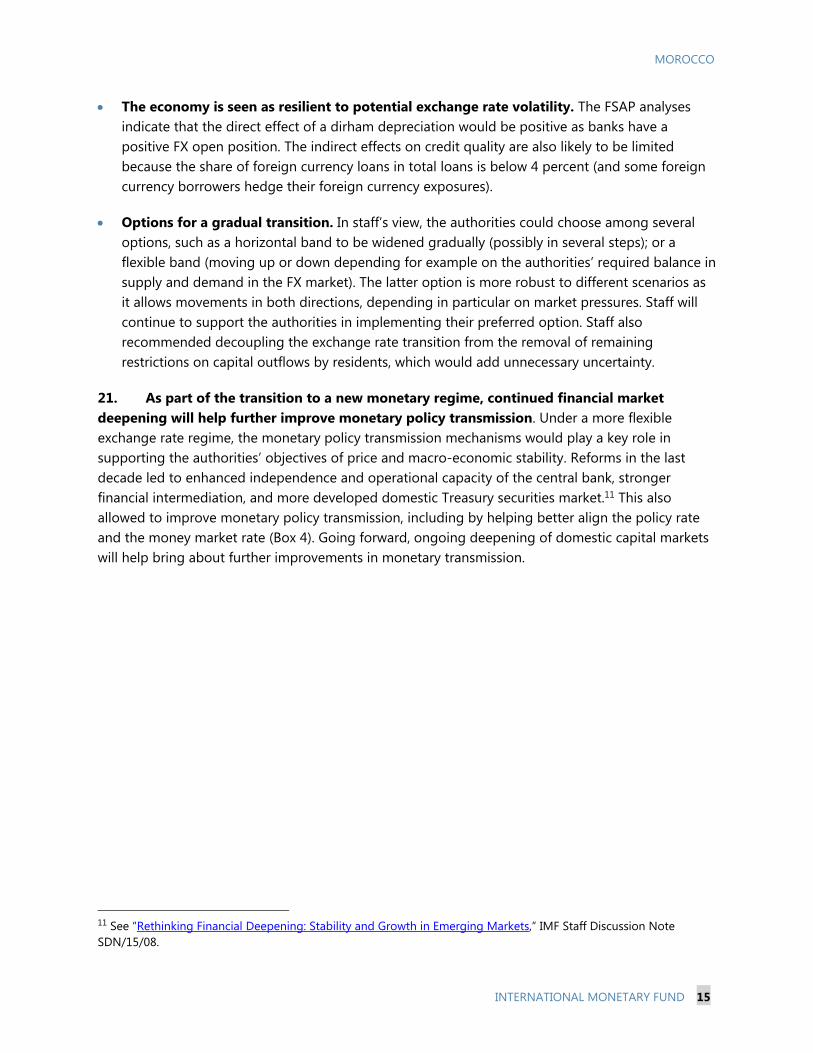
22. High youth unemployment results in part from shortcomings in the quality of education, and more efficient public spending could help reach better outcomes. Increases in public spending on education have been substantial over the last decade. However, the quality of education (as measured by students’ scores at international tests) is lagging behind many emerging countries, and skills mismatches are widely recognized as a key factor behind the large level of unemployment.12 Moroccan students’ results are lower than in other countries spending equivalent amount of public resources in education, raising an efficiency issue.13 The authorities shared staff’s assessment that large efficiency gains in public spending can be achieved and help reduce this gap significantly. Staff highlighted in particular the following priorities:
12 IBRD (2014), Revue des Dépenses Publiques, Tome II: Secteur de l’Education ; AfDB (2014), Diagnostic de Croissance du Maroc; Sutherland, D., Price, R., and Gonand, F. (2009), Improving Public Spending Efficiency in Primary and Secondary Education, OECD. 13 See 2015 Selected Issues Paper on “Efficiency of Public Spending on Education in Morocco.”

MOROCCO
18 INTERNATIONAL MONETARY FUND
Institutional quality and governance: By better defining responsibilities between the central government and sub-national authorities, decentralization reforms may help reduce the inefficiency of public spending. The authorities should manage financial and human resources, and strengthen the allocation of public spending in accordance with the differing educational needs across regions. In this respect, transfers of competences to local authorities should be supported by proper incentive systems.
Budget management: Increasing managerial autonomy in budget implementation would also improve the adequacy of resources allocation through more flexible job status, wage-setting process, budget allocation and teaching methods. At the school level, it would enhance decision-making autonomy and assessment policies concerning student performance, and allow for benchmarking between schools.
MOROCCO
INTERNATIONAL MONETARY FUND 19
Figure 3. Morocco: Education and Unemployment
Youth unemployment is elevated…. ...and graduate unemployment has remained above 16 percent in the pasted decade.
Skills mismatches are widely recognized as an impediment to youth employability.
School attainment has improved but remains below regional average and other developing regions.
Public spending in education is substantial and is amongthe highest compared to other countries.
The composition of public spending has recently shifted towards education despite lower spending to GDP ratio.
0
5
10
15
20
25
30
2006
T1
2006
T3
2007
T1
2007
T3
2008
T1
2008
T3
2009
T1
2009
T3
2010
T1
2010
T3
2011
T1
2011
T3
2012
T1
2012
T3
2013
T1
2013
T3
2014
T1
2014
T3
Urban Unemployment by Diploma
Ensemble Sans diplômeNiveau moyen Niveau supérieur
Sources: HCP; Moroccan authorities; and IMF staff estimates.
0
5
10
15
20
25
Asia
SSA
Morocco
LAC
CCA
MENAPOE
MENAPOI
1991 2000 2012
Source: ILO, Key Indicators of the Labor Market.
Youth Unemployment Rate (population 15-24)
Religion(2118 over)
Law, Econom
ics and Social Sc(102560 over)
Literature and Hum
anities(89800 over)
Sciences(40462 over)
Sciences and Technology(11194 under)
Medicine and Pharm
acy(14 over)
Dental M
edicine(406 under)
Engineering(11490 under)
Business and Managem
ent(5233 under)
Technology(8207 under)
Education Science(520 under)
Translation(283 under)
Vocational Studies
(7125 under)
-120%-100%-80%-60%-40%-20%
0%20%40%60%80%
100%120%140%
Under/Over Enrollment by Field of Study, 2013 (in percentage of seat capacities; over/under enrollment in brackets)
Source: Ministry of Higher Education
0
2
4
6
8
10
12
Morocco
SSA
MEN
APOI
All Regions
Asia
MEN
APOE
LAC
CCA
2000-5 2010
Source: Barro-Lee Dataset.
Average Years of Schooling (population age 15+)
Morocco5.0
0
1
2
3
4
5
6
7
8
Primay and Secondary Education Spending Percent of GDP, 2010-14
Sources: UNESCO; and IMF staff estimates.
15
20
25
30
35
40
0
5
10
15
20
25
30
Education Spending Share of Total Government Expenditure
Primary Secondary Tertiary/other Government spending share of GDP (RHS)
Sources: UNESCO; authorities' data; and IMF staff estimates.Note: Education data for 2010 and 2011 inferred based on the trend.

MOROCCO
20 INTERNATIONAL MONETARY FUND
Figure 3. Education and Unemployment (concluded) However, Moroccan students’ scores in sciences and mathematics are below comparable countries.
Education spending per student is relatively low...
…but potential efficiency gains are important. Quality of education can improve through better government spending management…
…by improving governance and reducing corruption… …and allocating more resources to teachers’ training.
200
250
300
350
400
450
500
550
600
650
Gha
naM
oroc
coO
man
Indo
nesi
aSy
rian
Arab
Rep
ublic
Wes
t Ban
k an
d G
aza
Qat
arSa
udi A
rabi
aM
aced
onia
, FYR
Geo
rgia
Jord
anLe
bano
nBa
hrai
nTu
nisi
aM
alay
sia
Chile
Thai
land Ira
nA
rmen
iaU
AERo
man
iaTu
rkey
Nor
way
Kaza
khst
anU
krai
neSw
eden
Italy
New
Zea
land
Lith
uani
aA
ustr
alia
Hun
gary
Isra
elU
nite
d St
ates
Uni
ted
King
dom
Slov
enia
Finl
and
Russ
ian
Fede
ratio
nH
ong
Kong
SA
RJa
pan
Kore
a, R
ep.
Sing
apor
e
Mean 8th Grade TIMSS Score in Math and Science, 2011
Sources: 2011 TIMSS.
Morocco1,745
0
5000
10000
15000
20000
25000
Average Spending on Primary and Secondary Education per student, 2010-14
(constant PPP)
Sources: UNESCO; and IMF staff estimates.
200
250
300
350
400
450
500
550
600
Sout
h Af
rica
Gha
naEl
Sal
vado
rPh
ilipp
ines
Mor
occo
Colo
mbi
aIn
done
sia
Chile
Tuni
sia
Geo
rgia
Iran
Mon
golia
Jord
anTh
aila
ndM
alay
sia
Bulg
aria
Ukr
aine
Isra
elLi
thua
nia
Latv
iaSl
ovak
Rep
ublic
Aust
ralia
Slov
enia
Czec
h Re
publ
icH
unga
ryEs
toni
aJa
pan
Kore
a
Average Actual and Predicted TIMSS Scores, 2003-11
Inefficiency termPredicted scoreActual score
Sources: IMF staff estimates.
Gap attributed to inefficiency
Morocco3.74
0
1
2
3
4
5
6
7
Government Efficiency, 2015
Sources: 2015 World Economic Forum Global Competitiveness Index.
Morocco3.82
0
1
2
3
4
5
6
7
Ethics and Corruption, 2015
Sources: 2015 World Economic Forum Global Competitiveness Index.
0102030405060708090
100
Mor
occo
Gha
naSy
rian
Arab
Rep
ublic
Finl
and
Hon
dura
sN
orw
ayTh
aila
ndM
alay
sia
Aust
ralia
Leba
non
Hon
g Ko
ng S
ARW
est B
ank
and
Gaz
aU
nite
d St
ates
Sing
apor
eSo
uth
Afr
ica
New
Zea
land Ira
nSw
eden
Indo
nesi
aJo
rdan
Japa
nQ
atar
Mac
edon
ia, F
YRSa
udi A
rabi
aU
AEBa
hrai
nIs
rael
Ukr
aine
Bots
wan
aTu
nisi
aSl
oven
iaLi
thua
nia
Hun
gary
Russ
ian
Fede
ratio
nG
eorg
iaAr
men
iaKo
rea,
Rep
.Ka
zakh
stan
Chile
Om
anTu
rkey
Italy
Sources: 2011 TIMSS teacher background questionnaire. Training is defined as university degee, advanced-education, or equivalent.
Teacher Trained in Education or Subject Area(Percent of all teachers)

MOROCCO
INTERNATIONAL MONETARY FUND 21
23. Morocco’s business environment has been improving, but much remains to be done to diversify the economy and increase its competitiveness. Efforts have been made to simplify administrative procedures (such as for customs transactions, property registration, and enterprise creation), and to limit payment delays in the public sector. In October 2015, Morocco’s ranking in the 2016 World Bank’s Doing Business indicators improved to 75 (against 80 in 2015). Nevertheless, in addition to the above, key reforms need to be implemented in order to improve the business climate and unlock growth potential, especially: improving labor market regulation; reducing government bureaucracy; improving transparency and addressing corruption; and strengthening the judiciary system (including procedures to address chronic payment delays). The authorities noted that they were pursuing further reforms in a number of the above areas, including through a national strategy to fight corruption, which was about to be launched.
24. Significant challenges remain regarding access to financial services for small firms. As noted in the FSAP, Morocco has achieved notable progress since 2007, but lack of financial access is still a constraint for (V)SMEs, which represent 90 percent of total firms. For example, only about 35 percent of firms use banks to finance investment. In response, BAM set up special refinancing mechanisms in 2012 and 2013 which helped increase the provision of (V)SME finance by banks: the share of total credit allocated to (V)SMEs increased from 33 percent in 2012 to 37 percent in 2014—a level significantly better than the MENA region average of less than 10 percent. However, (V)SMEs still encounter numerous administrative difficulties and tighter conditions in their access to credit. Staff welcomed plans to improve the availability of credit information (such as through better quality data from credit bureaus), and noted that other conditions, including expeditious judicial procedures, were essential. The authorities indicated that they were about to set up a national observatory for (V)SMEs and to modernize the legal framework for securities.
STAFF APPRAISAL 25. A sound policy framework and prudent macroeconomic management have helped the economy respond to shocks, but challenges remain. Structural reforms, including in the area of subsidies, have improved the resilience of economy, and positioned the budget to benefit from low oil prices in 2015. The development of new industrial sectors has supported strong export growth. However, growth performance in 2015 was hampered by a slower-than-expected recovery in Europe and reduced tourism activity due to geopolitical risks. Going forward, growth prospects will continue to be subject to these uncertainties.
26. Raising Morocco’s growth potential will require continued efforts to improve job creation and inclusiveness. Morocco’s growth potential may have declined somewhat, in line with lower global growth prospects in developed and emerging economies. However, continued efforts to address youth unemployment, increase labor force participation rates, reduce the gender gap and social and regional disparities, are crucial to achieve more inclusive growth and higher potential output. In particular, improving access to quality education and literacy rates, widely recognized as key factors behind the high level of unemployment, is critical to reduce skills mismatches and support the diversification of the economy and its insertion in global value chains.

MOROCCO
22 INTERNATIONAL MONETARY FUND
27. The external position has improved, but risks remain and will require stronger buffers. The current account continues to improve, helped mostly by strong export and lower oil imports. This, along with strong capital inflows, has resulted in a substantial rebuilding of international reserves. Nevertheless, the economy remains vulnerable to global conditions, notably the risk of a protracted period of slow growth in Europe or oil price volatility. Therefore, it is important that the authorities continue implementing reforms to strengthen external and fiscal buffers and competitiveness, and increase the resilience of the economy.
28. The current macroeconomic policy mix consisting of tighter fiscal policy and accommodative monetary policy is appropriate. The fiscal deficit is expected to further decline in 2015 as subsidy expenditures are contained. At the same time, there are uncertainties about grant revenues in the remainder of 2015, which may require some corrective measures. As the economy continues to recover, the expected fiscal adjustment for 2016 is gradual and appropriate. Since inflation expectations are well-anchored, monetary policy could potentially help support credit expansion and economic growth, should inflation decline further, and taking into account potential risks.
29. Going forward, further fiscal consolidation will be needed to reduce public debt gradually, and will require steadfast implementation of the authorities’ reform agenda. Public debt is sustainable, but remains relatively high, and a commitment to bring it down to at most 60 percent of GDP over the medium term is desirable to create the fiscal space needed to increase social and growth-enhancing capital expenditures. The corresponding medium term fiscal consolidation would be progressive and not detrimental to growth. In order to achieve it, the authorities should further reduce subsidies, complete pension reform, continue to contain the public wage bill, and rely more on structural tax measures. The regionalization process should proceed with care, as international experiences indicate that it is often associated with adverse fiscal implications.
30. Measures should be taken to improve the efficiency of public spending on education, where Morocco lags comparable countries. Although public spending on education is among the highest among all countries, Moroccan students’ scores in international tests are below comparable countries, and important efficiency gains can be achieved in the allocation of public resources. In particular, education quality could improve, with the same amount of resources, though better government spending management, improved governance and reduced corruption, and stronger focus on teachers’ training.
31. Morocco could now transition gradually, and from a position of strength, toward greater exchange rate flexibility. The authorities’ intention to move to a new exchange rate and monetary policy regime is welcome, as a more flexible exchange rate would help the economy absorb external shocks and preserve competitiveness. In light of the improved external and reserves position, and with key policy and operational requirements in place, the current situation is appropriate for a move. As part of the transition, continued financial market deepening will help bring about further improvements in monetary policy transmission and support the authorities’ objectives of price and macro-economic stability. The adoption of the new statute of BAM would also help further strengthen the central bank independence.

MOROCCO
INTERNATIONAL MONETARY FUND 23
32. The 2015 FSAP assessed that risks to financial stability are limited, but rising NPL levels and concentration risks need to be monitored. Banks are well capitalized and profitable, and benefit from stable funding sources. Given that rising NPL levels and concentration risks arising from single or group exposures are significant, continued monitoring of bank asset quality is required. The authorities’ recent efforts to tighten bank regulation on concentration risks and to strengthen bank provisioning requirements are welcome. More broadly, considerable progress has been achieved in strengthening the financial sector policy framework, including the new banking law introduced in 2014, and enhanced systemic risk surveillance. Going forward, supervisory resources will need to increase in order for BAM to effectively handle its expanding responsibilities; new tools will be needed to support the new macroprudential policy framework; and the institutional framework for financial crisis management will need to be strengthened.
33. Staff recommends that the next Article IV consultation be held on the standard 12-month cycle.

MOROCCO
24 INTERNATIONAL MONETARY FUND
Table 1. Morocco: Risk Assessment Matrix 1
Source of Risk Impact if Realized
Policy Response Nature of the shock Vulnerability/Channels of
transmission
1 The Risk Assessment Matrix (RAM) shows events that could materially alter the baseline path (the scenario most likely to materialize in staff’s view). The relative likelihood of risks listed is the staff’s subjective assessment of the risks surrounding the baseline (“low” is meant to indicate a probability below 10 percent, “medium” a probability between 10 and 30 percent, and “high” a probability of 30 percent or more). The RAM reflects staff’s views on the source of risks and overall level of concern as of the time of discussions with the authorities. Non-mutually exclusive risks may interact and materialize jointly. Note: Colored boxes on the left hand side represent shock likelihood and colored boxes on the right hand side represent severity of impact. Red = High, Yellow = Medium and Green = Low.
Structurally weak growth in advanced economies (Euro Area)
External: The Euro Area is Morocco’s main economic partner and destination for Moroccan migrants Real: Output is largely exported to the Euro Area
Greater exchange rate flexibility Accelerated structural reforms
Lower exports of goods, remittances and tourism revenues
Heightened risks of fragmentation, state failures, security dislocation in the Middle East, leading to a sharp rise in oil price volatility and migrant flows, with negative global spillovers
Fiscal: Remaining public subsidies for domestic energy products (butane gas) External: Morocco’s economy is still heavily dependent on oil product imports
Continue subsidy reform to minimize the fiscal impact Continue efforts towards energy diversification
Impacts of higher oil prices: - Higher fiscal cost of subsidies - Higher oil import bill and inflation
Increased energy price volatility due to uncertainty about the persistence of the oil supply shock and other drivers of the price decline
Tighter and more volatile global financial conditions
Build consensus around the role and importance of reforms in reducing vulnerabilities, and in fostering higher and more inclusive growth,
Further increase external and fiscal buffers against these shocks
Higher borrowing costs for the public and private sectors Slowdown of FDI inflows and growth
The government and firms have relied on international market financing in recent years Robust FDI inflows support economic growth and exports
Reform slowdown
Delays in reform implementation would weaken macroeconomic resilience and potential growth in the medium term
Key reforms (e.g., of pensions, subsidies, or labor market) may slow down following recent macroeconomic improvements and ahead of the 2016 elections

MOROCCO
INTERNATIONAL MONETARY FUND 25
Table 2. Morocco: Selected Economic Indicators, 2012–20
PLL 1/ Rev. 2/ PLL 2/ Rev. 2/2012 2013 2016 2017 2018 2019 2020
(Annual percentage change)
Output and PricesReal GDP 3.0 4.7 2.9 2.4 4.9 4.7 3.1 4.2 4.4 4.6 4.7
Real agriculture GDP -9.1 17.9 -1.3 -2.5 15.0 15.2 -1.8 4.7 5.2 5.4 5.4
Real non-agriculture GDP 4.7 3.0 3.6 3.1 3.5 3.3 3.8 4.1 4.3 4.5 4.7Consumer prices (end of period) 2.6 0.4 1.6 1.6 1.6 1.6 1.3 2.0 2.0 2.0 2.0Consumer prices (period average) 1.3 1.9 0.4 0.4 1.5 1.6 1.5 2.0 2.0 2.0 2.0
(In percent of GDP)
Investment and SavingGross capital formation 35.0 34.7 34.0 33.7 33.4 33.3 34.5 35.5 36.5 37.1 37.6
Of which: Nongovernment 29.6 29.6 28.5 28.3 28.9 28.6 29.4 30.2 30.6 30.9 31.2
Gross national savings 25.5 26.8 28.1 28.0 30.6 31.8 33.8 34.6 35.1 35.7 36.4Of which: Nongovernment 25.9 25.3 26.0 26.0 28.9 29.9 30.6 30.6 30.6 30.7 30.6
(In percent of GDP)
Public FinancesRevenue 28.0 27.7 28.3 28.0 25.8 25.6 26.4 26.6 27.1 27.6 28.0Expenditure 35.3 32.9 33.2 33.0 30.0 29.8 29.9 29.6 29.9 30.1 30.0Budget balance -7.3 -5.2 -4.9 -4.9 -4.3 -4.3 -3.5 -3.0 -2.8 -2.5 -2.1Primary balance (excluding grants) -4.9 -3.3 -3.7 -3.7 -3.0 -2.5 -2.2 -1.1 -0.2 0.1 0.7Cyclically-adjusted primary balance (excl. grants) -5.0 -2.8 -3.5 -3.7 -2.8 -2.2 -2.0 -1.0 -0.1 0.2 0.7Total government debt 58.3 61.5 66.4 63.4 63.8 63.6 64.4 64.0 63.2 61.9 60.0
(Annual percentage change; unless otherwise indicated)
Monetary SectorCredit to the private sector 3/ 4.8 3.8 4.6 2.5 4.2 3.3 4.3 ... ... ... ...Base money -0.5 9.0 4.8 6.2 5.8 5.5 6.5 ... ... ... ...Broad money 4.5 3.1 4.8 6.2 5.8 5.5 6.5 ... ... ... ...Velocity of broad money 0.9 0.9 0.9 0.9 0.9 0.9 0.9 ... ... ... ...Three-month treasury bill rate (period average, in percent) 3.4 3.4 ... 2.5 ... ... ... ... ... ... ...
(In percent of GDP; unless otherwise indicated)
External Sector Exports of goods and services (in U.S. dollars, percentage change) 0.4 4.0 4.8 7.4 -10.8 -10.4 5.9 8.8 8.8 8.4 9.0Imports of goods and services (in U.S. dollars, percentage change) 2.2 4.3 0.8 1.0 -16.3 -18.9 4.5 8.0 7.5 7.9 8.7Merchandise trade balance -22.3 -20.5 -17.6 -18.7 -14.5 -13.5 -13.5 -13.5 -13.4 -13.4 -13.5Current account excluding official transfers -9.8 -8.6 -7.5 -7.4 -4.2 -2.4 -2.0 -1.8 -1.5 -1.5 -1.4Current account including official transfers -9.5 -7.9 -5.8 -5.7 -2.8 -1.5 -0.7 -0.9 -1.4 -1.3 -1.3Foreign direct investment 2.4 2.8 2.9 2.8 2.5 2.6 2.7 2.8 2.8 2.8 2.8Total external debt 28.5 29.2 32.1 32.7 32.2 31.9 32.7 31.9 31.4 30.8 29.3Gross reserves (in billions of U.S. dollars) 17.5 19.3 20.4 20.4 22.1 23.5 28.8 32.2 35.8 39.2 42.9
In months of next year imports of goods and services 4.3 4.7 5.3 6.1 6.0 6.7 7.6 8.0 8.2 8.3 8.3In percent of Fund reserve adequacy metric 88.1 91.0 93.6 94.2 105.1 110.9 128.6 137.8 146.2 150.1 163.6
Memorandum Items:Nominal GDP (in billions of U.S. dollars) 98.3 107.2 109.2 110.0 103.3 103.5 108.4 115.3 123.0 131.8 141.4Unemployment rate (in percent) 9.0 9.2 … 9.9 … … … … … … …Population (millions) 32.6 33.0 33.3 33.3 33.7 33.7 34.0 34.4 34.7 35.0 35.4 Population growth (in percent) 1.1 1.1 1.1 1.1 1.1 1.1 1.0 1.0 1.0 1.0 0.9Net imports of energy products (in billions of U.S. dollars) -12.4 -12.2 -11.1 -11.0 -7.2 -6.6 -6.7 -7.5 -8.1 -8.7 -9.1Local currency per U.S. dollar (period average) 8.6 8.4 ... 8.4 ... ... ... ... ... ... ...Real effective exchange rate (annual average,
percentage change) 4/ -2.0 1.8 ... 0.1 ... 0.0 ... ... ... ... ...
Sources: Moroccan authorities; and IMF staff estimates.
1/ Refers to the macro framework for the 1st review of the PLL arrangement in CR/15/44, based on national accounts based in 1998 and BOP manual 5.2/ Revised macro framework, based on national accounts based in 2007 and BOP manual 6.3/ Includes credit to public enterprises.4/ For 2015, actual value as of August 2015
20152014Proj.

MOROCCO
26 INTERNATIONAL MONETARY FUND
Table 3. Morocco: Budgetary Central Government Finance, 2012–20
(In billions of dirhams)
PLL 1/ Rev. 2/ PLL 2/ Rev. 2/2012 2013 2016 2017 2018 2019 2020
Revenue 237.7 250.0 259.3 259.3 257.5 256.4 276.7 293.7 316.3 341.7 368.6Taxes 202.7 200.7 203.8 203.8 206.7 205.9 222.5 243.5 268.6 290.5 314.4
Taxes on income, profits, and capital gains 77.4 75.7 76.3 76.3 80.1 77.5 87.3 94.3 105.5 117.3 128.0Taxes on property 11.6 11.7 13.9 13.9 12.9 13.9 15.1 16.7 19.2 20.3 21.6Taxes on goods and services 99.0 100.0 100.7 100.7 100.9 102.0 106.8 119.1 128.7 136.4 147.2Taxes on international trade and transactions 9.4 8.1 8.1 8.1 7.7 8.0 7.9 9.0 8.9 9.8 10.5Other taxes 5.4 5.2 4.7 4.7 5.1 4.5 5.4 4.4 6.3 6.7 7.1
Grants 0.5 6.1 13.8 13.8 14.6 9.6 14.3 10.0 2.2 2.2 2.2Other revenue 34.6 43.2 41.7 41.7 36.2 40.8 39.9 40.2 45.5 48.9 52.1
Expense 253.2 250.8 254.5 255.4 254.9 252.7 260.4 268.0 280.1 296.1 311.4Compensation of employees 108.9 112.8 117.3 117.3 123.1 121.0 125.8 131.0 139.0 146.2 151.9
Of which: wages and salaries 96.7 99.0 101.6 101.6 105.5 103.4 106.8 110.8 117.2 123.1 127.7 social contributions 12.2 13.7 15.7 15.7 17.6 17.6 19.0 20.2 21.8 23.1 24.2
Use of goods and services and grants 56.6 59.3 65.0 65.0 71.2 72.1 73.9 78.6 82.5 87.6 91.9Of which: Use of goods and services 20.9 21.5 23.6 23.6 27.8 28.3 28.3 28.9 30.0 31.9 32.6
Grants 35.6 37.8 41.4 41.4 43.4 43.8 45.6 49.6 52.5 55.8 59.3Interest 20.7 23.3 24.8 25.6 26.9 27.7 28.3 30.5 33.0 35.2 39.2Subsidies 54.9 41.6 32.6 32.6 18.7 16.9 15.6 9.8 9.1 9.7 10.3Other expense 3/ 12.1 13.9 14.8 14.8 15.0 15.0 16.8 18.2 16.4 17.3 18.1
Net acquisition of nonfinancial assets 46.1 45.7 49.7 49.7 45.1 46.8 53.0 58.5 68.8 76.8 84.3
Net lending / borrowing (overall balance) -61.5 -46.5 -44.9 -45.7 -42.5 -43.0 -36.7 -32.8 -32.6 -31.2 -27.2Net lending / borrowing (excluding grants) -61.9 -52.6 -58.7 -59.5 -57.1 -52.7 -51.0 -42.8 -34.8 -33.4 -29.4
Change in net financial worth -61.5 -46.5 -44.9 -45.7 -42.5 -43.0 -36.7 -32.8 -32.6 -31.2 -27.2Net acquisition of financial assets -3.3 4.3 -2.0 -2.0 0.0 0.0 0.0 0.0 0.0 0.0 0.0
Domestic -3.3 4.3 -2.0 -2.0 0.0 0.0 0.0 0.0 0.0 0.0 0.0Shares and other equity -3.3 0.0 -2.0 -2.0 0.0 0.0 0.0 0.0 0.0 0.0 0.0
Foreign Loans 0.0 0.0 0.0 0.0 0.0 0.0 0.0 0.0 0.0 0.0 0.0Net incurrence of liabilities 58.2 50.8 42.8 43.7 42.5 43.0 36.7 32.8 32.6 31.2 27.2
Domestic 55.8 42.2 32.9 45.7 40.7 41.4 18.7 26.8 20.9 19.3 25.1Currency and Deposits 0.0 0.0 0.0 0.0 0.0 0.0 0.0 0.0 0.0 0.0 0.0Securities other than shares 60.6 50.7 44.8 49.6 48.7 49.4 18.7 26.8 20.9 19.3 25.1Other accounts payable -4.8 -8.6 -11.9 -3.9 -8.0 -8.0 0.0 0.0 0.0 0.0 0.0
Foreign Loans 2.4 8.6 9.9 -2.0 1.8 1.7 18.0 6.0 11.7 11.9 2.0
Memorandum Item:Total investment (including capital transfers) 58.1 59.6 64.4 64.4 60.1 61.8 69.8 76.7 85.2 94.1 102.5GDP 847.9 901.4 917.3 924.8 999.0 1,003.6 1,047.0 1,103.3 1,166.5 1,239.1 1,318.0
Sources: Ministry of Economy and Finance; and IMF staff estimates.
1/ Refers to the macro framework for the 1st review of the PLL arrangement in CR/15/44, based on national accounts based in 1998.2/ Revised macro framework, based on national accounts based in 2007.3/ Includes capital transfers to public entities.
2014 2015Proj.

MOROCCO
INTERNATIONAL MONETARY FUND 27
Table 4. Morocco: Budgetary Central Government Finance, 2012–20
(In percent of GDP)
PLL 1/ Rev. 2/ PLL 2/ Rev. 2/
2012 2013 2016 2017 2018 2019 2020
Revenue 28.0 27.7 28.3 28.0 25.8 25.6 26.4 26.6 27.1 27.6 28.0
Taxes 23.9 22.3 22.2 22.0 20.7 20.5 21.2 22.1 23.0 23.4 23.9
Taxes on income, profits, and capital gains 9.1 8.4 8.3 8.3 8.0 7.7 8.3 8.5 9.0 9.5 9.7
Taxes on property 1.4 1.3 1.5 1.5 1.3 1.4 1.4 1.5 1.6 1.6 1.6
Taxes on goods and services 11.7 11.1 11.0 10.9 10.1 10.2 10.2 10.8 11.0 11.0 11.2
Taxes on international trade and transactions 1.1 0.9 0.9 0.9 0.8 0.8 0.8 0.8 0.8 0.8 0.8
Other taxes 0.6 0.6 0.5 0.5 0.5 0.4 0.5 0.4 0.5 0.5 0.5
Grants 0.1 0.7 1.5 1.5 1.5 1.0 1.4 0.9 0.2 0.2 0.2
Other revenue 4.1 4.8 4.5 4.5 3.6 4.1 3.8 3.6 3.9 4.0 4.0
Expense 29.9 27.8 27.7 27.6 25.5 25.2 24.9 24.3 24.0 23.9 23.6
Compensation of employees 12.8 12.5 12.8 12.7 12.3 12.1 12.0 11.9 11.9 11.8 11.5
Of which : wages and salaries 11.4 11.0 11.1 11.0 10.6 10.3 10.2 10.0 10.0 9.9 9.7
social contributions 1.4 1.5 1.7 1.7 1.8 1.8 1.8 1.8 1.9 1.9 1.8
Use of goods and services and grants 6.7 6.6 7.1 7.0 7.1 7.2 7.1 7.1 7.1 7.1 7.0
Of which : Use of goods and services 2.5 2.4 2.6 2.6 2.8 2.8 2.7 2.6 2.6 2.6 2.5
Grants 4.2 4.2 4.5 4.5 4.3 4.4 4.4 4.5 4.5 4.5 4.5
Interest 2.4 2.6 2.7 2.8 2.7 2.8 2.7 2.8 2.8 2.8 3.0
Subsidies 6.5 4.6 3.6 3.5 1.9 1.7 1.5 0.9 0.8 0.8 0.8
Other expense 3/ 1.4 1.5 1.6 1.6 1.5 1.5 1.6 1.7 1.4 1.4 1.4
Net acquisition of nonfinancial assets 5.4 5.1 5.4 5.4 4.5 4.7 5.1 5.3 5.9 6.2 6.4
Net lending / borrowing (overall balance) -7.3 -5.2 -4.9 -4.9 -4.3 -4.3 -3.5 -3.0 -2.8 -2.5 -2.1
Net lending / borrowing (excluding grants) -7.3 -5.8 -6.4 -6.4 -5.7 -5.2 -4.9 -3.9 -3.0 -2.7 -2.2
Change in net financial worth -7.3 -5.2 -4.9 -4.9 -4.3 -4.3 -3.5 -3.0 -2.8 -2.5 -2.1
Net acquisition of financial assets -0.4 0.5 -0.2 -0.2 0.0 0.0 0.0 0.0 0.0 0.0 0.0
Domestic -0.4 0.5 -0.2 -0.2 0.0 0.0 0.0 0.0 0.0 0.0 0.0
Shares and other equity -0.4 0.0 -0.2 -0.2 0.0 0.0 0.0 0.0 0.0 0.0 0.0
Foreign Loans 0.0 0.0 0.0 0.0 0.0 0.0 0.0 0.0 0.0 0.0 0.0
Net incurrence of liabilities 6.9 5.6 4.7 4.7 4.3 4.3 3.5 3.0 2.8 2.5 2.1
Domestic 6.6 4.7 3.6 4.9 4.1 4.1 1.8 2.4 1.8 1.6 1.9
Currency and Deposits 0.0 0.0 0.0 0.0 0.0 0.0 0.0 0.0 0.0 0.0 0.0
Securities other than shares 7.1 5.6 4.9 5.4 4.9 4.9 1.8 2.4 1.8 1.6 1.9
Other accounts payable -0.6 -0.9 -1.3 -0.4 -0.8 -0.8 0.0 0.0 0.0 0.0 0.0
Foreign Loans 0.3 1.0 1.1 -0.2 0.2 0.2 1.7 0.5 1.0 1.0 0.2
Memorandum items:
Total investment (including capital transfers) 6.9 6.6 7.0 7.0 6.0 6.2 6.7 7.0 7.3 7.6 7.8
Sources: Ministry of Economy and Finance; and IMF staff estimates.
1/ Refers to the macro framework for the 1st review of the PLL arrangement in CR/15/44, based on national accounts based in 1998.
2/ Revised macro framework, based on national accounts based in 2007.
3/ Includes capital transfers to public entities.
2014 2015
Proj.

MOROCCO
28 INTERNATIONAL MONETARY FUND
Table 5. Morocco: Balance of Payments, 2012–20 (In billions of U.S. dollars, unless otherwise indicated)
PLL 1/ Rev. 2/ PLL 2/ Rev. 2/
2012 2013 2016 2017 2018 2019 2020
Current account -9.3 -8.5 -6.4 -6.2 -2.9 -1.6 -0.8 -1.1 -1.7 -1.8 -1.8Trade balance -21.9 -21.9 -19.2 -20.6 -15.0 -14.0 -14.6 -15.6 -16.5 -17.7 -19.1
Exports, f.o.b. 17.0 18.3 23.4 20.0 18.5 18.5 19.9 21.9 24.0 26.2 28.8Agriculture 3.3 3.9 4.0 4.1 3.9 3.9 4.2 4.5 4.7 5.0 5.3
Phosphates and derived products 5.6 4.4 4.7 4.6 4.3 4.3 4.6 4.9 5.3 5.8 6.3Imports, f.o.b. -38.9 -40.2 -42.6 -40.6 -33.5 -32.5 -34.5 -37.5 -40.5 -43.8 -47.9
Energy -12.4 -12.2 -11.1 -11.0 -7.2 -6.6 -6.7 -7.5 -8.1 -8.7 -9.1Capital goods -8.1 -9.1 -8.9 -8.9 -8.3 -8.3 -8.8 -9.4 -10.0 -10.7 -11.5Food products -4.7 -4.2 -5.0 -4.9 -3.7 -3.6 -3.8 -4.1 -4.3 -4.4 -4.6
Services 7.1 6.4 5.7 7.0 5.7 6.0 6.7 7.3 8.1 8.8 9.6 Tourism receipts 6.7 6.9 6.9 7.1 5.8 6.1 6.3 6.8 7.2 7.7 8.3
Income -2.2 -1.6 -2.4 -2.7 -2.6 -1.8 -1.9 -2.1 -2.4 -2.7 -3.0Transfers 7.7 8.7 9.6 10.0 9.0 8.2 9.0 9.3 9.1 9.8 10.8
Private transfers (net) 7.4 7.9 7.8 8.1 7.5 7.3 7.6 8.3 9.0 9.7 10.6Workers' remittances 6.7 6.9 6.8 7.1 6.3 6.2 6.5 7.0 7.6 8.2 9.1
Official grants (net) 0.2 0.8 1.8 1.9 1.5 0.9 1.4 1.0 0.2 0.2 0.2
Capital account 0.0 0.0 0.0 0.0 0.0 0.0 0.0 0.0 0.0 0.0 0.0Financial account 6.2 9.4 9.3 8.7 5.9 5.9 5.9 4.3 5.0 4.8 5.2 Direct investment 2.3 3.0 3.2 3.1 2.6 2.7 3.0 3.2 3.4 3.6 4.0
Portfolio investment 1.6 1.3 0.1 3.0 1.1 1.1 0.1 0.1 0.1 0.1 0.1Other 2.2 5.1 6.0 2.5 2.1 2.1 2.8 1.0 1.5 1.0 1.1
Private 1.0 2.8 2.5 1.2 1.1 1.1 0.4 -0.2 -0.2 -0.7 0.4Public medium-and long-term loans (net) 1.3 2.4 3.5 1.3 1.1 0.9 2.5 1.2 1.7 1.7 0.7
Disbursements 2.9 4.1 5.3 3.1 2.7 2.6 4.2 3.6 3.6 3.6 3.7Amortization -1.6 -1.8 -1.8 -1.8 -1.6 -1.6 -1.7 -2.4 -1.9 -1.9 -3.0
Reserve asset accumulation (-increase) 3.5 -1.4 -2.9 -3.2 -3.0 -4.3 -5.1 -3.2 -3.4 -3.0 -3.4Errors and omissions -0.3 0.5 0.0 0.7 0.0 0.0 0.0 0.0 0.0 0.0 0.0
Current account -9.5 -7.9 -5.8 -5.7 -2.8 -1.5 -0.7 -0.9 -1.4 -1.3 -1.3Trade balance -22.3 -20.5 -17.6 -18.7 -14.5 -13.5 -13.5 -13.5 -13.4 -13.4 -13.5
Exports, f.o.b. 17.3 17.1 21.4 18.2 17.9 17.9 18.3 19.0 19.5 19.9 20.4Agriculture 3.4 3.6 3.7 3.8 3.8 3.8 3.9 3.9 3.8 3.8 3.7
Phosphates and derived products 5.7 4.1 4.3 4.1 4.1 4.1 4.3 4.3 4.3 4.4 4.5Imports, f.o.b. -39.6 -37.5 -39.0 -36.9 -32.4 -31.4 -31.8 -32.5 -32.9 -33.3 -33.9
Petroleum -12.6 -11.3 -10.2 -10.0 -7.0 -6.3 -6.2 -6.5 -6.6 -6.6 -6.4Capital goods -8.2 -8.5 -8.2 -8.0 -8.0 -8.0 -8.1 -8.2 -8.2 -8.1 -8.1Food products -4.8 -3.9 -4.6 -4.4 -3.6 -3.5 -3.5 -3.5 -3.5 -3.4 -3.3
Services 7.2 6.0 5.2 6.4 5.5 5.8 6.2 6.4 6.6 6.7 6.8 Tourism receipts 6.8 6.4 6.3 6.4 5.6 5.9 5.8 5.9 5.9 5.9 5.9Income -2.3 -1.5 -2.2 -2.4 -2.5 -1.8 -1.7 -1.8 -2.0 -2.1 -2.2Transfers 7.8 8.1 8.8 9.1 8.7 8.0 8.3 8.1 7.4 7.5 7.6
Private transfers (net) 7.6 7.4 7.1 7.4 7.2 7.0 7.0 7.2 7.3 7.3 7.5Workers' remittances 6.9 6.4 6.3 6.5 6.1 6.0 6.0 6.1 6.2 6.2 6.4
Official grants (net) 0.2 0.7 1.6 1.7 1.4 0.9 1.3 0.9 0.2 0.1 0.1Capital account 0.0 0.0 0.0 0.0 0.0 0.0 0.0 0.0 0.0 0.0 0.0Financial account 6.3 8.8 8.5 7.9 5.7 5.7 5.4 3.7 4.1 3.6 3.7 Direct investment 2.4 2.8 2.9 2.8 2.5 2.6 2.7 2.8 2.8 2.8 2.8
Portfolio investment 1.6 1.2 0.1 2.8 1.1 1.1 0.1 0.1 0.1 0.1 0.1Other 2.3 4.8 5.5 2.3 2.1 2.0 2.6 0.8 1.2 0.8 0.8
Private 3/ 1.0 2.6 2.3 1.1 1.0 1.1 0.3 -0.2 -0.2 -0.5 0.3Public medium-and long-term loans (net) 1.3 2.2 3.2 1.2 1.0 0.9 2.3 1.0 1.4 1.3 0.5
Disbursements 2.9 3.9 4.8 2.8 2.6 2.5 3.9 3.1 2.9 2.8 2.6Amortization -1.6 -1.7 -1.6 -1.6 -1.6 -1.6 -1.6 -2.1 -1.6 -1.4 -2.1
Memorandum items:Exports of goods and services (in U.S. dollars, percentage change) 0.4 4.0 4.8 7.4 -10.8 -10.4 5.9 8.8 8.8 8.4 9.0Imports of goods and services (in U.S. dollars, percentage change) 2.2 4.3 0.8 1.0 -16.3 -18.9 4.5 8.0 7.5 7.9 8.7Current account balance excluding official grants (percent of GDP) -9.8 -8.6 -7.5 -7.4 -4.2 -2.4 -2.0 -1.8 -1.5 -1.5 -1.4Terms of trade (percentage change) 3/ -12.2 -2.5 -1.2 -1.2 8.1 10.7 0.1 -1.7 -1.2 -0.6 -0.6Gross official reserves 4/ 17.5 19.3 20.4 20.4 22.1 23.5 28.8 32.2 35.8 39.2 42.9
In months of prospective imports of GNFS 4.3 4.7 5.3 6.1 6.0 6.7 7.6 8.0 8.2 8.3 8.3In percent of the Assessing Reserve Adequacy (ARA) metric 88.1 91.0 93.6 94.2 105.1 110.9 128.6 137.8 146.2 150.1 163.6In percent of the adjusted Assessing Reserve Adequacy (ARA) metric 125.1 129.4 ... 130.3 146.7 154.2 179.9 194.5 208.1 213.9 230.2
Debt service (percent of export of GNFS and remittances) 5/ 6.2 7.0 6.6 6.8 7.0 7.0 6.9 8.0 6.4 6.0 7.6External public and publicly guaranteed debt (percent of GDP) 25.1 26.0 28.8 29.6 29.5 29.2 30.3 29.7 29.5 29.1 27.9DHs per US$, period average 8.6 8.4 ... 8.4 ... ... ... ... ... ... ...GDP (US$) 98.3 107.2 109.2 110.0 103.3 103.5 108.4 115.3 123.0 131.8 141.4Oil price (US$/barrel; Brent) 112.0 108.8 98.9 98.9 61.5 53.4 53.0 58.4 62.5 64.6 65.7
Sources: Ministry of Finance; Office des Changes ; and IMF staff estimates and projections.
1/ Refers to the macro framework for the 1st review of the PLL arrangement in CR/15/44, based on national accounts based in 1998 and BOP manual 5.2/ Revised macro framework, based on national accounts based in 2007 and BOP manual 6.3/ Based on WEO data for actual and projections. 4/ Excluding the reserve position in the Fund. 5/ Public and publicly guaranteed debt.
(Percent of GDP)
2014 2015
Proj.

MOROCCO
INTERNATIONAL MONETARY FUND 29
Table 6. Morocco: Monetary Survey, 2011–15
PLL 1/ Rev. 2/ PLL 2/ Rev. 2/2011 2012 2013
Net foreign assets 173.8 144.7 150.3 173.8 180.8 204.8 218.1
Of which : Gross reserves 177.1 147.9 156.9 180.8 184.5 211.8 225.1
Deposit money banks 1.7 2.7 -1.5 -1.6 0.1 0.3 0.5
Net domestic assets 775.4 847.4 872.5 896.8 905.4 944.5 927.9
Domestic credit 798.3 855.0 906.5 948.5 919.8 967.9 961.4
Net claims on the government 102.1 125.4 149.3 156.8 143.4 158.9 159.5
Banking system 102.1 125.4 149.3 156.8 143.4 158.9 159.5
Bank Al-Maghrib 2.2 0.5 0.8 0.6 -0.4 -0.8 -0.8
Of which : deposits -3.4 -4.5 -4.6 -4.8 -4.6 -5.0 -5.0
Deposit money banks 99.9 124.9 148.5 156.2 143.8 159.7 160.3
Credit to the economy 696.2 729.6 757.2 791.7 776.4 809.1 801.9
Other liabilities, net 24.6 10.2 32.4 51.7 14.4 23.5 33.5
Broad money 949.3 992.2 1,022.8 1,072.3 1,086.2 1,149.2 1,146.0
Money 586.8 612.2 628.9 660.6 660.6 708.2 709.1
Currency outside banks 158.3 163.6 171.4 180.1 179.4 193.8 194.7
Demand deposits 428.5 448.5 457.6 480.4 481.2 514.4 514.4
Quasi money 340.9 354.7 370.8 386.0 390.7 406.3 406.3Foreign deposits 21.6 25.3 23.1 25.7 35.0 34.8 30.6
Net foreign assets -10.8 -16.0 0.9 15.9 21.6 15.9 23.3
Net domestic assets 11.6 9.3 3.0 2.9 3.8 4.3 2.5
Domestic credit 11.6 7.1 6.0 4.6 1.5 5.2 4.5
Net claims on the government 25.8 22.8 19.0 5.0 -3.9 10.8 11.2
Credit to the economy 9.8 4.8 3.8 4.6 2.5 4.2 3.3
Banking credit 10.6 3.9 2.2 … 2.2 4.1 3.1
Broad money 6.4 4.5 3.1 4.8 6.2 5.8 5.5
Net foreign assets -2.4 -3.0 0.1 2.4 3.1 2.6 3.9
Domestic credit 9.3 6.0 5.2 4.1 1.3 4.4 3.8
Net claims on the government 2.3 2.5 2.4 0.7 -0.6 1.4 1.5
Credit to the economy 6.9 3.5 2.8 3.4 1.9 3.0 2.3
Other assets net -0.5 1.5 -2.2 -1.7 1.8 -0.8 -1.8
Memorandum items:
Velocity (GDP/M3) 0.86 0.85 0.88 0.86 0.85 0.87 0.88
Velocity (non-agr. GDP/M3) 0.76 0.76 0.77 0.74 0.76 0.75 0.76
Credit to economy/GDP (in percent) 84.9 86.0 84.0 86.3 84.0 81.0 79.9Credit to economy/nonagricultural GDP (in percent) 96.7 97.2 96.1 99.9 94.0 93.3 92.0
Sources: Bank Al-Maghrib; and IMF staff estimates.
1/ Refers to the macro framework for the 1st review of the PLL arrangement in CR/15/44, based on national accounts based in 1998.2/ Revised macro framework, based on national accounts based in 2007.
(Billions of dirhams)
(Annual percentage change)
(Change in percent of broad money)
20152014

MOROCCO
30 INTERNATIONAL MONETARY FUND
Table 7. Morocco: Financial Soundness Indicators, 2008–June 2015
(Percent, unless otherwise indicated)
2008 2009 2010 2011 2012 2013 2014 June 2015
Regulatory capital 1/Regulatory capital to risk-weighted assets 11.2 11.7 12.3 11.7 12.3 13.3 13.8 …Tier 1 capital to risk weighted assets 9.6 9.2 9.7 9.6 10.2 11.1 11.6 …Capital to assets 6.9 7.2 8.3 8.1 8.5 8.6 8.8 9.0
Asset qualitySectoral distribution of loans to total loans
Industry 18.7 18.3 18.4 18.6 18.4 18.6 19.3 19.0Of which : agro-business 3.3 3.6 3.8 3.4 3.2 3.6 3.5 3.7Of which : textile 1.7 1.9 1.4 1.3 1.2 1.0 0.9 0.9Of which : gas and electricity 3.3 2.9 3.9 4.5 4.8 4.7 6.1 6.3Agriculture 4.1 3.4 4.1 4.2 4.1 4.1 3.9 4.1Commerce 6.5 7.0 6.7 6.6 6.7 6.2 6.6 6.4Construction 15.9 14.1 13.3 13.9 12.6 12.4 12.2 11.8Tourism 2.6 3.2 2.9 2.8 2.9 2.4 2.4 2.2Finance 13.1 12.5 12.1 11.9 11.0 12.7 11.6 11.8Public administration 3.7 4.3 5.0 4.8 5.0 5.0 4.7 4.4Transportation and communication 4.5 4.2 4.0 4.1 4.0 3.8 3.7 4.3Households 26.5 27.6 28.1 27.6 28.9 29.7 31.4 32.0Other 4.4 5.4 5.4 5.5 6.4 5.1 4.2 4.0FX-loans to total loans 2.4 2.5 2.5 3.5 2.9 2.7 3.9 2.9Credit to the private sector to total loans 93.3 91.0 91.0 92.0 91.0 91.0 91.0 91.0Nonperforming Loans (NPLs) to total loans 6.0 5.5 4.8 4.8 5.0 5.9 6.9 7.2Specific provisions to NPLs 75.3 74.1 70.1 68.7 67.8 64.0 65.0 66.0NPLs, net of provisions, to Tier 1 capital 13.9 12.7 12.2 12.9 13.6 16.8 19.2 18.6Large exposures to Tier 1 capital 314.0 376.0 336.0 354.0 347.0 327.0 341.0 304.0Loans to subsidiaries to total loans 6.4 6.7 6.1 6.3 5.4 7.2 6.8 6.2Loans to shareholders to total loans 2.0 1.0 0.8 1.2 1.0 1.3 1.4 1.3Specific provisions to total loans 4.5 4.0 3.4 3.5 3.3 3.8 4.5 4.8General provisions to total loans 0.2 0.1 0.2 0.3 0.7 0.7 0.8 0.8
ProfitabilityReturn on assets (ROA) 1.2 1.2 1.2 1.1 1.0 1.0 0.9 1.0Return on equity (ROE) 16.7 15.2 14.2 13.4 11.8 10.6 10.2 10.6Interest rate average spread (b/w loans and deposits) 4.4 4.3 4.2 4.2 4.2 4.0 4.1 …Interest return on credit 5.8 5.8 5.7 5.7 5.6 5.5 5.5 …Cost of risk as a percent of credit 0.4 0.5 0.5 0.5 0.8 0.9 1.0 1.4Net interest margin to net banking product (NPB) 2/ 78.1 76.7 76.3 75.8 76.5 74.0 68.9 73.1Operating expenses to NPB 47.8 47.5 46.4 47.9 47.5 47.7 46.1 44.5Operating expenses to total assets 1.7 1.7 1.8 1.9 1.8 1.8 1.9 1.9Personnel expenses to noninterest expenses 51.9 49.7 49.1 49.4 49.2 48.4 47.6 …Trading and other noninterest income to NPB 21.9 23.3 23.7 24.2 23.4 26.0 30.8 26.9
LiquidityLiquid assets to total assets 24.4 17.3 12.0 11.4 10.5 12.5 13.3 14.4Liquid assets to short-term liabilities 24.7 23.0 16.0 16.1 14.7 17.4 17.7 14.0Deposits to loans 113.0 108.0 104.0 99.0 96.1 96.2 100.8 102.5Deposits of state-owned enterprises to total deposits 5.1 4.8 5.2 2.9 3.4 2.0 2.5 2.7
Sensitivity to market riskFX net open position to Tier 1 Capital 6.5 13.5 10.3 7.3 7.4 11.3 9.0 9.8
Source: Bank Al-Maghrib.
1/ Financial Soundness Indicators (FSIs) are calculated according to guidelines of the IMF FSIs compilation guide, 2004. 2/ Net Banking Product (NPB)=net interest margin-commissions paid+commissions received.* Provisional figures calculated according to Basel III definition and transitional provisions

MOROCCO
INTERNATIONAL MONETARY FUND 31
Table 8. Morocco: Capacity to Repay Indicators, 2014–20 1/
2014 2015 2016 2017 2018 2019 2020
Exposure and repayments (in SDR million)
GRA credit to Morocco 0.0 3,235.1 3,235.1 3,235.1 3,235.1 1,617.6 0.0
(In percent of quota) 0.0 550.0 550.0 550.0 550.0 275.0 0.0
Charges due on GRA credit 0.0 0.0 30.0 34.0 34.0 29.07 12.57
Principal due on GRA credit 0.0 0.0 0.0 0.0 0.0 1,617.6 1,617.6
Debt service due on GRA credit 0.0 0.0 30.0 34.0 34.0 1,646.6 1,630.1
Debt and debt service ratios
In percent of GDP
Total external debt 29.4 37.2 35.2 35.4 34.2 31.5 29.6
Public external debt 26.2 34.1 32.7 33.1 32.2 29.8 28.1
GRA credit to Morocco 0.0 4.8 4.6 4.3 4.1 0.5 0.0
Total external debt service 2.6 2.8 2.5 2.5 2.9 2.8 3.5
Public external debt service 2.1 2.5 2.5 2.2 2.2 2.7 2.5
Debt service due on GRA credit 0.0 0.0 0.0 0.0 0.0 0.5 0.4
In percent of gross international reserves
Total external debt 158.3 164.0 132.9 126.6 117.4 106.1 97.5
Public external debt 141.1 150.5 123.2 118.4 110.4 100.2 92.5
GRA credit to Morocco 0.0 21.4 17.4 15.6 14.0 1.6 0.0
In percent of exports of goods and services
Total external debt 96.9 116.0 114.4 120.8 123.7 124.3 125.6
Public external debt 86.4 106.6 106.0 112.9 116.2 117.4 119.2
GRA credit to Morocco 0.0 15.6 14.8 13.6 12.5 1.4 0.0
In percent of total external debt
GRA credit to Morocco 0.0 13.5 12.9 11.2 10.1 1.1 0.0
In percent of public external debt
GRA credit to Morocco 0.0 14.7 13.9 12.0 10.7 1.2 0.0
Memorandum items:
Nominal GDP (in billions of U.S. dollars) 110.0 103.5 108.4 115.3 123.0 131.8 141.4
Gross international reserves (in billions of U.S. dollars) 20.4 23.5 28.8 32.2 35.8 39.2 42.9
Exports of goods and services (in billions of U.S. dollars) 35.8 32.1 34.0 37.0 40.2 43.5 47.5
Quota (in millions of SDRs) 588.2 588.2 588.2 588.2 588.2 588.2 588.2
Source: IMF staff estimates and projections.
1/ Upon approval of the second review of the PLL arrangement Morocco can draw up to 550 percent of quota. The Moroccan authorities have expressed their intention to treat the arrangement as precautionary.
Proj.

MOROCCO
32 INTERNATIONAL MONETARY FUND
Table 9. Morocco: Selected FSAP Recommendations
Recommendations Priority
Banking Regulation and Oversight
Address banking supervisor’s capacity constraints; strengthen on-site supervision capacity. I
Review loan classification and provisioning rules; conduct an impact study for implementing the relevant IFRS in coordination with tax authorities.
NT
Advance recovery & resolution plans; more frequent comprehensive assessments for SIFIs NT
Macroprudential Oversight
Clarify the powers, instruments and voting arrangements of the CCSRS. I
Amend laws governing the regulators for capital markets, and insurance and pensions to include financial stability objective.
I/NT
Prioritize the implementation of counter-cyclical buffer; expand data coverage for the risk map; expand sectoral instruments.
NT
Emergency Liquidity Assistance (ELA)
Separate BAM’s ELA function clearly from government solvency support. I
Strengthen BAM’s recapitalization process; review its profit distribution mechanism. NT
Early Intervention/Bank Resolution Framework
Define the objectives of banking resolution; incorporate “the least-cost principle” I Formalize the hierarchy of creditors’ claims; introduce bail-in powers NT Designate an explicit bank resolution authority; limit its legal liabilities in this mandate NT
Deposit Insurance
Remove any type of open bank assistance via the deposit guarantee fund (DGF). I
Grant DGF a priority over uninsured depositors and general creditors. NT
Financial Market Infrastructures
Ensure legal basis for netting, settlement finality, collateral protection in insolvency I
Implement settlement guarantee scheme and default handling procedures in MAROCLEAR I
Securities Market Regulation and Oversight
Require more detailed disclosure of risks in money market funds. NT
Develop guarantee scheme for client securities accounts held in custodian banks. NT
Create clear administrative power to sanction individuals violating securities regulations. NT Modernize valuation rules of traded financial assets, including E Bond platform MT
Financial Inclusion
Establish a well-resourced governance and a robust monitoring and evaluation framework I
Improve credit bureau data quality; expand data providers to non-financial institutions I/NT
Amend legal and regulatory framework to enable MFIs to provide basic financial services I
Reduce obstacles to the use of cash-less transactions and consider measures to incentivize their use by the public and private sector.
NT

MOROCCO
INTERNATIONAL MONETARY FUND 33
Annex I. Public Debt Sustainability Analysis (DSA)
Morocco’s public debt remains sustainable. While the gross debt-to-GDP ratio declined between 2000 and 2010, external shocks and domestic factors have caused the ratio to rise again since then. Nevertheless, at about 63 percent of GDP at end-2014, public debt remains sustainable, and the DSA shows it to be resilient to various shocks. Vulnerabilities linked to the debt’s level and profile appear moderate for the most part. However, gross financing needs have been high (mainly linked to the rollover of existing debt), and have exceeded the benchmark of 15 percent of GDP over the past three years, highlighting some risks despite a relatively moderate debt level.
1. This DSA updates the analysis conducted for the second review of the current arrangement under the Precautionary and Liquidity Line (PLL). The overall analysis remains largely unchanged, and public debt remains sustainable. A slight downward revision to the real output growth projections during 2015–20 has not affected the debt-to-GDP ratio significantly given that the authorities maintain their deficit target for 2017 unchanged, and intend to put the debt-to-GDP ratio on a downward path over the medium-term.
2. After declining in the previous decade, Morocco’s public debt-to-GDP ratio started rising in 2010 as macroeconomic performance deteriorated. Rising international commodity prices contributed to a significant increase in the fiscal deficit, mainly through higher food and fuel subsidies, and public debt rose from 48 percent of GDP in 2009 to about 63 percent in 2014. About half of this increase occurred in 2012, when the economy was most affected by the crisis in Europe (Morocco’s main trade partner) and higher oil prices, and the authorities encountered difficulties in containing the fiscal deficit. However, the authorities’ fiscal consolidation efforts are expected to help bring the debt ratio down toward 60 percent of GDP in the medium term.
3. Public debt is generally resilient to shocks, but there are risks linked to financing needs and, to a lesser extent, to shocks to growth and the primary balance (heat map below). Baseline projections are realistic when compared to a group of market access countries. Morocco’s projected fiscal consolidation efforts, aimed at lowering the overall deficit below 3 percent of GDP in the medium term, do not appear exceptional relative to the distribution of other country cases. The debt level remains below the debt burden benchmark of 70 percent of GDP for emerging markets when various shocks are assumed, except in cases of shocks to real GDP growth or to the primary balance. Vulnerabilities linked to the profile of debt are mostly moderate, except for an exceptional increase in short-term debt in 2013—however, short term debt still represents a very small part of total debt (about 5 percent). Relevant indicators exceed the lower early-warning benchmarks but not the upper risk assessment benchmarks (chart). Gross financing needs of about 17 percent of GDP exceed the benchmark of 15 percent in 2014, but are expected to decline under this benchmark in 2015. The investment base, mostly composed of local investors (many of which long term investors) also mitigates risks from gross financing needs. Nonetheless, these risks highlight the importance of continuing on the path of fiscal consolidation to reduce debt-financed deficits, and of carefully managing the maturity profile of public debt.

MOROCCO
34 INTERNATIONAL MONETARY FUND
As of November 18, 2015 3/2/ 2013 2014 2015 2016 2017 2018 2019 2020 Sovereign Spreads
Nominal gross public debt 52.4 61.5 63.4 63.6 64.4 64.0 63.2 61.9 60.0 Spread (bp) 119Public gross financing needs 13.3 19.4 16.5 13.3 12.4 11.9 11.8 11.1 10.0 CDS (bp) 199
Real GDP growth (in percent) 4.6 4.7 2.4 4.7 3.1 4.2 4.4 4.6 4.7 Ratings Foreign LocalInflation (GDP deflator, in percent) 1.4 1.5 0.2 3.7 1.2 1.1 1.3 1.5 1.5 Moody's Ba1 Ba1Nominal GDP growth (in percent) 6.1 6.3 2.6 8.5 4.3 5.4 5.7 6.2 6.4 S&Ps BBB- BBB-Effective interest rate (in percent) 4/ 5.4 4.7 4.6 4.7 4.6 4.5 4.7 4.8 4.9 Fitch BBB- BBB
2013 2014 2015 2016 2017 2018 2019 2020 cumulativeChange in gross public sector debt 0.0 3.3 1.9 0.2 0.8 -0.5 -0.8 -1.3 -1.9 -3.4
Identified debt-creating flows -0.2 1.3 5.2 -0.7 1.0 -0.3 -0.7 -1.2 -1.8 -3.7Primary deficit 0.7 2.6 2.2 1.5 0.8 0.2 0.0 -0.3 -0.9 1.3
Primary (noninterest) revenue and gra27.2 27.7 28.0 25.6 26.4 26.6 27.1 27.6 28.0 161.2Primary (noninterest) expenditure 27.9 30.3 30.2 27.1 27.2 26.8 27.1 27.3 27.1 162.5
Automatic debt dynamics 5/ -0.4 -1.3 2.8 -2.2 0.1 -0.5 -0.6 -0.9 -0.9 -4.9Interest rate/growth differential 6/ -0.3 -0.9 1.2 -2.2 0.1 -0.5 -0.6 -0.9 -0.9 -4.9
Of which: real interest rate 2.0 1.7 2.7 0.5 2.0 2.0 2.0 1.9 1.9 10.4Of which: real GDP growth -2.3 -2.6 -1.4 -2.7 -1.9 -2.6 -2.7 -2.7 -2.8 -15.4
Exchange rate depreciation 7/ 0.0 -0.4 1.6 … … … … … … …Other identified debt-creating flows -0.5 0.0 0.2 0.0 0.0 0.0 0.0 0.0 0.0 0.0
CG: Privatization Proceeds (negative) -0.5 0.0 0.2 0.0 0.0 0.0 0.0 0.0 0.0 0.0Contingent liabilities 0.0 0.0 0.0 0.0 0.0 0.0 0.0 0.0 0.0 0.0(Specify) 0.0 0.0 0.0 0.0 0.0 0.0 0.0 0.0 0.0 0.0
Residual, including asset changes 8/ 0.2 2.0 -3.3 0.9 -0.1 -0.1 -0.1 -0.1 -0.1 0.3
Source: IMF staff.
1/ Public sector is defined as central government.
2/ Based on available data.
3/ Bond Spread over U.S. Bonds. Moody's credit rating is unsolicited.4/ Defined as interest payments divided by debt stock at the end of previous year.
5/ Derived as [(r - p(1+g) - g + ae(1+r)]/(1+g+p+gp)) times previous period debt ratio, with r = interest rate; p = growth rate of GDP deflator; g = real GDP growth rate;
a = share of foreign-currency denominated debt; and e = nominal exchange rate depreciation (measured by increase in local currency value of U.S. dollar).6/ The real interest rate contribution is derived from the denominator in footnote 4 as r - π (1+g) and the real growth contribution as -g.
7/ The exchange rate contribution is derived from the numerator in footnote 2/ as ae(1+r).
8/ For projections, this line includes exchange rate changes during the projection period.
9/ Assumes that key variables (real GDP growth, real interest rate, and other identified debt-creating flows) remain at the level of the last projection year.
Figure 1. Morocco: Public Sector Debt Sustainability Analysis (DSA) - Baseline Scenario
-1.0balance 9/
primary
(in percent of GDP unless otherwise indicated)
Debt, Economic and Market Indicators 1/
2004-2012Actual
Projections
Contribution to Changes in Public DebtProjections
2004-2012Actual
debt-stabilizing
-20
-15
-10
-5
0
5
10
15
cumulative-8
-6
-4
-2
0
2
4
6
8
10
2004 2005 2006 2007 2008 2009 2010 2011 2012 2013 2014 2015 2016 2017 2018 2019 2020
Debt-Creating Flows
Primary deficit Real GDP growth Real interest rateExchange rate depreciation Other debt-creating flows ResidualChange in gross public sector debt
projection
(in percent of GDP)

MOROCCO
INTERNATIONAL MONETARY FUND 35
Baseline Scenario 2015 2016 2017 2018 2019 2020 Historical Scenario 2015 2016 2017 2018 2019 2020Real GDP growth 4.7 3.1 4.2 4.4 4.6 4.7 Real GDP growth 4.7 4.4 4.4 4.4 4.4 4.4Inflation 3.7 1.2 1.1 1.3 1.5 1.5 Inflation 3.7 1.2 1.1 1.3 1.5 1.5Primary Balance -1.5 -0.8 -0.2 0.0 0.3 0.9 Primary Balance -1.5 -1.1 -1.1 -1.1 -1.1 -1.1Effective interest rate 4.7 4.6 4.5 4.7 4.8 4.9 Effective interest rate 4.7 4.6 5.0 5.3 5.7 5.6
Constant Primary Balance ScenarioReal GDP growth 4.7 3.1 4.2 4.4 4.6 4.7Inflation 3.7 1.2 1.1 1.3 1.5 1.5Primary Balance -1.5 -1.5 -1.5 -1.5 -1.5 -1.5Effective interest rate 4.7 4.6 4.9 5.1 5.4 5.3
Source: IMF staff.
Underlying Assumptions(in percent)
Figure 2. Morocco: Public DSA - Composition of Public Debt and Alternative Scenarios
Alternative Scenarios
Composition of Public Debt
Baseline Historical Constant Primary Balance
54
56
58
60
62
64
66
68
70
2013 2014 2015 2016 2017 2018 2019 2020
Gross Nominal Public Debt(in percent of GDP)
projection0
5
10
15
20
25
2013 2014 2015 2016 2017 2018 2019 2020
Public Gross Financing Needs(in percent of GDP)
projection
0
10
20
30
40
50
60
70
2004 2006 2008 2010 2012 2014 2016 2018 2020
By Maturity
Medium and long-term
Short-term
projection
(in percent of GDP)
0
10
20
30
40
50
60
70
2004 2006 2008 2010 2012 2014 2016 2018 2020
By Currency
Local currency-denominatedForeign currency-denominated
projection
(in percent of GDP)

MOROCCO
36 INTERNATIONAL MONETARY FUND
Figure 3. Morocco: Public DSA—Realism of Baseline Assumptions

MOROCCO
INTERNATIONAL MONETARY FUND 37
Figure 4. Morocco: Public DSA—Stress Tests
Primary Balance Shock 2015 2016 2017 2018 2019 2020 Real GDP Growth Shock 2015 2016 2017 2018 2019 2020Real GDP growth 4.7 3.1 4.2 4.4 4.6 4.7 Real GDP growth 4.7 1.6 2.6 4.4 4.6 4.7Inflation 3.7 1.2 1.1 1.3 1.5 1.5 Inflation 3.7 0.8 0.8 1.3 1.5 1.5Primary balance -1.5 -2.2 -1.6 0.0 0.3 0.9 Primary balance -1.5 -1.3 -1.2 0.0 0.3 0.9Effective interest rate 4.7 4.6 5.0 5.2 5.4 5.3 Effective interest rate 4.7 4.6 4.9 5.2 5.4 5.3
Real Interest Rate Shock Real Exchange Rate ShockReal GDP growth 4.7 3.1 4.2 4.4 4.6 4.7 Real GDP growth 4.7 3.1 4.2 4.4 4.6 4.7Inflation 3.7 1.2 1.1 1.3 1.5 1.5 Inflation 3.7 4.5 1.1 1.3 1.5 1.5Primary balance -1.5 -0.8 -0.2 0.0 0.3 0.9 Primary balance -1.5 -0.8 -0.2 0.0 0.3 0.9Effective interest rate 4.7 4.6 5.3 5.6 6.0 6.0 Effective interest rate 4.7 4.7 4.8 5.1 5.3 5.2
Combined ShockReal GDP growth 4.7 1.6 2.6 4.4 4.6 4.7Inflation 3.7 0.8 0.8 1.3 1.5 1.5Primary balance -1.5 -2.2 -1.6 0.0 0.3 0.9Effective interest rate 4.7 4.7 5.3 5.6 5.9 5.9
Adverse ScenarioReal GDP growth 4.7 1.5 2.6 2.8 3.0 3.1Inflation 3.7 1.2 1.1 1.3 1.5 1.5Primary balance -1.5 -2.8 -2.1 1.1 0.9 0.5Effective interest rate 4.7 4.6 5.1 5.4 5.4 5.3
Source: IMF staff.
Macro-Fiscal Stress Tests
Baseline Primary Balance ShockReal GDP Growth Shock
Real Interest Rate Shock
(in percent)
Real Exchange Rate Shock
Combined Macro-Fiscal Shock
Additional Stress Tests
Baseline
Underlying Assumptions
Adverse Scenario
58
60
62
64
66
68
70
2015 2016 2017 2018 2019 2020
Gross Nominal Public Debt(in percent of GDP)
200
210
220
230
240
250
260
270
2015 2016 2017 2018 2019 2020
Gross Nominal Public Debt(in percent of Revenue)
0
2
4
6
8
10
12
14
16
2015 2016 2017 2018 2019 2020
Public Gross Financing Needs(in percent of GDP)
58
60
62
64
66
68
70
72
74
2015 2016 2017 2018 2019 2020
Gross Nominal Public Debt(in percent of GDP)
200
210
220
230
240
250
260
270
280
2015 2016 2017 2018 2019 2020
Gross Nominal Public Debt(in percent of Revenue)
0
2
4
6
8
10
12
14
16
18
2015 2016 2017 2018 2019 2020
Public Gross Financing Needs(in percent of GDP)

MOROCCO
38 INTERNATIONAL MONETARY FUND
Figure 5. Morocco: Public DSA—Risk Assessment
Morocco
Source: IMF staff.
Primary Balance Shock
Debt Profile Vulnerabilities
3/ The cell is highlighted in green if country value is less than the lower risk-assessment benchmark, red if country value exceeds the upper risk-assessment benchmark, yellow if country value is between the lower and upper risk-assessment benchmarks. If data are unavailable or indicator is not relevant, cell is white. Lower and upper risk-assessment benchmarks are:
Change in the Share of Short-
Term Debt
Exchange Rate Shock
Contingent Liability shock
Debt level 1/
200 and 600 basis points for bond spreads; 5 and 15 percent of GDP for external financing requirement; 0.5 and 1 percent for change in the share of short-term debt; 15 and 45 percent for the public debt held by non-residents; and 20 and 60 percent for the share of foreign-currency denominated debt.
Foreign Currency
Debt
Public Debt Held by Non-
Residents
(Indicators vis-à-vis risk assessment benchmarks)
Market Perception
Gross financing needs 2/ Primary Balance Shock
Real Interest Rate Shock
Exchange Rate Shock
Contingent Liability Shock
4/ An average over the last 3 months, 20-Aug-15 through 18-Nov-15.
Real GDP Growth Shock
2/ The cell is highlighted in green if gross financing needs benchmark of 15 percent is not exceeded under the specific shock or baseline, yellow if exceeded under specific shock but not baseline, red if benchmark is exceeded under baseline, white if stress test is not relevant.
1/ The cell is highlighted in green if debt burden benchmark of 70 percent is not exceeded under the specific shock or baseline, yellow if exceeded under specific shock but not baseline, red if benchmark is exceeded under baseline, white if stress test is not relevant.
Real Interest Rate Shock
External Financing
Requirements
Real GDP Growth Shock
Heat Map
Upper early warning
Evolution of Predictive Densities of Gross Nominal Public Debt(in percent of GDP)
Debt profile 3/
Lower early warning
20
6024%
1 2
200
600120 bp
1 2
5
157%
1 2
0.5
1
-3%
1 2
Bond Spread over U.S. Bonds
External Financing Requirement
Annual Change in Short-Term Public
Debt
Public Debt in Foreign Currency
(in basis points) 4/ (in percent of GDP) (in percent of total) (in percent of total)
0
10
20
30
40
50
60
70
80
2013 2014 2015 2016 2017 2018 2019 2020
10th-25th 25th-75th 75th-90thPercentiles:Baseline
Symmetric Distribution
0
10
20
30
40
50
60
70
80
Restricted (Asymmetric) Distribution
no restriction on the growth rate shockno restriction on the interest rate shock0 is the max positive pb shock (percent GDP)no restriction on the exchange rate shock
Restrictions on upside shocks:
15
4524%
1 2
Public Debt Held by Non-Residents
(in percent of total)

MOROCCO
INTERNATIONAL MONETARY FUND 39
Annex II. External Sector Assessment
External stability has further strengthened in 2015 as the current account has improved, external debt has remained low and the reserve position has strengthened. However, challenges remain as the global economic environment remains fragile.
Improvements in the current account over the last few years have brought the exchange rate back in line with its fundamentals (Box 1). The External Balance Assessment, based on 2015 data, indicates that the dirham is broadly in line with fundamentals. The current account method shows that the current account gap relative to norm is 0.6 percent of GDP, corresponding to an undervaluation of about 2.0 percent of the dirham, and the external sustainability method indicates an undervaluation of 11.7 percent.1 However, the Real Effective Exchange Rate method shows an overvaluation of 9.1 percent of the dirham.2 Overall, the first two methods, which were used in past reports, have shown significant realignment of the dirham with fundamentals over the last two years. On balance, staff estimates that the dirham is now in line with fundamentals.
The external position continues to improve. Reserves in months of prospective imports of goods and services are projected to rise from 6.1 months at end-2014 to 6.7 at end-2015. This is equivalent to reserves rising from 94.2 percent of the Assessing Reserve Adequacy (ARA) metric at end-2014 to 110.7 percent of the metric at end-2015 (153.8 percent of the metric when factoring in existing capital account restrictions). External debt is sustainable and is projected to reach 32.5 percent of GDP at end-2015 before gradually declining to 29.0 percent of GDP over the medium term. However, a 30-percent depreciation would result in a significant increase in debt relative to GDP.
Capital flows have remained strong, and Morocco’s net international investment liability position started to improve in 2015. FDI flows are robust and are supporting the development of new export sectors as well as the real estate sector. In recent years, portfolio flows are dominated by the government bond issuances and those by the national phosphate company (including €1 billion Eurobonds in April 2015). At the same time, the strengthening reserve position, which is expected to continue in the medium-term, has helped improve the international
1 This result is sensitive to the NFA benchmark used. In this case, the benchmark is the actual 2014 NFA of -66 percent of GDP, which is arguably too loose as the NFA has deteriorated substantially over the last few years. However, even using a more conservative NFA, such as that at the beginning of the first PLL program (-58 percent), the overall assessment would not change. 2 This approach was not estimated for Morocco in the past because of the lack of data on the home bias variable (share of domestic debt detained by residents/non-residents). The limited time series used for the estimation this time may affect the robustness of the results.
-100
-80
-60
-40
-20
+0
+20
+40
2009 2010 2011 2012 2013 2014 2015 2016 2017 2018 2019
Morocco: Composition of Net International
Investment Position (percent of GDP)
FDI Portfolio investments
Other investments International reserves
NIIP

MOROCCO
40 INTERNATIONAL MONETARY FUND
investment liability position: after deteriorating from -50 percent of GDP in 2010 to -67 percent of GDP in 2014, it is projected to decline to -64 at end-2015 and -56 percent of GDP over the medium-term.
Challenges remain as the global economic environment remains fragile. While oil prices are low, risk of higher oil price volatility remain substantial, and such volatility would adversely affect Morocco’s current account and reserve positions. In addition, if stress reemerges in advanced countries and growth disappoints in the Euro Area, Moroccan exports, remittances and tourism would be lower. Volatility in international financial markets would also limit the opportunity the Moroccan sovereign and private sector to borrow at a low cost in the international markets. All these risks suggest that the authorities should continue their effort to strengthen the resilience of the economy to external shocks. In particular, more should be done on the front of subsidies reform, the diversification of energy sources, and the diversification of the export products and destinations.

MOROCCO
INTERNATIONAL MONETARY FUND 41
Box 1. Morocco: Exchange Rate Assessment
The EBA indicates that the dirham is in line with its fundamentals. The Current Account (CA) approach of the IMF’s External Balance Assessment (EBA) methodology points to a current account gap of 0.6 percent of GDP (as compared to 3.0 for the 2014 assessment). This is equivalent to an undervaluation of the dirham by 2 percent. The External Sustainability (ES) approach indicates an 11.7 percent undervaluation of the dirham, while the Real Effective Exchange Rate (REER) approach shows an overvaluation of 9.1 percent. While the results indicate a rebalancing of the exchange rate, which was assessed as overvalued in past years, the improvement needs to be sustained by continued reduction of the fiscal and health policies gaps (as shown by the CA approach).
2015(1) Cyclically-adjusted CA -2.9(2) Current account "norm" -3.4(3)=(1)-(2) Current account "gap" 0.6
Contribution of identified policy gaps(4) Fiscal policy -0.5(5) Social policy (health expenditure) -0.4(6) Reserve policy 0.9(7) Financial policy (credit) 0.2(8) Capital controls 0.9(9)=(4)+(5)+(6)+(7)+(8) Total 1.1
(10)=(3)-(9) Residual -0.5
(11) Elasticity of CA/REER 0.3(12)=-(3)/(11) Corresponding REER "gap" -2.0%
(1) NFA benchmark (end-2014 NFA) -66.8(2) 2020 CA/GDP -1.6(2) 2020 CA/GDP adjusted for multilateral consistency -1.4(3) CA/GDP stabilizing NFA at benchmark -4.7(4)=(2)-(3) CA/GDP "gap" 3.3(5) Elasticity of CA/REER 0.3(6)=-(4)/(5) Corresponding REER "gap" -11.7%
(Percent)
(1) REER (end-2015, in log) 4.6(2) Estimated REER (end-2015, in log) 4.4(3)= (1)-(2) Residual 0.13
Contribution of identified policy gaps(4) Health 0.01
(5) Capital controls -0.11
(6) Reserve -0.03
(7) Private credit -0.01
(8) Real interest rate 0.11
(9)=(4)+(5)+(6)+(7)+(8) Total -0.04
(10)= (9)+(3) Total REER gap 9.1%
Summary of the External Sustainability (ES)Method's Findings(Percent of GDP)
Summary of the Real Effective Exchange Rate (REER) Method's Findings
Summary of the Current Account (CA) Method's Findings(percent of GDP)

MOROCCO
42 INTERNATIONAL MONETARY FUND
Box 2. Morocco: External Stress Index Overall assessment. The external stress index for Morocco indicates that the external pressure faced by the country has abated in recent years. However, as shown in the downside scenario, external risks remain substantial for Morocco.
Background. The external stress index is an indicator of the evolution of the external environment faced by a particular country.1 The index is based on: (i) a consideration of the key external risks facing Morocco; (ii) the selection of proxy variables capturing these risks; and (iii) the choice of the weights to apply to each of these variables.
Risks. The main external risks for Morocco, as explained in detail in the 2014 PLL arrangement request and further updated according to the latest Global Risk Assessment Matrix (G-RAM), are (i) a structurally weak growth in key advanced economies, in particular the Euro area, resulting in lower exports, FDI, tourism and remittances; (ii) an increase in volatility of energy prices due to uncertainty about the persistence of the oil supply shock and the underlying drivers of the price decline; and (iii) tighter or more volatile global financial conditions.2
Variables. (i) Lower exports, FDI and remittances from Europe are captured by growth in the Euro area, the main trading partner of Morocco (representing more than 50 percent of trade, FDI and remittances); (ii) higher oil imports are captured by oil prices; and (iii) the impact of global financial volatility on Morocco are proxied by the emerging markets volatility index (VXEEM).
Weights. We used a data-based approach to determine the weight of each variable. Under this method, weights are determined by the economic size of the respective balance of payments items that are vulnerable to respective risks, relative to the overall size of the economy.
Baseline scenario. The baseline projections are based on WEO baseline projections for growth in Europe and oil prices. The VXEEM is assumed unchanged from its level of September 14, 2015.
Downside scenario. The downside scenario is in line with those from the most recent IMF spillover reports. The 2013 spillover report estimates that a slowdown in the euro area could result in the GDP level in the euro area being 4 percent below baseline after four years. The 2014 spillover report estimates that geopolitical crises could result in oil prices being 25 percent above baseline.
1 See “The Review of The Flexible Credit Line, The Precautionary and Liquidity Line, And the Rapid Financing Instrument” at: http://www.imf.org/external/np/pp/eng/2014/043014.pdf.
2 2014 PLL arrangement request: http://www.imf.org/external/pubs/cat/longres.aspx?sk=41818.0
-2.50
-2.00
-1.50
-1.00
-0.50
0.00
0.50
1.00
Jan-07
Apr-0
7
Jul-0
7
Oct-0
7
Jan-08
Apr-0
8
Jul-0
8
Oct-0
8
Jan-09
Apr-0
9
Jul-0
9
Oct-0
9
Jan-10
Apr-1
0
Jul-1
0
Oct-1
0
Jan-11
Apr-1
1
Jul-1
1
Oct-1
1
Jan-12
Apr-1
2
Jul-1
2
Oct-1
2
Jan-13
Apr-1
3
Jul-1
3
Oct-1
3
Apr-1
4
Oct-1
4
2015
2016
Morocco - External Stress Indicator
Baseline Downside
External risks External Proxy Variable Weights
Lower exports to the Euro areaLower FDI from the Euro area Euro Area growth 0.50Lower tourism from the Euro areaLower remittances from the Euro area
Higher oil import Change in oil price -0.40
Equity portfolio investment stock Emerging market implied volatility (VXEEM) -0.09

MOROCCO
INTERNATIONAL MONETARY FUND 43
Figure 1. Morocco: External Debt Sustainability: Bound Tests 1/ 2/ (External debt in percent of GDP)
i-rate shock 30
Baseline 30
0
5
10
15
20
25
30
35
40
45
50
55
2010 2012 2014 2016 2018 2020
Interest Rate Shock (Percent)
Sources: IMF country desk data, and IMF staff estimates.1/ Shaded areas represent actual data. Individual shocks are permanent one-half standard deviation shocks. Figures in the boxes represent average projections for the respective variables in the baseline and scenario being presented. Ten-year historical average for the variable is also shown. 2/ For historical scenarios, the historical averages are calculated over the ten-year period, and the information is used to project debt dynamics five years ahead.3/ Permanent 1/4 standard deviation shocks applied to real interest rate, growth rate, and current account balance.4/ One-time real depreciation of 30 percent occurs in 2015.
Historical
48Baseline
30
0
2
4
6
8
10
12
0
5
10
15
20
25
30
35
40
45
50
55
2010 2012 2014 2016 2018 2020
Baseline and Historical Scenarios
CA shock
37
Baseline 30
0
5
10
15
20
25
30
35
40
45
50
55
2010 2012 2014 2016 2018 2020
Combined shock
34
Baseline 30
0
5
10
15
20
25
30
35
40
45
50
55
2010 2012 2014 2016 2018 2020
Combined Shock 3/
30 % depreciation
44
Baseline 30
0
5
10
15
20
25
30
35
40
45
50
55
2010 2012 2014 2016 2018 2020
Real Depreciation Shock 4/
Gross financing need under baseline
(right scale)
Non-interest Current Account Shock (Percent of GDP)
Grow th shock
31
Baseline 30
0
5
10
15
20
25
30
35
40
45
50
55
2010 2012 2014 2016 2018 2020
Growth Shock (Percent per year)
Baseline:
Scenario:
Historical:
3.1
3.4
3.6
Baseline:
Scenario:
Historical:
4.2
3.4
4.4
Baseline:
Scenario:
Historical:
-0.6
-2.1
-4.3
MOROCCO
MOROCCO STAFF REPORT FOR THE 2015 ARTICLE IV CONSULTATION—
INFORMATIONAL ANNEX
Prepared By
The Middle East and Central Asia Department
(in consultation with other departments)
RELATIONS WITH THE FUND _______________________________________________________________ 2
RELATIONS WITH THE WORLD BANK GROUP _____________________________________________ 5
STATISTICAL ISSUES ________________________________________________________________________ 7
CONTENTS
November 30, 2015

MOROCCO
2 INTERNATIONAL MONETARY FUND
RELATIONS WITH THE FUND
(As of November 9, 2015)
Membership Status
Joined April 25, 1958; Article VIII
General Resources Account
SDR Million Percent Quota
Quota 588.20 100.00
Fund holdings of currency 517.75 88.02
Reserve position in Fund 70.46 11.98
SDR Department
SDR
Million
Percent
Allocation
Net cumulative allocation 561.42 100.00
Holdings 550.47 98.05
Outstanding Purchases and Loans
None
Latest Financial Arrangements (In millions of SDR)
Type
Date of
arrangement
Expiration
Date
Amount
Approved
Amount
Drawn
Precautionary and Liquidity Line 07/28/2014 07/27/2016 3,235.10 0.00
Precautionary and Liquidity Line 08/03/2012 07/27/2014 4,117.40 0.00
Stand-By 01/31/1992 03/31/1993 91.98 18.40
Projected Payments to Fund
(SDR million; based on existing use of resources and present holdings of SDR):
Forthcoming
2014 2015 2016 2017 2018
Principal
Charges/interest
0.00 0.02 0.02 0.02 0.02
Total
0.00 0.02 0.02 0.02 0.02

MOROCCO
INTERNATIONAL MONETARY FUND 3
Exchange Rate Arrangement and Exchange System
Morocco maintains an exchange system that is free of restrictions on the making of payments and
transfers on current international transactions. However, Morocco maintains certain restrictions
relating to Iraq and the Federal Republic of Yugoslavia (Serbia and Montenegro), pursuant to UN
Security Council Resolutions. These are subject to notification to the Fund in accordance with
Decision 144 (52/51). The exchange rate is freely determined in the interbank foreign exchange
market, which was created in 1996. Bank Al-Maghrib (BAM) intervenes in the market to maintain the
exchange rate within its target range, defined around a fixed central rate. Morocco has a
conventional peg arrangement. The current exchange rate of the Moroccan dirham is pegged to a
basket of currencies comprising the euro and the U.S. dollar, with respective weights of 60 percent
and 40 percent. BAM fixes daily rates for the rated currencies on the basis of variations on the value
of the basket. Rates for most currencies quoted in Morocco are established on the basis of the daily
dirham-euro rate and the cross rates for those currencies in relation to the euro in the international
exchange markets. As of November 9, 2015, the SDR/dirham exchange rate was SDR 1=MAD 13.74.
Article IV Consultation
Morocco is on the standard 12-month cycle. The last Article IV consultation was concluded by the
Executive Board on February 23, 2015. The discussions for the 2015 consultation were held in Rabat
and Casablanca during October 21–November 4, 2015.
Technical Assistance
STA Monetary and Financial Statistics March 1–March 11, 2010
MCM Stress Testing and Macroprudential Analysis February 9–February 18, 2011
STA
LEG
LEG
Monetary and Financial Statistics
Anti-Money Laundering / Combating the Financing
of Terrorism (AML/CFT) Diagnostic and Legislative
Drafting
AML/CFT Supervision
March 30–April 12, 2011
January 17–21, 2011 and
September 26–30, 2011
May 28–June 6, 2012
MCM Strengthening Macroprudential Analysis. June 21–29, 2012
MCM
LEG
Diagnostic assessment of capital markets in Morocco
(jointly with the Arab Monetary Fund and G8
Deauville Partnership Initiative for Local Currency
Capital Market Development in the MENA region)
AML/CFT Supervision
March 5–14, 2013
March 3–15, 2013
FAD Transfer pricing mission April 1–12, 2013
MCM Local government sukuk market June 2013
FAD Implementation of budgetary reforms and organic
budget law preparation
July 8–18, 2013
MCM
LEG
STA
Macro-economic modeling
AML/CFT Supervision
Leverage the OpenData Platform for data reporting
September 11–26, 2013
November 3–16, 2013
January 2014

MOROCCO
4 INTERNATIONAL MONETARY FUND
LEG
RES/ICD
MCM/MCD
AFR/MCM/MCD
RES/ICD
RES/ICD
MCM
RES/ICD
MCM
RES/ICD
RES/ICD
AML/CFT: Structures and Tools
Improving monetary frameworks – inflation targeting
Exchange rate flexibility
Pan-African cross-border banks exercise
Improving monetary frameworks – inflation targeting
Improving monetary frameworks – inflation targeting
Exchange rate flexibility
Improving monetary frameworks – inflation targeting
Development of macro prudential instruments
Improving monetary frameworks – inflation targeting
Improving monetary frameworks – inflation targeting
January 2014
March 27–April 14, 2014
May 26–30, 2014
June 2–6, 2014
June 2014
July 2014
September 15–19, 2014
September 22–October 3, 2014
November 3–14, 2014
May, 2015
September, 2015
FSAP update
The latest update of the Financial Sector Assessment was performed in April 2015. The findings
were discussed with the authorities during the October/November 2015 Article IV mission and
discussed by the Board on December 14, 2015.
Safeguard assessment
An update of the 2013 safeguards assessment of the BAM, completed in January 2015, found that
the safeguards framework at the BAM remains relatively strong. The Board continues to be engaged
and governance arrangements are supported by strong internal audit and risk management
functions. A new law on BAM statutes that would lead to sustained good governance practices and
autonomy remain in progress. In this regard, the authorities prepared draft amendments to the
central bank law, and progress is underway to strengthen financial reporting practices.
Resident Representative: None
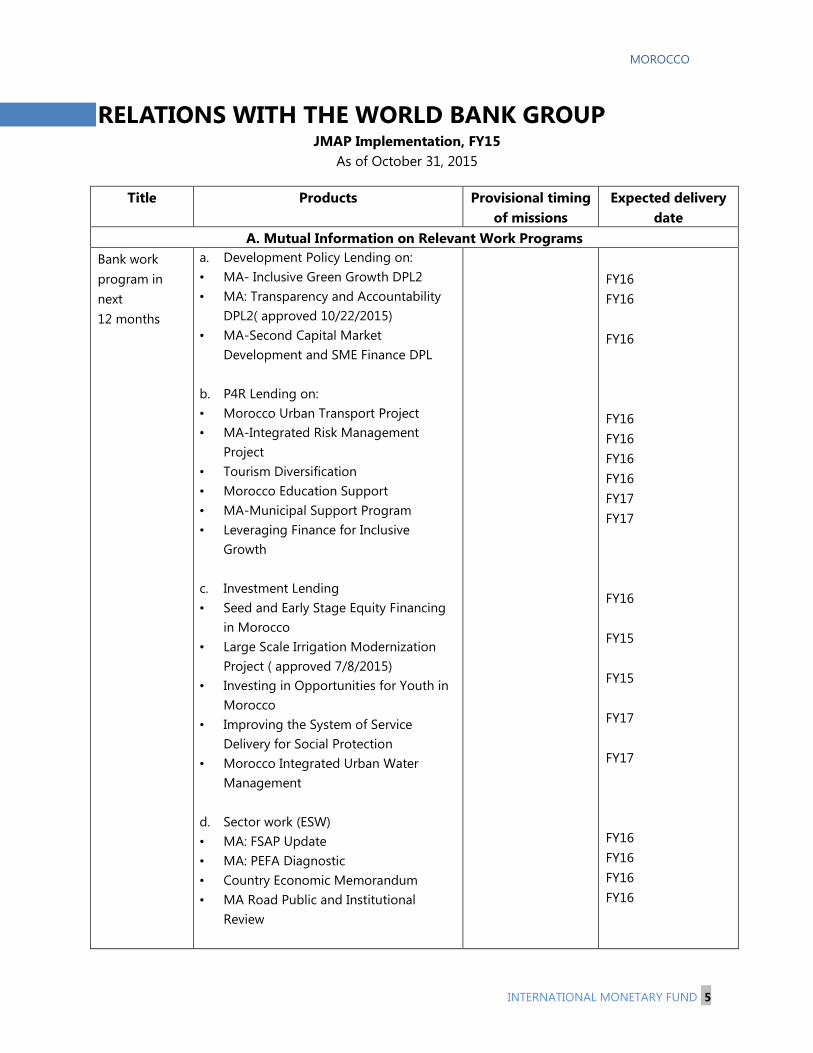
MOROCCO
INTERNATIONAL MONETARY FUND 5
RELATIONS WITH THE WORLD BANK GROUP JMAP Implementation, FY15
As of October 31, 2015
Title Products Provisional timing
of missions
Expected delivery
date
A. Mutual Information on Relevant Work Programs
Bank work
program in
next
12 months
a. Development Policy Lending on:
• MA- Inclusive Green Growth DPL2
• MA: Transparency and Accountability
DPL2( approved 10/22/2015)
• MA-Second Capital Market
Development and SME Finance DPL
b. P4R Lending on:
• Morocco Urban Transport Project
• MA-Integrated Risk Management
Project
• Tourism Diversification
• Morocco Education Support
• MA-Municipal Support Program
• Leveraging Finance for Inclusive
Growth
c. Investment Lending
• Seed and Early Stage Equity Financing
in Morocco
• Large Scale Irrigation Modernization
Project ( approved 7/8/2015)
• Investing in Opportunities for Youth in
Morocco
• Improving the System of Service
Delivery for Social Protection
• Morocco Integrated Urban Water
Management
d. Sector work (ESW)
• MA: FSAP Update
• MA: PEFA Diagnostic
• Country Economic Memorandum
• MA Road Public and Institutional
Review
FY16
FY16
FY16
FY16
FY16
FY16
FY16
FY17
FY17
FY16
FY15
FY15
FY17
FY17
FY16
FY16
FY16
FY16

MOROCCO
6 INTERNATIONAL MONETARY FUND
• MA: Cost of Environmental
Degradation
• MA: Trade and Competitiveness
e. Technical assistance (TA)
• MA: GAC in Moroccan Health MIS
• MA Health Coverage TA
• MA: Urban Logistics TA
• MA - Climate Change Adaptation for
Roads
• MA Broadband and ICT Sector
Development
• MA: RAS Establish. Mor Inv. Authority
• MA: #A032 Oversight
• MA: #A062 Supervision
• MA: #A061 Capital Market Legal
• MA: Wealth Accounting
• IUWM in MA: A Review of Options
• MA-Subsidy Reform and Cash Transfer
Prog
• MA: Int. Urban Water Mgmt Strategic
Sup
• Morocco Performance Based
Maintenance
FY16
FY16
FY16
FY16
FY16
FY16
FY16
FY16
FY16
FY15
FY16
FY16
FY16
FY16
FY16
IMF work
program in
next
12 months
TA mission LEG AML/CFT Supervision
TA mission STA Open Data Platform for
data reporting to STA
Staff Visit
TA mission MCM Exchange Rate
TA mission on macro-economic modeling
FSAP mission
January 13-25, 2014
January 23-29, 2014
Spring 2014
Spring 2014
First half 2014
Autumn 2014
MO
RO
CC
O

MOROCCO
INTERNATIONAL MONETARY FUND 7
B. Requests for Work Program Inputs
Fund request
to Bank
Developments on subsidies and pension
reforms
Developments on decentralization
As needed
As needed
Bank request
to Fund
Assessment of macroeconomic stance and
prospects
Request for assessment letters to DPLs
Data sharing
Semiannual (and on
ad hoc basis if
requested)
At least 4 operations
predicted
Ongoing
Following Article IV
and staff visits for
PLL reviews
C. Agreement on Joint Products and Missions
Joint products
in next
12 months
Continuous close coordination on the
reform agenda
Ongoing
STATISTICAL ISSUES
As of December 3, 2014
I. Assessment of Data Adequacy for Surveillance
General: Data provision is adequate to conduct effective surveillance.
National accounts: Real sector data are adequate for surveillance.
Government finance statistics: Fiscal data are adequate for surveillance.
Balance of payments statistics: External sector data are adequate for surveillance.
Monetary and financial statistics: They are adequate for surveillance.
II. Data Standards and Quality
Morocco has been a SDDS subscriber since
December 2005.
The results of a data ROSC mission were
published in April 2003 (Country Report
No. 03/92).

Morocco—Table of Common Indicators Required for Surveillance (As of November 25, 2015)
Date of latest
observation Date received
Frequency of
Data7
Frequency
of
Reporting7
Frequency
of
publication7
Memo items
Data Quality –
Methodological
soundness8
Data Quality –
Accuracy and
reliability9
Exchange Rates 11/9/15 11/9/15 D D D
International Reserve Assets and Reserve Liabilities of
the Monetary Authorities1
10/30/15 1/06/15 W W W
Reserve/Base Money 10/31/15 11/05/15 M M M LO, O, LNO, LO LO, LO, O, O, LO
Broad Money 10/31/15 11/05/15 M M M
Central Bank Balance Sheet 10/31/15 11/05/15 M M M
Consolidated Balance Sheet of the Banking System 10/31/15 11/05/15 M M M
Interest Rates2
11/9/15 11/9/15 D D D
Consumer Price Index 11/30/14 12/23/14 M M M O, LO, O, O LO, LO, O, O, O
Revenue, Expenditure, Balance and Composition of
Financing3 – General Government
4
2014 01/30/15 A A A LO, LNO, LO, O O, O, O, O, LO
Revenue, Expenditure, Balance and Composition of
Financing3– Budgetary Central Government
09/30/15 10/30/15 M M M
Stocks of Central Government and Central
Government-Guaranteed Debt5
Q3, 2015 10/30/15 Q Q Q
External Current Account Balance Q2, 2015 9/01/15 Q Q Q LO, LO, LO, LO LO, LO, O, LO, LNO
Exports and Imports of Goods and Services 09/30/15 10/15/15 M M M
GDP/GNP Q2, 2015 9/30/15 Q Q Q LO, LNO, LO, LO LNO, LO, O, O, LNO
Gross External Debt
Q3, 2015 10/30/15 Q Q Q
International Investment Position 6
2014 06/30/15 A A A
1 Any reserve assets that are pledged or otherwise encumbered should be specified separately. Also, data should comprise short-term liabilities linked to a foreign currency but settled by other means, as well as
the notional values of financial derivatives to pay and to receive foreign currency, including those linked to a foreign currency but settled by other means. 2 Both market-based and officially determined, including discount rates, money market rates, rates on treasury bills, notes, and bonds.
3 Foreign and domestic financing by instrument (currency and deposits, securities, loans, shares, and other accounts payable)
4 The general government consists of the central government (budgetary funds, extra budgetary funds, and social security funds) and state and local governments.
5 Including currency and maturity composition.
6 Includes external gross financial asset and liability positions vis-à-vis nonresidents.
7 Daily (D), Weekly (W), Monthly (M), Quarterly (Q), Annually (A); Irregular (I); Not Available (NA).
8 Reflects the assessment provided in the data ROSC published on April 4, 2003, and based on the findings of the mission that took place during January 16–30, 2002, for the dataset corresponding to the
variable in each row. The assessment indicates whether international standards concerning concepts and definitions, scope, classification/sectorization, and basis for recording are fully observed (O), largely
observed (LO), largely not observed (LNO), or not observed (NO).
MO
RO
CC
O
8
INTER
NA
TIO
NA
L MO
NETA
RY F
UN
D

Statement by Mohammed Daïri, Alternate Executive Director for Morocco
December 14, 2015
The Moroccan authorities thank staff for the fruitful exchange during the Article IV
Consultation discussions and the FSAP mission, and broadly agree with their assessment
and recommendations. In a still difficult external environment characterized by slow
growth in the euro area and regional insecurity problems affecting tourism and investor
confidence, the authorities continue to reduce vulnerabilities and strengthen the
foundations for stronger, private sector-led, and more inclusive and job-rich growth. In
this regard, they remain firmly committed to maintaining macroeconomic and financial
stability and further rebuilding fiscal and external buffers through sound policies,
strengthening of the policy framework, and further advancing the structural reform
agenda.
Recent Economic Developments and Outlook
The macroeconomic situation continues to improve. Growth in 2015 is estimated at
4.7 percent, reflecting a record cereal crop and a modest recovery in nonagricultural
production. After a decline in growth in 2016 with the return to more normal weather
conditions, ongoing strengthening of the euro area economy and continued reforms to
enhance productivity and potential output along with improved confidence would
improve the outlook, with Morocco’s growth expected to accelerate gradually to average
5 percent over the medium term. Average inflation is projected to remain low at
1.6 percent in 2015 and to stabilize thereafter at about 2 percent. The current account
deficit is projected to decline to 1.5 percent of GDP (from 5.7 percent in 2014 and
9.5 percent in 2012) and remain broadly at this level over the medium term. Reserves
continue to strengthen and should reach the equivalent of 6.7 months of imports of goods
and services, 111 percent of the normal ARA metric and 154 percent of the adjusted
ARA metric by end-2015, as against 6.1 months, 94 and 130 percent, respectively, in
2014. It is expected that reserves accumulation would continue over the medium term.
The significant improvement in the external position in 2015 owes much to the decline in
oil and food prices and lower cereal imports, notwithstanding lower tourism receipts. It
also reflects continued strong phosphates and automobiles exports and workers’
remittances, as well as robust FDI, which financed 160 percent of the current account
deficit. As a result, the external debt-to-GDP ratio declined from 29.6 percent in 2014 to
29.2 percent. It is expected that the external position will continue to strengthen and
external vulnerabilities to decline as a result of the ongoing diversification of the
economy, with emergence of new dynamic export-oriented sectors, and strengthening of
traditional ones under the sector-specific development strategies recently adopted.

Despite this favorable economic performance, the high level of unemployment, in
particular for the youth and new graduates, remains a concern. Further, labor force
participation is low, especially for women. Moreover, while significant progress has been
made in improving human development indicators and reducing poverty and inequality,
much remains to be done in this area, including in reducing regional inequality and
empowering women and the underprivileged groups of the population.
Fiscal Developments and Policy
The authorities remain firmly committed to maintaining macroeconomic stability. They
intend to continue with fiscal consolidation to achieve their 3 percent of GDP deficit
target in 2017 by further strengthening the tax system and improving expenditure
prioritization. Fiscal developments so far in 2015 are broadly in line with the
achievement of the 4.3 percent of GDP deficit target. Despite the tax revenue shortfall,
resulting from slower-than-expected nonagricultural growth, and lower grants, the
authorities are confident that lower subsidy and wage spending, along with stronger
revenue mobilization effort and tighter monitoring of other expenditures would help
maintain the deficit within target.
The 2016 draft budget seeks a further reduction of the deficit to 3.5 percent of GDP. It
contains a number of new revenue generating measures, including further steps in tax
reform to simplify the system and improve its performance in line with the
recommendations of the 2013 Assises Fiscales. It also maintains a prudent expenditure
policy, including on wages and subsidies, despite the complexity of the task in an election
year, which attests to the authorities’ strong resolve to pursue fiscal consolidation. In this
regard, the authorities are firmly determined to adopt the pension reform in 2016, with
implementation to start under the 2017 budget.
After its sharp increase during 2008–13, public debt-to-GDP ratio has stabilized since
2014 at 63-64 percent and should start declining in 2017 to reach 60 percent by 2020,
reflecting continued fiscal consolidation. In addition, debt management continues to be
improved to extend maturities and reduce costs, including through prudent borrowing
policies, careful balance between domestic and external borrowing, and mitigation of
interest rate and exchange rate risks.
Selected Issues Paper
The authorities thank staff for the papers and the presentations in Rabat. On Fiscal
Multipliers, the paper finds that they are small in Morocco as in other EMDCs. However,
the assessment was made for a period during which the economy was close to potential,
whereas it is now at below potential. As highlighted by Olivier Blanchard and Daniel
Leigh in WP/13/1, “fiscal multipliers associated with government spending can fluctuate

from being near zero in normal times to about 2.5 during recessions.” Therefore, the
paper’s conclusion that reducing public consumption would not affect growth may need
further substantiation. Moreover, it would have been useful to expand the analysis to tax
and investment multipliers in addition to those on public consumption.
On Efficiency of Spending on Education in Morocco, the paper recognizes that staff
findings are consistent with the authorities’ own diagnosis on the education system. A
strategic vision for education reform was announced in May this year, after several years
of diagnostics and discussions by a high level and broadly representative committee.
Several of the recommendations in the staff paper are also part of the strategy, including
improving efficiency and governance as well as teachers’ training. Other issues are of a
more complex nature, including reforming programs, curricula, pedagogical methods and
teachers’ ethics. A framework law (loi-cadre) will soon be prepared to formulate the
objectives of the reform strategy and the roadmap for its implementation. This being said,
the task of reforming education is a very complex one, in view of the various
constituencies involved and the long time horizon for reaching measurable results, and it
is important to garner broad support to the reform to maximize the likelihood of its
success.
Monetary and Exchange Rate Policies
In an environment of improving bank liquidity and modest credit growth, Bank Al
Maghrib has continued its accommodative policy and support to Very Small, Small and
Medium-Sized Enterprises (V-SMEs). In this regard, it is the authorities’ view that while
lending conditions have tightened as indicated in page 5 of the staff report, this was true
for some but not all sectors of the economy. The next meeting of BAM’s Council later
this month will provide the opportunity to reassess the policy stance in light of
developments in inflation and economic activity and related risks
The authorities agree with staff assessment that the small overvaluation estimated in
recent years has been corrected and that the exchange rate is now in line with
fundamentals. They are thankful to staff from MCM, Research, and MCD for their
technical assistance and advice in assessing the conditions and preparing for a transition
to a more flexible exchange rate regime and a new monetary policy framework. They
broadly agree with staff assessment that current conditions are propitious for such a
move, although additional work is needed to prepare private economic agents to this
important transition. The authorities intend to build on staff extensive work and thorough
discussions to finalize and reach consensus on an action plan in this area.

Financial Sector Developments and Policies
The recent Financial System Stability Assessment (FSSA) attests to the soundness and
resilience of the banking sector, the progress made in financial inclusion, and the
continued improvement in regulation and supervision in line with best international
practices. A new Banking Law was adopted in 2014, enhancing systemic risk
surveillance, and Basel III capital and liquidity requirements have been implemented.
The FSSA also highlights BAM’s efforts to strengthen oversight of cross-border
activities of Moroccan banks and improve coordination with host countries’ supervisors,
and finds that risks from such activities to the Moroccan banking system are limited. The
draft central bank law is at the last stage of finalization before its submission to the
government, which should happen soon. The new law should strengthen central bank
independence, governance, and supervisory powers and expand its mandate to include
contribution to financial stability.
The authorities broadly agree with the FSAP findings and recommendations. In his letter
to the Financial Counselor and Director of MCM last month, the Minister of Economy
and Finance reiterated the authorities’ appreciation for the high quality work and
pertinent recommendations and announced the creation of a committee grouping all
financial sector regulators with the task of drawing a roadmap for implementation of
these recommendations. The Minister also requested Fund technical assistance in the
areas of bank resolution, crisis management, macroprudential oversight and financial
inclusion.
Structural Reforms
Along with continued strengthening of the policy framework, the authorities are
cognizant of the crucial importance of further improving the business climate, reducing
labor market
rigidities, upgrading human resources, and ensuring equal access to quality public
services and financing, including for women. Implementation of the new Organic Budget
Law adopted in June 2015 will significantly strengthen the fiscal framework through a
fiscal rule and multi-year and results-based budgeting, enhance public financial
management and monitoring of fiscal policy, including by increasing transparency and
accountability, and help address remaining vulnerabilities in the budget process. The
Advanced Regionalization Program will be implemented starting in 2016. This program
aims at enhancing project selection and monitoring through budget devolution to elected
regional assemblies and promoting local resource mobilization. If well-designed, it could
contribute significantly to improving spending efficiency in a number of key areas,
including health and education, and reduce regional disparities.

Several reforms toward enhancing the business climate and improving governance have
been implemented over the past few years, which contributed to improving Morocco’s
rating under the Doing Business Indicators. In the fiscal area, in addition to the tax
measures aimed at reducing informality and distortions in the tax system and simplifying
procedures, a decree was adopted earlier this year to provide for timely reimbursement of
accumulated VAT credits which hinder the development of several businesses. A new
law on public-private partnerships was adopted, which should strengthen private sector
involvement in infrastructure development projects, while limiting risks to the budget in
line with best international practices. A new law was adopted in June establishing an
agency in charge of initiating, coordinating and overseeing government policies with
regard to preventing and fighting corruption and promoting good governance. The new
Prices and Competition Law and the Competition Council Law became effective this year
with the adoption of the relevant decrees, which should help create an enabling
environment for improved efficiency and productivity. In this regard, after elimination of
all subsidies to liquid petroleum products by end-2014, prices of these products were
fully liberalized at end-November 2015, as scheduled.
The authorities are cognizant of the key role of enhancing labor market flexibility and
improving education and training in reducing skill mismatches and promoting
employment. A national employment strategy has been announced recently, which would
help coordinate government actions in this area. Discussions on labor code reform have
been held with social partners, and are still ongoing. In the meantime, the authorities are
strengthening active labor market policies, with focus on training, reducing hiring costs,
and providing incentives to self-employment and very small enterprises. In this regard
vocational training programs under the OFPPT, and the active role played by the
employment intermediation agency (ANAPEC) throughout the country are helping
increase the employability of young job seekers.
Social Inclusion
The authorities pay particular attention to social inclusion and reducing inequality in their
development strategy. Implementation of various programs under the National Initiative
for Human Development (INDH) has benefitted close to 10 million people since its
inception in 2005, with an aggregate cost of $3 billion (of which 60 percent from the
INDH). These programs aim at strengthening capacity, facilitating access to
infrastructure and basic services, and promoting income generating activities. The
authorities continue to expand the coverage of and strengthen resources for social
protection programs under the Social Cohesion Fund, including the TAYSSIR
(conditional transfers for education) and RAMED (basic health coverage) programs, as
well as the recently-established assistance to widows in a precarious situation and persons
with special needs. Moreover, a multiyear rural development program with a total cost of
$5 billion was announced in July, aimed at better integrating remote areas to the rest of

the country through rural roads and other infrastructure and enhancing the provision of
basic services. The efficiency and targeting of these programs are expected to improve
under the ongoing regionalization program.
Conclusion
The authorities are encouraged by the progress achieved in strengthening the economy’s
fundamentals and maintaining broadly favorable performance in a generally still
unfavorable external environment. They have taken benefit of every available
opportunity to strengthen macroeconomic stability and advance the reform agenda to
achieve their goals of improved standards of living and increased inclusion, with close
attention to maintaining social peace and cohesion. They look forward to further fruitful
cooperation with the Fund.