Country Profile: The Kingdome of Morocco -...
14
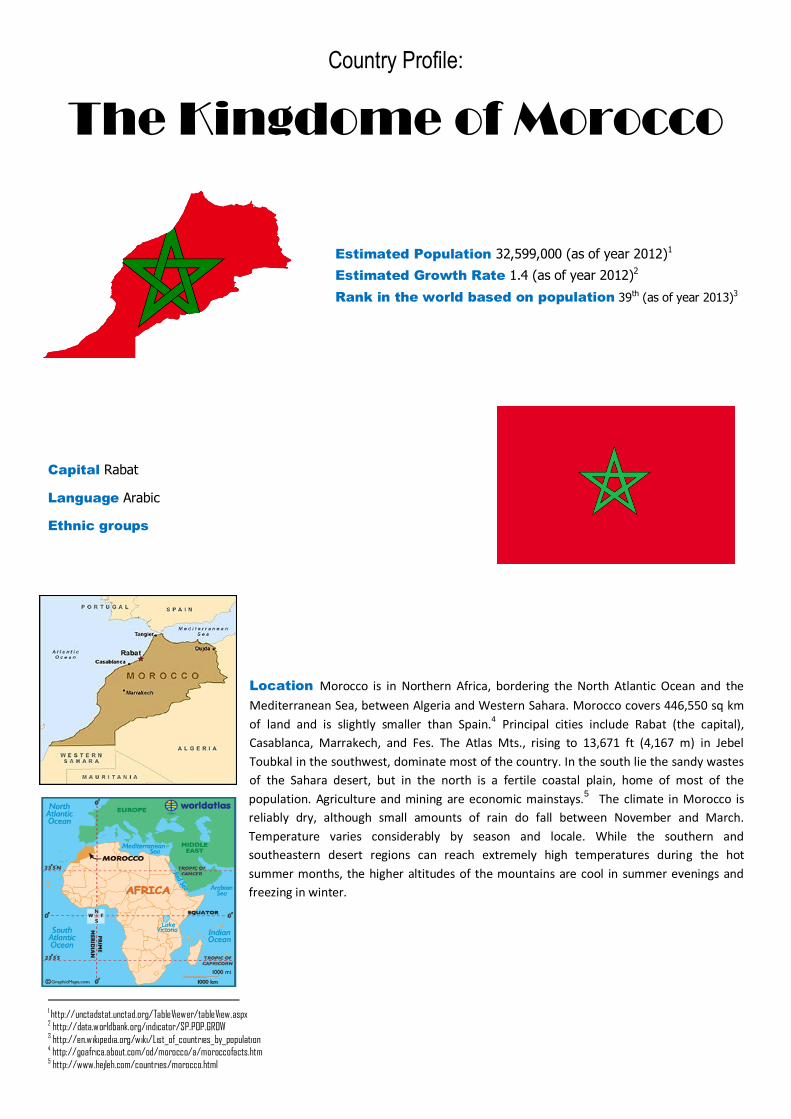
Country Profile: The Kingdome of Morocco Estimated Population 32,599,000 (as of year 2012) 1 Estimated Growth Rate 1.4 (as of year 2012) 2 Rank in the world based on population 39 th (as of year 2013) 3 Capital Rabat Language Arabic Ethnic groups Location Morocco is in Northern Africa, bordering the North Atlantic Ocean and the Mediterranean Sea, between Algeria and Western Sahara. Morocco covers 446,550 sq km of land and is slightly smaller than Spain. 4 Principal cities include Rabat (the capital), Casablanca, Marrakech, and Fes. The Atlas Mts., rising to 13,671 ft (4,167 m) in Jebel Toubkal in the southwest, dominate most of the country. In the south lie the sandy wastes of the Sahara desert, but in the north is a fertile coastal plain, home of most of the population. Agriculture and mining are economic mainstays. 5 The climate in Morocco is reliably dry, although small amounts of rain do fall between November and March. Temperature varies considerably by season and locale. While the southern and southeastern desert regions can reach extremely high temperatures during the hot summer months, the higher altitudes of the mountains are cool in summer evenings and freezing in winter. 1 http://unctadstat.unctad.org/TableViewer/tableView.aspx 2 http://data.worldbank.org/indicator/SP.POP.GROW 3 http://en.wikipedia.org/wiki/List_of_countries_by_population 4 http://goafrica.about.com/od/morocco/a/moroccofacts.htm 5 http://www.hejleh.com/countries/morocco.html
-
Upload
nguyennguyet -
Category
Documents
-
view
219 -
download
1
Transcript of Country Profile: The Kingdome of Morocco -...
Country Profile:
The Kingdome of Morocco
Estimated Population 32,599,000 (as of year 2012)1
Estimated Growth Rate 1.4 (as of year 2012)2
Rank in the world based on population 39th (as of year 2013)3
Capital Rabat
Language Arabic
Ethnic groups
Location Morocco is in Northern Africa, bordering the North Atlantic Ocean and the
Mediterranean Sea, between Algeria and Western Sahara. Morocco covers 446,550 sq km
of land and is slightly smaller than Spain.4 Principal cities include Rabat (the capital),
Casablanca, Marrakech, and Fes. The Atlas Mts., rising to 13,671 ft (4,167 m) in Jebel
Toubkal in the southwest, dominate most of the country. In the south lie the sandy wastes
of the Sahara desert, but in the north is a fertile coastal plain, home of most of the
population. Agriculture and mining are economic mainstays. 5 The climate in Morocco is
reliably dry, although small amounts of rain do fall between November and March.
Temperature varies considerably by season and locale. While the southern and
southeastern desert regions can reach extremely high temperatures during the hot
summer months, the higher altitudes of the mountains are cool in summer evenings and
freezing in winter.
1 http://unctadstat.unctad.org/TableViewer/tableView.aspx 2 http://data.worldbank.org/indicator/SP.POP.GROW 3 http://en.wikipedia.org/wiki/List_of_countries_by_population 4 http://goafrica.about.com/od/morocco/a/moroccofacts.htm 5 http://www.hejleh.com/countries/morocco.html

History 6
Morocco's history began with the Berbers, the aboriginal people who have inhabited the country since the end of the 2nd millennium BC Rome extended its rule over the area after defeating Carthage in 146 BC, and testimony to its presence still exists in the fine Roman ruins at Volubilis. As Rome fell into decline Morocco was invaded first by the Vandals and then, in the 7th century, by the Arabs. Although external Arab rule lasted little more than a century, the arrival of Islam proved to be a permanent addition to Moroccan culture. In the ensuing centuries a series of ruling dynasties came to power, including the Idrissids, the Almoravids, and the Almohads, but none seemed capable of long maintaining the critical support of the Berber leaders.
By the 15th century Spain and Portugal began to intrude into Morocco, after having expelled the Moors from their own lands. Although Morocco successfully repulsed these invasions, the tide of European imperialism eventually proved too great. By the middle of the 19th century Morocco's strategic importance had become evident to all of the European powers, and they engaged in a protracted struggle for possession of the country. Finally, in 1911, France was formally acknowledged as protector of the greater part of the country, with Spain receiving a number of isolated locales. French rule came to an end in 1953, although its cultural influence on Morocco remains strongly in evidence. Today the country is ruled by King Mohammed VI. He appears to be leading Morocco toward both long-term stability and a greater degree of economic prosperity.
Political system 7
Morocco is a constitutional, democratic, parliamentary and social monarchy. The constitutional system of the kingdom is based on the separation, balance and collaboration of powers, as well as citizenship and participatory democracy and the principles of good governance and the correlation between responsibility and accountability. Important Political Figures:
His Majesty the King Mohammed VI 8
The Royal family came to settle in Sijilmasa, in the Moroccan South, in the middle of the 13th century. His Majesty King Mohammed VI is the 23rd king of the Alaouite Dynasty, the reign of which started in the middle of the 17th century. His Majesty King Mohammed VI, Son of the late King H.M. Hassan II, was born on August 21st, 1963, in Rabat. At the age of 4, his august Father enrolled Him at the Koranic School of the Royal Palace. On June 28th 1973, His Royal Highness, the Crown Prince successfully completed the certificate of His primary studies, and finished his secondary studies at the Royal College where He received the Baccalaureate in 1981. He graduated from Mohammed V University in Rabat. In 1985, HRH completed the Bachelor Degree in Law from the University of Judicial, economic and social studies in Rabat. The subject of His thesis was “The Arab-African Union and the Kingdom’s Strategy in International Relations”. In 1987, he concluded the First Certificate of higher studies in political sciences. In July 1988, His Royal Highness, successfully completed the exams in the Second Certificate of high studies in public law. In order to complete His training, and to practice the principles and rules of law at the college, the Late King Hassan II decided to send Him, in November 1988, to Brussels to Mr. Jacques Delors, President of the Commission of the European Economic Communities, for few months. Even at a young age, Crown Prince was always asked by His august Father to carry out various missions at different levels: national, Arab, Islamic, African and international towards head of states and friends. His Highness took part, thus, in many international and regional conferences.
6 http://www.geographia.com/morocco/ 7 http://www.maroc.ma/en/content/monarchy# 8 http://www.embassyofmorocco.us/king.htm
His Majesty the King
Mohammed VI
Ruins of Roman Empire

On November 26, 1985, His Highness Crown Prince, Sidi Mohammed was nominated, by his father, as a Coordinator of Services at the General Headquarters of the Armed Forces. An assignment well carried out by the Crown Prince, who knew how to accomplish many different missions. On October 29, 1993, His Highness Crown Prince received, at the University of Nice-Antipolis in France, the title of a Doctor in Law with distinction. The thesis title was: “Cooperation between the European Economic Community and the Arab Maghreb Union”. On 23, July 1999, H.M. King Mohamed Ibn Al Hassan Ben Mohamed received the pledge of allegiance, in the Throne Room of the Royal palace in Rabat. His enthronement was celebrated on July 30, 1999. On the 22nd of June 2000, His Majesty the King Mohammed VI was awarded a Honoris Causa Doctorate by the University of George Washington. Governor of Morocco’s Central Bank 9
Mr. Abdellatif Jouahri serves as a Governor at Bank Al-Maghrib. He also serves as Chairman of the Board of Directors at Ubac Curaçao N.V. Mr. Jouahri serves as Chairman of the Supervisory Committee at Caisse de Dépôt et de Gestion - CDG - Morocco. He serves as Vice-Chairman of the Board at Maroc Lear - Morocco. He serves as a Director at Fonds Hassan II - Morocco, U.B.A.F. (France), British Arab Commercial Bank - BACB - London and Banca UBAE - Rome. Mr. Jouahri serves as a Director at Union de Banques Arabes et Francaises-UBAF. Mr. Jouahri served as a Director of British Arab Commercial Bank Ltd. since April 23, 2003 until April 30, 2010. He serves as Member of the Steering Committee at Institut Royal des Études Stratégiques - IRES. Mr. Jouahri serves as Chancellor at Université Al-Akhawayn - Morocco. International Chamber of Commerce- Morocco 10 Mr. Abdelhak Bennani is the Chairman at ICC Morocco, Owner at manazilna and CEO at Wafabank.
9 http://investing.businessweek.com/research/stocks/private/person.asp?personId=20631235&privcapId=874624 10 http://ma.viadin.za.com/socials/abdelhak_bennani
Mr. Abdellatif Jouahri

Economic Indicators 11
Indicator Indicator Value
Year 2013 Year 2012 Year 2011
GDP Growth (Constant Prices, National Currency) 4.524 % 2.992 % 4.986 %
GDP (Current Prices, National Currency) MAD 898.904 Billion MAD 840.225 Billion. MAD 802.607 Billion.
GDP (Current Prices, US Dollars) US$ 107.111 Billion US$ 97.53 Billion US$ 99.211 Billion
GDP Deflator 125.242 (Index, Base Year as per country's accounts = 100)
122.362 (Index, Base Year as per country's accounts = 100)
120.381 (Index, Base Year as per country's accounts = 100)
GDP Per Capita (Constant Prices, National Currency) MAD 21,846.87 MAD 21,114.08 MAD 20,714.11 GDP Per Capita (Current Prices, National Currency) MAD 27,361.38 MAD 25,835.60 MAD 24,935.75
GDP Per Capita (Current Prices, US Dollars) US$ 3,260.31 US$ 2,998.89 US$ 3,082.34
GDP (PPP), US Dollars US$ 181.924 Billion US$ 171.234 Billion US$ 163.338 Billion
GDP Per Capita (PPP), US Dollars US$ 5,537.51 US$ 5,265.18 US$ 5,074.65 GDP Share of World Total (PPP) 0.209 % 0.206 % 0.206 %
Implied PPP Conversion Rate 4.941 4.907 4.914
Investment (% of GDP) 36.447 % 35.872 % 35.953 % Gross National Savings (% of GDP) 29.463 % 26.272 % 27.837 %
Inflation, Average Consumer Prices (Indexed to Year 2000) 113.221 (Index, Base Year 2000 = 100)
110.495 (Index, Base Year 2000 = 100)
109.081 (Index, Base Year 2000 = 100)
Inflation (Average Consumer Price Change %) 2.467 % 1.296 % 0.907 % Inflation, End of Year (Indexed to Year 2000) 115.29 (Index, Base Year
2000 = 100) 112.446 (Index, Base Year 2000 = 100)
109.6 (Index, Base Year 2000 = 100)
Inflation (End of Year Change %) 2.53 % 2.596 % 0.921 %
Import Volume of All Items Including Goods and Services (Percent Change) 7.171 % -0.185 % 7.641 % Import Volumes of Goods Only (Percent Change) 5.88 % 1.236 % 9.665 %
Export Volume of All Items Including Goods and Services (Percent Change) 10.372 % -1.891 % 4.044 %
Export Volumes of Goods Only (Percent Change) 10.467 % 13.444 % 3.68 % Value of Oil Imports US$ 12.405 Billions US$ 12.111 Billions US$ 11.168 Billions
Value of Oil Exports US$ 0.934 Billions US$ 0.738 Billions US$ 0.563 Billions
Unemployment Rate (% of Labor Force) 8.712 % 8.812 % 8.912 %
Population 32.853 Million 32.522 Million 32.187 Million General government revenue (National Currency) MAD 253.804 Billions. MAD 232.783 Billions. MAD 223.009 Billions.
General government revenue (% of GDP) 28.235 % 27.705 % 27.786 %
General government total expenditure (National Currency) MAD 303.084 Billions. MAD 296.122 Billions. MAD 277.554 Billions.
General government total expenditure (% of GDP) 33.717 % 35.243 % 34.582 % Total Government Net Lending/ Borrowing (National Currency) MAD -49.28 Billions. MAD -63.339 Billions. MAD -54.545 Billions.
Total Government Net Lending/ Borrowing (% of GDP) -5.482 % -7.538 % -6.796 %
General Government Structural Balance (National Currency) MAD -40.477 Billion. MAD -49.451 Billion. MAD -52.436 Billion. General Government Balance (National Currency) MAD -26.881 Billion. MAD -43.327 Billion. MAD -36.311 Billion.
General Government Balance (% of GDP) -2.99 % -5.157 % -4.524 %
Total Government Net Debt (National Currency) MAD 545.181 Billion. MAD 496.212 Billion. MAD 433.139 Billion.
Total Government Net Debt (% of GDP) 60.65 % 59.057 % 53.967 % Total Government Gross Debt (National Currency) MAD 549.943 Billion. MAD 500.663 Billion. MAD 436.5 Billion.
Total Government Gross Debt (% of GDP) 61.179 % 59.587 % 54.385 %
Fiscal Year Gross Domestic Product, Current Prices MAD 898.904 Billions. MAD 840.225 Billions. MAD 802.607 Billions.
Current Account Balance (US Dollars) US$ -7.48 Billion US$ -9.363 Billion US$ -8.052 Billion Current Account Balance (% GDP) -6.984 % -9.6 % -8.116 %
11 http://www.economywatch.com/economic-statistics/country/Morocco/

Analyzing Morocco’s Foreign Trade 12
Morocco has the second-largest non-oil GDP in the Arab world. In the past, Morocco relied on phosphate exports, which has
declined over the recent years. The country has now emerged as an exporter of manufactured and agricultural products and its
popularity as a tourism destination is growing.
Morocco's trade is based on various free trade agreements that the country has signed with its principal economic partners.
Some of these are:
• The Euro-Mediterranean free trade area agreement with the European Union (EU). The objective of this agreement is to
integrate the European Free Trade Association.
• The Agadir Agreement, which was signed with Egypt, Jordan and Tunisia, within the framework of the Greater Arab Free
Trade Area.
• The US-Morocco Free Trade Agreement came into force on January 1, 2006.
• The agreement with Turkey for free exchange.
Import Profile 13
Imports in Morocco decreased to 29610 Million MAD in June of 2013 from 32366 Million MAD in May of 2013. Imports in
Morocco is reported by the Office des Changes. Morocco Imports averaged 18087.56 Million MAD from 1998 until 2013,
reaching an all time high of 38459 Million MAD in May of 2012 and a record low of 6424.40 Million MAD in January of 1999.
Morocco imports crude petroleum, textile fabric, telecommunications equipment, wheat, gas and electricity, transistors,
plastics. Its main imports partners are: France, Spain, China, Italy, Germany, United States and Saudi Arabia.
Main Imports & Main Import Partners (Year 2013)
Major Import Products Main Import Partners
Crude Petroleum France
Textile Spain
Fabric China Telecommunication Equipment Italy
Wheat Germany
Gas United States
Electricity Saudi Arabia
Transistors
Plastics
12 http://www.economywatch.com/world_economy/morocco/export-import.html 13 http://www.tradingeconomics.com/morocco/imports
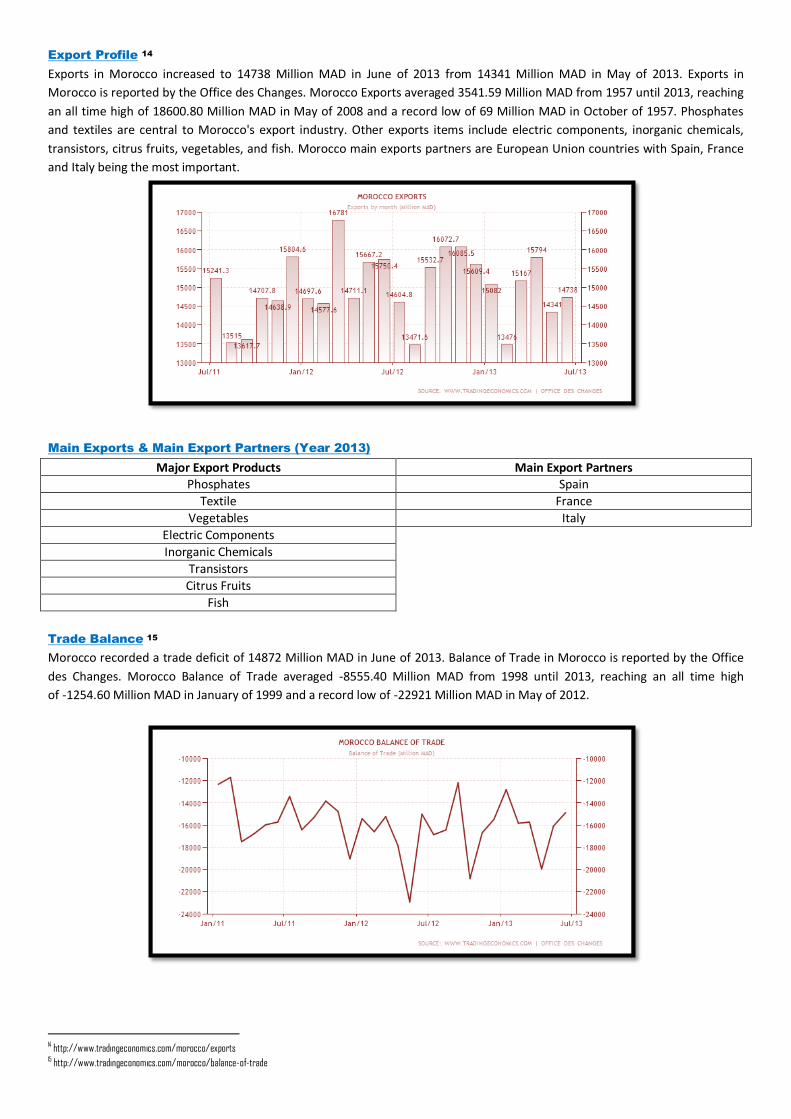
Export Profile 14
Exports in Morocco increased to 14738 Million MAD in June of 2013 from 14341 Million MAD in May of 2013. Exports in
Morocco is reported by the Office des Changes. Morocco Exports averaged 3541.59 Million MAD from 1957 until 2013, reaching
an all time high of 18600.80 Million MAD in May of 2008 and a record low of 69 Million MAD in October of 1957. Phosphates
and textiles are central to Morocco's export industry. Other exports items include electric components, inorganic chemicals,
transistors, citrus fruits, vegetables, and fish. Morocco main exports partners are European Union countries with Spain, France
and Italy being the most important.
Main Exports & Main Export Partners (Year 2013)
Major Export Products Main Export Partners Phosphates Spain
Textile France
Vegetables Italy
Electric Components
Inorganic Chemicals
Transistors
Citrus Fruits
Fish
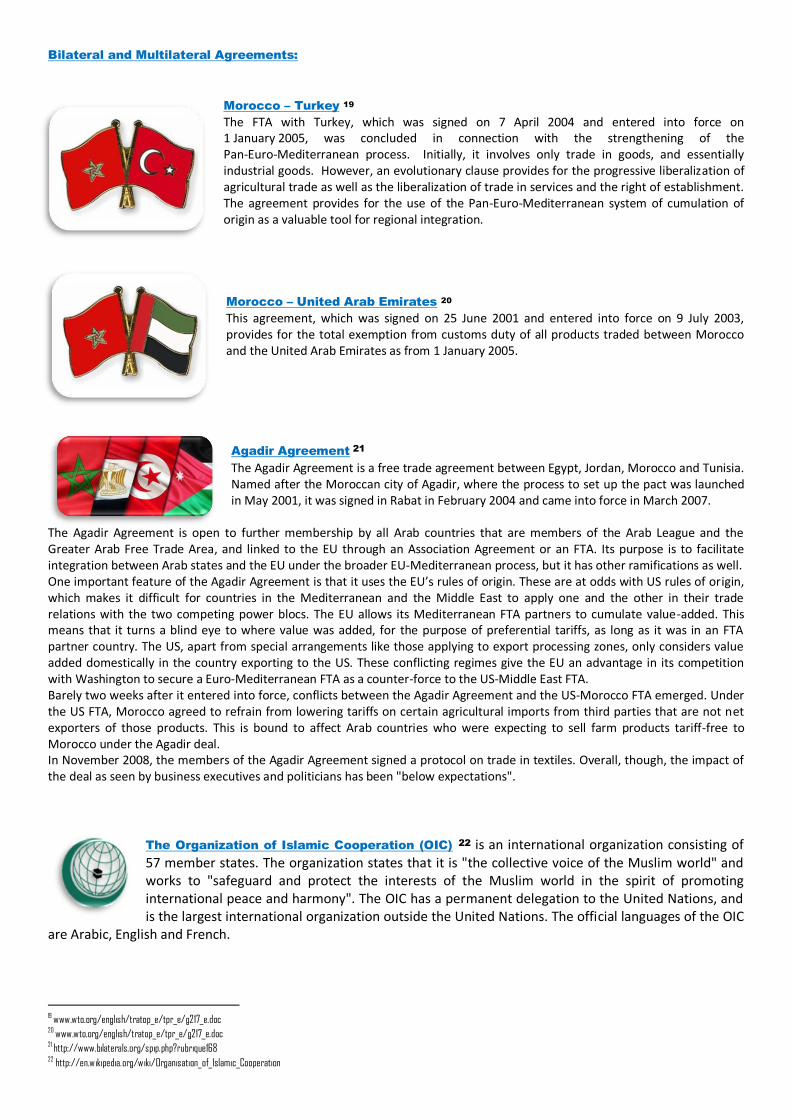
Trade Balance 15
Morocco recorded a trade deficit of 14872 Million MAD in June of 2013. Balance of Trade in Morocco is reported by the Office
des Changes. Morocco Balance of Trade averaged -8555.40 Million MAD from 1998 until 2013, reaching an all time high
of -1254.60 Million MAD in January of 1999 and a record low of -22921 Million MAD in May of 2012.
14 http://www.tradingeconomics.com/morocco/exports 15 http://www.tradingeconomics.com/morocco/balance-of-trade

Trade Policies 16
Since the last trade policy review in 2003, Morocco has continued to strengthen its economic, social and institutional reforms at a steady and increasing pace. Thanks to the reforms undertaken, coupled with the enhanced status of the rule of law and the introduction of sound macroeconomic management, Morocco now has a competitive and open economy capable of integrating into the ever-changing world economy. The ultimate objective is to stimulate the country's growth and improve the well-being of its population. Convinced that trade policy is essential to its economic policy and to development as a whole, Morocco embarked some 20 years ago on an irreversible process of liberalization and opening up to the rest of the world by:
- Continuing to reduce tariff protection and eliminate non-tariff measures;
- streamlining foreign trade procedures;
- creating an environment conducive to the development of business and investment;
- broadening and diversifying its trade and economic relations by concluding free trade agreements with its main bilateral or regional trading partners;
- Contributing to the consolidation of the multilateral trading system.
This enabled Morocco to return to strong economic growth in a gloomy world context and to maintain its macroeconomic balances thanks to the launching of large-scale structuring projects and the introduction of new sectoral strategies aimed at reconfiguring and diversifying its exportable supply in keeping with its competitive capacity and new world market demands. These proactive strategies focus both on the development of the industrial, agricultural, crafts, tourism and business services sectors and on comprehensive strengthening of the country's small- and medium-sized enterprises.
As regards its fundamental indicators, Morocco's structural budget deficit has turned into a surplus. There has been a significant inflow of foreign direct investment. At the same time, tourism receipts and remittances from Moroccans living abroad have been on the increase. However, Morocco is still concerned at the persisting foreign trade deficit which is undermining its development efforts. It is introducing measures aimed at boosting the production and export potential of companies, in particular SMEs, and at encouraging foreign investment.
16 www.wto.org/english/tratop_e/tpr_e/g217_e.doc

Trade Policy Table 17
Basic indicators
Population (thousands, 2011) 32 273 Rank in world trade, 2011 Exports Imports
GDP (million current US$, 2011) 100 221 Merchandise 71 56
GDP (million current PPP US$, 2011) 163 659 excluding intra – EU trade 49 38 Current account balance (million US$, 2011) -8 000 Commercial services 46 65
Trade per capita (US$, 2009-2011) 2 217 excluding intra-EU trade 29 46
Trade to GDP ratio (2009-2011) 75.4
Annual percentage change 2011 2005-2011 2010 2011
Real GDP (2005=100) 133 5 4 5
Exports of goods and services (volume, 2005=100) 127 4 16 2
Import of goods and services (volume, 2005=100) 145 6 3 7
Trade policy
WTO accession 1 January 1995 Contribution to WTO budget (%, 2012) 0.189 Trade policy review 24,26 June 2009 Import duties collected (%, 2008-2010)
GPA accession - in total tax revenue 6.7
Tariff and duty free imports to total imports 3.9 Tariff binding coverage (%) 100 Number of notifications to WTO and measures in force
MFN tariffs Final bound Applied 2011 Outstanding notifications in WTO Central Registry 24
Simple average of import duties Goods RTAs – services EIAs notified to WTO 6-1
All goods 41.3 14.3 Anti-dumping (30 June 2011) 0 Agricultural goods (AOA) 54.4 41.2 Countervailing duties (30 June 2011) …
Non-agricultural goods 39.3 10.2 Safeguards (26 October 2011) 0
Non-ad-valorem duties (% total tariff lines)
0.0 0.0 Number of disputes (complainant-defendant)
MFN duty free imports (%, 2010) Requests for consultation 0-0
in agricultural goods 0.0 Original panel / Appellate Body (AB) reports 0-0
in non-agricultural goods 1.1 Compliance panel / AB reports (Article 21.5 DSU) 0-0 Services sectors with GATS commitments 45 Arbitration awards (Article 22.6 DSU) 0-0
Merchandise Trade Value Annual percentage change
2011 2005-2011 2010 2011
Merchandise exports, f.o.b. (million US$) 21 519 12 26 21
Merchandise imports, c.i.f. (million US$) 44 295 13 8 25
2011 a 2011 a
Share in world total exports 0.12 Share in world total imports 0.24
Breakdown in economy’s total exports Breakdown in economy’s total imports
By main commodity groups (ITS) My main commodity groups (ITS) Agricultural products 15.8 Agricultural products 14.3
Fuels and mining products 18.9 Fuels and mining products 29.8
Manufactures 61.7 Manufactures 54.3
By main destination By main origin 1. European Union (27) 59.7 1. European Union (27) 49.2
2. India 6.1 2. China 8.4
3. Brazil 3.8 3. United States 7.1
4. United States 3.8 4. Saudi Arabia, Kingdom of 6.0 5. Singapore 1.9 5. Russian Federation 3.8
Commercial Services Trade
Value Annual percentage change
2011 2005-2011 2010 2011
Commercial services exports (million US$) 13 550 10 2 12
Commercial services imports (million US$) 6 713 14 8 17
2011 2011
Share in world total exports 0.33 Share in world total imports 0.17
Breakdown in economy’s total exports Breakdown in economy’s total imports
By principal services item By principal services item Transportation 20.1 Transportation 49.4
Travel 54.0 Travel 20.3
Other commercial services 25.9 Other commercial services 30.3
Industrial Property
Patents grants by patent office, 2010 Trademark registrations by office, 2010
Residents Non-residents Total Direct residents Direct non-residents Madrid Total 5 803 808 4 880 1 442 3 917 10 239
a Breakdowns by destination/origin refer to 2010.
17 WTO Trade profiles 2012 (PDF) – Page 119

Tariffs 18
Tariffs and imports: Summary and duty ranges
Summary Total Ag Non-Ag WTO member since 2000 Simple average final bound 41.3 54.4 39.3 Binding coverage Total 100 Simple average MFN applied 2011 14.3 41.2 10.2 Non-Ag 100 Trade weighted average 2010 13.1 29.9 10.8 Ag: Tariff quotas (in %) 8.5 Imports in billion US$ 2010 35.2 4.2 31.0 Ag: Special safeguards (in %) 16.2
Frequency distribution Duty-free 05 510 1015 1520 2550 50100 >100 NAV in % Tariff lines and import values (in %)
Agricultural products
Final bound 0 0 0.1 0 4.0 79.7 4.1 12.1 0
MFN applied 2011 0 17.9 8.9 0 16.5 47.9 1.6 7.2 0 Imports 2010 0 23.8 16.0 0 11.6 26.4 21.3 0.9 0
Non-agricultural products
Final bound 0.0 0.1 0.4 0 1.8 97.6 0 0 0
MFN applied 2011 0.0 65.0 8.8 0.2 4.9 21.2 0 0 0
Imports 2010 1.1 72.3 0.1 0 6.8 19.7 0 0 0
Tariffs and imports by product groups
Product groups Final bound duties MFN applied duties Imports
AVG Duty-free in %
Max Binding in %
AVG Duty-free in % Max Share in % Duty-free in %
Animal products 94.5 0 289 100 105.3 0 304 0.4 0 Dairy products 76.7 0 87 100 62.5 0 102 0.7 0 Fruit, vegetables, plants 34.0 0 40 100 40.3 0 49 0.8 0 Coffee, tea 34.0 0 34 100 23.2 0 49 0.6 0 Cereals & preparations 59.4 0 195 100 41.8 0 172 4.4 0
Oilseeds, fats & oils 86.2 0 236 100 20.9 0 138 2.3 0 Sugars & confectionary 134.5 0 168 100 31.8 0 60 1.1 0 Beverages & tobacco 34.0 0 34 100 34.8 0 49 0.5 0 Cotton 22.0 0 34 100 2.5 0 3 0.2 0 Other agricultural products 33.6 0 40 100 15.4 0 49 1.0 0
Fish & fish products 39.6 0 40 100 16.1 0 50 0.3 0 Minerals & metals 39.4 0.2 45 100 10.3 0.1 30 17.3 5.8 Petroleum 40.0 0 40 100 16.9 0 30 15.8 0 Chemicals 39.0 0 45 100 6.4 0 30 10.0 0
Wood, paper, etc. 39.0 0 45 100 20.5 0 30 4.0 0 Textiles 41.8 0 45 100 9.8 0 30 6.4 0 Clothing 40.2 0 45 100 29.1 0 30 0.8 0 Leather, footwear, etc. 39.7 0 45 100 17.6 0 30 1.5 0
Non-electrical machinery 36.8 0 45 100 4.9 0 30 10.8 0 Electrical machinery 37.8 0 45 100 6.8 0 30 8.1 0 Transport equipment 38.7 0 45 100 11.5 0 30 8.7 0 Manufactures, n.e.s. 39.2 0 45 100 5.4 0 30 4.3 0
Exports to major trading partners and duties faced
Major markets Bilateral imports Diversification 95% trade in no. of
MFN AVG of traded TL Pref. margin
Duty free imports
In million US$
HS 2-digit HS 6-digit Simple Weighted Weighted TL in % Value in %
Agricultural products
1. European Union 2010 1,517 16 57 12.1 12.7 8.1 46.1 45.6
2. Russian Federation 2010 245 2 3 12.7 6.4 1.6 2.7 0.0 3. United States 2010 137 8 15 3.2 2.3 1.4 95.9 77.1
4. Canada 2010 90 6 6 3.3 0.1 0.0 64.8 99.0
5. Switzerland 2010 28 9 21 21.0 0.6 1.7 38.4 81.8
Non-agricultural products 1. European Union 2010 8,354 53 309 5.2 7.2 7.2 100.0 100.0
2. India 2010 841 4 5 10.9 4.8 0.0 11.2 3.8
3. Brazil 2010 663 6 8 19.5 1.2 0.0 17.3 83.4
4. United States 2010 523 18 81 6.6 2.9 2.7 57.8 87.8 5. China 2010 449 14 44 13.7 6.9 0.0 13.3 74.4
18 WTO, World tariff profiles 2012 (PDF), Page 118
Bilateral and Multilateral Agreements:
Morocco – Turkey 19
The FTA with Turkey, which was signed on 7 April 2004 and entered into force on 1 January 2005, was concluded in connection with the strengthening of the Pan-Euro-Mediterranean process. Initially, it involves only trade in goods, and essentially industrial goods. However, an evolutionary clause provides for the progressive liberalization of agricultural trade as well as the liberalization of trade in services and the right of establishment. The agreement provides for the use of the Pan-Euro-Mediterranean system of cumulation of origin as a valuable tool for regional integration.
Morocco – United Arab Emirates 20
This agreement, which was signed on 25 June 2001 and entered into force on 9 July 2003, provides for the total exemption from customs duty of all products traded between Morocco and the United Arab Emirates as from 1 January 2005.
Agadir Agreement 21
The Agadir Agreement is a free trade agreement between Egypt, Jordan, Morocco and Tunisia. Named after the Moroccan city of Agadir, where the process to set up the pact was launched in May 2001, it was signed in Rabat in February 2004 and came into force in March 2007.
The Agadir Agreement is open to further membership by all Arab countries that are members of the Arab League and the Greater Arab Free Trade Area, and linked to the EU through an Association Agreement or an FTA. Its purpose is to facilitate integration between Arab states and the EU under the broader EU-Mediterranean process, but it has other ramifications as well. One important feature of the Agadir Agreement is that it uses the EU’s rules of origin. These are at odds with US rules of origin, which makes it difficult for countries in the Mediterranean and the Middle East to apply one and the other in their trade relations with the two competing power blocs. The EU allows its Mediterranean FTA partners to cumulate value-added. This means that it turns a blind eye to where value was added, for the purpose of preferential tariffs, as long as it was in an FTA partner country. The US, apart from special arrangements like those applying to export processing zones, only considers value added domestically in the country exporting to the US. These conflicting regimes give the EU an advantage in its competition with Washington to secure a Euro-Mediterranean FTA as a counter-force to the US-Middle East FTA. Barely two weeks after it entered into force, conflicts between the Agadir Agreement and the US-Morocco FTA emerged. Under the US FTA, Morocco agreed to refrain from lowering tariffs on certain agricultural imports from third parties that are not net exporters of those products. This is bound to affect Arab countries who were expecting to sell farm products tariff-free to Morocco under the Agadir deal. In November 2008, the members of the Agadir Agreement signed a protocol on trade in textiles. Overall, though, the impact of the deal as seen by business executives and politicians has been "below expectations".
The Organization of Islamic Cooperation (OIC) 22 is an international organization consisting of 57 member states. The organization states that it is "the collective voice of the Muslim world" and works to "safeguard and protect the interests of the Muslim world in the spirit of promoting international peace and harmony". The OIC has a permanent delegation to the United Nations, and is the largest international organization outside the United Nations. The official languages of the OIC
are Arabic, English and French.
19 www.wto.org/english/tratop_e/tpr_e/g217_e.doc 20 www.wto.org/english/tratop_e/tpr_e/g217_e.doc 21 http://www.bilaterals.org/spip.php?rubrique168 22 http://en.wikipedia.org/wiki/Organisation_of_Islamic_Cooperation

EU-Mediterranean (EMFTA) 23
The Euro-Mediterranean Free Trade Area (EMFTA) is a free trade zone under construction
since the Barcelona Declaration, a framework plan, was adopted in 1995. It is being built
through a series of bilateral FTAs (called Association Agreements) between Brussels and each
state bordering the Mediterranean, as well as so-called horizontal FTAs between the non-EU
Mediterranean countries themselves, such as the Agadir Agreement.
The countries in question are Algeria, Egypt, Jordan, Lebanon, Morocco, Palestinian Territories, Syria, Tunisia and Turkey.
Many people view the EU’s ambitions to build this special "partnership" with North African and Middle Eastern states — which
involves not only trade and investment liberalization but deep political reform, what Brussels calls "approximation" of other
countries’ legal and political institutions with its own — as both imperialist and neocolonial. This is all the more significant taking
into account the United States’ plans to weave together a US-Middle East Free Trade Agreement (MEFTA). For the two are in
direct competition.
EMFTA was supposed to be completed by 2010. However, a sustainability impact assessment of EMFTA commissioned by the EU
already foresees important negative social and environmental consequences. Complicating things further, French President
Sarkozy took the initiative to set up a Union for the Mediterranean, involving only the countries that border the sea, which was
launched in July 2008. Further still, questions have been arising as to why the EU does not merge its Mediterranean FTA
initiative with its GCC FTA initiative.
In September 2011, the EU announced the opening of "deep and comprehensive" trade negotiations with Egypt, Jordan,
Morocco and Tunisia. In February 2012, the EU and Morocco signed an agricultural trade deal (which also covers fisheries).
Critics have noted that the agreement will promote the exploitation of the disputed territory of Western Sahara, that the main
benefactors will be transnational companies and the King of Morocco, and that small farmers will suffer under the deal.
GAFTA 24
The Arab League has a long history of trying to foster trade and economic cooperation among its
member states, with several initiatives taken in the 1950s and 1960s.
In 1981, an agreement to facilitate and promote inter-Arab trade was signed, but to little effect.
In February 1997, the League decided to create an Arab Free Trade Area, also known as the Greater Arab
Free Trade Area or the Pan-Arab Free Trade Area, by 2008. This would be achieved through a 10%
reduction in customs fees each year as well as the gradual elimination of trade barriers. Eighteen of the 22 Arab League states
signed on to this agreement, which came into force on 1 January 1998.
In March 2001, it was decided to speed up the liberalization process, and on 1 January 2005 the elimination of most tariffs
among the GAFTA members was enforced.
The 17 states that are members of GAFTA are: Jordan, Bahrain, Egypt, Iraq, Kuwait, Lebanon, Libya, Morocco, Oman, Palestine,
Qatar, Saudi Arabia, Sudan, Syria, Tunisia, United Arab Emirates and Yemen. Others are in the process of joining.
Morocco – United States of America 25
Signed on 15 June 2004, the free trade agreement with the United States entered into force on 1 January 2006. It is a comprehensive agreement which covers all areas closely or remotely relating to trade: liberalization of goods and services, intellectual property, rules of origin, investment and social and environmental issues.
23 http://www.bilaterals.org/spip.php?rubrique173 24 http://www.bilaterals.org/spip.php?rubrique169 25 www.wto.org/english/tratop_e/tpr_e/g217_e.doc
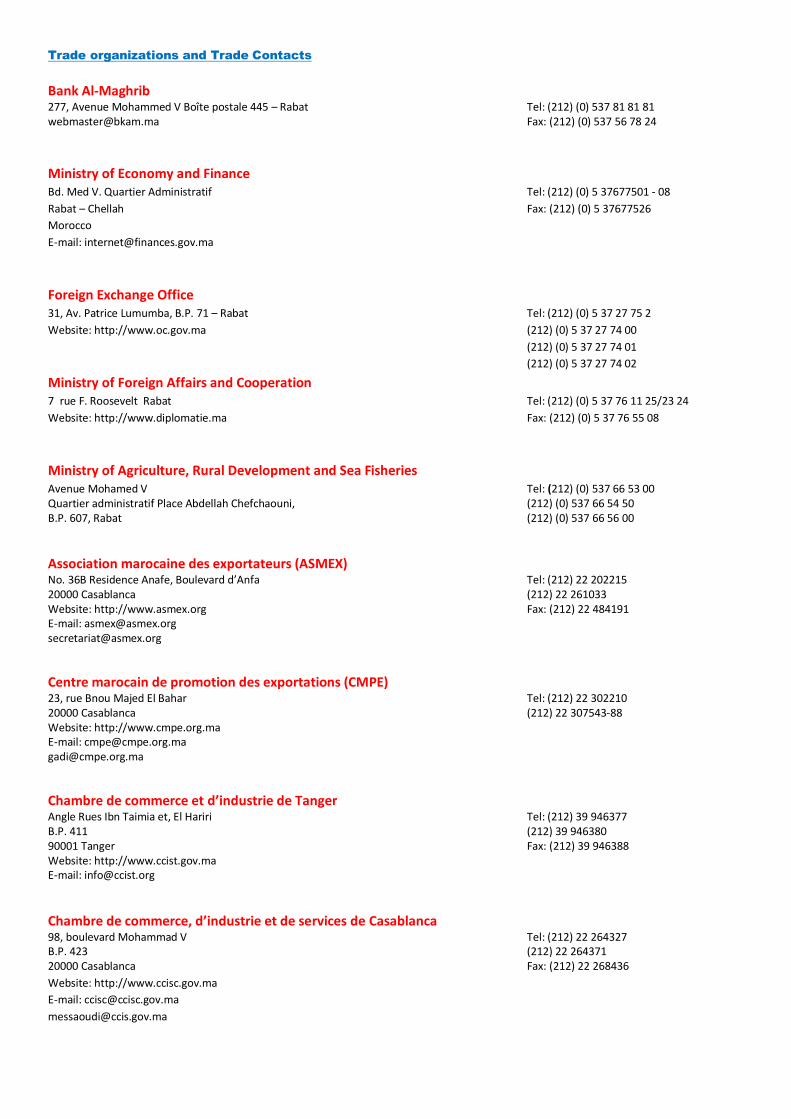
Trade organizations and Trade Contacts
Bank Al-Maghrib 277, Avenue Mohammed V Boîte postale 445 – Rabat Tel: (212) (0) 537 81 81 81 [email protected] Fax: (212) (0) 537 56 78 24
Ministry of Economy and Finance Bd. Med V. Quartier Administratif Tel: (212) (0) 5 37677501 - 08
Rabat – Chellah Fax: (212) (0) 5 37677526
Morocco
E-mail: [email protected]
Foreign Exchange Office
31, Av. Patrice Lumumba, B.P. 71 – Rabat Tel: (212) (0) 5 37 27 75 2
Website: http://www.oc.gov.ma (212) (0) 5 37 27 74 00
(212) (0) 5 37 27 74 01
(212) (0) 5 37 27 74 02
Ministry of Foreign Affairs and Cooperation 7 rue F. Roosevelt Rabat Tel: (212) (0) 5 37 76 11 25/23 24
Website: http://www.diplomatie.ma Fax: (212) (0) 5 37 76 55 08
Ministry of Agriculture, Rural Development and Sea Fisheries Avenue Mohamed V Tel: (212) (0) 537 66 53 00 Quartier administratif Place Abdellah Chefchaouni, (212) (0) 537 66 54 50 B.P. 607, Rabat (212) (0) 537 66 56 00
Association marocaine des exportateurs (ASMEX) No. 36B Residence Anafe, Boulevard d’Anfa Tel: (212) 22 202215 20000 Casablanca (212) 22 261033 Website: http://www.asmex.org Fax: (212) 22 484191 E-mail: [email protected] [email protected]
Centre marocain de promotion des exportations (CMPE) 23, rue Bnou Majed El Bahar Tel: (212) 22 302210 20000 Casablanca (212) 22 307543-88 Website: http://www.cmpe.org.ma E-mail: [email protected] [email protected]
Chambre de commerce et d’industrie de Tanger Angle Rues Ibn Taimia et, El Hariri Tel: (212) 39 946377 B.P. 411 (212) 39 946380 90001 Tanger Fax: (212) 39 946388 Website: http://www.ccist.gov.ma E-mail: [email protected]
Chambre de commerce, d’industrie et de services de Casablanca 98, boulevard Mohammad V Tel: (212) 22 264327 B.P. 423 (212) 22 264371 20000 Casablanca Fax: (212) 22 268436
Website: http://www.ccisc.gov.ma
E-mail: [email protected]
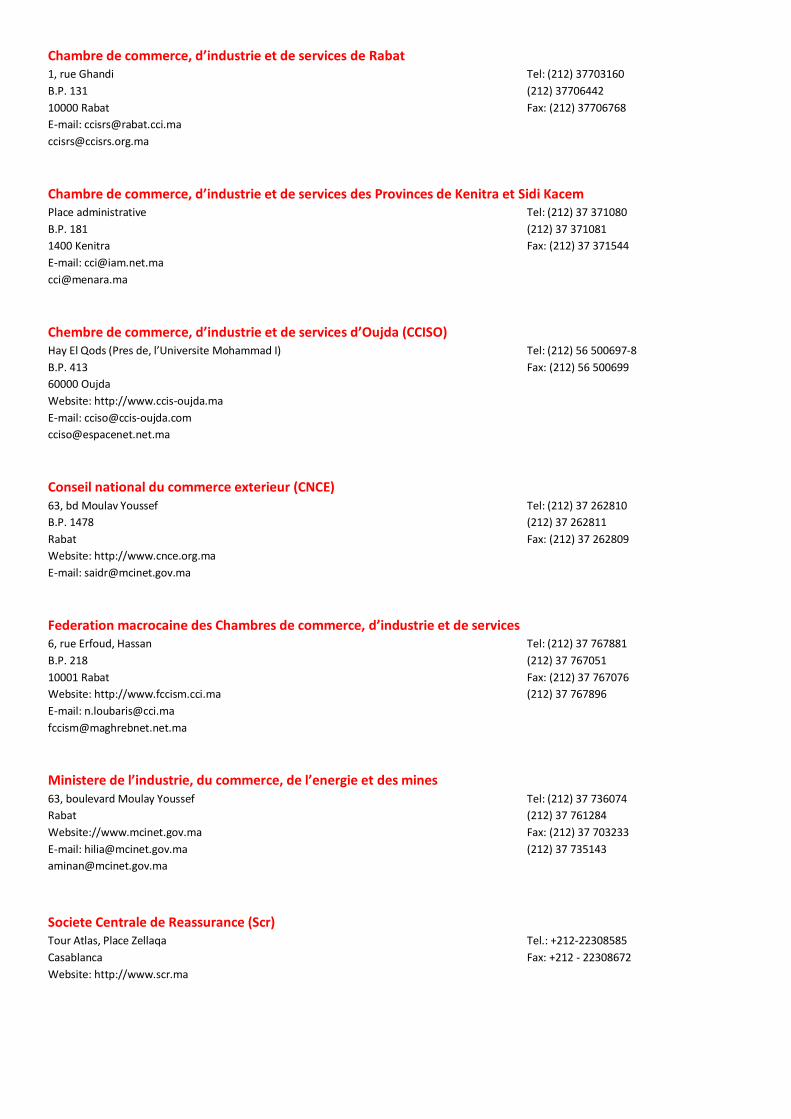
Chambre de commerce, d’industrie et de services de Rabat 1, rue Ghandi Tel: (212) 37703160
B.P. 131 (212) 37706442
10000 Rabat Fax: (212) 37706768
E-mail: [email protected]
Chambre de commerce, d’industrie et de services des Provinces de Kenitra et Sidi Kacem Place administrative Tel: (212) 37 371080
B.P. 181 (212) 37 371081
1400 Kenitra Fax: (212) 37 371544
E-mail: [email protected]
Chembre de commerce, d’industrie et de services d’Oujda (CCISO) Hay El Qods (Pres de, l’Universite Mohammad I) Tel: (212) 56 500697-8
B.P. 413 Fax: (212) 56 500699
60000 Oujda
Website: http://www.ccis-oujda.ma
E-mail: [email protected]
Conseil national du commerce exterieur (CNCE) 63, bd Moulav Youssef Tel: (212) 37 262810
B.P. 1478 (212) 37 262811
Rabat Fax: (212) 37 262809
Website: http://www.cnce.org.ma
E-mail: [email protected]
Federation macrocaine des Chambres de commerce, d’industrie et de services 6, rue Erfoud, Hassan Tel: (212) 37 767881
B.P. 218 (212) 37 767051
10001 Rabat Fax: (212) 37 767076
Website: http://www.fccism.cci.ma (212) 37 767896
E-mail: [email protected]
Ministere de l’industrie, du commerce, de l’energie et des mines 63, boulevard Moulay Youssef Tel: (212) 37 736074
Rabat (212) 37 761284
Website://www.mcinet.gov.ma Fax: (212) 37 703233
E-mail: [email protected] (212) 37 735143
Societe Centrale de Reassurance (Scr) Tour Atlas, Place Zellaqa Tel.: +212-22308585
Casablanca Fax: +212 - 22308672
Website: http://www.scr.ma
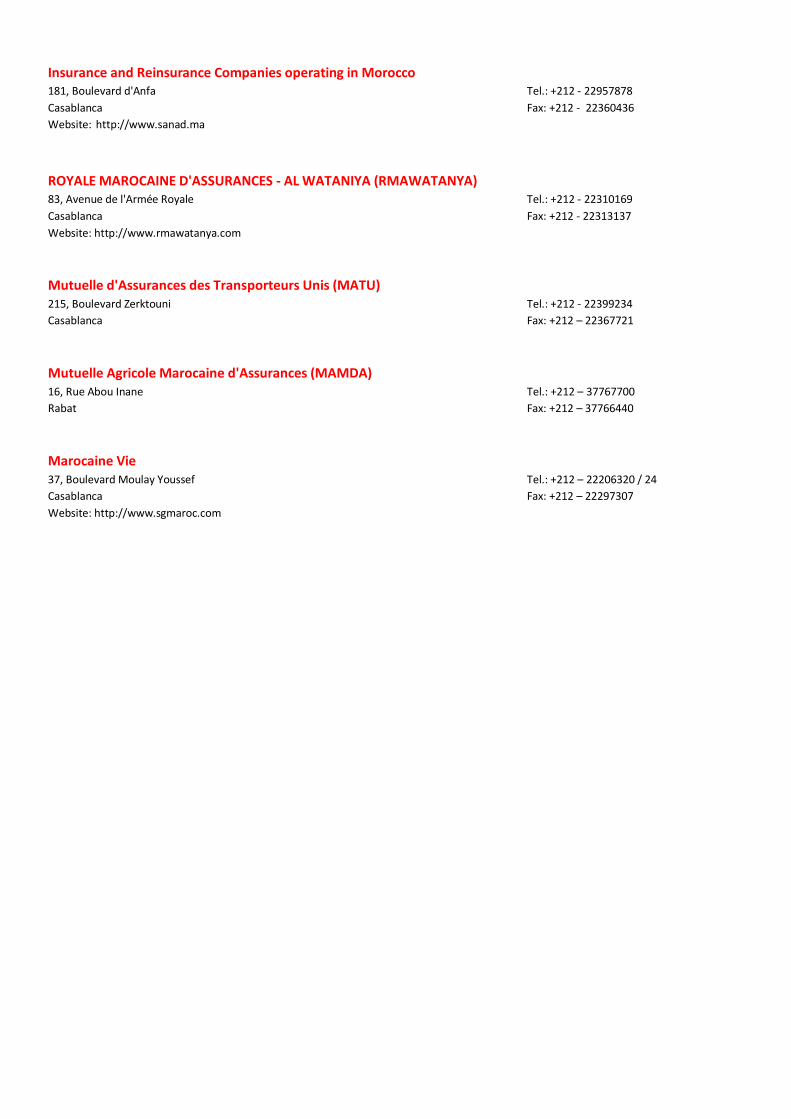
Insurance and Reinsurance Companies operating in Morocco 181, Boulevard d'Anfa Tel.: +212 - 22957878
Casablanca Fax: +212 - 22360436
Website: http://www.sanad.ma
ROYALE MAROCAINE D'ASSURANCES - AL WATANIYA (RMAWATANYA) 83, Avenue de l'Armée Royale Tel.: +212 - 22310169
Casablanca Fax: +212 - 22313137
Website: http://www.rmawatanya.com
Mutuelle d'Assurances des Transporteurs Unis (MATU) 215, Boulevard Zerktouni Tel.: +212 - 22399234
Casablanca Fax: +212 – 22367721
Mutuelle Agricole Marocaine d'Assurances (MAMDA) 16, Rue Abou Inane Tel.: +212 – 37767700
Rabat Fax: +212 – 37766440
Marocaine Vie 37, Boulevard Moulay Youssef Tel.: +212 – 22206320 / 24
Casablanca Fax: +212 – 22297307
Website: http://www.sgmaroc.com