IMF Country Report No. 15/35 THE ISLAMIC … · director for the islamic republic of mauritania...
84
© International Monetary Fund IMF Country Report No. 15/35 THE ISLAMIC REPUBLIC OF MAURITANIA 2014 ARTICLE IV CONSULTATION—STAFF REPORT; PRESS RELEASE; AND STATEMENT BY THE EXECUTIVE DIRECTOR FOR THE ISLAMIC REPUBLIC OF MAURITANIA Under Article IV of the IMF’s Articles of Agreement, the IMF holds bilateral discussions with members, usually every year. In the context of the Article IV consultation with the Islamic Republic of Mauritania, the following documents have been released and are included in this package: The Staff Report prepared by a staff team of the IMF for the Executive Board’s consideration on January 28, 2015, following discussions that ended on October 30, 2014, with the officials of Mauritania on economic developments and policies. Based on information available at the time of these discussions, the staff report was completed on January 14, 2015. An Informational Annex prepared by the IMF. A Debt Sustainability Analysis prepared by the IMF and the World Bank. A Press Release summarizing the views of the Executive Board as expressed during its January 28, 2015 consideration of the staff report that concluded the Article IV consultation with the Islamic Republic of Mauritania. A Statement by the Executive Director for the Islamic Republic of Mauritania. The documents listed below have been or will be separately released. Selected Issues Paper The policy of publication of staff reports and other documents allows for the deletion of market-sensitive information. Copies of this report are available to the public from International Monetary Fund Publication Services PO Box 92780 Washington, D.C. 20090 Telephone: (202) 623-7430 Fax: (202) 623-7201 E-mail: [email protected] Web: http://www.imf.org Price: $18.00 per printed copy International Monetary Fund Washington, D.C. February 2015
Transcript of IMF Country Report No. 15/35 THE ISLAMIC … · director for the islamic republic of mauritania...

© International Monetary Fund
IMF Country Report No. 15/35
THE ISLAMIC REPUBLIC OF
MAURITANIA 2014 ARTICLE IV CONSULTATION—STAFF REPORT;
PRESS RELEASE; AND STATEMENT BY THE EXECUTIVE
DIRECTOR FOR THE ISLAMIC REPUBLIC OF MAURITANIA
Under Article IV of the IMF’s Articles of Agreement, the IMF holds bilateral discussions with
members, usually every year. In the context of the Article IV consultation with the Islamic
Republic of Mauritania, the following documents have been released and are included in this
package:
The Staff Report prepared by a staff team of the IMF for the Executive Board’s
consideration on January 28, 2015, following discussions that ended on October 30, 2014,
with the officials of Mauritania on economic developments and policies. Based on
information available at the time of these discussions, the staff report was completed on
January 14, 2015.
An Informational Annex prepared by the IMF.
A Debt Sustainability Analysis prepared by the IMF and the World Bank.
A Press Release summarizing the views of the Executive Board as expressed during its
January 28, 2015 consideration of the staff report that concluded the Article IV
consultation with the Islamic Republic of Mauritania.
A Statement by the Executive Director for the Islamic Republic of Mauritania.
The documents listed below have been or will be separately released.
Selected Issues Paper
The policy of publication of staff reports and other documents allows for the deletion of
market-sensitive information.
Copies of this report are available to the public from
International Monetary Fund Publication Services
PO Box 92780 Washington, D.C. 20090
Telephone: (202) 623-7430 Fax: (202) 623-7201
E-mail: [email protected] Web: http://www.imf.org
Price: $18.00 per printed copy
International Monetary Fund
Washington, D.C.
February 2015
February 2015
ISLAMIC REPUBLIC OF
MAURITANIA STAFF REPORT FOR THE 2014 ARTICLE IV CONSULTATION
KEY ISSUES
Context. Mauritania’s economy has benefited from macroeconomic stability and high
growth in the context of contained inflation, responsible macro-policies, high iron ore
prices and scaled-up public investment. However, economic growth has not translated
into broadly improved living standards and is being hit by a sharp decline in iron ore
prices.
Outlook and Risks. Although the outlook remains favorable, it hinges heavily on
stabilizing iron ore prices and expanding mining capacity. Downside risks to the outlook
dominate because iron ore prices may decline further in response to excess supply in the
global market.
Key Policy Recommendations. With high risk of debt distress and deteriorating terms
of trade, Mauritania’s fiscal policy needs to remain focused on consolidation to support
fiscal sustainability. Over the medium term, a fiscal framework with a full-fledged fiscal
rule will help prevent the boom–bust cycles that ensue from volatility in natural resource
revenue, and with strengthened governance in managing mining wealth. The central
bank should take advantage of the low-inflation environment to strengthen monetary
policy formulation, gradually liberalize the foreign exchange market, and introduce
liquidity support and banking resolution frameworks. The implementation of the recent
FSAP recommendations should be pursued to enhance the stability of the financial
sector stability.
Economic diversification and inclusive growth are the foremost medium-term
challenges. The authorities should accelerate structural reforms needed to raise
Mauritania’s potential growth, create jobs, and improve living standards for all
Mauritanians.
Article VIII. A comprehensive analysis of the foreign exchange market identified
exchange restrictions and multiple currency practices (MCPs) subject to Fund approval
under Article VIII. Effective November 20, 2013, the exchange rate regime is classified as
“stabilized” arrangement.
January 14, 2015
ISLAMIC REPUBLIC OF MAURITANIA
2 INTERNATIONAL MONETARY FUND
Approved By Daniela Gressani and
Dhaneshwar Ghura
Discussions took place in Nouakchott during October 20–30. The Staff
team comprised Ms. Vera Martin (head), Ms. Touré, Mr. Jardak (all
MCD), Mr. Ricka (SPR), and Ms. Luca (FAD). The team was supported in
the field by Ms. Maaloum (local economist) and from headquarters by
Ms. Kebet and Mr. Selim (all MCD).
The mission met with President Mohamed Ould Abdel Aziz, Prime
Minister Yahya Ould Hademine, Governor of the Central Bank Sid’
Ahmed Ould Raiss, Minister of Finance Thiam Diombar, Minister of
Economic Affairs and Development Sidi Ould Tah, and other senior
government officials; representatives of the banking and private
sectors, trade unions, and civil society; and members of the diplomatic
and donor communities. The mission held a press conference at the
conclusion of the mission.
CONTENTS
CONTEXT_________________________________________________________________________________________ 4
ECONOMIC DEVELOPMENTS ____________________________________________________________________ 4
OUTLOOK AND RISKS ___________________________________________________________________________ 7
POLICY DISCUSSIONS _________________________________________________________________________ 13
A. Consolidating Macroeconomic Stability by Strengthening Policy Formulation and Public
Sector Governance _____________________________________________________________________________ 13
B. Strengthening Financial Stability and Promoting Financial Inclusion __________________________ 18
C. Structural Reforms to Facilitate More Inclusive Growth _______________________________________ 19
STAFF APPRAISAL _____________________________________________________________________________ 21
BOXES
1. Tax Revenue Performance in Mauritania _______________________________________________________ 6
2. External Spillovers to Mauritania’s Economy____________________________________________________ 9
3. Strengthening the Macro-Fiscal Framework in Mauritania_____________________________________ 16
FIGURES
1. Economic Developments vis-à-vis Regional Developments, 2008–15 _________________________ 24
2. Real Sector Developments, 2008–15 __________________________________________________________ 25
3. External Sector Developments, 2008–15 _______________________________________________________ 26
4. Fiscal Sector Developments, 2008–15 _________________________________________________________ 27
5. Monetary and Financial Sector Indicators, 2008–15 ___________________________________________ 28
ISLAMIC REPUBLIC OF MAURITANIA
INTERNATIONAL MONETARY FUND 3
6. Impediments to Growth and Competitiveness, 2014–15 _______________________________________ 29
7. Governance Environment ______________________________________________________________________ 31
8. Financial Inclusion Indicators, 2011 ____________________________________________________________ 32
TABLES
1. Selected Economic and Financial Indicators, 2012–20 _________________________________________ 33
2. Balance of Payments, 2012–20 ________________________________________________________________ 34
3a. Central Government Operations, 2012–20 ___________________________________________________ 35
3b. Central Government Operations, 2012–20 ___________________________________________________ 36
4. Monetary Situation, 2009–16 __________________________________________________________________ 37
5. Banking Soundness Indicators, 2008–13 _______________________________________________________ 38
6. Selected Economic and Financial Indicators, 2012–20 _________________________________________ 39
7. Millennium Development Goals, 1990–2015 __________________________________________________ 40
APPENDICES
I. Implementation Status of the Main 2012 Article IV Recommendations ________________________ 41
II. External Sector Assessment ___________________________________________________________________ 42
III. Financial Sector Assessment Recommendations ______________________________________________ 45
IV. Statistical Issues ______________________________________________________________________________ 47

ISLAMIC REPUBLIC OF MAURITANIA
4 INTERNATIONAL MONETARY FUND
CONTEXT
1. With macroeconomic stability restored, Mauritania needs to focus its economic
policies on increasing the economy’s resilience to external shocks and promoting inclusive
growth. With the support of the ECF arrangement (2010–13), the authorities managed to restore
macroeconomic stability with high economic growth, contained inflation, a more prudent fiscal
stance, and improved policy space. Both fiscal and external buffers improved thanks to exceptional
donor assistance, better tax collection, rising iron ore prices, and fishing proceeds. However, a
49 percent decline (year-on-year) in iron ore prices in 2014 again exposed Mauritania’s vulnerability
to terms-of-trade shocks: receipts related to the extractive sector account for 75 percent of exports
and 30 percent of fiscal revenues. The medium-term outlook hinges on the authorities’ capacity to
consolidate macroeconomic stability by strengthening policy formulation and governance;
strengthen the financial sector and promote financial inclusion; and undertake broad structural
reforms to promote private sector development and economic diversification, to broaden and
sustain growth and promote inclusion.
2. After a double victory in parliamentary and presidential elections, Mauritania’s ruling
party has the political space to undertake renewed economic reforms. The ruling party and its
allies gained a majority in the Parliament, paving the way for legislative economic reforms. President
Abdel Aziz intends to strengthen national unity, the judiciary system, and governance, while
reducing social inequality and poverty through better redistribution.
ECONOMIC DEVELOPMENTS
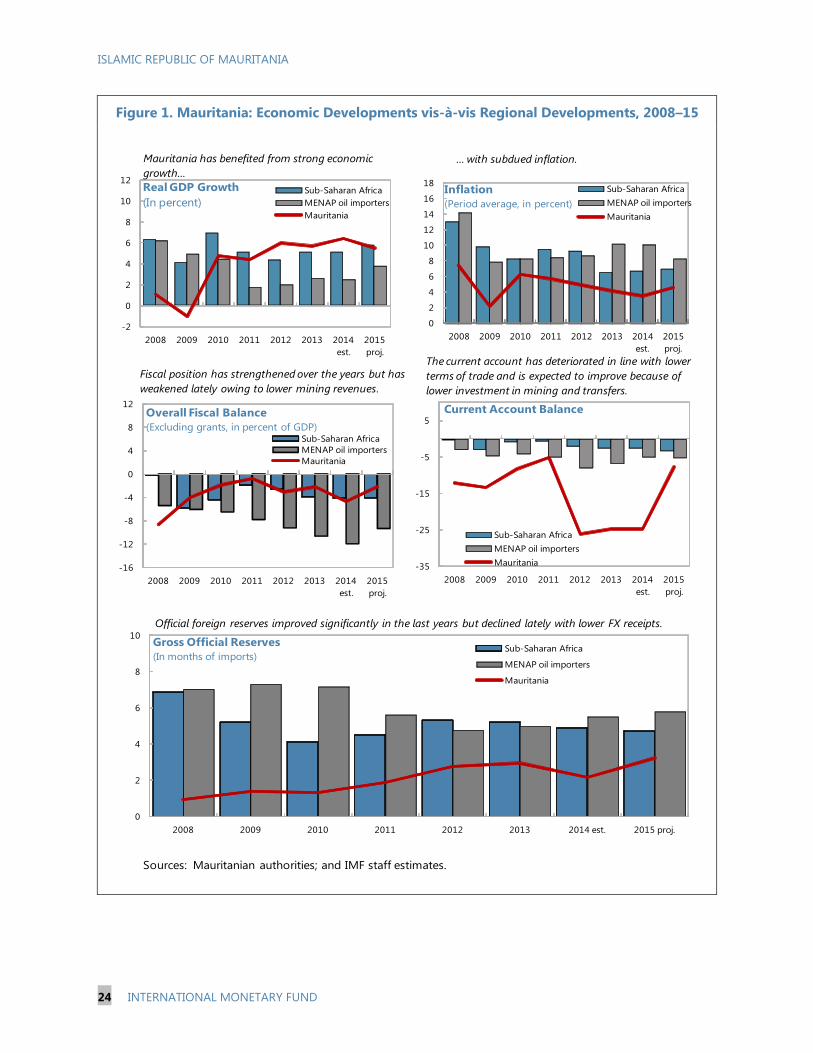
3. Economic growth in 2013–14 remained elevated in the context of contained inflation.
Based on the new national accounts,1 real GDP growth is estimated at 5.7 percent in 2013, from
6.0 percent in 2012. Reduced activity in fishing and agricultural sectors was only partly offset by
better mining and services activity. Preliminary economic indicators for the first part of 2014 point to
weaker than expected oil, manufacturing, and agricultural output, partly offset by stronger fishing
and construction activity and higher iron production. Average headline inflation declined from
4½ percent at end-2013 to 3 percent in mid-2014, owing to declining international prices. A spike in
domestic food prices, together with a gas price increase, accelerated average inflation to 4.1 percent
(year-on-year) in October 2014.2
4. The current account deficit remained wide during 2013–14 because of large capital
imports associated with the extractive sector and, lately, to worsening terms of trade. The
current account deficit reached 25 percent of GDP in 2013, reflecting large imports to expand
capacity in extractive industries—mostly financed by FDI. Reserve levels remained stable
1 See Box in Appendix IV for details.
2 Administered gas prices increased by 11.3 percent during 2014.

ISLAMIC REPUBLIC OF MAURITANIA
INTERNATIONAL MONETARY FUND 5
(6½ months of prospective imports excluding those related to the extractive industries). But an
improvement in the terms of trade during 2013 (at 34 percent) reversed during 2014 (at minus
18 percent). During the first half of 2014, the current account deteriorated to an annualized
32 percent from 18 percent of GDP compared to a year earlier, on account of a deteriorating trade
balance.
5. The deterioration of the terms of trade has been absorbed by lower foreign exchange
reserves. The nominal exchange rate against the U.S. dollar slightly depreciated (by 2 percent) since
end-2012; but appreciated in real terms owing to the inflation differential between Mauritania and
its trading partners. In 2014, the ouguiya continued its gradual depreciation with respect to the
U.S. dollar, with an appreciation of 7 percent vis-à-vis the euro, given the U.S. dollar’s appreciation
relative to the euro. Because the euro is a major trading partner currency, the real effective exchange
rate appreciated cumulatively by about 12 percent since 2013. The Central Bank of Mauritania (CBM)
stepped up its volume of foreign exchange sales in both fixing sessions and direct sales from
US$1.2 billion in 2012 to US$1.5 billion in 2013, and kept a similar trend during 2014 with sales
totaling US$1.5 billion. Weaker foreign exchange repatriation from mining companies to Mauritania
and no EU fishing compensation have decreased gross reserves to US$639 million in December
2014 from US$996 million at end-2013, to close to five months of prospective imports excluding
those related to extractive industries.
6. Fiscal policy has aimed at maintaining consolidation efforts. In 2013, the overall balance,
excluding grants, posted a deficit of 2.2 percent of non-extractive GDP, down from 3 percent in
2012.3 Budget execution up to the third quarter of 2014 showed an overall deficit (excluding grants)
of 3 percent because of high capital spending execution compared to the annual envelope. Within
tax revenues, lower domestic VAT revenues were more than offset by higher corporate income
taxes, customs revenues, and taxes on wages and salaries. For nontax revenues, higher revenues
from fishing licenses partially mitigated the slight decline in dividends and royalties from public
enterprises. Despite progress in revenue mobilization (Box 1), fiscal consolidation did not result in
improved non-extractive fiscal balances and external debt maintained an upward trend and—
despite the upward revision in national income accounts—remains elevated at 73½ percent of GDP
at end-2014.4
7. The risk of debt distress is assessed to be high because of the lagged effects of the
deterioration of the institutional environment in 2009 on debt thresholds (Annex I). The debt
sustainability analysis reports the breach of one of the debt thresholds in the baseline scenario,
leading to a deterioration of the assessed risk of debt distress. This is associated with lower debt
thresholds, driven by the lagged effects of the worsened institutional capacity as measured by the
World Bank’s CPIA rating in 2009, even though this rating has improved continuously since 2010.
3 On a cash basis. Fiscal outcomes do not fully capture the transfers to SOMELEC, the electricity public company, to
cover for operational losses, nor oil revenues from the decline in international oil prices.
4 The public debt-to-GDP ratio has declined from the previously reported level (98 percent of GDP in June 2013) due
to higher GDP figures in the new national accounts.
ISLAMIC REPUBLIC OF MAURITANIA
6 INTERNATIONAL MONETARY FUND
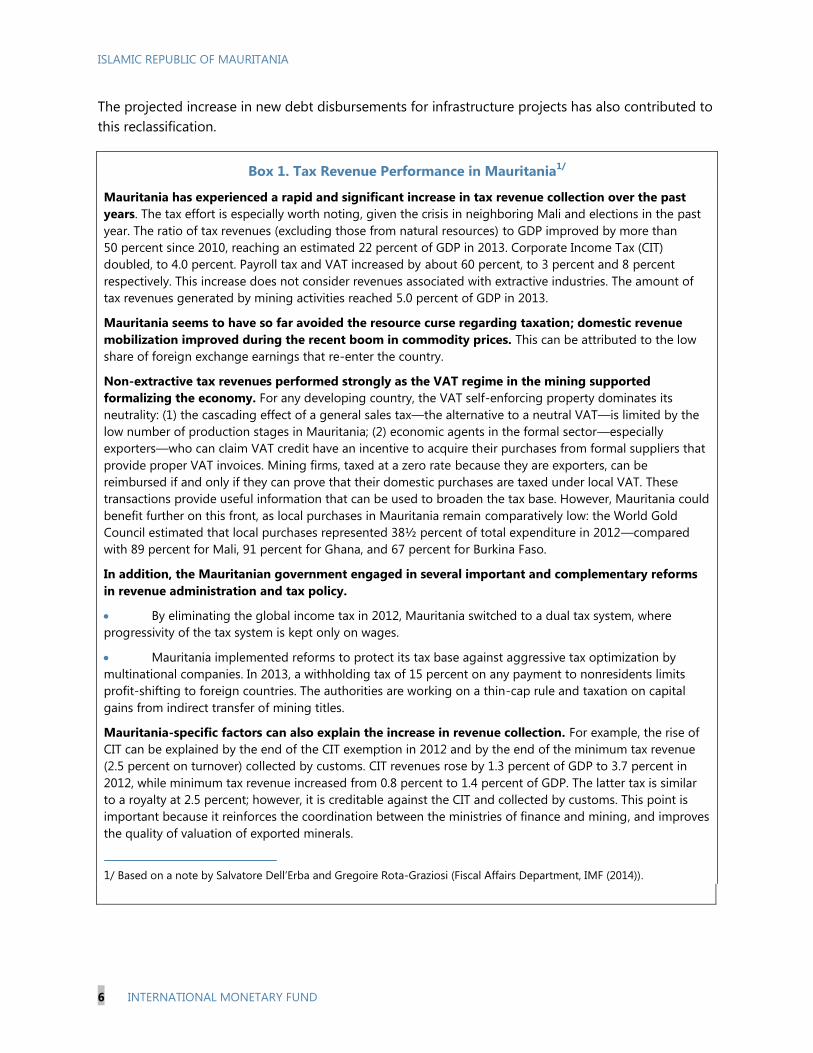
The projected increase in new debt disbursements for infrastructure projects has also contributed to
this reclassification.
Box 1. Tax Revenue Performance in Mauritania1/
Mauritania has experienced a rapid and significant increase in tax revenue collection over the past
years. The tax effort is especially worth noting, given the crisis in neighboring Mali and elections in the past
year. The ratio of tax revenues (excluding those from natural resources) to GDP improved by more than
50 percent since 2010, reaching an estimated 22 percent of GDP in 2013. Corporate Income Tax (CIT)
doubled, to 4.0 percent. Payroll tax and VAT increased by about 60 percent, to 3 percent and 8 percent
respectively. This increase does not consider revenues associated with extractive industries. The amount of
tax revenues generated by mining activities reached 5.0 percent of GDP in 2013.
Mauritania seems to have so far avoided the resource curse regarding taxation; domestic revenue
mobilization improved during the recent boom in commodity prices. This can be attributed to the low
share of foreign exchange earnings that re-enter the country.
Non-extractive tax revenues performed strongly as the VAT regime in the mining supported
formalizing the economy. For any developing country, the VAT self-enforcing property dominates its
neutrality: (1) the cascading effect of a general sales tax—the alternative to a neutral VAT—is limited by the
low number of production stages in Mauritania; (2) economic agents in the formal sector—especially
exporters—who can claim VAT credit have an incentive to acquire their purchases from formal suppliers that
provide proper VAT invoices. Mining firms, taxed at a zero rate because they are exporters, can be
reimbursed if and only if they can prove that their domestic purchases are taxed under local VAT. These
transactions provide useful information that can be used to broaden the tax base. However, Mauritania could
benefit further on this front, as local purchases in Mauritania remain comparatively low: the World Gold
Council estimated that local purchases represented 38½ percent of total expenditure in 2012—compared
with 89 percent for Mali, 91 percent for Ghana, and 67 percent for Burkina Faso.
In addition, the Mauritanian government engaged in several important and complementary reforms
in revenue administration and tax policy.
By eliminating the global income tax in 2012, Mauritania switched to a dual tax system, where
progressivity of the tax system is kept only on wages.
Mauritania implemented reforms to protect its tax base against aggressive tax optimization by
multinational companies. In 2013, a withholding tax of 15 percent on any payment to nonresidents limits
profit-shifting to foreign countries. The authorities are working on a thin-cap rule and taxation on capital
gains from indirect transfer of mining titles.
Mauritania-specific factors can also explain the increase in revenue collection. For example, the rise of
CIT can be explained by the end of the CIT exemption in 2012 and by the end of the minimum tax revenue
(2.5 percent on turnover) collected by customs. CIT revenues rose by 1.3 percent of GDP to 3.7 percent in
2012, while minimum tax revenue increased from 0.8 percent to 1.4 percent of GDP. The latter tax is similar
to a royalty at 2.5 percent; however, it is creditable against the CIT and collected by customs. This point is
important because it reinforces the coordination between the ministries of finance and mining, and improves
the quality of valuation of exported minerals.
1/ Based on a note by Salvatore Dell’Erba and Gregoire Rota-Graziosi (Fiscal Affairs Department, IMF (2014)).

ISLAMIC REPUBLIC OF MAURITANIA
INTERNATIONAL MONETARY FUND 7
8. Monetary indicators suggest a moderate increase in credit and excess liquidity (FSSA
report). Between October 2013 and 2014, as short-term deposits fueled broad money growth from
9.8 percent to 11.4 percent, banks’ credit growth slowed from 13.3 percent to 12.1 percent. Despite
the CBM’s increased FX sales, which helped stabilize excess liquidity in the past, liquidity in the
banking system has started to increase since mid-2014, on account of limited investment
opportunities. Free reserves increased in October 2014 on an annual basis.5
9. The banking sector is well capitalized and liquid, but remains fragile to shocks. High
credit concentration (including credit to the public sector), foreign-exchange risk exposures, and low
profitability due to a constrained business model and higher competition exacerbate banking
vulnerabilities. Although the banking system appears well-capitalized overall, some banks are not
meeting the minimum capital requirement and are under-provisioned. Asset quality remains weak:
nonperforming loans (NPLs) represented 20 percent of loans in the second quarter of 2014. On
December 31, 2014 the CBM removed the licenses of Maurisbank, an undercapitalized bank, and of
FCI, a financial institution with negative capital and little credit activity. The cases are likely to be
contested in courts and deposits be covered by the existing deposit insurance.
10. Advances in social indicators remain stalled. Poverty and unemployment remain elevated
and progress toward achieving the MDGs is uneven. About 26 percent of households were
estimated to be food-insecure in June 2014, in part because of higher rural migration to
Nouakchott. Progress toward building the foundation for inclusive growth, as set at the time of 2012
Article IV, has been mixed (Appendix I).
OUTLOOK AND RISKS
11. The near-term outlook remains favorable despite slower economic activity and lower
iron ore prices.
Slower economic activity in 2015. After recovering to 6.4 percent in 2014 (to the effect of the
strong rebound in fishing, which drives non-extractive GDP growth to 7.1 percent), real GDP
growth is projected at 5.5 percent in 2015 because of lower growth in mining activity, and lower
public investment and consumption from the demand side. Terms of trade are projected to
deteriorate by 4.5 percent as lower iron ore prices (24 percent) are partially compensated by the
decline in oil prices (40 percent). The current account deficit in 2015 (at 7.7 percent of GDP)
narrows significantly due to higher transfers associated with the telecom licensing. The overall
fiscal deficit is projected at 4.7 percent of non-extractive GDP (compared to 3 percent of non-
5 Banks are requested to hold 100 percent of the total bank’s bid in the exchange rate fixing sessions as excess
reserves in ouguiya as of the previous day’s close.
ISLAMIC REPUBLIC OF MAURITANIA
8 INTERNATIONAL MONETARY FUND
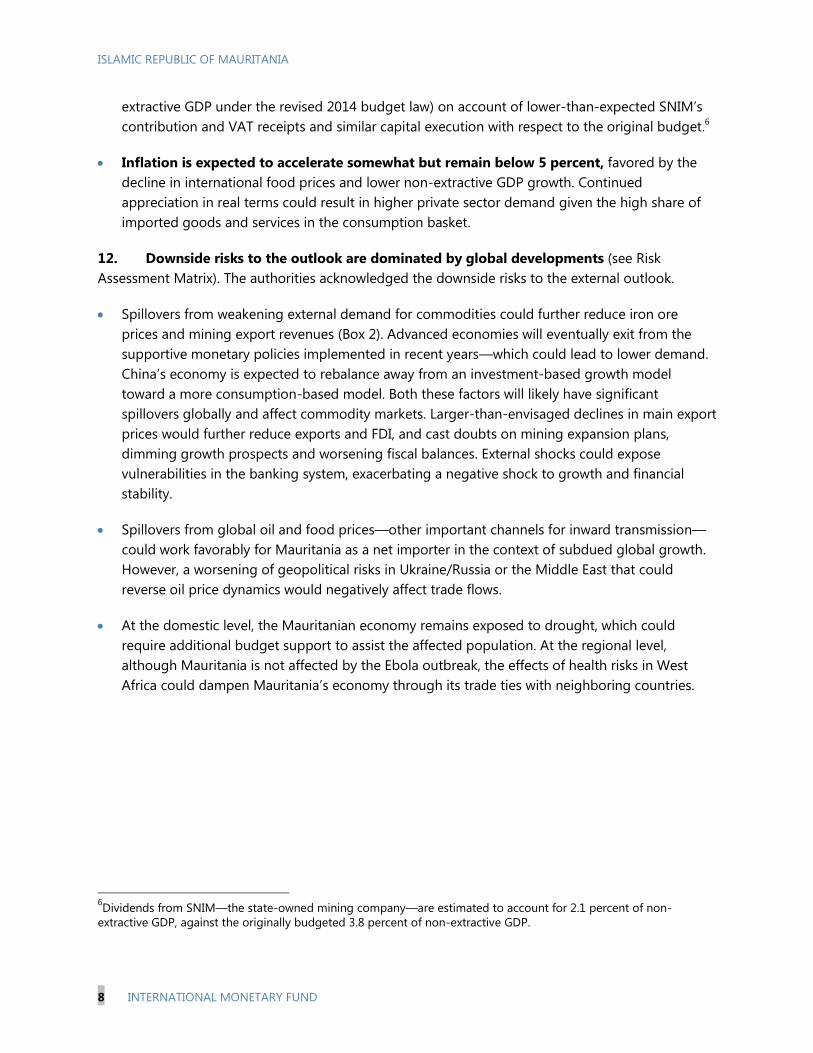
extractive GDP under the revised 2014 budget law) on account of lower-than-expected SNIM’s
contribution and VAT receipts and similar capital execution with respect to the original budget.6
Inflation is expected to accelerate somewhat but remain below 5 percent, favored by the
decline in international food prices and lower non-extractive GDP growth. Continued
appreciation in real terms could result in higher private sector demand given the high share of
imported goods and services in the consumption basket.
12. Downside risks to the outlook are dominated by global developments (see Risk
Assessment Matrix). The authorities acknowledged the downside risks to the external outlook.
Spillovers from weakening external demand for commodities could further reduce iron ore
prices and mining export revenues (Box 2). Advanced economies will eventually exit from the
supportive monetary policies implemented in recent years—which could lead to lower demand.
China’s economy is expected to rebalance away from an investment-based growth model
toward a more consumption-based model. Both these factors will likely have significant
spillovers globally and affect commodity markets. Larger-than-envisaged declines in main export
prices would further reduce exports and FDI, and cast doubts on mining expansion plans,
dimming growth prospects and worsening fiscal balances. External shocks could expose
vulnerabilities in the banking system, exacerbating a negative shock to growth and financial
stability.
Spillovers from global oil and food prices—other important channels for inward transmission—
could work favorably for Mauritania as a net importer in the context of subdued global growth.
However, a worsening of geopolitical risks in Ukraine/Russia or the Middle East that could
reverse oil price dynamics would negatively affect trade flows.
At the domestic level, the Mauritanian economy remains exposed to drought, which could
require additional budget support to assist the affected population. At the regional level,
although Mauritania is not affected by the Ebola outbreak, the effects of health risks in West
Africa could dampen Mauritania’s economy through its trade ties with neighboring countries.
6Dividends from SNIM—the state-owned mining company—are estimated to account for 2.1 percent of non-
extractive GDP, against the originally budgeted 3.8 percent of non-extractive GDP.
ISLAMIC REPUBLIC OF MAURITANIA
INTERNATIONAL MONETARY FUND 9
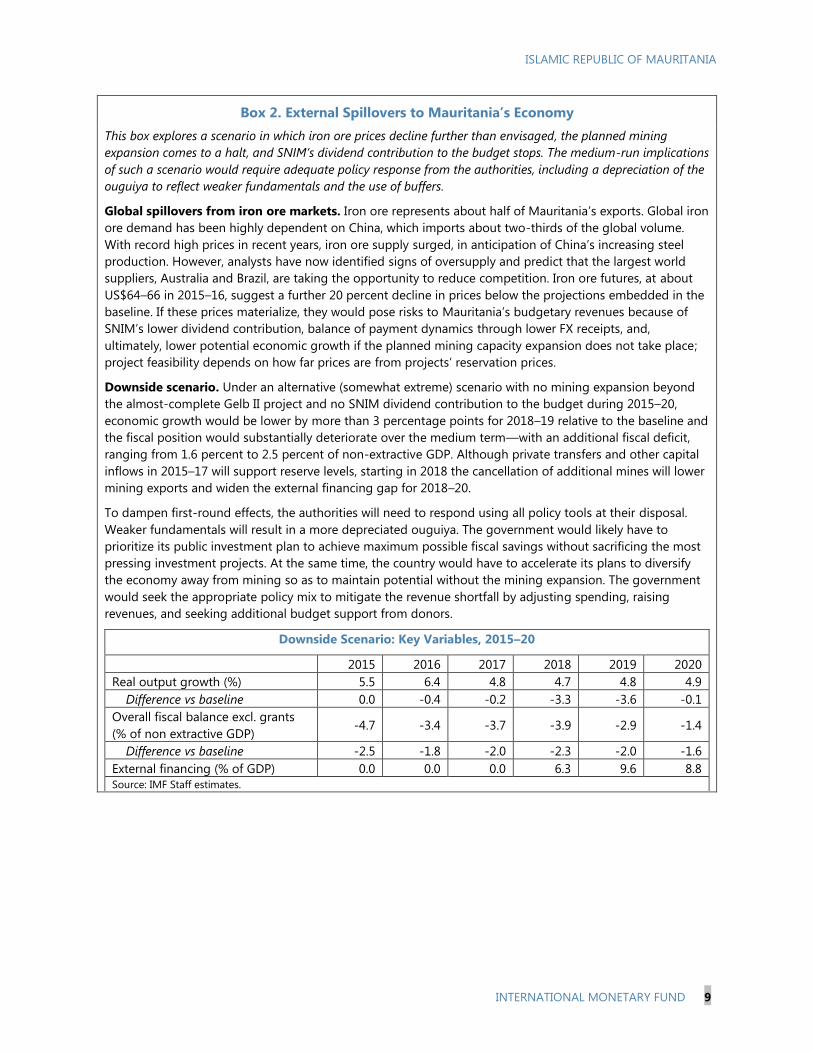
Box 2. External Spillovers to Mauritania’s Economy
This box explores a scenario in which iron ore prices decline further than envisaged, the planned mining
expansion comes to a halt, and SNIM’s dividend contribution to the budget stops. The medium-run implications
of such a scenario would require adequate policy response from the authorities, including a depreciation of the
ouguiya to reflect weaker fundamentals and the use of buffers.
Global spillovers from iron ore markets. Iron ore represents about half of Mauritania’s exports. Global iron
ore demand has been highly dependent on China, which imports about two-thirds of the global volume.
With record high prices in recent years, iron ore supply surged, in anticipation of China’s increasing steel
production. However, analysts have now identified signs of oversupply and predict that the largest world
suppliers, Australia and Brazil, are taking the opportunity to reduce competition. Iron ore futures, at about
US$64–66 in 2015–16, suggest a further 20 percent decline in prices below the projections embedded in the
baseline. If these prices materialize, they would pose risks to Mauritania’s budgetary revenues because of
SNIM’s lower dividend contribution, balance of payment dynamics through lower FX receipts, and,
ultimately, lower potential economic growth if the planned mining capacity expansion does not take place;
project feasibility depends on how far prices are from projects’ reservation prices.
Downside scenario. Under an alternative (somewhat extreme) scenario with no mining expansion beyond
the almost-complete Gelb II project and no SNIM dividend contribution to the budget during 2015–20,
economic growth would be lower by more than 3 percentage points for 2018–19 relative to the baseline and
the fiscal position would substantially deteriorate over the medium term—with an additional fiscal deficit,
ranging from 1.6 percent to 2.5 percent of non-extractive GDP. Although private transfers and other capital
inflows in 2015–17 will support reserve levels, starting in 2018 the cancellation of additional mines will lower
mining exports and widen the external financing gap for 2018–20.
To dampen first-round effects, the authorities will need to respond using all policy tools at their disposal.
Weaker fundamentals will result in a more depreciated ouguiya. The government would likely have to
prioritize its public investment plan to achieve maximum possible fiscal savings without sacrificing the most
pressing investment projects. At the same time, the country would have to accelerate its plans to diversify
the economy away from mining so as to maintain potential without the mining expansion. The government
would seek the appropriate policy mix to mitigate the revenue shortfall by adjusting spending, raising
revenues, and seeking additional budget support from donors.
Downside Scenario: Key Variables, 2015–20
2015 2016 2017 2018 2019 2020
Real output growth (%) 5.5 6.4 4.8 4.7 4.8 4.9
Difference vs baseline 0.0 -0.4 -0.2 -3.3 -3.6 -0.1
Overall fiscal balance excl. grants
(% of non extractive GDP) -4.7 -3.4 -3.7 -3.9 -2.9 -1.4
Difference vs baseline -2.5 -1.8 -2.0 -2.3 -2.0 -1.6
External financing (% of GDP) 0.0 0.0 0.0 6.3 9.6 8.8
Source: IMF Staff estimates.

Mauritania: Risk Assessment Matrix
Sources of Risks
Relative
Likelihood
Expected
Effect
A. Global Shocks
High Medium/High
High High
Low High
3. Geopolitical fragmentation that frays globalization:
Medium Medium/High
Medium High
Medium Medium ↑
In the short-term, external and fiscal buffers and higher exchange rate
flexibility would provide room for a gradual adjustment. Sound
macroeconomic management, a well-aligned exchange rate and
reforms to increase the resilience of the economy to external shocks
will require diversifying the economy and exports away from natural
resources. A fiscal framework that includes a fiscal rule and an
stabilization fund will support sound policy management.
In the short-term, external and fiscal buffers and higher exchange rate
flexibility would provide room for a gradual adjustment.
Higher oil prices will put pressure on the external account and
fuel inflation.
Sound macroeconomic management will require increasing the
effectiveness of the transmission mechanism to anchor inflation
expectations. The authorities could use a portion of the fiscal buffers
to compensate the poor temporarily.
Displacement and inefficiency associated with increased geopolitical surrounding
Russia/Ukraine , affecting global financial, trade, and commodity markets.
Heightened risk of state failures in the Middle East, leading to a sharp rise to oil
prices and negative confidence spillovers to the global economy.
While direct trade links are limited, tension between Russia and
Ukraine could result in higher oil prices with the potential of
worsening the trade and fiscal balances, and fueling inflation.
Disruptions to cereal markets could worsen the trade balance
and fuel inflation, given Mauritania's dependence on food
imports.
Policy ResponseChannel Mechanism
In advanced economies, lower-than-anticipated potential growth and persistently
low inflation due to a failutre to fully address legacies of the financial crisis leads to
secular stagnation.
In emerging markets, maturing of the cycle, misallocation of investment, and
incomplete structural reforms lead to prolonged slower growth
1. Protacted period of slower growth in advanced and emerging economies
Further slowdown in growth in the Euro Area (second trading
partner) would negatively affect the balance of payments,
through lower demand. The impact could be beneficiary for
Mauritania if oil prices decline.
A slowdown in emerging markets, including China (main trading
partner), will result in lower trade flows due to lower demand. A
decline in mining prices (especially iron ore) will the balance of
payments and the fiscal position could deteriorate substantially.
A slowdown in China's economy will worsen the external and
fiscal positions, due to lower demand for commodities and,
likely, lower commodity prices.
2. Growth slowdown in China: Significant growth slowdown in 2014-15 absent
offsetting stimulus.
As above.
4. Sustained decline in energy prices, triggered by deceleration of global
demand and coming on-stream of excess capacity
Lower oil and gas prices would improve the current account and
the fiscal balance.
Additional policy space could help buildup additional buffers to
increase the resilience of the economy to external shocks.
ISLA
MIC
REP
UB
LIC O
F M
AU
RIT
AN
IA
10
IN
TER
NA
TIO
NA
L MO
NETA
RY F
UN
D
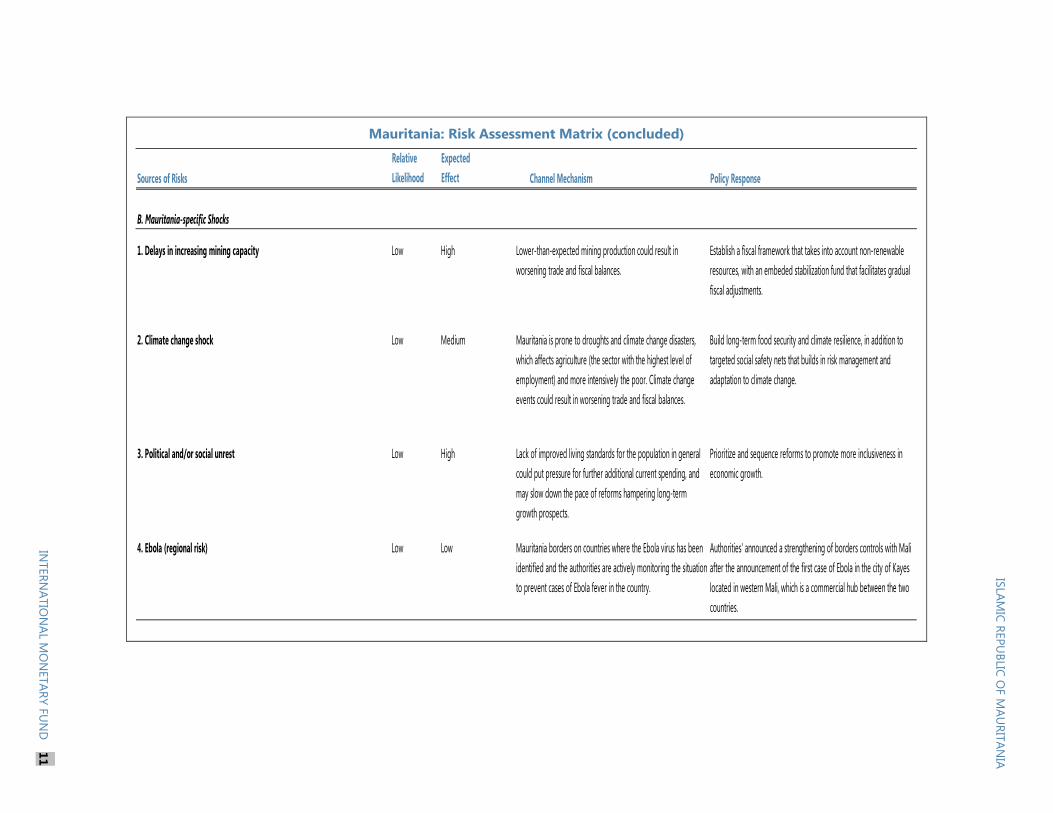
Mauritania: Risk Assessment Matrix (concluded)
Sources of Risks
Relative
Likelihood
Expected
Effect
B. Mauritania-specific Shocks
1. Delays in increasing mining capacity Low High
2. Climate change shock Low Medium
3. Political and/or social unrest Low High
4. Ebola (regional risk) Low Low
Policy ResponseChannel Mechanism
Mauritania borders on countries where the Ebola virus has been
identified and the authorities are actively monitoring the situation
to prevent cases of Ebola fever in the country.
Authorities' announced a strengthening of borders controls with Mali
after the announcement of the first case of Ebola in the city of Kayes
located in western Mali, which is a commercial hub between the two
countries.
Prioritize and sequence reforms to promote more inclusiveness in
economic growth.
Mauritania is prone to droughts and climate change disasters,
which affects agriculture (the sector with the highest level of
employment) and more intensively the poor. Climate change
events could result in worsening trade and fiscal balances.
Build long-term food security and climate resilience, in addition to
targeted social safety nets that builds in risk management and
adaptation to climate change.
Establish a fiscal framework that takes into account non-renewable
resources, with an embeded stabilization fund that facilitates gradual
fiscal adjustments.
Lack of improved living standards for the population in general
could put pressure for further additional current spending, and
may slow down the pace of reforms hampering long-term
growth prospects.
Lower-than-expected mining production could result in
worsening trade and fiscal balances.
ISLA
MIC
REP
UB
LIC O
F M
AU
RIT
AN
IA
INTER
NA
TIO
NA
L MO
NETA
RY F
UN
D
11

ISLAMIC REPUBLIC OF MAURITANIA
12 INTERNATIONAL MONETARY FUND
13. Medium-term prospects remain promising. With iron ore prices stabilizing at US$72 per
ton under the baseline, Mauritania’s large resource endowment provides ample opportunities for
development. Iron production is projected to more than double over the medium term, with real
GDP growth averaging 6.5 percent per year during 2015–20. SNIM, the public mining company, is
projected to ramp up production to MT22.75 per year by 2020 and by MT49.5 by 2030. The start of
the Tazadit underground mine in 2015 (peak production is expected after 2017 with MT2.5 per year)
and the Askaf mine in 2017 (with peak production of MT22.5 per year by 2023) are projected to
keep the growth of extractive GDP at 11 percent per year, on average, during 2015–20. Moving
forward with the Banda Gas project (with the potential of up to BTU65 billion per day over 20 years)
will provide Mauritania and the sub-region affordable and cleaner power, resulting in an additional
upside for growth in Mauritania.
14. The authorities expressed confidence in the continued strong growth and a
strengthening of the BOP over the medium term, while acknowledging the downside risks to
the external outlook.
The authorities pointed to their recent achievements despite the external shocks, including
continued elevated economic growth and contained inflation in 2014. They emphasized that
risks to macroeconomic stability could materialize in the context of a double shock (with
declining mining prices and rising oil prices, as in 2008), and noted upside risks to the outlook,
given that their development strategy was focused on scaled-up public investment that was to
be sustained by rising export earnings and fiscal revenues over the medium term.
The authorities emphasized steps to address the 2014–16 terms of trade deterioration. The
budget in 2015 aims at absorbing this external shock (¶16), and further adjustment or use of
buffers is envisaged if additional revenue shortfalls materialize. The CBM discussed the scope to
further accumulate reserves in the context of reduced FX demand for imports and additional
receipts from telecomm licensing, while envisaging higher exchange rate flexibility (¶21). Scaled-
up investment and progress in the business environment would support private sector
development and economic diversification, especially in agriculture, fishing, and services (¶26).
On that basis, the authorities did not consider additional adjustments necessary at this time.
ISLAMIC REPUBLIC OF MAURITANIA
INTERNATIONAL MONETARY FUND 13
POLICY DISCUSSIONS
The outlook depends on consolidating macroeconomic stability by strengthening governance and
addressing vulnerabilities. In addition, strengthening of the financial sector, greater financial inclusion,
and implementation of broad structural reforms to support private sector development and economic
diversification will make it possible to support growth, create jobs and promote its inclusiveness.
A. Consolidating Macroeconomic Stability by Strengthening Policy
Formulation and Public Sector Governance
Strengthening fiscal policy formulation to support medium-term sustainability
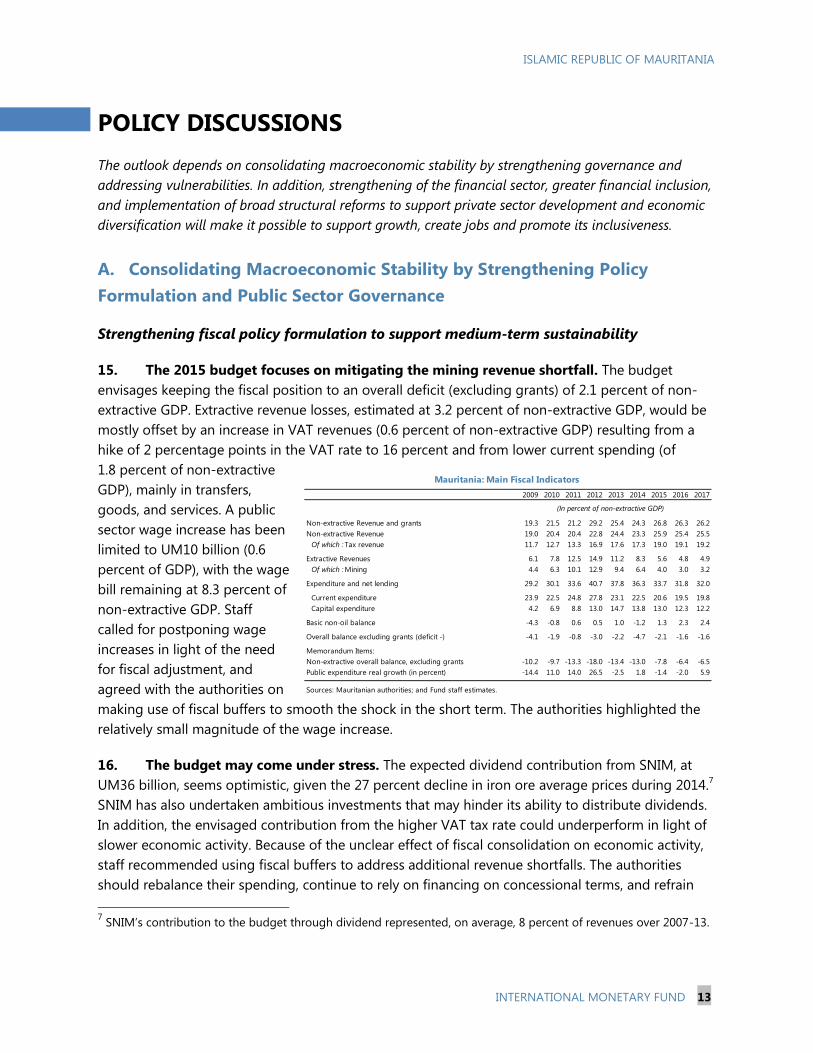
15. The 2015 budget focuses on mitigating the mining revenue shortfall. The budget
envisages keeping the fiscal position to an overall deficit (excluding grants) of 2.1 percent of non-
extractive GDP. Extractive revenue losses, estimated at 3.2 percent of non-extractive GDP, would be
mostly offset by an increase in VAT revenues (0.6 percent of non-extractive GDP) resulting from a
hike of 2 percentage points in the VAT rate to 16 percent and from lower current spending (of
1.8 percent of non-extractive
GDP), mainly in transfers,
goods, and services. A public
sector wage increase has been
limited to UM10 billion (0.6
percent of GDP), with the wage
bill remaining at 8.3 percent of
non-extractive GDP. Staff
called for postponing wage
increases in light of the need
for fiscal adjustment, and
agreed with the authorities on
making use of fiscal buffers to smooth the shock in the short term. The authorities highlighted the
relatively small magnitude of the wage increase.
16. The budget may come under stress. The expected dividend contribution from SNIM, at
UM36 billion, seems optimistic, given the 27 percent decline in iron ore average prices during 2014.7
SNIM has also undertaken ambitious investments that may hinder its ability to distribute dividends.
In addition, the envisaged contribution from the higher VAT tax rate could underperform in light of
slower economic activity. Because of the unclear effect of fiscal consolidation on economic activity,
staff recommended using fiscal buffers to address additional revenue shortfalls. The authorities
should rebalance their spending, continue to rely on financing on concessional terms, and refrain
7 SNIM’s contribution to the budget through dividend represented, on average, 8 percent of revenues over 2007-13.
2009 2010 2011 2012 2013 2014 2015 2016 2017
Non-extractive Revenue and grants 19.3 21.5 21.2 29.2 25.4 24.3 26.8 26.3 26.2
Non-extractive Revenue 19.0 20.4 20.4 22.8 24.4 23.3 25.9 25.4 25.5
Of which : Tax revenue 11.7 12.7 13.3 16.9 17.6 17.3 19.0 19.1 19.2
Extractive Revenues 6.1 7.8 12.5 14.9 11.2 8.3 5.6 4.8 4.9
Of which : Mining 4.4 6.3 10.1 12.9 9.4 6.4 4.0 3.0 3.2
Expenditure and net lending 29.2 30.1 33.6 40.7 37.8 36.3 33.7 31.8 32.0
Current expenditure 23.9 22.5 24.8 27.8 23.1 22.5 20.6 19.5 19.8
Capital expenditure 4.2 6.9 8.8 13.0 14.7 13.8 13.0 12.3 12.2
Basic non-oil balance -4.3 -0.8 0.6 0.5 1.0 -1.2 1.3 2.3 2.4
Overall balance excluding grants (deficit -) -4.1 -1.9 -0.8 -3.0 -2.2 -4.7 -2.1 -1.6 -1.6
Memorandum Items:
Non-extractive overall balance, excluding grants -10.2 -9.7 -13.3 -18.0 -13.4 -13.0 -7.8 -6.4 -6.5
Public expenditure real growth (in percent) -14.4 11.0 14.0 26.5 -2.5 1.8 -1.4 -2.0 5.9
Sources: Mauritanian authorities; and Fund staff estimates.
Mauritania: Main Fiscal Indicators
(In percent of non-extractive GDP)

ISLAMIC REPUBLIC OF MAURITANIA
14 INTERNATIONAL MONETARY FUND
from non-concessional external borrowing—even in the form of pledging future resource revenues.8
The authorities, however, were confident about budget risks remaining manageable given the
additional oil revenue windfall, which should be registered in the fiscal accounts; and the renewal of
telecom licenses at end-2015, which could provide room for reducing debt and smoothing
adjustment in case of larger-than-envisaged shocks.9
17. Staff made the following recommendations on measures to buttress medium-term
fiscal sustainability and reduce the risk of debt distress. The authorities recognize the need to
maintain efforts on these fronts.
Renew revenue mobilization efforts through improved tax collection capacity and a widening of
the tax base. To increase non-resource revenue, reforms need to be accelerated to limit tax
expenditures (under evaluation) and strengthen human resources of the tax and customs
administrations, improve information technology systems, and widen the list of taxpayers.
Curb current expenditure by proactively managing the wage bill, and by gradually phasing out
subsidies and transfers to other public sector entities. As a first step, the budget should fully
recognize the transfers to SOMELEC, the public electricity company, and establish a clear
mechanism that determines budget support,10
and register the revenue windfall from declining
oil prices to improve budget transparency. More importantly, the authorities should apply the
automatic pricing rule formula. Efforts to reduce the size of the civil service and introduce a
performance-based compensation system would reduce the wage bill and increase productivity.
A timeline for eliminating subsidies (on electricity and food products) should be accompanied
by appropriate communication and the broad establishment of the targeted cash transfer
program to limit the impact on the neediest.
Enhance monitoring of public enterprises to foster greater efficiency, including analyzing
potential fiscal risks. The authorities need to make progress in resolving pending arrears with
SOMELEC. The macro relevance of SNIM requires stronger accountability and transparency. A
broader coverage of public finances, beyond the central government, will facilitate a better
understanding and management of the fiscal stance.
8 Collateralized borrowing, by pledging future mineral revenues, is made on nonconcessional terms, and reduces
budget flexibility (by earmarking revenues for debt service) and a country’s flexibility in mobilizing and managing
foreign exchange, increasing its potential vulnerability to shocks. It could also worsen the status of current and future
creditors by protecting some; can raise creditworthiness risks; and usually ends up being more costly than more
traditional borrowing schemes. Careful consideration of their full implications needs to be taking into account before
engaging in such schemes.
9 The authorities introduced a new petroleum price structure and adjustment formula, bringing domestic prices to
international levels in 2012 (IMF Country Report No. 12/323); however, domestic prices have remained relatively
stable despite the recent decline in oil prices, which has translated into a revenue windfall for the authorities. These
additional revenues have not yet been registered in the TOFE, the budget reporting system, nor in the 2015 budget.
10 The MoF is in discussions with SOMELEC to determine the budget transfer required to support the operations of
SOMELEC.
ISLAMIC REPUBLIC OF MAURITANIA
INTERNATIONAL MONETARY FUND 15
Enhance the efficiency of capital spending by ensuring consistency with PRSP priorities and
absorption capacity, while ensuring debt sustainability. Identifying the magnitude of the
infrastructure gap and establishing a multiyear program of investment could increase
investment efficiency.
Reduce risks of debt distress by resolving Kuwait’s passive debt; contracting external loans on
concessional terms; enhancing the oversight and capacity of the public debt management office
at the Ministry of Finance; and improving institutional capacity and coordination to enhance
debt management practices.
18. Addressing fiscal dependence on extractive resources is necessary to improve fiscal
policy formulation. The budgetary framework should include a fiscal rule, a fiscal anchor, and a
fiscal stabilization fund that take price volatility into account, while incorporating intergenerational
equity considerations through a resource wealth fund. This budgetary framework should be
supported by robust institutions to enhance the management of mining wealth. Strengthening fiscal
policy formulation will help better safeguard the budget against boom-and-bust cycles in
nonrenewable resources (Box 3), reduce procyclicality, and provide predictability to fiscal policy. The
authorities agreed in principle with this approach but felt that such reforms are premature. Staff
supported the authorities’ intention to continue pursuing reforms in public financial management,
including a multiyear fiscal framework and the approval of the organic finance law (planned for
2015), which are considered prerequisites for introducing the fiscal rule.
ISLAMIC REPUBLIC OF MAURITANIA
16 INTERNATIONAL MONETARY FUND
Box 3. Strengthening the Macro-Fiscal Framework in Mauritania1/
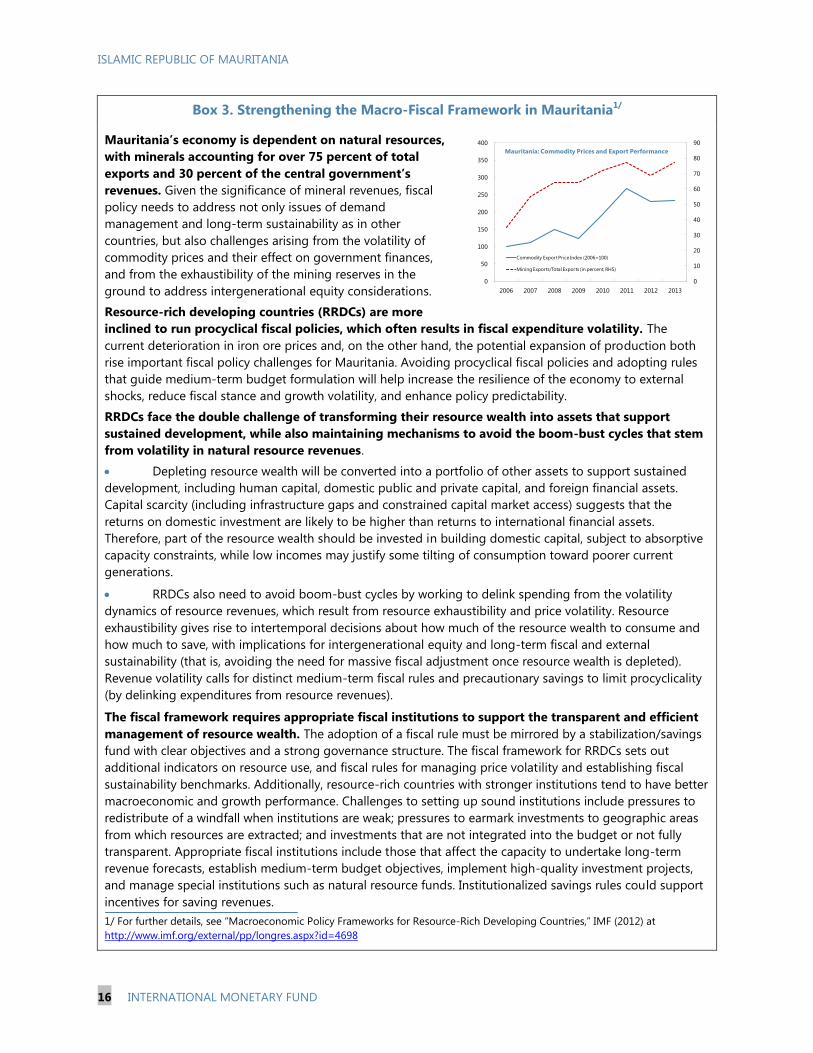
Mauritania’s economy is dependent on natural resources,
with minerals accounting for over 75 percent of total
exports and 30 percent of the central government’s
revenues. Given the significance of mineral revenues, fiscal
policy needs to address not only issues of demand
management and long-term sustainability as in other
countries, but also challenges arising from the volatility of
commodity prices and their effect on government finances,
and from the exhaustibility of the mining reserves in the
ground to address intergenerational equity considerations.
Resource-rich developing countries (RRDCs) are more
inclined to run procyclical fiscal policies, which often results in fiscal expenditure volatility. The
current deterioration in iron ore prices and, on the other hand, the potential expansion of production both
rise important fiscal policy challenges for Mauritania. Avoiding procyclical fiscal policies and adopting rules
that guide medium-term budget formulation will help increase the resilience of the economy to external
shocks, reduce fiscal stance and growth volatility, and enhance policy predictability.
RRDCs face the double challenge of transforming their resource wealth into assets that support
sustained development, while also maintaining mechanisms to avoid the boom-bust cycles that stem
from volatility in natural resource revenues.
Depleting resource wealth will be converted into a portfolio of other assets to support sustained
development, including human capital, domestic public and private capital, and foreign financial assets.
Capital scarcity (including infrastructure gaps and constrained capital market access) suggests that the
returns on domestic investment are likely to be higher than returns to international financial assets.
Therefore, part of the resource wealth should be invested in building domestic capital, subject to absorptive
capacity constraints, while low incomes may justify some tilting of consumption toward poorer current
generations.
RRDCs also need to avoid boom-bust cycles by working to delink spending from the volatility
dynamics of resource revenues, which result from resource exhaustibility and price volatility. Resource
exhaustibility gives rise to intertemporal decisions about how much of the resource wealth to consume and
how much to save, with implications for intergenerational equity and long-term fiscal and external
sustainability (that is, avoiding the need for massive fiscal adjustment once resource wealth is depleted).
Revenue volatility calls for distinct medium-term fiscal rules and precautionary savings to limit procyclicality
(by delinking expenditures from resource revenues).
The fiscal framework requires appropriate fiscal institutions to support the transparent and efficient
management of resource wealth. The adoption of a fiscal rule must be mirrored by a stabilization/savings
fund with clear objectives and a strong governance structure. The fiscal framework for RRDCs sets out
additional indicators on resource use, and fiscal rules for managing price volatility and establishing fiscal
sustainability benchmarks. Additionally, resource-rich countries with stronger institutions tend to have better
macroeconomic and growth performance. Challenges to setting up sound institutions include pressures to
redistribute of a windfall when institutions are weak; pressures to earmark investments to geographic areas
from which resources are extracted; and investments that are not integrated into the budget or not fully
transparent. Appropriate fiscal institutions include those that affect the capacity to undertake long-term
revenue forecasts, establish medium-term budget objectives, implement high-quality investment projects,
and manage special institutions such as natural resource funds. Institutionalized savings rules could support
incentives for saving revenues.
1/ For further details, see “Macroeconomic Policy Frameworks for Resource-Rich Developing Countries,” IMF (2012) at
http://www.imf.org/external/pp/longres.aspx?id=4698
0
10
20
30
40
50
60
70
80
90
0
50
100
150
200
250
300
350
400
2006 2007 2008 2009 2010 2011 2012 2013
Commodity Export Price Index (2006=100)
Mining Exports/Total Exports (in percent, RHS)
Mauritania: Commodity Prices and Export Performance

ISLAMIC REPUBLIC OF MAURITANIA
INTERNATIONAL MONETARY FUND 17
Coordinating monetary and exchange rate policies to support contained inflation and
enhance exchange rate flexibility
19. Monetary conditions are favorable to strengthening the monetary policy framework.
Staff agreed with the authorities on the need to evaluate liquidity conditions, adopt a formal
liquidity forecasting framework and enlarge liquidity management tools. In the context of contained
inflation, the CBM has relied on indirect monetary policy instruments (FX interventions and T-bills)
to reduce liquidity, leaving its policy rate and reserve requirements unchanged since 2009.11
However, FX interventions will be constrained by lower reserves as an instrument for managing
liquidity. Staff called for a start to formalizing monetary policy and the liquidity management
framework in the context of weak inflationary pressures with a view to strengthening governance
and institutions for the conduct of monetary policy; and agreed with the authorities on expanding
the instruments to include standing facilities and deposit certificates. The authorities noted that
implementing the strategy to develop these instruments needs to go in parallel with the
recapitalization of the CBM to ensure its operational autonomy and facilitate bearing the costs of
monetary policy. Although inflation has remained contained in recent years, a volatile global outlook
and pressures on FX reserves could result in rapid changes in price expectations. Staff agreed with a
proactive use of reserve requirements if demand pressures materialize ahead of reforms, given the
limited effectiveness of the interest rate transmission mechanism.
20. Gradually reforming the foreign exchange market will be essential to increase the role
of the exchange rate as a shock absorber and to support economic development. The
exchange rate regime has been reclassified as “stabilized,” from “other managed” (see Informational
Annex), and staff assessed the ouguiya as broadly consistent with medium-term fundamentals
(Appendix II). However, the current exchange rate policy of gradual depreciation vis-à-vis the U.S.
dollar may result in misalignment from a short-term perspective in the event of further
strengthening of the U.S. dollar vis-à-vis other
major currencies, given the extended negative
terms of trade. The authorities agreed with
staff’s assessment and noted the challenges of
assessing the exchange rate while in the
process of economic transformation. In light of
declining reserves in 2014, Mauritania needs to
rebuild external buffers to support external
stability, and plans to gradually liberalize the
foreign exchange market. The market is
characterized by excess demand, segmentation,
and high levels of central bank intervention.
Reducing market imperfections,
11
The CBM does not have standing deposit and lending facilities nor plays a lender-of-last-resort role in practice,
putting pressure on banks to hold large precautionary reserves. An additionally, banks are required to hold
100 percent of their demand at the FX fixing auction as ouguiyas’ excess reserves in their CBM’s current account.
0
10
20
30
40
50
60
70
80
0
5
10
15
20
25
30
35
40
45
50
Oct-08 Oct-09 Oct-10 Oct-11 Oct-12 Oct-13 Oct-14
Banks' free reserves Banks' holdings of T-bills (RHS)
Banking Sector Liquidity(In billions of UM)
ISLAMIC REPUBLIC OF MAURITANIA
18 INTERNATIONAL MONETARY FUND
increasing predictability in FX intervention (by, among other measures, regulating private sector
access to direct sales under exceptional circumstances) and shifting toward a wholesale auction may
deepen the market and support exchange rate flexibility. Over the long term, deeper coordination
between exchange rate and monetary policies, combined with changes in regulatory and
institutional arrangements, will support gradual development of the interbank FX market.
21. The authorities are committed to meeting Mauritania’s obligations under Article VIII
of the Fund’s Articles of Agreement. A recent comprehensive review of Mauritania’s foreign
exchange system identified three multiple currency practices (MCPs) and two exchange
restrictions.12
The authorities have already eliminated the three MCPs and the exchange restriction
arising from the limitation on the availability of foreign exchange for multiple transactions below
US$50,000, while ensuring a minimal impact on the functioning of the market; therefore the only
remaining exchange restriction arises from the insufficient foreign exchange availability at the fixing
sessions (auctions) organized by the CBM for those transactions that are required to be submitted
to the fixing sessions. The authorities noted that these exchange measures existed since the FX
market was first set up in 2007 with Fund technical assistance. The authorities request the Fund’s
approval to temporarily maintain the remaining exchange restriction as it is necessary for BOP
reasons and does not discriminate among Fund members. The authorities commit to eliminate the
restriction, working with staff, within one year following the approval.
B. Strengthening Financial Stability and Promoting Financial Inclusion
22. The strengthening of the financial regulatory framework needs to be accompanied by
its enforcement, to support financial stability. The CBM has adopted regulation on risk
classification, provisioning, and bank governance, and is developing risk-based supervision
procedures and on-site inspection methodology. Supervisory capacity has also been strengthened
with new personnel for inspections and IT systems to support real-time data transmission. However,
enforcement is weak because of the lack of legal protection for the supervisory authorities. In
addition, strengthened procedures for licensing and consolidated supervision, for risk concentration
and capital requirements, higher reporting standards and transparency on the financial situation of
credit institutions as well as expanding CBM supervision to the Deposit and Development Fund
(CDD) and the insurance sector will help support financial stability. Staff welcomed the authorities’
interest in anchoring the medium-term financial reform agenda in the accompanying FSAP
(Appendix III).
12
The MCPs arise from (i) the mandatory commissions and penalties on transactions at the fixing session (auctions);
(ii) the mandatory use of the official rate for direct FX transactions with the CBM and the lack of a mechanism to
prevent the deviation by more than 2 percent of the official rate from the fixing rate used in the fixing session and
from the exchange rate used in other transactions in the market; and (iii) the segmentation of the market in the
absence of a mechanism to ensure that the exchange rates in the fixing sessions and bank-to-client bilateral
transactions do not deviate from each other by more than 2 percent. The exchange restrictions arise from (i) the
insufficient foreign exchange availability at the fixing sessions organized by the CBM for those transactions that are
required to be submitted to the fixing sessions, and (ii) the limitation on the availability of foreign exchange for
multiple transactions below US$50,000.
ISLAMIC REPUBLIC OF MAURITANIA
INTERNATIONAL MONETARY FUND 19
23. The CBM’s role in times of stress needs to be strengthened. The CBM agreed with staff’s
recommendations on the need to revise the existing banking resolution framework for addressing
troubled financial institutions. Following the FSSA recommendations, the authorities agreed to
expedite a revised banking law that provides independence and legal protection to the authorities in
exercising their competencies, while introducing early-warning solvency and liquidity indicators. The
authorities also agreed on the need to reinforce the deposit guarantee fund, which remains
insufficient.
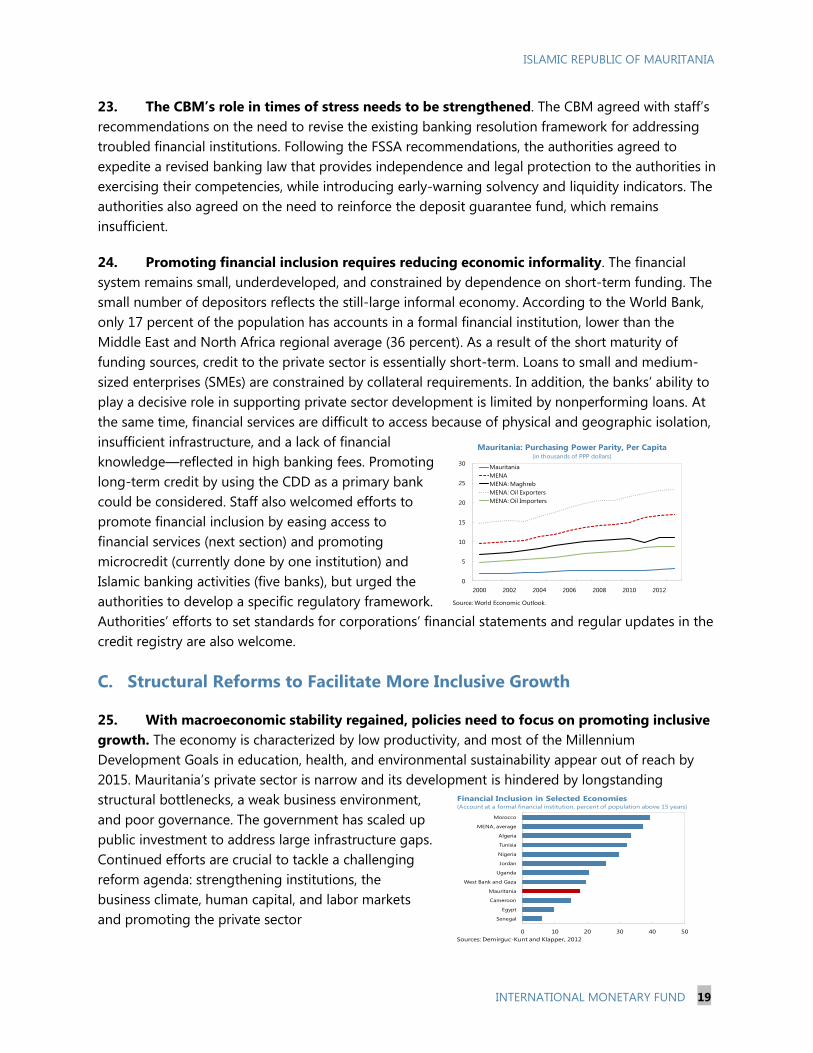
24. Promoting financial inclusion requires reducing economic informality. The financial
system remains small, underdeveloped, and constrained by dependence on short-term funding. The
small number of depositors reflects the still-large informal economy. According to the World Bank,
only 17 percent of the population has accounts in a formal financial institution, lower than the
Middle East and North Africa regional average (36 percent). As a result of the short maturity of
funding sources, credit to the private sector is essentially short-term. Loans to small and medium-
sized enterprises (SMEs) are constrained by collateral requirements. In addition, the banks’ ability to
play a decisive role in supporting private sector development is limited by nonperforming loans. At
the same time, financial services are difficult to access because of physical and geographic isolation,
insufficient infrastructure, and a lack of financial
knowledge—reflected in high banking fees. Promoting
long-term credit by using the CDD as a primary bank
could be considered. Staff also welcomed efforts to
promote financial inclusion by easing access to
financial services (next section) and promoting
microcredit (currently done by one institution) and
Islamic banking activities (five banks), but urged the
authorities to develop a specific regulatory framework.
Authorities’ efforts to set standards for corporations’ financial statements and regular updates in the
credit registry are also welcome.
C. Structural Reforms to Facilitate More Inclusive Growth
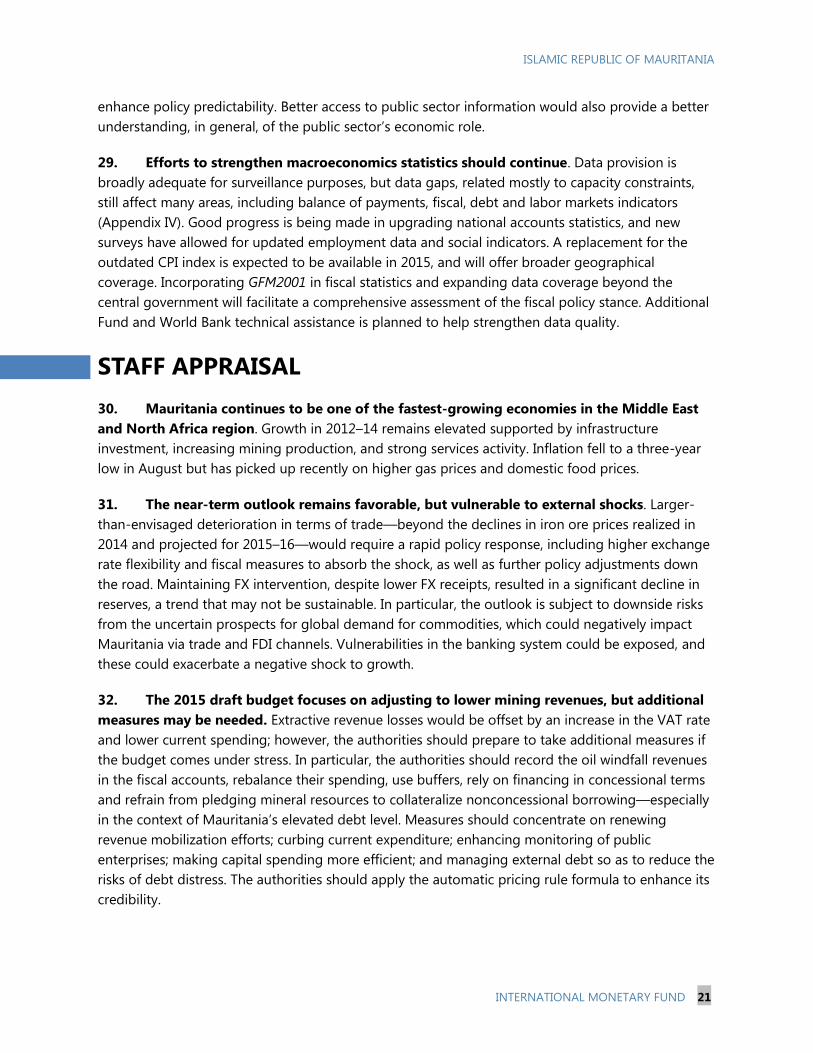
25. With macroeconomic stability regained, policies need to focus on promoting inclusive
growth. The economy is characterized by low productivity, and most of the Millennium
Development Goals in education, health, and environmental sustainability appear out of reach by
2015. Mauritania’s private sector is narrow and its development is hindered by longstanding
structural bottlenecks, a weak business environment,
and poor governance. The government has scaled up
public investment to address large infrastructure gaps.
Continued efforts are crucial to tackle a challenging
reform agenda: strengthening institutions, the
business climate, human capital, and labor markets
and promoting the private sector
0
5
10
15
20
25
30
2000 2002 2004 2006 2008 2010 2012
Mauritania
MENA
MENA: Maghreb
MENA: Oil Exporters
MENA: Oil Importers
Mauritania: Purchasing Power Parity, Per Capita(in thousands of PPP dollars)
Source: World Economic Outlook.
0 10 20 30 40 50
Senegal
Egypt
Cameroon
Mauritania
West Bank and Gaza
Uganda
Jordan
Nigeria
Tunisia
Algeria
MENA, average
Morocco
Sources: Demirguc-Kunt and Klapper, 2012
Financial Inclusion in Selected Economies(Account at a formal financial institution, percent of population above 15 years)

ISLAMIC REPUBLIC OF MAURITANIA
20 INTERNATIONAL MONETARY FUND
as the engine of growth, economic diversification, and job creation while supporting better social
protection and economic inclusion of vulnerable and marginalized people.
26. The authorities envisage structural reforms to manage external risks more effectively
and promote job creation. The authorities recognized the need to focus on promoting private
sector development and economic diversification while protecting the most vulnerable. This strategy
will strengthen the economy’s resilience to external shocks and offer macroeconomic benefits
associated with job creation and inclusiveness.
The authorities have identified comparative sectoral advantages (in agriculture, livestock, and
fishing) and have started implementing plans to increase value added in production and to
diversify an export base narrowly concentrated in unprocessed fishing and mining.
The private sector development strategy is supported by an action plan to improve the business
environment. Mauritania ranks low on the World Bank’s 2014 Doing Business indicators (173 out
of 189). The business climate is encumbered by burdensome procedures related to insolvency,
payment of taxes, starting a business, and obtaining credit. The authorities have taken steps to
improve the business climate by eliminating minimum capital requirements and by introducing a
one-stop shop to facilitate SME creation. In addition, staff encouraged the authorities to
increase transparency in procurement, develop the public-private partnership framework, and
strengthen dialogue with private sector stakeholders.
The authorities recognized the need for higher human capital and better jobs. Reforms are
needed to improve education and the functioning of the labor market so as to generate more
jobs in the formal sector. Assuming a constant rate of participation, the economy will need to
create some 200,000 jobs during 2014–20 to absorb new entrants in the labor market. The
unemployment rate reported and the informal sector mask significant heterogeneity across age,
gender, and region.
27. The authorities have made progress in targeting social transfers. With the support of the
World Bank, the authorities launched a household survey to identify poverty profiles. The survey will
result in a registry of beneficiaries that will facilitate better targeting of transfers to the most
vulnerable. Progress has been limited, however, and the timeline for implementing countrywide
targeted social transfers is unclear, with important implications for subsidy reform. A parallel
strategy to enhance access to, and quality of, public services will also be important for the future
development of conditional cash transfers to improve food security, education, and health
outcomes.
28. Strengthening governance and institutions will support a more inclusive economic
process. A level playing field that allows private companies to participate and compete will increase
the contribution of the private sector as a growth engine. This will also require large state-owned
companies such as SNIM—which has become active in non-mining activities—to refocus on their
mandate to improve their efficiency. In addition, enhancing the governance of public institutions,
which should include communicating decisions undertaken in the conduct of macro policies, would
ISLAMIC REPUBLIC OF MAURITANIA
INTERNATIONAL MONETARY FUND 21
enhance policy predictability. Better access to public sector information would also provide a better
understanding, in general, of the public sector’s economic role.
29. Efforts to strengthen macroeconomics statistics should continue. Data provision is
broadly adequate for surveillance purposes, but data gaps, related mostly to capacity constraints,
still affect many areas, including balance of payments, fiscal, debt and labor markets indicators
(Appendix IV). Good progress is being made in upgrading national accounts statistics, and new
surveys have allowed for updated employment data and social indicators. A replacement for the
outdated CPI index is expected to be available in 2015, and will offer broader geographical
coverage. Incorporating GFM2001 in fiscal statistics and expanding data coverage beyond the
central government will facilitate a comprehensive assessment of the fiscal policy stance. Additional
Fund and World Bank technical assistance is planned to help strengthen data quality.
STAFF APPRAISAL
30. Mauritania continues to be one of the fastest-growing economies in the Middle East
and North Africa region. Growth in 2012–14 remains elevated supported by infrastructure
investment, increasing mining production, and strong services activity. Inflation fell to a three-year
low in August but has picked up recently on higher gas prices and domestic food prices.
31. The near-term outlook remains favorable, but vulnerable to external shocks. Larger-
than-envisaged deterioration in terms of trade—beyond the declines in iron ore prices realized in
2014 and projected for 2015–16—would require a rapid policy response, including higher exchange
rate flexibility and fiscal measures to absorb the shock, as well as further policy adjustments down
the road. Maintaining FX intervention, despite lower FX receipts, resulted in a significant decline in
reserves, a trend that may not be sustainable. In particular, the outlook is subject to downside risks
from the uncertain prospects for global demand for commodities, which could negatively impact
Mauritania via trade and FDI channels. Vulnerabilities in the banking system could be exposed, and
these could exacerbate a negative shock to growth.
32. The 2015 draft budget focuses on adjusting to lower mining revenues, but additional
measures may be needed. Extractive revenue losses would be offset by an increase in the VAT rate
and lower current spending; however, the authorities should prepare to take additional measures if
the budget comes under stress. In particular, the authorities should record the oil windfall revenues
in the fiscal accounts, rebalance their spending, use buffers, rely on financing in concessional terms
and refrain from pledging mineral resources to collateralize nonconcessional borrowing—especially
in the context of Mauritania’s elevated debt level. Measures should concentrate on renewing
revenue mobilization efforts; curbing current expenditure; enhancing monitoring of public
enterprises; making capital spending more efficient; and managing external debt so as to reduce the
risks of debt distress. The authorities should apply the automatic pricing rule formula to enhance its
credibility.
ISLAMIC REPUBLIC OF MAURITANIA
22 INTERNATIONAL MONETARY FUND
33. Reforming the fiscal framework to address fiscal dependence on extractive resources
will strengthen fiscal policy formulation. The budgetary framework should include a fiscal rule, a
fiscal anchor, and a fiscal stabilization fund that take price volatility into account to help safeguard
the budget against boom-and-bust cycles, while incorporating intergenerational equity
considerations through a natural resource fund. Robust institutions are also needed to manage
prospective increasing mining wealth. Continuing with reforms in public financial management,
including a multi-year fiscal framework and the approval of the organic finance law, are crucial for
introducing the fiscal rule.
34. Strengthening the monetary policy framework will facilitate proactive use of monetary
policy. The authorities should take advantage of the present contained inflation to adopt a formal
liquidity forecasting framework and enlarge the set of liquidity management tools. This will help to
formalize monetary policy; improve the transmission mechanism to the real economy, and
strengthen institutions and governance for the conduct of monetary policy. By managing liquidity
more effectively, the CBM would be in a better position to reduce FX intervention. The
recapitalization of the CBM should be undertaken to support its conduct of monetary policy.
35. Gradually increasing exchange rate flexibility will help absorb external shocks and
support economic development over the long term. The exchange rate regime has been
reclassified as “stabilized” from “other managed”. While the ouguiya is in line with fundamentals
from a medium-term perspective, the current exchange rate policy of gradual depreciation vis-à-vis
the U.S. dollar may result in misalignment from a short-term perspective in the event of further
strengthening of the U.S. dollar vis-à-vis other major currencies given the extended negative terms
of trade. Mauritania needs to rebuild external buffers to support external stability, and plans to
gradually liberalize the foreign exchange market. Reducing market imperfections, increasing
predictability in FX intervention and shifting toward a wholesale auction would deepen the market
and support higher exchange rate flexibility. Over the long term, the central bank needs to transition
toward the objective of intervening only to smooth excessive exchange rate volatility. Coordination
between exchange rate and monetary policies, combined with changes in the regulatory and
institutional arrangements, will support gradual development of the interbank FX market.
36. Efforts to strengthen financial stability should continue. Building on progress in
strengthening banks’ capitalization and liquidity, the CBM should strictly enforce the existing
regulatory framework, which will require revising the banking law to provide legal protection of staff
in the exercise of their competencies. In addition, strengthening procedures for licensing and
consolidated supervision and for risk concentration and capital requirements, higher reporting
standards, and transparency on the financial situation of credit institutions, as well as expanding
CBM supervision to the public bank and the insurance sector, will help support financial stability. The
bank resolution regime should be enhanced, and a legal framework developed for introducing
early-warning solvency and liquidity indicators. The deposit guarantee fund needs additional
funding. Staff welcomed the authorities’ objective in anchoring the medium-term financial reform
agenda in the accompanying FSSA recommendations.
ISLAMIC REPUBLIC OF MAURITANIA
INTERNATIONAL MONETARY FUND 23
37. Mauritania’s medium-term prospects remain promising. Natural resource endowments
provide ample opportunities for development. Mining GDP is projected to expand rapidly during the
next five years as large projects come on stream. Sustained growth outside the mining sector would
need to be supported by continued structural reforms to promote private sector development and
economic diversification through improvements in the business environment and higher human
capital, while protecting the most vulnerable. Promoting access to credit and financial inclusion are
also required for private sector development. Efforts to strengthen macroeconomic statistics should
continue.
38. Staff supports the authorities’ request for approval of the remaining exchange
restriction. Staff welcomes the determination of the authorities to bring Mauritanian foreign
exchange regime in compliance with the member’s Article VIII obligations, and the timely
elimination of most of the identified exchange measures. Staff considers that the temporary
retention of the remaining exchange restriction is necessary for balance of payments reasons. In
addition, the exchange restriction does not discriminate among Fund members. In view of the
authorities’ commitment to eliminate this restriction in the next calendar year, and progress already
achieved regarding other identified measures, staff recommends the temporary approval of the
retention of this restriction until January 28, 2016 or the date of the conclusion of the next Article IV
consultation, whichever is earlier.
39. It is proposed that the next Article IV consultation be held on the standard 12-month cycle.
ISLAMIC REPUBLIC OF MAURITANIA
24 INTERNATIONAL MONETARY FUND
Figure 1. Mauritania: Economic Developments vis-à-vis Regional Developments, 2008–15
-2
0
2
4
6
8
10
12
2008 2009 2010 2011 2012 2013 2014
est.
2015
proj.
Sub-Saharan Africa
MENAP oil importers
Mauritania
Real GDP Growth
(In percent)
0
2
4
6
8
10
12
14
16
18
2008 2009 2010 2011 2012 2013 2014
est.
2015
proj.
Sub-Saharan Africa
MENAP oil importers
Mauritania
Inflation
(Period average, in percent)
-35
-25
-15
-5
5
2008 2009 2010 2011 2012 2013 2014
est.
2015
proj.
Sub-Saharan Africa
MENAP oil importers
Mauritania
Current Account Balance
0
2
4
6
8
10
2008 2009 2010 2011 2012 2013 2014 est. 2015 proj.
Sub-Saharan Africa
MENAP oil importers
Mauritania
Gross Official Reserves
(In months of imports)
-16
-12
-8
-4
0
4
8
12
2008 2009 2010 2011 2012 2013 2014
est.
2015
proj.
Sub-Saharan Africa
MENAP oil importers
Mauritania
Overall Fiscal Balance
(Excluding grants, in percent of GDP)
Mauritania has benefited from strong economic
growth...
... with subdued inflation.
Fiscal position has strengthened over the years but has
weakened lately owing to lower mining revenues.
The current account has deteriorated in line with lower
terms of trade and is expected to improve because of
lower investment in mining and transfers.
Official foreign reserves improved significantly in the last years but declined lately with lower FX receipts.
Sources: Mauritanian authorities; and IMF staff estimates.
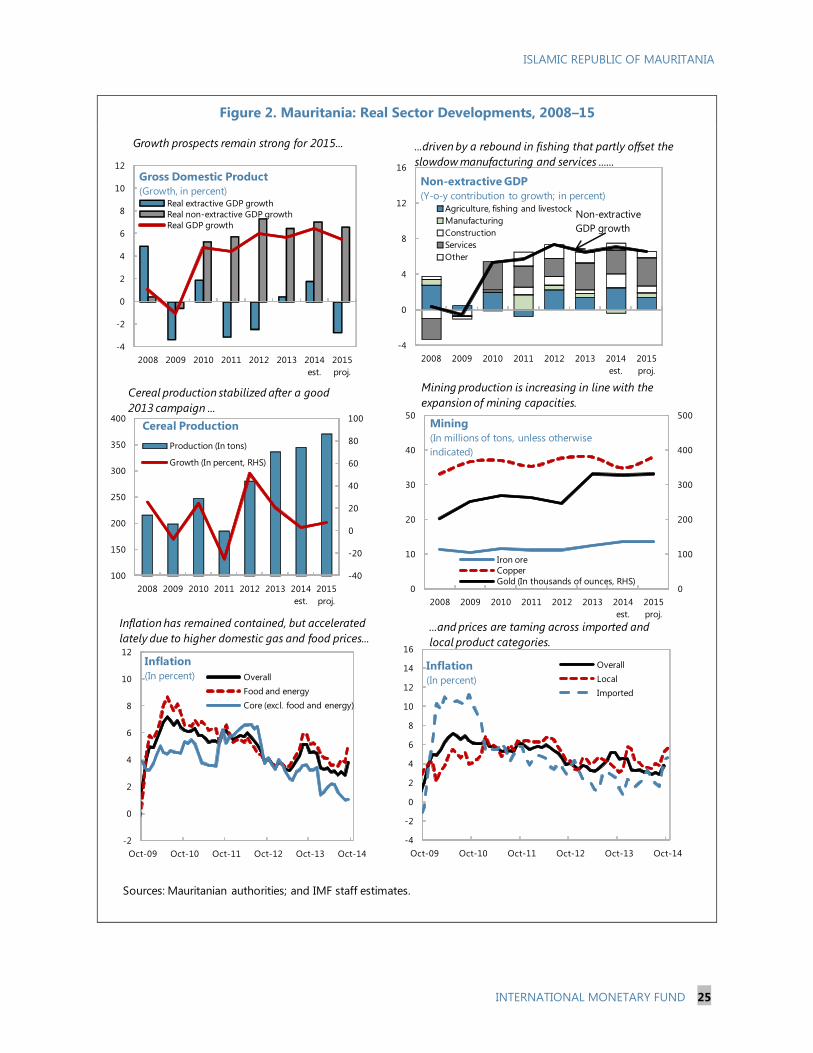
ISLAMIC REPUBLIC OF MAURITANIA
INTERNATIONAL MONETARY FUND 25
Figure 2. Mauritania: Real Sector Developments, 2008–15
Sources: Mauritanian authorities; and IMF staff estimates.
-4
-2
0
2
4
6
8
10
12
2008 2009 2010 2011 2012 2013 2014
est.
2015
proj.
Real extractive GDP growth
Real non-extractive GDP growth
Real GDP growth
Gross Domestic Product
(Growth, in percent)
-4
0
4
8
12
16
2008 2009 2010 2011 2012 2013 2014
est.
2015
proj.
Agriculture, fishing and livestock
Manufacturing
Construction
Services
Other
Non-extractive GDP
(Y-o-y contribution to growth; in percent)
Non-extractive
GDP growth
-40
-20
0
20
40
60
80
100
100
150
200
250
300
350
400
2008 2009 2010 2011 2012 2013 2014
est.
2015
proj.
Production (In tons)
Growth (In percent, RHS)
Cereal Production
0
100
200
300
400
500
0
10
20
30
40
50
2008 2009 2010 2011 2012 2013 2014
est.
2015
proj.
Iron ore
Copper
Gold (In thousands of ounces, RHS)
Mining
(In millions of tons, unless otherwise
indicated)
-2
0
2
4
6
8
10
12
Oct-09 Oct-10 Oct-11 Oct-12 Oct-13 Oct-14
Overall
Food and energy
Core (excl. food and energy)
Inflation
(In percent)
-4
-2
0
2
4
6
8
10
12
14
16
Oct-09 Oct-10 Oct-11 Oct-12 Oct-13 Oct-14
Overall
Local
Imported
Inflation
(In percent)
Growth prospects remain strong for 2015... ...driven by a rebound in fishing that partly offset the
slowdow manufacturing and services ......
Cereal production stabilized after a good
2013 campaign ...
Mining production is increasing in line with the
expansion of mining capacities.
Inflation has remained contained, but accelerated
lately due to higher domestic gas and food prices......and prices are taming across imported and
local product categories.
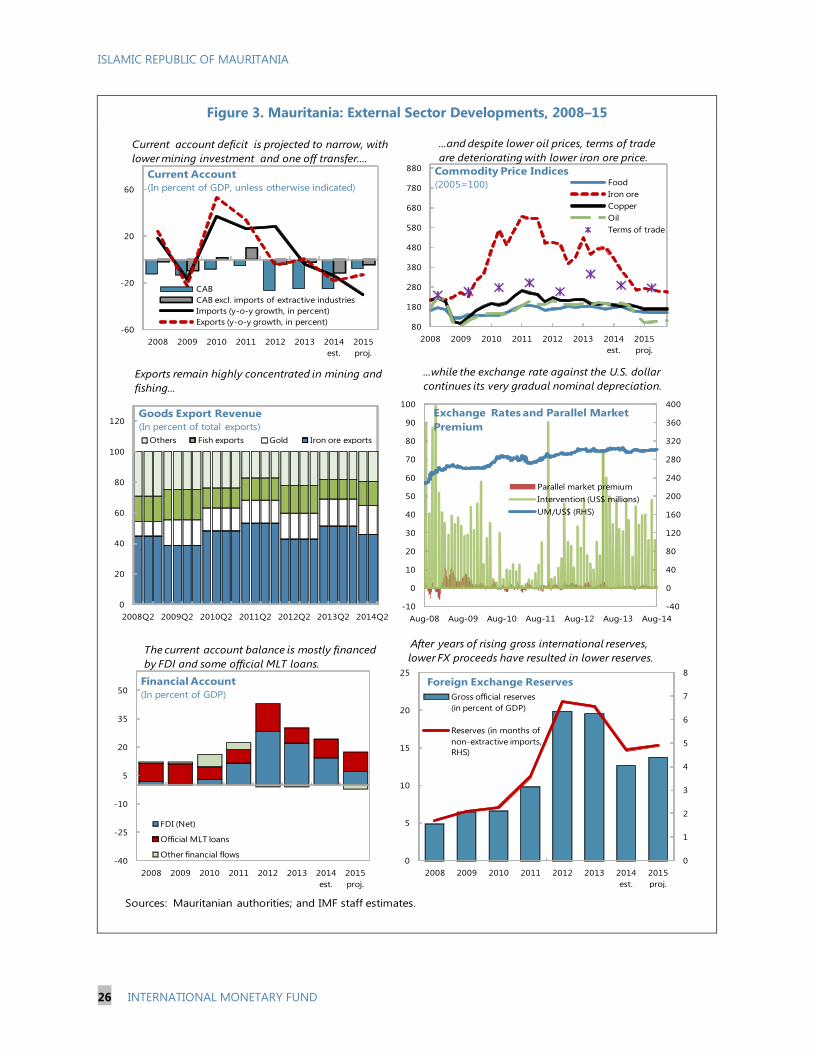
ISLAMIC REPUBLIC OF MAURITANIA
26 INTERNATIONAL MONETARY FUND
Figure 3. Mauritania: External Sector Developments, 2008–15
Sources: Mauritanian authorities; and IMF staff estimates.
-60
-20
20
60
2008 2009 2010 2011 2012 2013 2014
est.
2015
proj.
CAB
CAB excl. imports of extractive industries
Imports (y-o-y growth, in percent)
Exports (y-o-y growth, in percent)
Current Account
(In percent of GDP, unless otherwise indicated)
-40
0
40
80
120
160
200
240
280
320
360
400
-10
0
10
20
30
40
50
60
70
80
90
100
Aug-08 Aug-09 Aug-10 Aug-11 Aug-12 Aug-13 Aug-14
Parallel market premium
Intervention (US$ millions)
UM/US$ (RHS)
Exchange Rates and Parallel Market
Premium
0
1
2
3
4
5
6
7
8
0
5
10
15
20
25
2008 2009 2010 2011 2012 2013 2014
est.
2015
proj.
Gross official reserves
(in percent of GDP)
Reserves (in months of
non-extractive imports,
RHS)
Foreign Exchange Reserves
80
180
280
380
480
580
680
780
880
2008 2009 2010 2011 2012 2013 2014
est.
2015
proj.
Food
Iron ore
Copper
Oil
Terms of trade
Commodity Price Indices
(2005=100)
-40
-25
-10
5
20
35
50
2008 2009 2010 2011 2012 2013 2014
est.
2015
proj.
FDI (Net)
Official MLT loans
Other financial flows
Financial Account
(In percent of GDP)
The current account balance is mostly financed
by FDI and some official MLT loans.
Current account deficit is projected to narrow, with
lower mining investment and one off transfer....
...and despite lower oil prices, terms of trade
are deteriorating with lower iron ore price.
...while the exchange rate against the U.S. dollar
continues its very gradual nominal depreciation.Exports remain highly concentrated in mining and
fishing...
After years of rising gross international reserves,
lower FX proceeds have resulted in lower reserves.
0
20
40
60
80
100
120
2008Q2 2009Q2 2010Q2 2011Q2 2012Q2 2013Q2 2014Q2
Others Fish exports Gold Iron ore exports
Goods Export Revenue
(In percent of total exports)
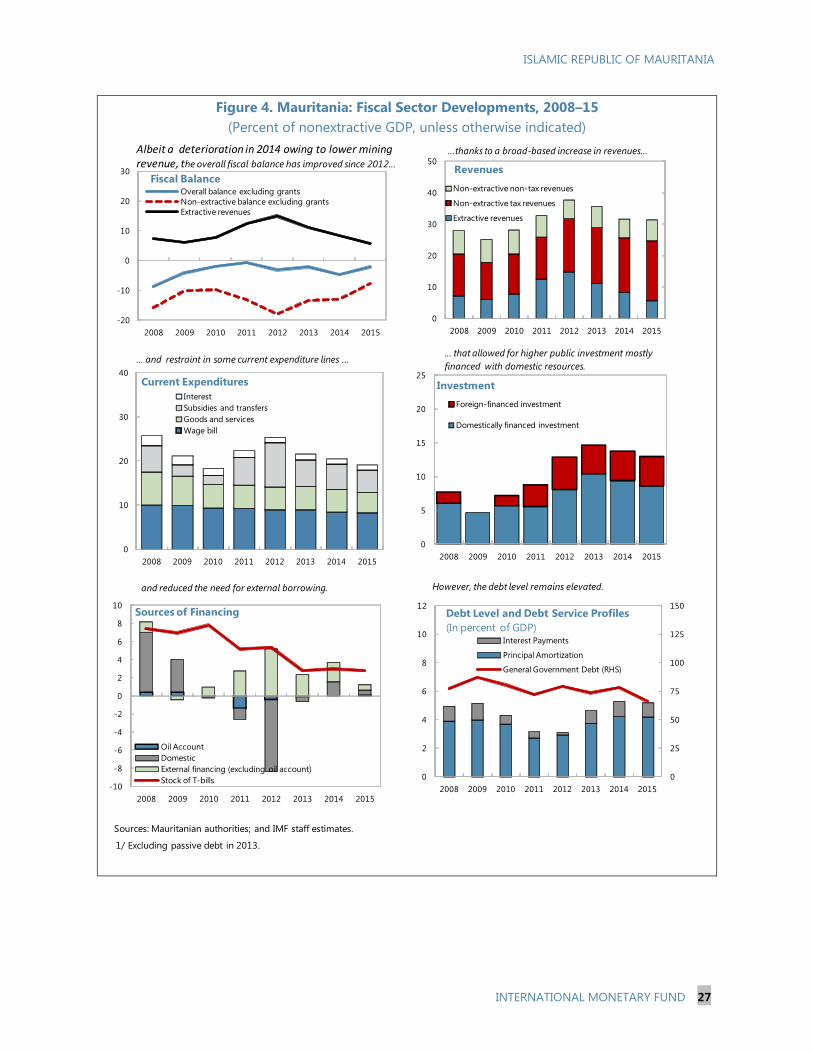
ISLAMIC REPUBLIC OF MAURITANIA
INTERNATIONAL MONETARY FUND 27
Figure 4. Mauritania: Fiscal Sector Developments, 2008–15
(Percent of nonextractive GDP, unless otherwise indicated)
Sources: Mauritanian authorities; and IMF staff estimates.
1/ Excluding passive debt in 2013.
-20
-10
0
10
20
30
2008 2009 2010 2011 2012 2013 2014 2015
Overall balance excluding grants
Non-extractive balance excluding grants
Extractive revenues
Fiscal Balance
2008 2009 2010 2011 2012 2013 2014 2015
0
10
20
30
40
50
Non-extractive non-tax revenues
Non-extractive tax revenues
Extractive revenues
Revenues
0
10
20
30
40
2008 2009 2010 2011 2012 2013 2014 2015
Interest
Subsidies and transfers
Goods and services
Wage bill
Current Expenditures
-10
-8
-6
-4
-2
0
2
4
6
8
10
2008 2009 2010 2011 2012 2013 2014 2015
Oil Account
Domestic
External financing (excluding oil account)
Stock of T-bills
Sources of Financing
0
5
10
15
20
25
2008 2009 2010 2011 2012 2013 2014 2015
Foreign-financed investment
Domestically financed investment
Investment
0
25
50
75
100
125
150
0
2
4
6
8
10
12
2008 2009 2010 2011 2012 2013 2014 2015
Interest Payments
Principal Amortization
General Government Debt (RHS)
Debt Level and Debt Service Profiles
(In percent of GDP)
Albeit a deterioration in 2014 owing to lower mining revenue, the overall fiscal balance has improved since 2012...
...thanks to a broad-based increase in revenues...
... and restraint in some current expenditure lines ...... that allowed for higher public investment mostly
financed with domestic resources.
and reduced the need for external borrowing. However, the debt level remains elevated.
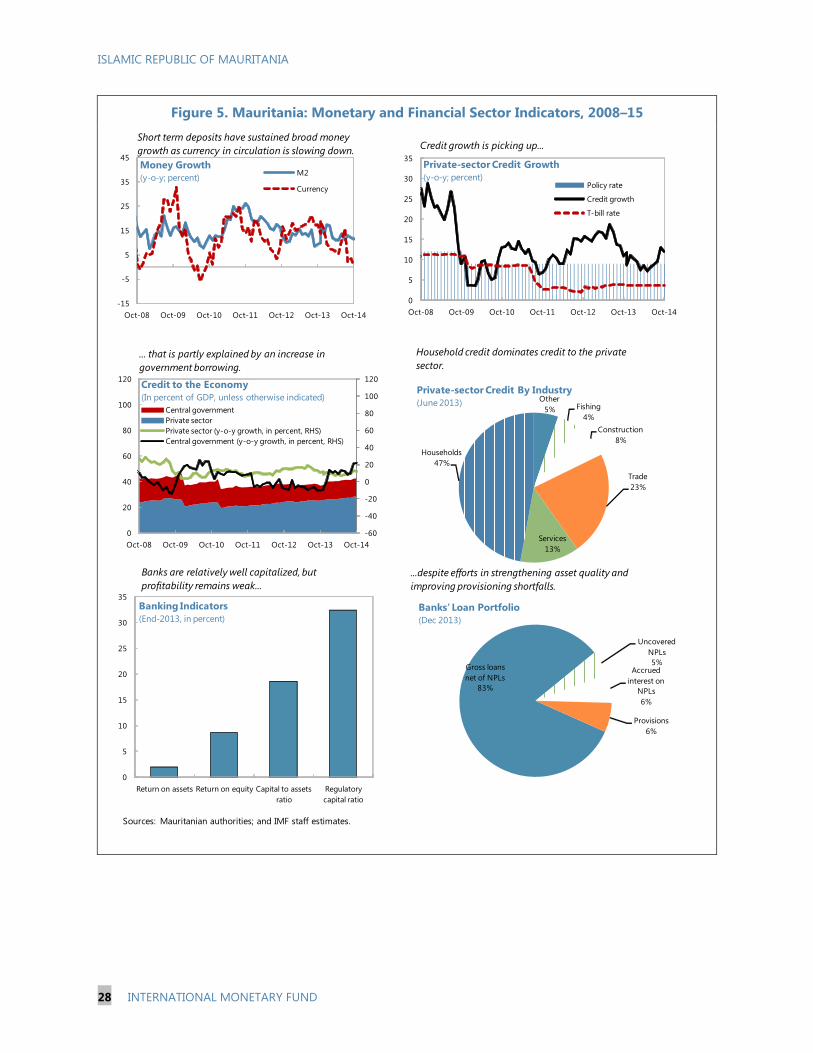
ISLAMIC REPUBLIC OF MAURITANIA
28 INTERNATIONAL MONETARY FUND
Figure 5. Mauritania: Monetary and Financial Sector Indicators, 2008–15
Sources: Mauritanian authorities; and IMF staff estimates.
-15
-5
5
15
25
35
45
Oct-08 Oct-09 Oct-10 Oct-11 Oct-12 Oct-13 Oct-14
M2
Currency
Money Growth
(y-o-y; percent)
0
5
10
15
20
25
30
35
Oct-08 Oct-09 Oct-10 Oct-11 Oct-12 Oct-13 Oct-14
Policy rate
Credit growth
T-bill rate
Private-sector Credit Growth
(y-o-y; percent)
-60
-40
-20
0
20
40
60
80
100
120
0
20
40
60
80
100
120
Oct-08 Oct-09 Oct-10 Oct-11 Oct-12 Oct-13 Oct-14
Central government
Private sector
Private sector (y-o-y growth, in percent, RHS)
Central government (y-o-y growth, in percent, RHS)
Credit to the Economy
(In percent of GDP, unless otherwise indicated) Other
5% Fishing
4%
Construction
8%
Trade
23%
Services
13%
Households
47%
Private-sector Credit By Industry
(June 2013)
0
5
10
15
20
25
30
35
Return on assets Return on equity Capital to assets
ratio
Regulatory
capital ratio
Banking Indicators
(End-2013, in percent)
Gross loans
net of NPLs
83%
Uncovered
NPLs
5%Accrued
interest on
NPLs
6%
Provisions
6%
Banks' Loan Portfolio
(Dec 2013)
Household credit dominates credit to the private
sector.
...despite efforts in strengthening asset quality and
improving provisioning shortfalls.
Short term deposits have sustained broad money
growth as currency in circulation is slowing down.Credit growth is picking up...
... that is partly explained by an increase in
government borrowing.
Banks are relatively well capitalized, but
profitability remains weak...
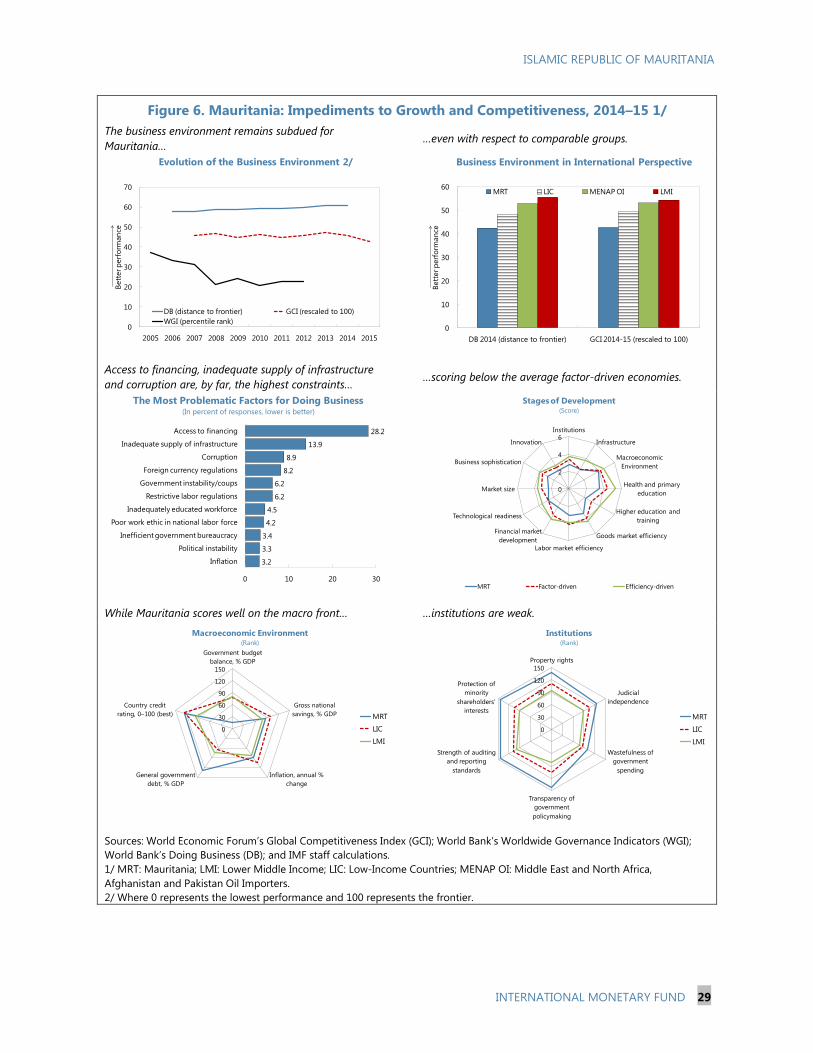
ISLAMIC REPUBLIC OF MAURITANIA
INTERNATIONAL MONETARY FUND 29
Figure 6. Mauritania: Impediments to Growth and Competitiveness, 2014–15 1/
The business environment remains subdued for
Mauritania…
…even with respect to comparable groups.
Access to financing, inadequate supply of infrastructure
and corruption are, by far, the highest constraints… …scoring below the average factor-driven economies.
While Mauritania scores well on the macro front… …institutions are weak.
Sources: World Economic Forum’s Global Competitiveness Index (GCI); World Bank’s Worldwide Governance Indicators (WGI);
World Bank’s Doing Business (DB); and IMF staff calculations.
1/ MRT: Mauritania; LMI: Lower Middle Income; LIC: Low-Income Countries; MENAP OI: Middle East and North Africa,
Afghanistan and Pakistan Oil Importers.
2/ Where 0 represents the lowest performance and 100 represents the frontier.
0
10
20
30
40
50
60
70
2005 2006 2007 2008 2009 2010 2011 2012 2013 2014 2015
Bett
er p
erf
orm
an
ce
DB (distance to frontier) GCI (rescaled to 100)
WGI (percentile rank)
Evolution of the Business Environment 2/
0
10
20
30
40
50
60
DB 2014 (distance to frontier) GCI 2014-15 (rescaled to 100)
Bett
er p
erf
orm
an
ce
MRT LIC MENAP OI LMI
Business Environment in International Perspective
3.2
3.3
3.4
4.2
4.5
6.2
6.2
8.2
8.9
13.9
28.2
0 10 20 30
Inflation
Political instability
Inefficient government bureaucracy
Poor work ethic in national labor force
Inadequately educated workforce
Restrictive labor regulations
Government instability/coups
Foreign currency regulations
Corruption
Inadequate supply of infrastructure
Access to financing
The Most Problematic Factors for Doing Business(In percent of responses, lower is better)
0
2
4
6Institutions
Infrastructure
Macroeconomic
Environment
Health and primary
education
Higher education and
training
Goods market efficiency
Labor market efficiency
Financial market
development
Technological readiness
Market size
Business sophistication
Innovation
MRT Factor-driven Efficiency-driven
Stages of Development(Score)
0
30
60
90
120
150
Government budget
balance, % GDP
Gross national
savings, % GDP
Inflation, annual %
change
General government
debt, % GDP
Country credit
rating, 0–100 (best) MRT
LIC
LMI
Macroeconomic Environment(Rank)
0
30
60
90
120
150
Property rights
Judicial
independence
Wastefulness of
government
spending
Transparency of
government
policymaking
Strength of auditing
and reporting
standards
Protection of
minority
shareholders’
interestsMRT
LIC
LMI
Institutions(Rank)

ISLAMIC REPUBLIC OF MAURITANIA
30 INTERNATIONAL MONETARY FUND
Figure 6. Mauritania: Impediments to Growth and Competitiveness, 2014-15 (concluded) 3/
Education is hindering competitiveness… …as well as labor market inefficiencies.
Weak infrastructure, despite noticeable improvements in
electricity production matrix… …and limited financial development hinder growth.
Progress on improving the efficiency… …has been unbalanced.
Sources: World Economic Forum’s Global Competitiveness Index (GCI); and IMF staff calculations.
3/ 2008-09 normalized to 148 countries.
0
30
60
90
120
150
Quality of primary
education
Quality of the
educational system
Quality of math and
science education
Internet access in
schools
Availability of
research and
training services
Extent of staff
training
MRT
LIC
LMI
Education(Rank)
0
30
60
90
120
150
Cooperation in labor-
employer relations
Flexibility of wage
determination
Hiring and firing
practices
Redundancy costs,
weeks of salary
Effect of taxation on
incentives to work
Pay and productivity
Reliance on
professional
management
Country capacity to
retain talent
Country capacity to
attract talent
Women in labor force,
ratio to men
MRT
LIC
LMI
Labor Market Efficiency(Rank)
0
30
60
90
120
150
Quality of overall
infrastructure
Quality of roads
Quality of railroad
infrastructure
Quality of port
infrastructure
Quality of air
transport
infrastructure
Quality of electricity
supply
MRT
LIC
LMI
Infrastructure(Rank)
0
30
60
90
120
150
Availability of
financial services
Affordability of
financial services
Financing through
local equity market
Ease of access to
loans
Venture capital
availability
Soundness of banks
Regulation of
securities exchanges
Legal rights index
MRT
LIC
LMI
Financial Market Development(Rank)
0
20
40
60
80
100
120
140
160
Extent of market dominance No. days to start a business
MRT 2008-09 MRT 2014-15 LIC LMI
Goods Market Efficiency (I)(Rank)
0
20
40
60
80
100
120
140
160
Prevalence of trade barriers Burden of customs procedures
MRT 2008-09 MRT 2014-15 LIC LMI
Goods Market Efficiency (II)(Rank)

ISLAMIC REPUBLIC OF MAURITANIA
INTERNATIONAL MONETARY FUND 31
Figure 7. Mauritania: Governance Environment
Governance indicators have worsened for Mauritania… …especially for the rule of law.
High young population and low labor market efficiency
will pose important challenges going forward…
…despite relatively good governance indicators when
taking into account per capita GDP.
The regulatory quality has deteriorated in relative terms… …in line with worsened government effectiveness.
Sources: Worldwide Governance Indicators; World Economic Outlook; World Development Indicators; Global Competitiveness
Index; and IMF staff calculations.
0
5
10
15
20
25
30
35
40
45
50
MRT LIC MENAP OI MENAP OE EMDC
Bett
er g
overn
an
ce
2000 2006 2012
WGI-4 1/(Percentile rank)
1/ Control of corruption, government effectiveness, regulatory quality and rule of
law)
0
5
10
15
20
25
30
35
40
45
50
MRT LIC MENAP OI MENAP OE EMDC
Bett
er g
overn
an
ce
2000 2006 2012
Rule of Law(Percentile rank)
LIC
MENAP OI
EMDC
BHR
KWTOMN
QTR
SAU
UAE
IRN
DZALBY
YMN
EGY
TUN
JOR
MAR
PAK
LBN
MRT
MENAP OE
0
5
10
15
20
25
30
35
40
45
0 50 100 150Po
pu
lati
on
ag
es
0-1
4 (in
perc
en
t o
f to
tal) (
2013)
Labor Market Efficiency rank (2014-15)
Labor Market Efficiency and Young Population Ratio
LIC
MENAP OI
EMDC
MRT
0
5
10
15
20
25
30
35
40
45
7 8 9 10 11
WG
I-4 p
erc
en
tile
ran
k (
2012)
Log PPP per capita (2014)
WGI-4 and GDP per Capita
0
5
10
15
20
25
30
35
40
45
50
2006 2007 2008 2009 2010 2011 2012
MRT LIC MENAP OI MENAP OE EMDC
Regulatory Quality(Percentile Rank)
0
5
10
15
20
25
30
35
40
45
50
2006 2007 2008 2009 2010 2011 2012
MRT LIC MENAP OI MENAP OE EMDC
Government Effectiveness(Percentile Rank)
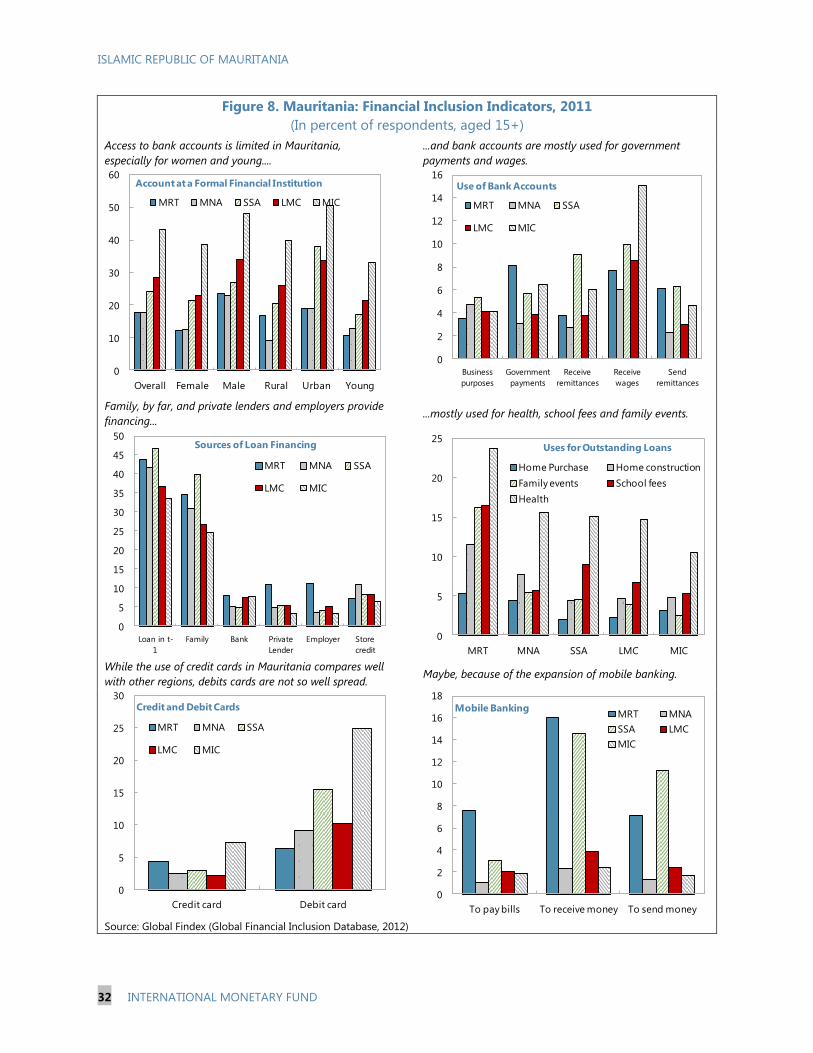
ISLAMIC REPUBLIC OF MAURITANIA
32 INTERNATIONAL MONETARY FUND
Figure 8. Mauritania: Financial Inclusion Indicators, 2011
(In percent of respondents, aged 15+)
Access to bank accounts is limited in Mauritania,
especially for women and young....
...and bank accounts are mostly used for government
payments and wages.
Family, by far, and private lenders and employers provide
financing... ...mostly used for health, school fees and family events.
While the use of credit cards in Mauritania compares well
with other regions, debits cards are not so well spread. Maybe, because of the expansion of mobile banking.
Source: Global Findex (Global Financial Inclusion Database, 2012)
0
10
20
30
40
50
60
Overall Female Male Rural Urban Young
MRT MNA SSA LMC MIC
Account at a Formal Financial Institution
0
2
4
6
8
10
12
14
16
Business
purposes
Government
payments
Receive
remittances
Receive
wages
Send
remittances
MRT MNA SSA
LMC MIC
Use of Bank Accounts
0
5
10
15
20
25
30
35
40
45
50
Loan in t-
1
Family Bank Private
Lender
Employer Store
credit
MRT MNA SSA
LMC MIC
Sources of Loan Financing
0
5
10
15
20
25
MRT MNA SSA LMC MIC
Home Purchase Home construction
Family events School fees
Health
Uses for Outstanding Loans
0
5
10
15
20
25
30
Credit card Debit card
MRT MNA SSA
LMC MIC
Credit and Debit Cards
0
2
4
6
8
10
12
14
16
18
To pay bills To receive money To send money
MRT MNA
SSA LMC
MIC
Mobile Banking
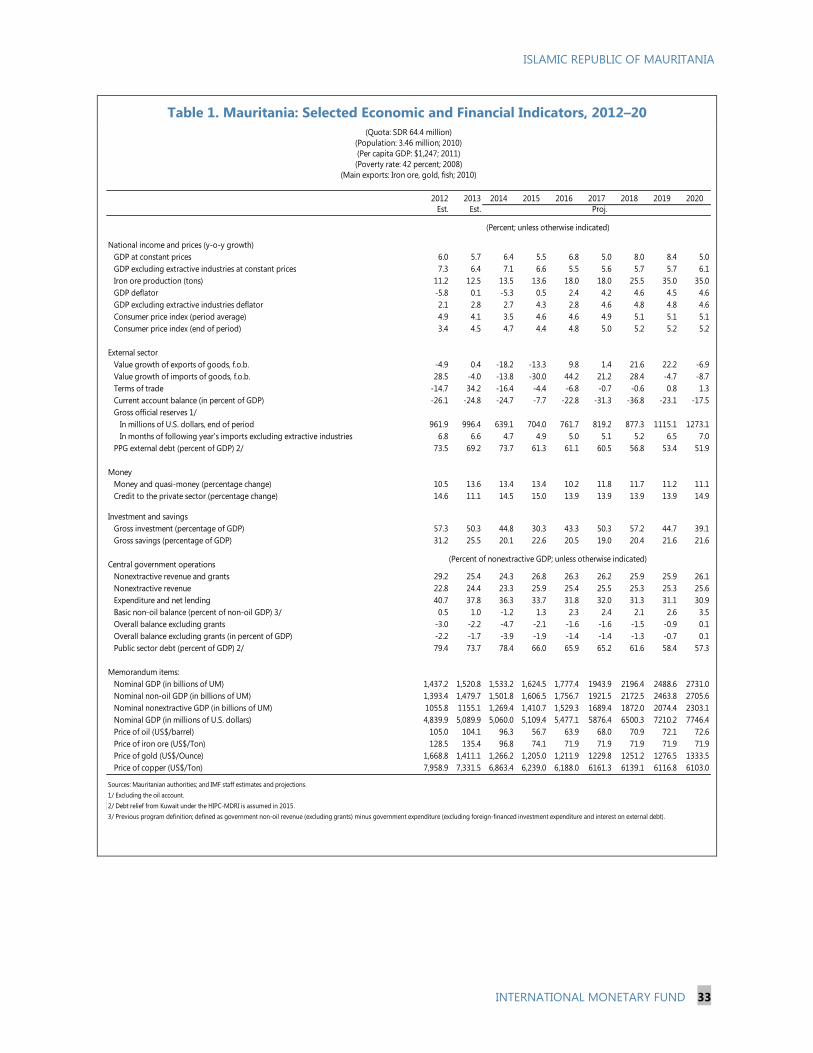
ISLAMIC REPUBLIC OF MAURITANIA
INTERNATIONAL MONETARY FUND 33
Table 1. Mauritania: Selected Economic and Financial Indicators, 2012–20
2012 2013 2014 2015 2016 2017 2018 2019 2020
Est. Est.
National income and prices (y-o-y growth)
GDP at constant prices 6.0 5.7 6.4 5.5 6.8 5.0 8.0 8.4 5.0
GDP excluding extractive industries at constant prices 7.3 6.4 7.1 6.6 5.5 5.6 5.7 5.7 6.1
Iron ore production (tons) 11.2 12.5 13.5 13.6 18.0 18.0 25.5 35.0 35.0
GDP deflator -5.8 0.1 -5.3 0.5 2.4 4.2 4.6 4.5 4.6
GDP excluding extractive industries deflator 2.1 2.8 2.7 4.3 2.8 4.6 4.8 4.8 4.6
Consumer price index (period average) 4.9 4.1 3.5 4.6 4.6 4.9 5.1 5.1 5.1
Consumer price index (end of period) 3.4 4.5 4.7 4.4 4.8 5.0 5.2 5.2 5.2
External sector
Value growth of exports of goods, f.o.b. -4.9 0.4 -18.2 -13.3 9.8 1.4 21.6 22.2 -6.9
Value growth of imports of goods, f.o.b. 28.5 -4.0 -13.8 -30.0 44.2 21.2 28.4 -4.7 -8.7
Terms of trade -14.7 34.2 -16.4 -4.4 -6.8 -0.7 -0.6 0.8 1.3
Current account balance (in percent of GDP) -26.1 -24.8 -24.7 -7.7 -22.8 -31.3 -36.8 -23.1 -17.5
Gross official reserves 1/
In millions of U.S. dollars, end of period 961.9 996.4 639.1 704.0 761.7 819.2 877.3 1115.1 1273.1
In months of following year's imports excluding extractive industries 6.8 6.6 4.7 4.9 5.0 5.1 5.2 6.5 7.0
PPG external debt (percent of GDP) 2/ 73.5 69.2 73.7 61.3 61.1 60.5 56.8 53.4 51.9
Money
Money and quasi-money (percentage change) 10.5 13.6 13.4 13.4 10.2 11.8 11.7 11.2 11.1
Credit to the private sector (percentage change) 14.6 11.1 14.5 15.0 13.9 13.9 13.9 13.9 14.9
Investment and savings
Gross investment (percentage of GDP) 57.3 50.3 44.8 30.3 43.3 50.3 57.2 44.7 39.1
Gross savings (percentage of GDP) 31.2 25.5 20.1 22.6 20.5 19.0 20.4 21.6 21.6
Central government operations
Nonextractive revenue and grants 29.2 25.4 24.3 26.8 26.3 26.2 25.9 25.9 26.1
Nonextractive revenue 22.8 24.4 23.3 25.9 25.4 25.5 25.3 25.3 25.6
Expenditure and net lending 40.7 37.8 36.3 33.7 31.8 32.0 31.3 31.1 30.9
Basic non-oil balance (percent of non-oil GDP) 3/ 0.5 1.0 -1.2 1.3 2.3 2.4 2.1 2.6 3.5
Overall balance excluding grants -3.0 -2.2 -4.7 -2.1 -1.6 -1.6 -1.5 -0.9 0.1
Overall balance excluding grants (in percent of GDP) -2.2 -1.7 -3.9 -1.9 -1.4 -1.4 -1.3 -0.7 0.1
Public sector debt (percent of GDP) 2/ 79.4 73.7 78.4 66.0 65.9 65.2 61.6 58.4 57.3
Memorandum items:
Nominal GDP (in billions of UM) 1,437.2 1,520.8 1,533.2 1,624.5 1,777.4 1943.9 2196.4 2488.6 2731.0
Nominal non-oil GDP (in billions of UM) 1,393.4 1,479.7 1,501.8 1,606.5 1,756.7 1921.5 2172.5 2463.8 2705.6
Nominal nonextractive GDP (in billions of UM) 1055.8 1155.1 1,269.4 1,410.7 1,529.3 1689.4 1872.0 2074.4 2303.1
Nominal GDP (in millions of U.S. dollars) 4,839.9 5,089.9 5,060.0 5,109.4 5,477.1 5876.4 6500.3 7210.2 7746.4
Price of oil (US$/barrel) 105.0 104.1 96.3 56.7 63.9 68.0 70.9 72.1 72.6
Price of iron ore (US$/Ton) 128.5 135.4 96.8 74.1 71.9 71.9 71.9 71.9 71.9
Price of gold (US$/Ounce) 1,668.8 1,411.1 1,266.2 1,205.0 1,211.9 1229.8 1251.2 1276.5 1333.5
Price of copper (US$/Ton) 7,958.9 7,331.5 6,863.4 6,239.0 6,188.0 6161.3 6139.1 6116.8 6103.0
Sources: Mauritanian authorities; and IMF staff estimates and projections.
1/ Excluding the oil account.
2/ Debt relief from Kuwait under the HIPC-MDRI is assumed in 2015.
3/ Previous program definition; defined as government non-oil revenue (excluding grants) minus government expenditure (excluding foreign-financed investment expenditure and interest on external debt).
Proj.
(Percent; unless otherwise indicated)
(Percent of nonextractive GDP; unless otherwise indicated)
(Quota: SDR 64.4 million)
(Population: 3.46 million; 2010)
(Per capita GDP: $1,247; 2011)
(Poverty rate: 42 percent; 2008)
(Main exports: Iron ore, gold, fish; 2010)
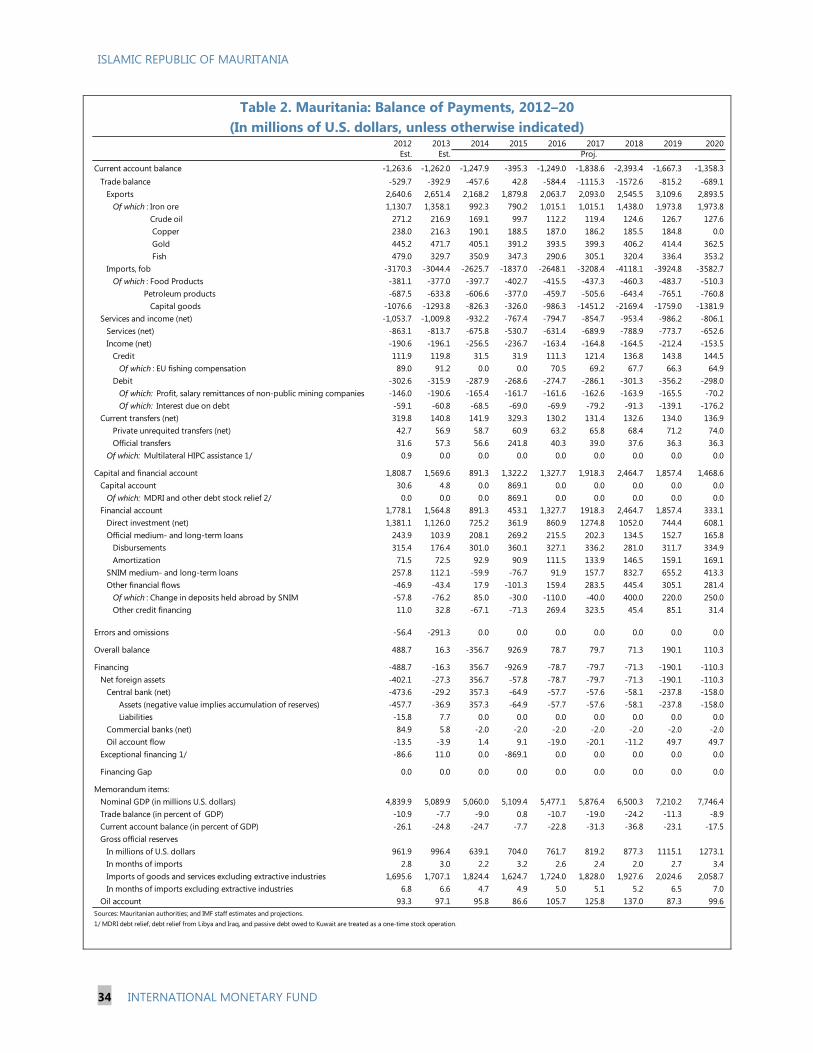
ISLAMIC REPUBLIC OF MAURITANIA
34 INTERNATIONAL MONETARY FUND
Table 2. Mauritania: Balance of Payments, 2012–20
(In millions of U.S. dollars, unless otherwise indicated)
2012 2013 2014 2015 2016 2017 2018 2019 2020
Est. Est.
Current account balance -1,263.6 -1,262.0 -1,247.9 -395.3 -1,249.0 -1,838.6 -2,393.4 -1,667.3 -1,358.3
Trade balance -529.7 -392.9 -457.6 42.8 -584.4 -1115.3 -1572.6 -815.2 -689.1
Exports 2,640.6 2,651.4 2,168.2 1,879.8 2,063.7 2,093.0 2,545.5 3,109.6 2,893.5
Of which : Iron ore 1,130.7 1,358.1 992.3 790.2 1,015.1 1,015.1 1,438.0 1,973.8 1,973.8
Crude oil 271.2 216.9 169.1 99.7 112.2 119.4 124.6 126.7 127.6
Copper 238.0 216.3 190.1 188.5 187.0 186.2 185.5 184.8 0.0
Gold 445.2 471.7 405.1 391.2 393.5 399.3 406.2 414.4 362.5
Fish 479.0 329.7 350.9 347.3 290.6 305.1 320.4 336.4 353.2
Imports, fob -3170.3 -3044.4 -2625.7 -1837.0 -2648.1 -3208.4 -4118.1 -3924.8 -3582.7
Of which : Food Products -381.1 -377.0 -397.7 -402.7 -415.5 -437.3 -460.3 -483.7 -510.3
Petroleum products -687.5 -633.8 -606.6 -377.0 -459.7 -505.6 -643.4 -765.1 -760.8
Capital goods -1076.6 -1293.8 -826.3 -326.0 -986.3 -1451.2 -2169.4 -1759.0 -1381.9
Services and income (net) -1,053.7 -1,009.8 -932.2 -767.4 -794.7 -854.7 -953.4 -986.2 -806.1
Services (net) -863.1 -813.7 -675.8 -530.7 -631.4 -689.9 -788.9 -773.7 -652.6
Income (net) -190.6 -196.1 -256.5 -236.7 -163.4 -164.8 -164.5 -212.4 -153.5
Credit 111.9 119.8 31.5 31.9 111.3 121.4 136.8 143.8 144.5
Of which : EU fishing compensation 89.0 91.2 0.0 0.0 70.5 69.2 67.7 66.3 64.9
Debit -302.6 -315.9 -287.9 -268.6 -274.7 -286.1 -301.3 -356.2 -298.0
Of which: Profit, salary remittances of non-public mining companies -146.0 -190.6 -165.4 -161.7 -161.6 -162.6 -163.9 -165.5 -70.2
Of which: Interest due on debt -59.1 -60.8 -68.5 -69.0 -69.9 -79.2 -91.3 -139.1 -176.2
Current transfers (net) 319.8 140.8 141.9 329.3 130.2 131.4 132.6 134.0 136.9
Private unrequited transfers (net) 42.7 56.9 58.7 60.9 63.2 65.8 68.4 71.2 74.0
Official transfers 31.6 57.3 56.6 241.8 40.3 39.0 37.6 36.3 36.3
Of which: Multilateral HIPC assistance 1/ 0.9 0.0 0.0 0.0 0.0 0.0 0.0 0.0 0.0
Capital and financial account 1,808.7 1,569.6 891.3 1,322.2 1,327.7 1,918.3 2,464.7 1,857.4 1,468.6
Capital account 30.6 4.8 0.0 869.1 0.0 0.0 0.0 0.0 0.0
Of which: MDRI and other debt stock relief 2/ 0.0 0.0 0.0 869.1 0.0 0.0 0.0 0.0 0.0
Financial account 1,778.1 1,564.8 891.3 453.1 1,327.7 1918.3 2,464.7 1,857.4 333.1
Direct investment (net) 1,381.1 1,126.0 725.2 361.9 860.9 1274.8 1052.0 744.4 608.1
Official medium- and long-term loans 243.9 103.9 208.1 269.2 215.5 202.3 134.5 152.7 165.8
Disbursements 315.4 176.4 301.0 360.1 327.1 336.2 281.0 311.7 334.9
Amortization 71.5 72.5 92.9 90.9 111.5 133.9 146.5 159.1 169.1
SNIM medium- and long-term loans 257.8 112.1 -59.9 -76.7 91.9 157.7 832.7 655.2 413.3
Other financial flows -46.9 -43.4 17.9 -101.3 159.4 283.5 445.4 305.1 281.4
Of which : Change in deposits held abroad by SNIM -57.8 -76.2 85.0 -30.0 -110.0 -40.0 400.0 220.0 250.0
Other credit financing 11.0 32.8 -67.1 -71.3 269.4 323.5 45.4 85.1 31.4
Errors and omissions -56.4 -291.3 0.0 0.0 0.0 0.0 0.0 0.0 0.0
Overall balance 488.7 16.3 -356.7 926.9 78.7 79.7 71.3 190.1 110.3
Financing -488.7 -16.3 356.7 -926.9 -78.7 -79.7 -71.3 -190.1 -110.3
Net foreign assets -402.1 -27.3 356.7 -57.8 -78.7 -79.7 -71.3 -190.1 -110.3
Central bank (net) -473.6 -29.2 357.3 -64.9 -57.7 -57.6 -58.1 -237.8 -158.0
Assets (negative value implies accumulation of reserves) -457.7 -36.9 357.3 -64.9 -57.7 -57.6 -58.1 -237.8 -158.0
Liabilities -15.8 7.7 0.0 0.0 0.0 0.0 0.0 0.0 0.0
Commercial banks (net) 84.9 5.8 -2.0 -2.0 -2.0 -2.0 -2.0 -2.0 -2.0
Oil account flow -13.5 -3.9 1.4 9.1 -19.0 -20.1 -11.2 49.7 49.7
Exceptional financing 1/ -86.6 11.0 0.0 -869.1 0.0 0.0 0.0 0.0 0.0
Financing Gap 0.0 0.0 0.0 0.0 0.0 0.0 0.0 0.0 0.0
Memorandum items:
Nominal GDP (in millions U.S. dollars) 4,839.9 5,089.9 5,060.0 5,109.4 5,477.1 5,876.4 6,500.3 7,210.2 7,746.4
Trade balance (in percent of GDP) -10.9 -7.7 -9.0 0.8 -10.7 -19.0 -24.2 -11.3 -8.9
Current account balance (in percent of GDP) -26.1 -24.8 -24.7 -7.7 -22.8 -31.3 -36.8 -23.1 -17.5
Gross official reserves
In millions of U.S. dollars 961.9 996.4 639.1 704.0 761.7 819.2 877.3 1115.1 1273.1
In months of imports 2.8 3.0 2.2 3.2 2.6 2.4 2.0 2.7 3.4
Imports of goods and services excluding extractive industries 1,695.6 1,707.1 1,824.4 1,624.7 1,724.0 1,828.0 1,927.6 2,024.6 2,058.7
In months of imports excluding extractive industries 6.8 6.6 4.7 4.9 5.0 5.1 5.2 6.5 7.0
Oil account 93.3 97.1 95.8 86.6 105.7 125.8 137.0 87.3 99.6
1/ MDRI debt relief, debt relief from Libya and Iraq, and passive debt owed to Kuwait are treated as a one-time stock operation.
Proj.
Sources: Mauritanian authorities; and IMF staff estimates and projections.
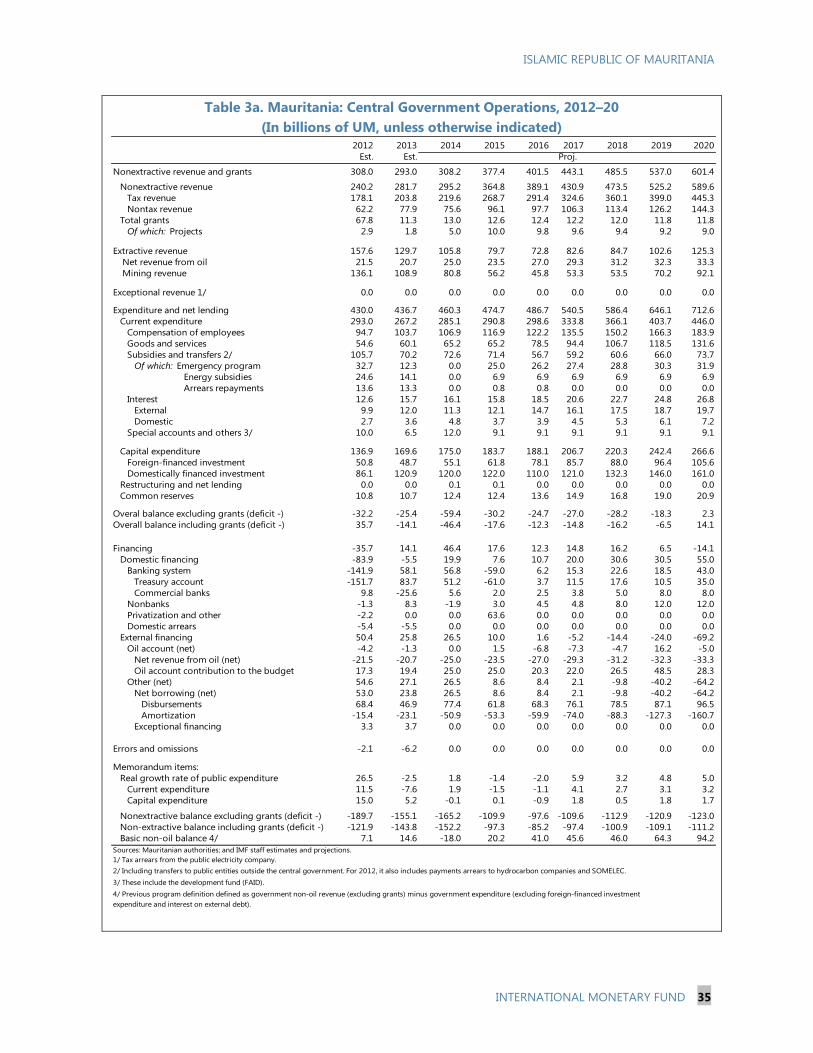
ISLAMIC REPUBLIC OF MAURITANIA
INTERNATIONAL MONETARY FUND 35
Table 3a. Mauritania: Central Government Operations, 2012–20
(In billions of UM, unless otherwise indicated)
2012 2013 2014 2015 2016 2017 2018 2019 2020
Est. Est.
Nonextractive revenue and grants 308.0 293.0 308.2 377.4 401.5 443.1 485.5 537.0 601.4
Nonextractive revenue 240.2 281.7 295.2 364.8 389.1 430.9 473.5 525.2 589.6
Tax revenue 178.1 203.8 219.6 268.7 291.4 324.6 360.1 399.0 445.3
Nontax revenue 62.2 77.9 75.6 96.1 97.7 106.3 113.4 126.2 144.3
Total grants 67.8 11.3 13.0 12.6 12.4 12.2 12.0 11.8 11.8
Of which: Projects 2.9 1.8 5.0 10.0 9.8 9.6 9.4 9.2 9.0
Extractive revenue 157.6 129.7 105.8 79.7 72.8 82.6 84.7 102.6 125.3
Net revenue from oil 21.5 20.7 25.0 23.5 27.0 29.3 31.2 32.3 33.3
Mining revenue 136.1 108.9 80.8 56.2 45.8 53.3 53.5 70.2 92.1
Exceptional revenue 1/ 0.0 0.0 0.0 0.0 0.0 0.0 0.0 0.0 0.0
Expenditure and net lending 430.0 436.7 460.3 474.7 486.7 540.5 586.4 646.1 712.6
Current expenditure 293.0 267.2 285.1 290.8 298.6 333.8 366.1 403.7 446.0
Compensation of employees 94.7 103.7 106.9 116.9 122.2 135.5 150.2 166.3 183.9
Goods and services 54.6 60.1 65.2 65.2 78.5 94.4 106.7 118.5 131.6
Subsidies and transfers 2/ 105.7 70.2 72.6 71.4 56.7 59.2 60.6 66.0 73.7
Of which: Emergency program 32.7 12.3 0.0 25.0 26.2 27.4 28.8 30.3 31.9
Energy subsidies 24.6 14.1 0.0 6.9 6.9 6.9 6.9 6.9 6.9
Arrears repayments 13.6 13.3 0.0 0.8 0.8 0.0 0.0 0.0 0.0
Interest 12.6 15.7 16.1 15.8 18.5 20.6 22.7 24.8 26.8
External 9.9 12.0 11.3 12.1 14.7 16.1 17.5 18.7 19.7
Domestic 2.7 3.6 4.8 3.7 3.9 4.5 5.3 6.1 7.2
Special accounts and others 3/ 10.0 6.5 12.0 9.1 9.1 9.1 9.1 9.1 9.1
Capital expenditure 136.9 169.6 175.0 183.7 188.1 206.7 220.3 242.4 266.6
Foreign-financed investment 50.8 48.7 55.1 61.8 78.1 85.7 88.0 96.4 105.6
Domestically financed investment 86.1 120.9 120.0 122.0 110.0 121.0 132.3 146.0 161.0
Restructuring and net lending 0.0 0.0 0.1 0.1 0.0 0.0 0.0 0.0 0.0
Common reserves 10.8 10.7 12.4 12.4 13.6 14.9 16.8 19.0 20.9
Overal balance excluding grants (deficit -) -32.2 -25.4 -59.4 -30.2 -24.7 -27.0 -28.2 -18.3 2.3
Overall balance including grants (deficit -) 35.7 -14.1 -46.4 -17.6 -12.3 -14.8 -16.2 -6.5 14.1
Financing -35.7 14.1 46.4 17.6 12.3 14.8 16.2 6.5 -14.1
Domestic financing -83.9 -5.5 19.9 7.6 10.7 20.0 30.6 30.5 55.0
Banking system -141.9 58.1 56.8 -59.0 6.2 15.3 22.6 18.5 43.0
Treasury account -151.7 83.7 51.2 -61.0 3.7 11.5 17.6 10.5 35.0
Commercial banks 9.8 -25.6 5.6 2.0 2.5 3.8 5.0 8.0 8.0
Nonbanks -1.3 8.3 -1.9 3.0 4.5 4.8 8.0 12.0 12.0
Privatization and other -2.2 0.0 0.0 63.6 0.0 0.0 0.0 0.0 0.0
Domestic arrears -5.4 -5.5 0.0 0.0 0.0 0.0 0.0 0.0 0.0
External financing 50.4 25.8 26.5 10.0 1.6 -5.2 -14.4 -24.0 -69.2
Oil account (net) -4.2 -1.3 0.0 1.5 -6.8 -7.3 -4.7 16.2 -5.0
Net revenue from oil (net) -21.5 -20.7 -25.0 -23.5 -27.0 -29.3 -31.2 -32.3 -33.3
Oil account contribution to the budget 17.3 19.4 25.0 25.0 20.3 22.0 26.5 48.5 28.3
Other (net) 54.6 27.1 26.5 8.6 8.4 2.1 -9.8 -40.2 -64.2
Net borrowing (net) 53.0 23.8 26.5 8.6 8.4 2.1 -9.8 -40.2 -64.2
Disbursements 68.4 46.9 77.4 61.8 68.3 76.1 78.5 87.1 96.5
Amortization -15.4 -23.1 -50.9 -53.3 -59.9 -74.0 -88.3 -127.3 -160.7
Exceptional financing 3.3 3.7 0.0 0.0 0.0 0.0 0.0 0.0 0.0
Errors and omissions -2.1 -6.2 0.0 0.0 0.0 0.0 0.0 0.0 0.0
Memorandum items:
Real growth rate of public expenditure 26.5 -2.5 1.8 -1.4 -2.0 5.9 3.2 4.8 5.0
Current expenditure 11.5 -7.6 1.9 -1.5 -1.1 4.1 2.7 3.1 3.2
Capital expenditure 15.0 5.2 -0.1 0.1 -0.9 1.8 0.5 1.8 1.7
Nonextractive balance excluding grants (deficit -) -189.7 -155.1 -165.2 -109.9 -97.6 -109.6 -112.9 -120.9 -123.0
Non-extractive balance including grants (deficit -) -121.9 -143.8 -152.2 -97.3 -85.2 -97.4 -100.9 -109.1 -111.2
Basic non-oil balance 4/ 7.1 14.6 -18.0 20.2 41.0 45.6 46.0 64.3 94.2
Sources: Mauritanian authorities; and IMF staff estimates and projections.
3/ These include the development fund (FAID).
Proj.
1/ Tax arrears from the public electricity company.
2/ Including transfers to public entities outside the central government. For 2012, it also includes payments arrears to hydrocarbon companies and SOMELEC.
4/ Previous program definition defined as government non-oil revenue (excluding grants) minus government expenditure (excluding foreign-financed investment
expenditure and interest on external debt).

ISLAMIC REPUBLIC OF MAURITANIA
36 INTERNATIONAL MONETARY FUND
Table 3b. Mauritania: Central Government Operations, 2012–20
(In percent of nonextractive GDP, unless otherwise indicated)
2012 2013 2014 2015 2016 2017 2018 2019 2020
Est. Est.
Nonextractive revenue and grants 29.2 25.4 24.3 26.8 26.3 26.2 25.9 25.9 26.1
Nonextractive revenue 22.8 24.4 23.3 25.9 25.4 25.5 25.3 25.3 25.6
Tax revenue 16.9 17.6 17.3 19.0 19.1 19.2 19.2 19.2 19.3
Nontax revenue 5.9 6.7 6.0 6.8 6.4 6.3 6.1 6.1 6.3
Total grants 6.4 1.0 1.0 0.9 0.8 0.7 0.6 0.6 0.5
Of which: Projects 0.3 0.2 0.4 0.7 0.6 0.6 0.5 0.4 0.4
Extractive revenue 14.9 11.2 8.3 5.6 4.8 4.9 4.5 4.9 5.4
Net revenue from oil 2.0 1.8 2.0 1.7 1.8 1.7 1.7 1.6 1.4
Mining revenue 12.9 9.4 6.4 4.0 3.0 3.2 2.9 3.4 4.0
Exceptional revenue 1/ 0.0 0.0 0.0 0.0 0.0 0.0 0.0 0.0 0.0
Expenditure and net lending 40.7 37.8 36.3 33.7 31.8 32.0 31.3 31.1 30.9
Current expenditure 27.8 23.1 22.5 20.6 19.5 19.8 19.6 19.5 19.4
Compensation of employees 9.0 9.0 8.4 8.3 8.0 8.0 8.0 8.0 8.0
Goods and services 5.2 5.2 5.1 4.6 5.1 5.6 5.7 5.7 5.7
Subsidies and transfers 2/ 10.0 6.1 5.7 5.1 3.7 3.5 3.2 3.2 3.2
Of which: Emergency program 3.1 1.1 0.0 1.8 1.7 1.6 1.5 1.5 1.4
Energy subsidies 2.3 1.2 0.0 0.5 0.5 0.4 0.4 0.3 0.3
Arrears repayments 1.3 1.1 0.0 0.1 0.1 0.0 0.0 0.0 0.0
Interest 1.2 1.4 1.3 1.1 1.2 1.2 1.2 1.2 1.2
External 0.9 1.0 0.9 0.9 1.0 1.0 0.9 0.9 0.9
Domestic 0.3 0.3 0.4 0.3 0.3 0.3 0.3 0.3 0.3
Special accounts and others 3/ 0.9 0.6 0.9 0.6 0.6 0.5 0.5 0.4 0.4
Capital expenditure 13.0 14.7 13.8 13.0 12.3 12.2 11.8 11.7 11.6
Foreign-financed investment 4.8 4.2 4.3 4.4 5.1 5.1 4.7 4.6 4.6
Domestically financed investment 8.2 10.5 9.5 8.6 7.2 7.2 7.1 7.0 7.0
Restructuring and net lending 0.0 0.0 0.0 0.0 0.0 0.0 0.0 0.0 0.0
Common reserves 1.0 0.9 1.0 0.9 0.9 0.9 0.9 0.9 0.9
Overall balance excluding grants (deficit -) -3.0 -2.2 -4.7 -2.1 -1.6 -1.6 -1.5 -0.9 0.1
Overall balance including grants (deficit -) 3.4 -1.2 -3.7 -1.3 -0.8 -0.9 -0.9 -0.3 0.6
Financing -3.4 1.2 3.7 1.3 0.8 0.9 0.9 0.3 -0.6
Domestic financing -7.9 -0.5 1.6 0.5 0.7 1.2 1.6 1.5 2.4
Banking system -13.4 5.0 4.5 -4.2 0.4 0.9 1.2 0.9 1.9
Treasury account -14.4 7.2 4.0 -4.3 0.2 0.7 0.9 0.5 1.5
Commercial banks 0.9 -2.2 0.4 0.1 0.2 0.2 0.3 0.4 0.3
Nonbanks -0.1 0.7 -0.1 0.2 0.3 0.3 0.4 0.6 0.5
Privatization and other -0.2 0.0 0.0 4.5 0.0 0.0 0.0 0.0 0.0
Domestic arrears -0.5 -0.5 0.0 0.0 0.0 0.0 0.0 0.0 0.0
External financing 4.8 2.2 2.1 0.7 0.1 -0.3 -0.8 -1.2 -3.0
Oil account (net) -0.4 -0.1 0.0 0.1 -0.4 -0.4 -0.2 0.8 -0.2
Net revenue from oil (net) -2.0 -1.8 -2.0 -1.7 -1.8 -1.7 -1.7 -1.6 -1.4
Oil account contribution to the budget 1.6 1.7 2.0 1.8 1.3 1.3 1.4 2.3 1.2
Other (net) 5.2 2.3 2.1 0.6 0.5 0.1 -0.5 -1.9 -2.8
Net borrowing (net) 5.0 2.1 2.1 0.6 0.5 0.1 -0.5 -1.9 -2.8
Disbursements 6.5 4.1 6.1 4.4 4.5 4.5 4.2 4.2 4.2
Amortization -1.5 -2.0 -4.0 -3.8 -3.9 -4.4 -4.7 -6.1 -7.0
Exceptional financing 0.3 0.3 0.0 0.0 0.0 0.0 0.0 0.0 0.0
Errors and omissions -0.2 -0.5 0.0 0.0 0.0 0.0 0.0 0.0 0.0
Memorandum items:
Nonextractive balance excluding grants (deficit -) -18.0 -13.4 -13.0 -7.8 -6.4 -6.5 -6.0 -5.8 -5.3
Non-extractive balance including grants (deficit -) -11.5 -12.4 -12.0 -6.9 -5.6 -5.8 -5.4 -5.3 -4.8
Overall balance (in percent of GDP) 2.5 -0.9 -3.0 -1.1 -0.7 -0.8 -0.7 -0.3 0.5
Basic non-oil balance 4/ 0.5 1.0 -1.2 1.3 2.3 2.4 2.1 2.6 3.5
Sources: Mauritanian authorities; and IMF staff estimates and projections.
3/ These include the development fund (FAID).
4/ Previous program definition, in percent of non-oil GDP.
Proj.
1/ Tax arrears from the public electricity company.
2/ Including transfers to public entities outside the central government. For 2012, it also includes payments arrears to hydrocarbon companies and SOMELEC.
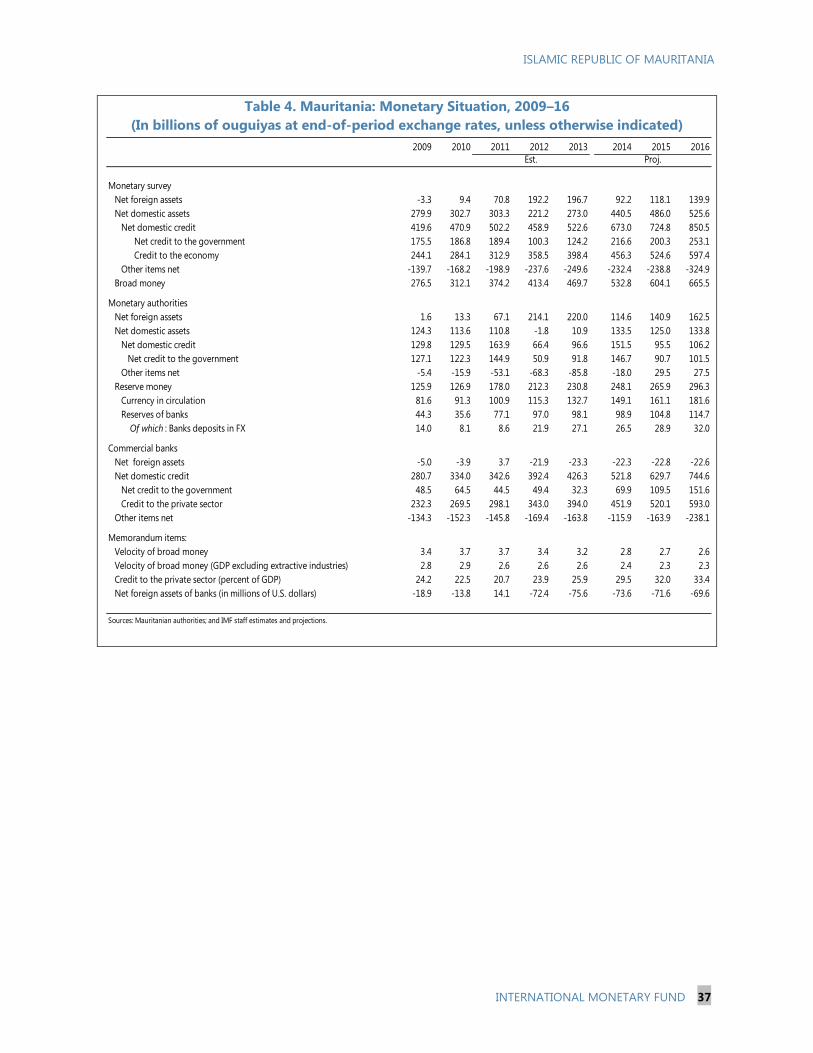
ISLAMIC REPUBLIC OF MAURITANIA
INTERNATIONAL MONETARY FUND 37
Table 4. Mauritania: Monetary Situation, 2009–16
(In billions of ouguiyas at end-of-period exchange rates, unless otherwise indicated)
2009 2010 2011 2012 2013 2014 2015 2016
Monetary survey
Net foreign assets -3.3 9.4 70.8 192.2 196.7 92.2 118.1 139.9
Net domestic assets 279.9 302.7 303.3 221.2 273.0 440.5 486.0 525.6
Net domestic credit 419.6 470.9 502.2 458.9 522.6 673.0 724.8 850.5
Net credit to the government 175.5 186.8 189.4 100.3 124.2 216.6 200.3 253.1
Credit to the economy 244.1 284.1 312.9 358.5 398.4 456.3 524.6 597.4
Other items net -139.7 -168.2 -198.9 -237.6 -249.6 -232.4 -238.8 -324.9
Broad money 276.5 312.1 374.2 413.4 469.7 532.8 604.1 665.5
Monetary authorities
Net foreign assets 1.6 13.3 67.1 214.1 220.0 114.6 140.9 162.5
Net domestic assets 124.3 113.6 110.8 -1.8 10.9 133.5 125.0 133.8
Net domestic credit 129.8 129.5 163.9 66.4 96.6 151.5 95.5 106.2
Net credit to the government 127.1 122.3 144.9 50.9 91.8 146.7 90.7 101.5
Other items net -5.4 -15.9 -53.1 -68.3 -85.8 -18.0 29.5 27.5
Reserve money 125.9 126.9 178.0 212.3 230.8 248.1 265.9 296.3
Currency in circulation 81.6 91.3 100.9 115.3 132.7 149.1 161.1 181.6
Reserves of banks 44.3 35.6 77.1 97.0 98.1 98.9 104.8 114.7
Of which : Banks deposits in FX 14.0 8.1 8.6 21.9 27.1 26.5 28.9 32.0
Commercial banks
Net foreign assets -5.0 -3.9 3.7 -21.9 -23.3 -22.3 -22.8 -22.6
Net domestic credit 280.7 334.0 342.6 392.4 426.3 521.8 629.7 744.6
Net credit to the government 48.5 64.5 44.5 49.4 32.3 69.9 109.5 151.6
Credit to the private sector 232.3 269.5 298.1 343.0 394.0 451.9 520.1 593.0
Other items net -134.3 -152.3 -145.8 -169.4 -163.8 -115.9 -163.9 -238.1
Memorandum items:
Velocity of broad money 3.4 3.7 3.7 3.4 3.2 2.8 2.7 2.6
Velocity of broad money (GDP excluding extractive industries) 2.8 2.9 2.6 2.6 2.6 2.4 2.3 2.3
Credit to the private sector (percent of GDP) 24.2 22.5 20.7 23.9 25.9 29.5 32.0 33.4
Net foreign assets of banks (in millions of U.S. dollars) -18.9 -13.8 14.1 -72.4 -75.6 -73.6 -71.6 -69.6
Sources: Mauritanian authorities; and IMF staff estimates and projections.
Est. Proj.

ISLAMIC REPUBLIC OF MAURITANIA
38 INTERNATIONAL MONETARY FUND
Table 5. Mauritania: Banking Soundness Indicators, 2008–13
(Percent, unless otherwise indicated)
2008 2009 2010 2011 2012 2013
Balance sheet
Assets / GDP 32.0 35.3 31.1 31.2 35.1 38.4
Net private-sector credit / total assets 56.6 51.1 53.2 48.2 50.8 52.1
Public enterprise credit / total assets 15.0 13.1 13.3 10.2 7.2 3.4
Government securities / total assets 17.2 16.0 18.8 11.1 11.2 5.8
Private-sector credit growth (y-o-y) 23.6 4.0 16.0 10.6 15.1 14.9
Gross NPLs / gross loans n.a. n.a. 45.3 39.2 25.7 20.4
Of which: accrued interest on NPLs / gross loans n.a. n.a. 11.6 11.5 8.3 7.1
Of which: legacy NPLs (pre-2010) / gross loans n.a. n.a. 16.7 13.7 13.8 12.8
Of which: new NPLs / gross loans n.a. n.a. 17.0 14.1 3.6 0.5
Provisions / (gross NPLs - accrued interest) n.a. n.a. 30.0 31.2 53.1 52.9
Provisions / loans 360+ days in arrears 84.1 85.2 87.7 90.7 88.0 88.8
Uncovered loans 360+ days in arrears / gross loans 84.1 85.2 87.7 90.7 88.0 88.8
Deposits / total assets 55.5 57.4 59.3 60.9 59.1 57.8
Private-sector gross loans / private-sector deposits 127.4 115.3 118.4 105.9 110.7 113.7
Capital ratios
Capital / total assets 16.9 16.7 16.7 18.5 17.5 18.7
Capital adequacy ratio 33.0 38.2 34.0 35.2 29.2 32.4
Foreign exchange exposure
Fx assets / total assets 9.3 13.9 10.5 10.5 10.5 10.6
Fx assets / fx liabilities (on balance sheet) 75.0 123.7 112.1 135.2 100.1 106.6
Open fx position / capital (including off balance sheet) -19.1 5.0 -16.0 -32.7 n.a. n.a.
Profitability and liquidity
Return on assets 1.9 1.4 0.4 1.2 1.4 2.0
Return on equity 10.7 8.5 2.7 6.0 8.4 8.7
Liquid assets / total assets 1/ 30.9 29.8 29.5 29.7 29.8 24.0
Memorandum items:
Share of assets held by three largest banks 53.4 53.6 53.7 50.7 45.4 42.3
Number of banks 10.0 10.0 10.0 12.0 12.0 15.0
Bank private-sector credit / GDP 23.3 24.2 22.5 20.7 23.9 25.9
Sources: Mauritanian authorities; and IMF staff.
1/ Liquid assets: cash, reserves, and treasury bills.
Est.
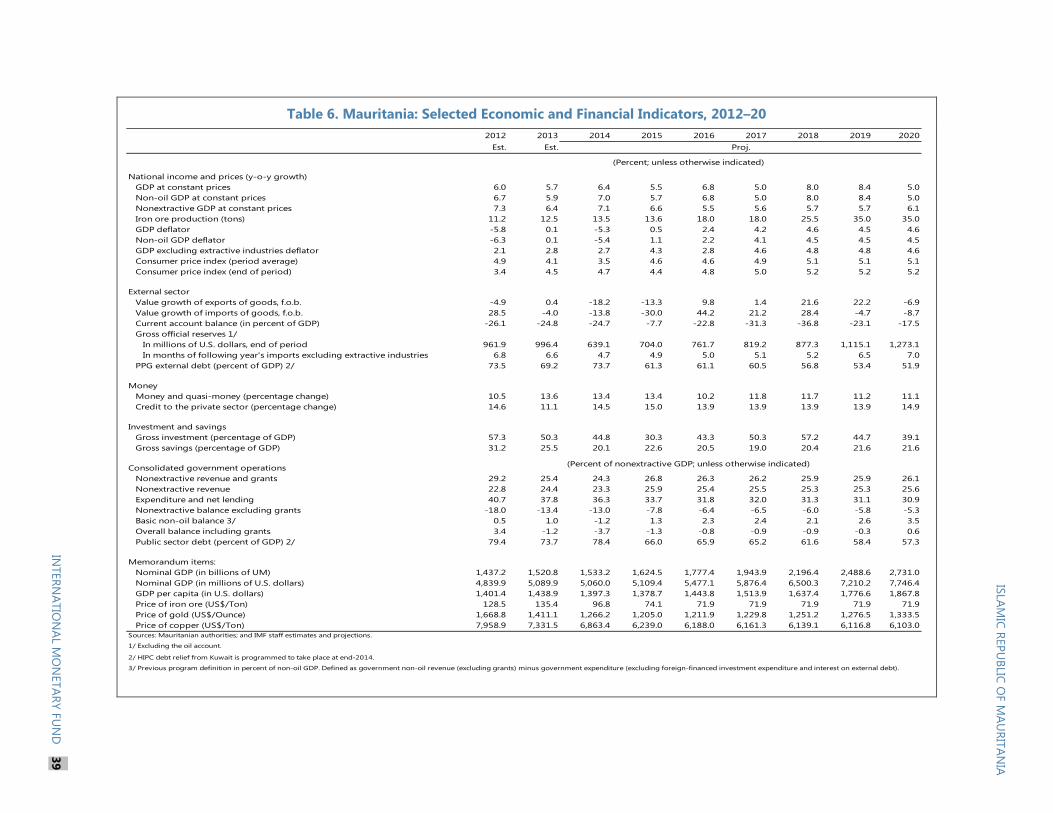
Table 6. Mauritania: Selected Economic and Financial Indicators, 2012–20
2012 2013 2014 2015 2016 2017 2018 2019 2020
Est. Est.
National income and prices (y-o-y growth)
GDP at constant prices 6.0 5.7 6.4 5.5 6.8 5.0 8.0 8.4 5.0
Non-oil GDP at constant prices 6.7 5.9 7.0 5.7 6.8 5.0 8.0 8.4 5.0
Nonextractive GDP at constant prices 7.3 6.4 7.1 6.6 5.5 5.6 5.7 5.7 6.1
Iron ore production (tons) 11.2 12.5 13.5 13.6 18.0 18.0 25.5 35.0 35.0
GDP deflator -5.8 0.1 -5.3 0.5 2.4 4.2 4.6 4.5 4.6
Non-oil GDP deflator -6.3 0.1 -5.4 1.1 2.2 4.1 4.5 4.5 4.5
GDP excluding extractive industries deflator 2.1 2.8 2.7 4.3 2.8 4.6 4.8 4.8 4.6
Consumer price index (period average) 4.9 4.1 3.5 4.6 4.6 4.9 5.1 5.1 5.1
Consumer price index (end of period) 3.4 4.5 4.7 4.4 4.8 5.0 5.2 5.2 5.2
External sector
Value growth of exports of goods, f.o.b. -4.9 0.4 -18.2 -13.3 9.8 1.4 21.6 22.2 -6.9
Value growth of imports of goods, f.o.b. 28.5 -4.0 -13.8 -30.0 44.2 21.2 28.4 -4.7 -8.7
Current account balance (in percent of GDP) -26.1 -24.8 -24.7 -7.7 -22.8 -31.3 -36.8 -23.1 -17.5
Gross official reserves 1/
In millions of U.S. dollars, end of period 961.9 996.4 639.1 704.0 761.7 819.2 877.3 1,115.1 1,273.1
In months of following year's imports excluding extractive industries 6.8 6.6 4.7 4.9 5.0 5.1 5.2 6.5 7.0
PPG external debt (percent of GDP) 2/ 73.5 69.2 73.7 61.3 61.1 60.5 56.8 53.4 51.9
Money
Money and quasi-money (percentage change) 10.5 13.6 13.4 13.4 10.2 11.8 11.7 11.2 11.1
Credit to the private sector (percentage change) 14.6 11.1 14.5 15.0 13.9 13.9 13.9 13.9 14.9
Investment and savings
Gross investment (percentage of GDP) 57.3 50.3 44.8 30.3 43.3 50.3 57.2 44.7 39.1
Gross savings (percentage of GDP) 31.2 25.5 20.1 22.6 20.5 19.0 20.4 21.6 21.6
Consolidated government operations
Nonextractive revenue and grants 29.2 25.4 24.3 26.8 26.3 26.2 25.9 25.9 26.1
Nonextractive revenue 22.8 24.4 23.3 25.9 25.4 25.5 25.3 25.3 25.6
Expenditure and net lending 40.7 37.8 36.3 33.7 31.8 32.0 31.3 31.1 30.9
Nonextractive balance excluding grants -18.0 -13.4 -13.0 -7.8 -6.4 -6.5 -6.0 -5.8 -5.3
Basic non-oil balance 3/ 0.5 1.0 -1.2 1.3 2.3 2.4 2.1 2.6 3.5
Overall balance including grants 3.4 -1.2 -3.7 -1.3 -0.8 -0.9 -0.9 -0.3 0.6
Public sector debt (percent of GDP) 2/ 79.4 73.7 78.4 66.0 65.9 65.2 61.6 58.4 57.3
Memorandum items:
Nominal GDP (in billions of UM) 1,437.2 1,520.8 1,533.2 1,624.5 1,777.4 1,943.9 2,196.4 2,488.6 2,731.0
Nominal GDP (in millions of U.S. dollars) 4,839.9 5,089.9 5,060.0 5,109.4 5,477.1 5,876.4 6,500.3 7,210.2 7,746.4
GDP per capita (in U.S. dollars) 1,401.4 1,438.9 1,397.3 1,378.7 1,443.8 1,513.9 1,637.4 1,776.6 1,867.8
Price of iron ore (US$/Ton) 128.5 135.4 96.8 74.1 71.9 71.9 71.9 71.9 71.9
Price of gold (US$/Ounce) 1,668.8 1,411.1 1,266.2 1,205.0 1,211.9 1,229.8 1,251.2 1,276.5 1,333.5
Price of copper (US$/Ton) 7,958.9 7,331.5 6,863.4 6,239.0 6,188.0 6,161.3 6,139.1 6,116.8 6,103.0
Sources: Mauritanian authorities; and IMF staff estimates and projections.
1/ Excluding the oil account.
2/ HIPC debt relief from Kuwait is programmed to take place at end-2014.
Proj.
(Percent; unless otherwise indicated)
(Percent of nonextractive GDP; unless otherwise indicated)
3/ Previous program definition in percent of non-oil GDP. Defined as government non-oil revenue (excluding grants) minus government expenditure (excluding foreign-financed investment expenditure and interest on external debt).
ISLA
MIC
REP
UB
LIC O
F M
AU
RIT
AN
IA
INTER
NA
TIO
NA
L MO
NETA
RY F
UN
D
39
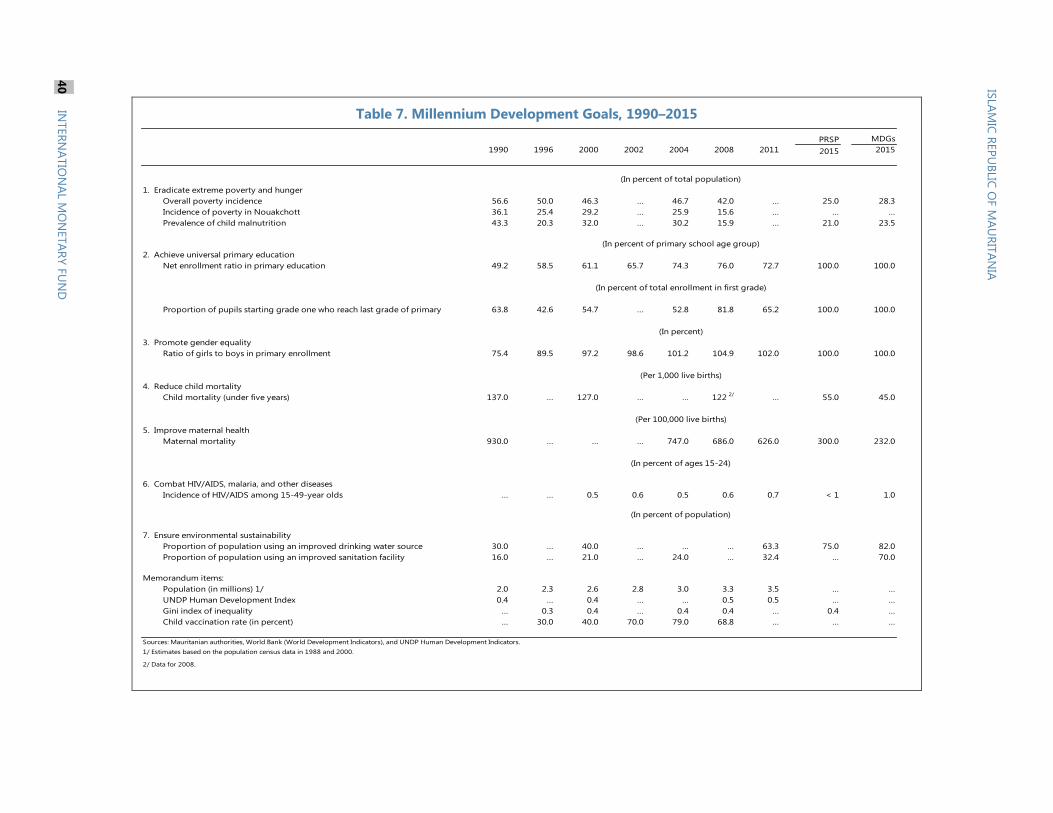
Table 7. Millennium Development Goals, 1990–2015
PRSP MDGs
1990 1996 2000 2002 2004 2008 2011 2015 2015
1. Eradicate extreme poverty and hunger
Overall poverty incidence 56.6 50.0 46.3 … 46.7 42.0 … 25.0 28.3
Incidence of poverty in Nouakchott 36.1 25.4 29.2 … 25.9 15.6 … … …
Prevalence of child malnutrition 43.3 20.3 32.0 … 30.2 15.9 … 21.0 23.5
2. Achieve universal primary education
Net enrollment ratio in primary education 49.2 58.5 61.1 65.7 74.3 76.0 72.7 100.0 100.0
Proportion of pupils starting grade one who reach last grade of primary 63.8 42.6 54.7 … 52.8 81.8 65.2 100.0 100.0
3. Promote gender equality
Ratio of girls to boys in primary enrollment 75.4 89.5 97.2 98.6 101.2 104.9 102.0 100.0 100.0
4. Reduce child mortality
Child mortality (under five years) 137.0 … 127.0 … … 122 2/
… 55.0 45.0
5. Improve maternal health
Maternal mortality 930.0 … … … 747.0 686.0 626.0 300.0 232.0
6. Combat HIV/AIDS, malaria, and other diseases
Incidence of HIV/AIDS among 15-49-year olds … … 0.5 0.6 0.5 0.6 0.7 < 1 1.0
7. Ensure environmental sustainability
Proportion of population using an improved drinking water source 30.0 … 40.0 … … … 63.3 75.0 82.0
Proportion of population using an improved sanitation facility 16.0 … 21.0 … 24.0 … 32.4 … 70.0
Memorandum items:
Population (in millions) 1/ 2.0 2.3 2.6 2.8 3.0 3.3 3.5 … …
UNDP Human Development Index 0.4 … 0.4 … … 0.5 0.5 … …
Gini index of inequality … 0.3 0.4 … 0.4 0.4 … 0.4 …
Child vaccination rate (in percent) … 30.0 40.0 70.0 79.0 68.8 … … …
Sources: Mauritanian authorities, World Bank (World Development Indicators), and UNDP Human Development Indicators.
1/ Estimates based on the population census data in 1988 and 2000.
2/ Data for 2008.
(Per 100,000 live births)
(In percent of ages 15-24)
(In percent of population)
(In percent of total population)
(In percent of primary school age group)
(In percent of total enrollment in first grade)
(In percent)
(Per 1,000 live births)
ISLA
MIC
REP
UB
LIC O
F M
AU
RIT
AN
IA
40
IN
TER
NA
TIO
NA
L MO
NETA
RY F
UN
D
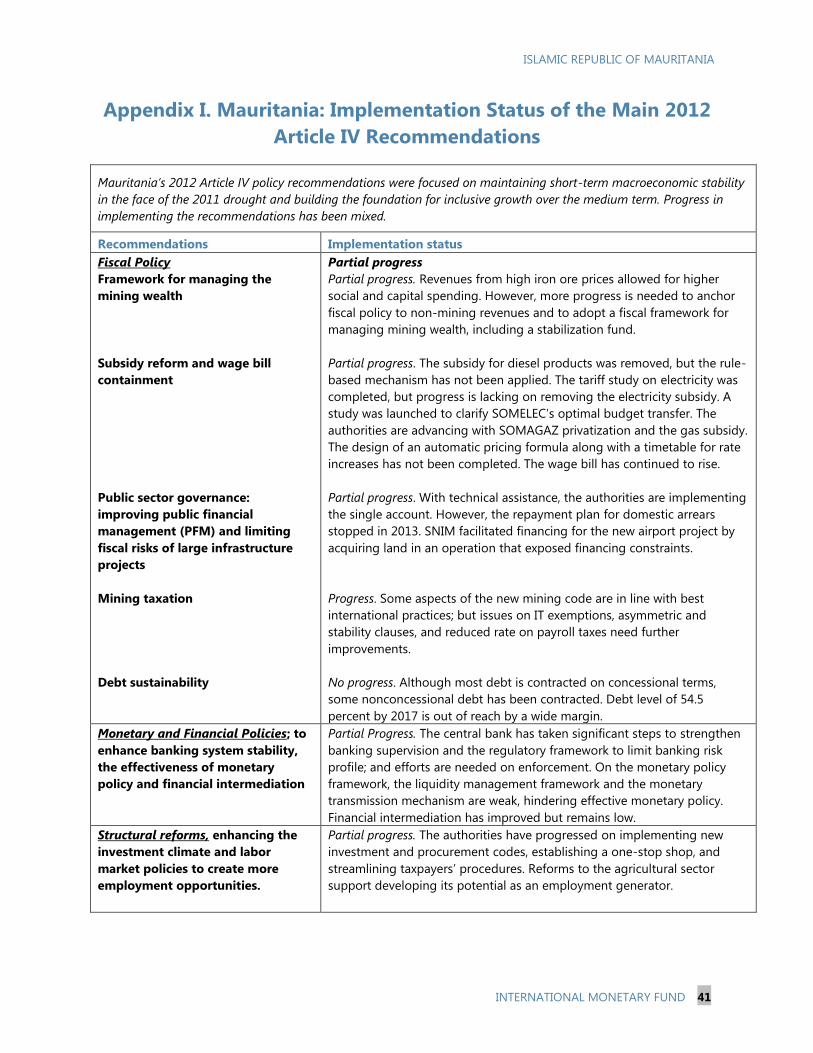
ISLAMIC REPUBLIC OF MAURITANIA
INTERNATIONAL MONETARY FUND 41
Appendix I. Mauritania: Implementation Status of the Main 2012
Article IV Recommendations
Mauritania’s 2012 Article IV policy recommendations were focused on maintaining short-term macroeconomic stability
in the face of the 2011 drought and building the foundation for inclusive growth over the medium term. Progress in
implementing the recommendations has been mixed.
Recommendations Implementation status
Fiscal Policy
Framework for managing the
mining wealth
Subsidy reform and wage bill
containment
Public sector governance:
improving public financial
management (PFM) and limiting
fiscal risks of large infrastructure
projects
Mining taxation
Debt sustainability
Partial progress
Partial progress. Revenues from high iron ore prices allowed for higher
social and capital spending. However, more progress is needed to anchor
fiscal policy to non-mining revenues and to adopt a fiscal framework for
managing mining wealth, including a stabilization fund.
Partial progress. The subsidy for diesel products was removed, but the rule-
based mechanism has not been applied. The tariff study on electricity was
completed, but progress is lacking on removing the electricity subsidy. A
study was launched to clarify SOMELEC’s optimal budget transfer. The
authorities are advancing with SOMAGAZ privatization and the gas subsidy.
The design of an automatic pricing formula along with a timetable for rate
increases has not been completed. The wage bill has continued to rise.
Partial progress. With technical assistance, the authorities are implementing
the single account. However, the repayment plan for domestic arrears
stopped in 2013. SNIM facilitated financing for the new airport project by
acquiring land in an operation that exposed financing constraints.
Progress. Some aspects of the new mining code are in line with best
international practices; but issues on IT exemptions, asymmetric and
stability clauses, and reduced rate on payroll taxes need further
improvements.
No progress. Although most debt is contracted on concessional terms,
some nonconcessional debt has been contracted. Debt level of 54.5
percent by 2017 is out of reach by a wide margin.
Monetary and Financial Policies; to
enhance banking system stability,
the effectiveness of monetary
policy and financial intermediation
Partial Progress. The central bank has taken significant steps to strengthen
banking supervision and the regulatory framework to limit banking risk
profile; and efforts are needed on enforcement. On the monetary policy
framework, the liquidity management framework and the monetary
transmission mechanism are weak, hindering effective monetary policy.
Financial intermediation has improved but remains low.
Structural reforms, enhancing the
investment climate and labor
market policies to create more
employment opportunities.
Partial progress. The authorities have progressed on implementing new
investment and procurement codes, establishing a one-stop shop, and
streamlining taxpayers’ procedures. Reforms to the agricultural sector
support developing its potential as an employment generator.
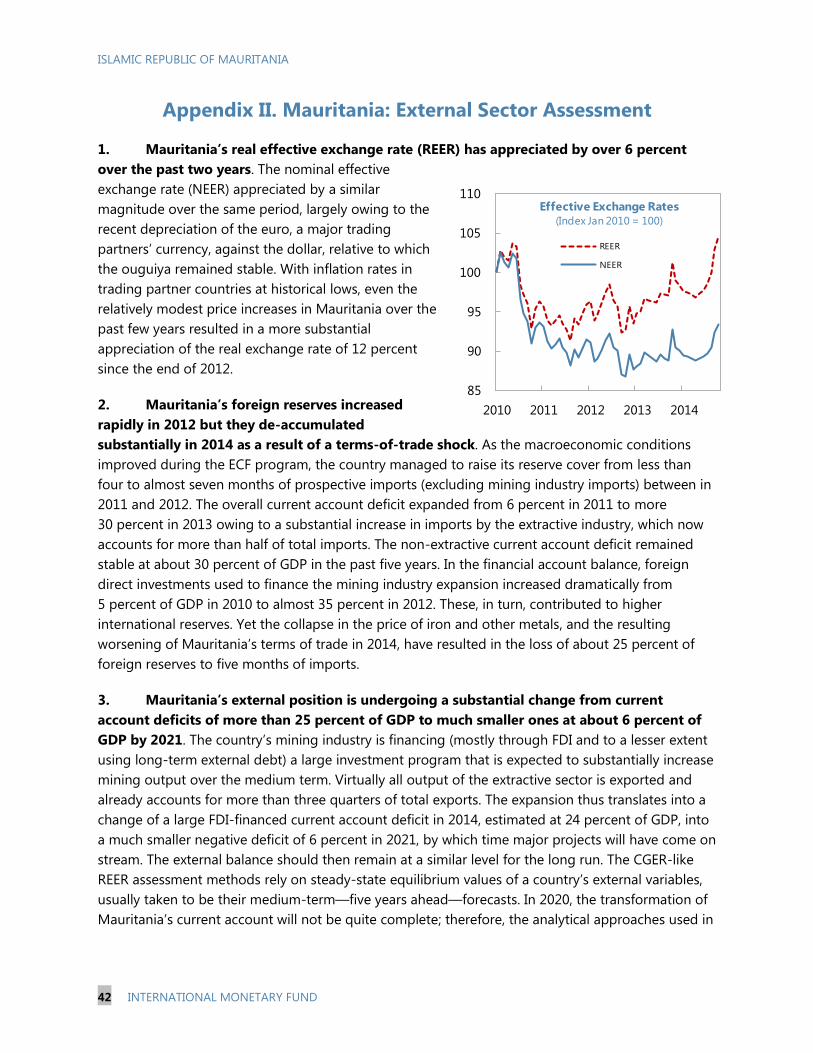
ISLAMIC REPUBLIC OF MAURITANIA
42 INTERNATIONAL MONETARY FUND
Appendix II. Mauritania: External Sector Assessment
1. Mauritania’s real effective exchange rate (REER) has appreciated by over 6 percent
over the past two years. The nominal effective
exchange rate (NEER) appreciated by a similar
magnitude over the same period, largely owing to the
recent depreciation of the euro, a major trading
partners’ currency, against the dollar, relative to which
the ouguiya remained stable. With inflation rates in
trading partner countries at historical lows, even the
relatively modest price increases in Mauritania over the
past few years resulted in a more substantial
appreciation of the real exchange rate of 12 percent
since the end of 2012.
2. Mauritania’s foreign reserves increased
rapidly in 2012 but they de-accumulated
substantially in 2014 as a result of a terms-of-trade shock. As the macroeconomic conditions
improved during the ECF program, the country managed to raise its reserve cover from less than
four to almost seven months of prospective imports (excluding mining industry imports) between in
2011 and 2012. The overall current account deficit expanded from 6 percent in 2011 to more
30 percent in 2013 owing to a substantial increase in imports by the extractive industry, which now
accounts for more than half of total imports. The non-extractive current account deficit remained
stable at about 30 percent of GDP in the past five years. In the financial account balance, foreign
direct investments used to finance the mining industry expansion increased dramatically from
5 percent of GDP in 2010 to almost 35 percent in 2012. These, in turn, contributed to higher
international reserves. Yet the collapse in the price of iron and other metals, and the resulting
worsening of Mauritania’s terms of trade in 2014, have resulted in the loss of about 25 percent of
foreign reserves to five months of imports.
3. Mauritania’s external position is undergoing a substantial change from current
account deficits of more than 25 percent of GDP to much smaller ones at about 6 percent of
GDP by 2021. The country’s mining industry is financing (mostly through FDI and to a lesser extent
using long-term external debt) a large investment program that is expected to substantially increase
mining output over the medium term. Virtually all output of the extractive sector is exported and
already accounts for more than three quarters of total exports. The expansion thus translates into a
change of a large FDI-financed current account deficit in 2014, estimated at 24 percent of GDP, into
a much smaller negative deficit of 6 percent in 2021, by which time major projects will have come on
stream. The external balance should then remain at a similar level for the long run. The CGER-like
REER assessment methods rely on steady-state equilibrium values of a country’s external variables,
usually taken to be their medium-term—five years ahead—forecasts. In 2020, the transformation of
Mauritania’s current account will not be quite complete; therefore, the analytical approaches used in
85
90
95
100
105
110
2010 2011 2012 2013 2014
REER
NEER
Effective Exchange Rates(Index Jan 2010 = 100)
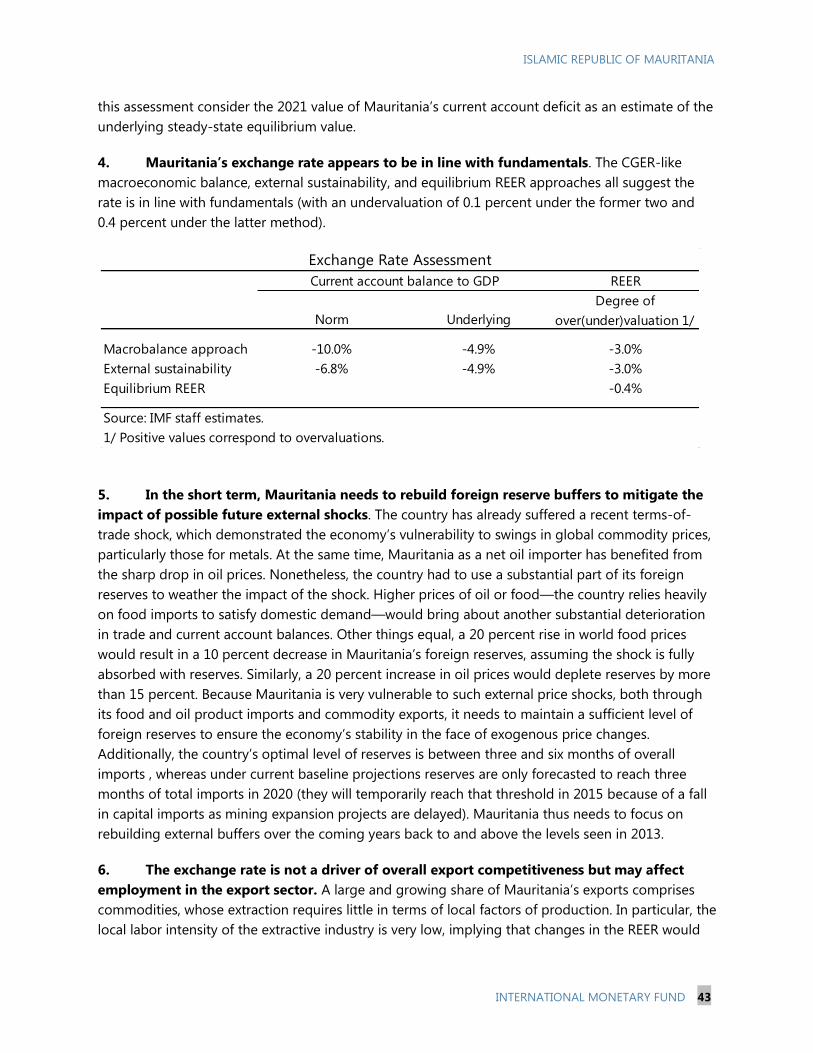
ISLAMIC REPUBLIC OF MAURITANIA
INTERNATIONAL MONETARY FUND 43
this assessment consider the 2021 value of Mauritania’s current account deficit as an estimate of the
underlying steady-state equilibrium value.
4. Mauritania’s exchange rate appears to be in line with fundamentals. The CGER-like
macroeconomic balance, external sustainability, and equilibrium REER approaches all suggest the
rate is in line with fundamentals (with an undervaluation of 0.1 percent under the former two and
0.4 percent under the latter method).
5. In the short term, Mauritania needs to rebuild foreign reserve buffers to mitigate the
impact of possible future external shocks. The country has already suffered a recent terms-of-
trade shock, which demonstrated the economy’s vulnerability to swings in global commodity prices,
particularly those for metals. At the same time, Mauritania as a net oil importer has benefited from
the sharp drop in oil prices. Nonetheless, the country had to use a substantial part of its foreign
reserves to weather the impact of the shock. Higher prices of oil or food—the country relies heavily
on food imports to satisfy domestic demand—would bring about another substantial deterioration
in trade and current account balances. Other things equal, a 20 percent rise in world food prices
would result in a 10 percent decrease in Mauritania’s foreign reserves, assuming the shock is fully
absorbed with reserves. Similarly, a 20 percent increase in oil prices would deplete reserves by more
than 15 percent. Because Mauritania is very vulnerable to such external price shocks, both through
its food and oil product imports and commodity exports, it needs to maintain a sufficient level of
foreign reserves to ensure the economy’s stability in the face of exogenous price changes.
Additionally, the country’s optimal level of reserves is between three and six months of overall
imports , whereas under current baseline projections reserves are only forecasted to reach three
months of total imports in 2020 (they will temporarily reach that threshold in 2015 because of a fall
in capital imports as mining expansion projects are delayed). Mauritania thus needs to focus on
rebuilding external buffers over the coming years back to and above the levels seen in 2013.
6. The exchange rate is not a driver of overall export competitiveness but may affect
employment in the export sector. A large and growing share of Mauritania’s exports comprises
commodities, whose extraction requires little in terms of local factors of production. In particular, the
local labor intensity of the extractive industry is very low, implying that changes in the REER would
Exchange Rate Assessment
Current account balance to GDP REER
Norm Underlying
Degree of
over(under)valuation 1/
Macrobalance approach -10.0% -4.9% -3.0%
External sustainability -6.8% -4.9% -3.0%
Equilibrium REER -0.4%
Source: IMF staff estimates.
1/ Positive values correspond to overvaluations.

ISLAMIC REPUBLIC OF MAURITANIA
44 INTERNATIONAL MONETARY FUND
be unlikely to affect the country’s competitiveness on global commodity markets. At the same time,
Mauritania is attempting to expand its artisanal fish industry precisely because of its high labor
intensity, in order to increase formal employment in a higher value-added sector. A substantial REER
appreciation, which may result from the improvement in the country’s current account balance,
could negatively affect local employment in the export-focused fishing industry.
7. Non-price measures of structural competitiveness suggest that Mauritania can
improve its external competitiveness substantially through structural reforms. Both the 2014
Doing Business indicators and the 2014–15 Global Competitiveness Index (GCI) show that
Mauritania is lagging behind the average for lower-income countries (LICs) and behind the oil
importers of the MENAP region. The Doing Business survey indicates that access to finance may
present the largest constraint to businesses in the economy, followed by supply of adequate
infrastructure. GCI data, in turn, demonstrate that,
within infrastructure, Mauritania particularly lags
behind other LICs in quality of roads, port, and air
transport infrastructure. The authorities are already
addressing deficiencies in these areas through their
public investment program. Continued well-targeted
and effective improvements—as well as better access
to finance through a more developed financial
system—can ease the operating conditions for local
business and thereby improve their external
competitiveness.
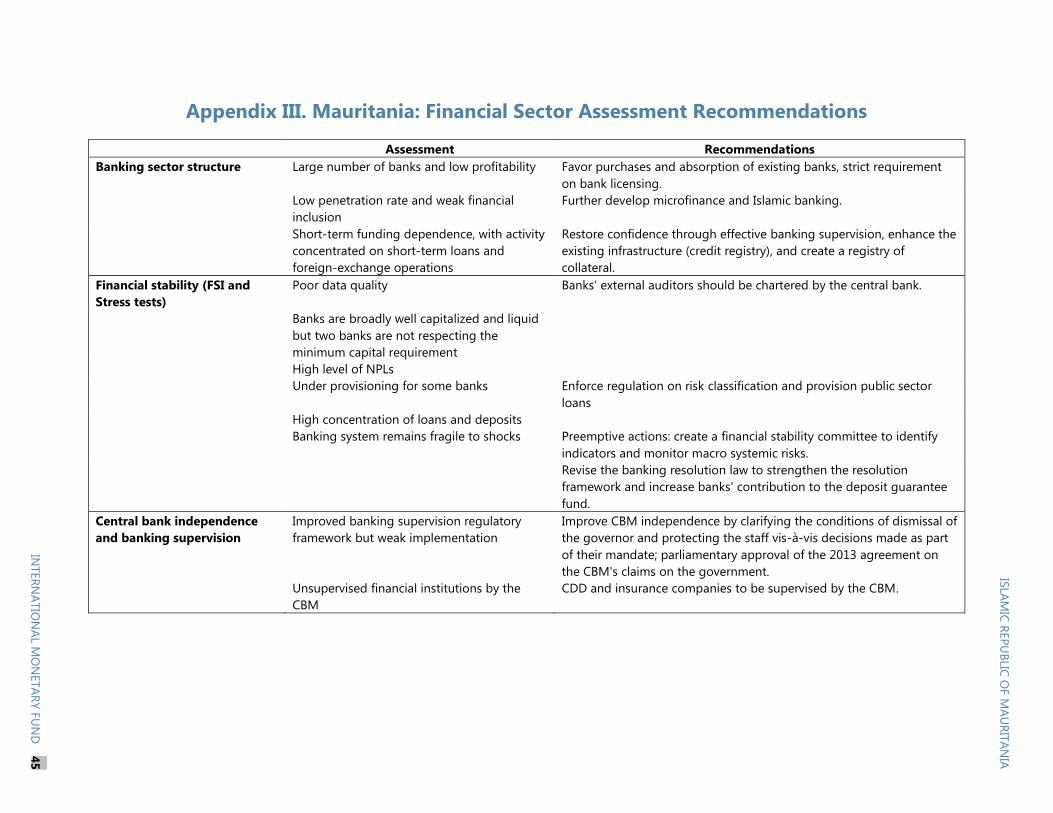
Appendix III. Mauritania: Financial Sector Assessment Recommendations
Assessment Recommendations
Banking sector structure Large number of banks and low profitability Favor purchases and absorption of existing banks, strict requirement
on bank licensing.
Low penetration rate and weak financial
inclusion
Further develop microfinance and Islamic banking.
Short-term funding dependence, with activity
concentrated on short-term loans and
foreign-exchange operations
Restore confidence through effective banking supervision, enhance the
existing infrastructure (credit registry), and create a registry of
collateral.
Financial stability (FSI and
Stress tests)
Poor data quality Banks’ external auditors should be chartered by the central bank.
Banks are broadly well capitalized and liquid
but two banks are not respecting the
minimum capital requirement
High level of NPLs
Under provisioning for some banks Enforce regulation on risk classification and provision public sector
loans
High concentration of loans and deposits
Banking system remains fragile to shocks Preemptive actions: create a financial stability committee to identify
indicators and monitor macro systemic risks.
Revise the banking resolution law to strengthen the resolution
framework and increase banks' contribution to the deposit guarantee
fund.
Central bank independence
and banking supervision
Improved banking supervision regulatory
framework but weak implementation
Improve CBM independence by clarifying the conditions of dismissal of
the governor and protecting the staff vis-à-vis decisions made as part
of their mandate; parliamentary approval of the 2013 agreement on
the CBM's claims on the government.
Unsupervised financial institutions by the
CBM
CDD and insurance companies to be supervised by the CBM.
ISLA
MIC
REP
UB
LIC O
F M
AU
RIT
AN
IA
INTER
NA
TIO
NA
L MO
NETA
RY F
UN
D
45
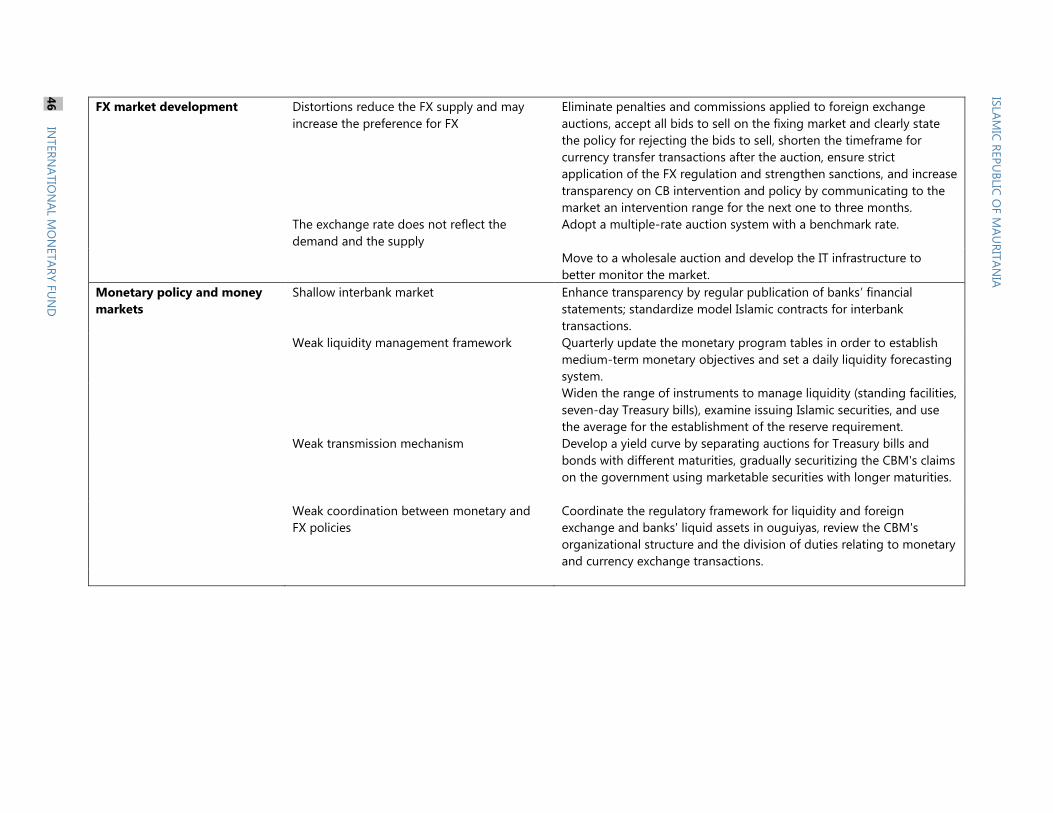
FX market development Distortions reduce the FX supply and may
increase the preference for FX
Eliminate penalties and commissions applied to foreign exchange
auctions, accept all bids to sell on the fixing market and clearly state
the policy for rejecting the bids to sell, shorten the timeframe for
currency transfer transactions after the auction, ensure strict
application of the FX regulation and strengthen sanctions, and increase
transparency on CB intervention and policy by communicating to the
market an intervention range for the next one to three months.
The exchange rate does not reflect the
demand and the supply
Adopt a multiple-rate auction system with a benchmark rate.
Move to a wholesale auction and develop the IT infrastructure to
better monitor the market.
Monetary policy and money
markets
Shallow interbank market Enhance transparency by regular publication of banks’ financial
statements; standardize model Islamic contracts for interbank
transactions.
Weak liquidity management framework Quarterly update the monetary program tables in order to establish
medium-term monetary objectives and set a daily liquidity forecasting
system.
Widen the range of instruments to manage liquidity (standing facilities,
seven-day Treasury bills), examine issuing Islamic securities, and use
the average for the establishment of the reserve requirement.
Weak transmission mechanism Develop a yield curve by separating auctions for Treasury bills and
bonds with different maturities, gradually securitizing the CBM's claims
on the government using marketable securities with longer maturities.
Weak coordination between monetary and
FX policies
Coordinate the regulatory framework for liquidity and foreign
exchange and banks' liquid assets in ouguiyas, review the CBM's
organizational structure and the division of duties relating to monetary
and currency exchange transactions.
ISLA
MIC
REP
UB
LIC O
F M
AU
RIT
AN
IA
46
IN
TER
NA
TIO
NA
L MO
NETA
RY F
UN
D
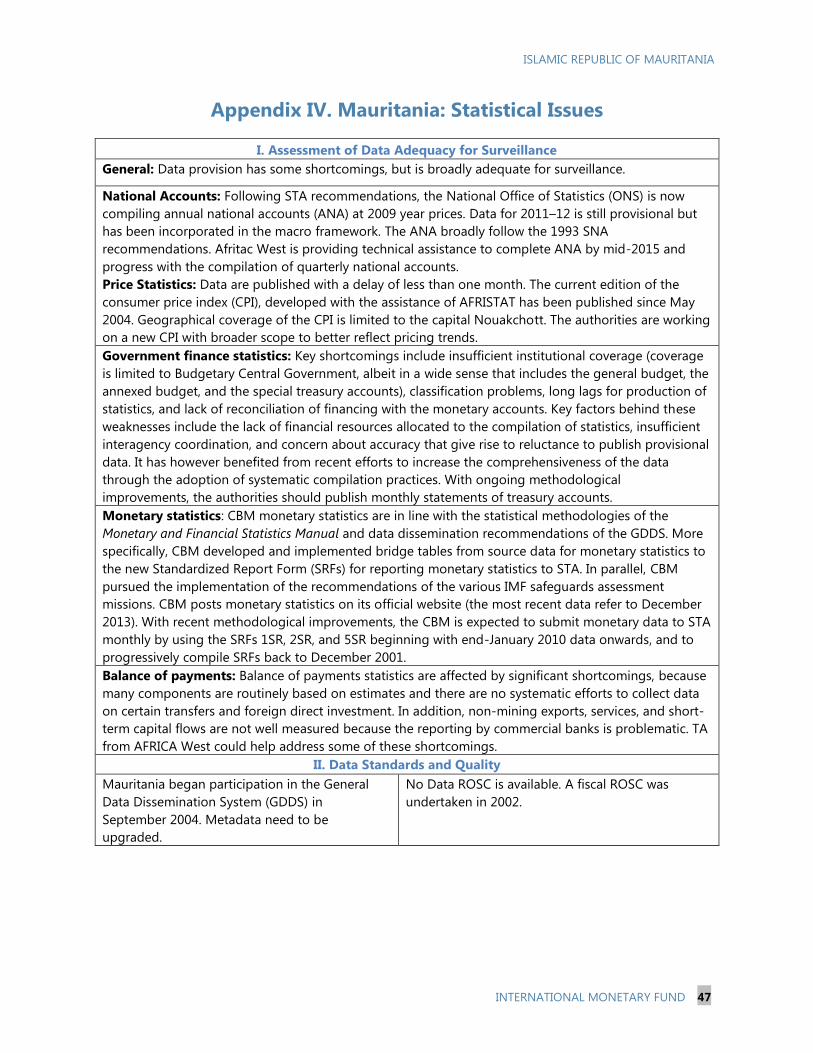
ISLAMIC REPUBLIC OF MAURITANIA
INTERNATIONAL MONETARY FUND 47
Appendix IV. Mauritania: Statistical Issues
I. Assessment of Data Adequacy for Surveillance
General: Data provision has some shortcomings, but is broadly adequate for surveillance.
National Accounts: Following STA recommendations, the National Office of Statistics (ONS) is now
compiling annual national accounts (ANA) at 2009 year prices. Data for 2011–12 is still provisional but
has been incorporated in the macro framework. The ANA broadly follow the 1993 SNA
recommendations. Afritac West is providing technical assistance to complete ANA by mid-2015 and
progress with the compilation of quarterly national accounts.
Price Statistics: Data are published with a delay of less than one month. The current edition of the
consumer price index (CPI), developed with the assistance of AFRISTAT has been published since May
2004. Geographical coverage of the CPI is limited to the capital Nouakchott. The authorities are working
on a new CPI with broader scope to better reflect pricing trends.
Government finance statistics: Key shortcomings include insufficient institutional coverage (coverage
is limited to Budgetary Central Government, albeit in a wide sense that includes the general budget, the
annexed budget, and the special treasury accounts), classification problems, long lags for production of
statistics, and lack of reconciliation of financing with the monetary accounts. Key factors behind these
weaknesses include the lack of financial resources allocated to the compilation of statistics, insufficient
interagency coordination, and concern about accuracy that give rise to reluctance to publish provisional
data. It has however benefited from recent efforts to increase the comprehensiveness of the data
through the adoption of systematic compilation practices. With ongoing methodological
improvements, the authorities should publish monthly statements of treasury accounts.
Monetary statistics: CBM monetary statistics are in line with the statistical methodologies of the
Monetary and Financial Statistics Manual and data dissemination recommendations of the GDDS. More
specifically, CBM developed and implemented bridge tables from source data for monetary statistics to
the new Standardized Report Form (SRFs) for reporting monetary statistics to STA. In parallel, CBM
pursued the implementation of the recommendations of the various IMF safeguards assessment
missions. CBM posts monetary statistics on its official website (the most recent data refer to December
2013). With recent methodological improvements, the CBM is expected to submit monetary data to STA
monthly by using the SRFs 1SR, 2SR, and 5SR beginning with end-January 2010 data onwards, and to
progressively compile SRFs back to December 2001.
Balance of payments: Balance of payments statistics are affected by significant shortcomings, because
many components are routinely based on estimates and there are no systematic efforts to collect data
on certain transfers and foreign direct investment. In addition, non-mining exports, services, and short-
term capital flows are not well measured because the reporting by commercial banks is problematic. TA
from AFRICA West could help address some of these shortcomings.
II. Data Standards and Quality
Mauritania began participation in the General
Data Dissemination System (GDDS) in
September 2004. Metadata need to be
upgraded.
No Data ROSC is available. A fiscal ROSC was
undertaken in 2002.
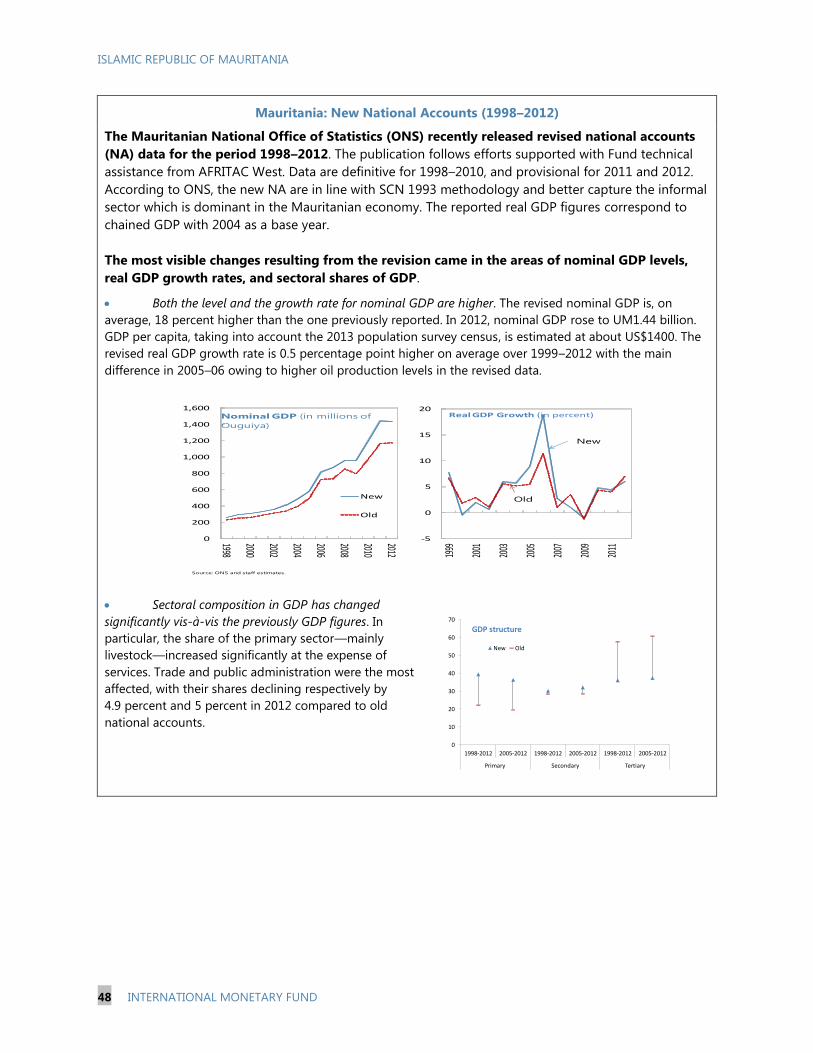
ISLAMIC REPUBLIC OF MAURITANIA
48 INTERNATIONAL MONETARY FUND
Mauritania: New National Accounts (1998–2012)
The Mauritanian National Office of Statistics (ONS) recently released revised national accounts
(NA) data for the period 1998–2012. The publication follows efforts supported with Fund technical
assistance from AFRITAC West. Data are definitive for 1998–2010, and provisional for 2011 and 2012.
According to ONS, the new NA are in line with SCN 1993 methodology and better capture the informal
sector which is dominant in the Mauritanian economy. The reported real GDP figures correspond to
chained GDP with 2004 as a base year.
The most visible changes resulting from the revision came in the areas of nominal GDP levels,
real GDP growth rates, and sectoral shares of GDP.
Both the level and the growth rate for nominal GDP are higher. The revised nominal GDP is, on
average, 18 percent higher than the one previously reported. In 2012, nominal GDP rose to UM1.44 billion.
GDP per capita, taking into account the 2013 population survey census, is estimated at about US$1400. The
revised real GDP growth rate is 0.5 percentage point higher on average over 1999–2012 with the main
difference in 2005–06 owing to higher oil production levels in the revised data.
Sectoral composition in GDP has changed
significantly vis-à-vis the previously GDP figures. In
particular, the share of the primary sector—mainly
livestock—increased significantly at the expense of
services. Trade and public administration were the most
affected, with their shares declining respectively by
4.9 percent and 5 percent in 2012 compared to old
national accounts.
Source: ONS and staff estimates.
0
200
400
600
800
1,000
1,200
1,400
1,600
1998
2000
2002
2004
2006
2008
2010
2012
New
Old
Nominal GDP (in millions of
Ouguiya)
-5
0
5
10
15
20
1999
2001
2003
2005
2007
2009
2011
Real GDP Growth (in percent)
New
Old
0
10
20
30
40
50
60
70
1998-2012 2005-2012 1998-2012 2005-2012 1998-2012 2005-2012
Primary Secondary Tertiary
GDP structure
New Old
ISLAMIC REPUBLIC OF MAURITANIA STAFF REPORT FOR THE 2014 ARTICLE IV CONSULTATION—INFORMATIONAL ANNEX Prepared By
Middle East and Central Asia Department (In consultation with other departments)
FUND RELATIONS ________________________________________________________________________ 2
JOINT MANAGEMENT ACTION PLAN OF THE WORLD BANK AND IMF ______________ 9
STATISTICAL ISSUES ____________________________________________________________________ 11
CONTENTS
January 14, 2015

ISLAMIC REPUBLIC OF MAURITANIA
2 INTERNATIONAL MONETARY FUND
FUND RELATIONS (As of November 30, 2014) Membership Status: Joined: September 10, 1963 Article VIII General Resources Account: SDR Million %QuotaQuota 64.4 100Fund holdings of currency (Exchange Rate) 64.39 99.99Reserve Tranche Position 0.02 0.03 SDR Department: SDR Million %AllocationNet cumulative allocation 61.67 100Holdings 0.93 1.52 Outstanding Purchases and Loans: SDR Million %QuotaECF Arrangements 83.01 128.9 Latest Financial Arrangements: Date of Expiration Amount Approved Amount Drawn Type Arrangement Date (SDR Million) (SDR Million) ECF 15-Mar-10 25-Jun-13 77.28 77.28ECF 1 18-Dec-06 1-Nov-09 16.1 10.31ECF 1 18-Jul-03 7-Nov-04 6.44 0.92 Projected Payments to Fund 2 (SDR Million; based on existing use of resources and present holdings of SDRs):
Forthcoming 2014 2015 2016 2017 2018 Principal 3.17 7.58 10.25 14.55 Charges/Interest 0.23 0.22 0.2 0.17 Total 3.4 7.8 10.45 14.72
1 Formerly PRGF 2 When a member has overdue financial obligations outstanding for more than three months, the amount of such arrears will be shown in this section.

ISLAMIC REPUBLIC OF MAURITANIA
INTERNATIONAL MONETARY FUND 3
Implementation of HIPC Initiative:
I. Commitment of HIPC assistance Enhanced Framework
Decision point date Feb-00 Assistance committed by all creditors (US$ million)3 622 Of which: IMF assistance (US$ million) 46.76 (SDR equivalent in millions) 34.8 Completion point date Jun-02 II. Disbursement of IMF assistance (SDR Million) Assistance disbursed to the member 34.80 Interim assistance 16.88 Completion point balance 17.92 Additional disbursement of interest income4 3.63 Total disbursements 38.43 Implementation of Multilateral Debt Relief Initiative (MDRI): I. MDRI-eligible debt (SDR Million)5 32.91 Financed by: MDRI Trust 30.23 Remaining HIPC resources 2.68 II. Debt Relief by Facility (SDR Million) Eligible Debt Delivery Date GRA PRGT Total June 2006 N/A 32.91 32.91 Implementation of Post-Catastrophe Debt Relief (PCDR): Not Applicable Decision point—point at which the IMF and the World Bank determine whether a country qualifies for assistance under the HIPC Initiative and decide on the amount of assistance to be committed. Interim assistance—amount disbursed to a country during the period between decision and completion points, up to 20 percent annually and 60 percent in total of the assistance committed at the decision point (or 25 percent and 75 percent, respectively, in exceptional circumstances).
3 Assistance committed under the original framework is expressed in net present value (NPV) terms at the completion point, and assistance committed under the enhanced framework is expressed in NPV terms at the decision point. Hence these two amounts cannot be added. 4 Under the enhanced framework, an additional disbursement is made at the completion point corresponding to interest income earned on the amount committed at the decision point but not disbursed during the interim period. 5 The MDRI provides 100 percent debt relief to eligible member countries that qualified for the assistance. Grant assistance from the MDRI Trust and HIPC resources provide debt relief to cover the full stock of debt owed to the Fund as of end-2004 that remains outstanding at the time the member qualifies for such debt relief.
ISLAMIC REPUBLIC OF MAURITANIA
4 INTERNATIONAL MONETARY FUND
Completion point—point at which a country receives the remaining balance of its assistance committed at the decision point, together with an additional disbursement of interest income as defined in footnote 2 above. The timing of the completion point is linked to the implementation of pre-agreed key structural reforms (i.e., floating completion point). Safeguards Assessments The latest safeguards assessment of the CBM, completed on April 30, 2010, concluded that significant risks remain. Action is needed to develop the CBM’s financial reporting, which lags significantly behind international standards and the practices of other central banks in the region. The CBM will also need to build capacity in the areas of information systems and internal audit, and notwithstanding recommendations to improve governance, has no plans to establish an Audit Committee or require the Board to fulfill its functions. AML/CFT The Middle East and North Africa Financial Action Task Force (MENAFATF) adopted the mutual evaluation report for Mauritania in November 2006, where it recommended corrective measures to address the deficiencies in the country’s AML/CFT framework. In the ninth follow-up report last November 2014, the MENAFATF noted the positive steps taken by the authorities, such as Senate approval of the amended AML/CFT draft law. However they concluded that some core and key recommendations remain unaddressed, in particular, (a) shortcomings in the legal definition of the act of terrorist financing; and (b) lack of sufficient procedures to implement United Nations Security Council Resolutions (UNSCRs) 1267 and 1373 on listing and freezing of terrorist assets. Mauritania was thus kept under the enhanced follow-up procedures and was asked to report back on new actions taken at the next Plenary scheduled for end-April 2015. Authorities are committed to improving the AML/CFT laws to address the identified deficiencies, and have undertaken measures to expedite procedures for joining the Egmont Group of Financial Intelligence Units as recommended by the 2012 FATF. Exchange Arrangement Mauritania’s de jure exchange rate arrangement is floating. The de facto exchange rate arrangement has been reclassified from “other managed” to “stabilized” effective November 20, 2013. Since end-March the nominal exchange rate against the U.S. dollar has remained within a 2 percent band. Mauritania maintains one exchange restriction subject to IMF approval under Article VIII of the Fund’s Articles of Agreement. The exchange restriction arises from the insufficient foreign exchange availability at the fixing sessions (auctions) organized by the Central Bank of Mauritania (CBM) for those transactions which are required to be submitted to the auctions. The authorities have requested, and staff recommends, Board approval for the temporary retention of this restriction. Last Article IV Consultation Previous Article IV discussions were held in Nouakchott during April 29–May 16, 2012 together with the Fourth Review under the Three-Year Extended Credit Facility Arrangement. The Country Report No. 12/246 was considered by the Executive Board on July 2, 2012.
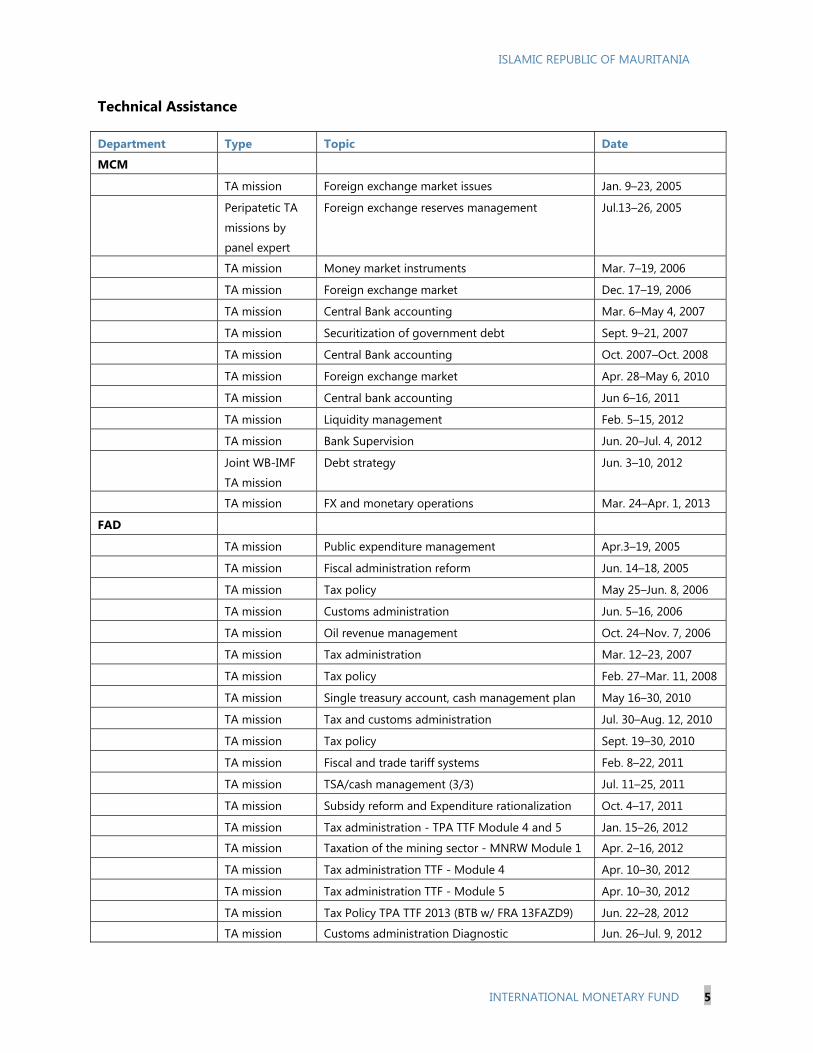
ISLAMIC REPUBLIC OF MAURITANIA
INTERNATIONAL MONETARY FUND 5
Technical Assistance
Department Type Topic Date
MCM
TA mission Foreign exchange market issues Jan. 9–23, 2005
Peripatetic TA
missions by
panel expert
Foreign exchange reserves management Jul.13–26, 2005
TA mission Money market instruments Mar. 7–19, 2006
TA mission Foreign exchange market Dec. 17–19, 2006
TA mission Central Bank accounting Mar. 6–May 4, 2007
TA mission Securitization of government debt Sept. 9–21, 2007
TA mission Central Bank accounting Oct. 2007–Oct. 2008
TA mission Foreign exchange market Apr. 28–May 6, 2010
TA mission Central bank accounting Jun 6–16, 2011
TA mission Liquidity management Feb. 5–15, 2012
TA mission Bank Supervision Jun. 20–Jul. 4, 2012
Joint WB-IMF
TA mission
Debt strategy Jun. 3–10, 2012
TA mission FX and monetary operations Mar. 24–Apr. 1, 2013
FAD
TA mission Public expenditure management Apr.3–19, 2005
TA mission Fiscal administration reform Jun. 14–18, 2005
TA mission Tax policy May 25–Jun. 8, 2006
TA mission Customs administration Jun. 5–16, 2006
TA mission Oil revenue management Oct. 24–Nov. 7, 2006
TA mission Tax administration Mar. 12–23, 2007
TA mission Tax policy Feb. 27–Mar. 11, 2008
TA mission Single treasury account, cash management plan May 16–30, 2010
TA mission Tax and customs administration Jul. 30–Aug. 12, 2010
TA mission Tax policy Sept. 19–30, 2010
TA mission Fiscal and trade tariff systems Feb. 8–22, 2011
TA mission TSA/cash management (3/3) Jul. 11–25, 2011
TA mission Subsidy reform and Expenditure rationalization Oct. 4–17, 2011
TA mission Tax administration - TPA TTF Module 4 and 5 Jan. 15–26, 2012
TA mission Taxation of the mining sector - MNRW Module 1 Apr. 2–16, 2012
TA mission Tax administration TTF - Module 4 Apr. 10–30, 2012
TA mission Tax administration TTF - Module 5 Apr. 10–30, 2012
TA mission Tax Policy TPA TTF 2013 (BTB w/ FRA 13FAZD9) Jun. 22–28, 2012
TA mission Customs administration Diagnostic Jun. 26–Jul. 9, 2012
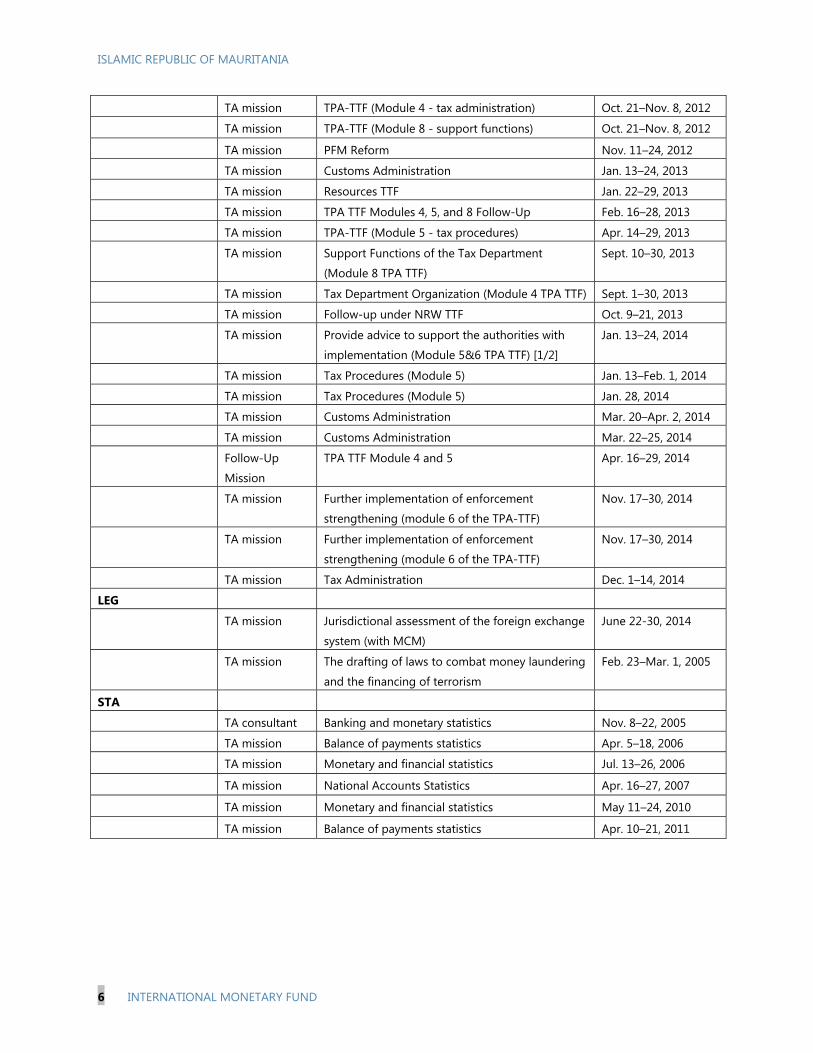
ISLAMIC REPUBLIC OF MAURITANIA
6 INTERNATIONAL MONETARY FUND
TA mission TPA-TTF (Module 4 - tax administration) Oct. 21–Nov. 8, 2012
TA mission TPA-TTF (Module 8 - support functions) Oct. 21–Nov. 8, 2012
TA mission PFM Reform Nov. 11–24, 2012
TA mission Customs Administration Jan. 13–24, 2013
TA mission Resources TTF Jan. 22–29, 2013
TA mission TPA TTF Modules 4, 5, and 8 Follow-Up Feb. 16–28, 2013
TA mission TPA-TTF (Module 5 - tax procedures) Apr. 14–29, 2013
TA mission Support Functions of the Tax Department
(Module 8 TPA TTF)
Sept. 10–30, 2013
TA mission Tax Department Organization (Module 4 TPA TTF) Sept. 1–30, 2013
TA mission Follow-up under NRW TTF Oct. 9–21, 2013
TA mission Provide advice to support the authorities with
implementation (Module 5&6 TPA TTF) [1/2]
Jan. 13–24, 2014
TA mission Tax Procedures (Module 5) Jan. 13–Feb. 1, 2014
TA mission Tax Procedures (Module 5) Jan. 28, 2014
TA mission Customs Administration Mar. 20–Apr. 2, 2014
TA mission Customs Administration Mar. 22–25, 2014
Follow-Up
Mission
TPA TTF Module 4 and 5 Apr. 16–29, 2014
TA mission Further implementation of enforcement
strengthening (module 6 of the TPA-TTF)
Nov. 17–30, 2014
TA mission Further implementation of enforcement
strengthening (module 6 of the TPA-TTF)
Nov. 17–30, 2014
TA mission Tax Administration Dec. 1–14, 2014
LEG
TA mission Jurisdictional assessment of the foreign exchange
system (with MCM)
June 22-30, 2014
TA mission The drafting of laws to combat money laundering
and the financing of terrorism
Feb. 23–Mar. 1, 2005
STA
TA consultant Banking and monetary statistics Nov. 8–22, 2005
TA mission Balance of payments statistics Apr. 5–18, 2006
TA mission Monetary and financial statistics Jul. 13–26, 2006
TA mission National Accounts Statistics Apr. 16–27, 2007
TA mission Monetary and financial statistics May 11–24, 2010
TA mission Balance of payments statistics Apr. 10–21, 2011
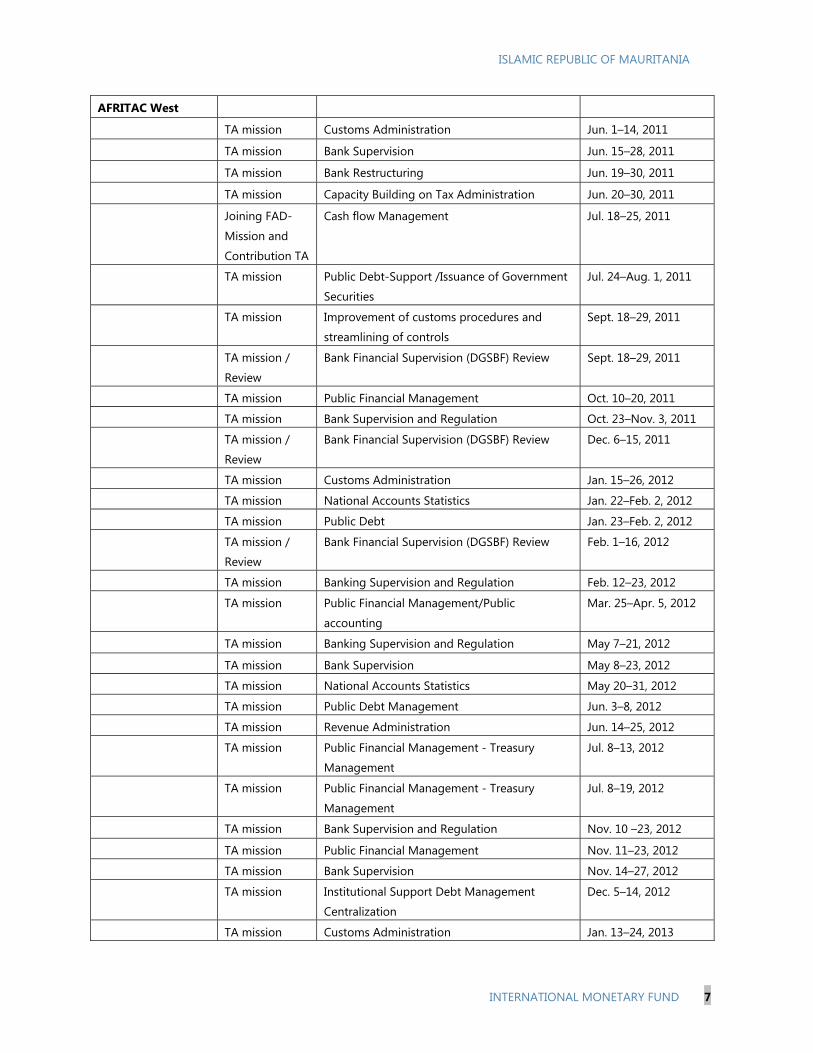
ISLAMIC REPUBLIC OF MAURITANIA
INTERNATIONAL MONETARY FUND 7
AFRITAC West
TA mission Customs Administration Jun. 1–14, 2011
TA mission Bank Supervision Jun. 15–28, 2011
TA mission Bank Restructuring Jun. 19–30, 2011
TA mission Capacity Building on Tax Administration Jun. 20–30, 2011
Joining FAD-
Mission and
Contribution TA
Cash flow Management Jul. 18–25, 2011
TA mission Public Debt-Support /Issuance of Government
Securities
Jul. 24–Aug. 1, 2011
TA mission Improvement of customs procedures and
streamlining of controls
Sept. 18–29, 2011
TA mission /
Review
Bank Financial Supervision (DGSBF) Review Sept. 18–29, 2011
TA mission Public Financial Management Oct. 10–20, 2011
TA mission Bank Supervision and Regulation Oct. 23–Nov. 3, 2011
TA mission /
Review
Bank Financial Supervision (DGSBF) Review Dec. 6–15, 2011
TA mission Customs Administration Jan. 15–26, 2012
TA mission National Accounts Statistics Jan. 22–Feb. 2, 2012
TA mission Public Debt Jan. 23–Feb. 2, 2012
TA mission /
Review
Bank Financial Supervision (DGSBF) Review Feb. 1–16, 2012
TA mission Banking Supervision and Regulation Feb. 12–23, 2012
TA mission Public Financial Management/Public
accounting
Mar. 25–Apr. 5, 2012
TA mission Banking Supervision and Regulation May 7–21, 2012
TA mission Bank Supervision May 8–23, 2012
TA mission National Accounts Statistics May 20–31, 2012
TA mission Public Debt Management Jun. 3–8, 2012
TA mission Revenue Administration Jun. 14–25, 2012
TA mission Public Financial Management - Treasury
Management
Jul. 8–13, 2012
TA mission Public Financial Management - Treasury
Management
Jul. 8–19, 2012
TA mission Bank Supervision and Regulation Nov. 10 –23, 2012
TA mission Public Financial Management Nov. 11–23, 2012
TA mission Bank Supervision Nov. 14–27, 2012
TA mission Institutional Support Debt Management
Centralization
Dec. 5–14, 2012
TA mission Customs Administration Jan. 13–24, 2013
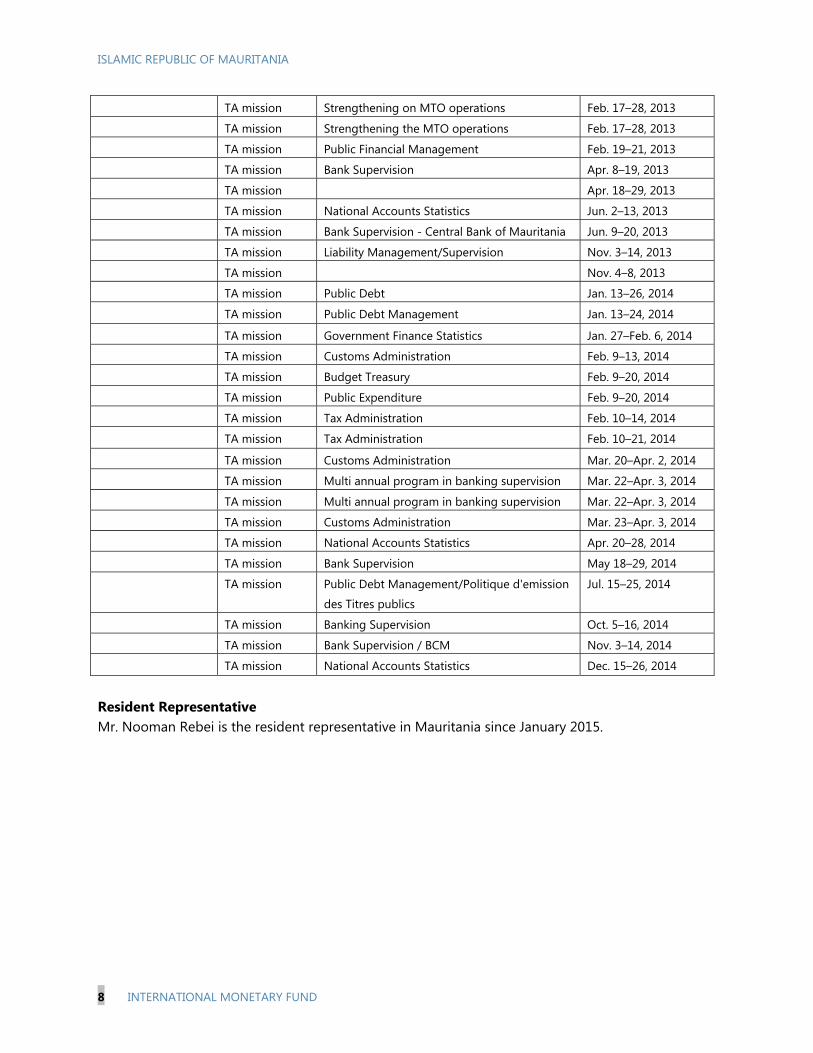
ISLAMIC REPUBLIC OF MAURITANIA
8 INTERNATIONAL MONETARY FUND
TA mission Strengthening on MTO operations Feb. 17–28, 2013
TA mission Strengthening the MTO operations Feb. 17–28, 2013
TA mission Public Financial Management Feb. 19–21, 2013
TA mission Bank Supervision Apr. 8–19, 2013
TA mission Apr. 18–29, 2013
TA mission National Accounts Statistics Jun. 2–13, 2013
TA mission Bank Supervision - Central Bank of Mauritania Jun. 9–20, 2013
TA mission Liability Management/Supervision Nov. 3–14, 2013
TA mission Nov. 4–8, 2013
TA mission Public Debt Jan. 13–26, 2014
TA mission Public Debt Management Jan. 13–24, 2014
TA mission Government Finance Statistics Jan. 27–Feb. 6, 2014
TA mission Customs Administration Feb. 9–13, 2014
TA mission Budget Treasury Feb. 9–20, 2014
TA mission Public Expenditure Feb. 9–20, 2014
TA mission Tax Administration Feb. 10–14, 2014
TA mission Tax Administration Feb. 10–21, 2014
TA mission Customs Administration Mar. 20–Apr. 2, 2014
TA mission Multi annual program in banking supervision Mar. 22–Apr. 3, 2014
TA mission Multi annual program in banking supervision Mar. 22–Apr. 3, 2014
TA mission Customs Administration Mar. 23–Apr. 3, 2014
TA mission National Accounts Statistics Apr. 20–28, 2014
TA mission Bank Supervision May 18–29, 2014
TA mission Public Debt Management/Politique d'emission
des Titres publics
Jul. 15–25, 2014
TA mission Banking Supervision Oct. 5–16, 2014
TA mission Bank Supervision / BCM Nov. 3–14, 2014
TA mission National Accounts Statistics Dec. 15–26, 2014
Resident Representative Mr. Nooman Rebei is the resident representative in Mauritania since January 2015.
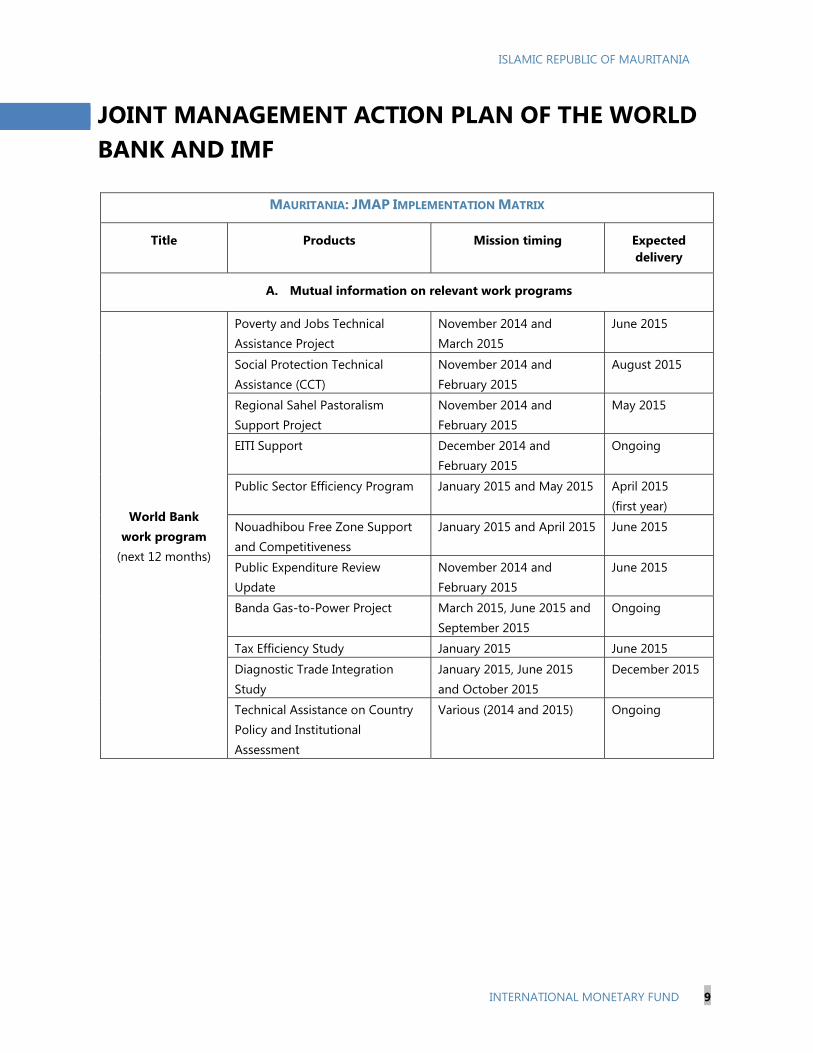
ISLAMIC REPUBLIC OF MAURITANIA
INTERNATIONAL MONETARY FUND 9
JOINT MANAGEMENT ACTION PLAN OF THE WORLD BANK AND IMF
MAURITANIA: JMAP IMPLEMENTATION MATRIX
Title Products Mission timing Expected delivery
A. Mutual information on relevant work programs
World Bank work program
(next 12 months)
Poverty and Jobs Technical Assistance Project
November 2014 and March 2015
June 2015
Social Protection Technical Assistance (CCT)
November 2014 and February 2015
August 2015
Regional Sahel Pastoralism Support Project
November 2014 and February 2015
May 2015
EITI Support December 2014 and February 2015
Ongoing
Public Sector Efficiency Program January 2015 and May 2015 April 2015 (first year)
Nouadhibou Free Zone Support and Competitiveness
January 2015 and April 2015 June 2015
Public Expenditure Review Update
November 2014 and February 2015
June 2015
Banda Gas-to-Power Project March 2015, June 2015 and September 2015
Ongoing
Tax Efficiency Study January 2015 June 2015
Diagnostic Trade Integration Study
January 2015, June 2015 and October 2015
December 2015
Technical Assistance on Country Policy and Institutional Assessment
Various (2014 and 2015) Ongoing
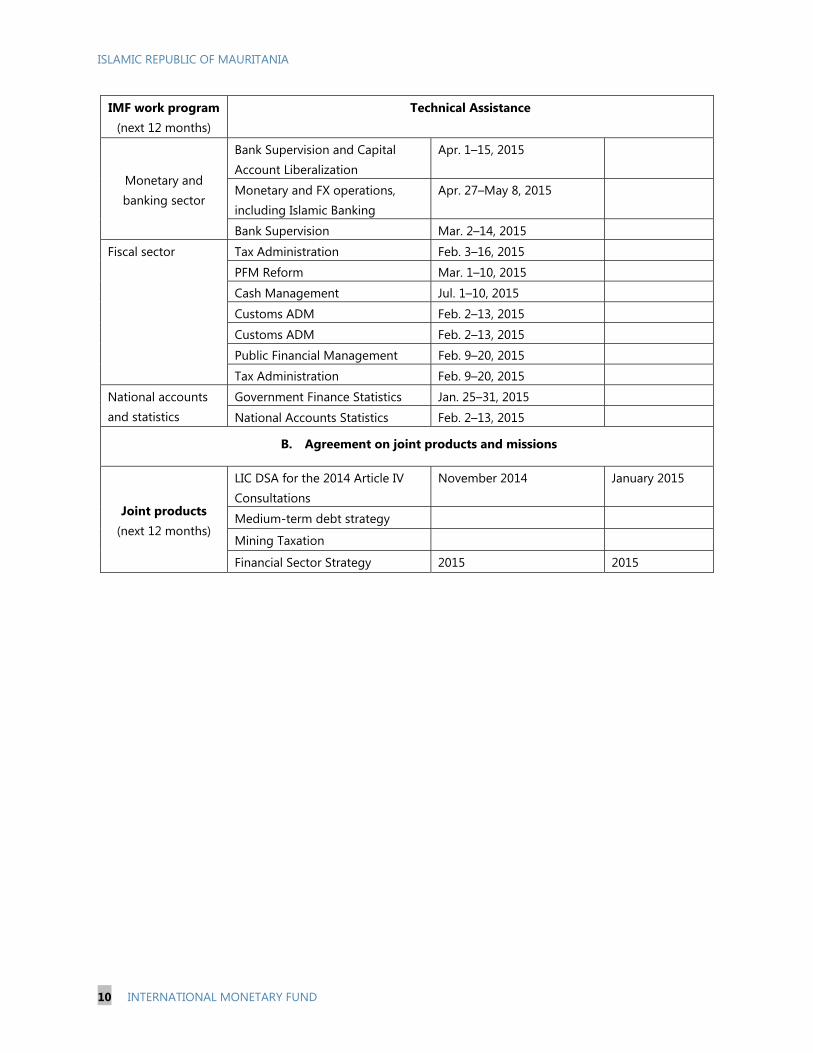
ISLAMIC REPUBLIC OF MAURITANIA
10 INTERNATIONAL MONETARY FUND
IMF work program (next 12 months)
Technical Assistance
Monetary and banking sector
Bank Supervision and Capital Account Liberalization
Apr. 1–15, 2015
Monetary and FX operations, including Islamic Banking
Apr. 27–May 8, 2015
Bank Supervision Mar. 2–14, 2015
Fiscal sector Tax Administration Feb. 3–16, 2015
PFM Reform Mar. 1–10, 2015
Cash Management Jul. 1–10, 2015
Customs ADM Feb. 2–13, 2015
Customs ADM Feb. 2–13, 2015
Public Financial Management Feb. 9–20, 2015
Tax Administration Feb. 9–20, 2015
National accounts and statistics
Government Finance Statistics Jan. 25–31, 2015
National Accounts Statistics Feb. 2–13, 2015
B. Agreement on joint products and missions
Joint products (next 12 months)
LIC DSA for the 2014 Article IV Consultations
November 2014 January 2015
Medium-term debt strategy
Mining Taxation
Financial Sector Strategy 2015 2015
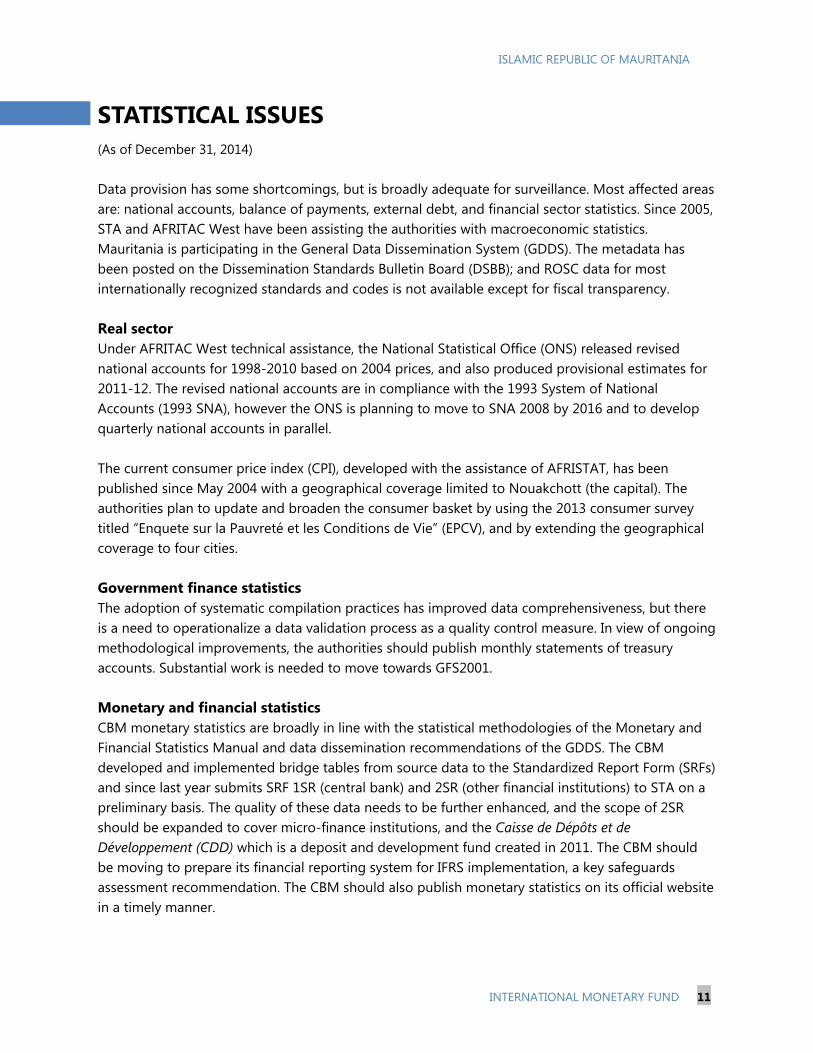
ISLAMIC REPUBLIC OF MAURITANIA
INTERNATIONAL MONETARY FUND 11
STATISTICAL ISSUES (As of December 31, 2014) Data provision has some shortcomings, but is broadly adequate for surveillance. Most affected areas are: national accounts, balance of payments, external debt, and financial sector statistics. Since 2005, STA and AFRITAC West have been assisting the authorities with macroeconomic statistics. Mauritania is participating in the General Data Dissemination System (GDDS). The metadata has been posted on the Dissemination Standards Bulletin Board (DSBB); and ROSC data for most internationally recognized standards and codes is not available except for fiscal transparency. Real sector Under AFRITAC West technical assistance, the National Statistical Office (ONS) released revised national accounts for 1998-2010 based on 2004 prices, and also produced provisional estimates for 2011-12. The revised national accounts are in compliance with the 1993 System of National Accounts (1993 SNA), however the ONS is planning to move to SNA 2008 by 2016 and to develop quarterly national accounts in parallel. The current consumer price index (CPI), developed with the assistance of AFRISTAT, has been published since May 2004 with a geographical coverage limited to Nouakchott (the capital). The authorities plan to update and broaden the consumer basket by using the 2013 consumer survey titled “Enquete sur la Pauvreté et les Conditions de Vie” (EPCV), and by extending the geographical coverage to four cities. Government finance statistics The adoption of systematic compilation practices has improved data comprehensiveness, but there is a need to operationalize a data validation process as a quality control measure. In view of ongoing methodological improvements, the authorities should publish monthly statements of treasury accounts. Substantial work is needed to move towards GFS2001. Monetary and financial statistics CBM monetary statistics are broadly in line with the statistical methodologies of the Monetary and Financial Statistics Manual and data dissemination recommendations of the GDDS. The CBM developed and implemented bridge tables from source data to the Standardized Report Form (SRFs) and since last year submits SRF 1SR (central bank) and 2SR (other financial institutions) to STA on a preliminary basis. The quality of these data needs to be further enhanced, and the scope of 2SR should be expanded to cover micro-finance institutions, and the Caisse de Dépôts et de Développement (CDD) which is a deposit and development fund created in 2011. The CBM should be moving to prepare its financial reporting system for IFRS implementation, a key safeguards assessment recommendation. The CBM should also publish monetary statistics on its official website in a timely manner.
ISLAMIC REPUBLIC OF MAURITANIA
12 INTERNATIONAL MONETARY FUND
Balance of payments Balance of payments statistics are affected by significant shortcomings, as many components are routinely based on estimates, and there are no systematic efforts to collect data on certain types of transfers, foreign direct investment, or tourism receipts. In addition non mining exports, services and short-term capital flows are not well measured. Similarly, under-reporting of external transactions by commercial banks is problematic. No balance of payments statistics are reported to STA. An April 2011 STA TA mission provided recommendations, which, if implemented by the authorities, would significantly address identified shortcomings.

ISLAMIC REPUBLIC OF MAURITANIA
INTERNATIONAL MONETARY FUND 13
Mauritania: Common Indicators Required for Surveillance (As of December 2014)
Date of latest observation
Date received
Frequency of
Data6
Frequency of
Reporting 6
Frequency of
publication6
Exchange Rates Dec. 2014 Jan. 2015 D D D
International Reserve Assets and Reserve Liabilities of the Monetary Authorities1 Sep. 2014 Oct. 2014 M M NA
Reserve/Base Money Oct. 2014 Dec. 2014 M M NA
Broad Money Oct. 2014 Dec. 2014 M M NA
Central Bank Balance Sheet Mar. 2014 Jun. 2014 Q Q NA
Consolidated Balance Sheet of the Banking System
Mar. 2014 Jun. 2014 Q Q NA
Interest Rates2 Oct. 2014 Oct. 2014 I I I
Consumer Price Index Nov. 2014 Dec. 2014 M M M
Revenue, Expenditure, Balance and Composition of Financing3 – General Government4
NA NA NA NA NA
Revenue, Expenditure, Balance and Composition of Financing3– Central Government
Oct. 2014 Dec. 2014 M M I
Stocks of Central Government and Central Government-Guaranteed Debt5 Oct. 2014 Dec. 2014 M M I
External Current Balance Jun. 2014 Oct. 2014 Q Q I
Exports and Imports of Goods and Services
Jun. 2014 Oct. 2014 Q Q I
GDP/GNP 20137 Oct. 2014 A A I
Gross External Debt Oct. 2014 Dec. 2014 M M I
1Includes reserve assets pledged or otherwise encumbered as well as net derivative positions. 2 Both market-based and officially-determined, including discount rates, money market rates, rates on treasury bills, notes and bonds. 3 Foreign, domestic bank, and domestic nonbank financing. 4 The general government consists of the central government (budgetary funds, extra budgetary funds, and social security funds) and state and local governments. 5 Including currency and maturity composition. 6 Daily (D), Weekly (W), Monthly (M), Quarterly (Q), Annually (A), Irregular (I), Not Available (NA). 7 Preliminary.
ISLAMIC REPUBLIC OF MAURITANIA STAFF REPORT FOR THE 2014 ARTICLE IV CONSULTATION—DEBT SUSTAINABILITY ANALYSIS
Mauritania’s risk of debt distress is rated high due to a breach of the debt-to-GDP ratio threshold under the baseline scenario. This represents a downgrade from the moderate risk of debt distress at the time of the 2012 Debt Sustainability Analysis. The downgrade is mostly due to a combination of higher projected debt disbursements and a more stringent level of the policy-dependent debt thresholds as measured by the World Bank CPIA score. The expected resolution of bilateral debt relief with Kuwait and a hike in export-led growth are projected to lower Mauritania’s debt level and enhance the capacity of carrying debt over the next years; however, strengthening the quality of policies and institutions—and particularly debt management capacity—will prove critical to rapidly revert to a moderate risk of debt distress. Overall, external debt dynamics tend to follow public debt dynamics, while private sector debt represents a modest portion of external debt.
Approved By Daniela Gressani and Dhaneshwar Ghura (IMF) and John Panzer (IDA)
Prepared by the staffs of the International Monetary Fund and the International Development Association
January 14, 2014

ISLAMIC REPUBLIC OF MAURITANIA
2 INTERNATIONAL MONETARY FUND
INTRODUCTION
Risk of external debt distress: High
Augmented by significant risks stemming from domestic public and/or private external debt?
No
BACKGROUND 1. Debt level remains elevated and mostly represented by public and publicly guaranteed (PPG) debt. Private sector’s access to finance remains limited. Public debt is mostly of an external nature, in the form of official lending with multilateral or bilateral institutions at concessional terms. Debt peaked during 2012 as the central government put in place large investment projects to address Mauritania’s infrastructure gap. The public and publicly guaranteed (PPG) debt includes the debt of the central government, central bank and few state-owned enterprises (SOEs); and it is mainly constituted of external debt as the domestic debt is small. The non-publicly guaranteed external debt includes the state-owned mining company SNIM (which does not need government guarantees) and commercial banks’ debt. In 2012, the PPG external debt rose 7 percentage GDP points to 73½ percent of GDP (2012) due to higher external debt disbursements for the central government financing of large infrastructure projects and it is projected to decline to about 52 percent of GDP over the medium term. The non-publicly guaranteed external debt, at 17 percent of GDP in 2013, has recently increased as SNIM has borrowed externally to finance its mining expansion plans.
2. Mauritania’s debt structure remains broadly sound. Despite its high level, Mauritania’s debt structure remains solid. Debt is contracted with bilateral and multilateral institutions, a stable creditor base, and mostly at concessional terms. Multilateral and bilateral creditors account for 42 and 46 percent of total debt, respectively. Mauritania’s exposure to regional Arab lenders, with about 60 percent of the total debt portfolio, could make it vulnerable to a change in their lending policies. Its debt structure includes very limited guaranteed borrowing by SOEs and debt is contracted on fixed terms, with long maturities. Sources of risks in the debt structure relate to foreign currency exposure due to the size of the external debt, as 95 percent of its debt stock is denominated in foreign currency (mainly US dollar, Kuwaiti Dinar, and SDR). Domestic debt remains small (about 5 percent of stock) and consists of treasury bills for budgetary and liquidity management purposes. It is, nevertheless, issued at short maturity (up to six months) with some limited rollover risks. The debt service profile remains stable and relatively benign, but a term-of trade shock could hamper Mauritania’s ability to servicing its external debt.
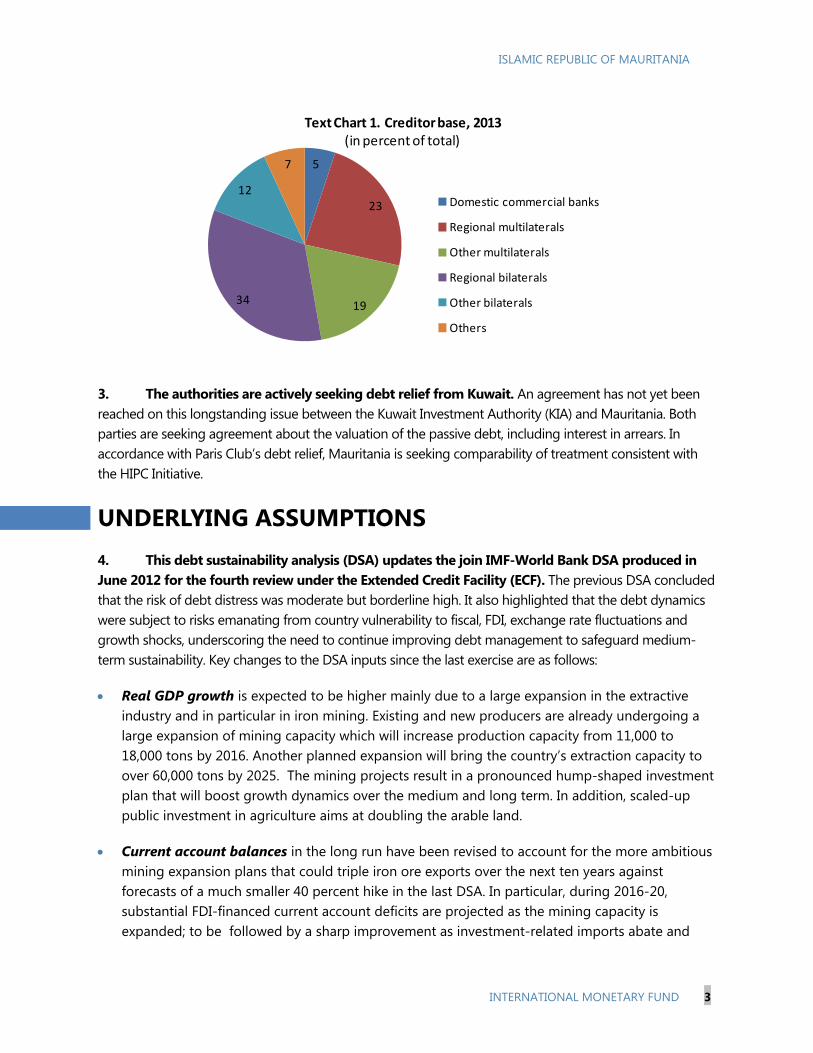
ISLAMIC REPUBLIC OF MAURITANIA
INTERNATIONAL MONETARY FUND 3
3. The authorities are actively seeking debt relief from Kuwait. An agreement has not yet been reached on this longstanding issue between the Kuwait Investment Authority (KIA) and Mauritania. Both parties are seeking agreement about the valuation of the passive debt, including interest in arrears. In accordance with Paris Club’s debt relief, Mauritania is seeking comparability of treatment consistent with the HIPC Initiative.
UNDERLYING ASSUMPTIONS 4. This debt sustainability analysis (DSA) updates the join IMF-World Bank DSA produced in June 2012 for the fourth review under the Extended Credit Facility (ECF). The previous DSA concluded that the risk of debt distress was moderate but borderline high. It also highlighted that the debt dynamics were subject to risks emanating from country vulnerability to fiscal, FDI, exchange rate fluctuations and growth shocks, underscoring the need to continue improving debt management to safeguard medium-term sustainability. Key changes to the DSA inputs since the last exercise are as follows:
Real GDP growth is expected to be higher mainly due to a large expansion in the extractive industry and in particular in iron mining. Existing and new producers are already undergoing a large expansion of mining capacity which will increase production capacity from 11,000 to 18,000 tons by 2016. Another planned expansion will bring the country’s extraction capacity to over 60,000 tons by 2025. The mining projects result in a pronounced hump-shaped investment plan that will boost growth dynamics over the medium and long term. In addition, scaled-up public investment in agriculture aims at doubling the arable land.
Current account balances in the long run have been revised to account for the more ambitious mining expansion plans that could triple iron ore exports over the next ten years against forecasts of a much smaller 40 percent hike in the last DSA. In particular, during 2016-20, substantial FDI-financed current account deficits are projected as the mining capacity is expanded; to be followed by a sharp improvement as investment-related imports abate and
5
23
1934
12
7
Text Chart 1. Creditor base, 2013(in percent of total)
Domestic commercial banks
Regional multilaterals
Other multilaterals
Regional bilaterals
Other bilaterals
Others
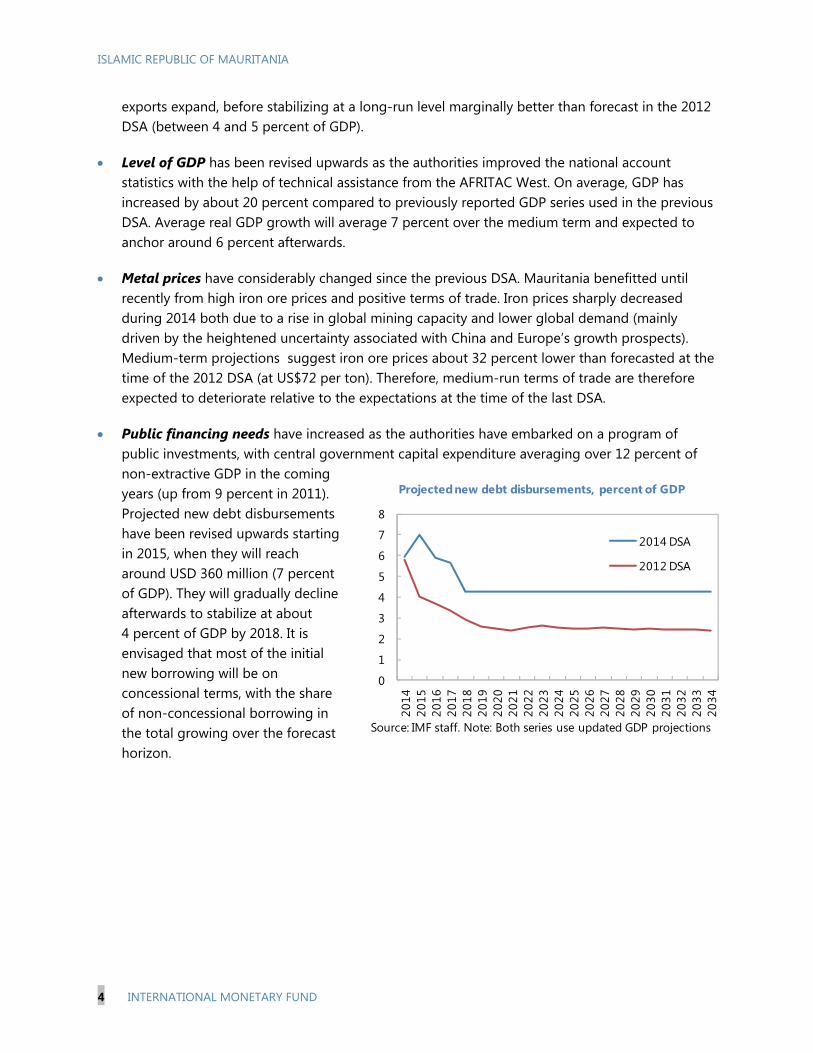
ISLAMIC REPUBLIC OF MAURITANIA
4 INTERNATIONAL MONETARY FUND
exports expand, before stabilizing at a long-run level marginally better than forecast in the 2012 DSA (between 4 and 5 percent of GDP).
Level of GDP has been revised upwards as the authorities improved the national account statistics with the help of technical assistance from the AFRITAC West. On average, GDP has increased by about 20 percent compared to previously reported GDP series used in the previous DSA. Average real GDP growth will average 7 percent over the medium term and expected to anchor around 6 percent afterwards.
Metal prices have considerably changed since the previous DSA. Mauritania benefitted until recently from high iron ore prices and positive terms of trade. Iron prices sharply decreased during 2014 both due to a rise in global mining capacity and lower global demand (mainly driven by the heightened uncertainty associated with China and Europe’s growth prospects). Medium-term projections suggest iron ore prices about 32 percent lower than forecasted at the time of the 2012 DSA (at US$72 per ton). Therefore, medium-run terms of trade are therefore expected to deteriorate relative to the expectations at the time of the last DSA.
Public financing needs have increased as the authorities have embarked on a program of public investments, with central government capital expenditure averaging over 12 percent of non-extractive GDP in the coming years (up from 9 percent in 2011). Projected new debt disbursements have been revised upwards starting in 2015, when they will reach around USD 360 million (7 percent of GDP). They will gradually decline afterwards to stabilize at about 4 percent of GDP by 2018. It is envisaged that most of the initial new borrowing will be on concessional terms, with the share of non-concessional borrowing in the total growing over the forecast horizon.
0
1
2
3
4
5
6
7
8
2014
2015
2016
2017
2018
2019
2020
2021
2022
2023
2024
2025
2026
2027
2028
2029
2030
2031
2032
2033
2034
2014 DSA
2012 DSA
Projected new debt disbursements, percent of GDP
Source: IMF staff. Note: Both series use updated GDP projections
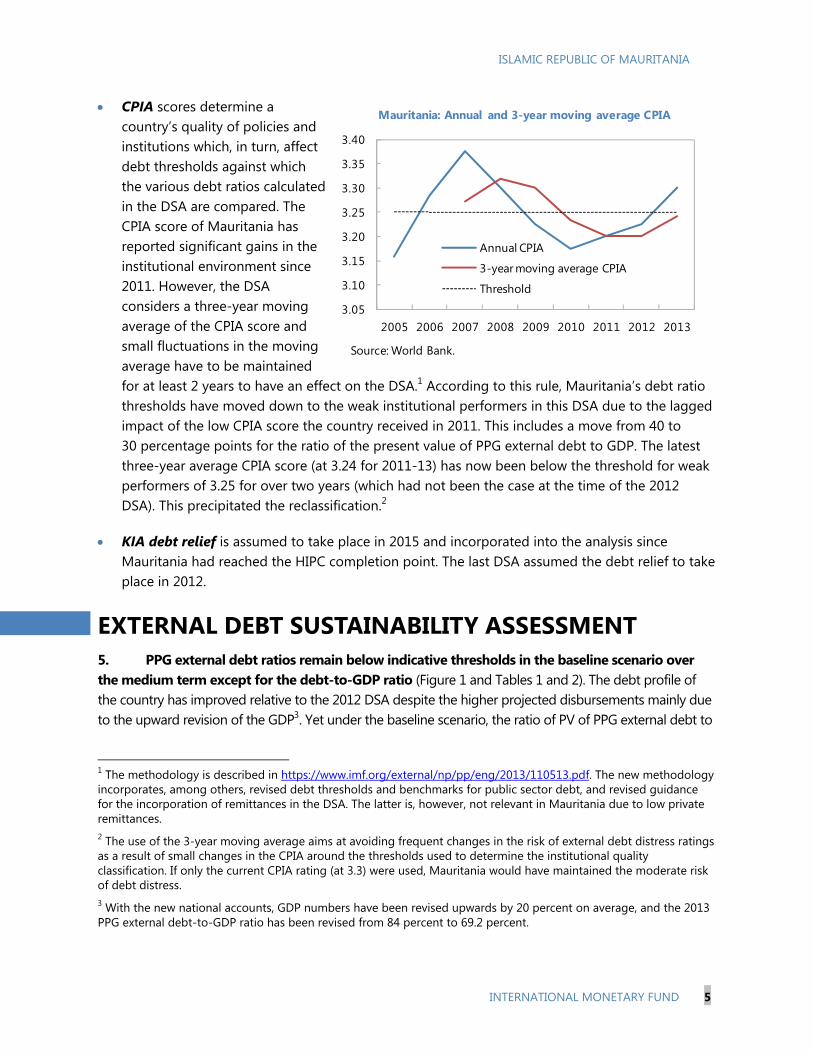
ISLAMIC REPUBLIC OF MAURITANIA
INTERNATIONAL MONETARY FUND 5
CPIA scores determine a country’s quality of policies and institutions which, in turn, affect debt thresholds against which the various debt ratios calculated in the DSA are compared. The CPIA score of Mauritania has reported significant gains in the institutional environment since 2011. However, the DSA considers a three-year moving average of the CPIA score and small fluctuations in the moving average have to be maintained for at least 2 years to have an effect on the DSA.1 According to this rule, Mauritania’s debt ratio thresholds have moved down to the weak institutional performers in this DSA due to the lagged impact of the low CPIA score the country received in 2011. This includes a move from 40 to 30 percentage points for the ratio of the present value of PPG external debt to GDP. The latest three-year average CPIA score (at 3.24 for 2011-13) has now been below the threshold for weak performers of 3.25 for over two years (which had not been the case at the time of the 2012 DSA). This precipitated the reclassification.2
KIA debt relief is assumed to take place in 2015 and incorporated into the analysis since Mauritania had reached the HIPC completion point. The last DSA assumed the debt relief to take place in 2012.
EXTERNAL DEBT SUSTAINABILITY ASSESSMENT 5. PPG external debt ratios remain below indicative thresholds in the baseline scenario over the medium term except for the debt-to-GDP ratio (Figure 1 and Tables 1 and 2). The debt profile of the country has improved relative to the 2012 DSA despite the higher projected disbursements mainly due to the upward revision of the GDP3. Yet under the baseline scenario, the ratio of PV of PPG external debt to
1 The methodology is described in https://www.imf.org/external/np/pp/eng/2013/110513.pdf. The new methodology incorporates, among others, revised debt thresholds and benchmarks for public sector debt, and revised guidance for the incorporation of remittances in the DSA. The latter is, however, not relevant in Mauritania due to low private remittances. 2 The use of the 3-year moving average aims at avoiding frequent changes in the risk of external debt distress ratings as a result of small changes in the CPIA around the thresholds used to determine the institutional quality classification. If only the current CPIA rating (at 3.3) were used, Mauritania would have maintained the moderate risk of debt distress. 3 With the new national accounts, GDP numbers have been revised upwards by 20 percent on average, and the 2013 PPG external debt-to-GDP ratio has been revised from 84 percent to 69.2 percent.
3.05
3.10
3.15
3.20
3.25
3.30
3.35
3.40
2005 2006 2007 2008 2009 2010 2011 2012 2013
Annual CPIA
3-year moving average CPIA
Threshold
Mauritania: Annual and 3-year moving average CPIA
Source: World Bank.
ISLAMIC REPUBLIC OF MAURITANIA
6 INTERNATIONAL MONETARY FUND
GDP breaches its threshold through 2025 because this threshold has been lowered to 30 percent from 40 percent due to the reclassification of the country’s institutional quality. The ratio will reach slightly over 39 percent in 2015-16 (after a decline due to the assumed KIA debt relief) and then decline slowly to stabilize at around 35 percent. The decrease over time is driven by the pick-up in exports which will translate into both stronger growth and fiscal revenues. The breach of the relevant threshold by the ratio of PV of PPG external debt to GDP is, at over 9 percentage points in 2015, somewhat larger but much more sustained than the breach of the threshold for the same ratio in the 2012 DSA.
6. Standardized stress tests lead to breaches of three debt ratio thresholds and point to the vulnerability of projected debt reduction to both domestic and external factors. A currency devaluation and failure to secure the projected non-debt creating flows would be particularly damaging to the ratios, even though the latter would probably be partially offset by lower imports.
7. The historical scenario produces unrealistically large swings in the level of projected external debt. This result is driven by the large discrepancy between changes in external debt and identified net debt-creating flows in the baseline scenario. This scenario involves a substantial change in the current account balance from a large FDI-financed deficit while the mining capacity is being expanded in the short run to a much diminished one once mining exports have increased. A large portion of the projected current account deficits in the short run will be financed by SNIM and a substantial share of the improvement in current account balances in the medium run will accrue to SNIM. The former will not raise the PPG external debt and the latter will not be necessarily used to rapidly decrease the external indebtedness of the sovereign. The large residuals in the analysis arise from the fact that a large share of SNIM’s project financing as well as use of the resulting higher export proceeds is unlikely to fall under the identified net debt-creating flow categories, which include non-interest current account balance.
8. The outlook for overall external debt has worsened in absolute terms compared to the last DSA. This can be attributed to the public external borrowing disbursements planned for infrastructure projects as well as increased borrowing from SNIM—whose significant debt-financed expansion plans could further raise external debt vulnerabilities. In addition, the 2012 DSA assumed that the now-delayed KIA debt relief would have been completed by this point.
PUBLIC DEBT SUSTAINABILITY ASSESSMENT 9. Indicators of overall public debt (external and domestic) and debt service mirrors the vulnerabilities associated with the external debt. The total public debt mildly breaches its indicative benchmark after the assumed KIA debt relief even though the breach steadily declines over the forecast horizon. The stress scenarios show that this projection is particularly vulnerable to currency depreciation and depends on the materialization of the expected export-led growth.
10. Overall public debt is largely comprised of PPG external debt. Almost 90 percent of total public debt in Mauritania is PPG external debt. Domestic public debt has hovered around 5 to 7 percent of GDP and is not a significant contributing factor to the overall public debt level.

ISLAMIC REPUBLIC OF MAURITANIA
INTERNATIONAL MONETARY FUND 7
CONCLUSION 11. Mauritania’s risk of external debt distress has increased due to a combination of the reclassification of its institutional capacity and higher projected new debt disbursements. The new institutional capacity classification has resulted in lowering of Mauritania’s debt thresholds, including from 40 to 30 percentage points for the ratio of the present value of PPG external debt to GDP. As a result of a baseline breach due to a lower threshold, the risk of debt distress has increased from moderate to high. In addition, the projected disbursement path in the coming years will increase PPG external debt level. The projected KIA debt relief will not, in itself, resolve breaching the threshold for the ratio of PV of PPG external debt to GDP. In the medium term, increased exports and the resulting output growth should decrease the country’s debt burden. The outlook would worsen substantially should the projected increases in exports and the subsequent higher growth and improvements in current account balances not materialize, in particular due to delays to or cancellations of mining capacity expansion plans.
12. Given the challenges of reducing debt rapidly, Mauritania needs to continue improving its institutional environment to quickly return to a moderate risk of debt distress. An anticipated debt relief and a hike in export-led growth are projected to lower Mauritania’s debt level and enhance the capacity of carrying debt over the next years; but debt management capacity needs to be strengthened. Given that under the baseline a breach of a threshold occurs for the duration of the projection period, Mauritania could gain substantially from a stronger institutional environment to increase the debt tolerance level. Within the categories of institutions considered by the CPIA score, Mauritania has largest scope for improvement in debt policy, financial sector, social protection and transparency in the public sector. The country should therefore, among other measures, redouble its efforts to implement a social protection framework that would help the socially vulnerable. Elsewhere, following the recommendation of the recent FSAP exercise should aid Mauritania in improving its financial sector institutions.
13. Recent technical assistance from AFRITAC-West provides recommendations to improve debt management practices which both bear on the overall CPIA score and is directly linked to Mauritania’s debt management capacity. The technical assistance mission assessed that debt management in Mauritania is fragmented and the relevant operational responsibilities are shared and duplicated. The authorities should therefore reorganize the functions of the various departments of the Ministry of Economic Affairs and Development, Ministry of Finance and the Central Bank that participate in debt management to increase the efficiency and coordination in debt contraction and management.
14. The authorities do not agree with the reclassification of the country’s quality of policies and institutions into the weak category as a function of the past CPIA scores, which has a direct bearing on the change in the country’s risk of external debt distress from medium to high. In particular, they believe the methodology in the joint Bank-Fund Debt Sustainability Framework for low-income countries places too much weight in its assessment of institutional quality on the past and too little on the present. The country’s institutional quality is being downgraded at a point in time when the CPIA has both been increasing for 3 consecutive years and has risen above the 3.25 minimum level required for medium quality of institutions. This means that the risk of the external debt distress is being increased while the actual institutional quality is improving and the macroeconomic environment remained stable.
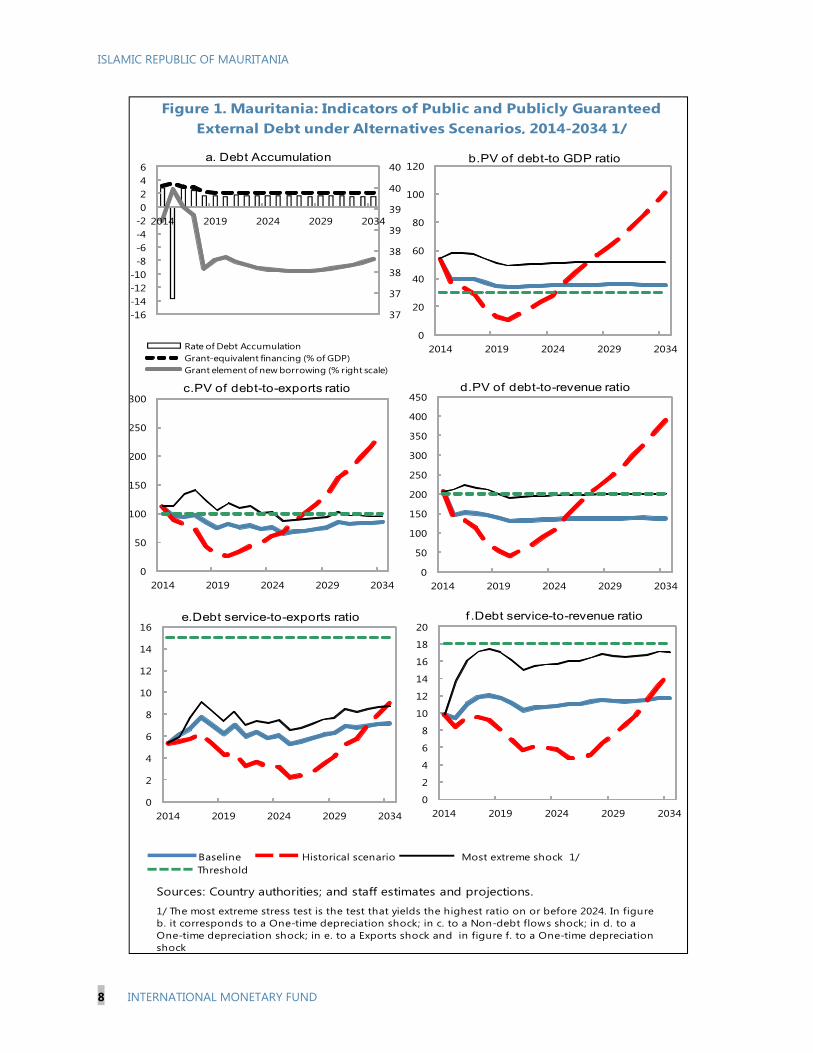
ISLAMIC REPUBLIC OF MAURITANIA
8 INTERNATIONAL MONETARY FUND
Sources: Country authorities; and staff estimates and projections.
Figure 1. Mauritania: Indicators of Public and Publicly Guaranteed External Debt under Alternatives Scenarios, 2014-2034 1/
1/ The most extreme stress test is the test that yields the highest ratio on or before 2024. In figure b. it corresponds to a One-time depreciation shock; in c. to a Non-debt flows shock; in d. to a One-time depreciation shock; in e. to a Exports shock and in figure f. to a One-time depreciation shock
Baseline Historical scenario Most extreme shock 1/ Threshold
0
2
4
6
8
10
12
14
16
18
20
2014 2019 2024 2029 2034
f .Debt service-to-revenue ratio
37
37
38
38
39
39
40
40
-16-14-12-10-8-6-4-20246
2014 2019 2024 2029 2034
Rate of Debt AccumulationGrant-equivalent financing (% of GDP)Grant element of new borrowing (% right scale)
a. Debt Accumulation
0
50
100
150
200
250
300
2014 2019 2024 2029 2034
c.PV of debt-to-exports ratio
0
20
40
60
80
100
120
2014 2019 2024 2029 2034
b.PV of debt-to GDP ratio
0
50
100
150
200
250
300
350
400
450
2014 2019 2024 2029 2034
d.PV of debt-to-revenue ratio
0
2
4
6
8
10
12
14
16
2014 2019 2024 2029 2034
e.Debt service-to-exports ratio
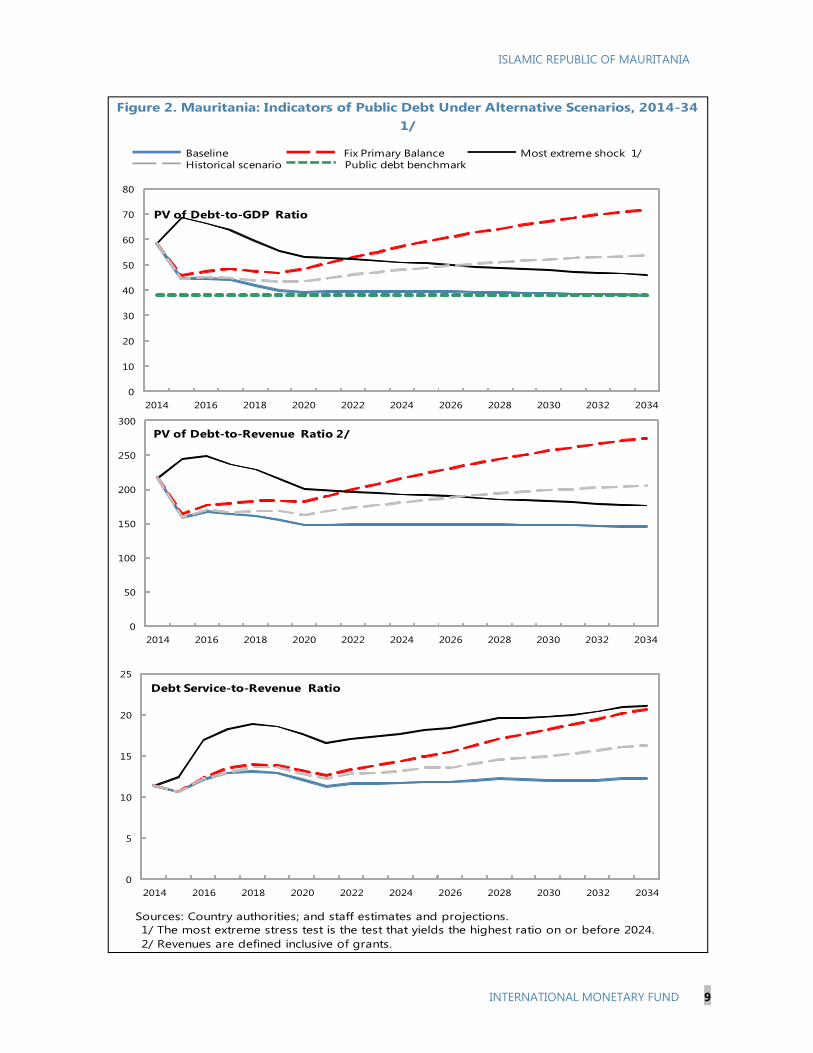
ISLAMIC REPUBLIC OF MAURITANIA
INTERNATIONAL MONETARY FUND 9
Sources: Country authorities; and staff estimates and projections.1/ The most extreme stress test is the test that yields the highest ratio on or before 2024. 2/ Revenues are defined inclusive of grants.
Figure 2. Mauritania: Indicators of Public Debt Under Alternative Scenarios, 2014-34 1/
BaselinePublic debt benchmark
Most extreme shock 1/Historical scenario
Fix Primary Balance
0
50
100
150
200
250
300
2014 2016 2018 2020 2022 2024 2026 2028 2030 2032 2034
PV of Debt-to-Revenue Ratio 2/
0
10
20
30
40
50
60
70
80
2014 2016 2018 2020 2022 2024 2026 2028 2030 2032 2034
PV of Debt-to-GDP Ratio
0
5
10
15
20
25
2014 2016 2018 2020 2022 2024 2026 2028 2030 2032 2034
Debt Service-to-Revenue Ratio
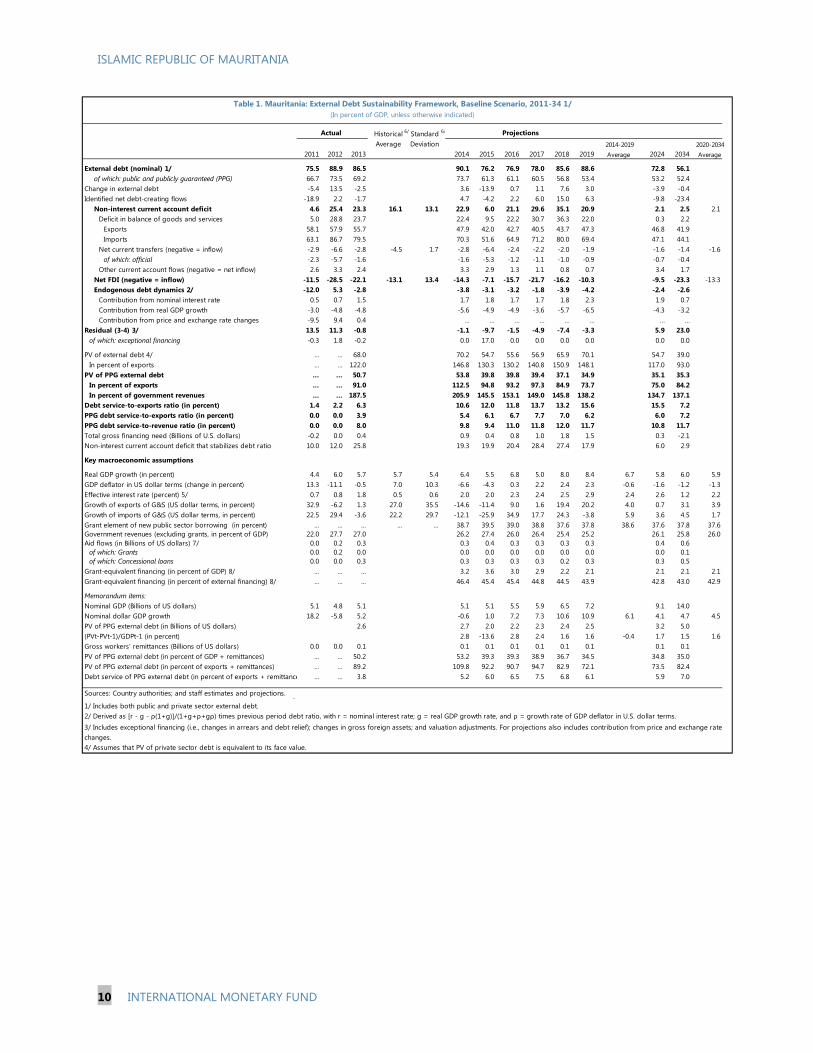
ISLAMIC REPUBLIC OF MAURITANIA
10 INTERNATIONAL MONETARY FUND
Historical 6/ Standard 6/
Average Deviation 2014-2019 2020-20342011 2012 2013 2014 2015 2016 2017 2018 2019 Average 2024 2034 Average
External debt (nominal) 1/ 75.5 88.9 86.5 90.1 76.2 76.9 78.0 85.6 88.6 72.8 56.1of which: public and publicly guaranteed (PPG) 66.7 73.5 69.2 73.7 61.3 61.1 60.5 56.8 53.4 53.2 52.4
Change in external debt -5.4 13.5 -2.5 3.6 -13.9 0.7 1.1 7.6 3.0 -3.9 -0.4Identified net debt-creating flows -18.9 2.2 -1.7 4.7 -4.2 2.2 6.0 15.0 6.3 -9.8 -23.4
Non-interest current account deficit 4.6 25.4 23.3 16.1 13.1 22.9 6.0 21.1 29.6 35.1 20.9 2.1 2.5 2.1Deficit in balance of goods and services 5.0 28.8 23.7 22.4 9.5 22.2 30.7 36.3 22.0 0.3 2.2
Exports 58.1 57.9 55.7 47.9 42.0 42.7 40.5 43.7 47.3 46.8 41.9Imports 63.1 86.7 79.5 70.3 51.6 64.9 71.2 80.0 69.4 47.1 44.1
Net current transfers (negative = inflow) -2.9 -6.6 -2.8 -4.5 1.7 -2.8 -6.4 -2.4 -2.2 -2.0 -1.9 -1.6 -1.4 -1.6of which: official -2.3 -5.7 -1.6 -1.6 -5.3 -1.2 -1.1 -1.0 -0.9 -0.7 -0.4
Other current account flows (negative = net inflow) 2.6 3.3 2.4 3.3 2.9 1.3 1.1 0.8 0.7 3.4 1.7Net FDI (negative = inflow) -11.5 -28.5 -22.1 -13.1 13.4 -14.3 -7.1 -15.7 -21.7 -16.2 -10.3 -9.5 -23.3 -13.3Endogenous debt dynamics 2/ -12.0 5.3 -2.8 -3.8 -3.1 -3.2 -1.8 -3.9 -4.2 -2.4 -2.6
Contribution from nominal interest rate 0.5 0.7 1.5 1.7 1.8 1.7 1.7 1.8 2.3 1.9 0.7Contribution from real GDP growth -3.0 -4.8 -4.8 -5.6 -4.9 -4.9 -3.6 -5.7 -6.5 -4.3 -3.2Contribution from price and exchange rate changes -9.5 9.4 0.4 … … … … … … … …
Residual (3-4) 3/ 13.5 11.3 -0.8 -1.1 -9.7 -1.5 -4.9 -7.4 -3.3 5.9 23.0of which: exceptional financing -0.3 1.8 -0.2 0.0 17.0 0.0 0.0 0.0 0.0 0.0 0.0
PV of external debt 4/ ... ... 68.0 70.2 54.7 55.6 56.9 65.9 70.1 54.7 39.0In percent of exports ... ... 122.0 146.8 130.3 130.2 140.8 150.9 148.1 117.0 93.0
PV of PPG external debt ... ... 50.7 53.8 39.8 39.8 39.4 37.1 34.9 35.1 35.3In percent of exports ... ... 91.0 112.5 94.8 93.2 97.3 84.9 73.7 75.0 84.2In percent of government revenues ... ... 187.5 205.9 145.5 153.1 149.0 145.8 138.2 134.7 137.1
Debt service-to-exports ratio (in percent) 1.4 2.2 6.3 10.6 12.0 11.8 13.7 13.2 15.6 15.5 7.2PPG debt service-to-exports ratio (in percent) 0.0 0.0 3.9 5.4 6.1 6.7 7.7 7.0 6.2 6.0 7.2PPG debt service-to-revenue ratio (in percent) 0.0 0.0 8.0 9.8 9.4 11.0 11.8 12.0 11.7 10.8 11.7Total gross financing need (Billions of U.S. dollars) -0.2 0.0 0.4 0.9 0.4 0.8 1.0 1.8 1.5 0.3 -2.1Non-interest current account deficit that stabilizes debt ratio 10.0 12.0 25.8 19.3 19.9 20.4 28.4 27.4 17.9 6.0 2.9
Key macroeconomic assumptions
Real GDP growth (in percent) 4.4 6.0 5.7 5.7 5.4 6.4 5.5 6.8 5.0 8.0 8.4 6.7 5.8 6.0 5.9GDP deflator in US dollar terms (change in percent) 13.3 -11.1 -0.5 7.0 10.3 -6.6 -4.3 0.3 2.2 2.4 2.3 -0.6 -1.6 -1.2 -1.3Effective interest rate (percent) 5/ 0.7 0.8 1.8 0.5 0.6 2.0 2.0 2.3 2.4 2.5 2.9 2.4 2.6 1.2 2.2Growth of exports of G&S (US dollar terms, in percent) 32.9 -6.2 1.3 27.0 35.5 -14.6 -11.4 9.0 1.6 19.4 20.2 4.0 0.7 3.1 3.9Growth of imports of G&S (US dollar terms, in percent) 22.5 29.4 -3.6 22.2 29.7 -12.1 -25.9 34.9 17.7 24.3 -3.8 5.9 3.6 4.5 1.7Grant element of new public sector borrowing (in percent) ... ... ... ... ... 38.7 39.5 39.0 38.8 37.6 37.8 38.6 37.6 37.8 37.6Government revenues (excluding grants, in percent of GDP) 22.0 27.7 27.0 26.2 27.4 26.0 26.4 25.4 25.2 26.1 25.8 26.0Aid flows (in Billions of US dollars) 7/ 0.0 0.2 0.3 0.3 0.4 0.3 0.3 0.3 0.3 0.4 0.6
of which: Grants 0.0 0.2 0.0 0.0 0.0 0.0 0.0 0.0 0.0 0.0 0.1of which: Concessional loans 0.0 0.0 0.3 0.3 0.3 0.3 0.3 0.2 0.3 0.3 0.5
Grant-equivalent financing (in percent of GDP) 8/ ... ... ... 3.2 3.6 3.0 2.9 2.2 2.1 2.1 2.1 2.1Grant-equivalent financing (in percent of external financing) 8/ ... ... ... 46.4 45.4 45.4 44.8 44.5 43.9 42.8 43.0 42.9
Memorandum items:Nominal GDP (Billions of US dollars) 5.1 4.8 5.1 5.1 5.1 5.5 5.9 6.5 7.2 9.1 14.0Nominal dollar GDP growth 18.2 -5.8 5.2 -0.6 1.0 7.2 7.3 10.6 10.9 6.1 4.1 4.7 4.5PV of PPG external debt (in Billions of US dollars) 2.6 2.7 2.0 2.2 2.3 2.4 2.5 3.2 5.0(PVt-PVt-1)/GDPt-1 (in percent) 2.8 -13.6 2.8 2.4 1.6 1.6 -0.4 1.7 1.5 1.6Gross workers' remittances (Billions of US dollars) 0.0 0.0 0.1 0.1 0.1 0.1 0.1 0.1 0.1 0.1 0.1PV of PPG external debt (in percent of GDP + remittances) ... ... 50.2 53.2 39.3 39.3 38.9 36.7 34.5 34.8 35.0PV of PPG external debt (in percent of exports + remittances) ... ... 89.2 109.8 92.2 90.7 94.7 82.9 72.1 73.5 82.4Debt service of PPG external debt (in percent of exports + remittance ... ... 3.8 5.2 6.0 6.5 7.5 6.8 6.1 5.9 7.0
Sources: Country authorities; and staff estimates and projections. 01/ Includes both public and private sector external debt.2/ Derived as [r - g - ρ(1+g)]/(1+g+ρ+gρ) times previous period debt ratio, with r = nominal interest rate; g = real GDP growth rate, and ρ = growth rate of GDP deflator in U.S. dollar terms.
4/ Assumes that PV of private sector debt is equivalent to its face value.
Actual
Table 1. Mauritania: External Debt Sustainability Framework, Baseline Scenario, 2011-34 1/(In percent of GDP, unless otherwise indicated)
Projections
3/ Includes exceptional financing (i.e., changes in arrears and debt relief); changes in gross foreign assets; and valuation adjustments. For projections also includes contribution from price and exchange rate changes.
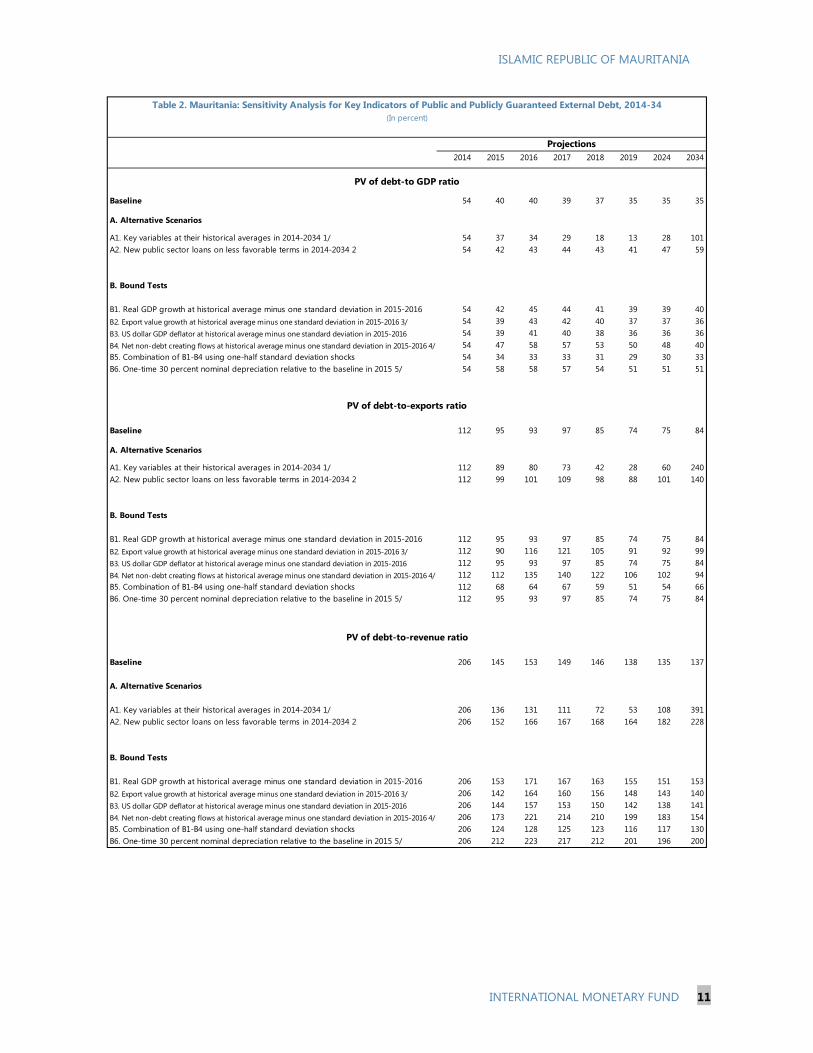
ISLAMIC REPUBLIC OF MAURITANIA
INTERNATIONAL MONETARY FUND 11
2014 2015 2016 2017 2018 2019 2024 2034
Baseline 54 40 40 39 37 35 35 35
A. Alternative Scenarios
A1. Key variables at their historical averages in 2014-2034 1/ 54 37 34 29 18 13 28 101A2. New public sector loans on less favorable terms in 2014-2034 2 54 42 43 44 43 41 47 59
B. Bound Tests
B1. Real GDP growth at historical average minus one standard deviation in 2015-2016 54 42 45 44 41 39 39 40B2. Export value growth at historical average minus one standard deviation in 2015-2016 3/ 54 39 43 42 40 37 37 36B3. US dollar GDP deflator at historical average minus one standard deviation in 2015-2016 54 39 41 40 38 36 36 36B4. Net non-debt creating flows at historical average minus one standard deviation in 2015-2016 4/ 54 47 58 57 53 50 48 40B5. Combination of B1-B4 using one-half standard deviation shocks 54 34 33 33 31 29 30 33B6. One-time 30 percent nominal depreciation relative to the baseline in 2015 5/ 54 58 58 57 54 51 51 51
Baseline 112 95 93 97 85 74 75 84
A. Alternative Scenarios
A1. Key variables at their historical averages in 2014-2034 1/ 112 89 80 73 42 28 60 240A2. New public sector loans on less favorable terms in 2014-2034 2 112 99 101 109 98 88 101 140
B. Bound Tests
B1. Real GDP growth at historical average minus one standard deviation in 2015-2016 112 95 93 97 85 74 75 84B2. Export value growth at historical average minus one standard deviation in 2015-2016 3/ 112 90 116 121 105 91 92 99B3. US dollar GDP deflator at historical average minus one standard deviation in 2015-2016 112 95 93 97 85 74 75 84B4. Net non-debt creating flows at historical average minus one standard deviation in 2015-2016 4/ 112 112 135 140 122 106 102 94B5. Combination of B1-B4 using one-half standard deviation shocks 112 68 64 67 59 51 54 66B6. One-time 30 percent nominal depreciation relative to the baseline in 2015 5/ 112 95 93 97 85 74 75 84
Baseline 206 145 153 149 146 138 135 137
A. Alternative Scenarios
A1. Key variables at their historical averages in 2014-2034 1/ 206 136 131 111 72 53 108 391A2. New public sector loans on less favorable terms in 2014-2034 2 206 152 166 167 168 164 182 228
B. Bound Tests
B1. Real GDP growth at historical average minus one standard deviation in 2015-2016 206 153 171 167 163 155 151 153B2. Export value growth at historical average minus one standard deviation in 2015-2016 3/ 206 142 164 160 156 148 143 140B3. US dollar GDP deflator at historical average minus one standard deviation in 2015-2016 206 144 157 153 150 142 138 141B4. Net non-debt creating flows at historical average minus one standard deviation in 2015-2016 4/ 206 173 221 214 210 199 183 154B5. Combination of B1-B4 using one-half standard deviation shocks 206 124 128 125 123 116 117 130B6. One-time 30 percent nominal depreciation relative to the baseline in 2015 5/ 206 212 223 217 212 201 196 200
PV of debt-to-exports ratio
PV of debt-to-revenue ratio
Table 2. Mauritania: Sensitivity Analysis for Key Indicators of Public and Publicly Guaranteed External Debt, 2014-34(In percent)
PV of debt-to GDP ratio
Projections
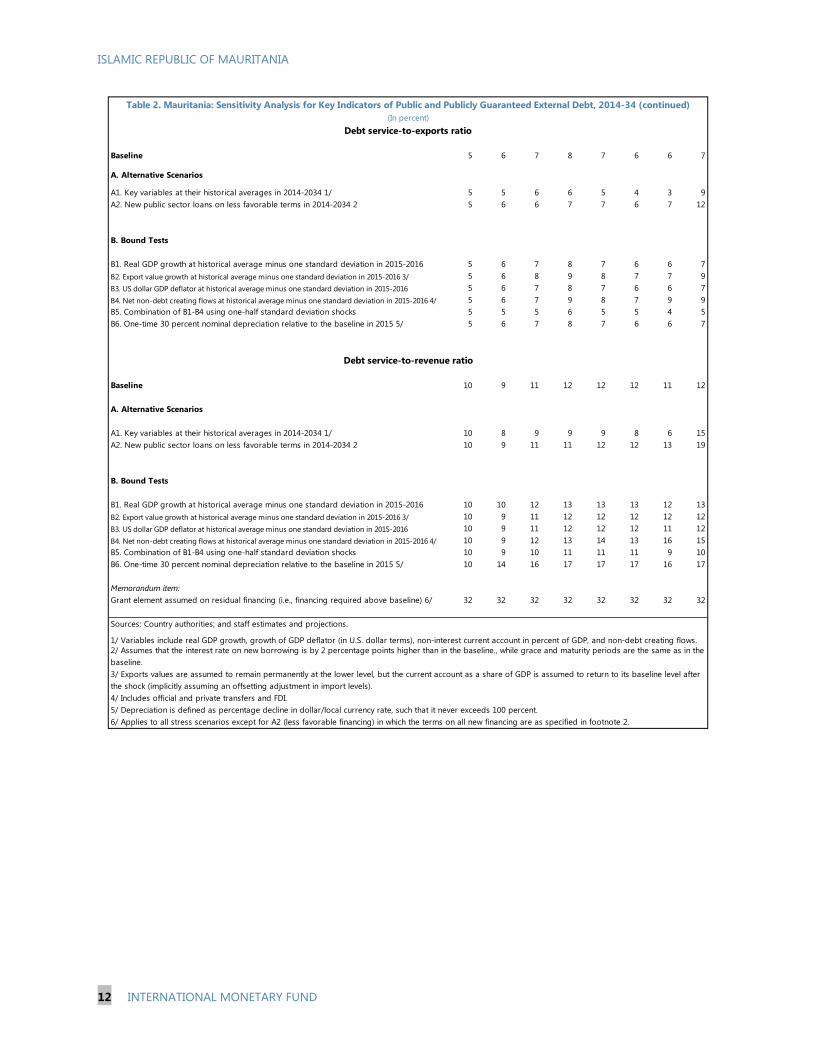
ISLAMIC REPUBLIC OF MAURITANIA
12 INTERNATIONAL MONETARY FUND
Baseline 5 6 7 8 7 6 6 7
A. Alternative Scenarios
A1. Key variables at their historical averages in 2014-2034 1/ 5 5 6 6 5 4 3 9A2. New public sector loans on less favorable terms in 2014-2034 2 5 6 6 7 7 6 7 12
B. Bound Tests
B1. Real GDP growth at historical average minus one standard deviation in 2015-2016 5 6 7 8 7 6 6 7B2. Export value growth at historical average minus one standard deviation in 2015-2016 3/ 5 6 8 9 8 7 7 9B3. US dollar GDP deflator at historical average minus one standard deviation in 2015-2016 5 6 7 8 7 6 6 7B4. Net non-debt creating flows at historical average minus one standard deviation in 2015-2016 4/ 5 6 7 9 8 7 9 9B5. Combination of B1-B4 using one-half standard deviation shocks 5 5 5 6 5 5 4 5B6. One-time 30 percent nominal depreciation relative to the baseline in 2015 5/ 5 6 7 8 7 6 6 7
Baseline 10 9 11 12 12 12 11 12
A. Alternative Scenarios
A1. Key variables at their historical averages in 2014-2034 1/ 10 8 9 9 9 8 6 15A2. New public sector loans on less favorable terms in 2014-2034 2 10 9 11 11 12 12 13 19
B. Bound Tests
B1. Real GDP growth at historical average minus one standard deviation in 2015-2016 10 10 12 13 13 13 12 13B2. Export value growth at historical average minus one standard deviation in 2015-2016 3/ 10 9 11 12 12 12 12 12B3. US dollar GDP deflator at historical average minus one standard deviation in 2015-2016 10 9 11 12 12 12 11 12B4. Net non-debt creating flows at historical average minus one standard deviation in 2015-2016 4/ 10 9 12 13 14 13 16 15B5. Combination of B1-B4 using one-half standard deviation shocks 10 9 10 11 11 11 9 10B6. One-time 30 percent nominal depreciation relative to the baseline in 2015 5/ 10 14 16 17 17 17 16 17
Memorandum item:Grant element assumed on residual financing (i.e., financing required above baseline) 6/ 32 32 32 32 32 32 32 32
Sources: Country authorities; and staff estimates and projections.
1/ Variables include real GDP growth, growth of GDP deflator (in U.S. dollar terms), non-interest current account in percent of GDP, and non-debt creating flows.
4/ Includes official and private transfers and FDI.5/ Depreciation is defined as percentage decline in dollar/local currency rate, such that it never exceeds 100 percent.6/ Applies to all stress scenarios except for A2 (less favorable financing) in which the terms on all new financing are as specified in footnote 2.
2/ Assumes that the interest rate on new borrowing is by 2 percentage points higher than in the baseline., while grace and maturity periods are the same as in the baseline.3/ Exports values are assumed to remain permanently at the lower level, but the current account as a share of GDP is assumed to return to its baseline level after the shock (implicitly assuming an offsetting adjustment in import levels).
Debt service-to-revenue ratio
Debt service-to-exports ratio
Table 2. Mauritania: Sensitivity Analysis for Key Indicators of Public and Publicly Guaranteed External Debt, 2014-34 (continued)(In percent)
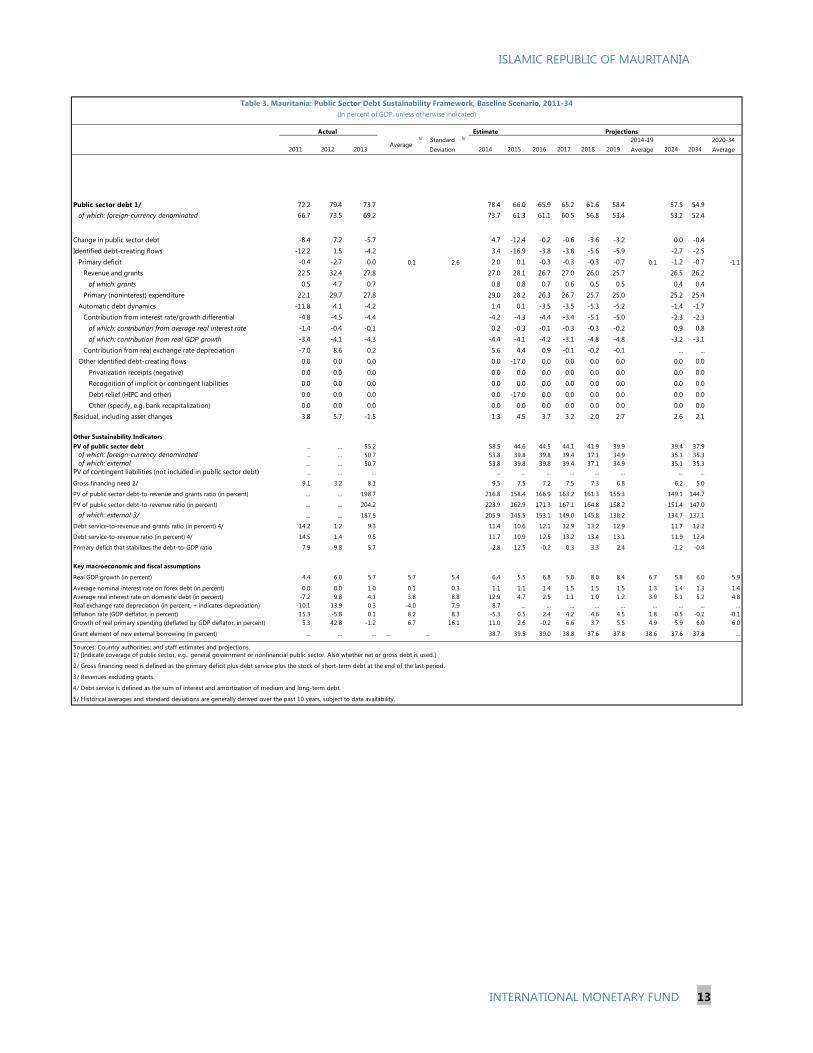
ISLAMIC REPUBLIC OF MAURITANIA
INTERNATIONAL MONETARY FUND 13
Estimate
2011 2012 2013Average
5/ Standard Deviation
5/
2014 2015 2016 2017 2018 20192014-19 Average 2024 2034
2020-34 Average
Public sector debt 1/ 72.2 79.4 73.7 78.4 66.0 65.9 65.2 61.6 58.4 57.5 54.9of which: foreign-currency denominated 66.7 73.5 69.2 73.7 61.3 61.1 60.5 56.8 53.4 53.2 52.4
Change in public sector debt -8.4 7.2 -5.7 4.7 -12.4 -0.2 -0.6 -3.6 -3.2 0.0 -0.4Identified debt-creating flows -12.2 1.5 -4.2 3.4 -16.9 -3.8 -3.8 -5.6 -5.9 -2.7 -2.5
Primary deficit -0.4 -2.7 0.0 0.1 2.6 2.0 0.1 -0.3 -0.3 -0.3 -0.7 0.1 -1.2 -0.7 -1.1
Revenue and grants 22.5 32.4 27.8 27.0 28.1 26.7 27.0 26.0 25.7 26.5 26.2of which: grants 0.5 4.7 0.7 0.8 0.8 0.7 0.6 0.5 0.5 0.4 0.4
Primary (noninterest) expenditure 22.1 29.7 27.8 29.0 28.2 26.3 26.7 25.7 25.0 25.2 25.4Automatic debt dynamics -11.8 4.1 -4.2 1.4 0.1 -3.5 -3.5 -5.3 -5.2 -1.4 -1.7
Contribution from interest rate/growth differential -4.8 -4.5 -4.4 -4.2 -4.3 -4.4 -3.4 -5.1 -5.0 -2.3 -2.3of which: contribution from average real interest rate -1.4 -0.4 -0.1 0.2 -0.3 -0.1 -0.3 -0.3 -0.2 0.9 0.8of which: contribution from real GDP growth -3.4 -4.1 -4.3 -4.4 -4.1 -4.2 -3.1 -4.8 -4.8 -3.2 -3.1
Contribution from real exchange rate depreciation -7.0 8.6 0.2 5.6 4.4 0.9 -0.1 -0.2 -0.1 ... ...Other identified debt-creating flows 0.0 0.0 0.0 0.0 -17.0 0.0 0.0 0.0 0.0 0.0 0.0
Privatization receipts (negative) 0.0 0.0 0.0 0.0 0.0 0.0 0.0 0.0 0.0 0.0 0.0Recognition of implicit or contingent liabilities 0.0 0.0 0.0 0.0 0.0 0.0 0.0 0.0 0.0 0.0 0.0Debt relief (HIPC and other) 0.0 0.0 0.0 0.0 -17.0 0.0 0.0 0.0 0.0 0.0 0.0Other (specify, e.g. bank recapitalization) 0.0 0.0 0.0 0.0 0.0 0.0 0.0 0.0 0.0 0.0 0.0
Residual, including asset changes 3.8 5.7 -1.5 1.3 4.5 3.7 3.2 2.0 2.7 2.6 2.1
Other Sustainability IndicatorsPV of public sector debt ... ... 55.2 58.5 44.6 44.5 44.1 41.9 39.9 39.4 37.9
of which: foreign-currency denominated ... ... 50.7 53.8 39.8 39.8 39.4 37.1 34.9 35.1 35.3of which: external ... ... 50.7 53.8 39.8 39.8 39.4 37.1 34.9 35.1 35.3
PV of contingent liabilities (not included in public sector debt) ... ... ... ... ... ... ... ... ... ... ...
Gross financing need 2/ 9.1 3.2 8.1 9.5 7.5 7.2 7.5 7.3 6.8 6.2 5.0
PV of public sector debt-to-revenue and grants ratio (in percent) … … 198.7 216.8 158.4 166.9 163.2 161.3 155.3 149.1 144.7
PV of public sector debt-to-revenue ratio (in percent) … … 204.2 223.9 162.9 171.3 167.1 164.8 158.2 151.4 147.0
of which: external 3/ … … 187.5 205.9 145.5 153.1 149.0 145.8 138.2 134.7 137.1
Debt service-to-revenue and grants ratio (in percent) 4/ 14.2 1.2 9.3 11.4 10.6 12.1 12.9 13.2 12.9 11.7 12.2
Debt service-to-revenue ratio (in percent) 4/ 14.5 1.4 9.5 11.7 10.9 12.5 13.2 13.4 13.1 11.9 12.4
Primary deficit that stabilizes the debt-to-GDP ratio 7.9 -9.8 5.7 -2.8 12.5 -0.2 0.3 3.3 2.4 -1.2 -0.4
Key macroeconomic and fiscal assumptions
Real GDP growth (in percent) 4.4 6.0 5.7 5.7 5.4 6.4 5.5 6.8 5.0 8.0 8.4 6.7 5.8 6.0 5.9
Average nominal interest rate on forex debt (in percent) 0.0 0.0 1.0 0.1 0.3 1.1 1.1 1.4 1.5 1.5 1.5 1.3 1.4 1.3 1.4Average real interest rate on domestic debt (in percent) -7.2 9.8 4.1 3.8 8.8 12.9 4.7 2.5 1.1 1.0 1.2 3.9 5.1 5.2 4.8Real exchange rate depreciation (in percent, + indicates depreciation) -10.1 13.9 0.3 -4.0 7.9 8.7 ... ... ... ... ... ... ... ... ...Inflation rate (GDP deflator, in percent) 15.3 -5.8 0.1 8.2 8.3 -5.3 0.5 2.4 4.2 4.6 4.5 1.8 -0.5 -0.2 -0.1Growth of real primary spending (deflated by GDP deflator, in percent) 5.3 42.8 -1.2 6.7 16.1 11.0 2.6 -0.2 6.6 3.7 5.5 4.9 5.9 6.0 6.0
Grant element of new external borrowing (in percent) ... ... ... … … 38.7 39.5 39.0 38.8 37.6 37.8 38.6 37.6 37.8 ...
Sources: Country authorities; and staff estimates and projections.1/ [Indicate coverage of public sector, e.g., general government or nonfinancial public sector. Also whether net or gross debt is used.]
2/ Gross financing need is defined as the primary deficit plus debt service plus the stock of short-term debt at the end of the last period.
3/ Revenues excluding grants.
4/ Debt service is defined as the sum of interest and amortization of medium and long-term debt.
5/ Historical averages and standard deviations are generally derived over the past 10 years, subject to data availability.
Table 3. Mauritania: Public Sector Debt Sustainability Framework, Baseline Scenario, 2011-34(In percent of GDP, unless otherwise indicated)
Actual Projections
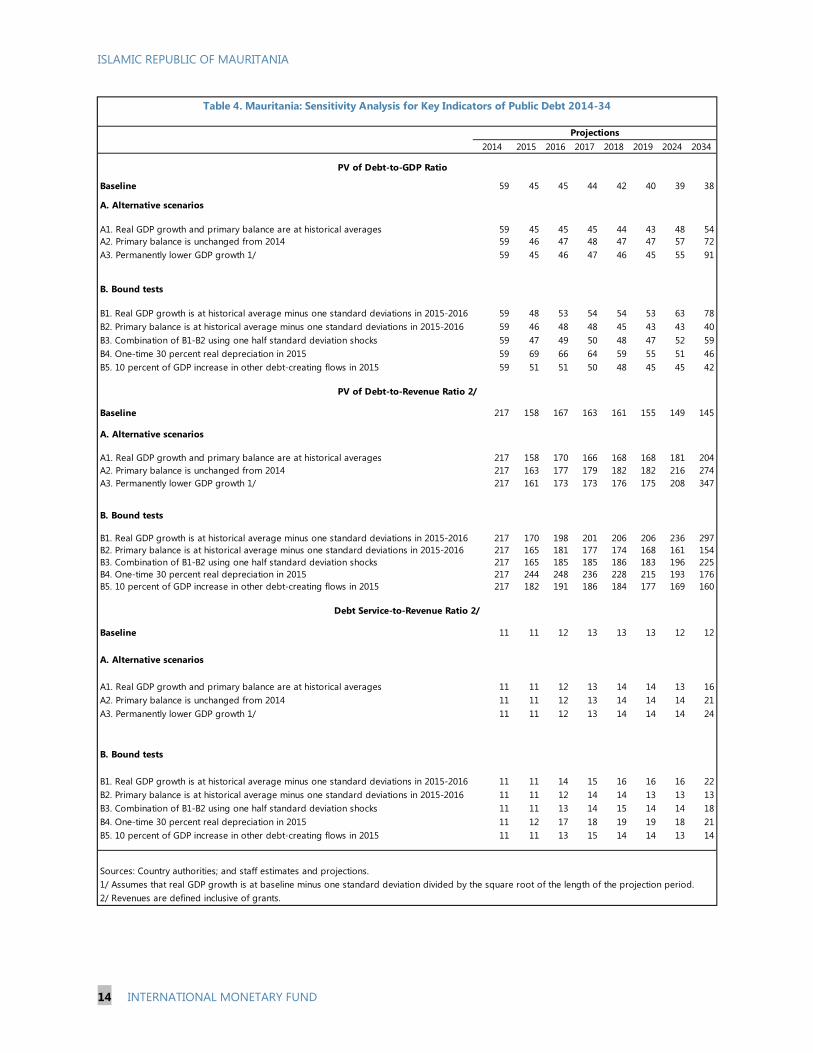
ISLAMIC REPUBLIC OF MAURITANIA
14 INTERNATIONAL MONETARY FUND
Table 4. Mauritania: Sensitivity Analysis for Key Indicators of Public Debt 2014-34
2014 2015 2016 2017 2018 2019 2024 2034
Baseline 59 45 45 44 42 40 39 38
A. Alternative scenarios
A1. Real GDP growth and primary balance are at historical averages 59 45 45 45 44 43 48 54A2. Primary balance is unchanged from 2014 59 46 47 48 47 47 57 72A3. Permanently lower GDP growth 1/ 59 45 46 47 46 45 55 91
B. Bound tests
B1. Real GDP growth is at historical average minus one standard deviations in 2015-2016 59 48 53 54 54 53 63 78B2. Primary balance is at historical average minus one standard deviations in 2015-2016 59 46 48 48 45 43 43 40B3. Combination of B1-B2 using one half standard deviation shocks 59 47 49 50 48 47 52 59B4. One-time 30 percent real depreciation in 2015 59 69 66 64 59 55 51 46B5. 10 percent of GDP increase in other debt-creating flows in 2015 59 51 51 50 48 45 45 42
Baseline 217 158 167 163 161 155 149 145
A. Alternative scenarios
A1. Real GDP growth and primary balance are at historical averages 217 158 170 166 168 168 181 204A2. Primary balance is unchanged from 2014 217 163 177 179 182 182 216 274A3. Permanently lower GDP growth 1/ 217 161 173 173 176 175 208 347
B. Bound tests
B1. Real GDP growth is at historical average minus one standard deviations in 2015-2016 217 170 198 201 206 206 236 297B2. Primary balance is at historical average minus one standard deviations in 2015-2016 217 165 181 177 174 168 161 154B3. Combination of B1-B2 using one half standard deviation shocks 217 165 185 185 186 183 196 225B4. One-time 30 percent real depreciation in 2015 217 244 248 236 228 215 193 176B5. 10 percent of GDP increase in other debt-creating flows in 2015 217 182 191 186 184 177 169 160
Baseline 11 11 12 13 13 13 12 12
A. Alternative scenarios
A1. Real GDP growth and primary balance are at historical averages 11 11 12 13 14 14 13 16A2. Primary balance is unchanged from 2014 11 11 12 13 14 14 14 21A3. Permanently lower GDP growth 1/ 11 11 12 13 14 14 14 24
B. Bound tests
B1. Real GDP growth is at historical average minus one standard deviations in 2015-2016 11 11 14 15 16 16 16 22B2. Primary balance is at historical average minus one standard deviations in 2015-2016 11 11 12 14 14 13 13 13B3. Combination of B1-B2 using one half standard deviation shocks 11 11 13 14 15 14 14 18B4. One-time 30 percent real depreciation in 2015 11 12 17 18 19 19 18 21B5. 10 percent of GDP increase in other debt-creating flows in 2015 11 11 13 15 14 14 13 14
Sources: Country authorities; and staff estimates and projections.1/ Assumes that real GDP growth is at baseline minus one standard deviation divided by the square root of the length of the projection period.2/ Revenues are defined inclusive of grants.
PV of Debt-to-GDP Ratio
Projections
PV of Debt-to-Revenue Ratio 2/
Debt Service-to-Revenue Ratio 2/
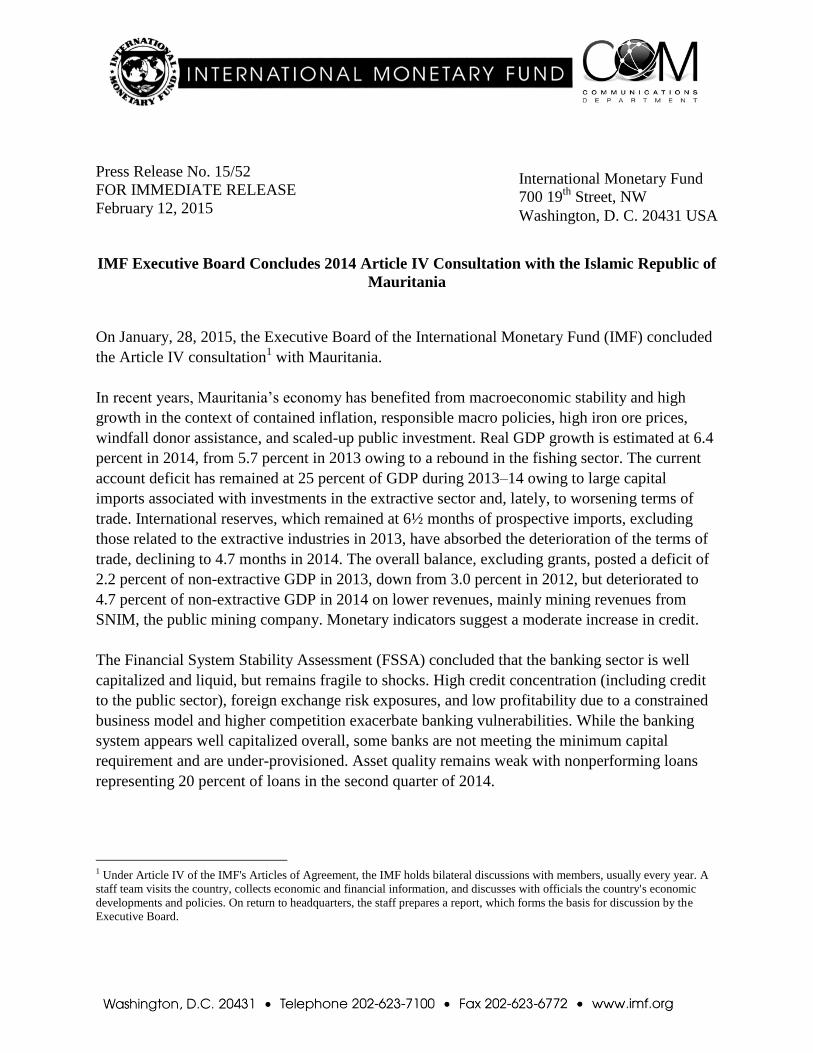
Press Release No. 15/52
FOR IMMEDIATE RELEASE
February 12, 2015
IMF Executive Board Concludes 2014 Article IV Consultation with the Islamic Republic of
Mauritania
On January, 28, 2015, the Executive Board of the International Monetary Fund (IMF) concluded
the Article IV consultation1 with Mauritania.
In recent years, Mauritania’s economy has benefited from macroeconomic stability and high
growth in the context of contained inflation, responsible macro policies, high iron ore prices,
windfall donor assistance, and scaled-up public investment. Real GDP growth is estimated at 6.4
percent in 2014, from 5.7 percent in 2013 owing to a rebound in the fishing sector. The current
account deficit has remained at 25 percent of GDP during 2013–14 owing to large capital
imports associated with investments in the extractive sector and, lately, to worsening terms of
trade. International reserves, which remained at 6½ months of prospective imports, excluding
those related to the extractive industries in 2013, have absorbed the deterioration of the terms of
trade, declining to 4.7 months in 2014. The overall balance, excluding grants, posted a deficit of
2.2 percent of non-extractive GDP in 2013, down from 3.0 percent in 2012, but deteriorated to
4.7 percent of non-extractive GDP in 2014 on lower revenues, mainly mining revenues from
SNIM, the public mining company. Monetary indicators suggest a moderate increase in credit.
The Financial System Stability Assessment (FSSA) concluded that the banking sector is well
capitalized and liquid, but remains fragile to shocks. High credit concentration (including credit
to the public sector), foreign exchange risk exposures, and low profitability due to a constrained
business model and higher competition exacerbate banking vulnerabilities. While the banking
system appears well capitalized overall, some banks are not meeting the minimum capital
requirement and are under-provisioned. Asset quality remains weak with nonperforming loans
representing 20 percent of loans in the second quarter of 2014.
1 Under Article IV of the IMF's Articles of Agreement, the IMF holds bilateral discussions with members, usually every year. A
staff team visits the country, collects economic and financial information, and discusses with officials the country's economic
developments and policies. On return to headquarters, the staff prepares a report, which forms the basis for discussion by the
Executive Board.
International Monetary Fund
700 19th
Street, NW
Washington, D. C. 20431 USA
2
The near-term outlook remains favorable despite slower economic activity and lower iron ore
prices. Real GDP growth is projected to decline to 5.5 percent in 2015 because of lower growth
in mining activity and lower private investment and consumption. Terms of trade are projected to
deteriorate by 4.5 percent as lower iron ore prices (by 24 percent) are partially compensated by
the decline in oil prices (of 40 percent). Inflation is expected to accelerate somewhat but remain
below 5 percent, favored by the decline in international food prices and lower non-extractive
GDP growth. Continued appreciation in real terms could result in higher private sector demand.
Medium-term prospects remain promising: Mauritania’s large resource endowment provides
ample opportunities for development. Structural reforms are essential to generate more growth
and jobs and to address the challenges of economic diversification, inequality, and
unemployment.
Risks to the outlook are tilted to the downside and dominated by global developments. Spillovers
from weakening external demand for commodities could further reduce iron ore prices and
mining export revenues. Larger-than-envisaged declines in main export prices would further
reduce exports and FDI and cast doubts on mining expansion plans, dimming growth prospects
and worsening fiscal balances. External shocks could expose vulnerabilities in the banking
system, exacerbating a negative shock to growth and financial stability.
Executive Board Assessment2
Executive Directors commended the Mauritanian authorities for policies that have secured
macroeconomic stability and supported development in recent years. Directors noted, however,
that the risks from further declines in iron ore prices and weak activity in key trading partners
cloud the outlook for the near term. Accordingly, they encouraged the authorities to persevere
with prudent policymaking and the implementation of institutional and structural reforms to
boost the economy’s resilience and foster more inclusive growth.
Directors welcomed progress with fiscal consolidation and the improved revenue performance.
They agreed that the 2015 budget mitigates shortfalls in mining revenue, but considered that
additional measures may be needed if the budget comes under pressure. Directors also stressed
the importance of strengthening public financial management to reduce the risk of debt distress.
Looking ahead, they underscored the need to improve the fiscal framework over the medium
term to enhance the management of resource wealth and support macrostability. They
recommended implementing an appropriate fiscal rule that takes into consideration the
development needs of the country and helps safeguard the budget from boom-bust cycles of
natural resource revenue, while reinforcing fiscal governance.
2 At the conclusion of the discussion, the Managing Director, as Chairman of the Board, summarizes the views of Executive
Directors, and this summary is transmitted to the country's authorities. An explanation of any qualifiers used in summings up can
be found here: http://www.imf.org/external/np/sec/misc/qualifiers.htm.
3
Directors encouraged the authorities to take advantage of the favorable inflation environment to
reinforce Mauritania’s monetary framework by strengthening liquidity management. They also
noted that prompt recapitalization of the central bank is essential to safeguard its credibility and
independence. Directors emphasized the importance of a gradual liberalization of the foreign
exchange market, noting that greater exchange rate flexibility would help absorb external shocks
and support the reconstitution of reserve buffers. They welcomed the authorities’ steps toward
compliance with Article VIII obligations, and encouraged them to eliminate the remaining
exchange restriction as soon as possible.
Directors underscored the need to further strengthen the stability of the financial system. They
welcomed the authorities’ intention to implement the recommendations of the recent Financial
System Stability Assessment. Priorities include strengthening regulatory enforcement and
supervisory independence, expanding central bank supervision to cover public banks and the
insurance sector, and enhancing the bank resolution framework.
Directors encouraged the authorities to accelerate reforms to promote private sector development
and economic diversification, which would boost employment and reduce poverty. In particular,
they recommended working closely with development partners to address infrastructure
bottlenecks, invest in human capital and education, improve governance and institutions, and
deepen financial inclusion.

4
Mauritania: Selected Economic Indicators, 2010-16
2010 2011 2012 2013 2014 2015 2016
National income and prices (percent; unless otherwise indicated)
GDP at constant prices 4.8 4.4 6.0 5.7 6.4 5.5 6.8
GDP excluding extractive industries at constant prices 5.3 5.7 7.3 6.4 7.1 6.6 5.5
GDP deflator 18.9 15.3 -5.8 0.1 -5.3 0.5 2.4
Consumer price index (average) 6.3 5.7 4.9 4.1 3.5 4.6 4.6
External sector
Terms of trade 7.7 8.5 -14.7 34.2 -16.4 -4.4 -6.8
Current account balance (in percent of GDP) -8.2 -5.1 -26.1 -24.8 -24.7 -7.7 -22.8
Gross official reserves (U.S. millions) 1/ 287.8 504.5 961.9 996.4 639.1 704.0 761.7
In months of following year's imports excluding
extractive industries 2.3 3.6 6.8 6.6 4.7 4.9 5.0
PPG external debt (percent of GDP) 2/ 73.1 66.7 73.5 69.2 73.7 61.3 61.1
Money
Money and quasi-money (percentage change) 12.9 19.9 10.5 13.6 13.4 13.4 10.2
Credit to the private sector (percentage change) 16.4 10.1 14.6 11.1 14.5 15.0 13.9
Investment and savings (percent of GDP)
Gross investment 39.2 42.9 57.3 50.3 44.8 30.3 43.3
Gross savings 28.2 34.9 31.2 25.5 20.1 22.6 20.5
Central government operations
(percent of non-extractive GDP)
Non-extractive revenue 20.4 20.4 22.8 24.4 23.3 25.9 25.4
Expenditure and net lending 30.1 33.6 40.7 37.8 36.3 33.7 31.8
Overall balance excluding grants -1.9 -0.8 -3.0 -2.2 -4.7 -2.1 -1.6
Public sector debt (percent of GDP) 2/ 80.6 72.2 79.4 73.7 78.4 66.0 65.9
Memorandum items:
Nominal GDP (in billions of UM) 1,196.
8
1,440.
2
1,437.
2
1,520.
8
1,533.
2 1,624.5 1,777.4
Nominal GDP (in millions of U.S. dollars) 4,343.
7
5,136.
3
4,839.
9
5,089.
9
5,060.
0 5,109.4 5,477.1
Price of oil (US$/barrel) 79.0 104.0 105.0 104.1 96.3 56.7 63.9
Price of iron ore (US$/Ton) 146.7 167.8 128.5 135.4 96.8 74.1 71.9
Sources: Mauritanian authorities; and IMF staff estimates and projections.
1/ Excluding the oil account.
2/ Debt relief from Kuwait under the HIPC-MDRI is assumed in 2015.
Statement by Ngueto Yambaye, Executive Director for Mauritania
and Mohamed Sidi Bouna, Advisor
January 28, 2015
I. INTRODUCTION
Mauritania has made significant progress in recent years towards both raising economic
growth and achieving macroeconomic stability. Real GDP growth averaged over
5 percent in the past decade owing to the exploitation of the country’s large fishing and
mineral resources, most notably iron ore but also copper and gold. Fiscal revenues rose
significantly, and sound macroeconomic management along with the mining sector’s
rapid expansion has enabled the buildup of sizable external and fiscal buffers. While
prudent policies and a favorable external environment have played a key role, my
authorities also recognize and appreciate the support and candid policy advice of staff
and the Fund, over the years, in this improved performance.
Mauritania also made some progress in the area of poverty reduction, including through
improved targeting of social safety nets and investment in key social projects to address
the country’s immense infrastructure gap. They acknowledge, however, that much
remains to be done in this area. In particular, as noted in the report, progress towards the
MDGs has been mixed. They would like nonetheless to reiterate that the fight against
poverty remains at the center of their development agenda and that they will continue to
promote growth-enhancing polices that are also inclusive in nature, in order to address
the population’s large social needs and provide employment opportunities, especially for
the youth. They are aware that reaching their ambitious objectives in this area requires
continued improvement in the country’s business climate and renewed efforts to
accelerate the development of the private sector.
Given the importance of natural resources in Mauritania’s economy, its recent
performance and the economic outlook has been adversely affected by the steep decline
in the international prices of the main commodities exported and the economic slowdown
in key trading partners. These external developments constitute the key downside risk to
the Mauritania’s outlook. However, my authorities expect that the country’s external
buffers built in recent years and the lower international oil and food prices (Mauritania
being a net importer of both) will help mitigate the impact of external shocks. Going
forward, they view as their key short-term challenge, the implementation of well-
designed policies to address these external risks, while preserving the hard-won
macroeconomic gains, as buffers are being increasingly used. Negotiations on the EU
fishing compensation are ongoing and my authorities expect an agreement that will be
mutually beneficial to all parties.
Over the longer term, the focus as rightly underscored by staff will be to enhance the
economy’s resilience to shocks, including through the imperative diversification of the
economy away from natural resources. My authorities share the overall assessment by
staff along with the key identified challenges which they intend to address in close
coordination with the Fund and other key partners.
II. RECENT ECONOMIC DEVELOPMENTS AND OUTLOOK
Growth: While real GDP growth is projected to slowdown slightly to 5.5 percent in 2015,
from 6.4 percent in 2014, the external and fiscal sectors will be the most affected by the
decline in the international prices of iron ore, copper, and gold exported by Mauritania.
External sector: The substantial deterioration in the terms of trade and large FDI-related
imports are having a significant adverse impact on the trade and current account balances,
and on the level of foreign exchange reserves (dropping from 6.6 months of imports
cover in 2013 to 4.7 months in 2014) despite the favorable effect of lower international
oil and food prices.
Fiscal sector: The fiscal deficit is estimated to have widened to 3.9 percent of GDP in
2014, from 1.7 percent in 2013, despite the decline in both current and capital
expenditures. This is due in part to the drop in the contribution of SNIM (the national
iron ore mining company) and other mining companies to the budget.
Inflation: It remains in check and is expected to stay moderate over the medium-term
(within the approximate 4-5 percent range) thanks to lower international food and fuel
prices, and a prudent monetary policy stance.
Outlook: In spite of the fall in iron ore prices and slower economic activity, the short- and
medium-term outlook remains broadly favorable. Real GDP over the medium-term is
expected to average over 6 percent reflecting in part increased mining activity coming
from new mines. The fiscal deficit is projected to narrow gradually from 1.9 percent of
non-extractive GDP in 2015 to 1.3 percent by 2013. The buildup of international reserves
is projected to resume in 2015 to reach 6.5 months of imports cover by 2019.
III. POLICY ADJUSTMENTS TO EXTERNAL RISKS
While the outlook remains favorable, the economy faces important risks in the near to
medium-term, and my authorities will continue to work closely with staff to design and
implement the necessary policies that will help preserve macroeconomic stability and
continued economic growth.
Fiscal policy adjustments: My authorities are addressing the projected decline in
revenues from the mining sector in the 2015 budget through an increase in the VAT rate
(from 14 to 16 percent) and cuts in current expenditures, while containing the increase in
the public sector wages within a level that does not increase the ratio of the wage bill as a
percentage of non-extractive GDP. The wage bill is actually projected to decline to 8.3
percent of non-extractive GDP in 2015, from 8.4 percent in 2014 and 9 percent in 2013.
As a medium- to long-term fiscal policy reform, my authorities very much welcomed the
discussion on a fiscal rule in a country like Mauritania with relatively abundant mineral
resources. However, they would like to emphasize that on the issue of pro-cyclicality of
fiscal policy, it is important to note, first, that while spending had increased during the

recent mining sector boom, budget revenues from non-extractive industries as a share of
GDP have also increased substantially, as my authorities continued to broaden the tax
base and strengthen fiscal revenue administration. Second, and more importantly, my
authorities believe that the implementation of a fiscal rule in a low-income country like
Mauritania with considerable basic social infrastructure needs would inevitably delay the
implementation of their development agenda and ultimately weigh on the ongoing policy
efforts to accelerate the fight against poverty. Therefore, in the short-term, they believe
that the focus should remain on implementing projects that are deemed viable and that
take into account the country’s absorptive capacity constraints. Nonetheless, they look
forward to continued constructive discussions with staff on this issue, as a potential and
significant long-term reform.
Monetary policy and exchange rate policy adjustments: My authorities agree with staff
that with declining foreign exchange reserves, now is a right time to strengthen the
monetary policy framework and reestablish the use of more direct and traditional
liquidity management instruments such as interest rates and reserve requirements, and
limit the use of indirect instruments like foreign exchange interventions and Treasury
bills. They look forward to continue discussions with staff on the formalization of
monetary policy and the liquidity management framework. My authorities also agree that
in the context of declining reserves, a more flexible exchange rate would contribute to
acting as shock absorber. They are of the view, however, that given Mauritania’s very
shallow foreign exchange market, characterized by considerably higher demand over
supply, the liberalization of the foreign exchange market should remain gradual.
My authorities welcome the assessment of Mauritania’s financial sector stability and
thank staff for the findings and recommendations made in the FSSA report. They would
like to reiterate their commitment to implementing the recommendations made in the
report, as rapidly as possible, and according to the agreed timeframe.
IV. OTHER ISSUES
Deterioration of the risk of debt distress: Mauritania’s public sector debt has risen to an
estimated 78.4 of GDP in 2014 (from 73.7 percent in 2013). The downward revision of
the country’s risk of debt distress (from moderate to high) is a concern to my authorities,
especially given that this revision is taking place at a time when they are facing daunting
external challenges which are having an immediate and direct impact on the economy.
They remain committed however to a prudent external borrowing policy and look
forward to further discussions with the IMF and the World Bank on improving the
institutional environment and stabilizing debt levels, including in the context of the new
public debt limits policy framework.
Obligations under Article VIII: My authorities take note of the report’s findings and will
continue to address the remaining restrictions highlighted in the report, with a view to
meeting all obligations under Article VIII. In the meantime, they request the Board’s
approval to temporarily maintain the remaining exchange restriction which, as indicated
by staff, is necessary for balance of payments reasons and does not discriminate among
IMF members. As also indicated in the report, my authorities will eliminate the
remaining restrictions within one year.
V. CONCLUSION
Mauritania has made important progress in the past few years in improving economic and
financial performance, and raising economic growth. However, the economy faces
important challenges in the foreseeable future resulting from increased external risks
which have exposed the economy’s vulnerability to terms of trade shocks and could
jeopardize the recent hard-won macroeconomic stability gains. In this regard, my
authorities will continue to work closely with staff to put in place the necessary policies
to address the risks, preserve the gains achieved and also continue their efforts to develop
the economy. In this endeavor, they will work closely with the Fund staff and their
development partners.