IMF Country Report No. 14/6 URUGUAY · IMF Country Report No. 14/6 URUGUAY STAFF REPORT FOR THE...
78
©2014 International Monetary Fund IMF Country Report No. 14/6 URUGUAY STAFF REPORT FOR THE 2013 ARTICLE IV CONSULTATION Under Article IV of the IMF’s Articles of Agreement, the IMF holds bilateral discussions with members, usually every year. In the context of the 2013 Article IV Consultation with Uruguay, the following documents have been released and are included in this package: ・The Staff Report for the 2013 Article IV Consultation, prepared by a staff team of the IMF for the Executive Board’s consideration on November 13, 2013, following discussions that ended on October 4, 2013, with the officials on economic developments and policies. Based on information available at the time of these discussions, the staff report was completed on October 29, 2013. ・An Informational Annex prepared by the IMF. ・A Press Release summarizing the views of the Executive Board as expressed during its November 13, 2013 board meeting on the Article IV Consultation Staff Report. ・A Statement by the Executive Director for Uruguay. The document(s) listed below have been or will be separately released. ・Selected Issues Papers The publication policy for staff reports and other documents allows for the deletion of market-sensitive information. Copies of this report are available to the public from International Monetary Fund Publication Services 700 19 th Street, N.W. Washington, D.C. 20431 Telephone: (202) 623-7430 Telefax: (202) 623-7201 E-mail: [email protected] Internet: http://www.imf.org International Monetary Fund Washington, D.C. January 2014
Transcript of IMF Country Report No. 14/6 URUGUAY · IMF Country Report No. 14/6 URUGUAY STAFF REPORT FOR THE...
©2014 International Monetary Fund
IMF Country Report No. 14/6
URUGUAY STAFF REPORT FOR THE 2013 ARTICLE IV CONSULTATION Under Article IV of the IMF’s Articles of Agreement, the IMF holds bilateral discussions with members, usually every year. In the context of the 2013 Article IV Consultation with Uruguay, the following documents have been released and are included in this package: ・The Staff Report for the 2013 Article IV Consultation, prepared by a staff team of the IMF for the Executive Board’s consideration on November 13, 2013, following discussions that ended on October 4, 2013, with the officials on economic developments and policies. Based on information available at the time of these discussions, the staff report was completed on October 29, 2013. ・An Informational Annex prepared by the IMF. ・A Press Release summarizing the views of the Executive Board as expressed during its November 13, 2013 board meeting on the Article IV Consultation Staff Report. ・A Statement by the Executive Director for Uruguay. The document(s) listed below have been or will be separately released. ・Selected Issues Papers The publication policy for staff reports and other documents allows for the deletion of market-sensitive information.
Copies of this report are available to the public from
International Monetary Fund Publication Services
700 19th Street, N.W. Washington, D.C. 20431 Telephone: (202) 623-7430 Telefax: (202) 623-7201
E-mail: [email protected] Internet: http://www.imf.org
International Monetary Fund Washington, D.C.
January 2014

URUGUAY
URUGUAY
STAFF REPORT FOR THE 2013 ARTICLE IV CONSULTATION
Background: Uruguay has experienced a decade of strong and inclusive expansion since its
2002 crisis, thanks to important institutional reforms, large-scale FDI projects attracted by
Uruguay’s stable macroeconomic environment and business-friendly investment climate, and
favorable external conditions.
Current setting: Growth has moderated to a more sustainable pace since 2012, mostly owing
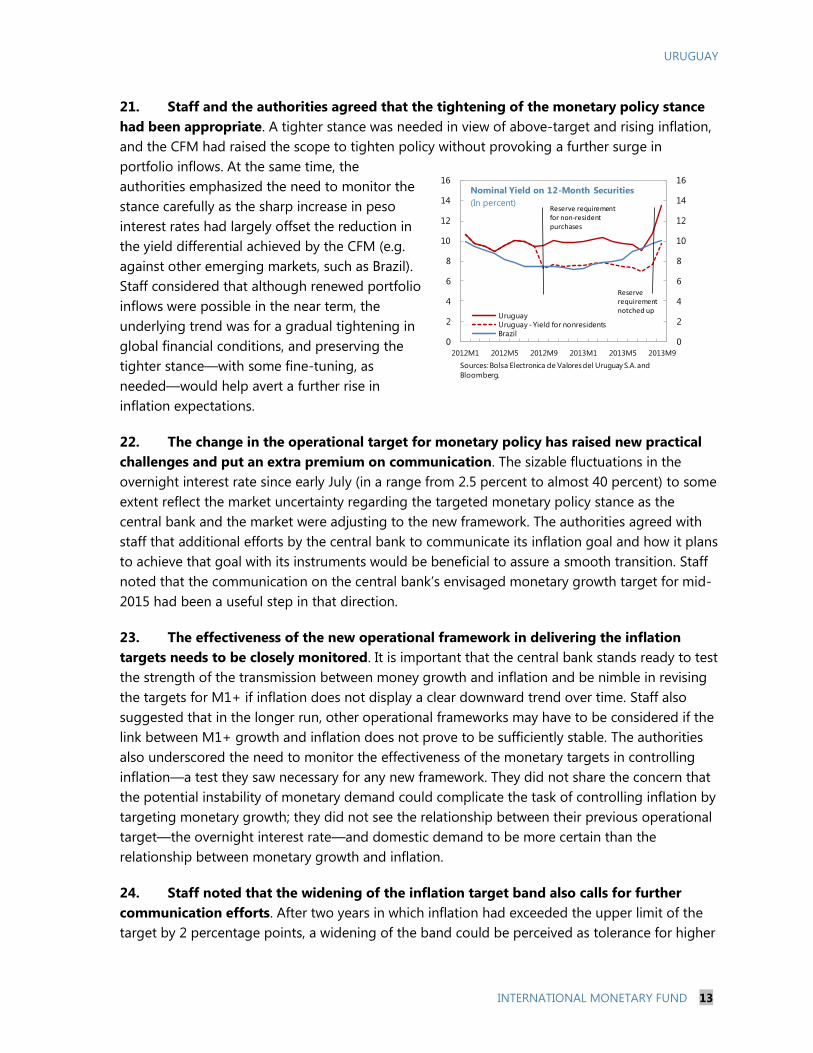
to weaker external demand from regional trading partners with which Uruguay is highly
interconnected. Unemployment remains near historical lows, fiscal policy has loosened, and
inflation persists above the target. Monetary policy, on the other hand, has tightened
considerably since August. The baseline scenario is for the output gap to close gradually.
Near-term risks are mostly to the downside, but vulnerabilities are limited given the strong
liquidity buffers of the public sector.
Focus: Discussions focused on policies to support a smooth convergence of output to
potential in the near term; the optimal policy response in case of inward spillovers; and
requirements to bolster the medium-term outlook.
Policies: Staff supported the authorities’ objective of gradually reducing inflation. Additional
efforts to communicate the targeted monetary policy stance would help smooth the volatility
in short-term interest rates and enhance the central bank’s control over inflation expectations.
A tighter fiscal policy stance and a moderation in wage growth would support monetary
policy in taming inflation. In case of adverse external shocks, the exchange rate should be the
main shock absorber and the ample liquidity buffers could be used to smooth out excessive
volatility. Staff recommended that the reserve requirements on non-residents’ purchases of
central bank and government securities be unwound once there is clear evidence that the
capital inflow surge has subsided. Uruguay’s medium-term growth would benefit from more
flexible wage determination and deeper financial markets. It is critical to press on with efforts
to boost infrastructure.
Past advice: There is broad agreement between the authorities and staff on the
macroeconomic policy priorities. In recent consultations the Fund has placed greater
emphasis on reducing inflation to the mid-point of the target range and called for fiscal
restraint, in part to help monetary policy. In addition, staff has encouraged prudent wage
growth to facilitate disinflation, safeguard competitiveness, and promote macroeconomic
flexibility. Recently, the authorities tightened monetary policy and issued new wage setting
guidelines aimed at restraining the growth of real wages and reducing the use of backward-
indexation.
October 29, 2013
URUGUAY
2 INTERNATIONAL MONETARY FUND
CONTENTS
OVERVIEW _______________________________________________________________________________________ 4
RECENT DEVELOPMENTS _______________________________________________________________________ 4
A. Real Developments ____________________________________________________________________________ 4
B. Policy Actions __________________________________________________________________________________ 7
OUTLOOK AND RISKS ___________________________________________________________________________ 9
POLICY DISCUSSIONS _________________________________________________________________________ 12
STAFF APPRAISAL _____________________________________________________________________________ 19
BOXES
1. Social Policies for Inclusive Growth ____________________________________________________________ 22
2. Capital Flow Management Measures __________________________________________________________ 23
3. Assessment of Balance of Payments Stability __________________________________________________ 24
4. Public Debt Management Operations _________________________________________________________ 26
5. FSAP Update 2012––Key Recommendations __________________________________________________ 27
6. New Legislation on Large-Scale Mining _______________________________________________________ 28
FIGURES
1. Post-2002 Recovery ___________________________________________________________________________ 30
2. Economic Activity _____________________________________________________________________________ 31
3. Inflation _______________________________________________________________________________________ 32
4. External Accounts _____________________________________________________________________________ 33
5. Credit and Banking ____________________________________________________________________________ 34
6. Monetary Developments ______________________________________________________________________ 35
7. Fiscal Developments and Projections __________________________________________________________ 36
Approved By Saul Lizondo and
Vivek Arora
Discussions took place in Montevideo during September 23–October
4. The staff team comprised Oya Celasun (Head), Camilo E. Tovar,
Garth Nicholls, (all WHD) and Samar Maziad (MCM). Yulia Ustyugova
(WHD) took part in the second half of the mission. Viktor Kitange
(FAD), Jesse Siminitz, Sumiko Ogawa, Juan Yepez, Xiomara Jordan (all
WHD) provided support in Headquarters. Natalia Melgar and Sandra
Shaw (Montevideo Office) also supported the mission.

URUGUAY
INTERNATIONAL MONETARY FUND 3
TABLES
1. Selected Economic Indicators _________________________________________________________________ 37
2. Main Fiscal Aggregates ________________________________________________________________________ 38
3. Public Sector Debt and Assets _________________________________________________________________ 39
4. Statement of Operations of the Central Government __________________________________________ 40
5. Central Government Stock Positions __________________________________________________________ 41
6. Summary Accounts of the Banking System ____________________________________________________ 42
7. Balance of Payments and External Sector Indicators ___________________________________________ 43
ANNEXES
I. Is the Uruguayan Economy Decoupling from its Neighbors? An Empirical Analysis of Inward
Spillovers to Uruguay ____________________________________________________________________________ 44
II. Public Sector Debt Sustainability Analysis (DSA) _______________________________________________ 52
III. External Debt Sustainability Analysis (DSA) ___________________________________________________ 59

URUGUAY
4 INTERNATIONAL MONETARY FUND
OVERVIEW
1. The year 2012 concluded the decade with the strongest average GDP growth on
record in Uruguay and a remarkable improvement in living standards (Figure 1). Key drivers
of Uruguay’s strong rebound from its 2002 crisis included important institutional reforms, large
FDI projects attracted by Uruguay’s stable macroeconomic environment and business-friendly
investment climate, and favorable external conditions.1 The result has been a strong rise in
employment, real wages, and consumption. Poverty rates have declined sharply thanks to strong
growth and active social policies (Box 1), and income inequality has also declined further since
2004.
2. The main priority is to safeguard and enhance these gains by ensuring a smooth
landing of the economy, and to bolster medium-term potential. 2012 saw slower growth and
widening imbalances—a higher fiscal deficit and inflation, a strong real appreciation (boosted by
portfolio inflows), and a wider current account deficit. The task ahead is to calibrate the policy
mix so as to decisively tackle inflation, safeguard competitiveness, and facilitate a smooth
landing in a less favorable global environment. The medium-term goals—to reinforce resilience
to shocks and bolster potential output—are unchanged.
RECENT DEVELOPMENTS
A. Real Developments
3. Growth has decelerated but remains solid. After averaging 7.7 percent in 2010–11, real
GDP growth moderated to 3.9 percent in 2012, mostly owing to lower export and tourism
revenues from Argentina and Brazil, and a drop in
hydroelectric output due to a drought. Staff’s growth
projection of 4 percent for 2013 reflects a rebound in
hydroelectric output in the first half of the year as
well as renewed momentum in commodity exports
and domestic demand, in particular private
consumption. Private investment remains close to
historic highs as a share of GDP although it has
decelerated somewhat after a boom in 2012 (Figure
2). Unemployment, which averaged 6¾ percent in
the six months through August, is near historic lows.
1 The Selected Issues Paper Agricultural Land Prices–A Channel in the Transmission of Global Commodity Price
Shocks on Economic Activity, by Juan Yepez, examines the impact of food commodity prices on agricultural land
prices in Uruguay and the region in the last decade, and the role played by agricultural land prices in transmitting
commodity price shocks to the broader economy.
0
2
4
6
8
10
12
14
0
2
4
6
8
10
12
14
2010H1 2011H1 2012H1 2013H1
Real GDP growth
(y-o-y, in percent)
Real GDP
Real GDP (excl. hydroelectric output)
Source: Banco Central del Uruguay and Fund staff
estimates.

URUGUAY
INTERNATIONAL MONETARY FUND 5
4. Inflation remains above the central bank’s target range of 4–6 percent and has
edged up recently (Figure 3). Nontradables inflation has averaged about 9 percent since mid-
2011, compared to slightly less than 8 percent in the previous three years. Headline inflation,
after rising in 2012Q3 owing mostly to a jump in food
prices, temporarily dipped to 7.5 percent in December
2012 as the authorities lowered administered prices
and took other temporary measures. The lower
December inflation rate contributed to slower real
wage growth in the first half of 2013 as many wage
contracts are indexed to end-year inflation, helping to
contain inflation pressures. However, inflation climbed
back to 9 percent in September 2013 due to the recent
rise in energy prices and the peso depreciation.
Twelve-month-ahead inflation expectations have risen
to about 8 percent from 7.5 percent half a year ago.
5. The current account deficit has widened significantly (Figure 4). Of the total increase
in the current account deficit—from 2.9 percent of GDP in 2011 to 5.4 percent of GDP in 2012—
about two thirds reflected a widening of the trade deficit, mostly due to higher imports of capital
goods associated with the construction of the Montes del Plata pulp mill and a surge in oil
imports for electricity generation after the drought. In addition, net services revenues, mainly
tourism, weakened in the second half of 2012, reflecting weak flows from Argentina and Brazil.
Although the trade balance has been normalizing in 2013—with a sharp drop in oil imports and
buoyant soy exports—the services balance has weakened further, reflecting a continued decline
in tourism revenues from Argentina, increased travel by Uruguayans to Argentina, and higher
services imports associated with hydrocarbon exploration.
6. The portfolio inflow surge that had started in early 2012 came to a stop in June
2013. The sharp increase in the foreign purchases of locally-issued, peso-denominated public
securities in spring 2012 was spurred by Uruguay’s new investment grade rating, wider interest
rate differentials (in particular relative to Brazil), and an improvement in global risk appetite. At
first, most of the inflows went into short-maturity central bank securities. After the central bank
introduced a reserve requirement on nonresidents’ purchases of central bank paper in
September 2012, flows rotated into central government notes (Box 2). The inflows ground to a
near halt in June, amid generalized financial volatility in emerging markets following the Fed’s
tapering announcement and after Uruguayan authorities announced in late May that they would
extend the reserve requirements for nonresidents’ purchases of central bank paper to purchases
of central government paper. Total foreign holdings of locally-issued peso-denominated public
securities were broadly flat between May and September.
7. The real effective exchange rate (REER) has depreciated moderately since May,
after appreciating strongly in the previous year. The REER strengthened 13 percent in the
twelve months through April 2013, with particularly pronounced appreciations against Uruguay’s
4
5
6
7
8
9
10
4
5
6
7
8
9
10
2010Q1 2011Q1 2012Q1 2013Q1
Headline Inflation
12-month ahead inflation expectations (avg.)
Consumer Prices
(y-o-y, in percent)
Source: Instituto Nacional de Estadistica.

URUGUAY
6 INTERNATIONAL MONETARY FUND
main trading partners, Argentina and Brazil (19 and
14 percent, respectively). The peso weakened by
16 percent against the U.S. dollar between late-May
and end September, but the REER depreciation was
smaller at about 8 percent between (from May to
August), since the currencies of Argentina and Brazil
also depreciated against the U.S. dollar over the same
period. Staff estimates that the REER remains slightly
on the strong side (0–10 percent, see Box 3).2
8. Credit continues to expand at a solid pace,
but remains modest relative to GDP (Figure 5).
Credit to households—mostly denominated in local
currency—has been growing by about 8 percent (y-
o-y) in real terms in recent months, while credit to firms—mostly denominated in U.S. dollars—
has been growing at about 18 percent (y-o-y). The stock of credit to the private sector stood at
24 percent of GDP in August 2013.
9. The growth of house prices moderated in 2012. Most of the expansion in the real
estate market in recent years had been concentrated in the urban luxury segment, and according
to anecdotal evidence, has received heavy foreign
investment (mainly from Argentina). The vast majority
of real estate transactions are done in cash
(household mortgages stood at 4 percent of GDP in
July 2013, broadly unchanged from levels in recent
years). Tight foreign exchange restrictions in
Argentina, and a new bilateral tax treaty on
information exchange between Argentina and
Uruguay, appear to have cooled the market, with the
growth of house prices softening in 2012. Market
participants pointed out that this trend continued in
2013.
2 The Selected Issues Paper Competitiveness Trends in Uruguay, by Garth P. Nicholls, looks at the evolution of
Uruguay’s exports structure and its drivers in the past decade, and discusses the balance of payments stability
assessment.
60
80
100
120
140
160
180
200
60
80
100
120
140
160
180
200
2001 2003 2005 2007 2009 2011 2013
Real Exchange Rates
(Index 2005 =100)
Multilateral 1/
Bilateral Argentina 1/
Bilateral Brazil
Source: Fund staff calculations based on Instituto Nacional de
Estadistica data.
1/ The real exchange rate against Argentina is calculated using
the unofficial CPI for Argentina and the average of the unofficial
and official exchange rates for the Argentine peso.
20
40
60
80
100
120
140
160
180
20
40
60
80
100
120
140
160
180
2002 2004 2006 2008 2010 2012
Average Price of Apartments by Square
Meter
(Montevideo, deflated by CPI)
Source: Fund staff calculations based on Instituto
Nacional de Estadistica data.

URUGUAY
INTERNATIONAL MONETARY FUND 7
B. Policy Actions
10. The central bank gradually tightened the monetary policy stance through March
2013 and announced changes to the policy framework in May 2013 (Figure 6).
Between June 2012 and March 2013, the central bank raised reserve requirements on bank
deposits and notched up the policy rate by a cumulative 50 basis points. The rate, at
9.25 percent from end-December, remained 300–400 basis points below staff’s estimates of
the neutral short-term interest rate. The central bank stepped up its pace of reserve
accumulation in early 2013 in order to limit the appreciation of the peso amidst heavy capital
inflows. In the meanwhile, concerns grew on the fiscal cost of sterilizing the reserves, and the
currency appreciation against Argentina and Brazil.
In June 2013, the authorities announced a new reserve requirement of 50 percent for
nonresidents’ purchases of locally-issued Treasury notes to discourage further portfolio
inflows and replaced the overnight interest rate target with targets for M1 plus saving
deposits (M1+). They also announced a widening of the inflation-target-band to 3–7 percent
starting in July 2014 from 4–6 percent.3 The M1+ targets for 2013Q3 and 2013Q4
(12.5–13 percent and 15–17 percent, respectively) represent a broadly unchanged pace of
monetary expansion relative to 2013H1 but a slower pace of growth than in the last two
years. The authorities envisage a further reduction in the rate of M1+ growth over the next
two years (to 8 percent by mid-2015—which would be lower than the sum of potential
growth and the mid-point of the inflation-target).
Since July 2013, monetary conditions fluctuated widely as the markets adjusted to the new
framework and the authorities fine-tuned their operations. In July, the overnight interbank
rate dipped sharply, averaging 4.5 percent. In August and September, the central bank
tightened liquidity, which drove the overnight interest rate to an average of 17.5 percent. In
early October, nominal peso yields for 1–60 months maturities were about 4 percentage
points above their levels in May.
11. The fiscal deficit widened in 2012 and fiscal policy is projected to remain slightly
expansionary in 2013 (Figure 7). The primary balance declined to -0.2 percent of GDP in 2012
from 2 percent in 2011. About half of the decline was due to one-off transfers and the higher
cost of electricity generation (using imported oil) at the state energy enterprise. The other half
largely reflected the greater-than-expected costs of the broadening of the pension and health
care systems (under reforms initiated in 2008, with a sizable wave of new beneficiaries added in
2012 in a process that will go on until 2016). Although the primary balance is expected to
improve to a 0.6 percent of GDP surplus in 2013, thanks largely to the recovery in the profits of
the state energy enterprise, fiscal policy is poised to add another small positive impulse mainly
3 The central bank had abandoned M1+ as its operational target in 2007Q3 and replaced it with a target for the
overnight interest rate.

URUGUAY
8 INTERNATIONAL MONETARY FUND
due to a rise in public investment spending. Under
unchanged policies, the deficits of the overall public
sector would settle around 2¼ percent of GDP in the
medium term—about 1.0–1.5 percentage points of
GDP higher than envisaged in last year’s budget—and
the gross public debt to GDP ratio would remain
broadly unchanged at about 60 percent of GDP. Net
debt (gross debt minus liquid assets) would remain
around 36–37 percent of GDP between 2013 and 2015.
12. The authorities continued implementing a
debt management strategy aimed at reducing
vulnerabilities. As a result of active liability
management, Uruguay’s public debt profile has
improved significantly in recent years—with a much
reduced share of foreign currency debt and a high
average maturity (Box 4). Moreover, the public sector
has accumulated a considerable stock of liquid assets,
which amounted to 22.4 percent of GDP at end-2012.
The authorities have also secured contingent credit
lines with multilateral agencies of some 4 percent of
GDP. Since spring 2012, Uruguay has obtained
investment grade sovereign ratings from four major
rating agencies and has access to foreign funding at
favorable costs (4.5 percent for a US$ denominated 10-
year bond issued in August 2013).
13. The government’s newly-issued guidelines for the ongoing wage negotiation round
seek to restrain the growth of real wages. The ongoing negotiation round, which started in
July and will end around November, will affect about one third of workers. The government has
recommended that workers and enterprises set wages for three years with two options for
setting annual wage increases. The first option would entail increases in line with the central
bank’s inflation target (with an ex-post correction based on actual inflation) plus a real
adjustment between zero and 3 percent, dependent on GDP growth and the performance of the
sector; there would be clauses that allow renegotiation in the event of large shocks. The second
option—in a break with past guidelines—would entail contracts without backward indexation.
Negotiations continue amid labor unrest; the authorities expect real wage growth to moderate
from about 4 percent in the last two years to 2–2.5 percent in the new round. However, the take
up of non-indexed contracts is likely to be limited.
0
10
20
30
40
50
60
70
80
0
10
20
30
40
50
60
70
80
2009 2012
Public Sector Gross Debt, Assets, And Net Debt
(In percent of GDP)
Gross Debt
Liquid Assets
Net Debt
Source: Ministerio de Economia y Finanzas.
-1.0
-0.5
0.0
0.5
1.0
1.5
-1.0
-0.5
0.0
0.5
1.0
1.5
2009 2011 2013 2015 2017
Fiscal Impulse
(Overall public sector, in percent of GDP)
Sources: Ministerio de Economia y Finanzas and
Fund staff calculations.

URUGUAY
INTERNATIONAL MONETARY FUND 9
OUTLOOK AND RISKS
14. The outlook is for growth to be somewhat below 4 percent in 2014–15, with
gradual reductions in inflation and the current account deficit. Growth is projected to soften
to 3.5 percent in 2014, with the phasing-out of the rebound in hydroelectric generation
subtracting 1.5 percentage points, and the scheduled start of production and exports by the pulp
mill adding 1 percentage point. A further slowdown in public spending in 2015 (with a roughly
constant fiscal budget in the aftermath of the elections) along with a gradual tightening of
monetary conditions should keep growth in 2015–18 somewhat below the potential growth rate
of 4 percent. Inflation is projected to ease over time as monetary policy is tightened, but the
recent depreciation of the peso against the U.S. dollar implies some upside risk for inflation in
the year ahead. The current account is projected to improve gradually in line with a recovery in
external demand.
15. Risks to the growth outlook are mostly to the downside in the near term. As a small
open economy, Uruguay is exposed to risks of inward spillovers (See Annex I for an analysis of
Uruguay’s external linkages and the importance of global spillovers for Uruguay’s growth). It also
faces domestic overheating risks. In the medium term, iron-ore mining may provide a boost to
growth.
Export commodity prices. About two-thirds of Uruguay’s exports are commodity based—
mostly food related. Although likely to be less sensitive to growth than energy and metal
prices, a sustained decline in food prices—e.g., in case of lower than anticipated emerging
market growth potential or a sharp slowdown in China—would hurt growth in Uruguay. At
the same time, a decline in energy prices that would likely accompany such a scenario would
help buffer the adverse effects though a lower import bill.
Weaker growth in the region. Uruguay has significant economic connections with Argentina
and Brazil, through trade, tourism, and FDI flows. Prospects for these countries could imply
downside risks for Uruguay through direct spillovers or confidence effects.
Oil prices. There is a threat of higher oil prices in the short-term due to geo-political events.
Tighter global financial conditions. Potential market volatility associated with the prospective
exit from accommodative monetary conditions in advanced economies or a re-emergence of
financial strains in Europe could lead to a tightening in global financial conditions and peso
depreciation. The adverse impact on bank balance sheets (stemming from high credit
dollarization) would be contained given broadly adequate capital and the strong level of
foreign assets of the banks and the public sector. At the same time, the tightening of global
financial conditions associated with the normalization of monetary policy in advanced
economies could weaken FDI into Uruguay and weigh on growth.
Domestic overheating. If monetary conditions were not to tighten sufficiently or if the
ongoing wage negotiation round were to result in strong growth in real wages, inflationary
pressures would rise further and competitiveness would weaken. Such an over-heating

URUGUAY
10 INTERNATIONAL MONETARY FUND
scenario would make the economy more vulnerable to external shocks and reduce the scope
for a soft landing and a gradual adjustment of policies in the period ahead.
Natural resource revenues. On the upside, the start of large-scale iron mining would boost
investment, and eventually export and fiscal revenues in the medium run. The current
account could widen due to the FDI-financed imports of capital goods in the initial phase of
the project.
Uruguay: Risk Assessment Matrix
Sources of risk Up/downside Likelihood Impact
Exte
rnal
Large decline in Uruguay’s export prices
(due to lower than anticipated emerging
market growth potential, sharp slowdown
in growth in China)
M H
Protracted economic and financial
volatility in emerging markets triggered
by prospective exit from unconventional
monetary policy in advanced economies
H L
Re-emergence of financial stress in the
euro area and tightening in global
financial conditions
M L
Sharply lower growth in the region M M
Global oil price shock triggered by
geopolitical events L L
Do
mest
ic Domestic overheating followed by a hard
landing L M
Increased mining revenues in the medium
term H H
Note: The Risk Assessment Matrix (RAM) shows events that could materially alter the baseline path discussed in
this report (which is the scenario most likely to materialize in the view of the staff). The relative likelihood of risks
listed is the staff’s subjective assessment of the risks surrounding this baseline. The RAM reflects staff's views on
the source of risks and overall level of concerns as of the time of discussions with the authorities.
16. The Uruguayan economy is generally well placed to manage these risks as liquidity
buffers are strong, external stability risks are modest, and the financial system is unlikely
to act as an important propagator of downside shocks (the policy responses to adverse
inward spillovers are discussed in paragraph 34).
The public sector has strong liquidity buffers. Fiscal financing risks are modest as the non-
financial public sector has financial assets of 5.8 percent of GDP (the central government has
liquid assets that would cover debt service needs through 2014) and has access to 4 percent
of GDP in contingent credit lines. Central bank reserves are also strong—at end-2012, the

URUGUAY
INTERNATIONAL MONETARY FUND 11
BCU had around 19 percent of GDP in free reserves (gross reserves minus reserve
requirements against foreign currency denominated deposits). BCU’s reserves amply exceed
various prudential benchmarks.
External stability risks are limited. Although the peso appears somehat on the strong side,
external financing risks are limited in the near term as central bank reserves are high and FDI
prospects remain solid (Box 3).
The financial system is small and appears resilient. Bank credit to the private sector is low at
24 percent of GDP. Most banks are liquid, with low loan-to-deposit ratios. Non-resident
deposits are more than matched by banks’ liquid foreign assets and reserve requirements;
the foreign assets of the commercial banks and the central bank exceed the sum of foreign-
currency deposits and short term-external debt. The main point of vulnerability is that 27.5
percent of bank loans in foreign currency are to firms whose earnings are in local currency.
That said, non-performing loans are less than 1.5 percent of total loans, and stress tests
conducted during the recent FSAP suggest that banks can withstand significant shocks,
despite some pockets of vulnerability.
17. The authorities were in broad agreement with staff’s outlook but saw more limited
downside risks. They felt that the reduced trade and tourism linkages with Argentina would
imply lower spillovers than in the past, and that the mostly commodity-based exports to Brazil
could easily find markets elsewhere if Brazilian growth were to disappoint. They argued that an
2010 2011 2012 2013 1/ LA5 2/
Regulatory capital in percent of risk-weighted assets 16.1 13.7 12.8 12.4 16.0
Non-performing loans in percent of total loans 1.0 1.3 1.5 1.4 2.8
Non-performing loans in percent of total household loans 3.5 3.1 3.5 3.8 n.a
Specific loan-loss provisions in percent of non-performing loans 73.1 71.1 69.0 61.3 n.a
Operating costs in percent of gross income 91.3 83.4 81.0 80.9 n.a
Return on assets 3/ 0.8 0.8 1.0 1.3 1.8
Return on equity 4/ 8.1 7.9 12.6 15.3 17.5
Liquidity ratio 5/ 47.4 47.8 52.6 52.6 30.6
Dollar loans in percent of total loans 59.4 58.5 57.9 61.9 22.2 6/
Dollar deposits in percent of total deposits 74.1 71.9 71.9 75.4 18.4 6/
Non-resident deposits in percent of total deposits 16.4 14.6 15.2 15.0 n.a
Private sector credit in percent of GDP 19.7 20.5 22.2 24.0 31.8
Household consumer credit in percent of GDP 8.4 8.5 8.8 8.9 n.a
Implicit exchange rate risk 7/ 31.4 31.4 34.0 27.5 n.a
1/ Latest available data (August 2013).
3/ Annualized net income before extraordinary items and taxes from the beginning of the year until the reporting
6/ Excludes Brazil.
7/ Share of foreign currency bank credit to unhedged borrowers.
Selected Financial Soundness Indicators
2/ Median of Brazil, Chile, Colombia, Mexico, Peru, for 2012. Definitions of soundness indicators vary by country.
month, in percent of average value of total assets over the same period.
4/ Same as footnote 3 but in percent of average value of capital over the same period.
5/ Liquid assets with maturity up to 30 days in percent of total liabilities expiring within the same period.
Sources: Banco Central del Uruguay, IMF Global Financial Stability Report, and Fund staff calculations.
URUGUAY
12 INTERNATIONAL MONETARY FUND
eventual rebalancing of demand in China—from investment toward consumption—would likely
improve Uruguay’s terms of trade by boosting food prices and lowering energy prices. They also
stressed that the strong liquidity buffers built by Uruguay’s public sector eliminates the risk of
debt-financing problems that Uruguay experienced in the past, and allow for a counter-cyclical
policy response if adverse shocks were to occur.
POLICY DISCUSSIONS
Taming Inflation in a Context of Volatile Capital Flows
18. There was agreement that inflation remains an important policy issue and staff
supports the central bank’s goal to gradually reduce inflation. Above target inflation and
expectations reduce the scope to ease monetary policy in response to negative economic shocks,
creates macroeconomic uncertainty, and adversely affects low income households. Lowering
inflation would help foster the de-dollarization and de-indexation of the economy. In staff’s view,
the high level of inflation reflects a number of factors, but most importantly an inflation target
that is not anchoring expectations within the range, and robust growth in domestic demand and
unit labor costs in recent years.
19. Staff and the authorities discussed the rationale for the recent changes to the
capital flow management measures (CFM) and the monetary policy framework. The
authorities stressed that their objective in extending the CFM to locally-issued central
government securities was to contain portfolio inflows; the differential between the policy rate in
Uruguay versus other emerging markets—especially Brazil—had been seen as an important
driver of portfolio inflows and peso appreciation in the year to May. On the decision to replace
the overnight interest rate target with a monetary aggregate target, the authorities also argued
that the transmission from the overnight interest rate target to deposit and lending rates had
been modest in the context of excess liquidity and elevated dollarization in Uruguay’s banking
system. They felt that targets for monetary aggregates could have a more direct and stronger
influence on domestic demand than short-term interest rates.
20. There was agreement that the broadening of the CFM announced in May was
justified by macroeconomic considerations. At the time of the announcement, the peso was
clearly on the strong side and there was no room to counteract the appreciation pressures by
altering the macroeconomic policy settings—with a fiscal tightening not feasible in the short run
and a monetary easing not desirable given above-target inflation and expectations. Staff noted
that as a general principle CFMs should not substitute for warranted macroeconomic adjustment
and be removed once the conclusion can be reached that the inflow surge has subsided. There
was agreement that it was too early to reach such a conclusion, as the Fed’s decision to delay its
tapering of asset purchases had raised the possibility of renewed inflows.
URUGUAY
INTERNATIONAL MONETARY FUND 13
21. Staff and the authorities agreed that the tightening of the monetary policy stance
had been appropriate. A tighter stance was needed in view of above-target and rising inflation,
and the CFM had raised the scope to tighten policy without provoking a further surge in
portfolio inflows. At the same time, the
authorities emphasized the need to monitor the
stance carefully as the sharp increase in peso
interest rates had largely offset the reduction in
the yield differential achieved by the CFM (e.g.
against other emerging markets, such as Brazil).
Staff considered that although renewed portfolio
inflows were possible in the near term, the
underlying trend was for a gradual tightening in
global financial conditions, and preserving the
tighter stance—with some fine-tuning, as
needed—would help avert a further rise in
inflation expectations.
22. The change in the operational target for monetary policy has raised new practical
challenges and put an extra premium on communication. The sizable fluctuations in the
overnight interest rate since early July (in a range from 2.5 percent to almost 40 percent) to some
extent reflect the market uncertainty regarding the targeted monetary policy stance as the
central bank and the market were adjusting to the new framework. The authorities agreed with
staff that additional efforts by the central bank to communicate its inflation goal and how it plans
to achieve that goal with its instruments would be beneficial to assure a smooth transition. Staff
noted that the communication on the central bank’s envisaged monetary growth target for mid-
2015 had been a useful step in that direction.
23. The effectiveness of the new operational framework in delivering the inflation
targets needs to be closely monitored. It is important that the central bank stands ready to test
the strength of the transmission between money growth and inflation and be nimble in revising
the targets for M1+ if inflation does not display a clear downward trend over time. Staff also
suggested that in the longer run, other operational frameworks may have to be considered if the
link between M1+ growth and inflation does not prove to be sufficiently stable. The authorities
also underscored the need to monitor the effectiveness of the monetary targets in controlling
inflation—a test they saw necessary for any new framework. They did not share the concern that
the potential instability of monetary demand could complicate the task of controlling inflation by
targeting monetary growth; they did not see the relationship between their previous operational
target—the overnight interest rate—and domestic demand to be more certain than the
relationship between monetary growth and inflation.
24. Staff noted that the widening of the inflation target band also calls for further
communication efforts. After two years in which inflation had exceeded the upper limit of the
target by 2 percentage points, a widening of the band could be perceived as tolerance for higher
0
2
4
6
8
10
12
14
16
0
2
4
6
8
10
12
14
16
2012M1 2012M5 2012M9 2013M1 2013M5 2013M9
Uruguay
Uruguay - Yield for nonresidents
Brazil
Nominal Yield on 12-Month Securities
(In percent)Reserve requirement for non-residentpurchases
Reserve requirement notched up
Sources: Bolsa Electronica de Valores del Uruguay S.A. and
Bloomberg.
URUGUAY
14 INTERNATIONAL MONETARY FUND
inflation and a lower commitment to tighten policy in response to upward pressures on inflation.
However, policy credibility may actually be enhanced if inflation is brought into the target band
under the new framework, especially if there were a narrowing of the band again over time to
effectively anchor inflation expectations. Staff argued that further communication on the central
bank’s decision to widen the band and its strategy for bringing inflation into the band would be
useful. The authorities took note of staff’s position, but did not consider that the widening would
be taken as a signal of a lower commitment to control inflation.
Prudent Wage-Setting
25. A moderation in real wage growth would be critical to safeguard competitiveness,
curb overheating risks, and tame inflation. The cumulative growth in real wages has exceeded
the growth of aggregate output per worker in recent years and the ensuing increase in real unit
labor costs has contributed to inflation. Staff supported the authorities’ recent wage-setting
guidelines that would keep the growth of real wages in the range of 0–3 percent depending on
the performance of GDP and the sector; the envisaged decline in the growth rate of real wages
(from about 4 percent in the last few years) would help contain rises in real unit labor costs going
forward. Staff also welcomes the proposed safeguard clauses that would allow a re-negotiation
in the event of a substantial change in the performance of the sector; such renegotiations could
help reduce the rigidity of real wages and buffer employment in the event of negative shocks.
26. Staff welcomed the authorities’ initiative to offer guidelines for non-indexed wage
adjustment. Reducing backward-indexation in wage contracts is crucial for raising the resilience
of labor demand against potential adverse shocks; it would also lower inflation inertia and
facilitate a reduction of inflation as the monetary policy stance is tightened. Staff argued that the
authorities’ recent guidelines for the possible design of non-indexed wages are an important
step in this regard and should be promoted strongly.
Fiscal Policy—Supporting Monetary Policy and Sustaining the Decline in Net Public Debt
27. Staff emphasized that a tighter policy stance would help alleviate some of the
burden on monetary policy. Staff estimates that despite a decline in the headline fiscal deficit,
fiscal policy will be neutral or provide a small positive impulse this year following a positive
impulse last year, with real expenditure growth slowing but remaining above the growth of real
GDP. With still tight labor market conditions and output growth somewhat above potential
recently, staff argued that a tighter fiscal stance would help alleviate some of the burden on
monetary policy in fighting inflation and reduce real appreciation pressures.4 The authorities did
not see scope to alter the course of fiscal policies in the near term. They considered the impact of
fiscal policy on inflation to be limited in Uruguay and felt that staff’s empirical findings on this
4 See the Selected Issues Paper Fiscal Policy and Inflation in Uruguay: Exploring the Nexus, by Camilo E. Tovar. The
paper estimates that a one percent of GDP reduction in the central government primary balance is associated
with a 0.45 percentage point decline in inflation.

URUGUAY
INTERNATIONAL MONETARY FUND 15
relationship was consistent with their conclusion. Staff reiterated that even if the impact of fiscal
policy on inflation may be moderate, given the trade-offs facing monetary policy, any support
from a tighter fiscal policy stance would be beneficial.
28. The authorities have shifted their focus from gross to net public debt over time. The
initial public sector budget for the 2010–15 period and the budget updates (Rendicion de
Cuentas) for 2011 and 2012 included an objective to reduce gross public debt to 40–45 percent
of GDP by 2015 (from 66 percent of GDP in 2009). At end-2012, gross public debt stood at about
60 percent of GDP, with the deviation from earlier projections reflecting mostly the stronger
accumulation of foreign assets.5 In the meanwhile, debt net of liquid assets declined from 44
percent of GDP in 2009 to about 37 percent of GDP in 2012; staff projects it to remain broadly
stable around that level under the current policies and outlook.
29. Staff noted that although Fund surveillance of fiscal sustainability is usually based
on gross debt, in certain cases there may be merit in focusing on net debt as a
complementary measure to reflect factors that could mitigate risks associated with gross
debt. In the case of Uruguay, staff recognizes the relevance of net debt, since the sizable liquid
financial assets of Uruguay’s consolidated public sector (including the central bank and central
government) do mitigate financing risks.
30. Staff recommended a gradual fiscal adjustment through the medium term to keep
net public sector debt on a firmly downward-sloping path. Staff and the authorities agreed
that public-debt vulnerabilities were contained in the near term given the comfortable level of
liquid assets of the central bank and the central government, as well as the robust profile of the
public debt. Since debt dynamics remain sensitive to growth and exchange rate shocks (see
Annex II), and given the uncertain external outlook for the years ahead, staff recommended
keeping net debt as a share of GDP on a firm
downward-trend. Returning the overall deficit of the
public sector to 1 percent of GDP in the medium
term (as envisaged in last year’s budget update–2011
Rendicion de Cuentas) from the 2.0-2.5 percent
projected now would be consistent with that goal.
31. The authorities saw their net debt
objective as having been fulfilled. They noted that
the net debt ratio had declined significantly and
stood very close to the levels projected in the
previous years of the current five-year budget period
(that started in 2010) in part due to the greater-than-
expected GDP growth and real exchange rate appreciation.
5 In April 2013, Uruguay’s historic public debt series were revised upwards due to a methodological change. The
revision to end-2012 gross public debt was 2 percentage points of GDP.
20
25
30
35
40
45
50
55
60
-0.5
0.0
0.5
1.0
1.5
2.0
2.5
3.0
3.5
4.0
2009 2010 2011 2012 2013 2014 2015
Primary Balance and Net Debt 1/
(In Percent of GDP)
Primary balance (projected in the 2010 budget)
Primary balance (projection in the current budget)
Primary balance (outturns)
Net public debt (rhs)
Sources: Ministerio de Economia y Finanzas and Fund staff calculations.
1/ The 2010 projections are from the 2010 Ley de Presupuesto―the initial budget
of the current five-year budget period .The projections for 2013 onwards are from
this year's budget update (2012 Rendicion de Cuentas).

URUGUAY
16 INTERNATIONAL MONETARY FUND
32. Staff and the authorities also discussed options for reducing the fiscal deficit. Staff
called for restraining the growth of expenditures while safeguarding infrastructure investments
and the safety net for the poor. It also saw scope for raising contributions to the public pension
and health care insurance plans since recent legislation to broaden coverage has proven more
costly than initially envisaged. The authorities noted that the low share of discretionary spending
excluding infrastructure investments implied little scope for lowering the deficit by slowing the
growth of spending. They felt that the contributions by workers and firms to the pension and
health care plans were already high by international standards and saw little room for raising
them. They did see scope to increase tax revenues in the longer run, mainly from higher-income
earners. They noted that Uruguay’s marginal tax rates for higher income earners remained below
international comparators. They saw it important to preserve an investment-friendly corporate
tax structure, with competitive marginal tax rates and tax breaks for selected investments; they
noted that the standards for qualifying for such breaks had been raised last year.
Policy Response to Inward Spillovers
33. In the event of a worsening of the outlook, staff argued that the policy response
should depend on the nature of the shock:
In case of a significant worsening of the terms of trade, due for example to a persistent growth
slowdown in large emerging market economies, the exchange rate should be the main shock
absorber. Reserves and liquidity buffers could be used to smooth out excess volatility and
CFMs can be unwound if there are disruptive portfolio outflows. Since the terms of trade
decline could be long-lasting, a counter-cyclical fiscal policy response is unlikely to be
appropriate.
In case of sharply lower regional growth, which would likely be temporary, automatic fiscal
stabilizers could be used to buffer the shock, but within limits, given the adverse implications
for public debt dynamics. International reserves, liquidity buffers, adjustments to reserve
requirements could be used to curb excessive volatility.
The authorities agreed on the important role of exchange rate flexibility in buffering shocks. They
also considered that Uruguay’s strong liquidity buffers would afford a fiscal policy response, at
least through automatic stabilizers.
Follow-up on the FSAP Recommendations
34. The authorities have taken several important steps to enhance financial stability
over the past year, in line with the recommendations of the 2012 FSAP update (Box 5).
Good progress has been made in several priority areas, including enhancing the resources of the
central bank’s Financial Services Superintendency (SSF), and bolstering crisis preparedness, stress
testing, and the supervisory process.
URUGUAY
INTERNATIONAL MONETARY FUND 17
35. Several measures to enhance supervision will be adopted in 2014, including:
Creation of a new unit a dedicated to operational supervision and the addition of three new
financial analysts to enhance SSF resources in this area.
Creation of a new unit dedicated to capital market supervision.
Creation of a new unit on authorizations to improve the due process and handling of
requests made by financial institutions to the superintendency.
An increase in the financial and human resources of the SSF by converting twenty temporary
externally-funded staff to permanent positions, and adding an analyst dedicated to monitor
BROU, the state-owned bank that accounts for about 40 percent of bank assets in Uruguay.
A review of the internal structure of the SSF and its supervisory methodology to enhance
risk-based supervision. The SSF is also initiating an international certification process
(ISO9000) for its different activities and processes, including regulation, authorization,
financial intelligence, and customer service. In 2014, the ISO certification process will cover
the supervisory process, infrastructure, and sanctions.
36. In the areas of supervisory process and contingency planning, the SSF has taken a
number of important steps. By end-2013, banks will submit the results of their first capital
adequacy evaluation. The SSF is also considering a more stringent stress testing exercise, which
will be used to establish capital surcharges for individual banks in 2014 in line with adopting
Pillar II. The SSF is also coordinating closely with COPAB, the deposit insurance fund, to propose
legal reforms to improve the exchange of information and coordinate action in the event of bank
resolution. In 2014, the SSF will conduct a profound independent assessment of the private
pension system, including a review of the strategy and business model of the BSE, the public
insurance company that provides annuities. In addition, progress has been made in establishing
international-standards of securities regulation, with new rules on corporate governance, insider
reporting, and takeover bids having come into effect in February 2013.
37. The authorities have also continued to strengthen their regulatory framework.
Significant progress has been made with the implementation of Basel II and III. Additional capital
requirements were introduced in 2013 to cover market and operational risks, and a capital
surcharge (capped at 2 percent) is being applied for systemically important banks. Moreover, the
central bank has updated its roadmap to implement remaining elements of Basel III, such as the
net stable funding ratio and liquidity coverage ratio, which should be in place by 2018.
Bolstering the Medium-Term Prospects
38. A medium-term potential growth rate of four percent is feasible but will require
policy actions in several areas. In particular, total factor productivity growth would need to stay
high and human and physical capital accumulation would need to strengthen to offset the drag
from lower labor force growth.

URUGUAY
18 INTERNATIONAL MONETARY FUND
39. An efficient labor market would bolster Uruguay’s growth potential and reinforce
the resilience of employment to shocks. Certain aspects of labor market efficiency continue
being reported as the most problematic aspects of doing business in Uruguay (e.g., in the 2013
Global Competitiveness Report of the World Economic Forum). There would be merit in
reviewing the changes introduced to the labor market regulations in recent years, and consider
changes to ensure a good balance between the requirements of a dynamic labor market and
appropriate protection for workers.
40. Infrastructure investments are also needed to sustain strong potential growth. Staff
welcomes the advances in diversifying Uruguay’s energy supply. Half of the energy supply will be
based on renewable sources by 2015, with the diversification helping to reduce the impact of
droughts on public balances—through UTE’s finances. However, delays in tackling infrastructure
gaps—ports and roads—through private-public partnerships remain to be addressed.
41. There is room to deepen financial markets and enhance the efficiency of the
financial sector. Higher competition across banks and lower costs would help ensure a better
and wider range of services to households and SMEs. The authorities highlighted that the
financial inclusion law that is currently being discussed in Congress would improve access to
finance by currently excluded segments (e.g. lower-income households and micro enterprises),
expand the range of services available, reduce costs, promote youth savings, and encourage
formalization and electronic payments. As regards the development of capital markets, staff
reiterated the FSAP recommendation that easing the domestic investment mandate of pension
funds could support the development of capital markets. Following up on another FSAP
recommendation to offer more than one portfolio option for pension contributors (in order to
achieve a more efficient trade-off between safety and return along the lifecycle), the authorities
noted that a draft law being considered by Congress would allow private pension funds to offer
their clients two portfolio options as opposed to a single one, thus helping them better align
their portfolio choice with their investment objectives.
0
0.2
0.4
0.6
0.8
1
Flexibility of wage
determination
Alignment
between
pay and
productivity
Cooperation in
labor-employer
relations
Hiring and firing
practices
Redundancy costs,
weeks of salary
2006
2013
Selected Indicators of Labor Market Efficiency 1/
Source: World Economic Outlook and 2013 Global Competitiveness Report of World
Economic Forum.
1/ A value of 1 indicates the country is ranked last.
BRA
CHL
COLMEX
PER
Uruguay
2
2.5
3
3.5
4
4.5
5
5.5
6
0.00 0.05 0.10 0.15 0.20
Flexi
bili
ty o
f w
ag
e d
ete
rmin
atio
na a
nd
alig
nm
ent
of
pay
with p
rod
uct
ivity
(sim
ple
ave
rag
e) 1/
Employment volatility (2007-2012)
1/ Lower y-axis value means less flexibility.
Flexibility of Wage Determination and Employment Volatility
(Emerging Markets in LAC, Asia, Africa and Europe)
URUGUAY
INTERNATIONAL MONETARY FUND 19
42. There has been continued progress on meeting international tax standards and in
strengthening Uruguay’s AML/CFT regime. To comply with international tax standards, the
government has signed 12 double taxation treaties and 11 tax information exchange treaties (1
and 6 of each, respectively, are pending parliamentary approvals in Uruguay and/or the partner
country). In addition, negotiations for 7 double taxation treaties and 6 tax information exchange
treaties are either complete or under way. Importantly, an information exchange treaty with
Argentina, which includes double taxation componentsbecame effective in February 2013. To
increase transparency, the Uruguayan authorities have also put in place a law requiring the
registration with BCU of all holdings of stocks and shares. Finally, the authorities expect that their
new financial inclusion lawwhich requires a number of commercial transactions to be done
electronicallywill strengthen the AML efforts.
43. The authorities have established a framework to appropriately manage the iron-ore
resources that may come on stream in the next few years. Under current prices, proven
reserves would generate exports of some US$1.5 billion per year (3 percent of 2012 GDP). A law
regulating large scale mining projects has just been approved by Congress (Box 6).6 The law sets
out a taxation regime in line with contemporary international standards and would create an
intergenerational sovereign wealth fund that would receive 70 percent of mining related
government revenues. On potential Dutch disease risks, staff and the authorities agreed that the
relatively moderate amount of spending out of export revenues limited the risks of a significant
real appreciation. While recognizing that mining projects to be politically sustainable are
expected to provide a source of financial support for local social and economic development,
staff recommended any spending financed by mining revenues to be designed in a way that
does not create budgetary risks from the finite and potentially volatile nature of the mining
revenue.
STAFF APPRAISAL
44. The outlook for the Uruguayan economy is solid, but risks and challenges remain.
After a decade of strong expansion, growth has moderated to a more sustainable pace. External
demand has weakened, but domestic consumption and investment remain robust. Inflation
persists above the target range. The current account deficit has widened but is expected to
narrow as external demand gradually recovers. Foreign direct investment is poised to stay strong.
45. Risks to the outlook stem from global, regional and domestic factors. Global
downside risk scenarios include a lasting drop in export commodity prices and tighter global
financial conditions. The prospects for regional trading partners could also imply some downside
risks for Uruguay, with potential spillovers through trade, tourism and FDI. On the domestic front,
6 The Selected Issues Paper The Fiscal Regime for Large-Scale Mining in Uruguay, by Victor Kitange, provides a
review of the new fiscal regime applicable to large-scale mining in Uruguay and gives a preliminary forecast of
potential government revenue from the Valentines iron-ore mining project.

URUGUAY
20 INTERNATIONAL MONETARY FUND
continued strong increases in labor costs could stoke higher inflation and further real
appreciation, hurting export competitiveness and eventually, growth.
46. Macro-financial vulnerabilities are contained. Uruguay’s financial system is not likely
to act as an amplifier of external shocks given its small size and muted links to the real sector;
banks are well regulated and their balance sheets generally appear robust. The central bank and
commercial banks have sizable net foreign asset positions. Public debt vulnerabilities are low:
astute debt management in recent years has brought the share of domestic currency debt to
above 50 percent and the average maturity of debt is high. The central government also has a
comfortable level of liquid foreign assets and contingent credit lines.
47. The authorities have made good progress towards implementing the
recommendations of the 2012 FSAP. Staff welcomes the steps taken to enhance the resources
of the SSF, improve crisis preparedness and stress testing, and upgrade the supervisory process.
48. The extension of the CFM to locally-issued government securities was warranted by
macroeconomic conditions. At the time of the broadening of the CFM there was little scope to
counteract currency appreciation pressures from portfolio inflows with monetary easing or
prompt fiscal tightening. Such capital flow management measures, however, should be
temporary; it would be advisable to remove them once there is clear evidence that the capital
inflow surge has abated.
49. Inflation persisting above the ceiling of the BCU’s target band remains an
important macroeconomic policy issue. High inflation and expectations reduce the scope for
monetary policy easing in response to a negative shock, they also raise macroeconomic
uncertainty and have an adverse impact on lower income groups. The mission welcomes the
tightening of the monetary policy stance over the last two months that is evidenced by the rise in
nominal peso yields.
50. The recent change in the operational target for monetary policy has raised new
practical challenges and put an extra premium on communication. Additional efforts by the
central bank to communicate its targeted monetary policy stance and inflation goal would help
market participants adapt to a new operational framework and smooth market volatility. Going
forward, the effectiveness of the new framework in delivering the inflation targets needs to be
monitored.
51. A moderation in wage growth is a critical pillar in supporting the goal of lowering
inflation and bolstering employment. Real wage growth has exceeded the growth of
aggregate output per worker in recent years, and the ensuing growth in real unit labor costs has
contributed to inflation. Prudent real wage growth would also curb the risk of overheating and
safeguard competitiveness. Reducing backward-indexation in wage contracts and thereby the
downward rigidity of real wages is also crucial for raising the resilience of labor demand against
adverse shocks. The authorities’ recent guidelines for the possible design of non-indexed wages
are an important step in this regard and should be promoted strongly.
URUGUAY
INTERNATIONAL MONETARY FUND 21
52. A tighter fiscal policy stance would be better aligned with the goal of reducing
inflation. The deficit has decreased this year mostly due the phasing-out of one-off factors. But
fiscal policy will be neutral or provide a small positive impulse this year following a positive
impulse last year. With still tight labor market conditions and output growth around potential, a
tighter fiscal stance would help alleviate some of the burden on monetary policy in the task of
taming inflation.
53. A lower fiscal deficit would also help keep net debt on a firmly downward-sloping
path. Keeping net public debt on a firm downward sloping path remains desirable given the
uncertain external outlook for the years ahead. Returning the overall deficit of the public sector
to 1 percent of GDP by the medium term—in line with last year’s budget projections—would be
consistent with that goal. To lower the deficit, slowing the growth of spending would be
desirable (shielding much-needed infrastructure investments and spending that protects the
poor), but since discretionary expenditures account for a relatively small share of the total, new
revenues may also be needed.
54. In the event of a worsening of the outlook, the policy response should depend on
the nature of the shock. In case of a significant worsening of the terms of trade, due for
example to a persistent growth slowdown in large emerging market economies, the exchange
rate should be the main shock absorber. Reserves and liquidity buffers could be used to smooth
out any excess volatility and CFMs (if still in force) can be unwound if there are disruptive
portfolio outflows. Since the terms of trade decline in such a scenario could be long-lasting, a
counter-cyclical fiscal policy response is unlikely to be appropriate. In case of sharply lower
regional growth, which would likely be temporary, automatic fiscal stabilizers could be used to
buffer the shock, but within limits, given the desirability of maintaining prudent public debt
dynamics. International reserves, liquidity buffers, and reserve requirements could be used to
curb excessive volatility.
55. The medium-term outlook for Uruguay is generally favorable but will require
various policy actions to maintain solid and stable growth. Specifically, boosting public
infrastructure and raising the efficiency of labor markets would help sustain high productivity and
investment growth, and enhance competitiveness. Improving access to finance and spurring
capital market development would increase the financial sector’s contribution to growth.
56. Staff proposes that Uruguay remains on the 12-month Article IV consultation cycle.
URUGUAY
22 INTERNATIONAL MONETARY FUND
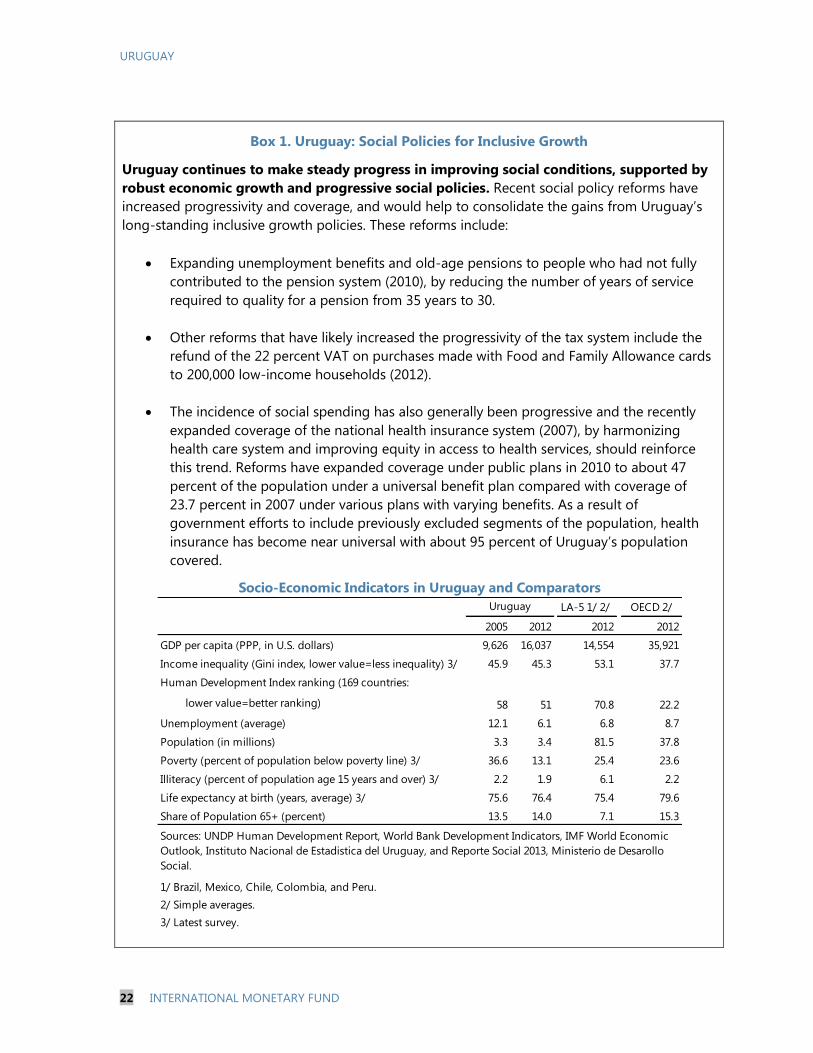
Box 1. Uruguay: Social Policies for Inclusive Growth
Uruguay continues to make steady progress in improving social conditions, supported by
robust economic growth and progressive social policies. Recent social policy reforms have
increased progressivity and coverage, and would help to consolidate the gains from Uruguay’s
long-standing inclusive growth policies. These reforms include:
Expanding unemployment benefits and old-age pensions to people who had not fully
contributed to the pension system (2010), by reducing the number of years of service
required to quality for a pension from 35 years to 30.
Other reforms that have likely increased the progressivity of the tax system include the
refund of the 22 percent VAT on purchases made with Food and Family Allowance cards
to 200,000 low-income households (2012).
The incidence of social spending has also generally been progressive and the recently
expanded coverage of the national health insurance system (2007), by harmonizing
health care system and improving equity in access to health services, should reinforce
this trend. Reforms have expanded coverage under public plans in 2010 to about 47
percent of the population under a universal benefit plan compared with coverage of
23.7 percent in 2007 under various plans with varying benefits. As a result of
government efforts to include previously excluded segments of the population, health
insurance has become near universal with about 95 percent of Uruguay’s population
covered.
LA-5 1/ 2/ OECD 2/
2005 2012 2012 2012
GDP per capita (PPP, in U.S. dollars) 9,626 16,037 14,554 35,921
Income inequality (Gini index, lower value=less inequality) 3/ 45.9 45.3 53.1 37.7
Human Development Index ranking (169 countries:
lower value=better ranking) 58 51 70.8 22.2
Unemployment (average) 12.1 6.1 6.8 8.7
Population (in millions) 3.3 3.4 81.5 37.8
Poverty (percent of population below poverty line) 3/ 36.6 13.1 25.4 23.6
Illiteracy (percent of population age 15 years and over) 3/ 2.2 1.9 6.1 2.2
Life expectancy at birth (years, average) 3/ 75.6 76.4 75.4 79.6
Share of Population 65+ (percent) 13.5 14.0 7.1 15.3
1/ Brazil, Mexico, Chile, Colombia, and Peru.
2/ Simple averages.
3/ Latest survey.
Socio-Economic Indicators in Uruguay and Comparators
Uruguay
Sources: UNDP Human Development Report, World Bank Development Indicators, IMF World Economic
Outlook, Instituto Nacional de Estadistica del Uruguay, and Reporte Social 2013, Ministerio de Desarollo
Social.
URUGUAY
INTERNATIONAL MONETARY FUND 23
Box 2. Uruguay’s Capital Flow Management Measures
Portfolio flows into Uruguay rose strongly in early 2012 as the country regained an investment
grade sovereign rating, its interest differentials widened, and global risk appetite improved.
Strong inflows into the public securities market added to the appreciation pressures arising from
high FDI and the relatively strong performance of the Uruguayan economy. In response, the
authorities introduced capital flow management measures in two steps:
At first, most of the portfolio inflows went into the market for short-maturity central bank
paper—letras de regulacion monetaria. Concerned with the interference of the inflows with
monetary policy operations, the Central Bank of Uruguay announced in August 2012 a 40
percent reserve requirement on nonresidents’ purchases of letras effective October 1, 2012.
After the announcement of the reserve requirement on letras, nonresidents’ purchases of letras
waned, but purchases of central government paper surged. Appreciation pressures continued,
with the central bank stepping up its pace of foreign currency purchases and sterilizing the
monetary expansion by issuing letras. Between February 2012 and May 2013, non-residents
holdings of locally-issued central government securities denominated in local currency rose by
US$2.6 billion—from 2 to 45 percent of the outstanding stock. On May 22, 2013, the authorities
announced they would introduce a 50 percent reserve requirement on nonresidents’ purchases
of central government paper effective July 2013. They also raised the existing reserve
requirement on purchases of letras from 40 to 50 percent.
Nonresidents’ purchases slowed to a near stop in June. The stop in purchases occurred after the
authorities announced they would extend the reserve requirement on non-residents’ purchases of
central bank paper to purchases of central
government paper, which coincided with the
Fed’s May 22 tapering announcement that
triggered generalized depreciation pressures
on emerging market currencies. Although
the Uruguayan peso had bucked the
depreciation trend among emerging market
currencies in the first three weeks of May, in
the two weeks following May 22 it
depreciated by about 8 percent against the
U.S. dollar.
0.0
0.5
1.0
1.5
2.0
2.5
3.0
3.5
0.0
0.5
1.0
1.5
2.0
2.5
3.0
3.5
Sep-11 Mar-12 Sep-12 Mar-13 Sep-13
Central government securities
Central bank securities
Source: Banco Central del Uruguay.
1/ Locally-issued securities.
Peso-Denominated Securities Held by Non-Residents 1/(Billions of Jan. 2012 dollars)
Reserve requirement introduced for foreign purchases of central bankpaper
Reserve requirement introduced for central gov. paper

URUGUAY
24 INTERNATIONAL MONETARY FUND
Box 3. Uruguay: Assessment of Balance of Payments Stability
Staff’s assessment is that the peso is slightly overvalued but stability risks remain contained.
Uruguay’s real effective exchange rate (REER) has appreciated over the last decade and is now about
40 percent above its pre-2002 crisis levels. Much of the appreciation, until recently, reflected
Uruguay’s stronger fundamentals—high commodity prices and productivity gains, supported by
strong FDI flows. During 2012, surging capital inflows and weakening performance in key trading
partners widened the current account deficit (CAD) and added to the appreciation pressures. Although
this led to concerns about the competitiveness of the economy, CGER and EBA estimates suggest that
the CAD is close to its estimated norms. Specifically, the widening of the CAD to 5.4 percent of GDP in
2012 was partly associated with transient factors - higher capital goods imports (due to the
construction of the Montes del Plata pulp mill) and higher imports of oil (due to a drought). Lower
tourism earnings and industrial exports due to foreign exchange restrictions in Argentina and slower
growth in Brazil and Europe also weighed on the current account in 2012. As these factors gradually
dissipate, the current account deficit is expected to narrow to about 3.5 percent of GDP over the
medium term, close to the MB
and EBA norms1. At the same
time, the CGER Equilibrium Real
Exchange Rate approach
suggests that as of July 2013 the
currency was about 10 percent
stronger than levels consistent
with Uruguay’s fundamentals.
The depreciation of the peso
against the U.S. dollar in August
does not change the thrust of
this assessment since the change
in Uruguay’s REER was limited
(as Uruguay’s main emerging
market trading partners also
experienced depreciations).
(Continued)
I. CGER Macroeconomic Balance (MB) approach -1.3
II. CGER External Sustainability (ES) approach 3.3
III. CGER Equilibrium Real Exchange Rate (ERER) approach 2/ 8.8
IV. EBA - Current Account Model 3/ 3.2
Memo Item:
Big Mac Index 4/ 9.3Average 4.1
Source: Fund staff calculations.
1/ Positive values indicate overvaluation.
2 / Considers the REER as of June 2013, unless otherwise stated.
3/ Using the 2012 EBA CA gap to gauge the REER gap.
4/ July 2013.
Exchange Rate Assessment
Deviation from equilibrium (in percent) 1/

URUGUAY
INTERNATIONAL MONETARY FUND 25
Box 3. Uruguay: Assessment of Balance of Payments Stability (Concluded)
A steady inflow of FDI has more than financed the current account deficit in recent years. The
deterioration in the net international investment position since 2004-09 mainly reflects higher FDI
liabilities. Uruguay’s international reserves amply exceed various prudential benchmarks, such as the
sum of short-term external debt and nonresident deposits; they are also high as a ratio to monthly
imports. These factors increase the resilience to withstand external shocks, including a reversal of
portfolio capital flows.
_________________________
1/The MB approach calculates the difference between the medium-term current account (CA) balance and an estimated
equilibrium CA "norm". The ES approach calculates the difference between the actual CA balance and the NFA-stabilizing CA
balance. The real exchange rate gap is calculated to bring the current account balance in line with its NFA-stabilizing level or
medium-term MB norm. The ERER is estimated as a function of medium-term fundamentals.
2004-09 (avg) 2011 2012
In billions of U.S. dollars (latest) 1/ 15.2 Assets 88.7 65.0 63.3
In months of imports (2012) 12.3 Of which:
In percent of: Portfolio investment 10.8 9.5 8.5
GDP (2012) 30.5 Currency and deposits 48.9 29.1 24.5
Short-term (ST) debt (end-2012) 238.0 Reserve assets 19.0 22.9 26.0
ST debt and foreign currency deposits (Q2 2013) 107.3 Liabilities 96.4 75.0 77.8
ST debt and nonresident deposits (Q2 2013) 145.0 Of which:
M2 (latest) 179.8 FDI 22.8 33.6 34.0
M3 (latest) 63.5 Portfolio investment 27.5 20.0 21.4
Memo items: Loans 24.1 10.3 11.1
IMF's new reserve adequacy metric range in General government 13.1 6.5 5.5
US$, billions (2013Q1) BCU 5.9 0.0 1.5
Banks foreign assets (US$, billions) 8.8 Other 3.1 2.5 4.2
Ratio of gross reserves plus banks' foreign assets to
ST debt plus foreign currency deposits (percent)169.0
Nonresident deposits 13.4 7.6 7.4
Net position -7.7 -9.9 -14.5
Sources: Banco Central del Uruguay and Fund staff calculations.
1/July 2013.
Sources: Banco Central del Uruguay (BCU), World Economic
Outlook and Fund staff calculations.
Gross International Reserves
3.9 to 5.9
International Investment Position, 2004-12
(In percent of GDP)

URUGUAY
26 INTERNATIONAL MONETARY FUND
Box 4. Uruguay: Public Debt Management Operations
The Uruguayan government has continued implementing its pro-active debt management
strategy that has improved the structure of Uruguay’s central government debt significantly. As
a result of this ongoing strategy, the average maturity of central government debt stands around 11
years and the share of local currency debt in total central government debt is close to 60 percent.
The key debt operations over the past year included:
Liability management. In November 2012, the government issued US$500 million of a new
benchmark bond maturing in 2045, and exchanged US$352 million in short-term debt for the new
2045 bond.
Loan prepayments and new contingency credit lines.
In January 2013, the authorities pre-paid a US$520
million loan to the IDB, making significant savings
on interest costs in NPV terms, while signing a new
policy loan of US$550 million with a deferred
disbursement option as part of Uruguay’s strategy
to build a strong safety net of contingent credit
lines.
Maturity re-profiling and build-up of liquidity
buffers. In July 2013, the government issued
US$2 billion due in 2024 with an amortization schedule concentrated in the three years up to
maturity. Half of the proceeds were used to repurchase more expensive and shorter-maturity debt,
while the other half will remain in liquid assets. With this operation, the government has pre-
financed its interest and amortization obligations through the end of 2014. In addition, the
government has also announced a new issuance calendar totaling US$438.6 million in peso-
denominated debt for the next six months, which aims at building liquid buffers.
InstitutionAmount
(US mn)
Maturity
(years)Conditionality
World Bank 520 20.5 No
IDB 550 14.3 No
CAF 400 7.0 No
FLAR 470 0.5 No
Total 1940
Source: MEF - Debt Management Office, IFIs.
Uruguay: Contingent Credit Lines
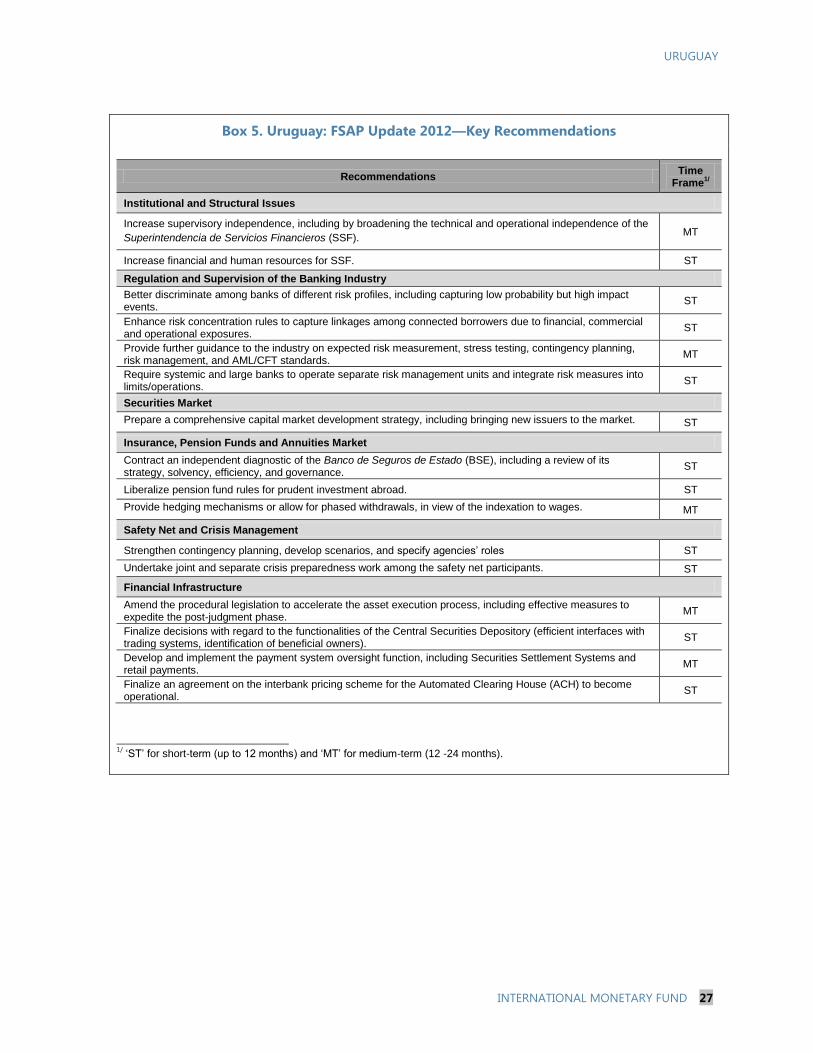
URUGUAY
INTERNATIONAL MONETARY FUND 27
Box 5. Uruguay: FSAP Update 2012––Key Recommendations
Recommendations Time
Frame1/
Institutional and Structural Issues
Increase supervisory independence, including by broadening the technical and operational independence of the
Superintendencia de Servicios Financieros (SSF). MT
Increase financial and human resources for SSF. ST
Regulation and Supervision of the Banking Industry
Better discriminate among banks of different risk profiles, including capturing low probability but high impact events.
ST
Enhance risk concentration rules to capture linkages among connected borrowers due to financial, commercial and operational exposures.
ST
Provide further guidance to the industry on expected risk measurement, stress testing, contingency planning, risk management, and AML/CFT standards.
MT
Require systemic and large banks to operate separate risk management units and integrate risk measures into limits/operations.
ST
Securities Market
Prepare a comprehensive capital market development strategy, including bringing new issuers to the market. ST
Insurance, Pension Funds and Annuities Market
Contract an independent diagnostic of the Banco de Seguros de Estado (BSE), including a review of its strategy, solvency, efficiency, and governance.
ST
Liberalize pension fund rules for prudent investment abroad. ST
Provide hedging mechanisms or allow for phased withdrawals, in view of the indexation to wages. MT
Safety Net and Crisis Management
Strengthen contingency planning, develop scenarios, and specify agencies’ roles ST
Undertake joint and separate crisis preparedness work among the safety net participants. ST
Financial Infrastructure
Amend the procedural legislation to accelerate the asset execution process, including effective measures to expedite the post-judgment phase.
MT
Finalize decisions with regard to the functionalities of the Central Securities Depository (efficient interfaces with trading systems, identification of beneficial owners).
ST
Develop and implement the payment system oversight function, including Securities Settlement Systems and retail payments.
MT
Finalize an agreement on the interbank pricing scheme for the Automated Clearing House (ACH) to become operational.
ST
_______________________________________ 1/
‘ST’ for short-term (up to 12 months) and ‘MT’ for medium-term (12 -24 months).

URUGUAY
28 INTERNATIONAL MONETARY FUND
Box 6. Uruguay: New Legislation on Large-Scale Mining
A law providing guidelines for investment in large-scale mining was approved in early
September by Uruguay’s legislature. The passage of the law enables the exploitation of iron
deposits in central Uruguay. The project, estimated to require an investment of US$3 billion, would
have a life span of 20–30 years and based on proven reserves could produce 18 million tons of iron
ore per year, generating exports of about US$1.5 billion per year (3 percent of 2012 GDP) at current
prices. The timeline of the project remains uncertain.
In addition to environmental guidelines, the law sets out a taxation regime and a revenue
allocation mechanism:
The taxation regime would include a royalty on revenues (production canon), income tax - IRAE
and an additional corporate income tax (tax on economic activity—additional IRAE). The
additional tax rate would be progressive and depend on the net operating margin (NOM, net
operating surplus/operational revenues) given by (0.9 x NOM-0.25). An international reference
price would be set as a floor for the valuation of operational revenues. Mineral taxation regimes
vary widely by country, and no one regime fits all, but the proposed taxation regime in the law is
broadly in line with the Fund staff recommendations to countries with natural resources (a simple
flat loyalty, an income tax, and a rent tax).
The law creates a new sovereign intergenerational investment fund (FSII) with the broad objective
of ensuring intergenerational equity in the use of natural resources.
Tax revenues arising from mining projects would be identified in the budget as revenues from
large scale mining projects, with 70 percent of the revenues flowing into the FSII and the
remaining 30 percent of revenues being directed to the “geographical areas of influence” of the
mining activity, including for local economic development projects on infrastructure,
environmental projects, and strengthening public technical capacity.
The FSII would be managed by a governmental committee, comprised of the Ministers of the
Economy and Finance, Industry, Energy and Mining, Housing, Environment, Agriculture, Office of
Planning and Budget, or technical specialists designated by them. The committee would be
responsible for designing the strategic investment guidelines and supervising and evaluating their
implementation.
The investments would be administered by the Asset Management Division of the Central Bank of
Uruguay, which would also advise the managing committee on the investment strategy.
(Continued)

URUGUAY
INTERNATIONAL MONETARY FUND 29
Box 6. Uruguay: Draft Law on Large-Scale Mining (Concluded)
The funds of the FSII could be invested in Uruguayan sovereign and central bank securities,
traded securities issued by Uruguayan or foreign private enterprises (subject to the approval
of the financial supervisory agency), term deposits in local or foreign currency, and highly-
rated fixed income securities issued by multilateral organizations or foreign governments.
The amount invested in local currency assets would not exceed 20 percent of the total; there
would be limits on the share of non-fixed income securities and concentration as well. The
funds could also be used for paying down long-term external public debt and for financing
research and development projects, integration of technology into education, and projects
related to the mitigation of the effects of climate change.
As the revenues from extraction come on stream, the authorities would be advised to
integrate the investment decisions for the intergenerational wealth fund into an overall
sovereign asset-liability management framework. In such a framework, debt management
and investment decisions would be coordinated to minimize the risk to the sovereign balance
sheet, and paying down more expensive debt may be an option. Once the revenue is transferred
to the fund, it should be invested to maximize the financial return subject to an acceptable level
of risk set according to the fund’s objectives. Clear withdrawal triggers and mechanisms to
channel financial resources to specific public expenditure projects should also be put in place to
avoid political pressures, while earmarking revenues should be minimized to avoid procyclicality.
An essential governance principle is to establish a clear chain of governing bodies from the
legislature down to the individual asset managers, with accountability at every level. There
should be a clear and transparent division of roles between the fund’s owner (the state) and the
fund’s manager who implements a clearly defined investment strategy according to the mandate
set out by the owner. In this context, identifying clear objective for the fund and its time horizon
would determine the appropriate investment strategy and risk tolerance.

URUGUAY
30 INTERNATIONAL MONETARY FUND
Sources: World Economic Outlook, World Development Indicators, Haver Analytics, Ministerio de Economia y
Finanzas, Social Report 2013 and Fund staff calculations.
1/ Linear interpolation used to fill in missing data.
2/ LA5 includes Brazil, Chile, Colombia, Mexico, and Peru.
3/ Percent of households below poverty line
4/ Percent of population below poverty line (Rendicion de Cuentas, Ministerio de Economia y Finanzas, 2013)
0
1
2
3
4
5
6
7
8
9
0
1
2
3
4
5
6
7
8
9
1998 2000 2002 2004 2006 2008 2010 2012
Foreign Direct Investment
(In percent of GDP)
0
5
10
15
20
25
60
70
80
90
100
110
120
130
140
1998 2000 2002 2004 2006 2008 2010 2012
Real wage (index
2008=100, lhs)
Unemployment rate (rhs)
Unemployment Rate and Real Wages
30
40
50
60
70
80
30
40
50
60
70
80
1998 2000 2002 2004 2006 2008 2010
LA5 range 2/ Uruguay
GINI Index 1/ 2/
(0=Uniformly distributed ,100=Fully Concentrated)
0
2000
4000
6000
8000
10000
12000
14000
16000
18000
0
2000
4000
6000
8000
10000
12000
14000
16000
18000
1998 2000 2002 2004 2006 2008 2010 2012
GDP Per Capita in PPP
(In U.S. dollars)
Figure 1. Uruguay: Post-2002 Recovery
-12
-8
-4
0
4
8
12
16
-12
-8
-4
0
4
8
12
16
1998 2002 2006 2010 2014 2018
Estimated
Projected
Output Gap
(In percent of potential GDP)
0
10
20
30
40
50
60
70
80
90
0
10
20
30
40
50
60
70
80
90
1998 2000 2002 2004 2006 2008 2010 2012
Poverty Rate 1/
(In percent)LA5 range 2/ 3/
Uruguay 3/
Uruguay 4/

URUGUAY
INTERNATIONAL MONETARY FUND 31
Sources: World Economic Outlook, Haver Analytics, Centro de Estudios de la Realidad Economica y Social
(CERES), and Fund staff estimates and calculations.
1/ The 2013 figure for investment projects approved for tax relief under the investment promotion law
includes information through August and the investment-to-GDP ratio for 2013 includes the first half of the
year only.
2/ Balance of positive and negative expectations for the next 6 months.
-12
-8
-4
0
4
8
12
16
20
24
28
-12
-8
-4
0
4
8
12
16
20
24
28
2008Q2 2009Q2 2010Q2 2011Q2 2012Q2 2013Q2
Dom. dem
Net exports
GDP
Real Growth and Contributions
(In percent, y-o-y)
-25
-20
-15
-10
-5
0
5
10
15
20
25
-25
-20
-15
-10
-5
0
5
10
15
20
25
2010Q3 2011Q3 2012Q3 2013Q3
Own firm
Overall economy
Entrepreneurs' Expectations of Industrial
Activity 2/
(In percent, survey balance)
60
70
80
90
100
110
120
130
140
60
70
80
90
100
110
120
130
140
2008Q1 2009Q1 2010Q1 2011Q1 2012Q1 2013Q1
Domestic demand
Industrial production
Industrial Production and Domestic Demand
(4-quarter mva, index 2009=100)
-30
-20
-10
0
10
20
30
40
50
60
-40
-20
0
20
40
60
80
2007Q3 2009Q3 2011Q3 2013Q3
Volume of Goods Exports to Trading Partners
(4-quarter mva, y-o-y , in percent)
Argentina
Brazil
Eurozone
A B C D E F G H I J K L MN
0
5
10
15
20
25
30
2007 2008 2009 2010 2011 2012 2013
Investment Ratios 1/
(In percent of GDP)
Public investment
Private investment
projects approved for tax relief
Figure 2. Uruguay: Economic Activity
0.0
0.2
0.4
0.6
0.8
1.0
1.2
1.4
0.0
0.2
0.4
0.6
0.8
1.0
1.2
1.4
2008Q1 2010Q1 2012Q1 2013Q2
Tourism Flows between Uruguay and
Argentina
(4-quarter basis, in billions of US dollars)
Spending by Uruguayans in Argentina
Spending by Argentines in Uruguay
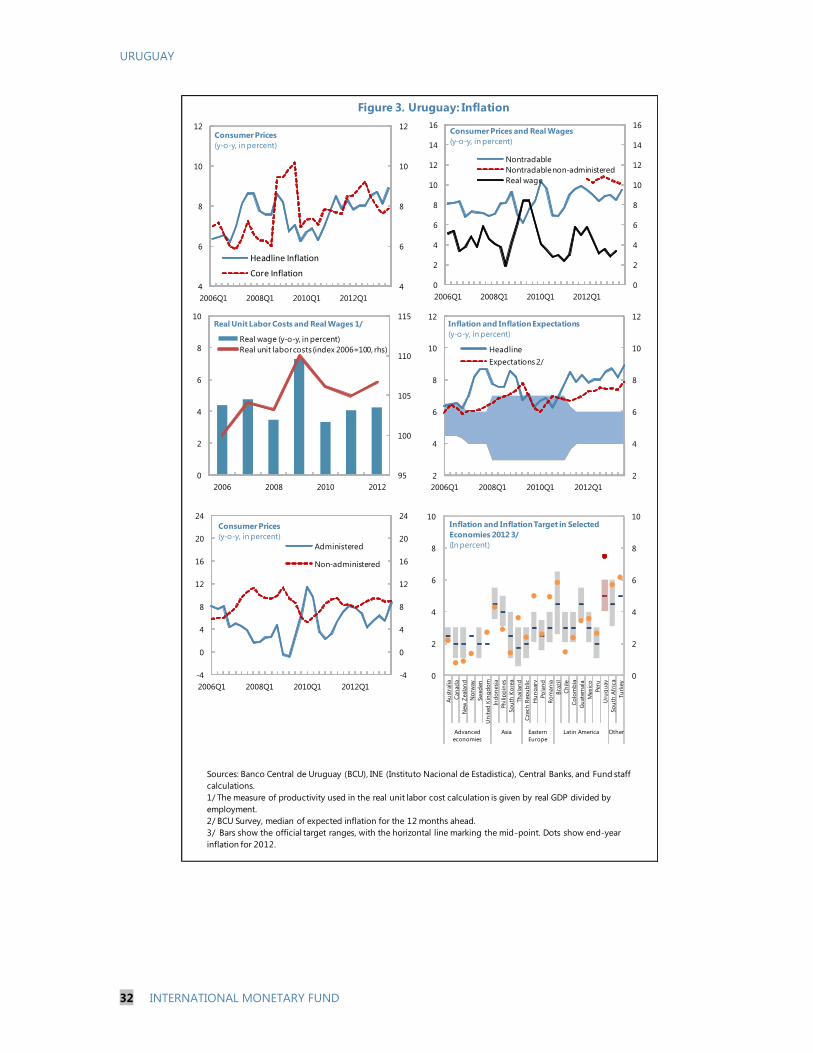
URUGUAY
32 INTERNATIONAL MONETARY FUND
Figure 3. Uruguay: Inflation
4
6
8
10
12
4
6
8
10
12
2006Q1 2008Q1 2010Q1 2012Q1
Headline Inflation
Core Inflation
Consumer Prices
(y-o-y, in percent)
0
2
4
6
8
10
12
14
16
0
2
4
6
8
10
12
14
16
2006Q1 2008Q1 2010Q1 2012Q1
Nontradable
Nontradable non-administered
Real wage
Consumer Prices and Real Wages
(y-o-y, in percent)
2
4
6
8
10
12
2
4
6
8
10
12
2006Q1 2008Q1 2010Q1 2012Q1
Headline
Expectations 2/
Inflation and Inflation Expectations
(y-o-y, in percent)
-4
0
4
8
12
16
20
24
-4
0
4
8
12
16
20
24
2006Q1 2008Q1 2010Q1 2012Q1
Administered
Non-administered
Consumer Prices
(y-o-y, in percent)
0
2
4
6
8
10
0
2
4
6
8
10
Au
stra
lia
Can
ad
a
New
Zeala
nd
No
rway
Sw
ed
en
Un
ited
Kin
gd
om
Ind
on
esi
a
Ph
ilip
pin
es
So
uth
Ko
rea
Th
ailan
d
Czech
Rep
ub
lic
Hu
ng
ary
Po
lan
d
Ro
man
ia
Bra
zil
Ch
ile
Co
lom
bia
Gu
ate
mala
Mexic
o
Peru
Uru
gu
ay
So
uth
Afr
ica
Tu
rkey
Advanced
economies
Asia Eastern
Europe
Latin America Other
Inflation and Inflation Target in Selected
Economies 2012 3/
(In percent)
Sources: Banco Central de Uruguay (BCU), INE (Instituto Nacional de Estadistica), Central Banks, and Fund staff
calculations.
1/ The measure of productivity used in the real unit labor cost calculation is given by real GDP divided by
employment.
2/ BCU Survey, median of expected inflation for the 12 months ahead.
3/ Bars show the official target ranges, with the horizontal line marking the mid-point. Dots show end-year
inflation for 2012.
95
100
105
110
115
0
2
4
6
8
10
2006 2008 2010 2012
Real Unit Labor Costs and Real Wages 1/
Real wage (y-o-y, in percent)
Real unit labor costs (index 2006=100, rhs)

URUGUAY
INTERNATIONAL MONETARY FUND 33
Figure 4. Uruguay: External Accounts
Sources: Banco Central de Uruguay (BCU), World Economic Outlook, Haver Analytics, and Fund staff calculations.
1/ Reserve data as of July 2013 divided by 2012 GDP.
100
110
120
130
140
150
160
170
180
190
80
85
90
95
100
105
110
2006 2007 2008 2009 2010 2011 2012 2013
Industrial Export Profitability(Index 2005 =100) Export profitability
Real effective
exchange rate (rhs)
0
50
100
150
200
250
300
0
50
100
150
200
250
300
1996 1998 2000 2002 2004 2006 2008 2010 2012
Current prices
2005 Constant prices
Exports of Goods and Services
(Index 2005=100)
-10
-5
0
5
10
15
-10
-5
0
5
10
15
2002 2004 2006 2008 2010 2012
Current Account Balance
(In percent of GDP, net)Services
Non-oil goods
Oil
Current Account
-15
-10
-5
0
5
10
15
20
-15
-10
-5
0
5
10
15
20
2002 2004 2006 2008 2010 2012
Financial Account Balance
(In percent of GDP, net)
Other
Portfolio
FDI
Financial Account
0
5
10
15
20
25
30
35
0
5
10
15
20
25
30
35
2002 2004 2006 2008 2010 2012
Gross Reserves 1/
(In percent of GDP)
-2
-1
0
1
2
3
4
5
-2
-1
0
1
2
3
4
5
2008 Q1 2009 Q1 2010 Q1 2011 Q1 2012 Q1 2013Q1
Services Balance of the Current Account
(4-quarter basis, in percent of GDP)
Other services (net)
Travel (net)
Transportation (net)
Services (net)

URUGUAY
34 INTERNATIONAL MONETARY FUND
Figure 5. Uruguay: Credit and Banking
Sources: World Economic Outlook, Banco Central del Uruguay (BCU), and Fund staff estimates and
calculations.
1/ BCU reports credit numbers in US$. Household credit is converted to pesos using the end of period
nominal exchange rate and deflated using CPI, since the majority of household credit is denominated in
local currency.
2/ LA5 includes Brazil, Chile, Colombia, Mexico, and Peru.
40
50
60
70
80
90
100
40
50
60
70
80
90
100
2006 2007 2008 2009 2010 2011 2012 2013
Credit
Deposit
Credit and Deposit Dollarization
(Foreign currency credit and deposits, in percent
of total)
45
50
55
60
65
70
75
2006 2007 2008 2009 2010 2011 2012 2013
45
50
55
60
65
70
75Loan to Deposits Ratio
(In percent)
0
5
10
15
20
0
5
10
15
20
2006 2007 2008 2009 2010 2011 2012 2013
NPL's (as share of total loans)
NPL's (as share of total
household loans)
Non-Performing Loans
(In percent)
0
2
4
6
8
10
12
14
16
18
0
2
4
6
8
10
12
14
16
18
2010Q1 2010Q4 2011Q3 2012Q2 2013Q1
Household
Non-household
Credit to Private Sector
(In percent of GDP)
-30
-20
-10
0
10
20
30
40
50
60
-30
-20
-10
0
10
20
30
40
50
60
2010 2011 2012 2013
Private firms (in US$)
Households (in real UY$)
Credit Growth by Sector 1/
(y-o-y, in percent)
-2
0
2
4
6
-2
0
2
4
6
2008 2009 2010 2011 2013
Return on Assets
(In percent) LA5 range 2/
Uruguay

URUGUAY
INTERNATIONAL MONETARY FUND 35
Figure 6. Uruguay: Monetary Developments
0
500
1000
1500
2000
2500
3000
3500
4000
4500
5000
0
5
10
15
20
25
30
35
40
5/2/2013 6/21/2013 8/10/2013 9/29/2013
Central Bank Notes: Tendered Amts.
and Rates 3/
(Letras de Regulacion Monetaria, LRM)
O/N rate
LRM (mn pesos, rhs)
2
4
6
8
10
12
14
16
18
20
2
4
6
8
10
12
14
16
18
20
O/N 1M 2M 3M 6M 9M 12M 24M 36M 48M 60M
Local Currency Yield Curve
(In percent)
5/20/2013
7/11/2013
8/21/2013
10/8/2013
70
80
90
100
110
120
130
140
0
40
80
120
160
200
240
280
320
360
400
2010 2011 2012 2013
FX intervention (Millions of US$, lhs) 1/
URY vs BRZ index (2010=100)
URY vs USD index (2010=100)
Foreign Exchange Intervention and
Exchange Rate
Sources: Banco Central del Uruguay, INE, BEVSA and Fund staff estimates and calculations.
1/ Positive values corresponds to foreign currency purchases.
2/ See details in selected issues paper "Why are inflation and inflation expectations above target in Uruguay?", IMF
country report No. 13/109.
3/ The first vertical line denotes an announcement of change in the framework (May 22 ). The second vertical line marks
the adoption of a new operational target (July 1).
0
5
10
15
20
25
30
35
0
5
10
15
20
25
30
35
2008q2 2009q2 2010q2 2011q2 2012q2 2013q2
Actual and Benchmark Policy Rates 2/
(In percent)
Policy rate
Taylor Rule (alpha=1.50 ; beta=0.50)
0
10
20
30
40
4
5
6
7
8
9
10
2006 2008 2010 2012 2014 2016
M1+ growth and Inflation
(in percent)
Inflation (y-o-y)
M1+ (y-o-y, rhs)Operational Target
0
10
20
30
40
0
5
10
15
20
2006 2008 2010 2012 2014 2016
Overnight (O/N) Rate and M1+ growth
(in percent)
O/N Rate (%)
M1+ (y-o-y, rhs)
Operational Target
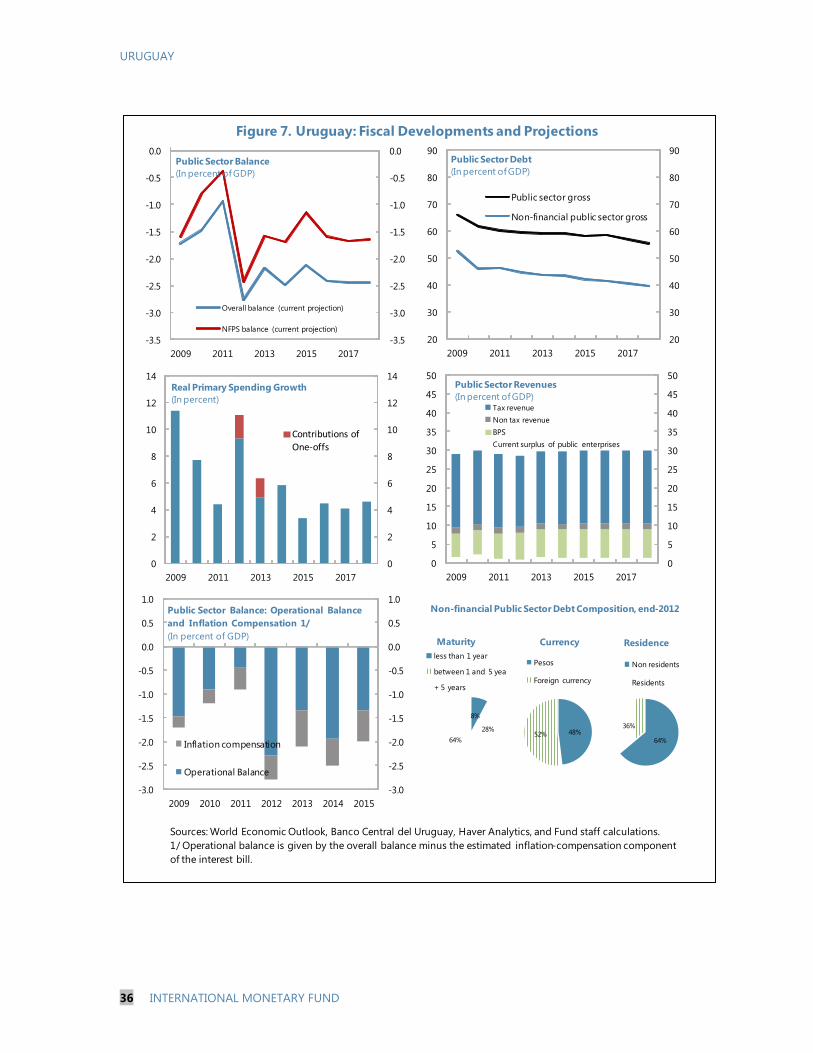
URUGUAY
36 INTERNATIONAL MONETARY FUND
-3.5
-3.0
-2.5
-2.0
-1.5
-1.0
-0.5
0.0
-3.5
-3.0
-2.5
-2.0
-1.5
-1.0
-0.5
0.0
2009 2011 2013 2015 2017
Public Sector Balance
(In percent of GDP)
Overall balance (current projection)
NFPS balance (current projection)
20
30
40
50
60
70
80
90
20
30
40
50
60
70
80
90
2009 2011 2013 2015 2017
Public Sector Debt
(In percent of GDP)
Public sector gross
Non-financial public sector gross
0
2
4
6
8
10
12
14
0
2
4
6
8
10
12
14
2009 2011 2013 2015 2017
Real Primary Spending Growth
(In percent)
Contributions of
One-offs
0
5
10
15
20
25
30
35
40
45
50
0
5
10
15
20
25
30
35
40
45
50
2009 2011 2013 2015 2017
Public Sector Revenues
(In percent of GDP)Tax revenue
Non tax revenue
BPS
Current surplus of public enterprises
Figure 7. Uruguay: Fiscal Developments and Projections
8%
28%
64%
Maturity
less than 1 year
between 1 and 5 years
+ 5 years
48%52%
Currency
Pesos
Foreign currency
64%
36%
Residence
Non residents
Residents
Non-financial Public Sector Debt Composition, end-2012
Sources: World Economic Outlook, Banco Central del Uruguay, Haver Analytics, and Fund staff calculations.
1/ Operational balance is given by the overall balance minus the estimated inflation-compensation component
of the interest bill.
-3.0
-2.5
-2.0
-1.5
-1.0
-0.5
0.0
0.5
1.0
-3.0
-2.5
-2.0
-1.5
-1.0
-0.5
0.0
0.5
1.0
2009 2010 2011 2012 2013 2014 2015
Public Sector Balance: Operational Balance
and Inflation Compensation 1/
(In percent of GDP)
Inflation compensation
Operational Balance
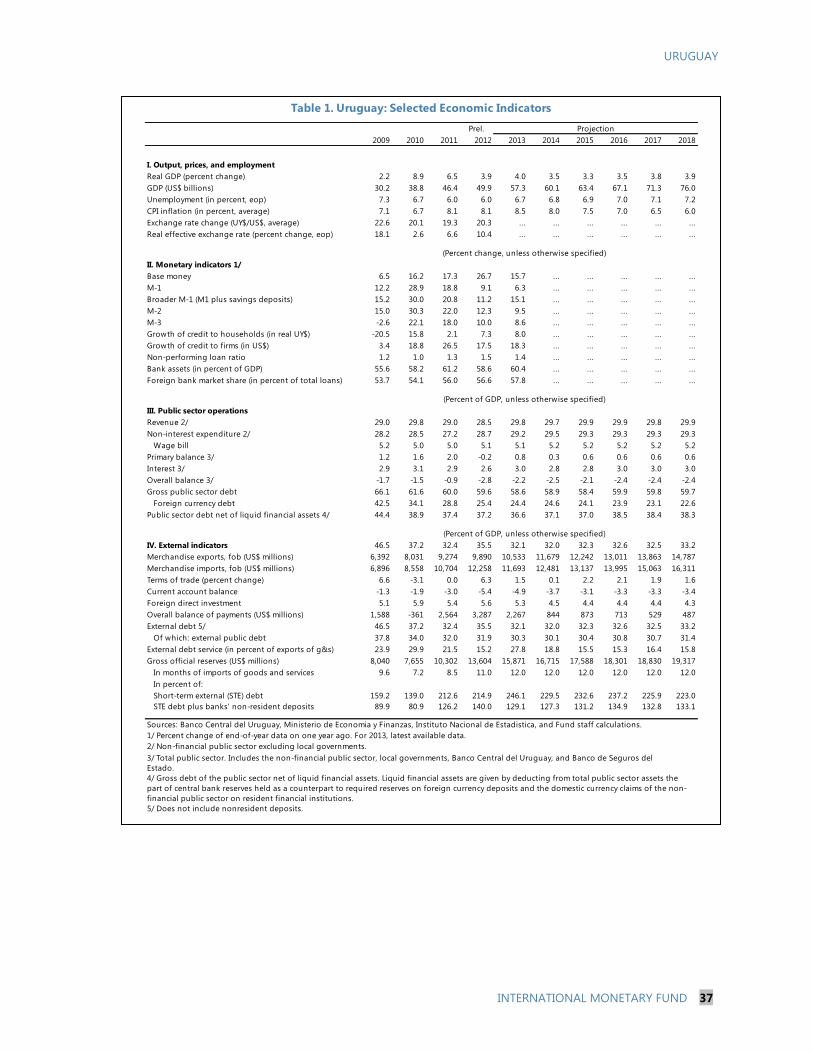
URUGUAY
INTERNATIONAL MONETARY FUND 37
Prel.
2009 2010 2011 2012 2013 2014 2015 2016 2017 2018
I. Output, prices, and employment
Real GDP (percent change) 2.2 8.9 6.5 3.9 4.0 3.5 3.3 3.5 3.8 3.9
GDP (US$ billions) 30.2 38.8 46.4 49.9 57.3 60.1 63.4 67.1 71.3 76.0
Unemployment (in percent, eop) 7.3 6.7 6.0 6.0 6.7 6.8 6.9 7.0 7.1 7.2
CPI inflation (in percent, average) 7.1 6.7 8.1 8.1 8.5 8.0 7.5 7.0 6.5 6.0
Exchange rate change (UY$/US$, average) 22.6 20.1 19.3 20.3 ... ... ... ... ... ...
Real effective exchange rate (percent change, eop) 18.1 2.6 6.6 10.4 ... ... ... ... ... ...
II. Monetary indicators 1/
Base money 6.5 16.2 17.3 26.7 15.7 ... ... ... ... ...
M-1 12.2 28.9 18.8 9.1 6.3 ... ... ... ... ...
Broader M-1 (M1 plus savings deposits) 15.2 30.0 20.8 11.2 15.1 ... ... ... ... ...
M-2 15.0 30.3 22.0 12.3 9.5 ... ... ... ... ...
M-3 -2.6 22.1 18.0 10.0 8.6 ... ... ... ... ...
Growth of credit to households (in real UY$) -20.5 15.8 2.1 7.3 8.0 ... ... ... ... ...
Growth of credit to firms (in US$) 3.4 18.8 26.5 17.5 18.3 ... ... ... ... ...
Non-performing loan ratio 1.2 1.0 1.3 1.5 1.4 ... ... ... ... ...
Bank assets (in percent of GDP) 55.6 58.2 61.2 58.6 60.4 ... ... ... ... ...
Foreign bank market share (in percent of total loans) 53.7 54.1 56.0 56.6 57.8 ... ... ... ... ...
III. Public sector operations
Revenue 2/ 29.0 29.8 29.0 28.5 29.8 29.7 29.9 29.9 29.8 29.9
Non-interest expenditure 2/ 28.2 28.5 27.2 28.7 29.2 29.5 29.3 29.3 29.3 29.3
Wage bill 5.2 5.0 5.0 5.1 5.1 5.2 5.2 5.2 5.2 5.2
Primary balance 3/ 1.2 1.6 2.0 -0.2 0.8 0.3 0.6 0.6 0.6 0.6
Interest 3/ 2.9 3.1 2.9 2.6 3.0 2.8 2.8 3.0 3.0 3.0
Overall balance 3/ -1.7 -1.5 -0.9 -2.8 -2.2 -2.5 -2.1 -2.4 -2.4 -2.4
Gross public sector debt 66.1 61.6 60.0 59.6 58.6 58.9 58.4 59.9 59.8 59.7
Foreign currency debt 42.5 34.1 28.8 25.4 24.4 24.6 24.1 23.9 23.1 22.6
Public sector debt net of liquid financial assets 4/ 44.4 38.9 37.4 37.2 36.6 37.1 37.0 38.5 38.4 38.3
IV. External indicators 46.5 37.2 32.4 35.5 32.1 32.0 32.3 32.6 32.5 33.2
Merchandise exports, fob (US$ millions) 6,392 8,031 9,274 9,890 10,533 11,679 12,242 13,011 13,863 14,787
Merchandise imports, fob (US$ millions) 6,896 8,558 10,704 12,258 11,693 12,481 13,137 13,995 15,063 16,311
Terms of trade (percent change) 6.6 -3.1 0.0 6.3 1.5 0.1 2.2 2.1 1.9 1.6
Current account balance -1.3 -1.9 -3.0 -5.4 -4.9 -3.7 -3.1 -3.3 -3.3 -3.4
Foreign direct investment 5.1 5.9 5.4 5.6 5.3 4.5 4.4 4.4 4.4 4.3
Overall balance of payments (US$ millions) 1,588 -361 2,564 3,287 2,267 844 873 713 529 487
External debt 5/ 46.5 37.2 32.4 35.5 32.1 32.0 32.3 32.6 32.5 33.2
Of which: external public debt 37.8 34.0 32.0 31.9 30.3 30.1 30.4 30.8 30.7 31.4
External debt service (in percent of exports of g&s) 23.9 29.9 21.5 15.2 27.8 18.8 15.5 15.3 16.4 15.8
Gross official reserves (US$ millions) 8,040 7,655 10,302 13,604 15,871 16,715 17,588 18,301 18,830 19,317
In months of imports of goods and services 9.6 7.2 8.5 11.0 12.0 12.0 12.0 12.0 12.0 12.0
In percent of:
Short-term external (STE) debt 159.2 139.0 212.6 214.9 246.1 229.5 232.6 237.2 225.9 223.0
STE debt plus banks' non-resident deposits 89.9 80.9 126.2 140.0 129.1 127.3 131.2 134.9 132.8 133.1
Sources: Banco Central del Uruguay, Ministerio de Economia y Finanzas, Instituto Nacional de Estadistica, and Fund staff calculations.
1/ Percent change of end-of-year data on one year ago. For 2013, latest available data.
2/ Non-financial public sector excluding local governments.
5/ Does not include nonresident deposits.
Table 1. Uruguay: Selected Economic Indicators
Projection
4/ Gross debt of the public sector net of liquid financial assets. Liquid financial assets are given by deducting from total public sector assets the
part of central bank reserves held as a counterpart to required reserves on foreign currency deposits and the domestic currency claims of the non-
financial public sector on resident financial institutions.
3/ Total public sector. Includes the non-financial public sector, local governments, Banco Central del Uruguay, and Banco de Seguros del
Estado.
(Percent change, unless otherwise specified)
(Percent of GDP, unless otherwise specified)
(Percent of GDP, unless otherwise specified)

URUGUAY
38 INTERNATIONAL MONETARY FUND
Prel.
2009 2010 2011 2012 2013 2014 2015
I. Primary balance of the non-financial public sector (IA+IB+IC) 8,722 12,918 18,594 -1,222 10,678 5,342 11,118
I.A. Primary balance of central government, BPS and NFPE 1/ 2/ 5,487 10,237 16,066 -2,416 7,245 2,705 8,183
Revenues 197,881 232,512 260,184 288,613 342,316 379,302 424,426
Taxes 134,055 152,175 174,974 191,253 219,901 245,757 273,322
Non tax 10,820 12,449 15,473 16,238 18,383 20,446 22,753
Social security 42,922 49,742 59,930 72,601 84,788 95,146 107,893
NFPE operating balance 2/ 10,084 18,146 9,807 8,520 19,243 17,953 20,457
Primary expenditures 192,394 222,275 244,118 291,029 335,071 376,598 416,242
Current 168,187 193,662 219,487 261,902 298,824 337,023 375,044
Capital 24,208 28,612 24,631 29,126 36,247 39,575 41,198
I.B. Primary balance of local governments 2,132 -167 929 -774 877 1,248 1,388
I.C. Primary balance of BSE 3/ 1,103 2,848 1,599 1,968 2,556 1,389 1,546
II. Primary balance of the BCU 4/ -653 -694 -783 -450 -1,510 -1,915 -2,131
III. Primary balance of the public sector (I+II) 8,069 12,224 17,811 -1,672 9,168 3,427 8,987
IV. Interest 19,850 23,804 26,186 26,369 34,129 35,351 39,125
of which: BCU 4/ 264 4,520 4,219 2,994 5,396 8,382 11,810
V. Overall balance of the public sector (III-IV) -11,781 -11,580 -8,375 -28,042 -24,960 -31,925 -30,138
I. Primary balance of the non-financial public sector (IA+IB+IC) 1.3 1.7 2.1 -0.1 0.9 0.4 0.8
IA. Primary balance of central government, BPS and NFPE 1/ 2/ 0.8 1.3 1.8 -0.2 0.6 0.2 0.6
Revenues 29.0 29.8 29.0 28.5 29.8 29.7 29.9
Taxes 19.6 19.5 19.5 18.9 19.2 19.3 19.2
Non tax 1.6 1.6 1.7 1.6 1.6 1.6 1.6
Social security 6.3 6.4 6.7 7.2 7.4 7.5 7.6
NFPE operating balance 2/ 1.5 2.3 1.1 0.8 1.7 1.4 1.4
Primary expenditures 28.2 28.5 27.2 28.7 29.2 29.5 29.3
Current 24.7 24.9 24.5 25.8 26.0 26.4 26.4
Capital 3.5 3.7 2.7 2.9 3.2 3.1 2.9
IB. Primary balance of local governments 0.3 0.0 0.1 -0.1 0.1 0.1 0.1
IC. Primary balance of BSE 3/ 0.2 0.4 0.2 0.2 0.2 0.1 0.1
II. Primary balance of BCU 4/ -0.1 -0.1 -0.1 0.0 -0.1 -0.2 -0.2
III. Primary balance of the public sector (I+II) 1.2 1.6 2.0 -0.2 0.8 0.3 0.6
IV. Interest 2.9 3.1 2.9 2.6 3.0 2.8 2.8
Of which: BCU 4/ 0.0 0.6 0.5 0.3 0.5 0.7 0.8
V. Overall balance of the public sector (III-IV) -1.7 -1.5 -0.9 -2.8 -2.2 -2.5 -2.1
Memorandum items
GDP (in millions of pesos) 682,216 779,226 896,849 1,013,878 1,147,792 1,276,602 1,420,623
Sources: Ministerio de Economia y Finanzas, Banco Central del Uruguay, and Fund staff calculations.
1/ Banco de Prevision Social (BPS).
2/ Non-financial public enterprises (NFPE).
3/ Banco de Seguros del Estado (BSE).
4/ Banco Central del Uruguay (BCU).
(In millions of pesos, unless otherwise indicated)
(In percent of GDP, unless otherwise indicated)
Table 2. Uruguay: Main Fiscal Aggregates
Projection

URUGUAY
INTERNATIONAL MONETARY FUND 39
Prel.
2009 2010 2011 2012 2013 2014 2015
Gross debt of the public sector 22,960 23,882 27,040 31,134 32,664 34,479 36,026
of which:
Non-financial public sector debt 18,254 17,814 20,825 23,465 24,995 26,810 28,357
Central bank debt 4,706 6,068 6,214 7,669 7,669 7,669 7,669
External debt of the public sector 13,117 13,182 14,436 16,649 16,879 17,627 18,788
Domestic debt of the public sector 9,843 10,700 12,604 14,485 15,786 16,852 17,238
Foreign-currency debt of the public sector 14,759 13,216 12,965 13,291 13,643 14,385 14,887
Short-term debt of the public sector (by remaining maturity) 3,514 4,530 4,624 6,113 6,231 6,338 6,443
Gross assets of the public sector 11,779 11,584 13,872 17,457 18,386 19,181 20,006
of which:
Financial assets of the non-financial public sector 2,838 2,902 2,693 3,049 3,211 3,350 3,494
Reserve assets of the central bank 8,941 8,682 11,180 14,408 15,175 15,831 16,513
Liquid assets of the public sector 2/ 7,541 8,793 10,177 11,708 12,247 12,743 13,216
Net public sector debt 11,181 12,298 13,168 13,677 14,278 15,298 16,020
Net public sector debt based on liquid financial assets 15,419 15,089 16,863 19,426 20,417 21,736 22,810
Gross debt of the public sector 66.1 61.6 60.0 59.6 58.5 58.9 58.4
of which:
Non-financial public sector debt 52.5 46.0 46.2 44.9 44.8 45.8 45.9
Central bank debt 13.5 15.7 13.8 14.7 13.7 13.1 12.4
External debt of the public sector 37.8 34.0 32.0 31.9 30.2 30.1 30.4
Domestic debt of the public sector 28.3 27.6 28.0 27.7 28.3 28.8 27.9
Foreign-currency debt of the public sector 42.5 34.1 28.8 25.4 24.4 24.6 24.1
Short-term debt of the public sector (by remaining maturity) 10.1 11.7 10.3 11.7 11.2 10.8 10.4
Gross assets of the public sector 33.9 29.9 30.8 33.4 32.9 32.8 32.4
of which:
Financial assets of the non-financial public sector 8.2 7.5 6.0 5.8 5.8 5.7 5.7
Liquid assets of the public sector 2/ 21.7 22.7 22.6 22.4 21.9 21.8 21.4
Net public sector debt 32.2 31.7 29.2 26.2 25.6 26.1 26.0
Net public sector debt based on liquid financial assets 44.4 38.9 37.4 37.2 36.6 37.1 37.0
Sources: Ministerio de Economia y Finanzas, Banco Central del Uruguay, and Fund staff calculations.
1/ Stocks are converted into pesos using the end of period exchange rate and divided by GDP.
2/ Liquid financial assets are given by deducting from total public sector assets the part of central bank reserves held as a counterpart to required reserves on
foreign currency deposits and the domestic currency claims of the non-financial public sector on resident financial institutions.
(In percent of GDP, unless otherwise indicated) 1/
Table 3. Uruguay: Public Sector Debt and Assets 1/
Projection
(In millions of U.S. dollars, unless otherwise indicated)
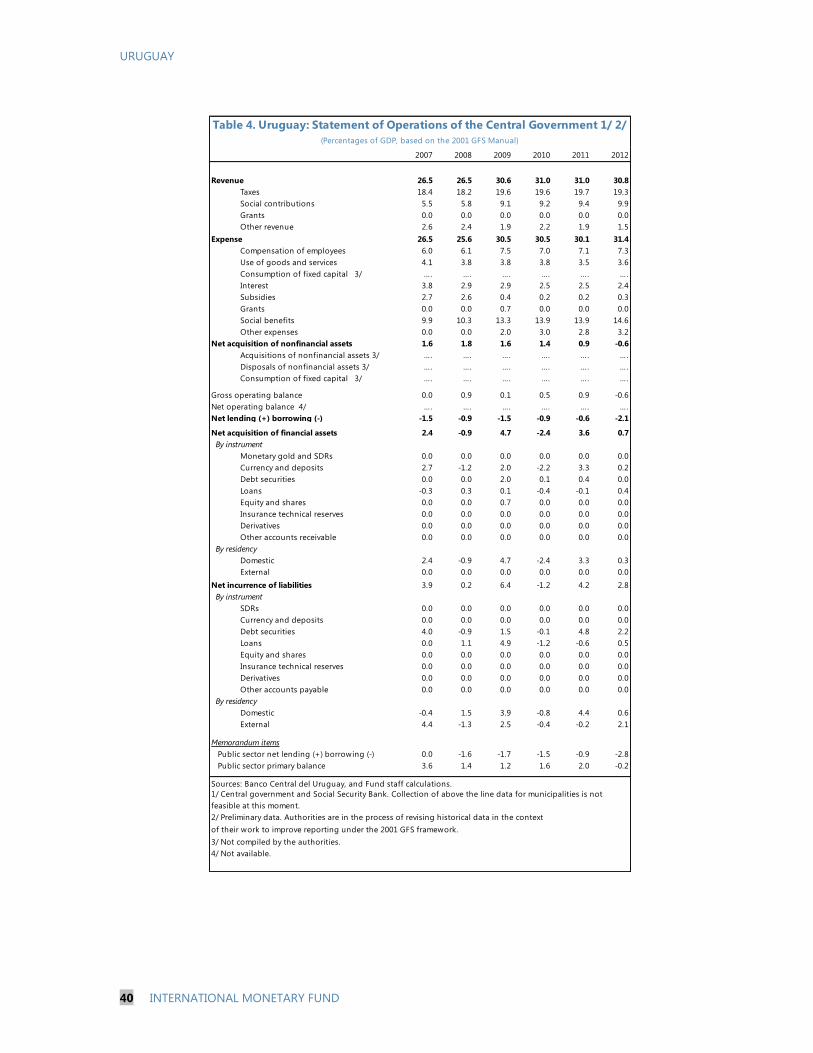
URUGUAY
40 INTERNATIONAL MONETARY FUND
Projections
2007 2008 2009 2010 2011 2012
Revenue 26.5 26.5 30.6 31.0 31.0 30.8
Taxes 18.4 18.2 19.6 19.6 19.7 19.3
Social contributions 5.5 5.8 9.1 9.2 9.4 9.9
Grants 0.0 0.0 0.0 0.0 0.0 0.0
Other revenue 2.6 2.4 1.9 2.2 1.9 1.5
Expense 26.5 25.6 30.5 30.5 30.1 31.4
Compensation of employees 6.0 6.1 7.5 7.0 7.1 7.3
Use of goods and services 4.1 3.8 3.8 3.8 3.5 3.6
Consumption of fixed capital 3/ …. …. …. …. …. ….
Interest 3.8 2.9 2.9 2.5 2.5 2.4
Subsidies 2.7 2.6 0.4 0.2 0.2 0.3
Grants 0.0 0.0 0.7 0.0 0.0 0.0
Social benefits 9.9 10.3 13.3 13.9 13.9 14.6
Other expenses 0.0 0.0 2.0 3.0 2.8 3.2
Net acquisition of nonfinancial assets 1.6 1.8 1.6 1.4 0.9 -0.6
Acquisitions of nonfinancial assets 3/ …. …. …. …. …. ….
Disposals of nonfinancial assets 3/ …. …. …. …. …. ….
Consumption of fixed capital 3/ …. …. …. …. …. ….
Gross operating balance 0.0 0.9 0.1 0.5 0.9 -0.6
Net operating balance 4/ …. …. …. …. …. ….
Net lending (+) borrowing (-) 5/ -1.5 -0.9 -1.5 -0.9 -0.6 -2.1
Net acquisition of financial assets 4/ 2.4 -0.9 4.7 -2.4 3.6 0.7
By instrument
Monetary gold and SDRs 0.0 0.0 0.0 0.0 0.0 0.0
Currency and deposits 2.7 -1.2 2.0 -2.2 3.3 0.2
Debt securities 0.0 0.0 2.0 0.1 0.4 0.0
Loans -0.3 0.3 0.1 -0.4 -0.1 0.4
Equity and shares 0.0 0.0 0.7 0.0 0.0 0.0
Insurance technical reserves 0.0 0.0 0.0 0.0 0.0 0.0
Derivatives 0.0 0.0 0.0 0.0 0.0 0.0
Other accounts receivable 0.0 0.0 0.0 0.0 0.0 0.0
By residency
Domestic 2.4 -0.9 4.7 -2.4 3.3 0.3
External 0.0 0.0 0.0 0.0 0.0 0.0
Net incurrence of liabilities 5/ 3.9 0.2 6.4 -1.2 4.2 2.8
By instrument
SDRs 0.0 0.0 0.0 0.0 0.0 0.0
Currency and deposits 0.0 0.0 0.0 0.0 0.0 0.0
Debt securities 4.0 -0.9 1.5 -0.1 4.8 2.2
Loans 0.0 1.1 4.9 -1.2 -0.6 0.5
Equity and shares 0.0 0.0 0.0 0.0 0.0 0.0
Insurance technical reserves 0.0 0.0 0.0 0.0 0.0 0.0
Derivatives 0.0 0.0 0.0 0.0 0.0 0.0
Other accounts payable 0.0 0.0 0.0 0.0 0.0 0.0
By residency
Domestic -0.4 1.5 3.9 -0.8 4.4 0.6
External 4.4 -1.3 2.5 -0.4 -0.2 2.1
Memorandum items
Public sector net lending (+) borrowing (-) 0.0 -1.6 -1.7 -1.5 -0.9 -2.8
Public sector primary balance 3.6 1.4 1.2 1.6 2.0 -0.2
Sources: Banco Central del Uruguay, and Fund staff calculations.
of their work to improve reporting under the 2001 GFS framework.
3/ Not compiled by the authorities.
4/ Not available.
Table 4. Uruguay: Statement of Operations of the Central Government 1/ 2/
(Percentages of GDP, based on the 2001 GFS Manual)
1/ Central government and Social Security Bank. Collection of above the line data for municipalities is not
feasible at this moment.
2/ Preliminary data. Authorities are in the process of revising historical data in the context
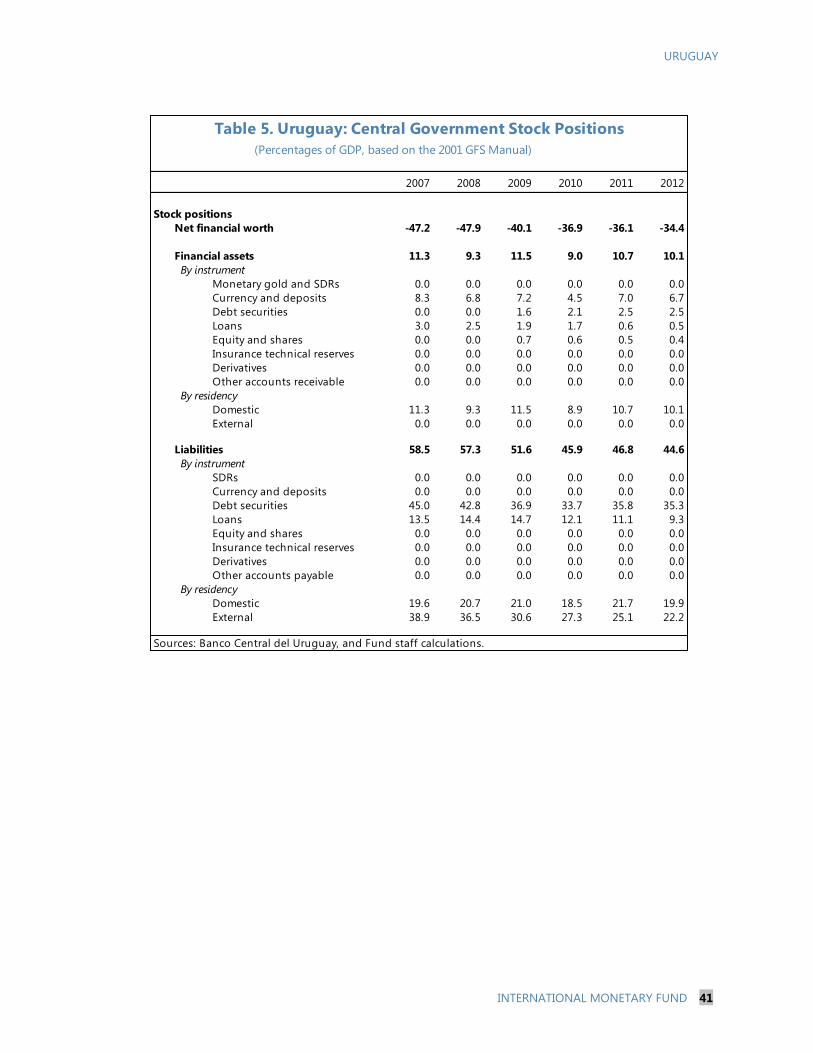
URUGUAY
INTERNATIONAL MONETARY FUND 41
2007 2008 2009 2010 2011 2012
Stock positions
Net financial worth -47.2 -47.9 -40.1 -36.9 -36.1 -34.4
Financial assets 11.3 9.3 11.5 9.0 10.7 10.1
By instrument
Monetary gold and SDRs 0.0 0.0 0.0 0.0 0.0 0.0
Currency and deposits 8.3 6.8 7.2 4.5 7.0 6.7
Debt securities 0.0 0.0 1.6 2.1 2.5 2.5
Loans 3.0 2.5 1.9 1.7 0.6 0.5
Equity and shares 0.0 0.0 0.7 0.6 0.5 0.4
Insurance technical reserves 0.0 0.0 0.0 0.0 0.0 0.0
Derivatives 0.0 0.0 0.0 0.0 0.0 0.0
Other accounts receivable 0.0 0.0 0.0 0.0 0.0 0.0
By residency
Domestic 11.3 9.3 11.5 8.9 10.7 10.1
External 0.0 0.0 0.0 0.0 0.0 0.0
Liabilities 58.5 57.3 51.6 45.9 46.8 44.6
By instrument
SDRs 0.0 0.0 0.0 0.0 0.0 0.0
Currency and deposits 0.0 0.0 0.0 0.0 0.0 0.0
Debt securities 45.0 42.8 36.9 33.7 35.8 35.3
Loans 13.5 14.4 14.7 12.1 11.1 9.3
Equity and shares 0.0 0.0 0.0 0.0 0.0 0.0
Insurance technical reserves 0.0 0.0 0.0 0.0 0.0 0.0
Derivatives 0.0 0.0 0.0 0.0 0.0 0.0
Other accounts payable 0.0 0.0 0.0 0.0 0.0 0.0
By residency
Domestic 19.6 20.7 21.0 18.5 21.7 19.9
External 38.9 36.5 30.6 27.3 25.1 22.2
Sources: Banco Central del Uruguay, and Fund staff calculations.
Table 5. Uruguay: Central Government Stock Positions
(Percentages of GDP, based on the 2001 GFS Manual)

URUGUAY
42 INTERNATIONAL MONETARY FUND
2009 2010 2011 2012 2013 1/
Net foreign assets 161.6 153.9 205.4 254.4 292.6
Net international reserves 2/ 157.8 153.8 205.0 263.9 305.4
Other net foreign assets 3.8 0.1 0.4 -9.5 -12.8
Net domestic assets -101.3 -86.5 -123.7 -155.0 -184.0
Net credit to the public sector 19.4 51.0 22.2 43.0 61.1
Net credit to the financial system -52.9 -35.7 -51.8 -82.5 -110.3
Credit to the private sector 0.3 0.3 0.3 0.3 0.3
Securities issued by the BCU -87.0 -123.3 -120.5 -155.2 -183.8
Other 18.9 21.1 26.1 39.4 48.7
Peso monetary liabilities 3/ 60.3 67.4 81.7 99.4 108.6
Net foreign assets 54.8 98.6 94.8 70.9 75.4
Net domestic assets 214.4 224.3 287.3 346.2 401.0
Net credit to the public sector 24.0 11.1 25.8 25.1 22.6
Net credit to the financial system 100.7 94.0 110.8 148.6 179.6
Credit to the private sector 146.3 179.8 213.4 243.9 275.1
Other -56.6 -60.6 -62.7 -71.4 -76.2
Liabilities to the private sector (residents) 269.1 322.8 382.1 417.1 476.4
Public banks 137.0 160.8 191.6 213.6 238.5
Local currency 46.2 56.3 70.5 82.0 88.3
Foreign currency 90.9 104.5 121.1 131.6 150.2
Private banks 132.1 162.0 190.5 203.5 237.9
Local currency 35.5 46.9 57.2 59.1 66.1
Foreign currency 96.6 115.1 133.3 144.4 171.8
Net foreign assets 216.3 252.5 300.2 325.3 367.9
Net domestic assets 62.8 88.5 102.1 117.1 130.7
Credit to the public sector 43.4 62.1 48.0 68.1 83.7
Credit to the rest of financial system -2.5 9.1 -2.4 -8.1 -17.0
Credit to the private sector 146.6 180.1 213.7 244.2 275.4
Other -124.7 -162.8 -157.1 -187.2 -211.3
Broad money (M-3) 279.2 341.0 402.4 442.4 498.6
Memorandum items: 5/
Base money 6.5 16.2 17.3 26.7 15.7
M-1 12.2 28.9 18.8 9.1 1.2
Broader M-1 (M1 plus savings deposits) 15.2 30.0 20.8 11.2 15.1
M-2 15.0 30.3 22.0 12.3 4.6
M-3 -2.6 22.1 18.0 10.0 16.4
Credit to households (in real UY$) -20.5 15.8 2.1 7.3 8.0
Credit to firms (in US$) 3.4 18.8 26.5 17.5 18.3
Source: Banco Central del Uruguay.
1/ Latest available data (June 2013).
2/ Includes all outstanding liabilities to the IMF, but excludes liabilities to resident financial institutions.
3/ Peso monetary liabilities includes base money and non-liquid liabilities.
4/ The Banco de la Republica Oriental de Uruguay (BROU), Banco Hipotecario de Uruguay (BHU; mortgage institution),
private banks, casas financieras and cooperatives.
5/ Percent change of end-of-year data on one year ago. For 2013, latest available data. In pesos, unless indicated otherwise.
Table 6. Uruguay: Summary Accounts of the Banking System (End of period, in billions of pesos)
I. Banco Central del Uruguay (BCU)
II. Public and private banks 4/
III. Banking system (central, private, and public banks)
(Percentage change) 5/
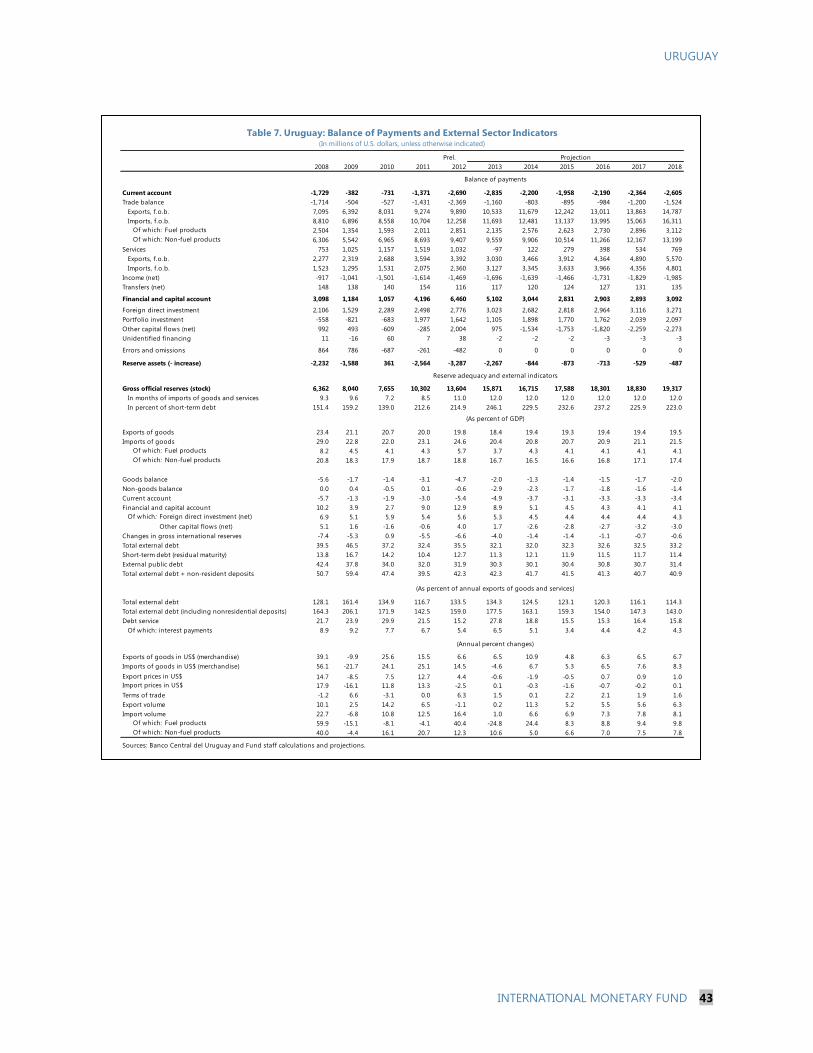
URUGUAY
INTERNATIONAL MONETARY FUND 43
Prel.
2008 2009 2010 2011 2012 2013 2014 2015 2016 2017 2018
Current account -1,729 -382 -731 -1,371 -2,690 -2,835 -2,200 -1,958 -2,190 -2,364 -2,605
Trade balance -1,714 -504 -527 -1,431 -2,369 -1,160 -803 -895 -984 -1,200 -1,524
Exports, f.o.b. 7,095 6,392 8,031 9,274 9,890 10,533 11,679 12,242 13,011 13,863 14,787
Imports, f.o.b. 8,810 6,896 8,558 10,704 12,258 11,693 12,481 13,137 13,995 15,063 16,311
Of which : Fuel products 2,504 1,354 1,593 2,011 2,851 2,135 2,576 2,623 2,730 2,896 3,112
Of which : Non-fuel products 6,306 5,542 6,965 8,693 9,407 9,559 9,906 10,514 11,266 12,167 13,199
Services 753 1,025 1,157 1,519 1,032 -97 122 279 398 534 769
Exports, f.o.b. 2,277 2,319 2,688 3,594 3,392 3,030 3,466 3,912 4,364 4,890 5,570
Imports, f.o.b. 1,523 1,295 1,531 2,075 2,360 3,127 3,345 3,633 3,966 4,356 4,801
Income (net) -917 -1,041 -1,501 -1,614 -1,469 -1,696 -1,639 -1,466 -1,731 -1,829 -1,985
Transfers (net) 148 138 140 154 116 117 120 124 127 131 135
Financial and capital account 3,098 1,184 1,057 4,196 6,460 5,102 3,044 2,831 2,903 2,893 3,092
Foreign direct investment 2,106 1,529 2,289 2,498 2,776 3,023 2,682 2,818 2,964 3,116 3,271
Portfolio investment -558 -821 -683 1,977 1,642 1,105 1,898 1,770 1,762 2,039 2,097
Other capital flows (net) 992 493 -609 -285 2,004 975 -1,534 -1,753 -1,820 -2,259 -2,273
Unidentified financing 11 -16 60 7 38 -2 -2 -2 -3 -3 -3
Errors and omissions 864 786 -687 -261 -482 0 0 0 0 0 0
Reserve assets (- increase) -2,232 -1,588 361 -2,564 -3,287 -2,267 -844 -873 -713 -529 -487
Gross official reserves (stock) 6,362 8,040 7,655 10,302 13,604 15,871 16,715 17,588 18,301 18,830 19,317
In months of imports of goods and services 9.3 9.6 7.2 8.5 11.0 12.0 12.0 12.0 12.0 12.0 12.0
In percent of short-term debt 151.4 159.2 139.0 212.6 214.9 246.1 229.5 232.6 237.2 225.9 223.0
Exports of goods 23.4 21.1 20.7 20.0 19.8 18.4 19.4 19.3 19.4 19.4 19.5
Imports of goods 29.0 22.8 22.0 23.1 24.6 20.4 20.8 20.7 20.9 21.1 21.5
Of which : Fuel products 8.2 4.5 4.1 4.3 5.7 3.7 4.3 4.1 4.1 4.1 4.1
Of which : Non-fuel products 20.8 18.3 17.9 18.7 18.8 16.7 16.5 16.6 16.8 17.1 17.4
Goods balance -5.6 -1.7 -1.4 -3.1 -4.7 -2.0 -1.3 -1.4 -1.5 -1.7 -2.0
Non-goods balance 0.0 0.4 -0.5 0.1 -0.6 -2.9 -2.3 -1.7 -1.8 -1.6 -1.4
Current account -5.7 -1.3 -1.9 -3.0 -5.4 -4.9 -3.7 -3.1 -3.3 -3.3 -3.4
Financial and capital account 10.2 3.9 2.7 9.0 12.9 8.9 5.1 4.5 4.3 4.1 4.1
Of which : Foreign direct investment (net) 6.9 5.1 5.9 5.4 5.6 5.3 4.5 4.4 4.4 4.4 4.3
Other capital flows (net) 5.1 1.6 -1.6 -0.6 4.0 1.7 -2.6 -2.8 -2.7 -3.2 -3.0
Changes in gross international reserves -7.4 -5.3 0.9 -5.5 -6.6 -4.0 -1.4 -1.4 -1.1 -0.7 -0.6
Total external debt 39.5 46.5 37.2 32.4 35.5 32.1 32.0 32.3 32.6 32.5 33.2
Short-term debt (residual maturity) 13.8 16.7 14.2 10.4 12.7 11.3 12.1 11.9 11.5 11.7 11.4
External public debt 42.4 37.8 34.0 32.0 31.9 30.3 30.1 30.4 30.8 30.7 31.4
Total external debt + non-resident deposits 50.7 59.4 47.4 39.5 42.3 42.3 41.7 41.5 41.3 40.7 40.9
Total external debt 128.1 161.4 134.9 116.7 133.5 134.3 124.5 123.1 120.3 116.1 114.3
Total external debt (including nonresidential deposits) 164.3 206.1 171.9 142.5 159.0 177.5 163.1 159.3 154.0 147.3 143.0
Debt service 21.7 23.9 29.9 21.5 15.2 27.8 18.8 15.5 15.3 16.4 15.8
Of which: interest payments 8.9 9.2 7.7 6.7 5.4 6.5 5.1 3.4 4.4 4.2 4.3
Exports of goods in US$ (merchandise) 39.1 -9.9 25.6 15.5 6.6 6.5 10.9 4.8 6.3 6.5 6.7
Imports of goods in US$ (merchandise) 56.1 -21.7 24.1 25.1 14.5 -4.6 6.7 5.3 6.5 7.6 8.3
Export prices in US$ 14.7 -8.5 7.5 12.7 4.4 -0.6 -1.9 -0.5 0.7 0.9 1.0
Import prices in US$ 17.9 -16.1 11.8 13.3 -2.5 0.1 -0.3 -1.6 -0.7 -0.2 0.1
Terms of trade -1.2 6.6 -3.1 0.0 6.3 1.5 0.1 2.2 2.1 1.9 1.6
Export volume 10.1 2.5 14.2 6.5 -1.1 0.2 11.3 5.2 5.5 5.6 6.3
Import volume 22.7 -6.8 10.8 12.5 16.4 1.0 6.6 6.9 7.3 7.8 8.1
Of which : Fuel products 59.9 -15.1 -8.1 -4.1 40.4 -24.8 24.4 8.3 8.8 9.4 9.8
Of which : Non-fuel products 40.0 -4.4 16.1 20.7 12.3 10.6 5.0 6.6 7.0 7.5 7.8
Table 7. Uruguay: Balance of Payments and External Sector Indicators(In millions of U.S. dollars, unless otherwise indicated)
Sources: Banco Central del Uruguay and Fund staff calculations and projections.
Projection
Balance of payments
Reserve adequacy and external indicators
(As percent of GDP)
(As percent of annual exports of goods and services)
(Annual percent changes)

URUGUAY
44 INTERNATIONAL MONETARY FUND
Annex I. Is the Uruguayan Economy Decoupling from its Neighbors?
An Empirical Analysis of Inward Spillovers to Uruguay1
Uruguay is a small open economy vulnerable to inward spillovers through trade, tourism,
and investment flows. The economy is integrated significantly with its two large neighbors,
Argentina and Brazil, and its economic cycle has historically been highly synchronized especially
with that of Argentina. While trade and financial linkages with Argentina has been diminishing in
recent years, Brazil has remained Uruguay’s main export destination in the past decade. In the
meantime, China has become an important source of demand for Uruguay’s exports. Uruguay
maintained a robust growth in 2012, in contrast to the notable deceleration in its neighbors
Argentina and Brazil, which may suggest a moderating impact of spillovers from the region and
the growing importance of other factors. Against this backdrop, this annex documents Uruguay’s
external linkages and estimates the sensitivity of its GDP growth to external factors.
Uruguay’s External Linkages
Uruguay’s economic activity has historically been highly correlated with the two large
regional economies, especially Argentina, and to a lesser extent, Brazil (Figures A1.1 and
A1.2). The main linkages that tie these economies are trade in goods, and services and
investment flows (mostly FDI). Financial linkages, primarily in the form of foreign currency
deposits in the Uruguayan banking sector, were significant prior to the Argentinean crisis in
2001. However, its importance has declined since then.
1 Prepared by Sumiko Ogawa, with inputs by Garth P. Nicholls.
80
100
120
140
160
180
200
220
240
80
100
120
140
160
180
200
220
240
1980 1988 1996 2004 2012
Figure A1.1. Real GDP
(Index 1980=100)
Argentina
Uruguay
Source: World Economic Outlook.
80
100
120
140
160
180
200
220
240
80
100
120
140
160
180
200
220
240
1980 1988 1996 2004 2012
Figure A1.2. Real GDP
(Index 1980=100)
Brazil
Uruguay
Source: World Economic Outlook.
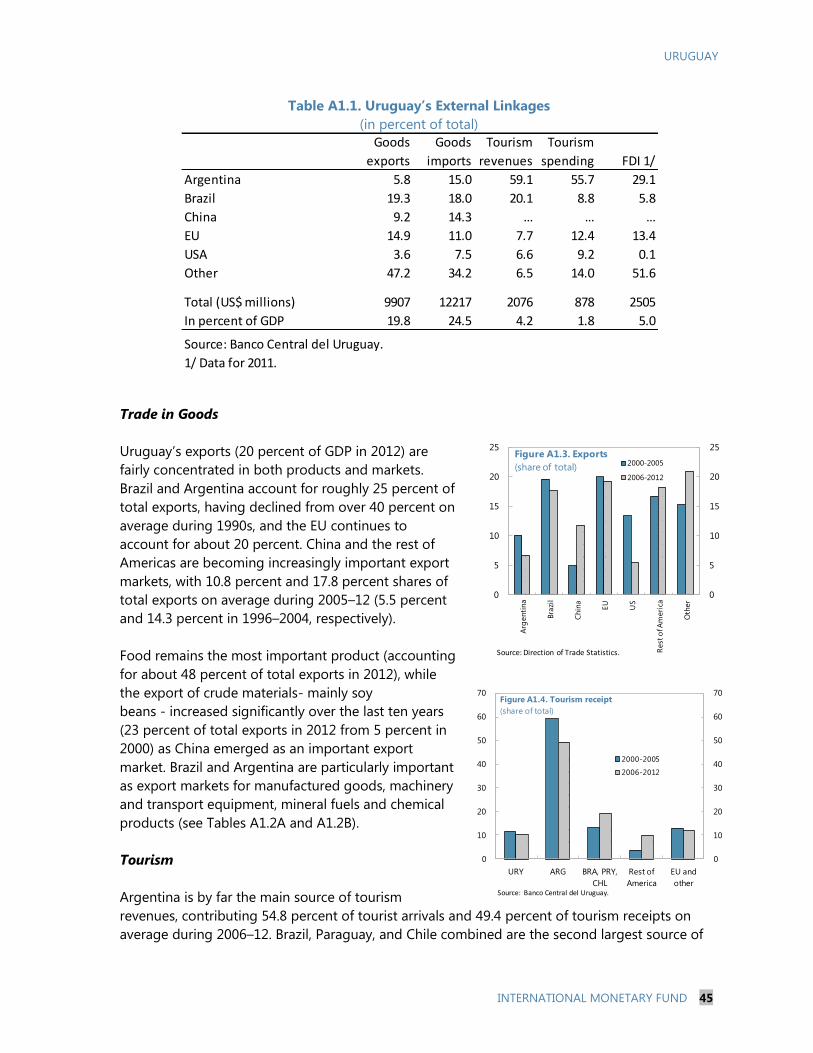
URUGUAY
INTERNATIONAL MONETARY FUND 45
Table A1.1. Uruguay’s External Linkages
(in percent of total)
Trade in Goods
Uruguay’s exports (20 percent of GDP in 2012) are
fairly concentrated in both products and markets.
Brazil and Argentina account for roughly 25 percent of
total exports, having declined from over 40 percent on
average during 1990s, and the EU continues to
account for about 20 percent. China and the rest of
Americas are becoming increasingly important export
markets, with 10.8 percent and 17.8 percent shares of
total exports on average during 2005–12 (5.5 percent
and 14.3 percent in 1996–2004, respectively).
Food remains the most important product (accounting
for about 48 percent of total exports in 2012), while
the export of crude materials- mainly soy
beans - increased significantly over the last ten years
(23 percent of total exports in 2012 from 5 percent in
2000) as China emerged as an important export
market. Brazil and Argentina are particularly important
as export markets for manufactured goods, machinery
and transport equipment, mineral fuels and chemical
products (see Tables A1.2A and A1.2B).
Tourism
Argentina is by far the main source of tourism
revenues, contributing 54.8 percent of tourist arrivals and 49.4 percent of tourism receipts on
average during 2006–12. Brazil, Paraguay, and Chile combined are the second largest source of
Goods
exports
Goods
imports
Tourism
revenues
Tourism
spending FDI 1/
Argentina 5.8 15.0 59.1 55.7 29.1
Brazil 19.3 18.0 20.1 8.8 5.8
China 9.2 14.3 … … …
EU 14.9 11.0 7.7 12.4 13.4
USA 3.6 7.5 6.6 9.2 0.1
Other 47.2 34.2 6.5 14.0 51.6
Total (US$ millions) 9907 12217 2076 878 2505
In percent of GDP 19.8 24.5 4.2 1.8 5.0
Source: Banco Central del Uruguay.
1/ Data for 2011.
0
5
10
15
20
25
0
5
10
15
20
25
Arg
en
tin
a
Bra
zil
Chin
a
EU
US
Rest
of A
meri
ca
Oth
er
Figure A1.3. Exports
(share of total)2000-2005
2006-2012
Source: Direction of Trade Statistics.
0
10
20
30
40
50
60
70
0
10
20
30
40
50
60
70
URY ARG BRA, PRY,
CHL
Rest of
America
EU and
other
Figure A1.4. Tourism receipt
(share of total)
2000-2005
2006-2012
Source: Banco Central del Uruguay.

URUGUAY
46 INTERNATIONAL MONETARY FUND
tourism market, followed closely by non-resident Uruguayans travelling to the country. Uruguay
is a net exporter of tourism services, with tourism receipts (4.2 percent of GDP in 2012) more
than twice the tourism spending (1.8 percent of GDP, more than half to Argentina).
Foreign Direct Investment (FDI)
FDI increased significantly over the last ten years, from 1.4 percent of GDP in 2001 to the peak of
7.6 percent in 2006 before moderating to 5.4 percent in 2011. Argentina and Europe are the
main sources of foreign direct investment in Uruguay. Argentina has increased in its importance
as a source of FDI in the recent years, while Europe’s share dropped in the last two years. The
sectoral allocation of FDI shifted in important ways in the recent years; in particular, FDI in the
financial sector declined to less than 10 percent of total in 2010–11 from about 40 percent in
2001–02. At the same time, FDI in the agriculture and construction sectors rose to about
15 percent and 25 percent of total FDI, respectively.
Non-Resident Deposits
Private sector deposits in the banking system have gone
through an important change following the Argentinean
crisis. Non-resident foreign currency deposits drove the
growth of private deposits prior to 2002, with its share
of total deposits rising to over 40 percent at the peak
(or 45 percent of GDP). Non-resident deposits noted a
more than 80 percent decline in nominal value from the
peak in late 2001 to trough in early 2003, and their
share dropped to around 16 percent of total deposits
(or about 7 percent of GDP at end-2012).
0
5
10
15
20
25
30
35
40
0
5
10
15
20
25
30
35
40
Arg
entina
Euro
pe
Baham
as
U.S
.
Bra
zil
Para
guay
Figure A1.5. Origins of Foreign Direct Investment
(In percent of total FDI)
2001-2005
2006-2011
Source: Banco Central del Uruguay.0 5 10 15 20 25 30
0 10 20 30
Agriculture
Construction
Manufacturing
Retail, hotels and restaurants
Financial
Other
Figure A1.6. Allocation of Foreign Direct Investment
(In percent of total FDI)
2001-2005
2006-2011
Source: Banco Central del Uruguay.
0
5
10
15
20
25
30
35
40
45
50
0
5
10
15
20
25
30
1998 2000 2002 2004 2006 2008 2010 2012
Figure A1.7. Private Deposits
(In million dollars)Resident
Non-resident
Share of non-resident deposit
(in percent, rhs)
Source: Banco Central del Uruguay.

URUGUAY
INTERNATIONAL MONETARY FUND 47
Inward Spillovers
This section updates the analysis in SM/12/285 to assess the impact of spillovers to the
Uruguayan economy from various external factors.2 The approach draws on Sosa (2006) and
Adler and Sosa (2012), and analyzes the sensitivity of Uruguay’s real GDP growth to different
types of shocks, such as global growth and those of regional key economies (Argentina and
Brazil), terms-of-trade, and global financial conditions (real LIBOR rate). Quarterly data for
1990Q1 to 2012Q4 is used for the analysis. Uruguay’s export and import price indices are used
instead of broader global commodity price indices as in earlier works, to better capture
international price shocks specific to key export products from Uruguay. Uruguay’s export prices
should also reflect better the similarities in its export basket to that of Argentina, and help to
disentangle common shocks versus the direct effect of idiosyncratic shocks to Argentina. The
model includes the variables in the order of most to least exogenous to Uruguay: first the global
variables (output, real short-term interest rate, and export and import prices); second regional
variables (Brazil and Argentina’s output); and then Uruguay’s GDP.
The estimated impulse responses indicate that the sensitivity of Uruguay’s GDP growth to
growth in Argentina remains significant, although it has diminished over time. For the
overall sample period, the impact lasts for six to seven quarters, and the cumulative impact of a
1 percentage point change in Argentina’s GDP growth translates into roughly 1.85 percentage
points over the eight quarters. This large sensitivity is primarily due to the amplified effect in the
earlier period of 1990–2003, and the elasticity declines sharply to 0.5 percentage points for the
more recent period of 2004–2012, consistent with reduced financial and trade linkages after the
crisis in early 2000s. Spillovers from Brazil, on the other hand, are found to be negative but
largely insignificant. As Brazil’s economy is much larger and more diverse, its overall GDP may
not appropriately represent the shocks that are relevant to Uruguay’s economy. Shocks to global
GDP and export prices have positive effects on Uruguay’s GDP, whereas shocks to import prices
only have a minor impact. An increase in the real short-term interest rate is found to have a
positive impact initially, followed by a lagged negative impact.
External factors are found to explain about 36 percent of the variation in Uruguay’s GDP
growth. The total share attributable to external shocks reflects the sum of the direct effects of
global and regional factors, as well as the indirect effects of global shocks transmitted through
Argentina and Brazil. To assess the extent to which the global shocks are transmitted through
Uruguay’s neighbors, the impact of the global shocks in the above baseline model is compared
against those in models including Argentina and Brazil’s GDP growth as exogenous variables. If
the impact of global factors is larger under the baseline model compared to those alternative
models, the difference can be interpreted as the indirect spillover of global shocks through these
two neighboring economies (Adler and Sosa, 2012).
2 There are a number of studies on spillovers based on vector autoregressions (VAR) approach. Dabla-Norris,
Espinoza and Jahan (2012) studied the importance of dominant regional emerging market economies on low
income countries; Bayoumi and Swiston (2007) analyzed the spillovers in advanced economies from the U.S., Euro
area and Japan; Alturki, Espinosa-Bowen and Ilahi (2009) looked at the influence of Russia on growth in the CIS
countries. For Latin America, Adler and Sosa (2012) analyzed spillovers from Brazil to South American countries
through the export channel and shocks to exchange rate.

URUGUAY
48 INTERNATIONAL MONETARY FUND
The results show that most of the external spillovers on Uruguay’s GDP growth reflect
direct effects rather than indirect global effects transmitted through Argentina and Brazil.
In particular, the bulk of the 25 percentage point contribution by Argentina to Uruguay’s
fluctuations represents direct effects. For Brazil, about half of the 3 percentage point contribution
represents the direct effects of Brazil-specific
shocks while the other half represents the
effect of global shocks transmitted through
Brazil. The direct effect of global shocks
accounts for 8 percentage points of the
fluctuations attributable to external factors.
As the share of Argentina in trade has
declined over time, the importance of global
factors is likely to have grown compared to
the averages estimated in these regressions.
0
5
10
15
20
25
30
35
40
Brazil's GDP
Global shocks transmitted
through Brazil
Argentina's GDP
Global shocks transmitted
through Argentina
Global shocks
Figure A1.8. Fraction of GDP Variance Explainedby External Factors(In percent)
Source: Fund staff calculations.
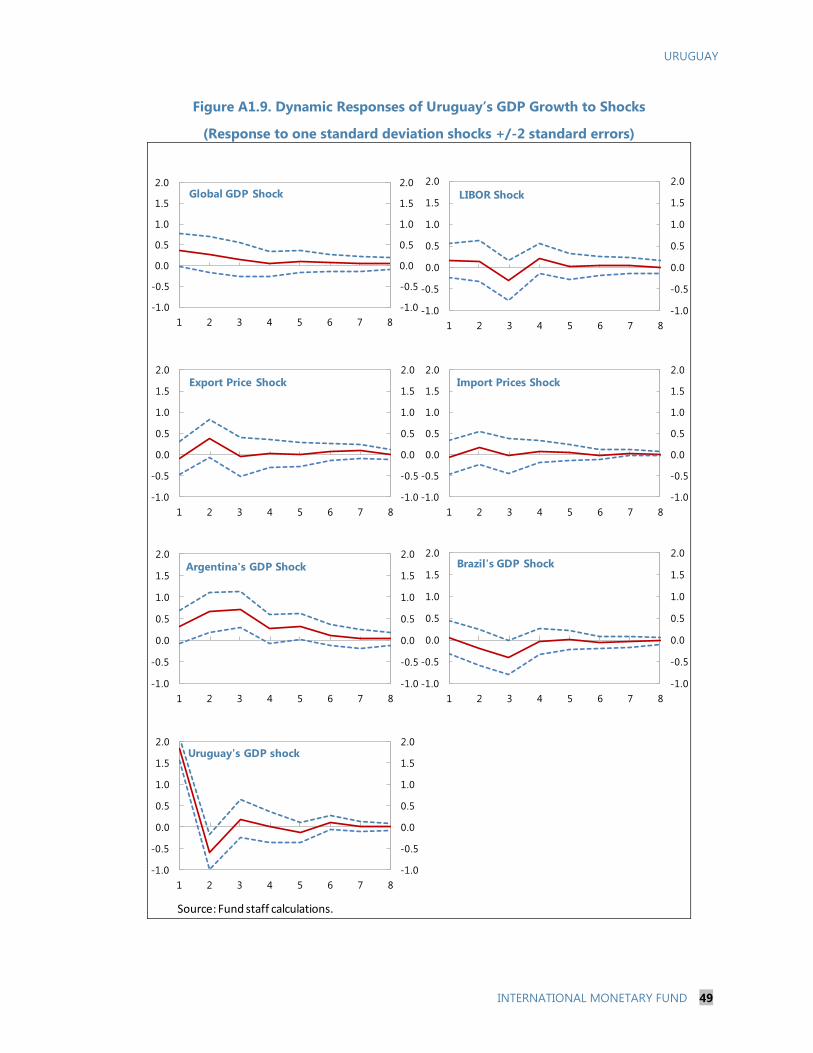
URUGUAY
INTERNATIONAL MONETARY FUND 49
Figure A1.9. Dynamic Responses of Uruguay’s GDP Growth to Shocks
(Response to one standard deviation shocks +/-2 standard errors)
-1.0
-0.5
0.0
0.5
1.0
1.5
2.0
-1.0
-0.5
0.0
0.5
1.0
1.5
2.0
1 2 3 4 5 6 7 8
Global GDP Shock
-1.0
-0.5
0.0
0.5
1.0
1.5
2.0
-1.0
-0.5
0.0
0.5
1.0
1.5
2.0
1 2 3 4 5 6 7 8
LIBOR Shock
-1.0
-0.5
0.0
0.5
1.0
1.5
2.0
-1.0
-0.5
0.0
0.5
1.0
1.5
2.0
1 2 3 4 5 6 7 8
Export Price Shock
-1.0
-0.5
0.0
0.5
1.0
1.5
2.0
-1.0
-0.5
0.0
0.5
1.0
1.5
2.0
1 2 3 4 5 6 7 8
Import Prices Shock
-1.0
-0.5
0.0
0.5
1.0
1.5
2.0
-1.0
-0.5
0.0
0.5
1.0
1.5
2.0
1 2 3 4 5 6 7 8
Argentina's GDP Shock
-1.0
-0.5
0.0
0.5
1.0
1.5
2.0
-1.0
-0.5
0.0
0.5
1.0
1.5
2.0
1 2 3 4 5 6 7 8
Brazil's GDP Shock
-1.0
-0.5
0.0
0.5
1.0
1.5
2.0
-1.0
-0.5
0.0
0.5
1.0
1.5
2.0
1 2 3 4 5 6 7 8
Uruguay's GDP shock
Source: Fund staff calculations.

Table A1.2A. Exports by Destination and Products, 2000
(In percent of total exports)
Table A1.2B. Exports by Destination and Products, 2012
(In percent of total exports)
SITC Shares in
total exports Argentina Brazil Chile China EU Korea Paraguay Russia USA Venezuela
Other
Countries
Food and Live animals (SITC 0) 1/ 42.4 2.3 12.3 1.1 1.1 3.0 0.6 0.2 0.2 5.4 0.6 15.7
Beverages and Tobacco (SITC 1) 2.6 0.0 0.2 0.0 0.0 0.0 0.0 2.3 0.0 0.0 0.0 0.0
Crude Materials (SITC2) 2/ 12.9 0.3 0.4 0.0 2.5 9.0 0.1 0.0 0.0 0.5 0.0 0.1
Chemicals & related products (SITC 5) 7.7 2.0 2.2 0.2 0.0 0.1 0.0 0.5 0.0 0.3 0.0 2.3
Manufactured goods classified by materials (SITC 6) 15.1 4.0 3.7 0.5 0.4 1.1 0.0 0.2 0.0 0.0 0.0 5.1
Machinery & Transport equipment (SITC 7) 8.1 5.6 2.1 0.1 0.0 0.0 0.0 0.1 0.0 0.2 0.0 0.0
Miscellaneous manufactured articles (SITC 8) 7.3 2.6 1.5 0.4 0.0 0.7 0.0 0.1 0.0 1.8 0.0 0.2
Other 3/ 4.0 1.1 0.7 0.2 0.0 1.0 0.0 0.1 0.0 0.0 0.0 0.8
Memo:
Share of exports to total exports 17.9 23.1 2.5 4.0 14.9 0.7 3.6 0.3 8.3 0.7 24.1
Sources: World Integrated Trade Solution (WITS), IMF Direction of Trade Statistics and Fund Staff calculations.
1/ SITC - standard international trade classification.
2/ Includes soybeans.
3/ Includes mineral fuels, lubricants and related matter (SITC 3), animal & vegetable oil, fats & waxes (SITC4), and other commodities, nes (SITC 9).
SITC Shares in
total exports Argentina Brazil Chile China EU Korea Paraguay Russia USA Venezuela
Other
Countries
Food and Live animals (SITC 0) 1/ 47.7 0.5 9.7 1.8 2.1 9.4 0.6 0.1 3.6 2.3 3.1 14.6
Beverages and Tobacco (SITC 1) 0.8 0.0 0.1 0.0 0.0 0.0 0.0 0.5 0.1 0.0 0.0 0.2
Crude Materials (SITC2) 2/ 24.6 0.1 0.5 0.0 14.8 2.0 0.3 0.0 0.2 0.2 0.0 6.3
Chemicals & related products (SITC 5) 6.7 1.0 3.2 0.2 0.0 0.1 0.0 0.6 0.0 0.2 0.2 1.2
Manufactured goods classified by materials (SITC 6) 8.4 1.6 2.1 0.2 0.8 2.4 0.0 0.2 0.0 0.4 0.1 0.6
Machinery & Transport equipment (SITC 7) 3.0 1.8 0.4 0.2 0.0 0.1 0.0 0.1 0.0 0.1 0.1 0.3
Miscellaneous manufactured articles (SITC 8) 4.9 1.0 2.3 0.1 0.2 0.5 0.0 0.1 0.0 0.1 0.0 0.6
Other 3/ 3.9 0.2 0.5 0.0 0.0 0.1 0.0 0.3 0.0 0.2 0.0 2.6
Memo:
Share of exports to total exports 6.2 18.7 2.5 18.0 14.6 0.9 1.8 3.9 3.5 3.5 26.4
Sources: World Integrated Trade Solution (WITS), IMF Direction of Trade Statistics and Fund staff calculations.
1/ SITC - standard international trade classification.
2/ Includes soybeans.
3/ Includes mineral fuels, lubricants and related matter (SITC 3), animal & vegetable oil, fats & waxes (SITC4) and other commodities, nes (SITC 9).
UR
UG
UA
Y
UR
UG
UA
Y
50
IN
TER
NA
TIO
NA
L M
ON
ETA
RY
FU
ND
URUGUAY
INTERNATIONAL MONETARY FUND 51
References
Adler, G. and S. Sosa, 2012, “Intra-Regional Spillovers in South America: Is Brazil Systemic after All?”
IMF Working Paper 12/145 (Washington: International Monetary Fund).
Alturki, F., J. Espinosa-Bowen, and N. Ilahi, 2009, “How Russia Affects the Neighborhood: Trade,
Financial, and Remittance Channels,” IMF Working Paper 09/277 (Washington: International
Monetary Fund).
Bayoumi, T. and A. Swiston, 2007, “Foreign Entanglements: Estimating the Source and Size of
Spillovers Across Industrial Countries,” IMF Working Paper 07/182 (Washington: International
Monetary Fund).
Dabla-Norris, E., R. Espinoza and S. Jahan, 2012, “Spillovers to Low-Income Countries: Importance of
Systemic Emerging Markets,” IMF Working Paper 12/49 (Washington: International Monetary Fund).
Sosa, S., 2010, “The Influence of “Big Brothers:” How Important are Regional Factors for Uruguay?”
IMF Working Paper 10/60 (Washington: International Monetary Fund).

URUGUAY
52 INTERNATIONAL MONETARY FUND
Annex II. Public Sector Debt Sustainability Analysis (DSA)
In Uruguay, large public sector liquidity buffers, and the favorable maturity and currency
composition of public debt, mitigate public sector financing risks. The gross debt level of
Uruguay’s consolidated public sector stood at 59.6 percent of GDP at the end of 2012. However,
the associated macroeconomic vulnerabilities are mitigated by the high level of liquid financial
assets of the public sector—22.4 percent of GDP at end-2012—as well as the high average
maturity and domestic currency share of the public debt. The short-term part of the public debt
primarily consists of securities issued by the central bank to manage liquidity and is more than
covered by the central bank’s gross international reserves.
The gross debt of the public sector has a broad institutional coverage. It includes:
Central government debt, which stood at 39.5 percent of GDP at end-2012. The average
maturity of central government debt is close to 12 years and about 55 percent of this debt is
denominated in local-currency.
Central bank debt, at 14.7 percent of GDP at end-2012. The debt of the central bank mostly
consists of securities issued to manage liquidity, including for the sterilization of a strong
accumulation of foreign exchange reserves in recent years. The maturity of these instruments
is 2 years or less, and about 85 percent are denominated in local currency.
Public enterprises’ debt, which stood at 5 percent of GDP at end-2012.
The public sector has contingent credit lines of 4 percent of GDP (see Box 4) and had total
gross financial assets of 33 percent of GDP at end-2012:
The gross foreign reserve assets of the central bank reached 27.6 percent of GDP at end-2012.
The financial assets of the non-financial public sector amounted to 5.8 percent of GDP at end-
2012. Most of these holdings reflect the pre-financing of the central government’s debt service
needs through end-2014.
The stock of liquid foreign assets of the public sector stood at 22.4 percent of GDP, given by
total gross public sector assets minus the reserve requirements held at BCU for foreign
currency deposits and domestic currency claims of the nonfinancial public sector on resident
banks.
Net public debt – gross debt minus liquid assets – stood at 37.2 percent of GDP in 2012.
Baseline and Alternative Scenarios
Under the DSA baseline scenario, gross debt would remain broadly stable at around 60 percent of
GDP (Figure A.2.4). Public gross financing needs gradually increase over the forecast horizon due
the upward trend in global and domestic interest rates. Public sector debt net of liquid assets
remains around its current level of about 37 percent of GDP. The baseline scenario assumes the
debt profile to remain robust, with the maturity remaining tilted to the medium and long term,
and a high share of local currency debt.
The analysis of past forecast errors for key macroeconomic variables suggest that the baseline
assumptions are generally realistic. The level of the projected primary balance for Uruguay is
comparable to those seen in the past. Uruguay has recently experienced rapid growth in bank
credit, which, based on empirical regularities in cross-country data, could portend risks of a
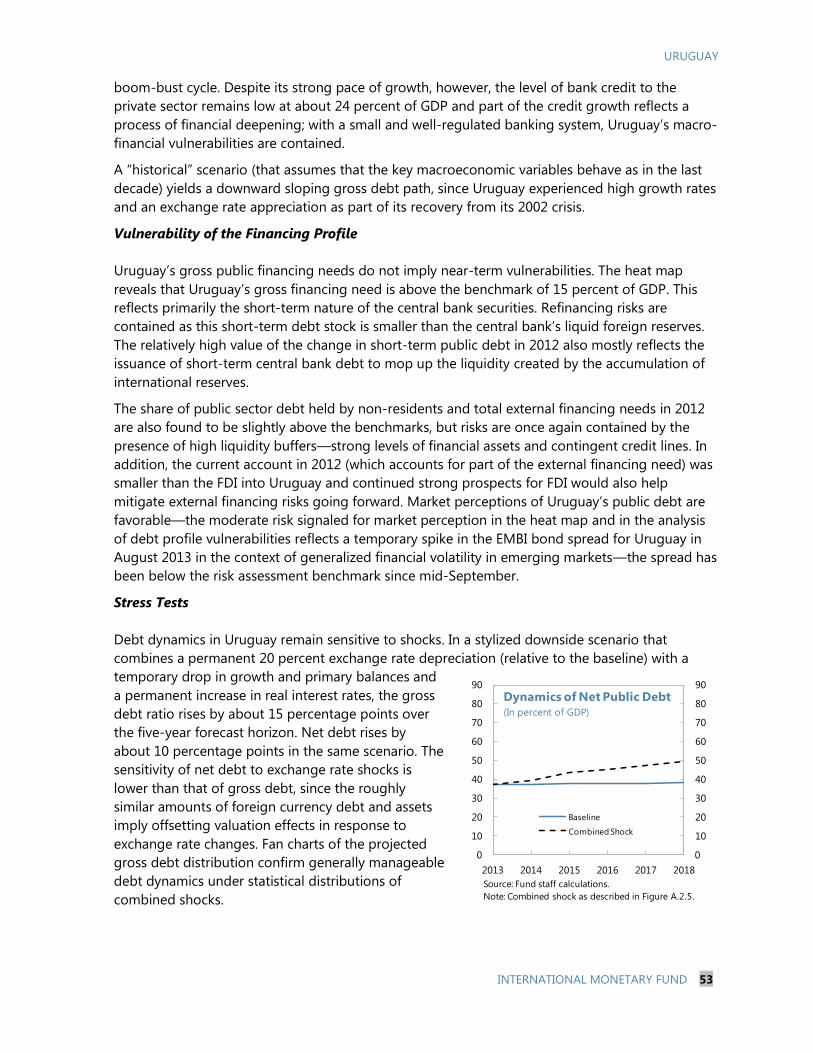
URUGUAY
INTERNATIONAL MONETARY FUND 53
boom-bust cycle. Despite its strong pace of growth, however, the level of bank credit to the
private sector remains low at about 24 percent of GDP and part of the credit growth reflects a
process of financial deepening; with a small and well-regulated banking system, Uruguay’s macro-
financial vulnerabilities are contained.
A “historical” scenario (that assumes that the key macroeconomic variables behave as in the last
decade) yields a downward sloping gross debt path, since Uruguay experienced high growth rates
and an exchange rate appreciation as part of its recovery from its 2002 crisis.
Vulnerability of the Financing Profile
Uruguay’s gross public financing needs do not imply near-term vulnerabilities. The heat map
reveals that Uruguay’s gross financing need is above the benchmark of 15 percent of GDP. This
reflects primarily the short-term nature of the central bank securities. Refinancing risks are
contained as this short-term debt stock is smaller than the central bank’s liquid foreign reserves.
The relatively high value of the change in short-term public debt in 2012 also mostly reflects the
issuance of short-term central bank debt to mop up the liquidity created by the accumulation of
international reserves.
The share of public sector debt held by non-residents and total external financing needs in 2012
are also found to be slightly above the benchmarks, but risks are once again contained by the
presence of high liquidity buffers—strong levels of financial assets and contingent credit lines. In
addition, the current account in 2012 (which accounts for part of the external financing need) was
smaller than the FDI into Uruguay and continued strong prospects for FDI would also help
mitigate external financing risks going forward. Market perceptions of Uruguay’s public debt are
favorable—the moderate risk signaled for market perception in the heat map and in the analysis
of debt profile vulnerabilities reflects a temporary spike in the EMBI bond spread for Uruguay in
August 2013 in the context of generalized financial volatility in emerging markets—the spread has
been below the risk assessment benchmark since mid-September.
Stress Tests
Debt dynamics in Uruguay remain sensitive to shocks. In a stylized downside scenario that
combines a permanent 20 percent exchange rate depreciation (relative to the baseline) with a
temporary drop in growth and primary balances and
a permanent increase in real interest rates, the gross
debt ratio rises by about 15 percentage points over
the five-year forecast horizon. Net debt rises by
about 10 percentage points in the same scenario. The
sensitivity of net debt to exchange rate shocks is
lower than that of gross debt, since the roughly
similar amounts of foreign currency debt and assets
imply offsetting valuation effects in response to
exchange rate changes. Fan charts of the projected
gross debt distribution confirm generally manageable
debt dynamics under statistical distributions of
combined shocks.
0
10
20
30
40
50
60
70
80
90
0
10
20
30
40
50
60
70
80
90
2013 2014 2015 2016 2017 2018
Dynamics of Net Public Debt
(In percent of GDP)
Baseline
Combined Shock
Source: Fund staff calculations.
Note: Combined shock as described in Figure A.2.5.
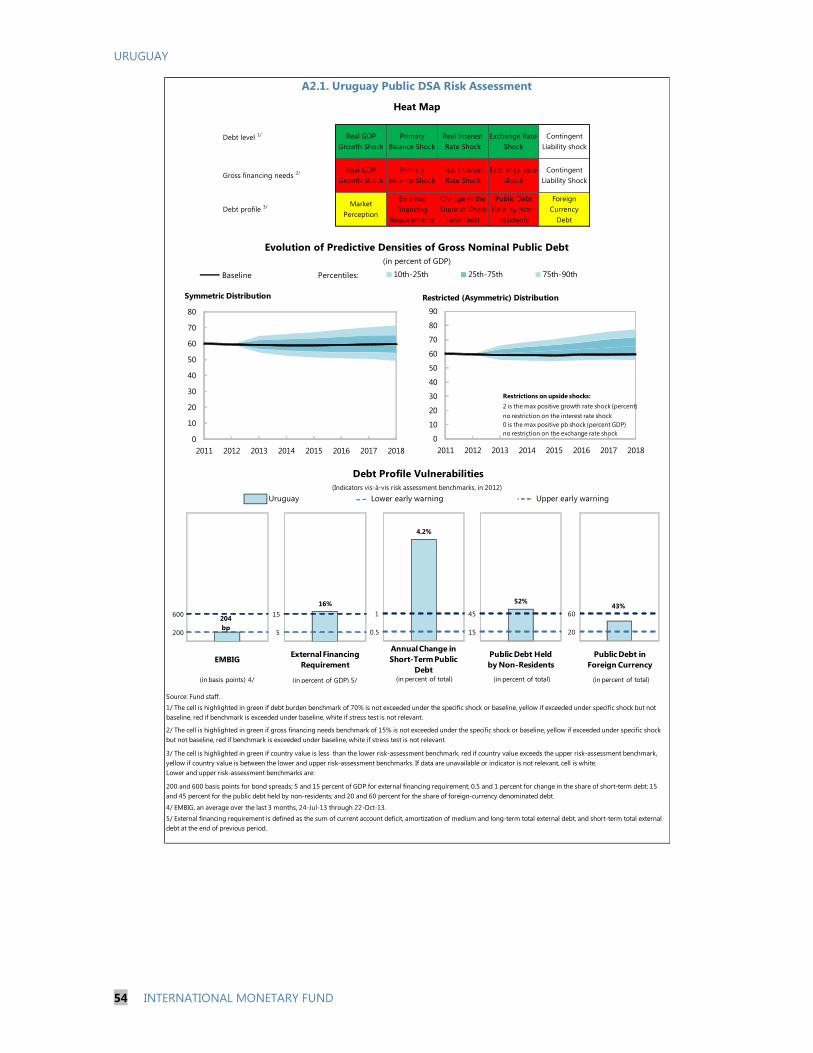
URUGUAY
54 INTERNATIONAL MONETARY FUND
Uruguay
Source: Fund staff.
A2.1. Uruguay Public DSA Risk Assessment
1/ The cell is highlighted in green if debt burden benchmark of 70% is not exceeded under the specific shock or baseline, yellow if exceeded under specific shock but not
baseline, red if benchmark is exceeded under baseline, white if stress test is not relevant.
Real Interest
Rate Shock
External
Financing
Requirements
Real GDP
Growth Shock
Heat Map
Upper early warning
Evolution of Predictive Densities of Gross Nominal Public Debt
(in percent of GDP)
Debt profile 3/
Lower early warning
(Indicators vis-à-vis risk assessment benchmarks, in 2012)
Debt Profile Vulnerabilities
Gross financing needs 2/
Debt level 1/ Real GDP
Growth Shock
Primary
Balance Shock
3/ The cell is highlighted in green if country value is less than the lower risk-assessment benchmark, red if country value exceeds the upper risk-assessment benchmark,
yellow if country value is between the lower and upper risk-assessment benchmarks. If data are unavailable or indicator is not relevant, cell is white.
Lower and upper risk-assessment benchmarks are:
Change in the
Share of Short-
Term Debt
Foreign
Currency
Debt
Public Debt
Held by Non-
Residents
Primary
Balance Shock
Real Interest
Rate Shock
Exchange Rate
Shock
Contingent
Liability Shock
Exchange Rate
Shock
Contingent
Liability shock
5/ External financing requirement is defined as the sum of current account deficit, amortization of medium and long-term total external debt, and short-term total external
debt at the end of previous period.
4/ EMBIG, an average over the last 3 months, 24-Jul-13 through 22-Oct-13.
2/ The cell is highlighted in green if gross financing needs benchmark of 15% is not exceeded under the specific shock or baseline, yellow if exceeded under specific shock
but not baseline, red if benchmark is exceeded under baseline, white if stress test is not relevant.
200 and 600 basis points for bond spreads; 5 and 15 percent of GDP for external financing requirement; 0.5 and 1 percent for change in the share of short-term debt; 15
and 45 percent for the public debt held by non-residents; and 20 and 60 percent for the share of foreign-currency denominated debt.
Market
Perception
20
6043%
1 2
200
600204
bp
1 2
5
15
16%
1 2
0.5
1
4.2%
1 2
EMBIGExternal Financing
Requirement
Annual Change in
Short-Term Public
Debt
Public Debt in
Foreign Currency
(in basis points) 4/ (in percent of GDP) 5/ (in percent of total) (in percent of total)
0
10
20
30
40
50
60
70
80
2011 2012 2013 2014 2015 2016 2017 2018
10th-25th 25th-75th 75th-90thPercentiles:Baseline
Symmetric Distribution
0
10
20
30
40
50
60
70
80
90
2011 2012 2013 2014 2015 2016 2017 2018
Restricted (Asymmetric) Distribution
2 is the max positive growth rate shock (percent)
no restriction on the interest rate shock
0 is the max positive pb shock (percent GDP)
no restriction on the exchange rate shock
Restrictions on upside shocks:
15
45
52%
1 2
Public Debt Held
by Non-Residents
(in percent of total)
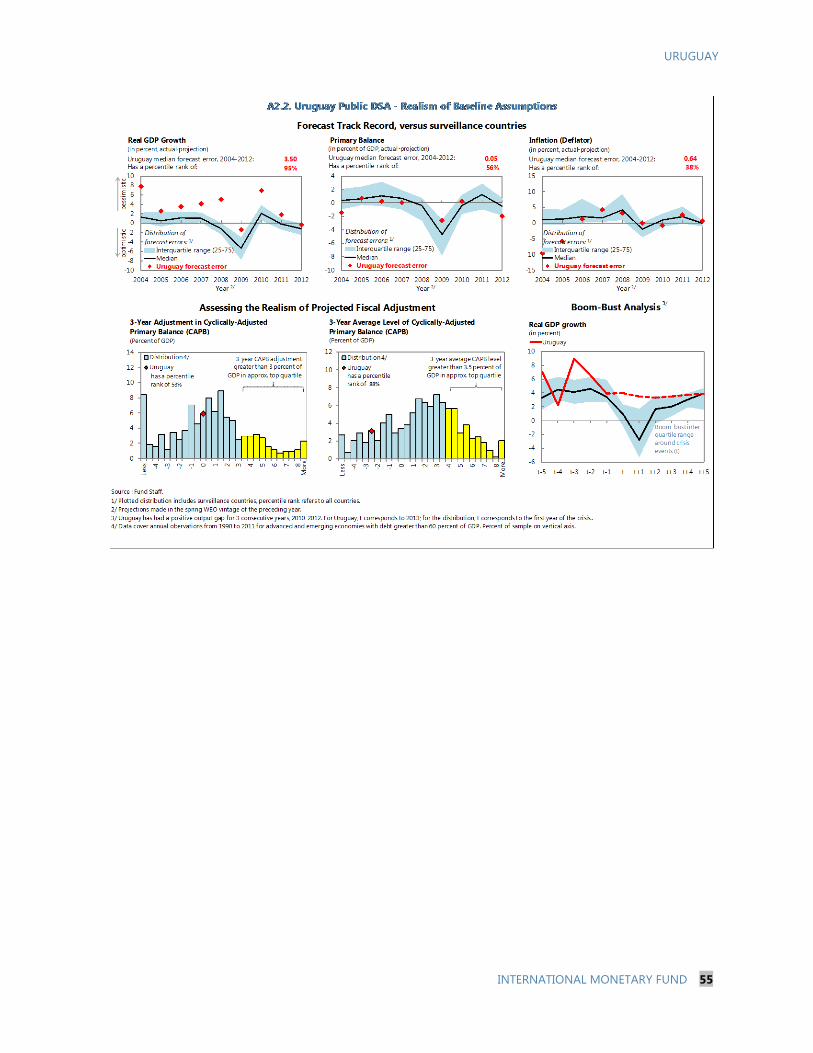
URUGUAY
INTERNATIONAL MONETARY FUND 55

URUGUAY
56 INTERNATIONAL MONETARY FUND
As of October 22, 20132/
2011 2012 2013 2014 2015 2016 2017 2018
Nominal gross public debt 82.0 60.0 59.6 59.2 59.0 58.9 59.3 59.5 59.7 Sovereign Spreads
Of which: guarantees 0.6 0.8 0.9 0.8 0.7 0.6 0.6 0.5 0.5 EMBIG (bp) 3/ 191
Public gross financing needs 14.8 10.9 14.8 16.1 17.1 20.3 17.5 20.0 18.2 5Y CDS (bp) 166
Net public debt 51.0 37.4 37.2 37.3 37.2 37.5 37.9 38.1 38.3
Real GDP growth (in percent) 4.0 6.5 3.9 4.0 3.5 3.3 3.5 3.8 3.9 Ratings Foreign Local
Inflation (GDP deflator, in percent) 8.0 8.0 8.8 8.9 7.5 7.7 7.2 6.8 6.4 Moody's Baa3 Baa3
Nominal GDP growth (in percent) 12.2 15.1 13.0 13.2 11.2 11.3 11.0 10.8 10.5 S&Ps BBB- BBB-
Effective interest rate (in percent) 4/ 5.6 5.5 5.0 5.7 6.6 7.7 7.6 6.9 6.5 Fitch BBB- BBB
2011 2012 2013 2014 2015 2016 2017 2018 cumulative
Change in gross public sector debt 0.7 -1.6 -0.4 -0.4 -0.2 -0.1 0.4 0.2 0.2 0.1
Identified debt-creating flows -2.7 -5.6 -3.4 -3.7 -1.8 -1.7 -1.3 -1.5 -1.7 -11.8
Primary deficit -2.5 -2.0 0.2 -0.8 -0.3 -0.6 -0.6 -0.6 -0.6 -3.5
Primary (noninterest) revenue and grants 30.8 31.9 31.3 32.7 32.6 32.8 32.7 32.7 32.7 196.2
Primary (noninterest) expenditure 28.3 29.9 31.5 31.9 32.3 32.1 32.1 32.1 32.2 192.7
Automatic debt dynamics 5/
-2.5 -5.4 -5.0 -4.0 -2.5 -1.9 -1.8 -2.1 -2.2 -14.4
Interest rate/growth differential 6/
-5.0 -5.1 -4.3 -4.0 -2.5 -1.9 -1.8 -2.1 -2.2 -14.4
Of which: real interest rate -2.0 -1.6 -2.2 -1.9 -0.6 -0.2 0.1 0.0 -0.1 -2.7
Of which: real GDP growth -3.0 -3.5 -2.1 -2.1 -1.9 -1.8 -1.9 -2.0 -2.1 -11.7
Exchange rate depreciation 7/
2.5 -0.3 -0.7 … … … … … … …
Other identified debt-creating flows 2.3 1.8 1.4 1.1 0.9 0.8 1.1 1.1 1.0 6.1
Privatization Receipts (negative) 0.0 0.0 0.0 0.0 0.0 0.0 0.0 0.0 0.0 0.0
Contingent liabilities 0.0 0.0 0.0 0.0 0.0 0.0 0.0 0.0 0.0 0.0
Other debt flows (asset purchases) 2.3 1.8 1.4 1.1 0.9 0.8 1.1 1.1 1.0 6.1
Residual 8/
3.5 4.0 3.0 3.3 1.6 1.6 1.7 1.8 1.9 11.9
Source: Fund staff.
1/ Public sector is defined as consolidated public sector (non-financial public sector and central bank) and includes public guarantees of the central government to the non-financial public sector.
2/ Based on available data.
3/ EMBIG.
4/ Defined as interest payments divided by debt stock (excluding guarantees) at the end of previous year.
5/ Derived as [(r - p(1+g) - g + ae(1+r)]/(1+g+p+gp)) times previous period debt ratio, with r = interest rate; p = growth rate of GDP deflator; g = real GDP growth rate;
a = share of foreign-currency denominated debt; and e = nominal exchange rate depreciation (measured by increase in local currency value of U.S. dollar).
6/ The real interest rate contribution is derived from the denominator in footnote 5 as r - π (1+g) and the real growth contribution as -g.
7/ The exchange rate contribution is derived from the numerator in footnote 5 as ae(1+r).
8/ Includes changes in the stock of guarantees and interest revenues (if any). For projections, includes exchange rate changes during the projection period.
9/ Assumes that key variables (real GDP growth, real interest rate, and other identified debt-creating flows) remain at the level of the last projection year.
A2.3. Uruguay Public Sector Debt Sustainability Analysis (DSA) - Baseline Scenario
-1.1
balance 9/
primary
(in percent of GDP unless otherwise indicated)
Debt, Economic and Market Indicators 1/
2002-2010
Actual
Projections
Contribution to Changes in Public Debt
Projections
2002-2010
Actual
debt-stabilizing
-40
-30
-20
-10
0
10
20
30
40
50
60
70
2002 2003 2004 2005 2006 2007 2008 2009 2010 2011 2012 2013 2014 2015 2016 2017 2018
Debt-Creating Flows
Primary deficit Real GDP growth Real interest rate Exchange rate depreciation
Other debt-creating flows Residual Change in gross public sector debt
projection
(in percent of GDP)
-20
-15
-10
-5
0
5
10
15
20
cumulative
URUGUAY
INTERNATIONAL MONETARY FUND 57
Baseline Scenario 2013 2014 2015 2016 2017 2018 Historical Scenario 2013 2014 2015 2016 2017 2018
Real GDP growth 4.0 3.5 3.3 3.5 3.8 3.9 Real GDP growth 4.0 5.3 5.3 5.3 5.3 5.3
Inflation 8.9 7.5 7.7 7.2 6.8 6.4 Inflation 8.9 7.5 7.7 7.2 6.8 6.4
Primary Balance 0.8 0.3 0.6 0.6 0.6 0.6 Primary Balance 0.8 2.4 2.4 2.4 2.4 2.4
Effective interest rate 5.7 6.6 7.7 7.6 6.9 6.5 Effective interest rate 5.7 6.6 7.1 6.7 5.9 5.4
Constant Primary Balance Scenario
Real GDP growth 4.0 3.5 3.3 3.5 3.8 3.9
Inflation 8.9 7.5 7.7 7.2 6.8 6.4
Primary Balance 0.8 0.8 0.8 0.8 0.8 0.8
Effective interest rate 5.7 6.6 7.6 7.6 6.9 6.5
Source: Fund staff.
Underlying Assumptions(in percent)
A2.4. Uruguay Public DSA - Composition of Public Debt and Alternative Scenarios
Alternative Scenarios
Composition of Public Debt
Baseline Historical Constant Primary Balance
Net debt (in
percent of
GDP)
0
10
20
30
40
50
60
70
2011 2012 2013 2014 2015 2016 2017 2018
Gross Nominal Public Debt
(in percent of GDP)
projection
0
5
10
15
20
25
30
2011 2012 2013 2014 2015 2016 2017 2018
Public Gross Financing Needs
(in percent of GDP)
projection
0
20
40
60
80
100
120
2002 2004 2006 2008 2010 2012 2014 2016 2018
By Maturity
Medium and long-term
Short-term
projection
(in percent of GDP)
0
20
40
60
80
100
120
2002 2004 2006 2008 2010 2012 2014 2016 2018
By Currency
Local currency-denominated
Foreign currency-denominated
projection
(in percent of GDP)

URUGUAY
58 INTERNATIONAL MONETARY FUND
2013 2014 2015 2016 2017 2018 2013 2014 2015 2016 2017 2018
Primary Balance Shock Real GDP Growth Shock
Real GDP growth 4.0 3.5 3.3 3.5 3.8 3.9 Real GDP growth 4.0 1.3 1.1 3.5 3.8 3.9
Inflation 8.9 7.5 7.7 7.2 6.8 6.4 Inflation 8.9 6.9 7.2 7.2 6.8 6.4
Primary balance 0.8 -0.4 -0.1 0.6 0.6 0.6 Primary balance 0.8 -0.6 -1.1 0.6 0.6 0.6
Effective interest rate 5.7 6.6 7.7 7.8 7.0 6.6 Effective interest rate 5.7 6.6 7.8 7.9 7.1 6.6
Real Interest Rate Shock Real Exchange Rate Shock
Real GDP growth 4.0 3.5 3.3 3.5 3.8 3.9 Real GDP growth 4.0 3.5 3.3 3.5 3.8 3.9
Inflation 8.9 7.5 7.7 7.2 6.8 6.4 Inflation 8.9 12.5 7.7 7.2 6.8 6.4
Primary balance 0.8 0.3 0.6 0.6 0.6 0.6 Primary balance 0.8 0.3 0.6 0.6 0.6 0.6
Effective interest rate 5.7 6.6 8.2 8.7 8.2 8.0 Effective interest rate 5.7 7.0 7.5 7.5 6.9 6.5
0.0 20.0 20.0 20.0 20.0 20.0
Combined Shock
Real GDP growth 4.0 1.3 1.1 3.5 3.8 3.9
Inflation 8.9 6.9 7.2 7.2 6.8 6.4
Primary balance 0.8 -0.6 -1.1 0.6 0.6 0.6
Effective interest rate 5.7 7.0 8.1 8.7 8.2 8.0
0.0 20.0 20.0 20.0 20.0 20.0
Source: Fund staff.
1/ For a description of the scenarios see http://www.imf.org/external/pubs/ft/dsa/mac.htm.
Nominal Exchange rate
deviation from baseline
Nominal Exchange rate
deviation from baseline
(in percent)
A2.5. Uruguay Public Gross DSA - Stress Tests 1/
Macro-Fiscal Stress Tests
Baseline Primary Balance Shock
Real GDP Growth Shock
Real Interest Rate Shock
Real Exchange Rate Shock
Combined Macro-Fiscal Shock
Additional Stress Tests
Baseline
Underlying Assumptions
40
45
50
55
60
65
70
2013 2014 2015 2016 2017 2018
Gross Nominal Public Debt(in percent of GDP)
0
50
100
150
200
250
2013 2014 2015 2016 2017 2018
Gross Nominal Public Debt
(in percent of Revenue)
0
10
20
30
40
50
2013 2014 2015 2016 2017 2018
Public Gross Financing Needs
(in percent of GDP)
0
10
20
30
40
50
60
70
80
2013 2014 2015 2016 2017 2018
Gross Nominal Public Debt(in percent of GDP)
0
50
100
150
200
250
2013 2014 2015 2016 2017 2018
Gross Nominal Public Debt
(in percent of Revenue)
0
10
20
30
40
50
2013 2014 2015 2016 2017 2018
Public Gross Financing Needs
(in percent of GDP)
Annex III. External Debt Sustainability Analysis (DSA)
Projections
2008 2009 2010 2011 2012 2013 2014 2015 2016 2017 2018 Debt-stabilizing
non-interest
current account 7/
1 Baseline: External debt 1/ 50.7 59.4 47.4 39.5 42.3 42.3 41.7 41.5 41.3 40.7 40.9 -5.7
2 Change in external debt -12.5 8.7 -12.0 -7.9 2.8 0.0 -0.6 -0.2 -0.2 -0.6 0.1
3 Identified external debt-creating flows (4+8+9) -15.6 -3.5 -17.2 -10.2 -2.9 -1.8 -2.2 -2.7 -2.5 -2.5 -2.4
4 Current account deficit, excluding interest payments 3.0 -1.4 -0.3 1.1 3.9 3.4 2.4 2.2 2.1 2.2 2.3
5 Deficit in balance of goods and services 3.2 -1.7 -1.6 -0.2 2.7 2.2 1.1 1.0 0.9 0.9 1.0
6 Exports 30.9 28.8 27.6 27.7 26.6 23.7 25.2 25.5 25.9 26.3 26.8
7 Imports 34.0 27.1 26.0 27.5 29.3 25.9 26.3 26.5 26.8 27.2 27.8
8 Net non-debt creating capital inflows (negative) -6.9 -5.0 -5.9 -5.4 -5.6 -5.3 -4.5 -4.4 -4.4 -4.4 -4.3
9 Automatic debt dynamics 2/ -11.6 2.9 -11.0 -5.9 -1.3 0.1 -0.1 -0.4 -0.2 -0.3 -0.3
10 Contribution from nominal interest rate 2.7 2.7 2.1 1.9 1.4 1.5 1.3 0.9 1.1 1.1 1.1
11 Contribution from real GDP growth -3.5 -1.1 -4.1 -2.6 -1.4 -1.5 -1.4 -1.3 -1.4 -1.5 -1.5
12 Contribution from price and exchange rate changes 3/ -10.9 1.4 -9.0 -5.2 -1.3 ... ... ... ... ... ...
13 Residual, incl. change in gross foreign assets (2-3) 4/ 3.1 12.2 5.2 2.3 5.7 1.8 1.6 2.5 2.4 1.9 2.5
External debt-to-exports ratio (in percent) 164.3 206.1 171.9 142.5 159.0 178.6 165.4 162.8 159.5 154.9 152.6
Gross external financing need (in billions of US dollars) 5/ 6.4 5.9 8.2 8.8 8.8 12.1 10.7 11.2 11.6 12.4 13.3
in percent of GDP 21.2 19.4 21.0 18.9 17.7 10-Year 10-Year 21.0 17.8 17.7 17.4 17.3 17.5
Scenario with key variables at their historical averages 6/ 42.3 34.3 27.8 21.5 15.3 9.9 -6.1
Historical Standard
Key Macroeconomic Assumptions Underlying Baseline Average Deviation
Real GDP growth (in percent) 7.2 2.2 8.9 6.5 3.9 5.3 2.2 4.0 3.5 3.3 3.5 3.8 3.9
GDP deflator in US dollars (change in percent) 20.8 -2.6 18.0 12.2 3.4 8.6 10.6 10.4 1.3 2.1 2.2 2.5 2.6
Nominal external interest rate (in percent) 5.6 5.2 4.6 4.7 3.9 5.3 0.9 4.2 3.2 2.2 2.9 2.9 3.0
Growth of exports (US dollar terms, in percent) 35.2 -7.1 23.0 20.0 3.2 18.0 13.6 2.1 11.7 6.7 7.6 7.9 8.6
Growth of imports (US dollar terms, in percent) 52.5 -20.7 23.2 26.7 14.4 20.9 19.1 1.4 6.8 6.0 7.1 8.1 8.7
Current account balance, excluding interest payments -3.0 1.4 0.3 -1.1 -3.9 1.3 3.2 -3.4 -2.4 -2.2 -2.1 -2.2 -2.3
Net non-debt creating capital inflows 6.9 5.0 5.9 5.4 5.6 5.3 1.5 5.3 4.5 4.4 4.4 4.4 4.3
1/ External debt includes non-resident deposits.
2/ Derived as [r - g - r(1+g) + ea(1+r)]/(1+g+r+gr) times previous period debt stock, with r = nominal effective interest rate on external debt; r = change in domestic GDP deflator in US dollar terms, g = real GDP
growth rate, e = nominal appreciation (increase in dollar value of domestic currency), and a = share of domestic-currency denominated debt in total external debt.
3/ The contribution from price and exchange rate changes is defined as [-r(1+g) + ea(1+r)]/(1+g+r+gr) times previous period debt stock. r increases with an appreciating domestic currency (e > 0) and rising
inflation (based on GDP deflator).
4/ For projection, line includes the impact of price and exchange rate changes.
5/ Defined as current account deficit, plus amortization on medium- and long-term debt, plus short-term debt at end of previous period.
6/ The key variables include real GDP growth; nominal interest rate; dollar deflator growth; and both non-interest current account and non-debt inflows in percent of GDP.
7/ Long-run, constant balance that stabilizes the debt ratio assuming that key variables (real GDP growth, nominal interest rate, dollar deflator growth, and non-debt inflows in percent of GDP) remain at their
levels of the last projection year.
Actual
Table A3.1. Uruguay: External Debt Sustainability Framework, 2008-2018
(In percent of GDP, unless otherwise indicated)
UR
UG
UA
Y
IN
TER
NA
TIO
NA
L MO
NETA
RY F
UN
D
59

URUGUAY
60 INTERNATIONAL MONETARY FUND
i-rate
shock42
Baseline 41
20
30
40
50
60
70
80
90
100
2008 2010 2012 2014 2016 2018
Interest rate shock (in percent)
Figure A3.1. Uruguay: External Debt Sustainability: Bound Tests 1/ 2/ 3/
(External debt in percent of GDP)
Sources: International Monetary Fund, Country desk data, and staff estimates.
1/ Shaded areas represent actual data. Individual shocks are permanent one-half standard deviation
shocks. Figures in the boxes represent average projections for the respective variables in the baseline
and scenario being presented. Ten-year historical average for the variable is also shown.
2/ For historical scenarios, the historical averages are calculated over the ten-year period, and the
information is used to project debt dynamics five years ahead.
3/ External debt includes non-resident deposits.
4/ Permanent 1/4 standard deviation shocks applied to real interest rate, growth rate, and current
account balance.
5/ One-time real depreciation of 30 percent occurs in 2010.
Historical
10
Baseline 41
0
5
10
15
20
25
0
10
20
30
40
50
60
70
80
90
100
2008 2010 2012 2014 2016 2018
Baseline and historical scenarios
CA shock 48
Baseline 41
20
30
40
50
60
70
80
90
100
2008 2010 2012 2014 2016 2018
Combined
shock 46
Baseline 41
20
30
40
50
60
70
80
90
100
2008 2010 2012 2014 2016 2018
Combined shock 4/
30 % depreciation 61
Baseline 41
20
30
40
50
60
70
80
90
100
2008 2010 2012 2014 2016 2018
Real depreciation shock 5/
Gross financing need
under baseline
(right scale)
Non-interest current account shock
(in percent of GDP)
Growth
shock 43
Baseline 41
20
30
40
50
60
70
80
90
100
2008 2010 2012 2014 2016 2018
Baseline:
Scenario:
Historical:
2.8
3.3
5.3
Baseline:
Scenario:
Historical:
3.6
2.5
5.3
Baseline:
Scenario:
Historical:
-2.2
-3.9
1.3
Growth shock
(in percent per year)

URUGUAY
STAFF REPORT FOR THE 2013 ARTICLE IV
CONSULTATION—INFORMATIONAL ANNEX
Prepared By
The Western Hemisphere Department
FUND RELATIONS ________________________________________________________________________ 2
RELATIONS WITH THE WORLD BANK UNDER JMAP ___________________________________ 4
RELATIONS WITH THE INTER-AMERICAN DEVELOPMENT BANK _____________________ 5
STATISTICAL ISSUES _____________________________________________________________________ 7
CONTENTS
October 29, 2013

URUGUAY
2 INTERNATIONAL MONETARY FUND
FUND RELATIONS
(As of August 31, 2013)
Membership Status: Joined: March 11, 1946 Article VIII
General Resources Account: SDR Million % Quota
Quota 306.50 100.00
Fund holdings of currency 198.39 64.73
Reserve Tranche Position 108.12 35.28
SDR Department: SDR Million % Allocation
Net cumulative allocation 293.26 100.00
Holdings 245.68 83.78
Outstanding Purchases and Loans: None
Latest Financial Arrangements:
Date of Expiration Amount Approved Amount Drawn
Type Arrangement Date (SDR Million) (SDR Million)
Stand-By Jun 08, 2005 Dec 27, 2006 766.25 263.59
Stand-By Apr 01, 2002 Mar 31, 2005 1,988.50 1,988.50
Of which: SRF Jun 25, 2002 Aug 08, 2002 128.70 128.70
Stand-By May 31, 2000 Mar 31, 2002 150.00 150.00
Projected Payments to Fund 1/
(SDR Million; based on existing use of resources and present holdings of SDRs):
Forthcoming
2013 2014 2015 2016 2017
Principal
Charges/Interest 0.01 0.03 0.03 0.03 0.03
Total 0.01 0.03 0.03 0.03 0.03
1/ When a member has overdue financial obligations outstanding for more than three months,
the amount of such arrears will be shown in this section.
Ex-Post Assessment. The last Ex-Post Assessment of Longer-Term Program Engagement was
considered by the Executive Board on August 29, 2007 (Country Report No. 08/47).
Exchange Rate Arrangement. The currency is the Uruguayan peso (Ur$). Uruguay has followed an
independently floating exchange rate regime since July 29, 2002. Since July 2013, targets for M1
plus saving deposits have replaced the overnight interbank rate, as intermediate monetary policy

URUGUAY
INTERNATIONAL MONETARY FUND 3
instrument. In 2008, Uruguay’s de facto exchange rate regime was reclassified from a managed
float with no predetermined path for the exchange rate to a floating exchange rate regime. On
October 14, 2013, the exchange rate in the official market was Ur$ 21.657 per U.S. dollar. Uruguay
has accepted the obligations of Article VIII and maintains an exchange rate system free of
restrictions on payments and transfers for current international transactions.
FSAP Participation and ROSCs. The Financial Sector Stability Assessment (FSSA) was considered
by the Executive Board on June 28, 2006 (Country Report No. 06/187). An FSAP Update was
considered by the Executive Board on December 10, 2012 (Country Report No.13/152). The ROSC-
module on fiscal transparency was published on March 5, 2001. A ROSC-module on data
dissemination practices was published on October 18, 2001. The ROSC on Anti-Money Laundering
and Combating the Financing of Terrorism (AML/CFT) was published on December 2006 (Country
Report No. 06/435). A data ROSC reassessment mission was undertaken during August 2012.
Technical Assistance 2008–12
DPT Purpose Date of Delivery
FAD Private public partnerships.
Tax, customs, and social security administration.
May 2010
November 2012, March 2011,
September 2010.
LEG TA to assist the authorities on the launch of the recently
designed AML/CFT national strategy.
TA to assist the authorities on the elaboration of a risk-
based national strategy enhancing the AML/CFT regime.
TA to conduct a money laundering/terrorist financing
country risk assessment consistent with the objectives of
the national AML/CFT strategy.
June 2012
December 2010
January, April, and July 2009
MCM FSAP update. September 2012
STA ROSC reassessment mission. August 2012
Government Finance Statistics, to assist in improving the
quality of public debt data.
February 2008
Article IV Consultation. The 2012 Article IV consultation was concluded by the Executive Board on
December 10, 2012 (Country Report No. 13/108). Uruguay is on the standard consultation cycle
governed by the provisions approved by the Executive Board on July 15, 2002.

URUGUAY
4 INTERNATIONAL MONETARY FUND
RELATIONS WITH THE WORLD BANK UNDER JMAP
Title Products Provisional
Timing of
Missions
Expected Delivery
Date*
A. Mutual Information on Relevant Work Programs
A. Lending
Bank work program
for next 12 months
1. UY Public Sector Management and
Social Inclusion DPL/DDO
October 2012
2. UY 2nd
Programmatic Public Sector
Management, Competitiveness and
Social Inclusion DPL/DDO
September 2012
3. UY Full-Time School Expansion
Project
July 2012
4. Road Rehabilitation and Maintenance
Program
November 2012
5. Support to Uruguayan Public Schools
Project
November 2012
6. UY OSE Sustainable and Efficient September 2012
B. ESW
1. Uruguay Social Programs Assessment September 2013
2. Pro-growth public policies,
competitiveness and business
investment climate
June 2015
3. Water for Uruguay April 2015
4. Social Protection and Early Childhood
Development Policies
May 2015
C. Technical Assistance
1. UY Access to Finance March 2014
2. Designing the Uruguay Rail Sector
Regulator
June 2014
*This corresponds to Delivery to Board in lending projects, and delivery to client in of AAAs.
URUGUAY
INTERNATIONAL MONETARY FUND 5
RELATIONS WITH THE INTER-AMERICAN
DEVELOPMENT BANK
(As of August 31, 2013)
The Inter-American Development Bank’s Board of Executive Directors approved in August 2011 the
new Country Strategy with Uruguay (2010–2015). Sovereign-guaranteed lending under the new
program is expected to reach approximately US$1.8 billion, which is considered to be consistent
with Uruguay’s five year budget. The program includes additional non reimbursable financing for
technical assistance and analytical work. Lending under the previous Country Strategy (2005–2009)
reached approximately US$1.3 billion.
Under the new Strategy, the national authorities and the Bank identified the following priority
sectors in which the IDB Group would focus both its financial and non-financial products and
services: (i) transport; (ii) energy; (iii) water, sanitation, and solid waste; (iv) science and technology;
(v) social protection; (vi) education and job training; (vii) agribusiness; (viii) services exports;
(ix) public management and finances; and (x) urban development and citizen security. It is also
expected that all four of the Bank’s private sector windows will approve loans and technical
assistance in the energy, transport, agribusiness and global services sectors. The strategic areas were
selected taking into account: (i) a context of strong economic growth, which imposes heavy
investment requirements on a number of sectors; (ii) business opportunities, which in turn
contribute to the Bank’s institutional goals within the framework of the 9th
General Capital Increase;
(iii) greater complementarity between the multilateral financial institutions working in Uruguay;
(iv) the Bank’s accumulated operational experience and technical knowledge from having worked for
several decades in the country; and (v) the government’s interest for continued IDB engagement
As of August 31th
2013, the Bank’s portfolio in Uruguay includes loans for the financing of 40
projects; six of which are without sovereign guarantee. The lending portfolio amounts to US$2,435.4
million, of which US$1,333.7 million are pending disbursement. Disbursements in 2013 are expected
to total US$185.4 million. The current portfolio includes lending to support the Government in the
following sectors: infrastructure and environment (19 loans adding US$905.1 million and
representing 37% of the approved amounts); social sector (4 loans adding US$97.2 million,
representing 4% of the approved amounts); institutional capacity and finance (12 loans adding
US$229.0 million and representing 9% of the approved amounts) and integration and trade (5 loans,

URUGUAY
6 INTERNATIONAL MONETARY FUND
adding US$577.0 million; 24% of the approved amounts). The portfolio also includes 7 loans to the
private sector for US$627.1 million (26% of the approved amounts).In 2013, the Bank approved
loans to the public sector in the areas of integration (US$550 MM) and transportation
(US$18.3 million).
Financial Relations with the Inter-American Development Bank1
(In millions of U.S. dollars)
Total Outstanding Loans: US$1,855.1 (As of August 31, 2013)
Loan Transactions
2004 2005 2006 2007 2008 2009 2010 2011 2012 2013p
Disbursement 57.6 242.3 114.8 112.9 337.2 477.3 54.3 177.2 272.8 185.4
Amortization 113.0 222.3 520.8 142.1 138.7 160.8 463.9 114.2 119.5 591.9
Net Loan Flows -55.5 20.0 -406.0 -29.2 198.5 316.5 -409.6 63.0 153.2 -406.5
Source: Inter-American Development Bank.
1/ Only loans with sovereign guarantee are considered.

URUGUAY
INTERNATIONAL MONETARY FUND 7
STATISTICAL ISSUES
(As of September 30, 2013)
I. Assessment of Data Adequacy for Surveillance
General: Data provision has some shortcomings, but broadly adequate for surveillance. Most
affected area is national accounts.
National accounts: In 2009, the Uruguayan authorities completed a revision of national
accounts statistics, in which they updated the benchmark year (from 1983 to 1997 and 2005) and
adopted the System of National Accounts 1993 (SNA93). However, national accounts statistics still
have some shortcomings, limited coverage of the enterprise survey, poor quality source data for
some components of GDP, inadequate information on the informal economy, and incomplete
quarterly accounts. Household consumption is not independently derived and changes in
inventories are obtained as residuals. Household income and expenditure survey are conducted
every ten years. The central bank (BCU) compiles and disseminates annual GDP estimates in
current and at previous year prices by the production and expenditure approaches, as well as
quarterly constant price GDP estimates by the production and expenditure approaches. Gross
national income, gross disposable income and gross savings are also available annually.
Consumer prices: Both the consumer and wholesale price indices are reported on a regular and
timely basis for publication in the IFS. The new base period for the consumer price index is
December 2010 = 100. The CPI has national coverage and includes more than forty thousand
price quotations. It does not cover either the implicit rent or the net acquisitions of owner-
occupied dwellings. The base of the wholesale price index has been updated to 2001. Producer
price indices (March 2010 =100) for national products have been recently disseminated. The PPI
does not cover utilities, construction, business and other services and exported output. The
authorities do not provide trade price and volume indices for publication in the International
Financial Statistics (IFS).
Government finance statistics: Official data on the central administration, the state enterprises
and the social security system are complete and current, but there are problems with the
timeliness of the data on local governments. There are also problems with the timeliness of
financing and debt data reported for inclusion in the Fund’s statistical publications. Information
on a monthly and quarterly basis for financing and debt data respectively, are disseminated on
the BCU website from 1999 onwards for the central government and total public sector, but no
information is reported for publication in the International Financial Statistics. The information
reported for publication in the Government Finance Statistics Yearbook covers transactions on
revenue and expense for the consolidated central government (data on revenue and expense for
local governments have not been reported since 1994), and the general government’s operations
on financial assets and liabilities, both in terms of flows (financing) and stocks (debt).
URUGUAY
8 INTERNATIONAL MONETARY FUND
Monetary and financial statistics: Monetary and financial statistics are prepared in accordance
with the IMF's Monetary and Financial Statistics Manual (2000). Authorities report monetary data
for the central bank, other depository corporations, and other financial corporations (OFCs) using
the standardized reporting forms (SRFs). However, data for the OFCs are limited to off-shore
financial institutions. A mission could be fielded to expand the institutional coverage of the OFCs
and compile the SRF for OFCs with full institutional coverage. Authorities reported annual
Financial Soundness Indicators (FSI) for 2008, 2009, and 2010. The authorities have not
responded to the queries sent regarding the 2009 and 2010 data. Historical series and updates
have not been submitted.
External sector statistics: Balance of payments statements are compiled and published on a
quarterly basis. Data are compiled following the recommendations of the fifth edition of the
Balance of Payments Manual. Uruguay compiles and reports to STA quarterly data on balance of
payments and annual data on the international investment position (IIP) for publication in the IFS
and the Balance of Payments Statistics Yearbook. New surveys are allowing for improved
coverage of the private sector in the IIP.
Uruguay started disseminating the international reserves and foreign currency liquidity data
template on the Fund’s external website in 2005. The BCU also disseminates quarterly external
debt statistics in the format prescribed by the SDDS on the National Summary Data Page (NSDP).
II. Data Standards and Quality
Uruguay subscribed to the SDDS in
February 2004 and is in observance.
Data ROSC published on October 1, 2001.
A data ROSC mission on CPI and NA was
conducted in August 2012.
III. Reporting to STA (Optional)
Annual GFS are regularly reported to STA for publication in the Government Finance Statistics
Yearbook. No high frequency GFS are reported for publication in the International Financial
Statistics.

URUGUAY
INTERNATIONAL MONETARY FUND 9
Uruguay: Common Indicators Required for Surveillance
(As of October 29, 2013)
Date of
Latest
Observation
Date
Received
Frequency
of
Data 6/
Frequency
of
Reporting 6/
Frequency
of
Publication 6/
Exchange Rates Oct. 08, 2013 10/09/13 D D D
International Reserve Assets and Reserve
Liabilities of the Monetary Authorities 1/
July 2013 9/30/13 M M M
Reserve/Base Money July 2013 9/30/13 M M M
Broad Money July 2013 9/30/13 M M M
Central Bank Balance Sheet July 2013 9/30/13 M M M
Consolidated Balance Sheet of the
Banking System
July 2013 9/30/13 M M M
Interest Rates 2/
Oct. 08, 2013 10/09/13 D D D
Consumer Price Index Sept. 2013 10/03/13 M M M
Revenue, Expenditure, Balance and
Composition of Financing 3/
– Central
Government4/
Aug. 2013 9/30/13 M M M
Stocks of Central Government and
Central Government-Guaranteed Debt 4,5/
Q2/13 9/30/13 Q Q Q
External Current Account Balance Q2/13 9/27/13 Q Q Q
Exports and Imports of Goods and
Services
Q2/13 9/27/13 Q Q Q
GDP/GNP Q2/13 9/13/13 Q Q Q
Gross External Debt
Q2/13 9/30/13 Q Q Q
1/ Includes reserve assets pledged or otherwise encumbered as well as net derivative positions.
2/ Both market-based and officially-determined, including discount rates, money market rates, rates on treasury bills,
notes and bonds. 3/ Foreign, domestic bank, and domestic nonbank financing.
4/ The general government consists of the central government (budgetary funds, extra budgetary funds, and social
security funds) and state and local governments. 5/ Includes currency and maturity composition.
6/ Daily (D); weekly (W); monthly (M); quarterly (Q); annually (A); irregular (I); and not available (NA).
Press Release No. 13/461
FOR IMMEDIATE RELEASE
November 20, 2013
IMF Executive Board Concludes 2013 Article IV Consultation with Uruguay
On November 13, 2013, the Executive Board of the International Monetary Fund (IMF)
concluded the Article IV consultation1 with Uruguay.
Uruguay has experienced a decade of strong and inclusive expansion since its 2002 crisis,
resulting in an impressive rise in Uruguayan living standards. Key drivers of this
performance included important institutional reforms, large foreign direct investment (FDI)
projects attracted by Uruguay’s stable macroeconomic environment and business-friendly
investment climate, and favorable external conditions. The result has been a strong rise in
employment, real wages, and consumption. Poverty rates have declined sharply.
Growth has moderated to a more sustainable pace since 2012, mostly owing to weaker
external demand. Real GDP growth is projected at 4 percent in 2013 and 3.5 percent in 2014.
Fiscal policy loosened in 2012 and is set to remain slightly expansionary in 2013. Annual
inflation, at 9.0 percent in September, remains outside the current target range (4–6 percent).
The Uruguayan peso appreciated against the backdrop of swelling capital inflows in the year
to May 2013. In June 2013, the authorities announced a new reserve requirement on foreign
purchases of Treasury notes to discourage further portfolio inflows and tightened the
monetary policy stance significantly. Since then, portfolio inflows appear to have come to a
stop and the Uruguayan peso has depreciated against the U.S. dollar, also reflecting a
tightening in global financial conditions following the U.S. Federal Reserve’s signal of a
prospective tapering of its asset purchases.
The outlook for the Uruguayan economy is solid, but risks and challenges remain. The
economy is exposed to the risk of inward spillovers from external developments and risks
from domestic wage and cost pressures. Uruguay’s financial vulnerabilities are modest, and
the government has reduced debt vulnerabilities significantly and built important financial
buffers. Still, above-target inflation and the desirability of reducing further the net debt of the
1 Under Article IV of the IMF's Articles of Agreement, the IMF holds bilateral discussions with members,
usually every year. A staff team visits the country, collects economic and financial information, and discusses
with officials the country's economic developments and policies. On return to headquarters, the staff prepares a
report, which forms the basis for discussion by the Executive Board.
International Monetary Fund
700 19th
Street, NW
Washington, D. C. 20431 USA
2
public sector constrain the policy space. The longer-term policy priority is to sustain high
growth rates for productivity, and human and physical capital investment.
Executive Board Assessment2
Executive Directors commended Uruguay’s strong economic performance and success in
reducing poverty over the past decade. Directors noted that the outlook for the economy
remains solid, but there are risks stemming from domestic factors and the uncertain external
environment. They agreed that policies going forward should be geared towards preserving
the gains made so far by facilitating a smooth landing in the near term, and boosting potential
growth in the medium term, while lowering inflation and safeguarding competitiveness.
Directors supported the recent tightening of the monetary policy stance in view of the above
target and rising inflation. They took note of the change in the operational target for
monetary policy and encouraged the authorities to enhance their communication of the
targeted policy stance. It will also be important to monitor the effectiveness of the new
framework in delivering the inflation targets. While Directors considered the broadening of
capital flow management measures to be useful given Uruguay’s macroeconomic situation,
they generally underscored that such measures should be temporary.
Directors agreed that prudent wage growth would help in lowering inflation, curbing the risk
of overheating, and safeguarding competitiveness. They stressed that reducing the use of
backward-indexation in wage contracts would make employment more resilient against
adverse shocks. Directors welcomed the authorities’ recent guidelines for the design of
non-indexed wages and encouraged them to promote these guidelines.
Directors considered that a tighter fiscal policy stance would be better aligned with the goal
of reducing inflation and further decreasing net public debt. In this context, they emphasized
the desirability to reduce the overall deficit, exploring both revenue and expenditure options,
while protecting priority social and infrastructure spending.
Directors underscored that maintaining solid and stable growth will require additional
financial and structural reforms. They commended the progress made in implementation of
the 2012 FSAP and looked forward to implementation of the envisaged financial sector
reform agenda, including further steps relating to financial deepening. Priority should also be
given to boosting public infrastructure and raising the efficiency of labor markets, while
ensuring appropriate protection for workers.
2 At the conclusion of the discussion, the Managing Director, as Chairman of the Board, summarizes the views
of Executive Directors, and this summary is transmitted to the country's authorities. An explanation of any
qualifiers used in summings up can be found here: http://www.imf.org/external/np/sec/misc/qualifiers.htm.
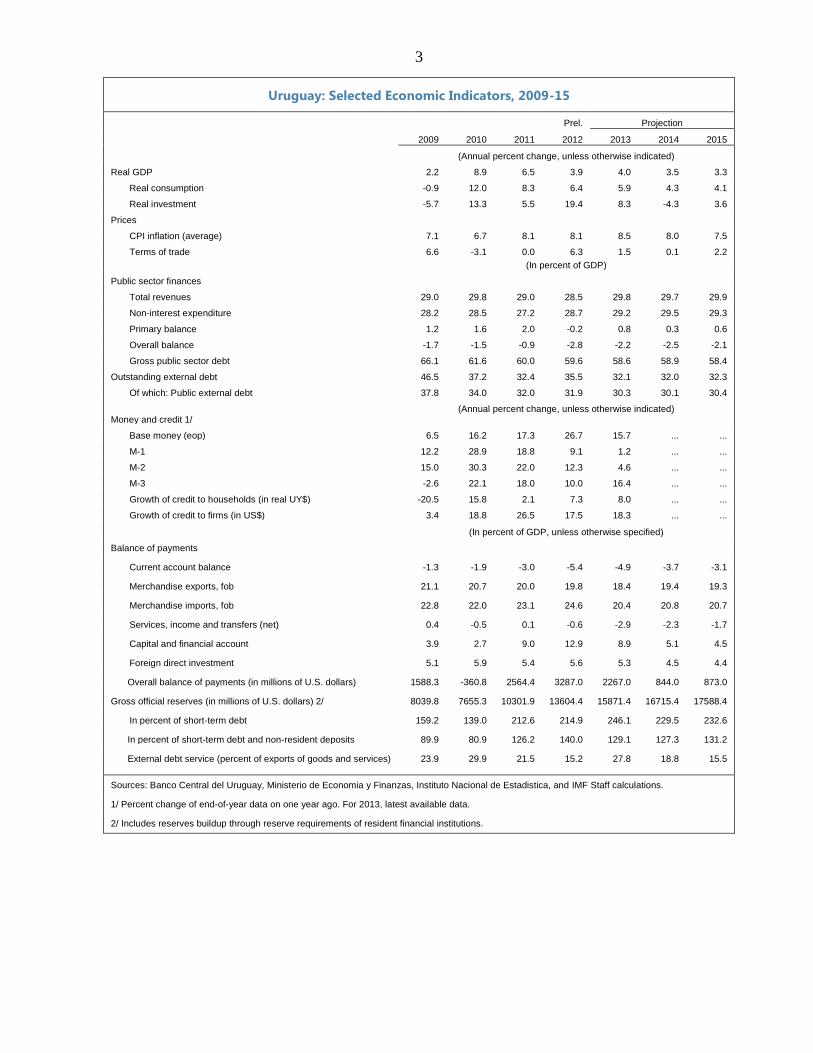
3
Uruguay: Selected Economic Indicators, 2009-15
Prel. Projection
2009 2010 2011 2012 2013 2014 2015
(Annual percent change, unless otherwise indicated)
Real GDP 2.2 8.9 6.5 3.9 4.0 3.5 3.3
Real consumption -0.9 12.0 8.3 6.4 5.9 4.3 4.1
Real investment -5.7 13.3 5.5 19.4 8.3 -4.3 3.6
Prices
CPI inflation (average) 7.1 6.7 8.1 8.1 8.5 8.0 7.5
Terms of trade 6.6 -3.1 0.0 6.3 1.5 0.1 2.2
(In percent of GDP)
Public sector finances
Total revenues 29.0 29.8 29.0 28.5 29.8 29.7 29.9
Non-interest expenditure 28.2 28.5 27.2 28.7 29.2 29.5 29.3
Primary balance 1.2 1.6 2.0 -0.2 0.8 0.3 0.6
Overall balance -1.7 -1.5 -0.9 -2.8 -2.2 -2.5 -2.1
Gross public sector debt 66.1 61.6 60.0 59.6 58.6 58.9 58.4
Outstanding external debt 46.5 37.2 32.4 35.5 32.1 32.0 32.3
Of which: Public external debt 37.8 34.0 32.0 31.9 30.3 30.1 30.4
(Annual percent change, unless otherwise indicated) Money and credit 1/
Base money (eop) 6.5 16.2 17.3 26.7 15.7 ... ...
M-1 12.2 28.9 18.8 9.1 1.2 ... ...
M-2 15.0 30.3 22.0 12.3 4.6 ... ...
M-3 -2.6 22.1 18.0 10.0 16.4 ... ...
Growth of credit to households (in real UY$) -20.5 15.8 2.1 7.3 8.0 ... ...
Growth of credit to firms (in US$) 3.4 18.8 26.5 17.5 18.3 ... ...
(In percent of GDP, unless otherwise specified)
Balance of payments
Current account balance -1.3 -1.9 -3.0 -5.4 -4.9 -3.7 -3.1
Merchandise exports, fob 21.1 20.7 20.0 19.8 18.4 19.4 19.3
Merchandise imports, fob 22.8 22.0 23.1 24.6 20.4 20.8 20.7
Services, income and transfers (net) 0.4 -0.5 0.1 -0.6 -2.9 -2.3 -1.7
Capital and financial account 3.9 2.7 9.0 12.9 8.9 5.1 4.5
Foreign direct investment 5.1 5.9 5.4 5.6 5.3 4.5 4.4
Overall balance of payments (in millions of U.S. dollars) 1588.3 -360.8 2564.4 3287.0 2267.0 844.0 873.0
Gross official reserves (in millions of U.S. dollars) 2/ 8039.8 7655.3 10301.9 13604.4 15871.4 16715.4 17588.4
In percent of short-term debt 159.2 139.0 212.6 214.9 246.1 229.5 232.6
In percent of short-term debt and non-resident deposits 89.9 80.9 126.2 140.0 129.1 127.3 131.2
External debt service (percent of exports of goods and services) 23.9 29.9 21.5 15.2 27.8 18.8 15.5
Sources: Banco Central del Uruguay, Ministerio de Economia y Finanzas, Instituto Nacional de Estadistica, and IMF Staff calculations.
1/ Percent change of end-of-year data on one year ago. For 2013, latest available data.
2/ Includes reserves buildup through reserve requirements of resident financial institutions.

Statement by Pablo Garcia-Silva, Executive Director for Uruguay and David Vogel, Advisor November 13, 2013
Uruguay’s Potential Growth vs. Historic Growth Rates (4:1)
During the second half of the twentieth century, Uruguay exhibited very languid growth rates
of about 1 percent on average. In contrast, 2013 will be the eleventh consecutive year of
positive growth, in a period which has presented a much higher average rate. More
importantly, the future poses promising perspectives: Uruguay’s potential growth is
estimated at about 4 percent.
The country’s robust growth has been accompanied by other remarkable developments in
many areas, which are related to creating better conditions of life for society as a whole,
especially for the most vulnerable sectors; reinforcing economic and financial stability; and
increasing room for maneuver to face eventual external shocks.
The Fate of a Country
Do external factors determine the fate of a small country? What are the contributions of
domestic policies and reforms? On these questions, the Uruguayan authorities believe that
domestic policies and structural reforms do matter, being the most critical factors to
understand the different paths that countries take. Indeed, shocks could be similar for
countries in the same region or with economic similarities, but results could be very different.
It is worth noting that over this decade, Uruguay has been one of the most dynamic
economies in the region. However, contrary to what occurred in other countries in the region,
in most of the decade Uruguay—which is an energy importer and does not export minerals—
has dealt with unfavorable terms of trade. Meanwhile, the country has also suffered severe
trade restrictions (especially on a regional level) and, more recently, the economic slowdown
of neighboring countries; in past times these factors would have generated substantial
negative effects on the country’s growth and investment. Nonetheless, economic activity
continues expanding on a sound path, in line with the country’s potential growth, and it is
expected that productive investment will continue to thrive. Evidently, beyond the
undeniable significance of the external factors (whose total contribution for Uruguay’s case
should be further elaborated), domestic policies and reforms are forging Uruguay’s present
and future.
A Period of Critical Changes
As noted, Uruguay has shown a critical transformation over the past years. Without trying to
establish an exhaustive list of reforms and results, it is possible to cite the following aspects:
Diversification of trade
2
The country’s unrelenting search to diversify markets is reflected in the export
figures which, for instance, show that Uruguay is exporting about 24 percent
of its total external sales to Argentina (5.7 percent) and Brazil (18.1 percent),
while this percentage was almost double at the end of the nineties.
Continued enhancement of governance and transparency
Among other indicators, according to Transparency International’s corruption
perception index, Uruguay and Chile (with a score of 72 – on a scale of 0-100)
occupy the highest position in the region.
Reform of the revenue administrations and the tax system
Evasion of VAT in Uruguay was estimated at 13.4 percent in 2012—relative
to potential revenue of the above-referred tax—, presenting a huge decrease
compared, for instance, with the levels observed ten years ago (about 40
percent); and Uruguay currently shows the lowest evasion rate in the region.
Meanwhile, the transformation of the tax system aimed at increasing its
efficiency and transparency, and contributing to the government’s objectives
of creating an appropriate investment climate and increasing social justice.
Creation of the Debt Management Unit
Risks have been substantially mitigated by extending maturities (average time
to maturity increased from 7.4 years in 2004 to 11 years currently), reducing
the percentage of debt denominated in foreign currency (from 89 percent to
47 percent) and in floating rate (from 23 percent to 5 percent). Of course,
many of the transformations observed in Uruguay’s debt profile have
generated an important fiscal cost, but, at the same time, have critically
minimized risks and vulnerabilities looking forward.
Reform of the Central Bank and the Financial Services Superintendency of Financial
Institutions
The reform process of the Central Bank has led to a modern structure and
functioning of the institution. Meanwhile, the sound indicators exhibited by
Uruguay’s financial system in terms of capitalization, liquidity and non-
performing loans clearly reflect the enormous transformation of the system
and, particularly, of the body in charge of its regulation and supervision.
Another critical aspect is the vital reduction of non-resident deposits, which
literally eliminated what was an important transmission channel of regional
shocks. Many other changes have been implemented in the financial system,
of which the 2006 and 2012 FSAP suggestions were valuable inputs.

3
Drastic transformation in the governance and incentives of the Banco de la República
Oriental del Uruguay (BROU) and Banco Hipotecario del Uruguay (BHU).
To cite just one dimension of the BROU’s performance, there is a negligible
level of 1.5 percent of non-performing loans (in the past, the BROU’s quality
of assets signified an important fragility); meanwhile, the BHU has undergone
a critical and historic transformation.
Draft Law for Financial Inclusion
In many countries the lack of access to credit is a key obstacle that prevents
them from enjoying more inclusive growth and more equal opportunities. In
this regard, the law would encourage better and higher access to the financial
system, particularly for weak sectors of society.
Reflecting Uruguay’s Transformation: The Illustrative Case of Investment
The very low investment rates were the Achilles’ heel of Uruguay’s economy, and a key
factor in explaining the country’s tepid growth performance in the past. Historically, foreign
direct investment (FDI) was negligible in Uruguay. Nonetheless, things have changed
drastically. Figures 9 and 10 in the staff’s chapter on Competitiveness Trends in Uruguay
provide an excellent picture of the transformation: between 2005 and 2012 FDI in the
country doubled in terms of GDP, while among Latin American countries Uruguay is
currently second (behind Chile) in attracting FDI (relative to countries’ GDP).
It is important to note that the substantial rise in capital imports—closely related to the surge
of FDI—is a key element in explaining the widening of Uruguay’s current account deficit.
The huge increase of investment, meanwhile, is critical to illustrate the new dynamic and
perspectives of the country’s trade and the huge diversification of markets, all of which
constitute a virtuous cycle. The country has been able to access markets that pay better prices
for high quality goods. Comparative advantages always existed but, in recent years,
investment has led to boosting production technologies, productivity, and quality, which is
also pointed out in the above-referred chapter on competitiveness.
Some Dimensions of Uruguay’s Public Debt and Fiscal Position
As a member country of the IMF, Uruguay would like to express a few comments regarding
the Fund’s assessments on debt issues, which goes well beyond this particular case. The
Uruguayan authorities consider that the Fund should adapt its analysis to the new
circumstances of the world and, particularly, of the emerging markets.
It is clear that monetary policies undertaken in some key advanced economies have
“obligated” emerging markets to intervene in the exchange rate markets so that transitory
shocks do not entail permanent effects. In that vein, Uruguay has had to accumulate a large
amount of international reserves (more than 30 percent of its GDP), which is more than
would have been desirable under normal circumstances. To a large extent, fiscal deficits have

4
been higher than expected in recent years due to the above-referred interventions. Uruguay’s
net public debt has critically decreased. However, the Fund’s analysis is much more focused
on gross debt, which impedes a more comprehensive and fair assessment of the country’s
fiscal situation, perspectives and eventual risks.
Analysts and the public in general compare countries’ debt ratios. However, are they
comparable? Does the staff use the same definitions and coverage? For instance, how is the
treatment of debt issued for sterilization operations in Uruguay and other similar countries?
The staff’s comments are welcome.
Furthermore, how are contingent liabilities considered? Uruguay’s Central Bank has been
capitalized. How is this positive development, which is recommended worldwide by the
Fund, considered in the fiscal and debt figures? Likewise, Uruguay’s reform of the security
system has allowed the country not to have contingent liabilities related to this matter to the
extent that debt has been made explicit, and for this reason, gross debt is 20 percentage points
higher compared with what would have been the case if reforms were not implemented.
Are transparency and reforms rewarded by the Fund’s analysis? The Uruguayan authorities
believe that the Fund needs to redouble efforts to have better and more evenhanded
assessments on debt issues, and to make ratios more comparable among countries. The
authorities urge the IMF’s Management and staff to address this issue as soon as possible.
The Government’s Commitment to its Objectives
The Uruguayan authorities are fully committed to its highest priority of reducing inflation in
the context of a flexible exchange rate system. In recent times, the country has had to deal
with abundant portfolio inflows, which were related to ultra-loose monetary policies in
advanced countries, but also, among other things, to Uruguay’s new investment grade status.
Meanwhile, a vibrant domestic demand (to a large extent linked to higher employment and
incomes, while it is also important to note that credit to the private sector relative to GDP
remain at a modest—and sound—level of about 24 percent) and some constraints on the
supply side exacerbated inflationary pressures.
As noted, the authorities are firm with their objectives and are flexible with the instruments
used to reach them. In this regard, the government believed that changing instruments was
sensitive and timely. Therefore, they introduced capital flow management measures which,
of course, will have a temporary nature. For the reasons explained in the staff report, the
Central Bank also decided to make changes to its policy framework and, particularly, its
operational targets. Moreover, the authorities further tightened the monetary policy stance.
After some months, it is possible to observe a more comfortable level of the real exchange
rate; and, after a couple of months where depreciation intensified pressures, the last monthly
report shows that inflation decreased from 9 percent in September to 8.67 percent in October.
Admittedly, the figure is still high and pressures do not appear to have significantly receded,
thus the authorities will continue monitoring developments and, if needed, will reinforce
policies and instruments.

5
Economic and Social Achievements: Hand in Hand
As noted at other opportunities, the Uruguayan authorities understand the meaning of
“stability” as a global concept which involves economic, financial, social and political
stability. Of course, in times of robust growth and historic low records of unemployment,
there are increasing wage pressures. However, wages (which decreased substantially during
the 2002-03 crisis) have not been misaligned from the productivity path. In any case, the
government carefully monitors these developments and has recently suggested restraining the
growth of real wages. Beyond that, Uruguay has traditionally enjoyed a social, peaceful
environment, and the current labor frameworks reinforce the tradition of searching better and
sustainable social equilibrium and a fair treatment for all sides.
The results of the above-referred policies and reforms and, of course, active social policies
are eloquent in the social area: poverty decreased from 25.7 percent in 2006 to 8.4 percent in
2012, and extreme poverty from 1.5 percent to 0.3 percent in the same period. Substantial
progress has also been made with regard to the reduction of inequality. As one of the
multiple dimensions of Uruguay’s social achievements, it is worth underlining the
information provided in Box 1 of the staff report: “as a result of government efforts to
include previously excluded segments of the population, health insurance has become near
universal with about 95 percent of Uruguay’s population covered”.
As a political dimension, which may reflect the importance of gaining social consensus and
increasing sustainability, an article about democracy in Latin America, published in the last
issue of The Economist, brought about a survey among the countries in the region, asking
“how satisfied are you with the way democracy works in your country?” 80 percent of
Uruguayans responded “very satisfied” or “somewhat satisfied” which is double the regional
average.
Conclusion
Of course, as any small and open economy, Uruguay is exposed to the changing
circumstances of the world economy. The expected monetary tapering in advanced countries
has the potential of creating noises and transitory volatility. Protectionist policies constitute
another critical risk for an open economy like Uruguay. Beyond that, as noted, the country’s
policies and reforms have created appropriate conditions to keep growing at a robust rate (in
line with its potential growth), to be ready to withstand eventual global or regional shocks,
and to continue improving the social conditions of its inhabitants. Clearly, much remains to
be done in many areas. It is important to reiterate that reducing inflation constitutes a highest
priority. Meanwhile, improving levels of education and infrastructure will be vital to face
Uruguay’s future challenges and pave the way for further social and economic development.