Image Analysis Used for Aluminium Alloy Microstructure Investigation
8
Research paper 58 © Copyright by International OCSCO World Press. All rights reserved. 2010 VOLUME 42 ISSUES 1-2 September-October 2010 of Achievements in Materials and Manufacturing Engineering of Achievements in Materials and Manufacturing Engineering Image analysis used for aluminium alloy microstructure investigation M. Krupiński a, *, K. Labisz a , L.A. Dobrzański a , Z. Rdzawski a,b a Division of Materials Processing Technology, Management and Computer Techniques in Materials Science, Institute of Engineering Materials and Biomaterials, Silesian University of Technology, ul. Konarskiego 18a, 44-100 Gliwice, Poland b Institute of Non-Ferrous Metals, ul. Sowińskiego 5, 44-100 Gliwice, Poland * Corresponding author: E-mail address: mariusz.krupinski@polsl.pl Received 21.06.2010; published in revised form 01.09.2010 Materials ABSTRACT Purpose: In this work the metallographic microstructure analysis of the investigated AlSi7Cu3Mg aluminium cast alloy was performed for samples cooled with different cooling rate settings. The preformed investigations are subjected to the analysis of cooling rate influence on the phase morphology. Design/methodology/approach: The solidification process itself is analysed using the UMSA device by appliance of the Derivative Thermo Analysis. The influence of the cooling rate on the alloy microstructure was investigated using computer aided image analysis, in this work also the content of particular phases was analysed, as well the percentage of pinholes compared to the chosen cooling rate. Findings: The treated sample is without holes, cracks and defects as well as has a slightly higher hardness value compared to the as-cast material. Research limitations/implications: The investigated samples were made of the cylindrical shape and were cooled in the range of 0.2°C/s to 1.25°C/s. In this work also the derivative thermoanalysis was performed to determine the correlation between the chosen cooling rate and the microstructure as well changes in the derivative curve shape. For alloy cooling with chosen cooling rate as well for the derivative thermo-anal ysis the UMSA analysator was applied. Practical implications: The investigated material can find its use in the foundry industry; an improvement of component quality depends mainly on better control over the production parameters. Originality/value: The originality of this work is based on applying of regulated cooling rate of aluminium alloy for structure and mechanical properties changes. As an effect of this study it will be possible to understand and to influence the mechanism of structure forming, refinement and nucleation. Also a better understanding of the thermal characterist ics will be provided to achieve a desirable phase morphology required for application of this material under production conditions. Keywords: Metallic alloys; Thermo analysis; Phases morphology; Al-Si-Cu Reference to this paper should be given in the following way: M. Krupiński, K. Labisz, L.A. Dobrzański, Z. Rdzawski, Image analysis used for aluminium alloy microstructure investigati on, Journal of Achievements in Materials and Manufacturing Engineering 42/1-2 (2010) 58-65.
-
Upload
rikeshbeharry -
Category
Documents
-
view
217 -
download
0
Transcript of Image Analysis Used for Aluminium Alloy Microstructure Investigation

8/20/2019 Image Analysis Used for Aluminium Alloy Microstructure Investigation
http://slidepdf.com/reader/full/image-analysis-used-for-aluminium-alloy-microstructure-investigation 1/8
Research paper58 © Copyright by International OCSCO World Press. All rights reserved. 2010
VOLUME 42
ISSUES 1-2
September-October
2010
of Achievements in Materials
and Manufacturing Engineering
of Achievements in Materials
and Manufacturing Engineering
Image analysis used for aluminium
alloy microstructure investigationM. Krupiński a,*, K. Labisz a, L.A. Dobrzański a, Z. Rdzawski a,b
a Division of Materials Processing Technology, Management and Computer Techniques
in Materials Science, Institute of Engineering Materials and Biomaterials,
Silesian University of Technology, ul. Konarskiego 18a, 44-100 Gliwice, Polandb Institute of Non-Ferrous Metals, ul. Sowińskiego 5, 44-100 Gliwice, Poland
* Corresponding author: E-mail address: [email protected]
Received 21.06.2010; published in revised form 01.09.2010
Materials
ABSTRACT
Purpose: In this work the metallographic microstructure analysis of the investigated AlSi7Cu3Mg aluminium
cast alloy was performed for samples cooled with different cooling rate settings. The preformed investigations
are subjected to the analysis of cooling rate influence on the phase morphology.
Design/methodology/approach: The solidification process itself is analysed using the UMSA device
by appliance of the Derivative Thermo Analysis. The influence of the cooling rate on the alloy microstructure
was investigated using computer aided image analysis, in this work also the content of particular phases was
analysed, as well the percentage of pinholes compared to the chosen cooling rate.
Findings: The treated sample is without holes, cracks and defects as well as has a slightly higher hardness value
compared to the as-cast material.
Research limitations/implications: The investigated samples were made of the cylindrical shape and were
cooled in the range of 0.2°C/s to 1.25°C/s. In this work also the derivative thermoanalysis was performed
to determine the correlation between the chosen cooling rate and the microstructure as well changes in the
derivative curve shape. For alloy cooling with chosen cooling rate as well for the derivative thermo-analysis the
UMSA analysator was applied.
Practical implications: The investigated material can find its use in the foundry industry; an improvement
of component quality depends mainly on better control over the production parameters.
Originality/value: The originality of this work is based on applying of regulated cooling rate of aluminium
alloy for structure and mechanical properties changes. As an effect of this study it will be possible to understand
and to influence the mechanism of structure forming, refinement and nucleation. Also a better understanding of
the thermal characteristics will be provided to achieve a desirable phase morphology required for application of
this material under production conditions.
Keywords: Metallic alloys; Thermo analysis; Phases morphology; Al-Si-Cu
Reference to this paper should be given in the following way:
M. Krupiński, K. Labisz, L.A. Dobrzański, Z. Rdzawski, Image analysis used for aluminium alloy microstructure
investigation, Journal of Achievements in Materials and Manufacturing Engineering 42/1-2 (2010) 58-65.

8/20/2019 Image Analysis Used for Aluminium Alloy Microstructure Investigation
http://slidepdf.com/reader/full/image-analysis-used-for-aluminium-alloy-microstructure-investigation 2/8
59READING DIRECT: www.journalamme.org
Materials
1. Introduction
The crystallisation process occurs, in case of the cast metal
alloys, after casting of the liquid metal into the mould.
The parameters of this process determine the microstructure
of the obtaining casts, which is critical for the achieved physical
and mechanical properties [1].
As a result of the metal crystallisation in the mould there
can be formed three different microstructure areas: in place
of the metal-mould contact is formed the so called frozen
crystals/grains area. This composition consist mainly of equiaxial,
very small crystals with a random orientation, here occurs
the fastest heat transport; -area with columnar shaped
crystals/grains; this is an area with a middle cooling rate value;
-area with equiaxial crystals/grains, which is present in the central
part of the cast, this microstructure is characterised
by a macroscopic isotropy and contains also crystals with
a random orientation, with a bigger crystals size compared
to those present in the frozen crystals area, here occurs the slowestcooling rate in the whole cast. The occurrence of these areas
depends on several factors like: physical and chemical state
of the liquid metal (chemical composition, distribution
of inhibitors of the heterogenic nucleation), cooling rate
of the cast (heat transport from the liquid metal), convection
intensity of the liquid metal [2-4].
The microstructure of an engineering material depends
on its properties. For the reason of the dependence settlement
between the microstructure and properties there should
be performed an image analysis. The process of image analysis
can be defined as a image investigation for object identification
and its contribution valuation on the properties. This process
consist of data accusation from the image as well the analysis
through: identification, classification, measurement and valuationof the physical state of the sample, analysis of the pattern
observed in the image as well the spatial relation between
the features of a given sample. In case of data acquisition about
metal microstructure, the manual, stereological or conventional
image analysis methods are often time-consuming and not always
user friendly. As a solution for this problem there are applied
computer aided qualitative and quantitative metal microstructure
analysis [5-8].
For determination and calculation of the thermal processes
parameters occurred during the solidification some
thermodynamical calculation should be performed. A very
important tool is the cooling rate curve with determined baseline.
The baseline equation calculation requires that the thermal system being considered (i.e., the alloy sample and the cup) complies
with Newtonian cooling model requirements. This means that
the temperature within the system must be spatially uniform
or, at least, that the temperature gradient in any direction within
the system must be negligible at any instant during the cooling
process [9].
The overall heat transmission coefficient is based on the total
thermal resistance between the temperature of the solidifying
sample (Tc) and the environment temperature (T).
Under the assumption described, the energy balance can
be written as follows:
dt
dQT T UA
dT
T T d V C L
cc
)(
)(
(1)
In case were no metallurgical reaction occurs (i.e., when
QL=0) Equation 1 can be reduced to another form, where the baseline equation can be set:
)(
T T
V C
UA
dt
dT c
c
(2)
where:
Q L - Crystallisation heat,
Cp - Heat capacity,
U – heat transmission coefficient,
dT c /dt - Differential ,
dt, T O Environment temperature,
T c – S olidifying temperature,
CV – Heat capacity term.
However, since this new alloy was recently engineered,
the solidification kinetics and the sequence of the phase
transformations in relation to the as-cast and heat-treated
structures needs to be further understood, quantified and
implemented for further improvement of the casting technology
and cast component service characteristics. Moreover,
the optimum conditions for liquid metal treatment must
be understood to gain full benefit from the achievable refinement
of the primary Si particles. The cooling rate is proportional to the
heat extraction from the sample during solidification. Due to the
increase the cooling rate the nucleation undercooling increase.
The phenomenon of an increase in the nucleation temperature
with an increase in the solidification rate depends on the mobility
of the clusters of atoms in the melt. These groups of the froze
atoms produces the fluctuation clusters and fluctuation embryos,
which are the nucleation primers. The increase of the cooling rate
with an increase amount of the nucleation primers and reduction
of the recalescence temperature is well established fact.
This effect have influence on the grain size, and precipitation
morphology and distribution [10-18].
The concept of this work include rapid and slow quenching
rate experiments to monitor the solidification process mainly
of the Al2Cu an iron and magnesium containing phases. The goal
of this paper is to present the structure changes mechanism
on the basis of the characteristic of the Al-Si-Cu alloy, which
is used for monolithic engine block widely in the automotive
industry due to its good casting characteristics and mechanical
properties [19, 20].
2. Material and experimental procedure
The aim of his work was the analysis of phases present
on metallographic micrographs of a AlSi7Cu3Mg cast aluminium
alloy (Table 1) cooled with different cooling rates.
The investigations include a analysis of cooling rate influence
on phase morphology. The influence of the cooling rate on the
1. Introduction
2. Material and experimentalprocedure

8/20/2019 Image Analysis Used for Aluminium Alloy Microstructure Investigation
http://slidepdf.com/reader/full/image-analysis-used-for-aluminium-alloy-microstructure-investigation 3/8
Research paper60
Journal of Achievements in Materials and Manufacturing Engineering
M. Krupiński, K. Labisz, L.A. Dobrzański, Z. Rdzawski
Volume 42 Issues 1-2 September-October 2010
alloy microstructure was investigated using computer image
analysis, in this work also the amount of the present phases was
analysed as well the analyses was performed of the pores
percentage amount in comparison to the cooling rate. The analysis
was performed on specially worked out image from polished
samples using special software for image analysis. For thisanalysis ca. 300 images of metallographic samples was used.
Table 1.
Chemical composition of AC-AlSi7Cu3Mg aluminium alloy
Mass concentration of the element, in wt. %, AA standard
Al Cu Mg
8.5-8 3-4 0.3-0.6
Mn Fe Ti
0.2-0.65 0.8 0.25
Zn Ni
0.65 0.3
The images of metallographic microstructures was obtaining
as a result of thermo-derivative analysis, the samples
for investigations were of the following shape:
cylindrical (Fig. 1A), cooling rate: 0.2°C/s, 0.5°C/s, 1°C/s,
hollow-cylindrical (Fig. 1B), cooling rate 1.25°C/s.
Fig. 1. Dimensions of the cylindrical sample types used for
investigations
For statement of the interdependence between the chemical
composition and the structure of the AC-AlSi7Cu3Mg
(EN 1706:2001) aluminium cast alloy (Table 1), cooled with
different cooling speed, followed investigations were made:
Alloy structure using Leica MEF4A optical microscope
together with the image analysis software. The samples
for optical microscope investigations were electro etched
using 30% HBF4 solution with proper direct current
conditions as well in the 5% HF solution;
chemical composition of the Al alloy using qualitative and
quantitative X-Ray analysis, as well EDS microanalysis;
derivative thermo analysis using the UMSA thermo simulator,
with a computer-controlled cooling system. This is necessary
for precise simulation of the cooling conditions like
temperature and time during the crystallization of theinvestigated alloy.
Analysis of metallographic microstructure image was
performer in a following way:
1) Colour segmentation for a chosen phase,
2) Binarising of a given phase,
3) Phase segmentation. Matrix generating for give phases,
quantitative analysis. For each phase the matrix is created
separately, for the reason of a non uniform colour of each
phase, by the following parameters:
Sensitivity of the colour sampling, the higher numerical
value the lower tolerance for halftone and other colours;
Sample size 1x1 for small phases as well 3x3 for big
phases;
4)
In percent content of the present phases.
3. Research results and discussion
In this work there was analysed the influence of the cooling
speed in the range of 0.2°-1.25ºC/s on microstructure of the
AlSi7Cu3Mg cast aluminium alloys. Some micrographs of the
microstructure were showed in Figs. 2-9. In Fig. 10 are shown the
phases, which were analysed in the work. In Fig. 11 the image
analysis was presented of the Al15(MnFe)3Si2 phase
for identification in the microstructure image and following
quantitative analysis. It is possible on the basis of the performed
measurements of the structure image to make some conclusions
about the precipitation morphology changes. The results of the
measurements for all images are analysed statistically.
Fig. 2. Optical micrograph of the Al alloy, cylindrical sample
of the A type, cooling rate 0.2ºC/s, plane perpendicular to the
sample axis
3. Research resultsand discussion

8/20/2019 Image Analysis Used for Aluminium Alloy Microstructure Investigation
http://slidepdf.com/reader/full/image-analysis-used-for-aluminium-alloy-microstructure-investigation 4/8
61
Materials
Image analysis used for aluminium alloy microstructure investigation
Fig. 3. Optical micrograph of the Al alloy, cylindrical sample
of the A type, cooling rate 0.2ºC/s, plane parallel to the sample axis
Fig. 4. Optical micrograph of the Al alloy, cylindrical sample of the
A type, cooling rate 0.5C/s, plane perpendicular to the sample axis
Fig. 5. Optical micrograph of the Al alloy, cylindrical sample
of the A type, cooling rate 0.5C/s, plane parallel to the sample axis
Fig. 6. Optical micrograph of the Al alloy, cylindrical sample of the
A type, cooling rate 1C/s, plane perpendicular to the sample axis
Fig. 7. Optical micrograph of the Al alloy, cylindrical sample
of the A type, cooling rate 1ºC/s, plane parallel to the sample axis
Fig. 8. Optical micrograph of the Al alloy, cylindrical sample
of the A type, cooling rate 1.25C/s, plane perpendicular to the
sample axis
8/20/2019 Image Analysis Used for Aluminium Alloy Microstructure Investigation
http://slidepdf.com/reader/full/image-analysis-used-for-aluminium-alloy-microstructure-investigation 5/8
Research paper62
Journal of Achievements in Materials and Manufacturing Engineering
M. Krupiński, K. Labisz, L.A. Dobrzański, Z. Rdzawski
Volume 42 Issues 1-2 September-October 2010
Fig. 9. Optical micrograph of the Al alloy, cylindrical sample of
the A type, cooling rate 1.25C/s, plane parallel to the sample axis
Fig. 10. Optical micrograph of the AlSi7Cu3Mg cooling rate
1C/s with marked phases analysed in the work:1-Al15(MnFe)3Si2,
2-Si, 3-Al2Cu
Fig. 11. Analysis of the Al15(MnFe)3Si2 phase precipitations
together with the generated matrix
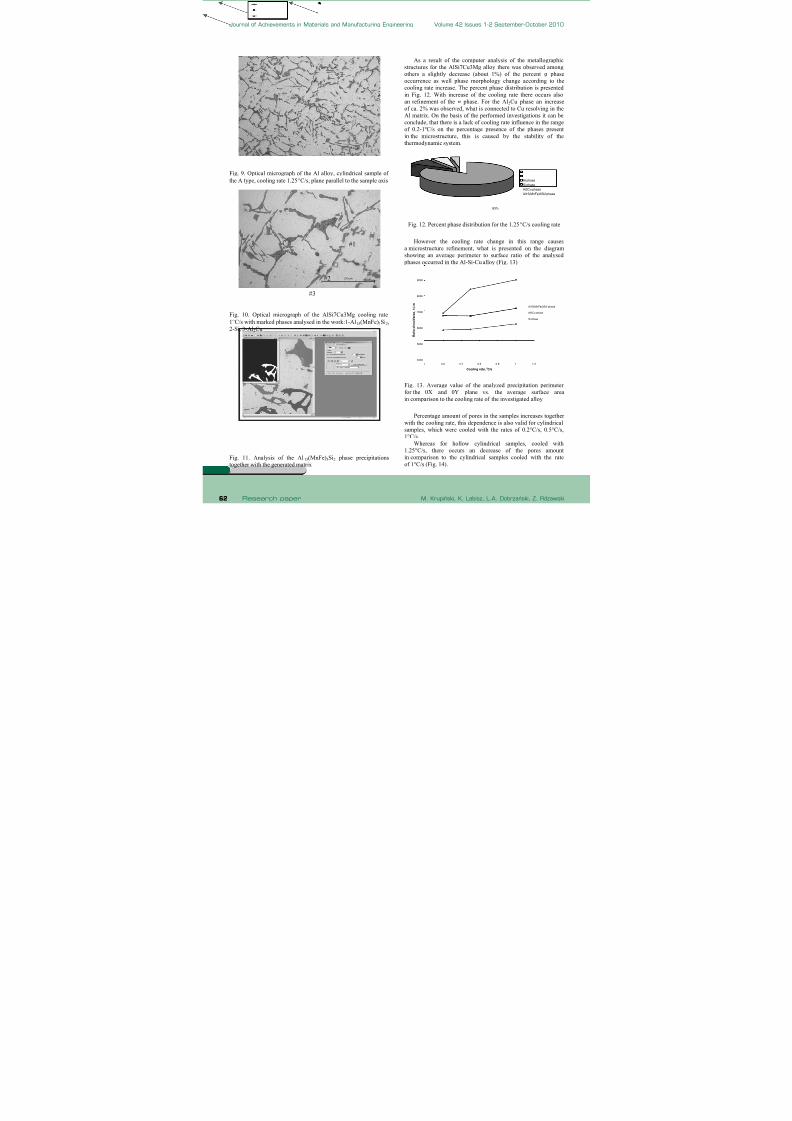
As a result of the computer analysis of the metallographic
structures for the AlSi7Cu3Mg alloy there was observed among
others a slightly decrease (about 1%) of the percent phase
occurrence as well phase morphology change according to the
cooling rate increase. The percent phase distribution is presented
in Fig. 12. With increase of the cooling rate there occurs alsoan refinement of the phase. For the Al2Cu phase an increase
of ca. 2% was observed, what is connected to Cu resolving in the
Al matrix. On the basis of the performed investigations it can be
conclude, that there is a lack of cooling rate influence in the range
of 0.2-1ºC/s on the percentage presence of the phases present
in the microstructure, this is caused by the stability of the
thermodynamic system.
83%
8%
6% 3%
Al phase
Si phase
Al2Cu phase
Al15(MnFe)3Si2 phase
Fig. 12. Percent phase distribution for the 1.25C/s cooling rate
However the cooling rate change in this range causes
a microstructure refinement, what is presented on the diagram
showing an average perimeter to surface ratio of the analysed
phases occurred in the Al-Si-Cu alloy (Fig. 13).
4000
5000
6000
7000
8000
9000
0 0.2 0.4 0.6 0.8 1 1.2
Cooling rate, oC/s
R a t i o c i r c u i t / a r e a ,
1 / m
Al15(MnFe)3Si2 phase
Al2Cu phase
Si phase
Fig. 13. Average value of the analyzed precipitation perimeterfor the 0X and 0Y plane vs. the average surface area
in comparison to the cooling rate of the investigated alloy
Percentage amount of pores in the samples increases together
with the cooling rate, this dependence is also valid for cylindrical
samples, which were cooled with the rates of 0.2°C/s, 0.5°C/s,
1°C/s.
Whereas for hollow cylindrical samples, cooled with
1.25°C/s, there occurs an decrease of the pores amount
in comparison to the cylindrical samples cooled with the rate
of 1°C/s (Fig. 14).
#1
#2
#3

8/20/2019 Image Analysis Used for Aluminium Alloy Microstructure Investigation
http://slidepdf.com/reader/full/image-analysis-used-for-aluminium-alloy-microstructure-investigation 6/8
63
Materials
Image analysis used for aluminium alloy microstructure investigation
0 1 2 3 4 5
0,2°C/s
0,5°C/s
1°C/s
1,25°C/s
C o o l i n g
r a t e
Number of porosity, %
Fig. 14. Percentage pores amount in the AlSi7Cu3Mg alloy
in comparison to the cooling rate.
The differences in investigation results both for the phase and
pores amount in case of the cylindrical sample can be dependent
on the cooling way, where the sample was cooled not only from
outside but also from inside simultaneously, what has influences
the heat volume of the sample system.
In case of the percentage phase amount for the investigated
microstructure micrographs there can be made following
conclusions, that a significant importance for image analysis has
the choice of the sample place chosen for measuring, as well
the distance from cooling surface, because the morphology itself
is highly dependent on the place from where it was take
for investigations. While the quality of the metallographic sample
(scratches, surface roughness, etching) is of very big importance
for the computer image analysis of the metallographic
microstructure.The major difficulties with the computer analysis were
occurred in case of the phase as well the Al15(MnFe)3Si2 phase
for the reason of the mutual overlaying histograms of the phase
colours; in case of the Al2Cu the major difficulty was connected
to the phase morphology.
Analyzing the crystallisation process (Fig. 15) on the basis
of the cooling curves is was state that at the T L temperature starts
the nucleation process of the phase dendrites. On the derivative
curve it is visible as a small inflexion point marked as I, A, 1,
as well a temporary decrease in the cooling rate of the alloy. Heat
effect accomplished to the nucleation process provide additionally
heat to the remaining melt, however heat balance of the crystllised
ingot is negative. The heat provided by the nuclei of the phase
is disproportional smaller compared to the heat give up to thesurrounding through the cooled metal and causes only cooling
rate decrease of the remaining melt. This process is going until the
minimum of the crystallisation temperature of the dendrite
phase (point II, B, 2 in the curves) is achieved, where the
created nuclei achieves the critical value and the growing process
of the phase dendrite crystals is beginning.
Fig. 15. Cooling curve and crystallisation curve of the AC-AlSi7Cu3Mg alloy cooled with different cooling rate: 1.25oC/s, 1oC/s, 0.5oC/s

8/20/2019 Image Analysis Used for Aluminium Alloy Microstructure Investigation
http://slidepdf.com/reader/full/image-analysis-used-for-aluminium-alloy-microstructure-investigation 7/8
Research paper64
Journal of Achievements in Materials and Manufacturing Engineering
M. Krupiński, K. Labisz, L.A. Dobrzański, Z. Rdzawski
Volume 42 Issues 1-2 September-October 2010
The differential curves in this point takes zero as value.
The crystallisation heat warms up the remaining melt to the
temperature at point III, C, 3, where the created and freely
growing crystals of the dendritic phase begin to touch each
others with some surfaces include the remaining melt inside. Next
growth of the crystals causes a temperature increase of the meltto the maximal temperature value of the crystllised phase, (point
IV, D, 4), at this moment also the iron, manganese and silicon
containing phase crystallisation occurs, what is confirmed in the
literature [1]. The chemical composition of the remained melt
changes according to the liquidus line in the Al–Si equilibrium
diagram. The melt is enriched with Si and after the temperature
at point V, E, 5 is achieved the nucleation of the + eutectic
begins. The temperature grows to the maximal crystallisation
temperature of the eutectic (point VII, G, 7 ), where the
spontaneous precipitation of the durable i phases occurs. Next
undercooling of the melt causes the crystallisation of the
multiphase eutectic Cu and Mg and +, which emit additive
crystallisation heat, this is shown on the differential curve in form
of clearly heat effects (point VIII, H, 8 and IX, I, 9).The crystallisation ends after the T Sol solidus temperature
is achieved (point X, J, 10).
Description of the characteristic points on the cooling curve is
shown in Table 2.
Table 2.
Description of the characteristic points on the cooling curve from
Fig. 15
Point on the
graph
Description
I, A, 1 TL nucleation temperature
II, B, 2 Point of the beginning of the crystal growth (
phase dendrites)
III, C, 3 Point of the dendrites ( phase) growth
IV, D, 4 Point of the phase dendrite growth and
(Al+Fe+Mn+Si) precipitation growth
V, E, 5 Nucleation point of the + eutectic
VI Point of the + eutectics growth
VII, G, 7 Point of the stable eutectic growth +, in this
point occurs the thermal equilibrium of the
crystallized phases
VIII, H, 8 Crystallization Point of Cu , Mg and +
eutectic
IX, I, 9 Endpoint of crystallization of Mg, Cu and +
eutectic
X, J, 10 TSol temperature of the crystallization end
4. Conclusion
The phase morphology changes increase in relation to the
cooling rate for the investigated Al-Si-Cu alloy. The higher
cooling rate, the higher the refinement and dispersion of the
phases (, Al15(Fe,Mn)3Si2 and Al2Cu) present in the matrix.
Increase of the cooling rate (0.2°C/s-1°C/s) influences also the
shape of the intermetallic phases. They are more elongated,
needle like shaped ( phase), more dispersive as well less regular
(Al2Cu phase) and fine grained (Al15(MnFe)3Si2). For lower
cooling rates, they more often are of a globular shape e.g.
dendritic for the Al15(MnFe)3Si2 phase. The amount of the pores
increases together with the cooling rate, this dependence is valid
also for cylindrical samples, which were cooled with the rates of
0.2°C/s; 0.5°C/s; 1°C/s.
Additional information
Selected issues related to this paper are planned to be
presented at the 16th International Scientific Conference on
Contemporary Achievements in Mechanics, Manufacturing and
Materials Science CAM3S'2010 celebrating 65 years of the
tradition of Materials Engineering in Silesia, Poland and the 13 th
International Symposium Materials IMSP'2010, Denizli, Turkey.
References[1] L. Bäckerud, G. Chai, J. Tamminen, Solidification
Characteristics of Aluminum Alloys, AFS, 1992.
[2] L.A. Dobrzaski, R. Maniara, J.H. Sokolowski, The effect
of cast Al-Si-Cu alloy solidification rate on alloy thermal
characteristics, Journal of Achievements in Materials and
Manufacturing Engineering 17 (2006) 217-220.
[3] J. Szajnar, T. Wróbel, Methods of inoculation of pure
aluminium structure, Journal of Achievements in Materials
and Manufacturing Engineering 27/1 (2008) 95-98.
[4] H. Yamagata, W. Kasprzak, M. Aniolek, H. Kurita,
J.H. Sokolowski, The effect of average cooling rates on the
microstructure of the Al-20% Si high pressure die casting
alloy used for monolithic cylinder blocks, Journalof Materials Processing Technology 203 (2008) 333-341.
[5] J.P. Anson, J.E. Gruzleski, The quantitative discrimination
between shrinkage and gas microporosity in cast aluminum
alloys using spatial data analysis, Materials Characterization
43 (1999) 319-335.
[6] P.D. Lee, A. Chirazi, R.C. Atwood, W. Wan, Multiscale
modelling of solidification microstructures, including
microsegregation and microporosity, in an Al-Si-Cu alloy,
Materials Science and Engineering A 365 (2004) 57-65.
[7] D.G. Prakash, B. Prasanna, D. Regener, Computational
microstructure analyzing technique for quantitative
characterization of shrinkage and gas pores in pressure die
cast AZ91 magnesium alloys, Computational Materials
Science 32 (2005) 480-488.[8] L. Wojnar, K.J. Kurzydowski, J. Szala, Practice of image
analysis, PTS, Cracow, 2002 (in Polish).
[9] W.T. Kierkus, J.H. Sokolowski, Recent Advances in
Cooling Curve Analysis: A New Method for determining the
‘Base Line’ Equation, AFS Transactions 66 (1999) 161-167.
[10] L.J. Yang, The effect of casting temperature on the
properties of squeeze cast aluminium and zinc alloys,
Journal of Materials Processing Technology 140 (2003)
391-396.
[11] Y.H. Zhu, Phase transformations of eutectoid Zn-Al alloys,
Journal of Materials Science 36 (2001) 3973-3980.
4. Conclusions
Additional information
References

8/20/2019 Image Analysis Used for Aluminium Alloy Microstructure Investigation
http://slidepdf.com/reader/full/image-analysis-used-for-aluminium-alloy-microstructure-investigation 8/8
65
Materials
Image analysis used for aluminium alloy microstructure investigation
[12] B. Krupiska, L.A. Dobrzaski, Z. Rdzawski, K. Labisz,
Cooling rate influence on microstructure of the Zn-Al cast
alloy, Journal of Achievements in Materials and
Manufacturing Engineering 38/2 (2010)115-122.
[13] E.M. da Costa, C.E. da Costa, F. Dalla Vecchia, C. Rick,
M. Scherer, C.A. dos Santos, B.A. Dedavid, Study of theinfluence of copper and magnesium additions on the
microstructure formation of Zn-Al hypoeutectic alloys,
Journal of Alloys and Compounds 488/1 (2009) 89-99.
[14] E. Fra, Alloys crystallisation, WNT, Warsaw, 2003
(in Polish).
[15] J. Sobczak, Innovations in foundry, Part 1, Institute of
Foundry, Cracow, 2007 (in Polish).
[16] A.A Prensyakov, Y.A Gorban, V.V Chervyakova,
The aluminium – zinc phase diagram, Russian Journal of
Physical Chemistry 6 (1961) 632-633.
[17] B.K. Prasad, O.P. Modi, Slurry wear characteristics of zinc-
based alloys: Effects of sand content of slurry, silicon
addition to alloy system and traversal distance, Transactions
of Nonferrous Metals Society of China 19/2 (2009) 277-286.
[18] R. MacKay, M. Djurdjevic, J.H. Sokolowski, The Effect of
Cooling Rate on the Fraction Solid of the MetallurgicalReaction in the 319 Alloy, AFS Transactions 25 (2000)
521-529.
[19] L.A. Dobrzaski, M. Krupiski, K. Labisz, Derivative
thermo analysis of the near eutectic Al-Si-Cu alloy,
Archives of Foundry Engineering 8/4 (2008) 37-40.
[20] M. Krupiski, K. Labisz, L.A. Dobrzaski, Z. Rdzawski,
Derivative thermo analysis of the Al-Si cast alloy with
addition of rare earths metals, Archives of Foundry
Engineering 10/1 (2010) 79-82.