IFGL REFRACTORIES LIMITEDifglref.com/presentation/IFGL_Refractories_FY17-Final.pdf · IFGL...
26
IFGL REFRACTORIES LIMITED Investor Presentation MAY 2017 COMMITTED TO CLEAN METAL 1
Transcript of IFGL REFRACTORIES LIMITEDifglref.com/presentation/IFGL_Refractories_FY17-Final.pdf · IFGL...

IFGL REFRACTORIES LIMITED
Investor PresentationMAY 2017
COMMITTED TO CLEAN METAL
1

2 Safe Harbor
This presentation and the accompanying slides (the “Presentation”), has been prepared by IFGL Refractories Limited (the “Company”), solely forinformation purposes and do not constitute any offer, recommendation or invitation to purchase or subscribe for any securities, and shall not form thebasis or be relied on in connection with any contract or binding commitment whatsoever.
This Presentation has been prepared by the Company based on information and data which the Company considers reliable, but the Company makesno representation or warranty, express or implied, whatsoever, and no reliance shall be placed on, the truth, accuracy, completeness, fairness andreasonableness of the contents of this Presentation. This Presentation may not be all inclusive and may not contain all of the information that youmay consider material. Any liability in respect of the contents of, or any omission from, this Presentation is expressly excluded.
Certain matters discussed in this Presentation may contain statements regarding the Company’s market opportunity and business prospects that areindividually and collectively forward-looking statements. Such forward-looking statements are not guarantees of future performance and are subjectto known and unknown risks, uncertainties and assumptions that are difficult to predict. These risks and uncertainties include, but are not limited to,the performance of the Indian economy and of the economies of various international markets, the performance of the refractories industry in Indiaand world-wide, competition, the company’s ability to successfully implement its strategy, the Company’s future levels of growth and expansion,technological implementation, changes and advancements, changes in revenue, income or cash flows, the Company’s market preferences and itsexposure to market risks, as well as other risks. The Company’s actual results, levels of activity, performance or achievements could differ materiallyand adversely from results expressed in or implied by this Presentation. The Company assumes no obligation to update any forward-lookinginformation contained in this Presentation.

3
Industry Overview

New Steel Policy 2017…4
Targets to achieve 300MT of Steel
Making by 2030
Entire Demand of High grade
automotive steel, electrical steel,
special steels and alloys to be met ‘DOMESTICALLY’
Adoption of energy efficient technologies in
the MSME steel sector to improve
productivity
Increase per capita Steel Consumption
to 160Kgs from current level of
60Kg by 2030
To facilitate R&D in the sector via setting up Steel
Research and Technology
Mission of India (SRTMI).
…to bring fresh impetus to Indian Steel

Steel Demand in 2018: +ve growth expected5
NAFTA: +2.4%
Central & South America: +4.7%
Africa: +4.1%
EU-28: +1.4%
Other Europe: +3.5%
CIS: +3.4%
Middle East: +3.7%
Asia & Oceania (Ex China): +3.8%
Source: Worldsteel Association
China: -2.0%

Core Sectors performing – Benefitting Refractories6
Steel production has grown ~7% from April 2016 to January 2017.With infrastructure push the Government has initiated acrossmultiple sectors, Steel demand is expected to remain buoyant
Cement production capacity is expected to increase from 421.1 mntons in 2016 to 550 mn tons by 2020 with an improvement inUtilization levels
Indian Glass Market is estimated to Increase at a CAGR of15% over the next 3 years fueled by growth in sectors likereal estate, infrastructure, retail, automotive and food &beverages. The glass consumption growth is expected inconstruction (10-12%), automotive (20), consumer goods(15-20) and pharmaceuticals (15-18) sectors

Indian Economy on an uptick…7
Industrial Production
Steady with upward Bias
Infrastructure push
Increased spending by Government
FDI
Increased inflow in Manufacturing
Core Sector
Experiencing steady growth
Policy framework
Positive policies for sectors such as Housing,
Railways
…to benefit Steel Industry

8
Our Performance

Consolidated Profit & Loss9
Particulars [Rs. Crs] Q4 FY17 Q4 FY16 Growth % FY17 FY16 Growth %
Total Income 209.1 177.9 17.5% 768.4 722.1 6.4%
Raw Material 96.8 87.4 361.7 365.2
Employee Expenses 32.3 32.3 125.4 119.6
Other Expenses 51.0 38.7 179.2 156.1
EBITDA 29.0 19.5 48.5% 102.1 81.2 25.7%
EBITDA % 13.9% 11.0% 13.3% 11.2%
Depreciation 5.5 3.6 17.4 15.6
Finance Cost 1.4 1.1 4.5 4.8
Profit before Tax and Minority Interest (MI)
22.1 14.8 49.5% 80.2 60.9 31.7%
Tax 5.9 3.2 20.0 15.7
Profit after Tax & before MI 16.2 11.6 38.9% 60.2 45.2 33.3%
Minority Interest 2.5 1.0 8.0 3.2
Profit after Tax & MI 13.7 10.6 28.9% 52.2 41.9 24.4%
Cash Profit 19.1 14.2 69.5 57.5
IFGL India Business(Including IFGL Exports): Increased Steel production and better working capital environment with Steel companies a big positive. Government support to the Steel sector is benefitting Refractories Producers
Monocon Group: Focus on Engineering services and improvement in utilization levels have resulted in ~7% increase in Revenue
Hofmann Group: Continue to maintain stable operations
EI Ceramics: Benefitting from an increase in domestic production of Steel in USA post Anti – Dumping measures
Commentary

Consolidated Balance Sheet10
Rs. Crs. Mar-17 Mar-16
Shareholder’s Fund 404 387
Share capital 35 35
Reserves & Surplus 369 352
Minority Interest 21 13
Non-current liabilities 26 30
Long term borrowings 14 19
Deferred Tax Liabilities (net) 11 11
Other non-current liabilities 0 0
Long-term provisions 1 0
Current liabilities 195 169
Short term borrowings 61 51
Trade Payables 119 99
Other current liabilities 11 17
Short-term provisions 4 2
Total Liabilities 646 598
Rs. Crs. Mar-17 Mar-16
Non-current assets 240 264
Fixed assets 124 132
Goodwill on Consolidation 109 128
Long-term loans and advances 7 4
Non-current investments 1 1
Other Non Current Assets 0 1
Current assets 406 334
Current Investments 11 8
Inventories 94 78
Trade receivables 232 180
Cash and bank balances 56 55
Short-term loans and advances 9 10
Other current assets 4 3
Total Assets 646 598

Consolidated Financial Highlights11
Total Income [Rs. Crs] EBITDA [Rs. Crs]
EBITDA margin [%] PAT* [Rs. Crs]
768722
FY17FY16
102
81
FY17FY16
60
45
FY17FY16
13.3
11.2
FY16 FY17
* Before Minority Interest

Standalone Financial Highlights12
Total Income [Rs. Crs] EBITDA [Rs. Crs]
EBITDA margin [%] PAT [Rs. Crs]
354
307
FY17FY16
3537
FY16 FY17
1719
FY17FY16
10.1
12.1
FY17FY16
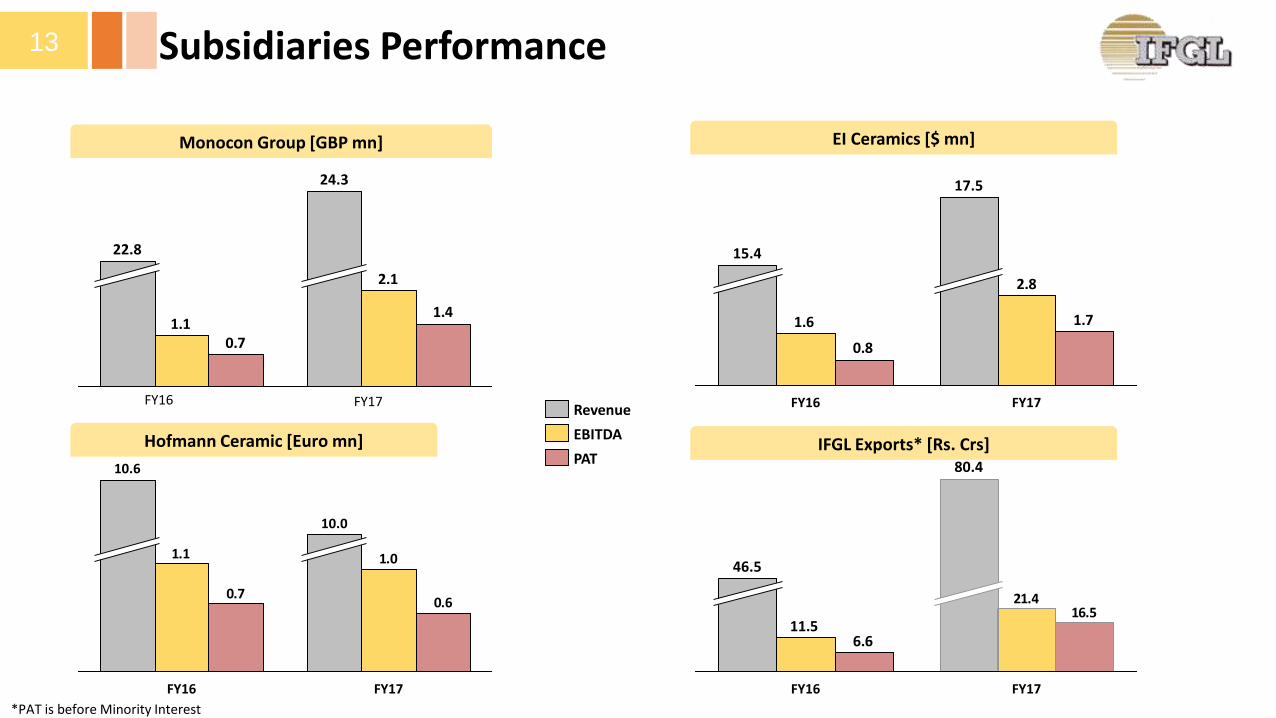
Subsidiaries Performance13
Monocon Group [GBP mn]
Hofmann Ceramic [Euro mn]
EI Ceramics [$ mn]
IFGL Exports* [Rs. Crs]
2.8
1.6 1.7
0.8
FY17
17.5
FY16
15.4
PAT
Revenue
EBITDA
21.4
11.516.5
6.6
46.5
80.4
FY17FY16
1.01.1
0.60.7
FY17
10.6
FY16
10.0
2.1
1.11.4
0.7
22.8
24.3
FY16 FY17
*PAT is before Minority Interest

Merger of IFGL with IFGL Exports14
NCLT, Kolkata to hear applications for confirmation of Scheme sometime in Q1/Q2FY17
Profits attributable to minority interest will get released
Consolidated Entity will emerge a ‘Larger Entity’
Scheme has been approved by Shareholders, secured creditors of both the companies
Costs will get rationalized with improvement in overall Gross Margin
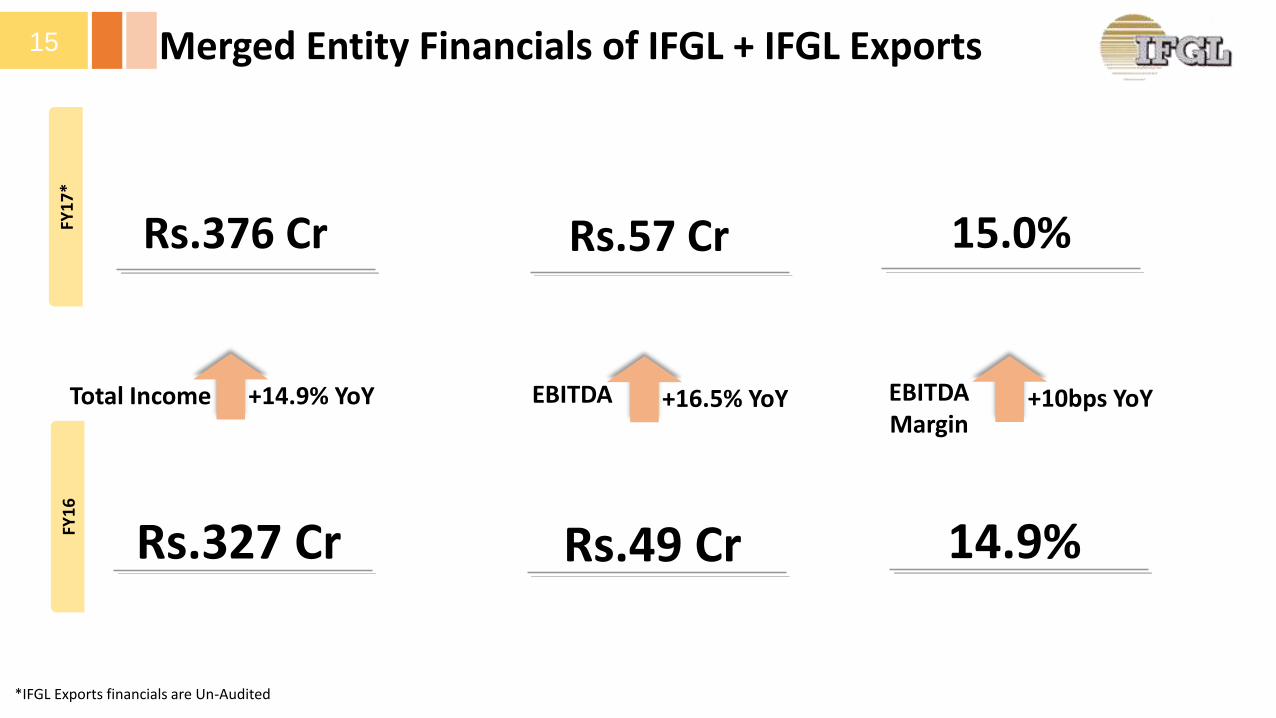
Merged Entity Financials of IFGL + IFGL Exports15
135 CrOperating ProfitRs.376 Cr
Total Income
135 CrRs.327 Cr
+14.9% YoY
FY1
7*
FY1
6
135 CrRs.57 Cr
135 CrRs.49 Cr
+16.5% YoY
15.0%
135 Cr14.9%
+10bps YoYEBITDA EBITDA Margin
*IFGL Exports financials are Un-Audited

Capex in FY18 to boost performance 16
Hofmann Germany Plant
IFGL Odisha Plant
IEL KandlaPlant
~Euro 2mn Capex: Capacity Increase AutomationEfficiency Enhancement
~Rs. 10Cr Capex: To augment SGR & Zirconia Nozzles manufacturing facilities
~10Cr Capex: To increase the present capacity of ISO products from 160,000 pcs p.a. to 240,000 pcs p.a.

Consistently performing over the years…17
Particulars [Rs. Crs] FY13 FY14 FY15 FY16 FY17 CAGR
Total Income 676.8 781.0 793.5 722.1 768.4 3.2%
Raw Material 352.3 378.0 406.1 365.2 361.7
Employee Expenses 98.7 110.0 117.9 119.6 125.4
Other Expenses 163.2 181.0 170.6 156.1 179.2
EBITDA 62.7 113.0 98.9 81.2 102.1 13.0%
EBITDA % 9.3% 14.5% 12.5% 11.2% 13.3%
Depreciation 13.4 15.0 14.3 15.6 17.4
Finance Cost 8.0 7.0 5.9 4.8 4.5
Profit before Tax and Minority Interest (MI)
41.3 91.0 78.7 60.9 80.2 18.0%
Tax 15.9 25.0 25.4 15.7 20.0
Profit after Tax & before MI 25.4 66.0 53.3 45.2 60.2 24.1%
Minority Interest -2.8 2.0 0.2 3.2 8.1
Profit after Tax & MI 28.2 64.0 53.1 41.9 52.2 16.6%
Cash Profit 41.6 79.0 67.4 57.5 69.5 13.7%

…with steady overseas subsidiaries performance…18EB
ITD
AR
OC
E
Monocon Group [GBP mn] EI Ceramics [$ mn]Hofmann Ceramic [Euro mn]
8.6%
5.1%
FY13 FY17
10.4%
5.1%
FY13 FY17
15.9%
13.6%
FY13 FY17
10.3%
7.6%
FY13 FY17
6.8%
5.1%
FY13 FY17
19.0%
25.5%
FY13 FY17

…to create sustainable shareholder value…19
Return on Capital Employed Net Debt : Equity [x] Net Debt : EBITDA [x]
13%
FY15 FY17FY13
22%
FY16
14%
18%
FY14
17%
0.10.1
0.2
0.3
0.5
FY16FY13 FY14 FY15 FY17
0.30.4
0.70.8
1.9
FY17FY16FY15FY14FY13

…with consistent Payout20
Particulars (Rs.) FY13 FY14 FY15 FY16 FY17
Consolidated Book Value per Share 70.9 95.1 99.6 111.7 116.9
Consolidated Earning Per Share 7.9 18.3 15.1 12.1 15.1
Dividend Per Share 1.5 1.75 2.00 2.00 *as per Note Above
20.0%
FY15 FY17FY16
15.0%
FY14FY13
17.5%
15.0%*To be
considered by the
Board of Directors of
the Proposed Merged Entity

21
About Us

22 A Global MNC…
Mono Ceramics Inc
Michigan, US
E I Ceramics,
Cincinnati, US
Monocon , UK
Tianjin Monocon
Tianjin, China
Hofmann Ceramic,
Germany
IFGL Exports,
Kandla SEZ

…with strong management team…23
Mr. S.K. Bajoria -Chairman
• Promoter of S K Bajoria Group based at Kolkata engaged in diversified business activities
• Has been President of the Indian Chamber of Commerce, Director of West Bengal Industrial Development Corporation Ltd and Industrial Promotion & Investment Corporation of Orissa Ltd
• Associated with IFGL from the very early days of Indo Flogates, even before the start of production in 1984. Has been Director & Chief Executive of erstwhile Indo Flogates Ltd.
• More than 30 years of experience of Refractory Industry and has been involved in various capacities in Indian Refractories Makers Association
• Joined as Director Monocon International Refractories Ltd in May, 2015, and fully involved in Overseas Operations of Group
• Is a Doctorate in Industrial Chemistry from Milano University
• Was the Board member & COO of Steel Division of RHI AG Vienna, being one of the leading manufacturers of specialized refractories for Iron & Steel Industry
Mr. P. Bajoria -Managing Director
Mr. Giorgio Cappelli -Director, Monocon

…serving the specialized refractory segment…24
Isostatic Refractories Slide Gate Refractories & Systems
Tube Changer Refractories & System Purging System & Refractories
Cast Products & Zirconia Nozzles Foundry Ceramics

…to reputed names in the Global Steel Industry25

For further information, please contact:
Company : Investor Relations Advisors :
IFGL Refractories Ltd.CIN - L27202OR1989PLC002971Mr. Rajesh [email protected]
www.ifglref.com
Strategic Growth Advisors Pvt. Ltd.CIN - U74140MH2010PTC204285Mr. Shogun Jain / Mr. Pratik [email protected] / [email protected]+91 7738377756 / +91 9769260769www.sgapl.net


![An Indian Multinational Investor Presentation - IFGL · PDF fileCost Revenue in Acquisition Year 2015 Revenue ... Slide Gate & Purging Refractories ... Return on Capital Employed [%]](https://static.fdocuments.net/doc/165x107/5ab9aaa57f8b9ac10d8e83ee/an-indian-multinational-investor-presentation-ifgl-revenue-in-acquisition-year.jpg)