IEEE TRANS. AFFECTIVE COMPUTING 1 Multi-Modal Emotion ... · IEEE TRANS. AFFECTIVE COMPUTING 1...
14
IEEE TRANS. AFFECTIVE COMPUTING 1 Multi-Modal Emotion Recognition in Response to Videos Mohammad Soleymani, Student Member, IEEE, Maja Pantic, Senior Member, IEEE, Thierry Pun, Member, IEEE, Abstract—This paper presents a user-independent emotion recognition method with the goal of recovering affective tags for videos using electroencephalogram (EEG), pupillary response and gaze distance. We first selected 20 video clips with extrinsic emotional content from movies and online resources. Then EEG responses and eye gaze data were recorded from 24 participants while watching emotional video clips. Ground truth was defined based on the median arousal and valence scores given to clips in a preliminary study using an online questionnaire. Based on the participants’ responses, three classes for each dimension were defined. The arousal classes were calm, medium aroused and activated and the valence classes were unpleasant, neutral and pleasant. One of the three affective labels of either valence or arousal was determined by classification of bodily responses. A one-participant-out cross validation was employed to investigate the classification performance in a user-independent approach. The best classification accuracy of 68.5% for three labels of valence and 76.4% for three labels of arousal were obtained using a modality fusion strategy and a support vector machine. The results over a population of 24 participants demonstrate that user-independent emotion recognition can outperform individual self-reports for arousal assessments and do not underperform for valence assessments. Index Terms—Emotion recognition, EEG, Pupillary reflex, Pattern classification, Affective computing. ✦ 1 I NTRODUCTION E MOTIONS play an important role in viewers’ content selection and consumption. With the rapid expan- sion of digital multimedia content, alternative methods to the existing explicit tagging are needed to enrich the pool of tagged content. When a user watches video clips or listens to music, he/she may experience cer- tain feelings and emotions [1], [2], [3] which manifest through bodily and physiological cues, e.g., pupil dila- tion and contraction, facial expressions, e.g., frowning, and changes in vocal features, e.g., laughter. In order to translate user’s bodily and behavioral reactions to emotions, reliable emotion assessment tech- niques are required. Emotion assessment is a challenging task; even users are not always able to express their emotion with words and the emotion self-reporting error is not negligible. This makes it difficult to define a ground truth. Affective self-reports might be held in doubt because users cannot always remember all the different emotions they had felt during watching a video, and/or might misrepresent their feelings due to self presentation, e.g., a user wants to show he is coura- geous whereas in reality he was scared [4]. The emotion recognition system provides us with an alternative that • Mohammad Soleymani and Thierry Pun are with the Computer Vision and Multimedia Laboratory, University of Geneva, Battelle Campus, Building A, Rte. de Drize 7, Carouge(GE) CH - 1227, Switzerland. Email: [email protected] • Maja Pantic is with the Department of computing, Imperial College London, SW7 2AZ, UK e-mail: (see http://www.doc.ic.ac.uk/ maja) • Maja Pantic is also with the Faculty of Electrical Engineering, Mathemat- ics and computer science, University of Twente, the Netherlands. reduces the effort of deciding on the right label and on defining the right questions or methods to assess emotions explicitly. One of the most accepted and well-known theories which explains the process of emotional experience is appraisal theory. According to this theory, cognitive judgment or appraisal of situation is a key factor in the emergence of emotions [5], [6], [7]. According to Orthoney, Clore and Collins (OCC) [6] emotions are experienced with the following scenario. First, there is a perception of an event, object or an action. Then, there will be an evaluation of events, objects or actions according to personal wishes or norms. Finally, the perception and evaluation result in a specific emotion. Considering this scenario for an emotional experience in response to multimedia content, emotions arise first through sympathy with the presented emotions in the content. During appraisal process for an emotional ex- perience in response to multimedia content, a viewer examines events, situations and objects with respect to their novelty, pleasantness, goal, attainability, copability, and compatibility with his/her norms. Then, viewer’s perception induces specific emotions which changes the viewer’s physiological responses, motor actions, and feelings [8]. Scherer [9] categorized emotions into utilitarian and aesthetic emotions. Emotional responses to videos are a mixture of both utilitarian and aesthetic emotions with an emphasize on the later one. Existence of aesthetic emotional responses discourages simply using six well- known basic emotions in the context of emotion under- standing of videos. Digital Object Indentifier 10.1109/TAC.2011.37 1949-3045/11/$26.00 © 2011 IEEE This article has been accepted for publication in a future issue of this journal, but has not been fully edited. Content may change prior to final publication.
Transcript of IEEE TRANS. AFFECTIVE COMPUTING 1 Multi-Modal Emotion ... · IEEE TRANS. AFFECTIVE COMPUTING 1...

IEEE TRANS. AFFECTIVE COMPUTING 1
Multi-Modal Emotion Recognition in Responseto Videos
Mohammad Soleymani, Student Member, IEEE, Maja Pantic, Senior Member, IEEE,Thierry Pun, Member, IEEE,
Abstract—This paper presents a user-independent emotion recognition method with the goal of recovering affective tags for videosusing electroencephalogram (EEG), pupillary response and gaze distance. We first selected 20 video clips with extrinsic emotionalcontent from movies and online resources. Then EEG responses and eye gaze data were recorded from 24 participants while watchingemotional video clips. Ground truth was defined based on the median arousal and valence scores given to clips in a preliminary studyusing an online questionnaire. Based on the participants’ responses, three classes for each dimension were defined. The arousalclasses were calm, medium aroused and activated and the valence classes were unpleasant, neutral and pleasant. One of the threeaffective labels of either valence or arousal was determined by classification of bodily responses. A one-participant-out cross validationwas employed to investigate the classification performance in a user-independent approach. The best classification accuracy of 68.5%for three labels of valence and 76.4% for three labels of arousal were obtained using a modality fusion strategy and a support vectormachine. The results over a population of 24 participants demonstrate that user-independent emotion recognition can outperformindividual self-reports for arousal assessments and do not underperform for valence assessments.
Index Terms—Emotion recognition, EEG, Pupillary reflex, Pattern classification, Affective computing.
�
1 INTRODUCTION
EMOTIONS play an important role in viewers’ contentselection and consumption. With the rapid expan-
sion of digital multimedia content, alternative methodsto the existing explicit tagging are needed to enrich thepool of tagged content. When a user watches videoclips or listens to music, he/she may experience cer-tain feelings and emotions [1], [2], [3] which manifestthrough bodily and physiological cues, e.g., pupil dila-tion and contraction, facial expressions, e.g., frowning,and changes in vocal features, e.g., laughter.
In order to translate user’s bodily and behavioralreactions to emotions, reliable emotion assessment tech-niques are required. Emotion assessment is a challengingtask; even users are not always able to express theiremotion with words and the emotion self-reporting erroris not negligible. This makes it difficult to define aground truth. Affective self-reports might be held indoubt because users cannot always remember all thedifferent emotions they had felt during watching a video,and/or might misrepresent their feelings due to selfpresentation, e.g., a user wants to show he is coura-geous whereas in reality he was scared [4]. The emotionrecognition system provides us with an alternative that
• Mohammad Soleymani and Thierry Pun are with the Computer Vision andMultimedia Laboratory, University of Geneva, Battelle Campus, BuildingA, Rte. de Drize 7, Carouge(GE) CH - 1227, Switzerland.Email: [email protected]
• Maja Pantic is with the Department of computing, Imperial CollegeLondon, SW7 2AZ, UK e-mail: (see http://www.doc.ic.ac.uk/ maja)
• Maja Pantic is also with the Faculty of Electrical Engineering, Mathemat-ics and computer science, University of Twente, the Netherlands.
reduces the effort of deciding on the right label andon defining the right questions or methods to assessemotions explicitly.
One of the most accepted and well-known theorieswhich explains the process of emotional experience isappraisal theory. According to this theory, cognitivejudgment or appraisal of situation is a key factor inthe emergence of emotions [5], [6], [7]. According toOrthoney, Clore and Collins (OCC) [6] emotions areexperienced with the following scenario. First, there isa perception of an event, object or an action. Then,there will be an evaluation of events, objects or actionsaccording to personal wishes or norms. Finally, theperception and evaluation result in a specific emotion.Considering this scenario for an emotional experiencein response to multimedia content, emotions arise firstthrough sympathy with the presented emotions in thecontent. During appraisal process for an emotional ex-perience in response to multimedia content, a viewerexamines events, situations and objects with respect totheir novelty, pleasantness, goal, attainability, copability,and compatibility with his/her norms. Then, viewer’sperception induces specific emotions which changes theviewer’s physiological responses, motor actions, andfeelings [8].
Scherer [9] categorized emotions into utilitarian andaesthetic emotions. Emotional responses to videos are amixture of both utilitarian and aesthetic emotions withan emphasize on the later one. Existence of aestheticemotional responses discourages simply using six well-known basic emotions in the context of emotion under-standing of videos.
Digital Object Indentifier 10.1109/TAC.2011.37 1949-3045/11/$26.00 © 2011 IEEE
This article has been accepted for publication in a future issue of this journal, but has not been fully edited. Content may change prior to final publication.

IEEE TRANS. AFFECTIVE COMPUTING 2
1.1 Background
Emotional responses to multimedia content have beenstudied from three perspectives. There has been a re-search trend towards estimating emotions from multi-media content [10], [11], [12]. On the other hand, rec-ognizing emotions induced by videos has been studiedin the affective computing community [13], [14], [15],[3], [16]. The emotion recognition has been also usedin applications such as detecting topical relevance, orsummarizing videos [17], [13], [18]. This paper presentsan emotion recognition method using EEG signals andeye gaze data in response to videos using users’ bodilyresponses.
Hanjalic and Xu [10] introduced “personalized con-tent delivery” as a valuable tool in affective indexingand retrieval systems. In order to represent affect invideo, they first selected video and audio content basedfeatures based on their relation to the valence-arousalspace that was defined as an affect model. Irie et al.[19] proposed a latent topic model by defining affectiveaudio-visual words in the content of movies to de-tect emotions in movie scenes. They extracted emotion-category-specific audio-visual features named affectiveaudio-visual words. These higher level features wereused to classify movie scenes using a latent topic drivingmodel. This model takes into account temporal informa-tion which is the effect of the emotion from precedentscene to improve affect classification. The probability ofemotional changes between consecutive scenes was alsoused in [20] to improve emotional classification of moviescenes using content features.
Emotional characteristics of videos have also im-proved music and image recommendation. Shan et al.[12] used affective characterization using content analy-sis to improve film music recommendation. Tkalcic et al.showed how affective information can improve imagerecommendation [11]. In their image recommendationscenario, affective scores of images from the internationalaffective picture system (IAPS) [21] were used as fea-tures for an image recommender. They conducted anexperiment with 52 participants to study the effect ofusing affective scores. The image recommender usingaffective scores showed a significant improvement in theperformance of their image recommendation system.
Joho et al. [17], [13] developed a video summarizationtool using facial expressions. A probabilistic emotionrecognition based on facial expressions was employedto detect emotions of 10 participants watching eightvideo clips. The participants were asked to mark thehighlights of the video with an annotation tool after theexperiments. The expression change rate between differ-ent emotional expressions and the “pronounce level” oramount of expression were used as features to detectpersonal highlights in the videos. The pronounce levelsthey used was ranging from highly expressive emotions,surprise and happiness, to no expression or neutral. Theyhave also extracted two affective content-based features
which were audio energy and visual change rate fromvideos to create an affective curve in the same way asthe affective highlighting method proposed by Hanjalic[10]
There has been long standing research on emotionassessment from physiological signals [1], [22], [23], [24],[14], [25]. Amongst these studies, few of them achievednotable results using video stimuli. Lisetti and Nasozused physiological response to recognize emotion inresponse to movie scenes [14]. The movie scenes elicitedsix emotions, namely sadness, amusement, fear, anger,frustration and surprise. They achieved a high recogni-tion rate of 84% for the recognition of these six emotions.However the classification was based on the analysis ofthe signals in response to pre-selected segments in theshown video known to be related to highly emotionalevents.
Takahashi [15] recorded EEG and peripheral phys-iological signals from 12 participants. He then classi-fied the responses to emotional videos into five classesnamely, joy, sadness, disgust, fear, and relax. He achievedthe accuracy of 41.7% using EEG signals. Howeverthe feature level fusion of EEG signals and peripheralphysiological signals failed to improve the classificationaccuracy.
An affective characterization for movie scenes usingperipheral physiological signals as well as multimediacontent features was proposed by Soleymani et al. [3].Eight participants watched 64 movie scenes and self-reported their emotions. Affective correlates between dif-ferent physiological and content features were studied.A linear regression trained by relevance vector machines(RVM) was utilized to estimate each clip’s affect fromphysiological and content features.
Koelstra et al. [16] recorded EEG and peripheral phys-iological signals of six participants in response to musicvideos. Participants rated their felt emotions by means ofarousal, valence and like/dislike rating rating. The emo-tional responses of each participant was classified intotwo classes of low/high arousal, low/high like/dislike,and low/high valence. The average classification ratesvaried between 55% and 58% which is slightly aboverandom level.
In a more recent study, Kolodyazhniy et al. [26] usedperipheral physiological signals to recognize neutral,fear and sadness responses to movie excerpts. Duringthe presentation of videos to the participants, they in-troduced startle stimuli using randomly generated whitenoise sounds to boost physiological responses. Theirsystem was able to recognize sadness, fear and neutralemotional states with the recognition rate of 77.5% in aparticipant-independent approach.
Eye gaze and pupillary responses has been used ex-tensively to measure attention. However, we are notaware of research on how emotions affect eye gazewhile watching videos; therefore the eye gaze itself hasnot been used for emotion recognition. The pupillaryresponse is the measurement of pupil diameter over
This article has been accepted for publication in a future issue of this journal, but has not been fully edited. Content may change prior to final publication.

IEEE TRANS. AFFECTIVE COMPUTING 3
time. Pupil can dilate or constrict in response to light,cognitive, attentional and emotional stimuli [27], [28].Gao et al. [29] showed the significance of using pupillaryreflex for emotion assessment after reducing the lighteffect using a real-time feedback.
1.2 Potential application
Characterizing multimedia content with relevant, reli-able and discriminating tags is vital for multimediainformation retrieval. Affective characteristics of multi-media are important features for describing multime-dia content and can be presented by such emotionaltags. Implicit affective tagging refers to the effortlessgeneration of subjective and/or emotional tags. Implicittagging of videos using affective information can helprecommendation and retrieval systems to improve theirperformance [12], [11], [30].
Currently, social media websites encourage users totag their content. However, the users’ intent when tag-ging multimedia content does not always match the in-formation retrieval goals. A large portion of user definedtags are either motivated by the goal of increasing thepopularity and reputation of a user in an online commu-nity or based on individual and egoistic judgments [31].Implicit tagging does not interrupt users while listeningor watching a video. Moreover, in presence of a reliableimplicit tagging measurement method, determined tagscarry less irrelevant and inaccurate information.
Users do not evaluate media content on the samecriteria. Some might tag multimedia content with wordsto express their emotion while others might use tagsto describe the content. For example, a picture receivedifferent tags based on the objects in the image, thecamera by which the picture was taken or the emotiona user felt looking at the picture. Scherer defines this byintrinsic and extrinsic appraisal [9]. Intrinsic appraisalis independent from the current goals and values of theviewer while extrinsic or transactional appraisal leads tofeeling emotions in response to the stimuli. For example,the content’s intrinsic emotion of a picture with a smilingface is happiness whereas this person might be a hatredfigure to the viewer and the extrinsic appraisal leads tounpleasant emotions. What we want to detect is the laterone that is the emotion felt by the viewer.
The goal of implicit affective tagging is thus to monitorthe reactions of a person in response to a particularmultimedia content and automatically recognize the cor-responding tag. These responses can be used to reliablygenerate affective tags. A scheme of implicit taggingscenario versus explicit tagging is shown in Fig. 1.
In the proposed implicit tagging scenario, multimediacontent will be tagged based on the bodily reactionsof users recorded by a physiological acquisition deviceand an eye gaze tracker. The reactions can be usedboth to find tags common to a population and to de-velop a personal profile possibly in combination withuser preferences and browsing history. With the recently
xx
x xx
x
xx
x
Fig. 1. Implicit affective tagging vs. explicit taggingscenarios. The analysis of the bodily responses replacethe direct interaction between user and the computer.Therefore, user do not have to be distracted for taggingthe content.
marketed physiological devices such as Neurosky1, andEmotiv helmet2, physiological interfaces are likely goingto be the emerging human computer interfaces of thefuture.
1.3 Research questions
Although individual differences are always present inemotional reactions, there usually also exists one morecommon affective response in a population to a multi-media content. For example the scenes from a dramamovie induce sadness in most of the people. For adramatic scene, sadness can be considered the popular orfrequently felt emotion. In this paper, we investigate andshow the feasibility and comparable performance of auser-independent emotion recognition to detect the dom-inant or commonly selected affective tags. The implicittagging application limited our choices for modalities tocues which are measurable while participants are sittingand are mostly in passive mode. The research questionsthat this paper investigates are:
1) Is it possible to design an accurate and user-independent classification protocol to recognizeemotions from pupillary reflex, EEG signals andother bodily responses in response to video con-tent?
2) Can non-verbal affective cues replace affective self-report with comparable emotion recognition per-formance and no requisite of direct user inputs?
The rest of the paper is organized as follows. Theemotion model, video dataset, experimental protocol andphysiological dataset classification are discussed in Sec-tion 2. Section 3 presents and discusses the experimentalresults and compares their performance to self-reports.The current methods’ open issues and future work arediscussed in Section 4. The paper is concluded in Section5.
1. http://www.neurosky.com/2. http://www.emotiv.com/
This article has been accepted for publication in a future issue of this journal, but has not been fully edited. Content may change prior to final publication.

IEEE TRANS. AFFECTIVE COMPUTING 4
2 MATERIAL AND METHODS2.1 Emotional modelAlthough the most straightforward way to represent anemotion is to use discrete labels such as fear, and joy,label-based representations have some disadvantages.The main one being that labels are not cross-lingual:emotions do not have exact translations in differentlanguages, e.g., “disgust” does not have an exact trans-lation in Polish [32]. Psychologists therefore often rep-resent emotions or feelings in an n-dimensional space(generally 2- or 3-dimensional). The most famous suchspace, which is used in the present study and origi-nates from cognitive theory, is the 2D valence-arousalor pleasure-arousal space [33]. The valence scale rangesfrom unpleasant to pleasant. The arousal scale rangesfrom passive to active or excited.
2.2 Preliminary studyIn the preliminary study 21 commercially producedmovies were first segmented into their scenes. Sceneslonger than two minutes were divided into shorter twominutes long excerpts. From these excerpts, 155 emo-tional video clips containing full or part of movie sceneswere manually selected. The 155 selected videos wereshown to more than 50 participants; each video clipreceived 10 annotations in average [34]. The preliminarystudy was conducted utilizing an online affective anno-tation system in which the participants were able to usea web interface to report their emotions in response tothe videos played by a web-based video player (see Fig.2). In case of using videos from online repositories, thefull length videos were used in the dataset.
In the preliminary study the participants were thusasked to self-assess their emotion by reporting the feltarousal (ranging from calm to excited/activated) andvalence (ranging from unpleasant to pleasant) on ninepoints scale as well as emotional keywords. 14 videoclips were chosen based on the preliminary study fromthe clips which received the highest number of emotionalkeyword tags in different emotion categories which arelisted in the Table 1. Videos were selected to cover differ-ent emotional responses (see Fig. 3). Three other popularvideo clips from online resources were added to this set(two for joy/happiness and one for disgust). Three pastweather forecast reports (retrieved from youtube.com)were also used as neutral emotion clips. The videos fromonline resources were added to the dataset to enable usto distribute some of the emotional video samples withthe recorded multi-modal dataset described below. Table1 gives the emotional labels, titles, and sources of theemotional video clips.
The median arousal and valence was used to deter-mine ground truth labels with the following procedure.First, the values assessed by the online questionnairewere centered and then three equal length intervals weredefined on the assessment range (arousal, valence ∈[1, 9]). The labels assigned to all videos are given in Table
1. The distribution of online self emotions for the selectedvideos is shown in Fig. 3.
Fig. 2. A snapshot of the online affective annotationsystem. Arousal and valence were assessed using SAMmanikins. Participants were able to give their emotionaltag using a drop down menu.
1 2 3 4 5 6 7 8 91
2
3
4
5
6
7
8
9
12
3
4 5
6
7
8
9
10
11
12
13
14
15
16
17
18
19
20
Val
ence
Arousal
Fig. 3. Stimulus videos are shown in the valence-arousalplane. The center of the ellipses represents the meanarousal and valence and the horizontal and vertical radiusrepresents the standard deviation of the online assess-ments. The clip codes are printed at the center of eachellipse.
Ultimately, 20 videos were selected to be shown whichwere between 34.9s to 117s long (M = 81.4s, SD =22.5s). Psychologists recommended videos from one toten minutes long for elicitation of a single emotion [35],[2]. Here, the video clips were kept as short as possibleto avoid multiple emotions or habituation to the stimuliwhile keeping them long enough to observe the effect.
2.3 Experiment Protocol and SetupA multi-modal recording setup was arranged to recordfacial videos, audio and vocal expressions, eye gaze,
This article has been accepted for publication in a future issue of this journal, but has not been fully edited. Content may change prior to final publication.

IEEE TRANS. AFFECTIVE COMPUTING 5
TABLE 1The video clips are listed the with their sources. The
emotion labels are: calm (Cal.), medium aroused (Med.),activated (Act.), unpleasant (Unp.), neutral valence
(Neu.), Pleasant (Pls.).
CodeEmotionLabels
Video clips sources
1 Act., Unp. Hannibal2 Act., Unp. The Pianist3 Med., Pls. Mr. Bean’s holiday4 Act., Neu. Ear worm (blip.tv)5 Med., Neu. Kill Bill VOL I6 Med., Pls. Love actually7 Med., Pls. Mr. Bean’s holiday8 Cal., Pls. The thin red line9 Med., Neu. The shining10 Med., Pls. Love actually11 Act., Unp. The shining12 Med., Unp. Gangs of New York13 Act., Unp. Silent hill14 Med., Unp. The thin red line15 Cal., Neu. AccuWeather New York weather report
(youtube.com)16 Act., Unp. American history X17 Cal., Neu. AccuWeather Detroit weather report
(youtube.com)18 Act., Pls. Funny cats (youtube.com)19 Cal., Neu. AccuWeather Dallas weather report
(youtube.com)20 Act., Pls. Funny (blip.tv)
and physiological signals simultaneously (see Fig. 4).The experiment was controlled by the Tobii studio soft-ware (http://www.tobii.com). In order to synchronizedifferent modalities, device generated time stamps wererecorded along with audio and physiological signals.These time stamps consisted of time series with squareshaped periodic signal (60Hz) representing the momentswhen the cameras’ shutters were open to capture eachframe. The synchronization method and hardware setupdetails are given in Lichtenauer et al. [36].
The Biosemi active II system3 with active electrodeswas used for physiological signals acquisition. Physio-logical signals including ECG, EEG (32 channels), gal-vanic skin response (GSR), respiration amplitude, andskin temperature were recorded while the videos wereshown to the participants. Peripheral physiological sig-nals, facial videos and vocal expressions modalities werenot employed in this paper; therefore all the results ofthis paper are only based on EEG signals, pupillaryresponse and gaze distance recorded by eye gaze tracker.However, the classification protocol presented in thispaper can be applied to a wide variety of modalitiesand is not limited to the utilized modalities.
3. http://www.biosemi.com
Participants were asked to report their felt emotions byindicating their felt arousal and valence on a nine pointsscale. To simplify the interface a keyboard was providedwith only nine numerical keys and the participant couldanswer each question by pressing one of the nine.
30 participants with different cultural and educationbackgrounds volunteered to participate in response toa campus wide call for volunteers at Imperial College,London. Out of the 30 young healthy adult participants,17 were female and 13 were male; ages varied between19 to 40 years old (M = 26.06, SD = 4.39). Participantshad different educational background from undergrad-uate students to post-docs with different English profi-ciency from intermediate to native speakers. The datarecorded from six participants were not analyzed due totechnical problems, poor signal quality and unfinisheddata collection. Hence, the analysis results of this pa-per are only based on the responses recorded from 24participants. The results in the Section 3 of this paperare only based on Eye gaze data and EEG signals. Thisdatabase is freely available to the academic community,and is easily accessible through a web-interface4.
Fig. 4. The experimental setup. 6 video cameras wererecording facial expressions during the experiment. Themodified keyboard is visible in front of the participant.
Fig. 5. Each trial started by a 15s neutral clip and contin-ued by playing one emotional clip. The self-assessmentwas done at the end of each trial. There were 20 trials ineach session of experiment.
4. http://mahnob-db.eu
This article has been accepted for publication in a future issue of this journal, but has not been fully edited. Content may change prior to final publication.
IEEE TRANS. AFFECTIVE COMPUTING 6
The participants were informed about the experimentand their rights with a verbal introduction, by emailand through a consent form. Participants were trainedabout the interface before the experiment and duringthe setup time. The participants were also introduced tothe meaning of arousal, valence in the self-assessmentprocedure, and to the nature of the video content.
In emotional-affective experiments the bias from theemotional state needs to be removed. For this purposebefore each emotional video a short neutral clip ran-domly selected from the clips provided by the Stanfordpsychophysiology laboratory [2] was shown to the par-ticipants.
Each trial started with a short neutral clip. Afterwatching the short neutral clip, one of the 20 video clipswas played. Video clips were played from the datasetin random order. After watching the video clip, theparticipant filled in the self-assessment form which ap-peared automatically. In total, the time interval betweenthe start of a trial and the end of the self-reportingphase was approximately two and half minutes. Thisinterval included playing the neutral clip, playing theemotional clip, performing the self-assessment. Runningof the whole protocol took in average 50 minutes inaddition to 30 minutes setup time (see Fig. 5).
2.4 Preprocessing and Feature Extraction2.4.1 EEG signalsPsychological studies regarding the relations betweenemotions and the brain are uncovering the strong im-plication of cognitive processes in emotions [37], [38].As a result, the EEG signals carry valuable informationabout the participants’ felt emotions.
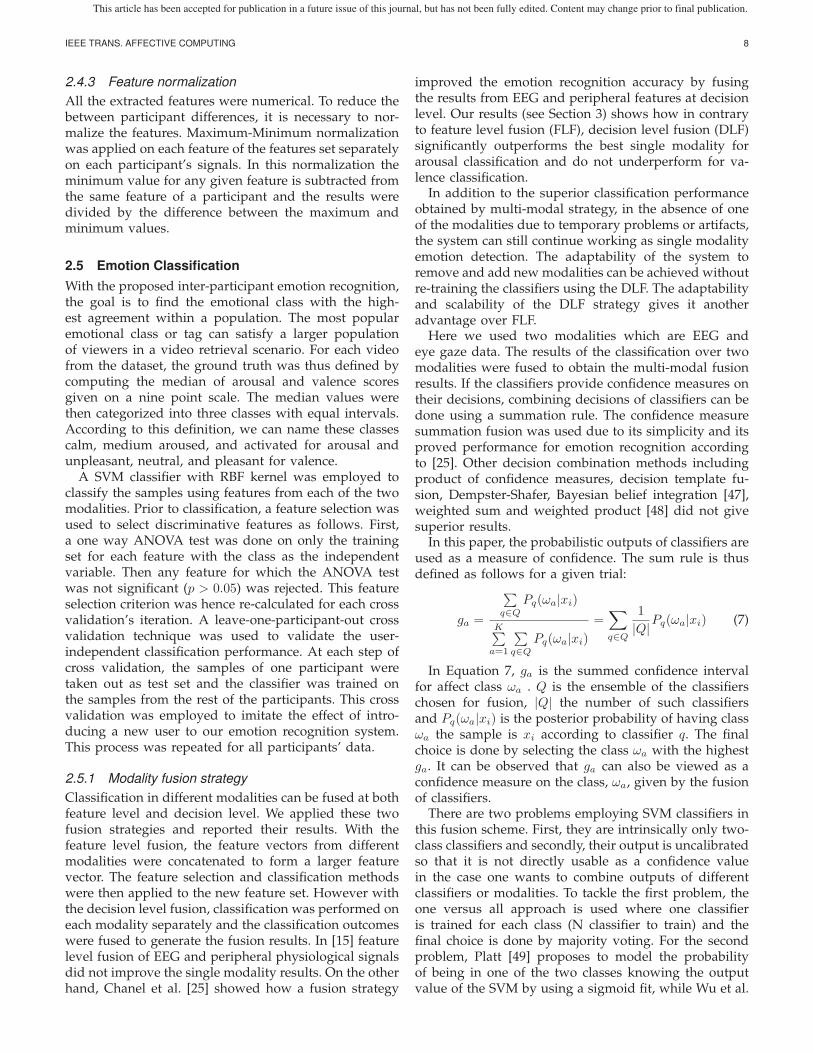
Electroencephalogram signals were recorded with a1024Hz sampling rate and later downsampled to 256Hzto reduce the memory and processing costs. EEG signalswere recorded using active AgCl electrodes placed ac-cording to the international 10-20 system. The layout ofEEG electrodes on the cap are shown in Fig. 6. The un-wanted artifacts, trend and noise were reduced prior toextracting the features from EEG data by pre-processingthe signals. Drift and noise reduction were done byapplying a 4-45Hz band-pass filter. Other artifacts suchas muscular activity was kept at minimum level byinstructing the participants to minimize their movementswhile videos were playing. Biosemi active electrodesrecord EEG signals referenced to common mode senseelectrode (CMS) as a part of its feedback loop. In orderto gain the full common-mode rejection ratio (CMRR) at50Hz, EEG signals should be re-referenced to anotherreference. EEG signals were thus re-referenced to theaverage reference to maximize signal to noise ratio.
The spectral power of EEG signals in different bandswas found to be correlated with emotions [39], [40], [25].Power spectral density (PSD) from different bands werecomputed using fast Fourier transform (FFT) and Welchalgorithm [41]. In this method, the signal is split into
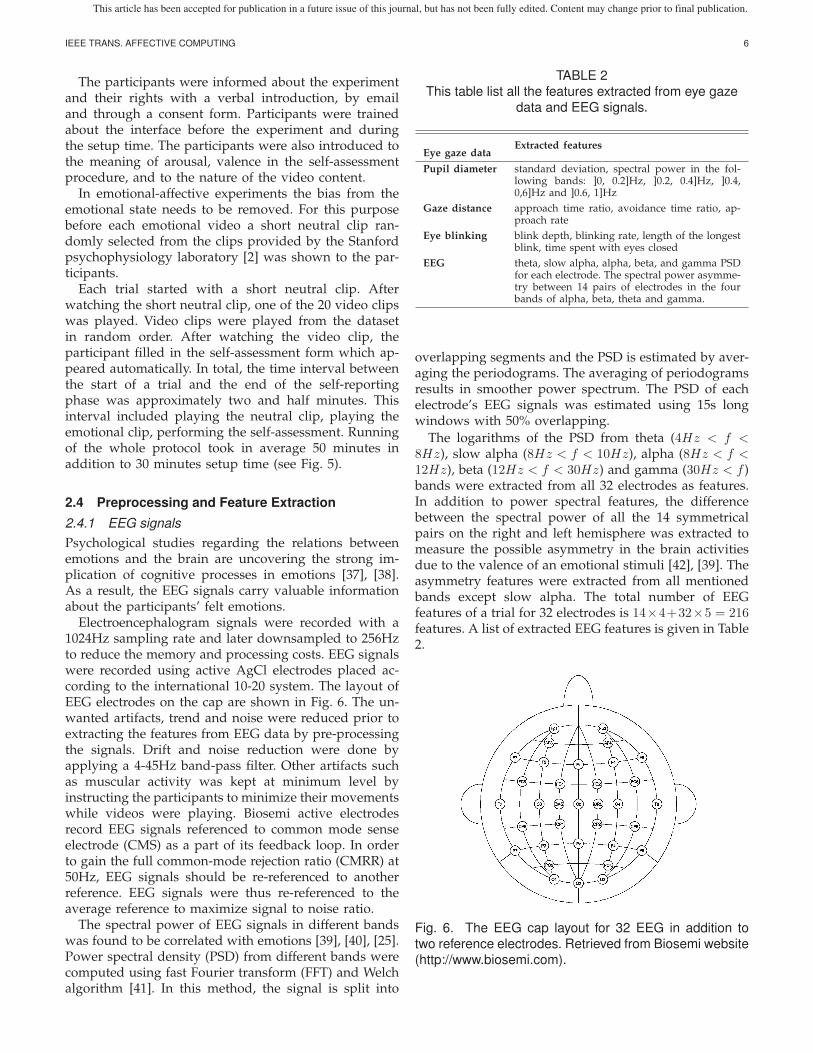
TABLE 2This table list all the features extracted from eye gaze
data and EEG signals.
Eye gaze dataExtracted features
Pupil diameter standard deviation, spectral power in the fol-lowing bands: ]0, 0.2]Hz, ]0.2, 0.4]Hz, ]0.4,0,6]Hz and ]0.6, 1]Hz
Gaze distance approach time ratio, avoidance time ratio, ap-proach rate
Eye blinking blink depth, blinking rate, length of the longestblink, time spent with eyes closed
EEG theta, slow alpha, alpha, beta, and gamma PSDfor each electrode. The spectral power asymme-try between 14 pairs of electrodes in the fourbands of alpha, beta, theta and gamma.
overlapping segments and the PSD is estimated by aver-aging the periodograms. The averaging of periodogramsresults in smoother power spectrum. The PSD of eachelectrode’s EEG signals was estimated using 15s longwindows with 50% overlapping.
The logarithms of the PSD from theta (4Hz < f <8Hz), slow alpha (8Hz < f < 10Hz), alpha (8Hz < f <12Hz), beta (12Hz < f < 30Hz) and gamma (30Hz < f )bands were extracted from all 32 electrodes as features.In addition to power spectral features, the differencebetween the spectral power of all the 14 symmetricalpairs on the right and left hemisphere was extracted tomeasure the possible asymmetry in the brain activitiesdue to the valence of an emotional stimuli [42], [39]. Theasymmetry features were extracted from all mentionedbands except slow alpha. The total number of EEGfeatures of a trial for 32 electrodes is 14×4+32×5 = 216features. A list of extracted EEG features is given in Table2.
Fig. 6. The EEG cap layout for 32 EEG in addition totwo reference electrodes. Retrieved from Biosemi website(http://www.biosemi.com).
This article has been accepted for publication in a future issue of this journal, but has not been fully edited. Content may change prior to final publication.

IEEE TRANS. AFFECTIVE COMPUTING 7
2.4.2 Eye gaze data
The X120 Tobii5 eye gaze tracker provides the positionof the projected eye gaze on the screen, the pupil diam-eter, the moments when the eyes were closed and theinstantaneous distance of the participant’s eyes to thegaze tracker device positioned below the screen. The eyegaze data was sampled at 60Hz. The blinking momentsare also extractable from eye gaze data. The eye gazeitself is highly dependent on the content and therefore itwas not used directly for emotion recognition. However,pupil diameter has been shown to change in differentemotional states [27], [28].
A linear interpolation was used to replace the missingpupil diameter samples due to eye blinking. Then theaverage diameter of right and left eye pupil was used asthe pupil diameter time series. The major cause of pupildiameter variation comes from lighting; therefore theparticipants’ responses to the same video (stimuli) in thecontrolled lighting environment follow similar patterns.There are different parametric models for pupillary lightreflex [43], [44]. However, these parametric models arenot error free and calculating their numerous parametersis rather difficult without specific light reflex experiment.It has been shown that the pupillary light reflex magni-tude changes with age and between different people [43].Most of the participants in our experiment were young,in their twenties; therefore the aging effect assumed tobe negligible. The difference between the magnitudescan be reduced by normalizing the pupil diameter timeseries. Consequently we extracted the light reflex using anon-parametric estimation from the data. This commonlighting reflex pattern was estimated for each videousing principal component analysis (PCA).
If Y is the M ×Np matrix containing the centered andnormalized pupillary responses to the same video fromNp participants and M samples, then Y consists of threecomponents:
Y = X + Z + E (1)
X is the lighting response which is the strongest effect inthe signal. Z is the parasympathetic emotional and atten-tional response and E is the noise originated from mea-surement. These three components are originated fromindependent sources and the decorrelating characteristicof principal component analysis (PCA) is able to separatethese three. First, Y was decomposed using principalcomponent analysis (PCA) into Np components. The firstprincipal component is assumed to be a close estimationof the lighting reflex. The normalized principal compo-nent was then removed from normalized time series.Then the remaining residual part includes Z + E.
Y = UDV T (2)
Ap = UD (3)
5. http://www.tobii.com
Sp = V T (4)
Y1 = Ap1Sp1 (5)
YR = Y − Y1 (6)
If we decompose Y using singular value decomposi-tion (SVD) U is a matrix with eigen vectors of Y Y T as itscolumn. D is a diagonal matrix whose diagonal valuesare the eigen values of Y Y T . Finally the columns of Vare the eigen vectors of Y TY (see Equation 2). From theprincipal components of Y , Ap we can reconstruct thefirst principal component or the light reflex pattern Y1
(see Equation 3). To remove the light reflex component,Y1, from all the time series, it is enough to subtractit from the original data (see Equation 5 and 6). YR
is the residual part which contains the emotional andattentional pattern in addition to the noise.
After removing the linear trend, the power spectrumof the pupil diameter variation was computed. Standarddeviation and spectral features were extracted from thepupil diameter. The Hippus effect is the small oscilla-tions of eye pupil diameter between 0.05 to 0.3Hz andwith the amplitude of 1 mm [43], [45]. Hippus effecthas been shown to be present when one is relaxed orpassive. In the presence of mental activity the effect willdisappear. The Hippus effect is extracted by the first twopower spectral features which are covering up to 0.4 Hz.The rate of eye blinking is shown to be correlated withanxiety [46]. From the eye blinks, the eye blinking rate,the average and maximum blink duration were extractedas features. In addition to the eye blinking features theamount of time the participants spent with his/her eyesclosed was also used as a feature to detect possible eyeclosing due to unpleasant emotions.
Although the participants were asked not to moveduring the experiment, there were small head move-ments which manifested itself in the distance betweenparticipants’ eyes and the eye gaze tracker. The distanceof the participant to the screen and its changes providevaluable information about the participants’ posture. Thetotal change in the distance of the user to the gazetracker, gaze distance, was calculated to measure thepossible approach and avoid phenomena. The amountof time the participant spent per trial getting close or farfrom the screen was computed as well. These featureswere named approach and avoidance ratio to representthe amount of time participant spent getting close orgoing far from the screen. The frequency of the partic-ipants’ movement towards the screen during each trial,approach rate, was also extracted. Ultimately 12 featureswere extracted from the eye gaze data. A summary ofall extracted features is given in Table 2.
This article has been accepted for publication in a future issue of this journal, but has not been fully edited. Content may change prior to final publication.
IEEE TRANS. AFFECTIVE COMPUTING 8
2.4.3 Feature normalizationAll the extracted features were numerical. To reduce thebetween participant differences, it is necessary to nor-malize the features. Maximum-Minimum normalizationwas applied on each feature of the features set separatelyon each participant’s signals. In this normalization theminimum value for any given feature is subtracted fromthe same feature of a participant and the results weredivided by the difference between the maximum andminimum values.
2.5 Emotion ClassificationWith the proposed inter-participant emotion recognition,the goal is to find the emotional class with the high-est agreement within a population. The most popularemotional class or tag can satisfy a larger populationof viewers in a video retrieval scenario. For each videofrom the dataset, the ground truth was thus defined bycomputing the median of arousal and valence scoresgiven on a nine point scale. The median values werethen categorized into three classes with equal intervals.According to this definition, we can name these classescalm, medium aroused, and activated for arousal andunpleasant, neutral, and pleasant for valence.
A SVM classifier with RBF kernel was employed toclassify the samples using features from each of the twomodalities. Prior to classification, a feature selection wasused to select discriminative features as follows. First,a one way ANOVA test was done on only the trainingset for each feature with the class as the independentvariable. Then any feature for which the ANOVA testwas not significant (p > 0.05) was rejected. This featureselection criterion was hence re-calculated for each crossvalidation’s iteration. A leave-one-participant-out crossvalidation technique was used to validate the user-independent classification performance. At each step ofcross validation, the samples of one participant weretaken out as test set and the classifier was trained onthe samples from the rest of the participants. This crossvalidation was employed to imitate the effect of intro-ducing a new user to our emotion recognition system.This process was repeated for all participants’ data.
2.5.1 Modality fusion strategyClassification in different modalities can be fused at bothfeature level and decision level. We applied these twofusion strategies and reported their results. With thefeature level fusion, the feature vectors from differentmodalities were concatenated to form a larger featurevector. The feature selection and classification methodswere then applied to the new feature set. However withthe decision level fusion, classification was performed oneach modality separately and the classification outcomeswere fused to generate the fusion results. In [15] featurelevel fusion of EEG and peripheral physiological signalsdid not improve the single modality results. On the otherhand, Chanel et al. [25] showed how a fusion strategy
improved the emotion recognition accuracy by fusingthe results from EEG and peripheral features at decisionlevel. Our results (see Section 3) shows how in contraryto feature level fusion (FLF), decision level fusion (DLF)significantly outperforms the best single modality forarousal classification and do not underperform for va-lence classification.
In addition to the superior classification performanceobtained by multi-modal strategy, in the absence of oneof the modalities due to temporary problems or artifacts,the system can still continue working as single modalityemotion detection. The adaptability of the system toremove and add new modalities can be achieved withoutre-training the classifiers using the DLF. The adaptabilityand scalability of the DLF strategy gives it anotheradvantage over FLF.
Here we used two modalities which are EEG andeye gaze data. The results of the classification over twomodalities were fused to obtain the multi-modal fusionresults. If the classifiers provide confidence measures ontheir decisions, combining decisions of classifiers can bedone using a summation rule. The confidence measuresummation fusion was used due to its simplicity and itsproved performance for emotion recognition accordingto [25]. Other decision combination methods includingproduct of confidence measures, decision template fu-sion, Dempster-Shafer, Bayesian belief integration [47],weighted sum and weighted product [48] did not givesuperior results.
In this paper, the probabilistic outputs of classifiers areused as a measure of confidence. The sum rule is thusdefined as follows for a given trial:
ga =
∑q∈Q
Pq(ωa|xi)
K∑a=1
∑q∈Q
Pq(ωa|xi)
=∑
q∈Q
1
|Q|Pq(ωa|xi) (7)
In Equation 7, ga is the summed confidence intervalfor affect class ωa . Q is the ensemble of the classifierschosen for fusion, |Q| the number of such classifiersand Pq(ωa|xi) is the posterior probability of having classωa the sample is xi according to classifier q. The finalchoice is done by selecting the class ωa with the highestga. It can be observed that ga can also be viewed as aconfidence measure on the class, ωa, given by the fusionof classifiers.
There are two problems employing SVM classifiers inthis fusion scheme. First, they are intrinsically only two-class classifiers and secondly, their output is uncalibratedso that it is not directly usable as a confidence valuein the case one wants to combine outputs of differentclassifiers or modalities. To tackle the first problem, theone versus all approach is used where one classifieris trained for each class (N classifier to train) and thefinal choice is done by majority voting. For the secondproblem, Platt [49] proposes to model the probabilityof being in one of the two classes knowing the outputvalue of the SVM by using a sigmoid fit, while Wu et al.
This article has been accepted for publication in a future issue of this journal, but has not been fully edited. Content may change prior to final publication.

IEEE TRANS. AFFECTIVE COMPUTING 9
[50] proposes a solution to extend this idea to multipleclasses. In this study we used the MATLAB libSVMimplementation [51] of the Platt and Wu algorithms toobtain the posterior probabilities, Pq(ωa|xi).
3 EXPERIMENTAL RESULTSThe experiments were performed in a laboratory envi-ronment with controlled temperature and illumination;24 participants viewed 20 video clips each. 467 sampleswere gathered over a potential dataset of 24× 20 = 480samples; the 13 missing ones were unavailable due totechnical difficulties.
0 500 1000 1500 2000 2500 3000 35003
4
5Pupilary responses to one of the videos
0 500 1000 1500 2000 2500 3000 3500−4
−2
0
2The first principal component
0 500 1000 1500 2000 2500 3000 35003.4
3.6
3.8
4
4.2
Time
The highlighted signal after subtracting the principal component
Fig. 7. From top to bottom: on the first plot there is anexample of pupil diameter measures from three differentparticipants in response to one video. The second plotshows the first principal component extracted by PCAfrom the time series shown in the first plot (the lightingeffect). The bottom plot shows the pupil diameter of theblue signal in the first plot after reducing the lighting effect.
For the pupillary responses to each video the mostsignificant component was extracted using PCA andthen removed from the pupillary time series. In theexample given in Fig. 7, examples of the pupillaryresponses, extracted pupillary lighting reflex and theresidual component after removing the light reflex aregiven. The normalized variance or eigen-values of thefirst component were found to be significantly largerthan the rest of the components. The first principalcomponent carried in average more than 50% of thevariance in the data.
In order to study the discrimination abilities of the eyegaze data features, a one way analysis of variance testwas performed on the features. The difference betweenthe mean of features in different arousal or valence cate-gories was found significant (p < 0.05). The significanceof one way ANOVA shows that there is at least a signif-icant difference between the means of the samples fromtwo classes out of three. The box plots of four features
1 2 3
0
0.2
0.4
0.6
0.8
1
1: Calm, 2: Medium arousal, 3: Activated
(a) Eye blinking rate, arousal
1 2 3
0
0.2
0.4
0.6
0.8
1
1: Unpleasant, 2: Neutral valence, 3: Pleasant
(b) Approach time ration, valence
1 2 3
0
0.2
0.4
0.6
0.8
1
1: Unpleasant, 2: Neutral valence, 3: Pleasant
(c) Blink depth, valence
1 2 3
0
0.2
0.4
0.6
0.8
1
1: Unpleasant, 2: Neutral valence, 3: Pleasant
(d) SD of pupil diameter, valence
Fig. 8. Box plots of four different gaze data featuresin three emotional conditions. (a) Eye blinking rate forarousal classification (b) Approach time ratio for valenceclassification (c) Blink depth, average blink time, for va-lence classification (d) STD of pupil diameter for valenceclassification. One way ANOVA results showed a signifi-cant difference beween features mean of different classes(p < 0.05)
namely, eye blinking rate, approach rate, maximum blinklength, and standard deviation of pupillary responsesare shown in Fig. 8. In average eye blinking rate washigher in calmer videos (see Fig. 8(a)). The amount oftime participants spent getting closer to the screen islower for the pleasant category. This shows that they hada tendency to seat more upright while watching morepleasant videos (see Fig. 8(b)). On the other hand, themaximum blink length or depth is higher for unpleasantvideos. This is due to the fact that participants kepttheir eyes closed for some moments while watchingunpleasant videos (see Fig. 8(c)). Pupillary response’sstandard deviation is also shown to be higher duringneutral scenes (see Fig. 8(d)).
To find the best discriminative EEG features, the lineardiscrimination criterion was calculated. This parameteris the the between class variance divided by withinclass variance for any given feature (see Table 3). Forarousal classification, PSD in alpha bands of occipitalelectrodes was found to be the most discriminant fea-tures. In contrary for valence beta and gamma bands oftemporal electrodes are more informative. The betweenclass to within class variance ratios are higher for the bestarousal EEG features. The higher linear discriminationcriterion for best arousal features explains the superiorclassification rate for arousal dimension (see Table 4).
Regarding the self-reports, we computed the aver-
This article has been accepted for publication in a future issue of this journal, but has not been fully edited. Content may change prior to final publication.

IEEE TRANS. AFFECTIVE COMPUTING 10
TABLE 310 best EEG features for arousal and valence
classification based on linear discrimination criterion.The between class variance to within class variance
ratios, σ2bw/σ
2wn are also given.
Arousal classification Valence classification
Band Electrode/s σ2bw/σ2
wn Band Electrode/s σ2bw/σ2
wn
Slow α PO4 0.18 β T8 0.08α PO4 0.17 γ T8 0.08θ PO4 0.16 β T7 0.07Slow α PO3 0.15 γ T7 0.06θ Oz 0.14 γ P8 0.05Slow α O2 0.14 γ P7 0.05Slow α Oz 0.14 θ Fp1 0.04θ O2 0.13 β CP6 0.04θ FC6 0.13 β P8 0.04α PO3 0.13 β P7 0.04
age pair-wise Cohen’s kappa for keyword based an-notations. A fair multi-rater agreement was found onemotional keywords (9 keywords) with κ = 0.32. Thecorrelation between arousal and valence ratings betweenparticipants was also computed. The correlation be-tween arousal and valence ratings given by differentparticipants on nine points scales were mean(ρ) =0.45, SD(ρ) = 0.25 and mean(ρ) = 0.73, SD(ρ) = 0.12respectively. Therefore, there was a higher inter-rateragreement on valence comparing to arousal.
3.1 Emotion Recognition FeasibilityReferring to the first research question, the results haveshown that it is possible to accurately recognize emo-tions with a user-independent approach. The classifi-cation accuracy measures are summarized in Table 4.The traditional F-score which combines precision andrecall by their harmonic mean was also computed foreach emotion category to give an overall evaluation ofclassification performance (Equation 8). The F1 scorevaries between zero and one. The random level is 0.5 forbinary classification and balanced classes; values closestto 1 indicate a better performance.
F1 =2× precision× recall
precision+ recall(8)
Precision and recall can be only defined for one class;hence, the F1 scores were calculated from the resultsof one versus all classification schemes for each classseparately. As a result, the expectation of F1 scores ofa uniform random classifier are calculated and givenin Table 4. The classification rate of both three classclassifications are defined as the percentage of correctlyclassified samples.
For the SVM classifier, the size of the kernel, γ, wasselected between [0.01, 10], based on the average F1 scoreusing a 20-fold cross validation on the training set. TheC parameter that regulates the tradeoff between errorminimization and margin maximization is empiricallyset to 1. Classifications were first performed with the
TABLE 4The classification rate and F1 scores of emotion
recognition for different modalities.
ModalityClassification rate Average F1
dimension arousal valence arousal valenceEEG 62.1% 50.5% 0.60 0.50Eye gaze 71.1% 66.6% 0.71 0.66Feature level fusion(FLF)
66.4% 58.4% 0.65 0.55
Decision level fusion(DLF)
76.4% 68.5% 0.76 0.68
Self-reports with SAMmanikins
55.7% 69.4% 0.57 0.70
Random level 33.3% 33.3% 0.36 0.40
goal of recovering the three classes with a leave-one-participant-out cross validation scheme. Regarding thesingle modality classification of arousal and valence inthree classes, we obtained 62.1% and 50.5% accuracyfrom EEG signals and 71.1% and 66.6% accuracy fromeye gaze data (see Table 4). Although EEG classificationresults are inferior to the eye gaze data, they are compa-rable to the state of the art classification rates consideringthe inter-participant classification scheme [52], [25].
The FLF did not improve the best single modality,gaze data, results. However, the modality fusion strategyusing the DLF improved the best SVM classificationrate for arousal up to 76.4%. The DLF did not under-perform for valence classification. To test the statisticalsignificance of the classification performance, a pairedt-test was used to compare F1 scores of the DLF onone side and the self reports and the best single modal-ity, eye gaze data, on the other side. The F1 scoresfrom each participant’s samples were compared and theimprovement over arousal classification comparing toeye gaze data and self reports were found significant(p < 0.01). However, the difference between the eye gaze,DLF, and self reports F1 scores on valence classificationwas not found statistically significant. The confidencelevels of the classification results from the two modalitieswere added to find the class with the highest summedconfidence.
The confusion matrices for each modality show howthey performed on each emotion category (Tables 5.a -5.j). In these confusion matrices the row represents theclassified label and each column represents the groundtruth. Only for activated category EEG classificationperformed as well as gaze data modality. However, thefusion of both with the exceptions of neutral valenceclass outperformed gaze data results (see tables 5.a - 5.dand 5.f - 5.i). The DLF outperformed the feature levelfusion for all categories except unpleasant (see tables 5.c,5.d, 5.h, and 5.i).
The use of different stimuli and emotion classes makeit difficult to directly compare the results to similar work.Here, we compare the obtained accuracy with the most
This article has been accepted for publication in a future issue of this journal, but has not been fully edited. Content may change prior to final publication.

IEEE TRANS. AFFECTIVE COMPUTING 11
TABLE 5Confusion matrices of different classification schemes (row: classified label; column: ground truth). The numbers onthe first row and the first column of tables a, b, c, d and e represents: 1. calm, 2. medium aroused, 3. activated andfor tables f, g, h, i, and j represents: 1. unpleasant 2. neutral valence 3. pleasant. The confusion matrices relate to
classification using (a, f) EEG signals (b, g) Eye gaze data (c, h) Feature level fusion (FLF) (d, i) Decision level fusion(DLF) (e, j) Self reports
Arousal
1 2 31 44 15 112 22 111 393 30 60 135
(a) EEG
1 2 31 60 7 92 10 136 403 26 43 136(b) Eye gaze data
1 2 31 49 14 102 15 117 313 32 55 144
(c) FLF
1 2 31 62 6 82 8 146 283 26 34 149
(d) DLF
1 2 31 63 35 112 24 88 653 9 63 109
(e) Self reports
Valence
1 2 31 87 56 522 23 52 153 54 31 97
(f) EEG
1 2 31 108 46 262 36 77 123 20 16 126(g) Eye gaze data
1 2 31 139 83 562 7 36 103 18 20 98
(h) FLF
1 2 31 115 48 222 27 75 123 22 16 130
(i) DLF
1 2 31 126 40 42 38 91 533 0 8 107
(j) Self reports
similar existing studies. Kolodyazhniy et al. [26] usedvideos extracted from movies in a user independentstrategy to classify three classes; namely, neutral, sadnessand fear. They obtained 77.5% recognition rate fromperipheral physiological responses while introducingrandom startles. Their results on three classes is almost atthe same level of our arousal classification performance.In a gaming protocol Chanel et al. [52] achieved theaccuracy of 63% in a user-independent approach on therecognition of three classes; namely, boredom, engage-ment, anxiety. These three classes can be translated toour three arousal levels. Our results are inferior to theones by Lisetti and Nasoz [14] on six classes. However,we used different modalities and videos and thereforethese results are not directly comparable.
3.2 Emotion recognition and self-reports
Referring to the second research question, the agreementbetween participants’ self-reports and ground truth isshown in the confusion matrix given in Table 5.e andTable 5.j. The columns of this table represent how thevideos of each class defined by ground truth were in-dividually self-reported. For example, the first columnof this table represent how many of the samples whichwere actually in class one were classified into differentclasses.
In order to measure the agreement between individ-ual self-reports and the ground truth, the self-reportedarousal and valence scores on nine point scale weretranslated into three levels. These levels were thentreated like classified labels and the classification ratewas computed. This was done by considering that thegoal of each participant is to label a video clip by thecorrect label, the most common tag. The classificationrate for individually self-reported labels was 55.7% forarousal which is inferior to the worst classifier’s result.Although, looking at the inter-annotation agreement,participants found that it easier to self-report pleasant-ness, the classification rate for valence is not significantlylower than the self-report rate. Therefore, the accuracy
of obtained tags via classification is comparable to theindividually reported labels.
Fig. 9. This bar chart shows the F1 score for classificationresults of each class from different modalities.
Fig. 9 summarizes the comparison of different classi-fication strategies showing the F1 scores for each cate-gory and on average. Looking at the bars on the mostright side of the chart, only EEG results are inferior tothe explicit self-report agreements using self assessmentmanikins.
4 DISCUSSION
In this section, we discuss limitations of the currentstudy and present the open issues. Physiological re-sponses can vary due to non-emotional changes, such ascircadian rhythms, ambient temperature, body postureand other psychophysiological factors such as attention, anticipation and mental effort [53]. Emotion recogni-tion from bodily responses is therefore confounded bycontextual factors. Moreover, like other similar studies[26], the generalization of the results are limited by thevideos shown to the participants.
The inter-annotation agreement for arousal self-reportsis lower comparing to keyword based self-assessments.In a real-case scenario for an explicit tagging system,using words will be easier for an ordinary user andleads to higher between participant agreement in com-parison to arousal and valence reported by self assess-ment manikins (SAM). However, emotional keywords
This article has been accepted for publication in a future issue of this journal, but has not been fully edited. Content may change prior to final publication.

IEEE TRANS. AFFECTIVE COMPUTING 12
are difficult to translate and might not exist with theexact same meaning in different languages [32]. Emotiondetection can overcome those difficulties with keepingthe accuracy at the same level. In this paper, participantswere asked to explicitly choose an emotional indicatorto form the ground truth. In a real application, with theexistence of a reliable user-independent emotion recogni-tion method, the self-reporting phase can be eliminated.
Arousal classes were in average detected with higheraccuracy using EEG signals comparing to valence labels.This might be due to higher visual and auditory varianceof the arousal variant videos comparing to valence vari-ant ones. Exciting scenes usually contain fast movementsand loud noises which manifest themselves both in EEGsignals and pupillary responses, whereas the differencebetween pleasant and unpleasant responses can be hid-den in the semantics. The direct bodily responses todifferent stimuli can increase the variance in responsesand improve the emotion recognition results. For exam-ple, faster changing video induces a different responsein occipital cortex activities comparing to a more staticvideo.
The DLF superior classification rate for arousal andits similar performance for valence classification showsthat the proposed emotion classification can replace theself-reporting of single participants for detecting popularemotional tags for this dataset. These popular emotionaltags are defined by the emotions felt by the majorityof users watching the same video. After detecting emo-tional classes, they can be stored with other metadataattached to each video. Emotional labels can be con-verted to scores for arousal and valence for each video.The emotional scores can be then used, as in the imagerecommendation applications [11], to improve a videorecommender’s performance. In future, the recognizedemotional labels should be added as features to a videorecommendation system to study the effect of introduc-ing emotional labels on those systems. This effect canbe determined by assessing users’ satisfaction from arecommendation or retrieval system with and withoutemotional information. The emotion detection can bealso used indirectly as a tool to detect topical relevancein information retrieval systems [18].
The determination of ground truth is based on theparticipants’ feedback in the online preliminary exper-iment. In order to measure the agreement between thepopular responses of the two separate populations ofthe preliminary assessments and the experiments, wecomputed the median valence and arousal reportedduring the experiment and compared the labels basedon the recorded participants’ popular response. Onlythree arousal labels out of 40 labels were changed fromactivated to medium arousal or vice-versa. No valencelabel has changed when comparing two populations.This is due to valence dimension’s higher inter-annotatoragreement.
This study still has open issues that need to be con-sidered in the future. In a real case scenario, any new
user will need to have a few minutes of signals recordedto provide reliable values for feature normalization. Theestimation of pupillary response to lighting is an openissue which needs more investigation. Although weassumed that the lighting pupillary responses are similarbetween participants, there will be a large difference incase of introducing users from a different age group.Therefore, the parameters of a reliable model for pupil-lary reflex to lighting, such as [43], should be determinedbefore introducing a new user to the system. Alterna-tively, the real time lighting effect similar to [29] can beemployed to remove the lighting effect. A larger videoset and larger number of participant can be consideredto increase the generalization of the developed emotionclassifier in response to videos.
In this paper, the length of the experimental sessionlimited the number of videos we could show to eachparticipant. The number of participants in this paper islarge and diverse enough comparing to similar studies[1], [25]. However this population only consisted ofyoung students which limits the trained algorithm tothis particular group. These limitations might worsenthe results in case of introducing a new genre of videowhich was not present in the current video set. To gener-alize and train such a system, the recruited participantsshould be as close as possible to the target audience ofthe video retrieval or recommendation systems.
Emotions can co-occur and/or last for very shortmoments. This puts using a single emotional label for avideo clip under question. In order to address this issue,self-reporting should include the possibility to indicatedifferent emotions and their degree of strength. This ispossible by using questionnaires such as positive andnegative affect schedule (PANAS) [54] or Geneva emo-tion wheel [9]. However, these emotional self-reportingmethods are more complex and make the experimentlonger. In future, multiple or co-occurring emotionsshould be assessed using a more sophisticated self re-porting tool.
5 CONCLUSIONS
This paper showed the performance of an inter-participant emotion recognition tagging approach usingparticipants’ EEG signals, gaze distance and pupillaryresponse as affective feedbacks. The feasibility of anapproach to recognize emotion in response to videosis shown. Although the results were based on a fairlysmall video dataset due to experimental limitations thepromising accuracy can be scalable to more samplesfrom a larger population. The improved performanceusing multi-modal fusion techniques leads to the conclu-sion that by adding other modalities, such as facial ex-pressions, accuracy as well as robustness should furtherimprove. Results from our previous studies [3] showedthat there is a significant difference between peoples’emotional self assessments in response to videos. How-ever, there usually exists one most popular emotional
This article has been accepted for publication in a future issue of this journal, but has not been fully edited. Content may change prior to final publication.

IEEE TRANS. AFFECTIVE COMPUTING 13
tag for which there is significant agreement in a popu-lation. This “most popular emotion” has been shown tobe detectable with monitoring users’ bodily responses.Moreover, the population tags give the retrieval systemhigher chance of success in a given population. Wehave shown that it is possible to design an accurateand user-independent classification protocol to recognizeemotions from pupillary reflex, EEG signals in responseto video content. Moreover, we have shown that forthe utilized video dataset, the non-verbal affective cuescan replace affective self-report with comparable emo-tion recognition performance and no requisite of directuser inputs. We can thus answer positively to our tworesearch questions.
ACKNOWLEDGMENTSThe work of Soleymani and Pun was supported in partby the Swiss National Science Foundation and in partby the European Community’s Seventh Framework Pro-gramme (FP7/2007-2011) under grant agreement Peta-media no. 216444. The data acquisition part of this workwas supported by the European Research Council underthe ERC Starting Grant agreement no. ERC-2007-StG-203143 (MAHNOB). The work of Pantic is supportedin part by the European Community’s 7th FrameworkProgramme (FP7/2007-2013) under the grant agreementno 231287 (SSPNet). The authors would like to thankDr. Jeroen Lichtenauer and Jozef Dobos (Imperial Col-lege, London), Prof. Didier Grandjean and Dr. Guil-laume Chanel (University of Geneva) for their valuablescientific comments and technical support during theexperiments.
REFERENCES[1] J. Kim and E. Andre, “Emotion Recognition Based on Physiolog-
ical Changes in Music Listening,” Pattern Analysis and MachineIntelligence, IEEE Transactions on, vol. 30, no. 12, pp. 2067–2083,2008.
[2] J. Rottenberg, R. D. Ray, and J. J. Gross, Emotion elicitation usingfilms, ser. Series in affective science. Oxford University Press,2007, pp. 9–28.
[3] M. Soleymani, G. Chanel, J. J. M. Kierkels, and T. Pun, “AffectiveCharacterization of Movie Scenes Based on Content Analysis andPhysiological Changes,” International Journal of Semantic Comput-ing, vol. 3, no. 2, pp. 235–254, June 2009.
[4] R. W. Picard and S. B. Daily, “Evaluating Affective Interactions:Alternatives to Asking What Users Feel,” in CHI Workshop onEvaluating Affective Interfaces: Innovative Approaches, 2005.
[5] K. R. Scherer, “Studying the emotion-antecedent appraisal pro-cess: An expert system approach,” Cognition & Emotion, vol. 7,no. 3, pp. 325–355, 1993.
[6] A. Ortony, G. L. Clore, and A. Collins, The Cognitive Structure ofEmotions. Cambridge University Press, July 1988.
[7] D. Sander, D. Grandjean, and K. R. Scherer, “A systems approachto appraisal mechanisms in emotion,” Neural Netw., vol. 18, no. 4,pp. 317–352, May 2005.
[8] W. Wirth and H. Schramm, “Media and Emotions,” Communica-tion research trends, vol. 24, no. 3, pp. 3–39, 2005.
[9] K. R. Scherer, “What are emotions? And how can they be mea-sured?” Social Science Information, vol. 44, no. 4, pp. 695–729,December 2005.
[10] A. Hanjalic and L.-Q. Xu, “Affective video content representationand modeling,” Multimedia, IEEE Transactions on, vol. 7, no. 1, pp.143–154, 2005. [Online]. Available: http://dx.doi.org/10.1109/TMM.2004.840618
[11] M. Tkalcic, U. Burnik, and A. Kosir, “Using affective parameters ina content-based recommender system for images,” User Modelingand User-Adapted Interaction, pp. 1–33–33, September 2010.
[12] M. K. Shan, F. F. Kuo, M. F. Chiang, and S. Y. Lee, “Emotion-basedmusic recommendation by affinity discovery from film music,”Expert Syst. Appl., vol. 36, no. 4, pp. 7666–7674, September 2009.
[13] H. Joho, J. M. Jose, R. Valenti, and N. Sebe, “Exploiting facialexpressions for affective video summarisation,” in Proceeding ofthe ACM International Conference on Image and Video Retrieval, ser.CIVR ’09. New York, NY, USA: ACM, 2009.
[14] C. L. Lisetti and F. Nasoz, “Using noninvasive wearable com-puters to recognize human emotions from physiological signals,”EURASIP J. Appl. Signal Process., vol. 2004, no. 1, pp. 1672–1687,January 2004.
[15] K. Takahashi, “Remarks on Emotion Recognition from BioPoten-tial Signals,” in in 2nd Int. Conf. on Autonomous Robots and Agents,2004, 2005.
[16] S. Koelstra, A. Yazdani, M. Soleymani, C. Muhl, J.-S. Lee, A. Ni-jholt, T. Pun, T. Ebrahimi, and I. Patras, “Single Trial Classificationof EEG and Peripheral Physiological Signals for Recognition ofEmotions Induced by Music Videos,” in Brain Informatics, ser.Lecture Notes in Computer Science, Y. Yao, R. Sun, T. Poggio,J. Liu, N. Zhong, and J. Huang, Eds. Berlin, Heidelberg: Springer,2010, vol. 6334, ch. 9, pp. 89–100.
[17] H. Joho, J. Staiano, N. Sebe, and J. Jose, “Looking at the viewer:analysing facial activity to detect personal highlights of multime-dia contents,” Multimedia Tools and Applications, pp. 1–19, October2010.
[18] I. Arapakis, I. Konstas, and J. M. Jose, “Using facial expressionsand peripheral physiological signals as implicit indicators oftopical relevance,” in Proceedings of the seventeen ACM internationalconference on Multimedia, ser. MM ’09. New York, NY, USA: ACM,2009, pp. 461–470.
[19] G. Irie, T. Satou, A. Kojima, T. Yamasaki, and K. Aizawa, “Af-fective Audio-Visual Words and Latent Topic Driving Model forRealizing Movie Affective Scene Classification,” Multimedia, IEEETransactions on, vol. 12, no. 6, pp. 523 –535, October 2010.
[20] M. Soleymani, J. J. M. Kierkels, G. Chanel, and T. Pun, “ABayesian framework for video affective representation,” in Pro-ceedings of the International Conference on Affective Computing andIntelligent interaction (ACII 2009), September 2009, pp. 1–7.
[21] P. Lang, M. Bradley, and B. Cuthbert, “International affective pic-ture system (IAPS): Affective ratings of pictures and instructionmanual,” University of Florida, Gainesville, Florida, US, Tech.Rep. A-8, 2008.
[22] P. J. Lang, M. K. Greenwald, M. M. Bradley, and A. O. Hamm,“Looking at pictures: Affective, facial, visceral, and behavioralreactions,” Psychophysiology, vol. 30, no. 3, pp. 261–273, 1993.
[23] J. Wang and Y. Gong, “Recognition of multiple drivers’ emotionalstate,” in In ICPR’08: The 19th International Conference on PatternRecognition, 2008.
[24] J. A. Healey, “Wearable and automotive systems for affect recog-nition from physiology,” Ph.D. dissertation, MIT, 2000.
[25] G. Chanel, J. J. M. Kierkels, M. Soleymani, and T. Pun, “Short-termemotion assessment in a recall paradigm,” International Journal ofHuman-Computer Studies, vol. 67, no. 8, pp. 607–627, August 2009.
[26] V. Kolodyazhniy, S. D. Kreibig, J. J. Gross, W. T. Roth, andF. H. Wilhelm, “An affective computing approach to physiologicalemotion specificity: Toward subject-independent and stimulus-independent classification of film-induced emotions,” Psychophys-iology, vol. 7, no. 48, pp. 908–922, 2011.
[27] Bradley, M. Margaret, Miccoli, Laura, Escrig, A. Miguel, Lang,and J. Peter, “The pupil as a measure of emotional arousal andautonomic activation,” Psychophysiology, vol. 45, no. 4, pp. 602–607, July 2008.
[28] T. Partala and V. Surakka, “Pupil size variation as an indicationof affective processing,” International Journal of Human-ComputerStudies, vol. 59, no. 1-2, 2003.
[29] Y. Gao, A. Barreto, and M. Adjouadi, “Monitoring and processingof the pupil diameter signal for affective assessment of a computeruser,” in Proceedings of the 13th International Conference on Human-Computer Interaction. Part I: New Trends. Berlin, Heidelberg:Springer-Verlag, 2009, pp. 49–58.
[30] J. J. M. Kierkels, M. Soleymani, and T. Pun, “Queries and tagsin affect-based multimedia retrieval,” in ICME’09: Proceedings ofthe 2009 IEEE international conference on Multimedia and Expo.Piscataway, NJ, USA: IEEE Press, 2009, pp. 1436–1439.
This article has been accepted for publication in a future issue of this journal, but has not been fully edited. Content may change prior to final publication.
IEEE TRANS. AFFECTIVE COMPUTING 14
[31] M. Pantic and A. Vinciarelli, “Implicit Human-Centered Tagging,”IEEE Signal Processing Magazine, vol. 26, no. 6, pp. 173–180,November 2009.
[32] J. A. Russell, “Culture and the Categorization of Emotions,”Psychological Bulletin, vol. 110, no. 3, pp. 426–450, 1991.
[33] J. A. Russell and A. Mehrabian, “Evidence for a three-factortheory of emotions,” Journal of Research in Personality, vol. 11, no. 3,pp. 273–294, September 1977.
[34] M. Soleymani, J. Davis, and T. Pun, “A collaborative personalizedaffective video retrieval system,” in Affective Computing and Intel-ligent Interaction and Workshops, 2009. ACII 2009. 3rd InternationalConference on, sep 2009.
[35] A. Schaefer, F. Nils, X. Sanchez, and P. Philippot, “Assessing theeffectiveness of a large database of emotion-eliciting films: A newtool for emotion researchers,” Cognition & Emotion, vol. 24, no. 7,pp. 1153–1172, 2010.
[36] J. Lichtenauer, M. Valstar, J. Shen, and M. Pantic, “Cost-EffectiveSolution to Synchronized Audio-Visual Capture Using MultipleSensors,” in AVSS ’09: Proceedings of the 2009 Sixth IEEE Inter-national Conference on Advanced Video and Signal Based Surveillance.Washington, DC, USA: IEEE Computer Society, 2009, pp. 324–329.
[37] R. Adolphs, D. Tranel, and A. R. Damasio, “Dissociable neuralsystems for recognizing emotions,” Brain and Cognition, vol. 52,no. 1, pp. 61–69, June 2003.
[38] A. R. Damasio, T. J. Grabowski, A. Bechara, H. Damasio, L. L. B.Ponto, J. Parvizi, and R. D. Hichwa, “Subcortical and cortical brainactivity during the feeling of self-generated emotions,” NatureNeuroscience, vol. 3, no. 10, pp. 1049–1056, October 2000.
[39] R. J. Davidson, “Affective neuroscience and psychophysiology:toward a synthesis.” Psychophysiology, vol. 40, no. 5, pp. 655–665,September 2003.
[40] L. I. Aftanas, N. V. Reva, A. A. Varlamov, S. V. Pavlov, andV. P. Makhnev, “Analysis of evoked EEG synchronization anddesynchronization in conditions of emotional activation in hu-mans: temporal and topographic characteristics.” Neuroscience andbehavioral physiology, vol. 34, no. 8, pp. 859–867, October 2004.
[41] P. D. Welch, “The Use of Fast Fourier Transform for the Estimationof Power Spectra: A Method Based on Time Averaging OverShort, Modified Periodograms,” IEEE Transactions on Audio andElectroacoustics, vol. 15, pp. 70–73, 1967.
[42] S. K. Sutton and R. J. Davidson, “Prefrontal Brain Asymmetry:A Biological Substrate of the Behavioral Approach and InhibitionSystems,” Psychological Science, vol. 8, no. 3, pp. 204–210, 1997.
[43] V. F. Pamplona, M. M. Oliveira, and G. V. G. Baranoski, “Photo-realistic models for pupil light reflex and iridal pattern deforma-tion,” ACM Trans. Graph., vol. 28, no. 4, pp. 1–12, 2009.
[44] A. Longtin and J. Milton, “Modelling autonomous oscillations inthe human pupil light reflex using non-linear delay-differentialequations,” Bulletin of Mathematical Biology, vol. 51, no. 5, pp. 605–624, September 1989.
[45] H. Bouma and L. C. J. Baghuis, “Hippus of the pupil: Periodsof slow oscillations of unknown origin,” Vision Research, vol. 11,no. 11, 1971.
[46] F. H. Kanfer, “Verbal rate, eyeblink, and content in structuredpsychiatric interviews,” Journal of Abnormal and Social Psychology,vol. 61, no. 3, pp. 341–347, 1960.
[47] D. Ruta and B. Gabrys, “An Overview of Classifier Fusion Meth-ods,” Computing and Information Systems, vol. 7, no. 1, pp. 1–10,2000.
[48] L. I. Kuncheva, Combining Pattern Classifiers: Methods and Algo-rithms. Wiley-Interscience, july 2004.
[49] J. C. Platt, Probabilities for SV Machines. MIT Press, 2000, pp.61–74.
[50] T. F. Wu, C. J. Lin, and R. C. Weng, “Probability Estimates forMulti-class Classification by Pairwise Coupling,” J. Mach. Learn.Res., vol. 5, pp. 975–1005, 2004.
[51] C. Chang and C. Lin, “LIBSVM: a Library for Support VectorMachines,” 2001.
[52] G. Chanel, C. Rebetez, M. Betrancourt, and T. Pun, “Emotionassessment from physiological signals for adaptation of gamedifficulty,” Systems, Man and Cybernetics, Part A: Systems andHumans, IEEE Transactions on, vol. PP, no. PP, p. In Press, 2011.
[53] S. D. Kreibig, G. Schaefer, and T. Brosch, Psychophysiologicalresponse patterning in emotion: Implications for affective computing.Oxford, UK: Oxford University Press, 2010, ch. 2.4, pp. 105–130.
[54] D. Watson, L. A. Clark, and A. Tellegen, “Development andvalidation of brief measures of positive and negative affect: thePANAS scales.” Journal of personality and social psychology, vol. 54,no. 6, pp. 1063–1070, June 1988.
Mohammad Soleymani received both his B.Sc.and M.Sc. degrees from the department of Elec-trical and Computer Engineering, University ofTehran, Iran, in 2003 and 2006 respectively. Heis now a doctoral student and research assistantat the Computer Vision and Multimedia Labora-tory, Computer Science Department, Universityof Geneva, Switzerland. His research interestsinclude affective computing and multimedia in-formation retrieval. He has been co-organizingthe MediaEval multimedia benchmarking initia-
tive since 2010. He is a member of IEEE and the HUMAINE association.
Maja Pantic is Professor in Affective and Be-havioural Computing at Imperial College Lon-don, Department of Computing, UK, and at theUniversity of Twente, Department of ComputerScience, the Netherlands. She is one of theworld’s leading experts in the research on ma-chine understanding of human behavior includ-ing vision-based detection, tracking, and analy-sis of human behavioral cues like facial expres-sions and body gestures, and multi-modal hu-man affect/mental state understanding. She has
published more than 100 technical papers in these areas of research.In 2008, for her research on Machine Analysis of Human NaturalisticBehavior (MAHNOB), she received European Research Council Start-ing Grant as one of 2% best young scientists in any research field inEurope. In 2011, Prof. Pantic was awarded Roger Needham Awardmade annually for a distinguished research contribution in computerscience by a UK based researcher within ten years of their PhD. Shecurrently serves as the Editor in Chief of Image and Vision ComputingJournal and as an Associate Editor for the IEEE Transactions onSystems, Man, and Cybernetics Part B (TSMC-B). She has also servedas the General Chair for several conferences and symposia includingthe IEEE FG 2008 and the IEEE ACII 2009. She is a Senior Member ofthe IEEE.
Thierry Pun (IEEE Member, EE Eng. 1979,PhD 1982) is head of the Computer Visionand Multimedia Laboratory, Computer ScienceDepartment, University of Geneva, Switzerland.He received his Ph.D. in image processing forthe development of a visual prosthesis for theblind in 1982, at the Swiss Federal Instituteof Technology, Lausanne, Switzerland. He wasvisiting fellow from 1982 to 1985 at the NationalInstitutes of Health, Bethesda, USA. After beingCERN Fellow from 1985 to 1986 in Geneva,
Switzerland, he joined the University of Geneva, in 1986, where hecurrently is full professor at the Computer Science Department. He hasauthored or co-authored about 300 full papers as well as eight patents.His current research interests, related to affective computing and multi-modal interaction, concern: physiological signals analysis for emotionassessment and brain-computer interaction, multi-modal interfaces forblind users, data hiding, multimedia information retrieval systems.
This article has been accepted for publication in a future issue of this journal, but has not been fully edited. Content may change prior to final publication.