Identification of Severe Crash Factors and … of Severe Crash Factors and Countermeasures in North...
133
I I d d e e n n t t i i f f i i c c a a t t i i o o n n o o f f S S e e v v e e r r e e C C r r a a s s h h F F a a c c t t o o r r s s a a n n d d C C o o u u n n t t e e r r m m e e a a s s u u r r e e s s i i n n N N o o r r t t h h C C a a r r o o l l i i n n a a - - F F i i n n a a l l R R e e p p o o r r t t Prepared for the North Carolina Department of Transportation By the UNC Highway Safety Research Center August 2001
Transcript of Identification of Severe Crash Factors and … of Severe Crash Factors and Countermeasures in North...

IIddeennttiiffiiccaattiioonn ooff SSeevveerree CCrraasshhFFaaccttoorrss aanndd CCoouunntteerrmmeeaassuurreessiinn NNoorrtthh CCaarroolliinnaa -- FFiinnaall RReeppoorrtt
PPrreeppaarreedd ffoorr tthhee NNoorrtthh CCaarroolliinnaa DDeeppaarrttmmeenntt ooff TTrraannssppoorrttaattiioonn
BByy tthhee UUNNCC HHiigghhwwaayy SSaaffeettyy RReesseeaarrcchh CCeenntteerr
AAuugguusstt 22000011

Technical Report Documentation Page
1. Report No.
FHWA/NC/2001-003
2. Government Accession No. 3. Recipient's Catalog No.
5. Report Date
August, 2001
4. Title and Subtitle
Identification of Severe Crash Factors and Countermeasures inNorth Carolina – Final Report
6. Performing Organization Code
7. Author(s) Huang, H.F., Schneider, R.J., Zegeer, C.V., Khattak, A.J.,Amerlynck, V.J., and Lacy, J.K.
8. Performing Organization Report No.
10. Work Unit No. (TRAIS)9. Performing Organization Name and Address
University of North CarolinaHighway Safety Research Center730 Airport Road, Bolin Creek CenterChapel Hill, NC 27599-3430
11. Contract or Grant No.
1999-1442-01
13. Type of Report and Period Covered
Final Report May 1, 1999 – August 2001
12. Sponsoring Agency Name and Address
North Carolina Department of TransportationResearch and Analysis Group1 South Wilmington StreetRaleigh, NC 27601 14. Sponsoring Agency Code
1999-1115. Supplementary Notes
Pat Strong and Mike Stanley were the N.C. DOT Contract Managers. The UNC Department of City and RegionalPlanning was a subcontractor to HSRC.
16. Abstract
This report examines the roadway, crash, vehicle, individual, and environmental factors that are associated with fatal andserious injury crashes in North Carolina between 1993 and 1997. The initial analysis identifies road classifications,geographic characteristics, and time trends related to severe crashes using Highway Safety Information Systems (HSIS)segment and crash data. HSIS system highways in North Carolina include the state primary and major secondary routes. Non-HSIS roads include local streets and minor secondary streets. Both HSIS and non-HSIS data are used in the moredetailed section of the study to analyze the severe crash factors on all HSIS highways, two-lane urban HSIS highways,two-lane rural HSIS highways, urban non-HSIS routes, and rural non-HSIS routes.
In this report, a test of the standard error of a binomial proportion is used to find the statistical significance of theroadway, crash, vehicle, individual, and environmental factors related to severe crashes. The initial analysis shows thaturban and rural two-lane roads are associated with the highest crash severity, mountain counties have the highestproportion of severe crashes, and crash severity remained stable for some of the most severe crash types. Factorsassociated with significantly high crash severity on all roadway types include curve, run-off-road, utility pole, tree, head-on, pedestrian, bicycle, darkness, and alcohol use. The final section of the report recommends countermeasures that canbe used to reduce the incidence of fatal and serious injury crashes associated with these factors.
17. Key Words:
crashes, fatal and severe injury, countermeasures,crash factors
18. Distribution Statement
No restrictions.
19. Security Classif. (of this report)
Unclassified
20. Security Classif. (of this page)
Unclassified
21. No. of Pages
151
22. Price
Form DOT F 1700.7 (8-72)
IDENTIFICATION OF SEVERE CRASH FACTORS ANDCOUNTERMEASURES IN NORTH CAROLINA
For the North Carolina Department of Transportation
By the University of North Carolina Highway Safety Research Center
Authors:Herman F. Huang
Robert J. SchneiderCharles V. ZegeerAsad J. Khattak
Virginie J. AmerlynckJ. Kevin Lacy
Project Coordinator: Charles V. Zegeer
August 2001

ii
TABLE OF CONTENTSABSTRACT.................................................................................................................................... vINTRODUCTION .......................................................................................................................... 1REVIEW OF LITERATURE ......................................................................................................... 2
A. PREVIOUS CRASH FACTOR STUDIES........................................................................... 2B. CONTRIBUTION OF THIS STUDY TO THE LITERATURE.......................................... 3
ANALYSIS OVERVIEW .............................................................................................................. 4PART I INITIAL ANALYSIS OF NORTH CAROLINA CRASHES......................................... 6
A. COMPARISON OF NORTH CAROLINA WITH THE SOUTHEAST AS A WHOLE.... 6B. NORTH CAROLINA CRASH FACTORS .......................................................................... 7
Introduction .......................................................................................................................... 7Method.................................................................................................................................. 7Data Description................................................................................................................... 8Steps ..................................................................................................................................... 9Analysis Results ................................................................................................................. 10
C. CONCLUSIONS OF INITIAL ANALYSIS ...................................................................... 27Segments ............................................................................................................................ 27Crashes ............................................................................................................................... 27
D. NEED FOR MORE IN-DEPTH ANALYSES ................................................................... 28Crash Types Recommended for Further Investigation....................................................... 28Crash Characteristics Recommended for Further Investigation......................................... 29
PART II DETAILED COMPARISON OF HSIS AND NON-HSIS ROUTES.......................... 30A. OBJECTIVE ....................................................................................................................... 30B. APPROACH........................................................................................................................ 30
Method................................................................................................................................ 30Data Description................................................................................................................. 32
C. ANALYSIS OF HSIS TWO-LANE URBAN, HSIS TWO-LANE RURAL, AND OTHERHSIS ROUTES................................................................................................................... 36Roadway Factors ................................................................................................................ 36Crash Factors ...................................................................................................................... 40Vehicle Factors................................................................................................................... 43Driver Factors..................................................................................................................... 43Environmental Factors ....................................................................................................... 46
D. ANALYSIS OF NON-HSIS URBAN AND RURAL ROUTES ....................................... 50Roadway Factors ................................................................................................................ 50Crash Factors ...................................................................................................................... 53Vehicle Factors................................................................................................................... 56Driver Factors..................................................................................................................... 56Environmental Factors ....................................................................................................... 56
E. Summary of Severe Crash Factors on HSIS and non-HSIS Routes.................................... 59PART III COUNTERMEASURES ............................................................................................. 62
A. INTRODUCTION .............................................................................................................. 62B. RECOMMENDED TREATMENTS .................................................................................. 62
Curve Crashes8 ................................................................................................................... 62Run-off-Road Crashes (General)9 ...................................................................................... 64

iii
Utility Pole Crashes12 ......................................................................................................... 65Tree Crashes14 .................................................................................................................... 65Head-On Crashes15 ............................................................................................................. 66Pedestrian Crashes.............................................................................................................. 67Bicycle Crashes19 ............................................................................................................... 71Motorcycle Crashes............................................................................................................ 72Alcohol Crashes ................................................................................................................. 72Nighttime Crashes .............................................................................................................. 72
CONCLUSIONS....................................................................................................................... 73REFERENCES ............................................................................................................................. 74APPENDIX A COMPARISON OF NORTH CAROLINA WITH THE SOUTHEAST AS AWHOLEAPPENDIX B: CARE DATA TABLESAPPENDIX C: PRELIMINARY HSIS ANALYSIS HYPOTHESES AND DATAAPPENDIX D: CRASH FACTOR SIGNIFICANCE TABLESAPPENDIX E: HSIS AND NON-HSIS SAMPLE SIZE TABLES

iv
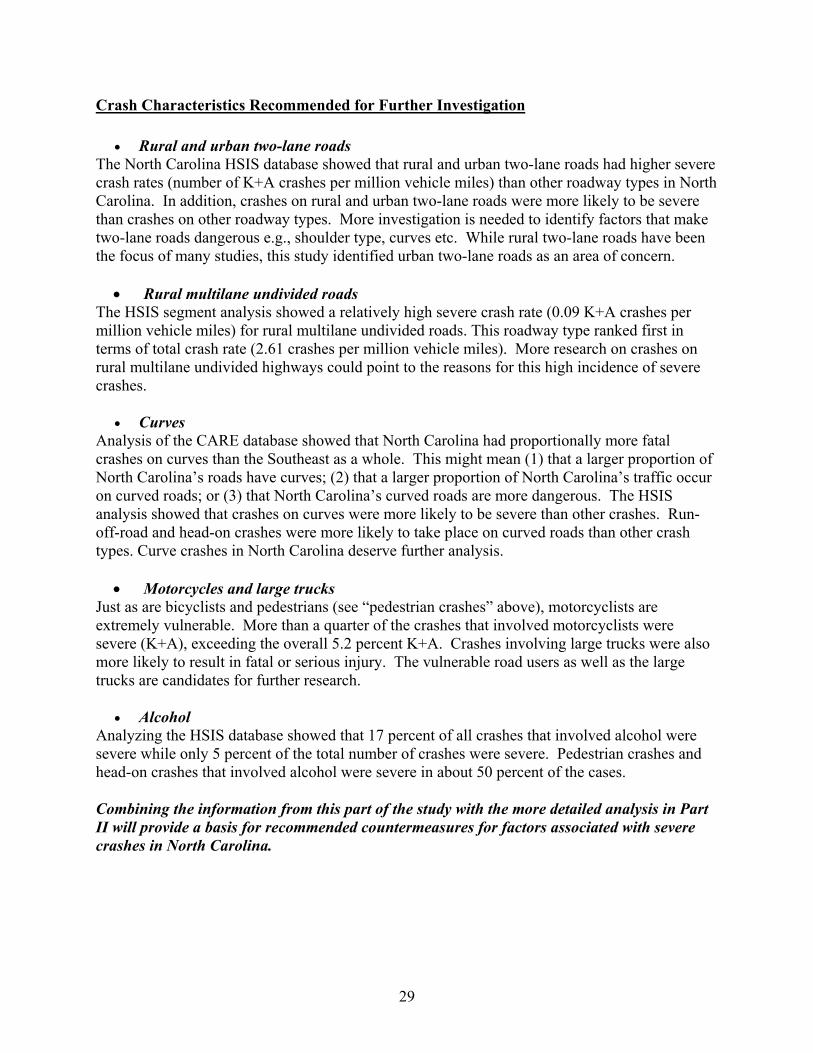
LIST OF FIGURESFigure 1. Structure of severe crash analysis.................................................................................... 5Figure 2. Distribution of all HSIS crashes and severe HSIS crashes by roadway classification.. 11Figure 3. Crash rates by roadway type.......................................................................................... 12Figure 4. Overall crash severity by county (1993-1997) .............................................................. 13Figure 5. Crash severity on urban two-lane roads by county (1993-1997) .................................. 15Figure 6. Trends in crash severity, all crashes (1993-1997) ......................................................... 16Figure 7. Trends in injury severity b crash type (1993-1997) ...................................................... 17Figure 8. Trends by crash type, as a percent of all crashes for given year (1993-1997) .............. 19Figure 9. Crashes involving motorcycles and large trucks that are serious or fatal (1993-1997) 20Figure 10. Distribution of all HSIS and severe HSIS crashes by crash type (1993-1997) ........... 23Figure 11. Percent of crashes that are severe by crash type (1993-1997)..................................... 24Figure 12. Crash severity by crash type (1993-1997)................................................................... 25Figure 13. HSIS crashes on urban and rural two-lane and all other roads by severity................. 33Figure 14. HSIS vs. non-HSIS urban and rural crashes by severity ............................................. 34Figure 15. Severe crashes on urban and rural two-lane HSIS roads by road character................ 37Figure 16. Severe crashes on urban and rural two-lane HSIS roads by road feature ................... 38Figure 17. Sever crashes on urban and rural two-lane HSIS roads by road defect....................... 39Figure 18. Severe crashes on urban and rural two-lane HSIS roads by crash type ...................... 41Figure 19. Severe crashes on urban and rural two-lane HSIS roads by means of involvement ... 42Figure 20. Severe crashes on urban and rural two-lane HSIS roads by bicycle and pedestrian
involvement........................................................................................................................... 44Figure 21. Severe crashes on urban and rural two-lane HSIS roads by vehicle type ................... 45Figure 22. Severe crashes on urban and rural two-lane HSIS roads by alcohol involvement ...... 47Figure 23. Severe crashes on urban and rural two-lane HSIS roads by lighting condition .......... 48Figure 24. Severe crashes on urban and rural two-lane HSIS roads by weekday ........................ 49Figure 25. Severe crashes on urban and rural non-HSIS roads by road feature ........................... 51Figure 26. Severe crashes on urban and rural non-HSIS roads by road defect ............................ 52Figure 27. Severe crashes on urban and rural non-HSIS roads by crash type .............................. 54Figure 28. Severe crashes on urban and rural non-HSIS roads by means of involvement........... 55Figure 29. Severe crashes on urban and rural non-HSIS roads by bicycle and pedestrian
involvement........................................................................................................................... 57Figure 30. Severe crashes on urban and rural non-HSIS roads by vehicle type........................... 58Figure 31. Pedestrian Crash Countermeasure Matrix .................................................................. 69
LIST OF TABLESTable 1. Structure of detailed crash factor analysis ...................................................................... 35Table 2. North Carolina sever crash factors.................................................................................. 59

v
ABSTRACT
This report examines the roadway, crash, vehicle, individual, and environmental factors that areassociated with fatal and serious injury crashes in North Carolina between 1993 and 1997. Theinitial analysis identifies road classifications, geographic characteristics, and time trends relatedto severe crashes using Highway Safety Information Systems (HSIS) segment and crash data.Both HSIS and non-HSIS data are used in the more detailed section of the study to analyze thesevere crash factors on all HSIS highways, two-lane urban HSIS highways, two-lane rural HSIShighways, urban non-HSIS routes, and rural non-HSIS routes. In this section, a test of thestandard error of a binomial proportion is used to find the statistical significance of the roadway,crash, vehicle, individual, and environmental factors related to severe crashes. The initialanalysis shows that urban and rural two-lane roads are associated with the highest crash severity,mountain counties have the highest proportion of severe crashes, and crash severity remainedstable for some of the most severe crash types. Factors associated with significantly high crashseverity on all roadway types include curve, run-off-road, utility pole, tree, head-on, pedestrian,bicycle, darkness, and alcohol use. The final section of the report recommends countermeasuresthat can be used to reduce the incidence of fatal and serious injury crashes associated with thesefactors.

INTRODUCTION
The eight Southeastern States in FHWA's Region IV have been ranked among the highestnationally in terms of fatal crash rates in recent years. These eight states include North Carolina,Alabama, Florida, Georgia, Kentucky, Mississippi, Tennessee, and South Carolina. These eightstates accounted for approximately 25 percent of the nation's total fatalities in 1995 and a fatalityrate about 20 percent above the national mean1.
In 1995, North Carolina ranked 9th of the 50 states in terms of total highway-related deaths, with1,418 people killed. The fatality rate of 1.9 (people killed per 100 million vehicle miles oftravel) ranked North Carolina 20th nationally1. In response to these trends in traffic fatalities,the North Carolina DOT and other state DOT's in Region IV have expressed an interest in furtherstudying fatal crash causes and possible countermeasures.
This report summarizes the findings of a study on the contributing factors and characteristics offatal and serious crashes in North Carolina. This is the final report of a two-phase studycommissioned by the North Carolina DOT as part of the FHWA’s Region IV Fatal Study. Thestudy analyzed data from two sources:
(1) The 1993-1997 Redbook Accident Files database, which contains data on all reported crashesin North Carolina:
a) The Highway Safety Information System (HSIS) database, a subset of the RedbookAccident Files, was used to examine both fatal and serious injury crashes in NorthCarolina and to take a more detailed look at severe injury crash factors on two-laneurban and two-lane rural roadways. This database contains approximately 40 percentof crashes reported in North Carolina.
b) The non-HSIS crashes from the Redbook database were used to supplement andstrengthen findings from the preliminary HSIS analysis and to examine severe crashfactors on urban and rural roadways. This database represents the remaining 60percent of crashes reported in North Carolina.
(2) The 1993-1997 Fatal Analysis Reporting System (FAR) data through the Critical AnalysisReporting Environment (CARE) database, which contains only fatal crashes, was used tocompare North Carolina crash characteristics with the Southeast as a whole (eight statesincluding North Carolina).
The report consists of a review of previous crash factor studies, an overview of the analysisstructure, and three main parts. Part I summarizes the findings of an initial analysis of NorthCarolina crashes using the HSIS database. Part II is a more detailed examination of thesignificant severe crash factors identified in Part I. Specifically, it looks at severe crash factorson two-lane urban and two-lane rural HSIS highways and urban and rural non-HSIS routes. PartIII suggests possible countermeasures to reduce the occurrence of the most significant severecrash factors in North Carolina. Appendix A compares fatal crashes in North Carolina withthose in the Southeast as a whole using CARE data.

2
REVIEW OF LITERATURE
A. PREVIOUS CRASH FACTOR STUDIES
This report describes an in-depth analysis of the roadway, crash, vehicle, individual andenvironmental factors that contribute to severe injury crashes in North Carolina. Though limitedprevious research is available which has examined severe crash factors at this level of detail for asingle state, the topic of factors contributing to crashes has been addressed. Earlier studies byTessmer, Zegeer, et al., Leaf et al., and Stamatiadis, et al. have compared fatal crashcharacteristics on urban and rural roadways throughout the country, general crash factors byroadway class in eight states, crash types on a major urban beltway, and crash characteristics onlow-volume rural roads in Kentucky and North Carolina2,3,4,5.
Tessmer used Fatal Analysis Reporting System (FARS) data collected between 1975 and 1993 tocompare factors that contributed to fatal crashes in rural and urban areas of the United States.The research showed that 40 percent more deaths occurred on rural roadways than on urbanroadways, even though the total vehicle miles traveled (VMT) during the study period wasalmost thirty percent lower on rural roads. Specific factors that were associated with highernumbers of fatalities on rural roads than on urban roads included high speed limits, head-oncollisions, alcohol involvement, light and large truck involvement, and lower emergencyresponse times. Factors that contributed to fatalities in urban areas included high speed limitsand car, motorcycle, and pedestrian involvement2.
Crash information from the early 1990s was drawn from the eight-state (California, Illinois,Maine, Michigan, Minnesota, North Carolina, Utah, and Washington) HSIS database by Zegeer,et al. to compare crash rates and characteristics by roadway class. Unlike the analysis ofnationwide FARS data, this study looked at all crashes, regardless of injury severity. It foundthat total number of crashes per million vehicle miles were higher on urban streets than on ruralroads. In addition, undivided non-freeways and rural two-lane roads had higher crash rates thanfreeways and divided non-freeways.
This study also identified factors that contributed to crashes by roadway classification:• Urban freeways: icy weather, rear-end/same direction sideswipe, and fixed object crashes;• Urban two-lane roads: head-on/opposite direction sideswipe, backing and parking, angle,
wet weather, and pedestrian and bicyclist crashes;• Multi-lane divided and undivided roadways: wet weather, rear-end/same direction
sideswipe, angle, and pedestrian crashes;• Rural freeways: fixed object, animal, rollover, nighttime, and icy pavement;• Rural two-lane roads: fixed-object, rollover, head-on/opposite direction sideswipe, animal,
nighttime, icy pavement;• Rural multi-lane roads: animal, angle, fixed-object, rollover, injury, icy pavement, and wet
weather3.
Leaf, et al. reported that three crash types, stopping/slowing, run-off-road, and sideswipe/cutoff,accounted for 78 percent of all crashes between 1993 and 1996 on the Capital Beltway aroundWashington D.C. The rate of injury and fatal crashes decreased over this period. The results

3
may be representative of the most common types of crashes on major roadways with highcongestion levels4.
North Carolina and Kentucky were used by Stamatiadis, et al. to study factors contributing tocrashes on low-volume rural roads. Crash data collected between 1993 and 1995 showed thatdrivers under the age of 25 are more likely to be involved in single-vehicle crashes than anyother group of drivers. Young drivers were often involved in single-vehicle crashes occurring atnight, under higher-speeds, narrower lanes, sharper curves, and lower-volume roads. Thougholder drivers were less safe than younger drivers on roads with sharp curves, drivers as a wholehad lower crash rates on roads with no shoulders and roads with sharp curves. Anothersignificant finding was that large vehicles were more likely to hit other vehicles on narrow low-volume roads, but small vehicles were more likely to be involved in single-vehicle crashes5.
These studies suggest factors that contribute to severe injury crashes include rural areas,undivided and two-lane roads, higher-speed roads, head-on collisions, large vehicles, youngdrivers, pedestrian and bicycle involvement, and alcohol involvement. This report will examinethese and other characteristics to find which are significant in North Carolina.
B. CONTRIBUTION OF THIS STUDY TO THE LITERATURE
In addition to identifying factors that are associated with crashes within North Carolina, thisstudy makes several contributions to the body of crash factor analysis literature. First, unlikeother crash factor studies, it specifically analyzes the data with respect to high crash severity.Instead of identifying factors related to crashes in general, the study highlights the unique factorsassociated with serious injury and fatal crashes on specific classes and types of roadway. Next, itcarries the process of safety improvement past the analysis stage by offering countermeasuresthat can be used to reduce the types of crashes that are identified through the analysis. Forexample, instead of simply stating that crashes on curved roadways are a problem because theyare often severe, this study suggests that treatments such as flattening curves, widening lanes orshoulders, removing roadside hazards, and flattening sideslope can be made to achieve safetyimprovements. Finally, the FARS, HSIS, and Redbook Accident Databases were used in theanalysis, and a number of different safety treatments are suggested as countermeasures. Thus,this study represents a strategy involving a wide range of crash problems and roadway factorsthat can lead to a reduction in severe crashes.

4
ANALYSIS OVERVIEW
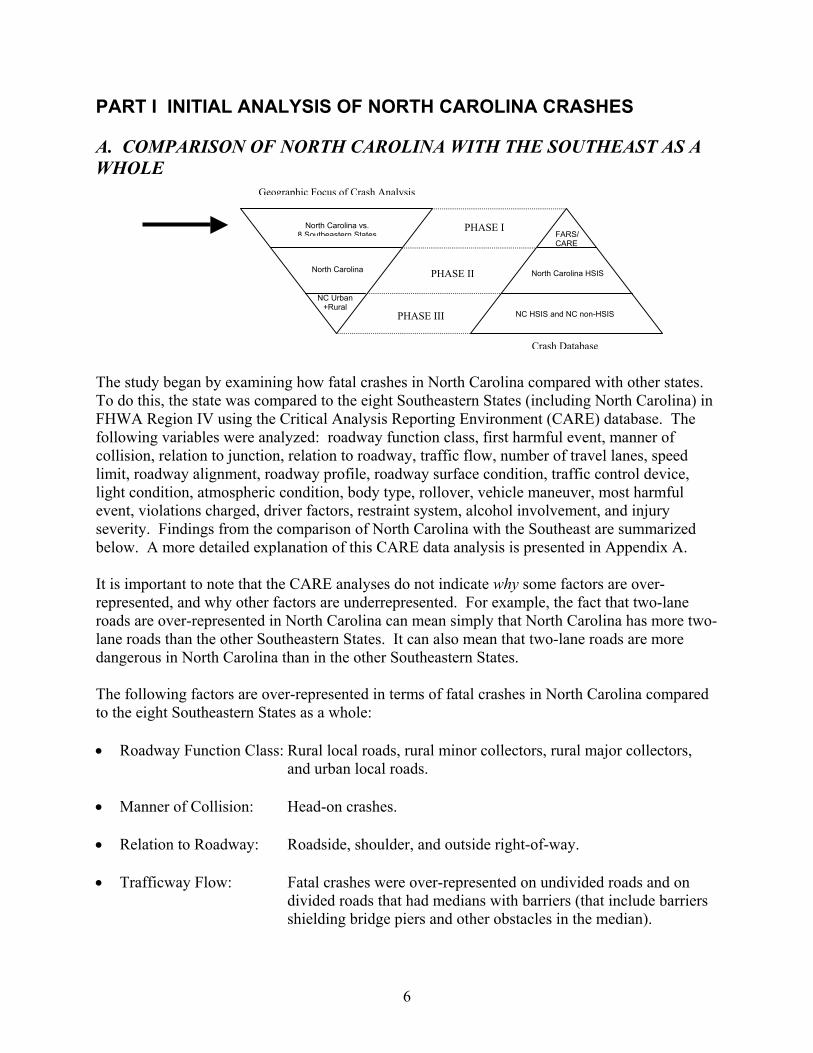
The analysis of this study was structured in three phases (Figure 1). The first phase examinedsevere crashes over a broad geographic area (eight Southeastern States) using a database withrelatively few records (FARS/CARE, 47,047 records). As the analysis proceeded, it evaluated asmaller geographic area (North Carolina) with a larger database (North Carolina HSIS, 478,500records). The final phase of the analysis examined specific parts of the smaller geographic area(urban and rural routes in North Carolina) and used two databases that contained the greatestnumber of records (North Carolina HSIS and non-HSIS, 1,129,500 total records). The generalobjective, structure, method, and findings of the study are outlined by the set of boxes below.
Structure: Examination of eight Southeastern States using FARS/CARE database, NorthCarolina using HSIS database, and of North Carolina urban and rural roadways using HSISand non-HSIS databases to find roadway, crash, vehicle, individual, and environmentalfactors that influence crash rates and severity.
Method: Crash and segment files of HSIS database are queried to identify roadclassifications, geographic characteristics, and time trends related to severe crashes in Part I;databases containing crashes on all HSIS, two-lane urban HSIS, two-lane rural HSIS, urbannon-HSIS, and rural non-HSIS roadways are queried and tested using the standard error of abinomial proportion to identify significant severe crash factors in Part II.
Objective: Identify factors associated with fatal and serious injury crashes in NorthCarolina and recommend appropriate countermeasures to reduce their frequency.
Findings: Factors associated with a high incidence of fatal and serious injury crashes inNorth Carolina include:
• Urban and rural two-lane roadways• Curves• Run-off-road (utility pole and tree)• Head-on• Pedestrian• Bicycle• Motorcycle• Alcohol• Mountains• Darkness

Figure 1. Structure of severe crash analysis
Geographic Focus of Crash Analysis
PHASE I
PHASE II
PHASE III
Crash Database and Size*
*All crash data used in this study were collected between 1993 and 1997
5
NC Urban+Rural
North Carolina vs. 8 Southeastern States
North Carolina
NC HSIS and NC non-HSIS1,129,500 Crashes
North Carolina HSIS478,500 Crashes
FARS/CARE47,047 Crashes
6
PART I INITIAL ANALYSIS OF NORTH CAROLINA CRASHES
A. COMPARISON OF NORTH CAROLINA WITH THE SOUTHEAST AS AWHOLE
The study began by examining how fatal crashes in North Carolina compared with other states.To do this, the state was compared to the eight Southeastern States (including North Carolina) inFHWA Region IV using the Critical Analysis Reporting Environment (CARE) database. Thefollowing variables were analyzed: roadway function class, first harmful event, manner ofcollision, relation to junction, relation to roadway, traffic flow, number of travel lanes, speedlimit, roadway alignment, roadway profile, roadway surface condition, traffic control device,light condition, atmospheric condition, body type, rollover, vehicle maneuver, most harmfulevent, violations charged, driver factors, restraint system, alcohol involvement, and injuryseverity. Findings from the comparison of North Carolina with the Southeast are summarizedbelow. A more detailed explanation of this CARE data analysis is presented in Appendix A.
It is important to note that the CARE analyses do not indicate why some factors are over-represented, and why other factors are underrepresented. For example, the fact that two-laneroads are over-represented in North Carolina can mean simply that North Carolina has more two-lane roads than the other Southeastern States. It can also mean that two-lane roads are moredangerous in North Carolina than in the other Southeastern States.
The following factors are over-represented in terms of fatal crashes in North Carolina comparedto the eight Southeastern States as a whole:
• Roadway Function Class: Rural local roads, rural minor collectors, rural major collectors,and urban local roads.
• Manner of Collision: Head-on crashes.
• Relation to Roadway: Roadside, shoulder, and outside right-of-way.
• Trafficway Flow: Fatal crashes were over-represented on undivided roads and ondivided roads that had medians with barriers (that include barriersshielding bridge piers and other obstacles in the median).
North Carolina vs.8 Southeastern States
North Carolina
NC Urban+Rural
PHASE I
PHASE II
PHASE III
FARS/CARE
North Carolina HSIS
NC HSIS and NC non-HSIS
Geographic Focus of Crash Analysis
Crash Database
7
• Number of Travel Lanes: Two-lane roads.
• Roadway Alignment: Curves.
• Roadway Profile: Sag, level, and hillcrest.
• Most Harmful Event: Tree, vehicle in transport – other, and immersion were among themost harmful events.
• Violations Charged: Alcohol/drugs and speeding.
Findings from this examination were used to check consistency with the analysis of factorsassociated with severe injury crashes within North Carolina in Phase II and Phase III.
B. NORTH CAROLINA CRASH FACTORS
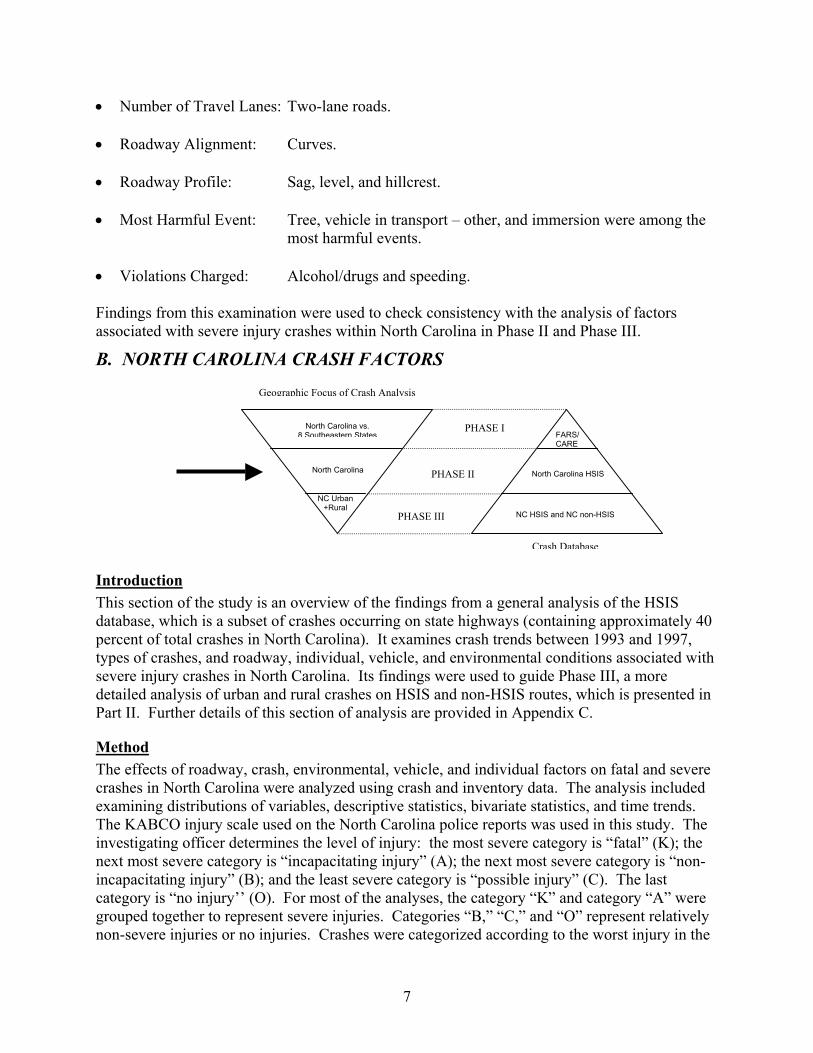
IntroductionThis section of the study is an overview of the findings from a general analysis of the HSISdatabase, which is a subset of crashes occurring on state highways (containing approximately 40percent of total crashes in North Carolina). It examines crash trends between 1993 and 1997,types of crashes, and roadway, individual, vehicle, and environmental conditions associated withsevere injury crashes in North Carolina. Its findings were used to guide Phase III, a moredetailed analysis of urban and rural crashes on HSIS and non-HSIS routes, which is presented inPart II. Further details of this section of analysis are provided in Appendix C.
MethodThe effects of roadway, crash, environmental, vehicle, and individual factors on fatal and severecrashes in North Carolina were analyzed using crash and inventory data. The analysis includedexamining distributions of variables, descriptive statistics, bivariate statistics, and time trends.The KABCO injury scale used on the North Carolina police reports was used in this study. Theinvestigating officer determines the level of injury: the most severe category is “fatal” (K); thenext most severe category is “incapacitating injury” (A); the next most severe category is “non-incapacitating injury” (B); and the least severe category is “possible injury” (C). The lastcategory is “no injury’’ (O). For most of the analyses, the category “K” and category “A” weregrouped together to represent severe injuries. Categories “B,” “C,” and “O” represent relativelynon-severe injuries or no injuries. Crashes were categorized according to the worst injury in the
North Carolina vs.8 Southeastern States
North Carolina
NC Urban+Rural
PHASE I
PHASE II
PHASE III
FARS/CARE
North Carolina HSIS
NC HSIS and NC non-HSIS
Geographic Focus of Crash Analysis
Crash Database

8
crash. Crash data were analyzed at the roadway segment level and the crash level. Themeasures of injury severity used in the analysis included:
• Segment level:The following two measures were used:1. Worst fatal and serious injury (K+A) crash rates. (K+A injury crashes per million vehicle
miles).2. Relative severity of crashes (K+A injury crashes divided by total crashes).
• Crash level:The following two measures were used:1. Worst injury in a crash.2. Total numbers of injuries.
General hypotheses regarding expected distributions and relationships are presented in AppendixC and an examination of the data for statistical evidence is presented later in the report. Morespecific hypotheses regarding relationships between specific variables are presented along withthe data analysis.
Data DescriptionThe North Carolina 1993-1997 Highway Safety Information System (HSIS) crash data and 1994HSIS inventory data were used for this part of the analysis. HSIS data, which include all injuryand all non-injury crashes causing more than $1000 property damage for crashes reported in1996-1997 and $500 property damage in 1993-1995, come from approximately 34,800 miles ofthe 92,000 total miles of roadway in the state. These 34,800 miles have been entered into acomputer mileposting system, so crashes can be linked to them. Because there are no county-maintained roadways in North Carolina, most of the state’s rural roadways are included in thisstudy.
The data were analyzed using two files: a roadway segment file and a crash file. They contained38,170 road segments and 478,450 crashes, respectively. The variables in the database are asfollows:
• Segment FileInjury variablesTotal number of K crashes (crash in which at least one person was killed).Total number of A crashes (crash in which nobody was killed but at least one personsustained incapacitating, “A”, injury).Total number of B crashes (crash in which worst injury is non-incapacitating, “B”,injury).Total number of C crashes (crash in which worst injury was coded as “C,” or "possibleinjury").Total number of O crashes (crashes without injury).Roadway characteristicsSection length, AADT, surface width, left and right shoulder width and type, median typeand width, number of lanes, speed limit, access control, surface type, rural/urbanclassification and roadway classification.

9
Crash characteristicsNumber of vehicles in crash.
• Crash FileInjury variablesMost severe injury in a crash measured on KABCO scale.Number of injuries in a crash.Roadway factorsNumber of lanes, type of traffic control, location type (bridge etc.), speed limit, roadcharacter, road configuration, road defect or under construction, type of road surface,surface condition.Crash factorsNumber of vehicles, pedestrian involved, bicyclist involved, motorcycle involved, fire (inany of the vehicles), impact speed (for up to 3 vehicles), contributing factors (27 flags),alcohol involvement.Vehicle factorsVehicle type (for up to 3 vehicles), number of vehicles in which airbags are presentdivided by total number of vehicles, number of vehicles in which airbags deployeddivided by total number of vehicles, number of occupants in all vehicles.Driver/Individual factorsDriver sex (for up to 3 drivers), driver age (for up to 3 drivers), driver restraint (for up to3 drivers), alcohol involvement.Environmental factorsTime of day, day of week, light or dark, weather, time of year (accident date),development type, city population.
StepsTwo levels of analysis were performed:
The segment-level analysis:
• Computed and compared the rates of fatal and serious crashes by a composite roadway classvariable that included road access (freeway, non-freeway), road type (divided, undivided;number of lanes), area type (urban, rural) and surface type (primitive or not).
• Identified North Carolina counties that had higher crash severity and examined whether thehigh severity counties were spatially clustered.
The crash-level analysis:
• Compared trends in fatal and serious crashes by roadway class and crash type over five years(1993-1997).
• Examined the distribution of fatal and serious crashes and the distribution of fatal and seriousinjuries. The distribution of fatal and serious crashes was examined by the variables listedbelow:
- roadway class (e.g., urban freeway, rural 2-lane highway).
10
- road character (curve, grade, straight).- crash type (e.g., run-off-road and head-on).- light condition.- weather.- alcohol involvement.
• Reported crash severity associated with the following roadway, crash, vehicle, individual,and environmental characteristics:
- roadway class.- road character.- crash type.- motorcycle involved.- large truck involved.- alcohol involvement.- driver age.- light condition.- weather.
Analysis Results
Road Segments
The following are key findings from the crash severity analysis of crashes on North CarolinaHSIS route segments.
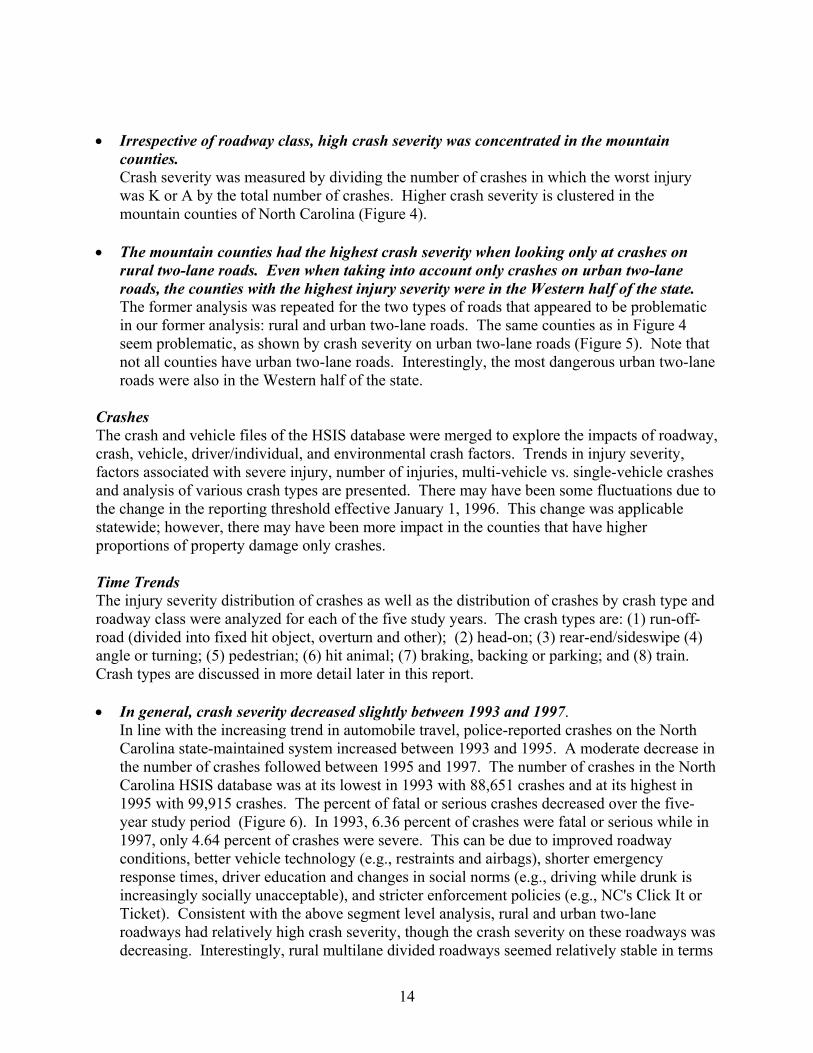
• Rural and urban two-lane roads and rural multilane undivided roads had proportionallymore severe crashes than other roadway classes.Most of the segments in the database were rural two-lane highways (N=27,425) and themajority of crashes as well as the majority of severe crashes occurred on such roads (Figure2). When controlling for exposure (AADT and segment length), the same picture appeared.The severe crash rate (number of K+A crashes per million vehicle miles) was highest forurban two-lane roads (0.13), followed by rural two-lane roads (0.12) and rural multilaneundivided roads (0.09) (Figure 3). The overall crash rates were reasonable and consistentwith North Carolina crash rates reported in earlier studies3.
• Rural and urban two-lane roads were associated with high crash severity.The proportion of severe crashes ([K+A]/[K+A+B+C+O]) was also high for rural and urbantwo-lane roadways. 5.9 percent of all crashes on rural two-lane roads and 6.2 percent ofcrashes on urban two-lane roads were K+A. While rural two-lane roadways have been thefocus of studies and are known to be problematic3,6,7, this preliminary analysis has identifiedurban two-lane roads as a good candidate for further exploration of severe crashes in NorthCarolina.

Figure 2. Distribution of all HSIS crashes and severe HSIS crashesby roadway classification
Distribution of HSIS K+A crashes(Total # of crashes = 24,714)
Rural 2-lane highway64.1%
Rural multilane undivided (non-freeway)
9.4%
Other4.8%
Rural freeway3.8%
Urban 2-lane highway8.7%
Urban multilane undivided (non-freeway)
0.1%
Urban freeway0.7%
Rural multilane divided (non-freeway)
7.8%
Urban multilane divided (non-freeway)
0.5%
Distribution of all HSIS crashes(total # of crashes = 478,160)
Rural 2-lane highway56.4%
Rural multilane undivided (non-freeway)
14.1%
Rural multilane divided (non-freeway)
10.5%
Rural freeway4.4%
Urban 2-lane highway7.2%
Urban multilane undivided (non-freeway)
0.2%
Urban multilane divided (non-freeway)
0.5%
Urban freeway0.7% Other
6.0%
11

Figure 3. Crash rates by roadway type
2.09
2.61
1.55
0.61
2.09
1.01 0.99
0.45
0.8
1.7
0.090.040.020.050.050.13
0.030.060.090.12
0
0.5
1
1.5
2
2.5
3
Rural 2-lanehighway
Ruralmultilaneundivided
(non-freeway)
Ruralmultilane
divided (non-freeway)
Ruralfreeway
Urban 2-lanehighway
Urbanmultilaneundivided
(non-freeway)
Urbanmultilane
divided (non-freeway)
Urbanfreeway
Other All roadways
Roadway Type
Cra
shes
per
Mill
ion
Vehi
cle
Mile
s
Total crash rate Severe crash rate (K+A crashes)

Percent Crashes that are K+A
below 5 .0 %
5.0% - 5.6%
5.7%- 6.4%6.5 %- 7.5%
7.6% and over
i i
Map produced byHighway Safety Research CenterUniversity of North Carolina at Chapel HillAugust 1999SOURCE: Highway Safety Information System
Pitt
Wake
Bladen
Duplin
Hyde
Bertie
Wilkes
Pender
Moore
Halifax
Union
Nash
Surry
RobesonOnslow
Iredell
Sampson
Columbus
Swain
Burke
Johnston
Ashe
Guilford
Anson
Randolph
Harnett
Brunswick
Wayne
Jones
Chatham
Macon
Rowan
Martin
Hoke
Stokes
LeeStanly
Lenoir Craven
Granville
Franklin
Warren
Tyrrell
Buncombe
Davidson
Haywood
Person Gates
Jackson
Dare
Caswell
Forsyth
Caldwell
Carteret
Beaufort
Cumberland
Orange
Madison
Rutherford
Wilson
Polk
Yadkin
Gaston
Rockingham
Cherokee
Catawba
Davie
Hertford
McDowell
Richmond
Northampton
Cleveland
Vance
Clay
Avery
Alamance
Mecklenburg
Edgecombe
Lincoln
Yancey
Montgomery
Pamlico
Cabarrus
Durham
Graham
Greene
Scotland
Watauga
Henderson
Washington
Mitchell
Transylvania
Camden
Alexander
CurrituckAlleghany
ChowanPerquimans
Pasquotank
New Hanover
Figure 4. Overall crash severity by county (1993-1997)
Percent of Crashes that are K+ALow
High
14
• Irrespective of roadway class, high crash severity was concentrated in the mountaincounties.Crash severity was measured by dividing the number of crashes in which the worst injurywas K or A by the total number of crashes. Higher crash severity is clustered in themountain counties of North Carolina (Figure 4).
• The mountain counties had the highest crash severity when looking only at crashes onrural two-lane roads. Even when taking into account only crashes on urban two-laneroads, the counties with the highest injury severity were in the Western half of the state.The former analysis was repeated for the two types of roads that appeared to be problematicin our former analysis: rural and urban two-lane roads. The same counties as in Figure 4seem problematic, as shown by crash severity on urban two-lane roads (Figure 5). Note thatnot all counties have urban two-lane roads. Interestingly, the most dangerous urban two-laneroads were also in the Western half of the state.
CrashesThe crash and vehicle files of the HSIS database were merged to explore the impacts of roadway,crash, vehicle, driver/individual, and environmental crash factors. Trends in injury severity,factors associated with severe injury, number of injuries, multi-vehicle vs. single-vehicle crashesand analysis of various crash types are presented. There may have been some fluctuations due tothe change in the reporting threshold effective January 1, 1996. This change was applicablestatewide; however, there may have been more impact in the counties that have higherproportions of property damage only crashes.
Time TrendsThe injury severity distribution of crashes as well as the distribution of crashes by crash type androadway class were analyzed for each of the five study years. The crash types are: (1) run-off-road (divided into fixed hit object, overturn and other); (2) head-on; (3) rear-end/sideswipe (4)angle or turning; (5) pedestrian; (6) hit animal; (7) braking, backing or parking; and (8) train.Crash types are discussed in more detail later in this report.
• In general, crash severity decreased slightly between 1993 and 1997.In line with the increasing trend in automobile travel, police-reported crashes on the NorthCarolina state-maintained system increased between 1993 and 1995. A moderate decrease inthe number of crashes followed between 1995 and 1997. The number of crashes in the NorthCarolina HSIS database was at its lowest in 1993 with 88,651 crashes and at its highest in1995 with 99,915 crashes. The percent of fatal or serious crashes decreased over the five-year study period (Figure 6). In 1993, 6.36 percent of crashes were fatal or serious while in1997, only 4.64 percent of crashes were severe. This can be due to improved roadwayconditions, better vehicle technology (e.g., restraints and airbags), shorter emergencyresponse times, driver education and changes in social norms (e.g., driving while drunk isincreasingly socially unacceptable), and stricter enforcement policies (e.g., NC's Click It orTicket). Consistent with the above segment level analysis, rural and urban two-laneroadways had relatively high crash severity, though the crash severity on these roadways wasdecreasing. Interestingly, rural multilane divided roadways seemed relatively stable in terms

Pitt
Wake
Bladen
Duplin
Hyde
Bertie
Wilkes
Pender
Moore
Halifax
Union
Nash
Surry
Robeson
Onslow
Iredell
Sampson
Columbus
Swain
Burke
Johnston
Ashe
Guilford
Anson
Randolph
Harnett
Brunswick
Wayne
Jones
Chatham
Macon
Rowan
Martin
Hoke
Stokes
LeeStanly
Lenoir Craven
Granville
Franklin
Warren
Tyrrell
Buncombe
Davidson
Haywood
PersonGates
Jackson
Dare
Caswell
Forsyth
Caldwell
Carteret
Beaufort
Cumberland
Orange
Madison
Rutherford
Wilson
Polk
Yadkin
Gaston
Rockingham
Cherokee
Catawba
Davie
Hertford
McDowell
Richmond
Northampton
Cleveland
Vance
Clay
Avery
Alamance
Mecklenbur g
Edgecombe
Lincoln
Yancey
Montgomery
Pamlico
Cabarrus
Durham
Graham
Greene
Scotland
Watauga
Henderson
Washington
Mitchell
Transylvania
Camden
Alexander
CurrituckAlleghany
ChowanPerquimans
Pasquotank
New Hanover
ion Urban Two Lane Roadsin North Carolina Counties
NO URBAN 2 LANEROADS3.0% - 4.8%5.6% - 6.5%6.8% - 7.6%8.0% - 15.1%
SOURCE: Highway Safety Information System
Map produced byHighway Safety Research CenterUniversity of North Carolina at Chapel HillAugust 1999
Figure 5. Crash severity on urban two-lane roads by county (1993-1997)
High
Percent of Crashes that are K+Aof all crashes on Urban Two-Lane Roads
Low

54.84% 54.97%56.16%
54.60% 54.15%
27.14% 27.90% 27.95%28.97% 29.17%
11.66% 11.54% 11.30% 11.61% 12.03%
5.46% 4.77%3.77% 3.99% 3.83%
0.90% 0.82% 0.82% 0.83% 0.81%
0%
10%
20%
30%
40%
50%
60%
1993 1994 1995 1996 1997
Year
Percent
OCBAK

Figure 7. Trends in injury severity by crash type (1993-1997)
10.8
%
10.6
%
9.6%
33.4
%
2.8%
6.2%
37.4
%
0.5% 1.
7%
18.8
%
9.6%
13.8
%
8.3%
39.3
%
2.1%
5.5%
34.8
%
0.6% 1.
7%
15.2
%
7.8% 9.
3%
7.2%
35.0
%
1.5%
4.8%
32.8
%
0.3% 1.
6%
32.6
%
8.0%
9.8%
7.0%
31.1
%
1.8%
5.1%
31.7
%
0.4% 1.
0%
0.0%
8.2%
11.2
%
7.2%
31.9
%
1.7%
4.9%
32.6
%
0.3% 1.
0%
16.7
%
0%
5%
10%
15%
20%
25%
30%
35%
40%
45%
Ran offroad, fixed
object
Ran offroad,
overturn
Ran offroad, other
Head on Rear endor
sideswipe,same
direction
Angle orturning
Pedestrian Animal Braking,backing, or
parking
Train
Crash Type
Perc
ent o
f All
Cra
shes
that
wer
e K
+A
1993 (N = 88,651) 1994 (N = 94,017) 1995 (N = 99,915) 1996 (N = 98,263) 1997 (N = 97,604)

18
of fatal or serious injury crashes and no particular trend was discernable on urban multilanedivided roadways.
• Although crash severity for most crash types decreased between 1993 and 1997, crashseverity remained stable for some of the most severe crash types.Head-on crashes, pedestrian crashes, and run-off-road crashes had consistently highpercentages of fatal or serious crashes (Figure 7). For most collision types, the percent offatal or severe crashes decreased over 1993-1997. However, the trend in head-on and run-off-road, overturn collisions was relatively stable over 1993-1997. Both types had a peak ofhigh injury severity in 1994 but had more or less the same injury severity in 1997 as they hadin 1993. The percentages for train crashes were less informative due to the very smallnumber of such crashes in the database, ranging from 36 crashes in 1997 to 48 crashes in1993.
• The proportion of high severity crash types remained stable or decreased.There were proportionally more rear-end/side swipe crashes and animal crashes in 1997 thanin 1993 (Figure 8). Angle or turning crashes, braking, backing and parking crashes, andpedestrian crashes represented a smaller share of the crashes in 1997 than they did in 1993.Other crash types remained more or less stable over time. Thus, while crash types that weregenerally not severe, such as rear-end/side swipe and animal crashes are increasing, highseverity crashes such as run-off-road and pedestrian crashes were remaining stable or aredecreasing. A partial explanation for this trend is that high severity crash types were beingtransferred to low-severity crash types due to roadway improvements or vehicle technology.
Factors associated with severe injury crashesFatal (K) and serious (A) crashes made up 24,735 of the 478,450 crashes in the database. Thus,overall 5.2 percent of the crashes were severe (K+A). Crashes with the following characteristicshad severity that was noticeably higher than the overall, 5.2 percent severity; they were thusmore likely to be severe than the average crash:
• 5.9 percent of crashes that took place on rural two-lane roads and 6.2 percent of the crashesthat took place on urban two-lane roads were fatal or serious.
• Crashes on curved roadway sections were more likely to be severe than crashes on straightroads. Further, 11.3 percent of crashes on curved-level road sections were K+A, and 9.0percent of crashes on curved-graded road sections, 7.9 percent of crashes on curved, bottomroads and 7.3 percent of crashes on curved-hill crest road sections were K+A.
• Crashes that involved a motorcycle were more likely to be severe than other crashes.Results showed that 29.1 percent of crashes that involve a motorcycle were K+A (Figure 9).The increased injury severity for crashes involving pedestrians and bicyclists is discussedunder crash type.
• Over 1.4 percent of all crashes that involved a large truck were fatal (Figure 9), while only0.8% of all crashes were fatal.
• 17.4 percent of the crashes involving alcohol and drugs were severe.

Figure 8. Trends by crash type, as a percent of all crashes for given year (1993-1997)
11.1
5%
0.44
%
13.7
6%
0.93
%
30.7
5%
30.7
9%
1.45
%
6.75
%
1.49
%
0.05
%
10.9
2%
0.50
%
13.4
6%
0.85
%
31.7
8%
30.8
9%
1.35
%
6.38
%
1.42
%
0.05
%
10.9
3%
0.39
%
12.8
6%
0.81
%
32.6
4%
30.2
7%
1.27
%
6.92
%
1.40
%
0.04
%
11.5
8%
0.42
%
13.3
8%
1.03
%
31.2
3%
29.2
1%
1.22
%
7.87
%
1.11
%
0.04
%
10.8
1%
0.42
%
12.5
8%
0.94
%
33.0
1%
29.0
5%
1.19
%
8.10
%
1.16
%
0.04
%
0%
5%
10%
15%
20%
25%
30%
35%
Ran offroad, fixed
object
Ran offroad,
overturn
Ran offroad, other
Head on Rear endor
sideswipe,same
direction
Angle orturning
Pedestrian Animal Braking,backing, or
parking
Train
Crash Type
Perc
ent o
f All
Cra
shes
for G
iven
Yea
r
1993 (N = 88,651) 1994 (N = 94,017) 1995 (N = 99,915) 1996 (N = 98,263) 1997 (N = 97,604)

Figure 9. Crashes involving motorcycles and large trucks that are serious or fatal
3.52%
1.44%0.83%
25.56%
4.35% 4.34%
0%
5%
10%
15%
20%
25%
30%
Motorcycle Large Truck All Crashes
Perc
ent (
K+A
)
K A

21
• Crashes involving one or more young driver (less than 21) or one or more old driver (65 orolder) were about as likely to be severe as other crashes. 5.3 percent of crashes involvingyoung drivers and 5.0 percent involving elderly drivers were severe. However, the percent offatalities was higher for drivers 65 and older (1.1 percent) than for younger drivers (0.8percent).
• 7.0 percent of crashes that took place during darkness on roads without street lightingwere fatal or serious. In contrast, crashes during darkness on roads with street lighting werenot especially severe (5.1 percent were K+A). This may imply that street lighting canenhance visibility and provide information to reduce the effect of darkness on injury severity.However, it might simply indicate that lighting was more often present on lower-speed urbanstreets compared to higher-speed rural roads with less lighting. Also, it was possible thatemergency response to crashes that occur in unlit and dark areas (at night) were slower thanin other conditions, exacerbating unattended injuries.
• 6.1 percent of crashes that took place during fog were fatal or serious. However, only a verysmall percentage of crashes (1.3 percent) took place during fog. Crashes during sleet or hail(3.3 percent), snow (3.4 percent), or rain (4.1 percent) were all less likely to be severe thanother crashes, perhaps due to lower-speed collisions during inclement weather conditions.
Number of injuries by roadway class
When measuring injury severity by the number of injuries, the same picture appears as whentaking into account only the worst injury in each crash. The 478,450 crashes that took place inNorth Carolina between 1993 and 1997 caused 354,394 injuries. Nearly ten percent of theseinjuries were fatal or serious (K+A). Over 64 percent of all K+A injuries took place on ruraltwo-lane roads, 9.0 percent on rural multilane undivided roads, and 8.7 percent on urban two-lane roads. This distribution of injuries is very similar to the distribution of crashes by roadwayclass.
Multi-vehicle vs. Single-vehicle crashes
Of the 478,450 crashes in the database, 148,053 (30.9 percent) were single-vehicle crashes whilethe remaining 330,397 crashes (69.1 percent) involved more than one vehicle. This sectionexamines the association between single-vehicle crashes, other factors, and injury severity .
• Curved road segments were especially dangerous for single-vehicle crashes.A larger proportion of single-vehicle crashes occurred on curved road segments (34.3percent) compared with other crashes (only 10.0 percent of the multi-vehicle crashesoccurred on curved roads). In addition, single-vehicle crashes on curved road segments hadhigher severity (%K+A) than other crashes on curved roads.
• Single-vehicle crashes, on average, were more severe than multi-vehicle crashes.The analysis showed that 6.3 percent of the single-vehicle crashes were K+A while only 4.7percent of the multi-vehicle crashes were K+A.

22
• Proportionally more of the single-vehicle crashes occurred on rural two-lane roads thanother crashes.Almost 70 percent of the single-vehicle crashes occurred on rural two-lane roads, while onlyhalf of the multi-vehicle crashes took place on such roads.
• Surprisingly, nighttime single-vehicle crashes on unlit roads were less severe than daytimesingle-vehicle crashes.Only 5.9 percent of the single-vehicle crashes that occurred during darkness on unlit roadswere K+A while 6.8 percent of the daylight single-vehicle crashes were severe. Oneexplanation for this is that more than one-third of the single-vehicle crashes that took place atnight on unlit roads were caused by an animal getting on the road. This type of crashgenerally causes minor or no injuries.
Crash type versus injury severity and roadway/other crash characteristics
The distribution of total crashes and the distribution of K+A crashes for each crash type is shownby Figure 10. Distributions are shown across severity, roadway class, roadway character, numberof lanes, alcohol involvement, light condition, and weather condition. The percent of K+Acrashes for each crash type across the same roadway, crash, and environment characteristics isshown in Figure 11. The crash types are: (1) run-off-road (divided into hit fixed object, overturnand other); (2) head-on; (3) rear-end/sideswipe; (4) angle or turning; (5) pedestrian; (6) hitanimal; (7) braking, backing or parking; and (8) train. The "pedestrian" crash type includesbicycle crashes.
Some of the key findings of this analysis revealed that:
• More than two-thirds of the severe crashes (K+A) were either run-off-road or angle orturning crashes. Almost three-fourths of the fatal crashes (K) were either head-on or run-off-road crashes.The largest number of severe crashes are run-off-road crashes (9,828 or 39.7 percent) andangle or turning crashes (7,579 or 31.2 percent) (Figure 10). Head-on crashes accounted foronly 6.1 percent of the K+A crashes but accounted for 32.0 percent of the fatal crashes whilerun-off-road crashes and angle and turning crashes accounted for 42.1 percent and 24.3percent of the fatal crashes, respectively.
• Head-on, pedestrian, train, and run-off-road crashes were very likely to be severe.Some crash types have higher percentages of K and A injury than others. Especially severewere head-on crashes (33.9 percent are K+A), pedestrian crashes (33.9 percent), train crashes(17.2 percent), run-off-road, overturn crashes (11.0 percent), run-off-road, hit fixed objectcrashes (8.8 percent), and run-off-road, other crashes (7.8 percent) (Figure 12).
• The vast majority of serious ran-off- road, other, head-on, animal and backing, braking,and parking crashes occurred on two-lane roads.The majority of crashes (total and serious) occur on two-lane roads. Some crash types, suchas "other" run-off-road crashes, head-on crashes, animal crashes, train crashes, occurredalmost solely (80 percent or more) on two-lane roads. In addition, more than 80 percent ofthe serious backing, braking and parking crashes, a low-severity crash type, occurred on two-lane roads.
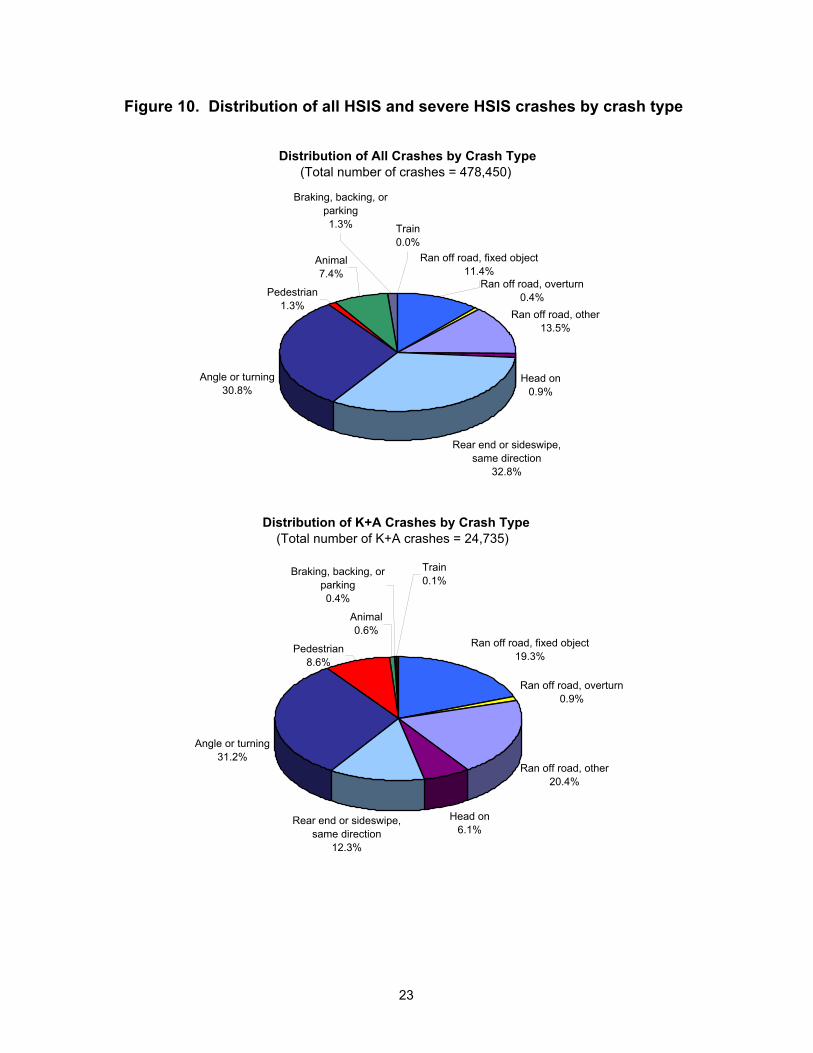
Figure 10. Distribution of all HSIS and severe HSIS crashes by crash type
Distribution of All Crashes by Crash Type(Total number of crashes = 478,450)
Ran off road, overturn0.4%
Ran off road, other13.5%
Head on0.9%
Rear end or sideswipe, same direction
32.8%
Angle or turning30.8%
Pedestrian1.3%
Animal7.4%
Braking, backing, or parking1.3% Train
0.0%Ran off road, fixed object
11.4%
Distribution of K+A Crashes by Crash Type(Total number of K+A crashes = 24,735)
Ran off road, fixed object19.3%
Ran off road, overturn0.9%
Ran off road, other20.4%
Head on6.1%
Rear end or sideswipe, same direction
12.3%
Angle or turning31.2%
Pedestrian8.6%
Animal0.6%
Braking, backing, or parking0.4%
Train0.1%
23

8.8%
11.1%
7.8%
2.0%
5.3%
0.4%1.4%
17.2%
5.2%
33.9%33.9%
0%
5%
10%
15%
20%
25%
30%
35%
40%
Ran
off
road
, fix
ed o
bjec
t
Ran
off
road
, ove
rtur
n
Ran
off
road
, oth
er
Hea
d on
Rea
r en
d or
sid
esw
ipe,
sam
e di
rect
ion
Ang
le o
r tu
rnin
g
Ped
estr
ian
Ani
mal
Bra
king
, bac
king
, or
park
ing
Tra
in
ALL
CR
AS
HE
S
Crash Type
Perc
ent t
hat a
re K
+A

Figure 12. Crash severity by crash type
53.8%
38.1%
47.0%
19.9%
52.9% 53.3%
3.6%
91.5%
79.3%
44.8%
55.0%
20.5%
23.1%
25.6%
21.6%
38.0%
29.3%
27.5%
5.8%
15.7%
23.8%
28.3%
16.9%
27.8%
19.5%
24.6%
7.1%
12.2%
35.0%
14.3%
11.6%
7.2% 10.5% 6.6%
23.3%
4.6%
24.4%
10.5%
4.3%10.7% 9.5%
6.7%
0.8%
3.4%2.2%0.4%1.8% 1.3%1.3%0.6%1.6%
0.2%0.0%0.7%0.1%
0%
10%
20%
30%
40%
50%
60%
70%
80%
90%
100%
Ran offroad, fixed
object
Ran offroad,
overturn
Ran offroad, other
Head on Rear end orsideswipe,
samedirection
Angle orturning
Pedestrian Animal Braking,backing, or
parking
Train All crashes
Crash Type
Perc
ent
KABCO

26
• Run-off-road and head-on crashes were more concentrated on rural two-lane roads thanother crash types. In addition, head-on crashes occurring on rural or urban two-laneroads were more likely to be severe than head-on crashes occurring on other types ofroads.The majority of crashes (56 percent of total crashes and 64 percent of severe crashes) wereon rural two-lane roads, followed by rural multilane undivided and divided highways andurban two-lane roads. Also, 70 percent or more of "other" run-off-road, head-on, animal andtrain crashes (fatal and serious crashes as well as all crashes) occurred on rural two-laneroads. Rather larger shares of the head-on and run-off-road crashes (fatal and serious crashesas well as all crashes) occurred on urban two-lane roads. Head-on crashes were more likelyto be severe when taking place on rural two-lane roads (36.8 percent were K+A) or on urbantwo-lane roads (35.9 percent were K+A) than when taking place on most other types of roads(in comparison, 33.9 percent of all head-on crashes were K+A).
• Run-off-road and head-on crashes were more likely to occur on curved roads than othercrash types. In addition, run-off-road and head-on crashes were more likely to be severeon curved roads than on straight roads.Most crashes (total as well as fatal and serious only) took place on straight level roads, morethan 40 percent of the run-off-road crashes and almost 40 percent of the head-on crashesoccurred on curved roads. Head-on and run-off-road crashes occurring on curved roads weremore likely to be severe than if occurring on straight roads.
• Pedestrian and head-on crashes involving alcohol lead to fatal or serious injury in half ofthe cases.As expected, alcohol or drugs increased the possibility of fatality or serious injury—17.4percent of the crashes involving alcohol and drugs were severe while only 5.2 percent of thetotal crashes were severe. About half of the pedestrian (49 percent) and head-on (50 percent)crashes that involved alcohol were severe compared with the overall 34 percent K+A for bothcrash types.
• Half of the pedestrian crashes that occurred during darkness on unlit roads were severe.As expected, pedestrian crashes taking place during darkness on unlit roads were particularlysevere—49 percent were K+A compared with the 34 percent K+A for all pedestrian crashes.Interestingly, braking, backing and parking crashes, a crash type with a very low overallseverity (only 1.4 percent are K+A), were fatal or serious in 7.2 percent of the cases whenthey occurred in darkness on unlit roads.
• More than half of head-on crashes that occurred during fog lead to fatal or serious injury.Only a very small percentage of crashes took place during fog—1.3 percent of all crashes,1.5 percent of the severe crashes. Some crash types were more likely to occur during fogthan others—4.3 percent and 2.4 percent of the serious animal crashes and serious head-oncrashes, respectively occurred during fog. Head-on crashes were very likely to be severewhen they occurred during fog (52 percent are K+A).

27
C. CONCLUSIONS OF INITIAL ANALYSIS
Segments
The North Carolina HSIS segment analysis showed that:
• Rural and urban two-lane roads had the highest fatal and serious crash rate. In other words,even when controlling for exposure (AADT and segment length), relatively more K+Acrashes occurred on rural and urban two-lane roads than on other roads.
• Rural and urban two-lane roads had higher crash severity than other roads. In other words, ifa crash took place on a rural or urban two-lane road, it was more likely to be severe than acrash on another type of road.
• The North Carolina counties with higher crash severity were largely in the mountains.
• Counties with higher crash severity on rural two-lane roads were also located in themountains of North Carolina. Higher crash severity on urban two-lane roads was found inthe western half of the state.
Crashes
The North Carolina HSIS crash analysis showed that:
• Crash severity decreased slightly between 1993 and 1997. However, crash severity remainedstable for some of the most severe crash types.
• Crashes on rural or urban two-lane roads, crashes on curved roads, crashes involving alcohol,crashes during darkness on unlit roads, crashes during fog and crashes involving amotorcycle or a large truck were all more likely to be severe than other crashes.
• Single-vehicle crashes, on average, were more severe than multi-vehicle crashes.Proportionally more of the single-vehicle crashes took place on rural two-lane roads thanother crashes. Curved roads were especially dangerous for single-vehicle crashes.
• Head-on, pedestrian, run-off-road, and train crashes were very likely to be severe.
• Run-off-road and head-on crashes were more likely to take place on curved roads than othercrash types. In addition, run-off-road and head-on crashes were more likely to be moreserious on curved roads than on straight roads.
• The following crash characteristics were associated with very high severity (%K+A):pedestrian and head-on crashes involving alcohol lead to fatal or serious injury in half of thecases; half of the pedestrian crashes that took place during darkness on unlit roads were

28
severe; and more than half of head-on crashes that took place during fog lead to fatal orsevere injury.
D. NEED FOR MORE IN-DEPTH ANALYSES
The first section of Part I suggested how fatal crashes in North Carolina differed from crashes inthe Southeastern FHWA region as a whole. Combining this information with a more detailedanalysis of severe crashes led to the following conclusions and suggestions for more in-depthanalyses in Part II.
Crash Types Recommended for Further Investigation
• Head-on crashesAnalysis of the CARE database showed that head-on crashes were over-represented in NorthCarolina between 1993 and 1997. In other words, North Carolina had proportionally more head-on crashes (21 percent of all fatals are head-on crashes in North Carolina) than the Southeast as awhole (15 percent of all fatals are head-on crashes). Based on the subset of North Carolinacrashes contained in the HSIS crash and inventory database (meaning crashes on 34,800 miles ofstate system), head-on crashes were very likely to lead to fatal or serious injury (34 percent ofhead-on crashes were severe). While head-on crashes accounted for only 6 percent of the totalnumber of severe crashes (K+A), this crash type accounted for 32 percent of the fatal (K)crashes. The detailed analysis of North Carolina crashes in the HSIS database also showed thatthe vast majority of head-on crashes occurred on two-lane roads and that head-on crashesoccurring on two-lane roads were more likely to be severe than head-on crashes occurring onmultilane roads. Head-on crashes were also more likely to occur on curved roads than on othercrash types and head-on crashes that occurred on curved roads were more likely to be severe thanother head-on crashes. Head-on crashes were also particularly likely to be severe whenoccurring during fog.
• Run-off-road crashesAnother crash type that was very likely to be severe was run-off-road crashes. Analyzing theHSIS database showed that 11 percent of run-off-road, overturn, 9 percent of run-off-road, hitfixed object, and 8 percent of the other run-off-road crashes were severe. As with head-oncrashes, run-off-road crashes occurred mostly on two-lane roads and were more likely to besevere if they occurred on such roads. Run-off-road crashes were also more likely to be severewhen occurring on curved roadways. In addition, run-off-road crashes accounted for almost 40percent of the severe (K+A) crashes and 42 percent of the fatal (K) crashes in the 1993-1997HSIS database. Run-off-road is a crash type that warrants further investigation.
• Pedestrian crashesA total of 34 percent of the pedestrian crashes in the HSIS database were severe (i.e., K or Ainjury crashes). Crash severity was likely to increase when alcohol was involved (49 percent areK+A) as well as when the crash took place during darkness on unlit roads (49 percent are K+A).Although pedestrian crashes decreased slightly between 1993 and 1997, in absolute and inrelative terms, their severity did not decrease. This particularly dangerous crash type also meritsfurther attention.
29
Crash Characteristics Recommended for Further Investigation
• Rural and urban two-lane roadsThe North Carolina HSIS database showed that rural and urban two-lane roads had higher severecrash rates (number of K+A crashes per million vehicle miles) than other roadway types in NorthCarolina. In addition, crashes on rural and urban two-lane roads were more likely to be severethan crashes on other roadway types. More investigation is needed to identify factors that maketwo-lane roads dangerous e.g., shoulder type, curves etc. While rural two-lane roads have beenthe focus of many studies, this study identified urban two-lane roads as an area of concern.
• Rural multilane undivided roadsThe HSIS segment analysis showed a relatively high severe crash rate (0.09 K+A crashes permillion vehicle miles) for rural multilane undivided roads. This roadway type ranked first interms of total crash rate (2.61 crashes per million vehicle miles). More research on crashes onrural multilane undivided highways could point to the reasons for this high incidence of severecrashes.
• CurvesAnalysis of the CARE database showed that North Carolina had proportionally more fatalcrashes on curves than the Southeast as a whole. This might mean (1) that a larger proportion ofNorth Carolina’s roads have curves; (2) that a larger proportion of North Carolina’s traffic occuron curved roads; or (3) that North Carolina’s curved roads are more dangerous. The HSISanalysis showed that crashes on curves were more likely to be severe than other crashes. Run-off-road and head-on crashes were more likely to take place on curved roads than other crashtypes. Curve crashes in North Carolina deserve further analysis.
• Motorcycles and large trucksJust as are bicyclists and pedestrians (see “pedestrian crashes” above), motorcyclists areextremely vulnerable. More than a quarter of the crashes that involved motorcyclists weresevere (K+A), exceeding the overall 5.2 percent K+A. Crashes involving large trucks were alsomore likely to result in fatal or serious injury. The vulnerable road users as well as the largetrucks are candidates for further research.
• AlcoholAnalyzing the HSIS database showed that 17 percent of all crashes that involved alcohol weresevere while only 5 percent of the total number of crashes were severe. Pedestrian crashes andhead-on crashes that involved alcohol were severe in about 50 percent of the cases.
Combining the information from this part of the study with the more detailed analysis in PartII will provide a basis for recommended countermeasures for factors associated with severecrashes in North Carolina.

30
PART II DETAILED COMPARISON OF HSIS AND NON-HSIS ROUTES
A. OBJECTIVE
Phase II used the Highway Safety Information System (HSIS) database to identify the followingfactors relating to severe crashes in North Carolina:
• Urban and rural two-lane roads• Rural multilane undivided roads• Curves• Head-on• Run-off-road• Bicycle and pedestrian• Motorcycles and large trucks• Single vehicle involvement• Alcohol involvement• Darkness
The HSIS database includes crashes on primary and secondary routes in North Carolina, butcontains less than half of all crashes throughout the state. In addition, the HSIS database hasbeen well-analyzed in past studies of crash factors. Therefore, this section includes non-HSISroutes to supplement the analysis. Non-HSIS routes include non-state-owned rural roads,subdivision streets, and minor urban streets. Analysis of both HSIS and non-HSIS crashes givean additional dimension to the analysis by creating a more complete picture of the factors thatinfluence severe crashes, especially on urban and lower class rural roads.
B. APPROACH
MethodThe HSIS database contains crash data on 478,450 crashes on major routes in North Carolinabetween 1993 and 1997. Because two-lane urban and two-lane rural roadways were identified asfactors contributing to severe crashes in the preliminary HSIS analysis, it is divided further into34,629 crashes on urban two-lane highways, 174,048 crashes on rural two-lane highways, and269,773 crashes on all other HSIS roadways in this section of the report. Severe crashes,represented by the number of K+A crashes in each sample, are evaluated according to roadway,
North Carolina vs.8 Southeastern States
North Carolina
NC Urban+Rural
PHASE I
PHASE II
PHASE III
FARS/CARE
North Carolina HSIS
NC HSIS and NC non-HSIS
Geographic Focus of Crash Analysis
Crash Database

31
crash, vehicle, driver, and environmental variables. Significant differences between crash factorsare found through cross-tabulation techniques.
This sample of HSIS crashes is compared to the non-HSIS database that contains 654,319crashes. The non-HSIS crashes are divided into 544,878 urban crashes and 107,165 ruralcrashes. Note that 2276 (0.3 percent) of the records in the non-HSIS database are incompletebecause they are not designated as urban or rural. Cross-tabulation techniques are also used onthese sets to find the roadway, crash, vehicle, driver, and environmental factors related to severecrashes in North Carolina.
This part of the report identifies factors that are significantly related to severe injury crashes.First, the proportion of severe crashes for each factor (K+A/(K+A+B+C+O)) is determined.
Next, an estimate for the standard error for a binomial proportion tests the significance of eachfactor. This technique uses the following formula to account for differing sample sizes:
SE = {[p*(1-p)]/n}0.5
SE is an estimate of the standard error of the proportion of crashes for a given factor that aresevere (K+A), p is the proportion of crashes that are severe, and n is the total number of crashesassociated with that factor. Therefore, an upper-bound for the standard error for each factor witha sample size of n can be found:
The greatest possible value is SE = {[0.5*(1-0.5)]/n}0.5 = {[0.5*0.5]/n}0.5 = {[0.25]/n}0.5
For example, if the sample size is 100, an upper-bound estimate of the standard error for thepercentage of crashes that are severe is {[0.25]/100}0.5 = 0.05. If the sample size is 5,000, anupper-bound estimate of the standard error for the percentage of crashes that are severe is{[0.25]/5,000}0.5 = 0.00707. A factor will be considered significant when the percentage ofsevere crashes associated with that factor is at least two standard errors greater than thepercentage of all crashes in the database that are severe (see Example below). Assuming that theproportions of severe crashes are distributed normally, at least 95 percent of the differencebetween proportions will be due to factors other than random chance. Note that this method usedto test for significance is conservative because it uses an upper-bound estimate for standard error.
ExampleThis example shows how the estimate for the standard error of a binomial proportion was used in Table D.1 to determine thestatistical significance of crash factors. The proportion of severe crashes (K+A) on urban two-lane HSIS highways was 0.062(6.2 percent, N=34,629). Both curved, hillcrest (N=428, K+A=10.1 percent) and curved, grade (N=4092, K+A=8.5 percent) hada higher proportion of severe crashes than the roadway system as a whole. To determine if the proportion of severe crashes foreither road characteristic was significantly higher, the standard error upper-bounds reference table was used (Table D.2).
First, the difference between the curved, hillcrest and overall proportions was determined to be 0.101-0.062=0.039. Next,because there were 428 curved, hillcrest crashes, the N=400 row was used as a conservative estimate of the upper-bound of thestandard error for the curved, hillcrest severe crash proportion. Finally, the significance was found in terms of standard errors.The proportion 0.062 was more than one standard error (0.0250) smaller, but not two standard errors (0.0500) smaller than0.101. Therefore, curved, hillcrest did not have statistical significance at the “two standard error” (95 percent confidence) level.
The difference between the proportion of severe curved, grade and all urban two-lane HSIS crashes was 0.085-0.062=0.023.Using the reference table N=4000, the proportion 0.062 was determined to be more than two standard errors (0.0158), but lessthan three standard errors (0.0237) smaller than 0.085. Therefore, curved, grade was a statistically significant severe crashfactor.

32
Therefore, some factors that have marginal significance will not be highlighted even though theymay have a noticeable relationship with injury severity. In addition, this method does not controlfor the effect of combinations of factors on injury severity.
The results of significance testing on each variable are presented in Appendix D.
Data Description
Overall, severe (K+A) crashes make up 5.2 percent (24735/478450) of HSIS crashes.Examining the HSIS database by urban and rural classification shows that 6.2 percent(2151/34629) of urban two-lane, 5.9 percent (6731/174048) of rural two-lane, and only 3.9percent (15853/269773) of crashes on other HSIS roads are severe (Figure 13). The proportionsof severe crashes on urban two-lane, rural two-lane, and all other HSIS roads are eachsignificantly different from the overall percentage of severe HSIS crashes at a five standard errorlevel.
In contrast, only 3.4 percent (22451/652043) of non-HSIS crashes are severe. However, 2.9percent (15944/544878) of non-HSIS urban and 6.1 percent (6507/107165) of non-HSIS ruralcrashes are severe (Figure 14). These proportions are each significantly different from theoverall percentage of severe non-HSIS crashes at the five standard error level. Note that asmaller percentage of rural two-lane crashes are severe on HSIS highways, but rural routes havea greater percentage of severe crashes than urban routes in the non-HSIS database.
Though all non-HSIS roadways were expected to have more severe crash problems because theyare not the primary highways and arterials in North Carolina, only the rural non-HSIS (non-state-owned) roads had a higher proportion of severe crashes than all HSIS roadways. Non-HSISurban roads, which contain many subdivision streets and minor urban streets, had a smallerpercentage of severe crashes than all HSIS roadways.
Next, the databases are queried according to specific characteristics to identify factors that arerelated to severe crashes. The variables used to determine these factors include:
Roadway factorsRoad characteristics (straight level, hillcrest, grade, and bottom, and curve level, hillcrest,
grade, and bottom)Road feature (bridge, underpass, driveway, intersection, beginning/end of divided
highway, etc.)Road configuration (undivided one-way and two-way, and divided)Road defects (loose material, low shoulders, etc.)Road condition (dry, wet, muddy, snowy, icy, and other)Road surface (concrete, smooth and coarse asphalt, gravel, etc.)Traffic signalTraffic control (stop sign, yield sign, flashing signal, etc.)

Figure 13. HSIS crashes on urban and rural two-lane and all other roads by severity
Urban 2-lane roads
6.2%
41.5%52.3%
Rural 2-lane roads
5.9%
40.1%54.0%
All other roads
3.9%
39.2%
56.9%
Fatal and A injury
B and C injury
Property damageonly

Figure 14. HSIS vs. non-HSIS urban and rural crashes by severity
Non-HSIS Urban
2.9%
33.0%
64.1%
Non-HSIS Rural
6.1%
36.4%57.5%
HSIS
5.2%
39.9%55.0%
Fatal and A injury
B and C injury
Property damageonly

35
Crash factorsAccident type (run-off-road rollover, head-on, angle/turn, rear end/sideswipe, etc.)Means of involvement (run-off-road, hit fixed object, hit non-fixed object, car vs. car, car
vs. truck or bus, 2+ vehicles involved, etc.)Number of units involved in accidentBicycle accidentPedestrian accident
Vehicle factorsVehicle type (car, small truck, large truck, bus, pedestrian, motorcycle, bicyclist, and other)
Driver factorsAlcohol involvement
Environmental factorsLight condition (daylight, dusk, dawn, dark with streetlight, dark without streetlight)Day of weekWeather condition (clear, cloudy, rain, snow, fog, etc.)
Sample sizes are presented in Appendix E, and Table 1 shows the general structure of the severecrash factor analysis.
Table 1. Structure of detailed crash factor analysis
Roadway SystemCrash Factor HSIS Non-HSISCategory Urban 2-lane Rural 2-lane Other Urban RuralRoadway Factors
Crash Factors
Vehicle Factors
Driver Factors
Environmental Factors

36
C. ANALYSIS OF HSIS TWO-LANE URBAN, HSIS TWO-LANE RURAL,AND OTHER HSIS ROUTES
Roadway SystemCrashFactor
HSIS Non-HSIS
Category Urban 2-lane Rural 2-lane Other Urban Rural
Roadway Factors
Crash Factors
Vehicle Factors
Driver Factors
Environmental Factors
Roadway Factors
Curved road segments had a significantly higher percentage of severe crashes than straightsegments on urban two-lane highways, rural two-lane highways, and all other types of HSISroadways (Figure 15). This difference was particularly noticeable for level segments of urbanhighways, where 5.0 percent of crashes on straight roads of this type (N=16,568) were severe,while nearly ten percent of crashes on curved roads of this type (N=4,316) were severe.
Bridges and underpasses were significant roadway features related to severe crashes on ruraltwo-lane and other HSIS routes and were a noticeable factor on urban two-lane highways (Figure16). Though they lacked statistical significance due to a small sample size, railroad crossingsand the beginning or end of divided highways were associated with high percentages of severecrashes on urban two-lane highways. Railroad crossings were also a noticeable factor on non-two-lane highways. There were small sample sizes for railroad crossings on urban two-lanehighways (N=90) and crashes at the beginning or end of divided highways on urban two-lanehighways (N=27).
Multilane undivided roadways were a significant road configuration in the HSIS database as awhole, but the breakdown of the database into 2-lane urban and 2-lane rural highways and allother routes did not allow for a comparative analysis. Though this analysis did not identify anysignificant road configurations, it suggested that divided two-lane highways had lower crashseverity than undivided two-lane highways but that divided highways had slightly higher crashseverities for all other HSIS roads. For all other HSIS routes, 4.3 percent of crashes on dividedhighways were severe (N=91,016), but only 3.5 percent of crashes on undivided two-way roadswere severe (N=75,454). This result was surprising because undivided roadways are normallyassociated with more severe injuries than divided roadways. However, this may simply be theresult of higher vehicle speeds on the divided multi-lane roads, as compared to individual routes.
About 95 percent of HSIS crashes were on roadways with no defects. Though relatively fewcrashes were on roads with defects, nearly 10 percent of crashes on rural two-lane highways withlow shoulders (N=1085) were severe compared to only 5.9 percent of all rural two-lane highwaycrashes (Figure 17). Low shoulders on rural two-lane highways was the only significant

Figure 15. Severe crashes on urban and rural two-lane HSIS roads by road character
5.0
7.1
5.3
4.5
9.9 10.1
8.5
7.1
6.2
4.8
5.6 5.4
6.1
9.1
7.6
8.89.2
5.9
3.6 3.73.9
5.05.5
4.9
5.85.6
3.9
0
2
4
6
8
10
12
Level Hillcrest Grade Bottom Level Hillcrest Grade Bottom All crashes
Straight road
Perc
ent o
f cra
shes
resu
lting
in fa
tal o
r A in
jury
Urban 2-lane highway Rural 2-lane highway All other HSIS roads
Curved road

Figure 16. Severe crashes on urban and rural two-lane HSIS roadsby road feature
7.5
0.0
4.1
5.4 5.3
6.1
4.6
7.4
1.8
0.0
11.1
6.2
10.1
5.8
4.2
6.1
2.9
5.6
4.3
6.5
3.6 3.8
6.7
5.9
4.4
8.2
3.4
4.2
1.5
4.3
5.2
4.3
2.8
3.94.2
3.9
0
2
4
6
8
10
12
Bridge
Underp
ass
Public
drive
wayPriv
ate dr
iveway
Alley i
nterse
ction
Inters
ectio
n of ro
adway
Median
cros
sing
End-be
gin di
v. hig
hway
Interc
hang
e ram
pInt
ercha
nge s
ervice
rd.
Railroa
d cros
sing
All cras
hes
Road feature
Perc
ent o
f cra
shes
resu
lting
in fa
tal o
r A in
jury
Urban 2-lane highway Rural 2-lane highway All other HSIS roads

Figure 17. Severe crashes on urban and rural two-lane HSIS roadsby road defect
4.9
8.3
7.67.1
6.3
4.3
3.2
6.2 6.2
5.3
3.5
9.6
6.5
5.05.4
6.45.9 5.9
4.64.1
5.9
6.7
2.3
3.3
5.1
3.9 3.9
0
2
4
6
8
10
12
Loose material Holes, deepruts
Low shoulders Soft shoulders Repairs,defects
Underconstruction
Other defects No defects All crashes
Road Defect
Perc
ent o
f cra
shes
resu
lting
in fa
tal o
r A in
jury
Urban 2-lane highway Rural 2-lane highway All other HSIS roads

40
roadway defect, but low and soft shoulders were associated with an above-average percentage ofsevere crashes on all three types of HSIS routes. One explanation for why locations with lowshoulders are a severe crash factor is that they tend to be associated with run-off-road and head-on crashes.
Dry roads were associated with the greatest incidence of severe crashes on all three types ofHSIS roadways, though this condition was a significant crash factor only on rural two-laneroadways. Interestingly, the incidence of severity was lower than average on snowy, icy, andwet roads for all three classifications. This finding was consistent with research by Khattak,Kantor, and Council (1998). Though more crashes may occur in these conditions, people oftendrive at lower speeds in snowy and icy conditions than on dry roads, which may result in asmaller percentage of severe crashes.
The analysis did not reveal any specific road surface to be a significant severe crash factor due tothe small sample sizes of crashes on gravel, sand, and soil road surfaces. Though concrete roadpavement was associated with a higher percentage of severe crashes on non-two-lane HSISroads, this is logically the result of concrete being used on high-speed, multilane roadways,which have a higher percentage of severe crashes than lower-speed roads.
On multilane HSIS roadways, crashes occurring at locations with traffic signals were associatedwith a significantly higher proportion of severe crashes compared to HSIS roadways as a whole.Yet, injury severity in these locations may be explained better by other factors, such as beingassociated with intersections, which were also more likely to have severe crashes compared to alllocations as a whole.
Crash Factors
Preliminary analysis of the HSIS database identified head-on, run-off-road, single-vehicle, andbicycle and pedestrian crashes to be associated with significantly higher percentages of severeinjuries. Dividing the database into two-lane urban, two-lane rural, and all other HSIS routesgave similar results. The percentage of head-on crashes resulting in severe injury was about sixtimes greater than the corresponding percentage for all crashes on all three types of routes(Figure 18). The greatest difference in the percentage of severe pedestrian and bicycle crashesand percentage of severe crashes on each roadway type overall was for all other HSIS routes andthe smallest difference was for urban two-lane highways. Pedestrian and bicycle crashes arediscussed in more detail below. Run-off-road crashes, especially those on rural two-lanehighways, were also associated with a significantly high percentage of severe injuries.
Several means of involvement had significantly high percentages of severe injuries on HSISroutes. Data from all three types of roadways showed that run-off-road crashes and crasheswith two or more vehicles had a higher incidence of severe injuries than other types of crashes(Figure 19). Yet, it should be noted that the HSIS database reports only the most severe injury ina crash. When more vehicles are involved, there is a greater likelihood that one of thepassengers will have a severe injury. As mentioned above, run-off-road crashes tend to havemore severe injuries, but they should also require extra attention due to their frequent occurrence.These crashes accounted for over 30 percent of urban two-lane highway and over 25 percent ofrural two-lane highway crashes in the HSIS database.

Figure 18. Severe crashes on urban and rural two-lane HSIS roadsby accident type
9.7
13.5
7.0
35.9
2.2
6.8
32.9
0.51.8
31.8
4.86.2
10.1
12.2
7.9
36.8
2.3
5.8
34.5
0.41.5
19.5
4.55.96.4
9.18.2
22.4
1.6
4.3
33.0
0.4 1.10.0
2.93.9
0
5
10
15
20
25
30
35
40
Ran-of
f-road
, hit f
ixed o
bject
Ran-of
f-road
, rollo
ver
Ran-of
f-road
, othe
r
Head-o
nRea
r-end
/side
swipe
Angle/
turn
Pedes
trian/b
icycle
Animal
Park/Brak
e
Train
Other
All cras
hes
Accident Type
Perc
ent o
f cra
shes
resu
lting
in fa
tal o
r A in
jury
Urban 2-lane highway Rural 2-lane highway All other HSIS roads

Figure 19. Severe crashes on urban and rural two-lane HSIS roads by means of involvement
8.1
4.6
7.2
4.6
5.6
8.8
5.1
6.2
8.8
5.1
6.9
4.0
4.9
7.5
5.1
5.9
7.2
2.8
3.9
2.52.8
4.8
6.2
3.9
0
2
4
6
8
10
Ran off road Hit fixed object Hit non-fixedobject
Car vs. car Car vs. truck,bus
2+ vehiclesinvolved
Other 1,2vehicle accident
All crashes
Means of involvement
Perc
ent o
f cra
shes
resu
lting
in fa
tal o
r A in
jury
Urban 2-lane highway Rural 2-lane highway All other HSIS roads

43
Additional data were used to analyze the types of objects being hit by vehicles that ran off theroad. This database subset showed that 9.7 percent of crashes on urban two-lane, 10.1 percent onrural two-lane, and 6.4 percent on other HSIS highways were severe. Among the most commonobjects struck on HSIS highways were trees (N=18,949), utility poles (N=7,507), fences(N=3,719), mailboxes (N=2,765), and parked vehicles (N=1,501). Though trees were the onlyobject significantly related to severe crashes on all three types of routes (about 13 percent K+Aon urban and rural two-lane routes and over eight percent K+A on other routes), utility poleswere associated with a high proportion of fatal and serious injuries on urban two-lane (10.8percent K+A) and non-two-lane HSIS roads (8.5 percent K+A).
Single-vehicle crashes were the most severe on rural two-lane and non-two-lane HSIS routes.About 40 percent of crashes on urban and rural two-lane HSIS routes and 18 percent on non-twolane HSIS routes were single-vehicle, so this type of crash is important to address with safetycountermeasures. There were no significant findings related to number of vehicles involved onurban two-lane HSIS routes. Though crashes with three or more vehicles involved had thehighest percentage of severe injuries on urban two-lane HSIS routes, this finding may be theresult of the database reporting the most severe injury from each crash, which is more likely tobe severe when there are more vehicles involved. Crashes on all three classifications of HSISroadways were least likely to be severe when two vehicles were involved.
The percentage of crashes that are severe when bicycles were involved was between three andfive times higher and the percentage of crashes that were severe when pedestrians wereinvolved was between seven and twelve times higher than other crashes on all HSIS roadways(Figure 20). This difference was greatest for non-two-lane HSIS roads, meaning that thesemultilane highways were the most dangerous for pedestrians and bicycles compared other typesof roads. Overall, about 45 percent of injuries in HSIS pedestrian crashes and about 20 percentof injuries in HSIS bicycle crashes were severe. It should be pointed out that HSIS urban two-lane highways had only a small number of bicycle crashes (N=156) and pedestrian crashes(N=186).
Vehicle Factors
Motorcycle, pedestrian, and bicycle crashes were all associated with a significantly highpercentage of severe crashes on all types of HSIS routes (Figure 21). Large trucks were asignificant severe crash factor on rural two-lane highways. In fact, all four vehicle types had asevere crash percentage that was at least 20 percent higher than the mean of 7.2 percent on ruraltwo-lane routes.
Crashes involving school buses had a lower percentage of severe injuries than other crashes forall types of HSIS routes. The analysis was limited by a relatively small sample of school buscrashes in each classification, especially on two-lane urban highways (N=173).
Driver Factors
The percentage of crashes that were severe when drinking or drugs were involved was almostfour times greater on urban and rural two-lane HSIS roadways and slightly more than four times
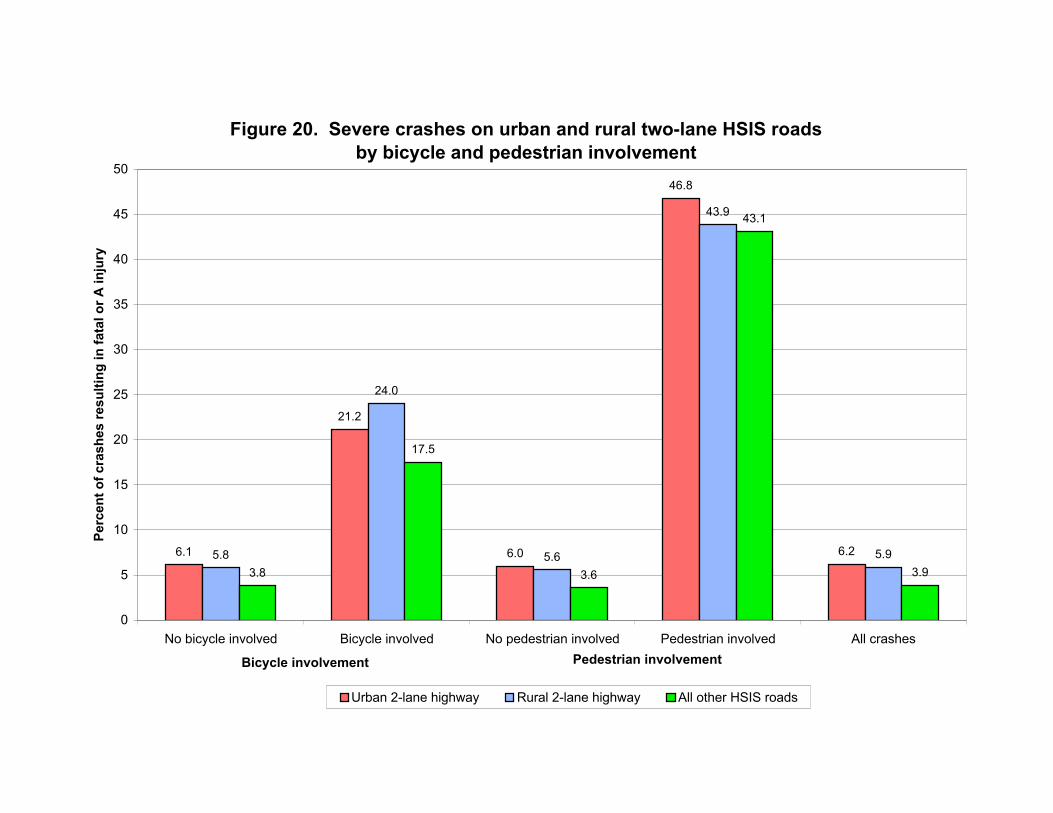
Figure 20. Severe crashes on urban and rural two-lane HSIS roads by bicycle and pedestrian involvement
6.1
21.2
6.0
46.8
6.25.8
24.0
5.6
43.9
5.93.8
17.5
3.6
43.1
3.9
0
5
10
15
20
25
30
35
40
45
50
No bicycle involved Bicycle involved No pedestrian involved Pedestrian involved All crashes
Bicycle involvement
Perc
ent o
f cra
shes
resu
lting
in fa
tal o
r A in
jury
Urban 2-lane highway Rural 2-lane highway All other HSIS roads
Pedestrian involvement

Figure 21. Severe crashes on urban and rural two-lane HSIS roadsby vehicle type
46.9
21.8
6.5 5.9
8.3
5.5
33.6
9.9
7.3
44.0
24.3
4.25.8
8.7
5.3
30.3
7.4 7.2
43.1
17.7
4.0 3.65.5
3.7
24.7
5.2 4.8
0
5
10
15
20
25
30
35
40
45
50
Pedestrian Bicycle Bus Small Truck Large Truck Car Motorcycle Other All vehicles
Vehicle Type
Perc
ent o
f veh
icle
s w
ith fa
tal o
r A in
jury
Urban 2-lane highway Rural 2-lane highway All other HSIS roads

46
greater for all other HSIS roadways (Figure 22). Though alcohol involvement is a significantsevere crash factor on all types of routes, it should be noted that alcohol was involved in agreater percentage of crashes on urban (7.7 percent) and rural (6.8 percent) two-lane HSIS roadsthan on other HSIS roads (4.0 percent).
Environmental Factors
Darkness without streetlight was the most significant environmental crash factor on all types ofhighways in the HSIS database (Figure 23). More than 25 percent of crashes on urban and ruraltwo-lane HSIS roadways occurred under this lighting condition.
Crashes occurring on weekends were more likely to be severe than weekdays on all types ofHSIS routes (Figure 24). Yet, weekends were only a significant crash factor for rural two-laneand non-two-lane HSIS routes
The most noticeable weather condition related to severe injuries on rural two-lane and non-two-lane HSIS routes was fog, smog, smoke, or dust. However, no weather conditions weresignificantly-related to severe crashes on any type of HSIS route.

Figure 22. Severe crashes on urban and rural two-lane HSIS roadsby alcohol involvement
5.3
17.6
6.2
5.0
18.4
5.9
3.4
14.6
3.9
0
2
4
6
8
10
12
14
16
18
20
No drink or drug Intoxicated All crashes
Alcohol involvement
Perc
ent o
f cra
shes
resu
lting
in fa
tal o
r A in
jury
Urban 2-lane highway Rural 2-lane highway All other HSIS roads
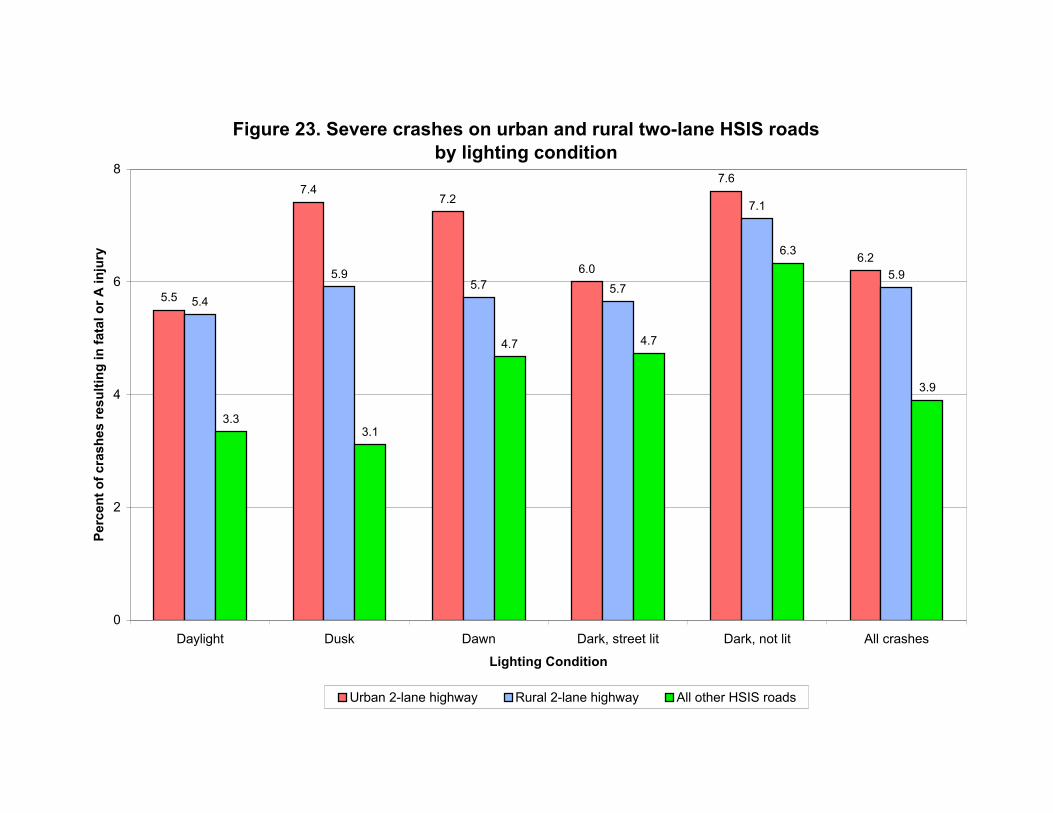
Figure 23. Severe crashes on urban and rural two-lane HSIS roadsby lighting condition
5.5
7.47.2
6.0
7.6
6.2
5.4
5.95.7 5.7
7.1
5.9
3.33.1
4.7 4.7
6.3
3.9
0
2
4
6
8
Daylight Dusk Dawn Dark, street lit Dark, not lit All crashes
Lighting Condition
Perc
ent o
f cra
shes
resu
lting
in fa
tal o
r A in
jury
Urban 2-lane highway Rural 2-lane highway All other HSIS roads

Figure 24. Severe crashes on urban and rural two-lane HSIS roads by weekday
5.4
6.0
5.2
5.8
6.77.0
7.6
6.2
5.2 5.35.5 5.3 5.4
7.0
7.9
5.9
3.7 3.7 3.63.4 3.6
4.5
5.2
3.9
0
2
4
6
8
10
Monday Tuesday Wednesday Thursday Friday Saturday Sunday All crashes
Weekday
Perc
ent o
f cra
shes
resu
lting
in fa
tal o
r A in
jury
Urban 2-lane highway Rural 2-lane highway All other HSIS roads

50
D. ANALYSIS OF NON-HSIS URBAN AND RURAL ROUTES
Roadway SystemCrashFactor
HSIS Non-HSIS
Category Urban 2-lane Rural 2-lane Other Urban Rural
Roadway Factors
Crash Factors
Vehicle Factors
Driver Factors
Environmental Factors
Roadway Factors
Curved roadways were associated with a significantly greater percentage of severe crashes thanstraight roadways on non-HSIS routes. This result complements what was found using the HSISdatabase. About 5.5 percent of crashes on level, curved urban non-HSIS roads (N=24,318) weresevere, but only 2.6 percent of crashes on level, straight urban non-HSIS roads (N=372,419)were severe. Similarly, while almost nine percent of crashes on level, curved rural non-HSISroads (N=19,298) were severe, only 4.7 percent of crashes on level, straight rural non-HSISroads (N=49,321) were severe.
Bridges had the highest incidence of severe crashes on rural non-HSIS routes (Figure 25). Thisresult complements the finding that bridges are a significant severe crash factor on rural two-laneHSIS highways. Intersections also had a large enough sample size to be a statistically significantsevere crash factor on urban non-HSIS roads, though only a slightly-higher percentage of thistype of crash was severe compared to urban non-HSIS routes overall (3.7 percent K+A versus2.9 percent K+A).
The undivided two-way road configuration was associated with the highest percentage of severecrashes on HSIS routes, but none of undivided one-way, undivided two-way, or divided roadwayon urban or rural non-HSIS routes were related to a significantly higher incidence of severeinjuries.
Low shoulders were the most noticeable roadway defects on HSIS highways and were asignificant severe crash factor on rural two-lane routes. These defects were also associated witha significantly high percentage of severe crashes on rural non-HSIS routes (Figure 26). While6.1 percent of all rural non-HSIS crashes (N=107,070) were severe, 11.3 percent of crashes onroadways with low shoulders (N=514) were severe. About three percent of all urban non-HSIScrashes were severe, but 4.6 percent of crashes on roads with soft shoulders (N=769) and 4.0percent on roads with low shoulders (N=1014) were severe.
Though snowy and icy roadway conditions may be expected to generate more severe crashes, theopposite held on non-HSIS rural and urban routes. These findings supported the results of theHSIS analysis.

Figure 25. Severe crashes on urban and rural non-HSIS roads by road feature
3.84.2
1.4
2.7 2.7
3.74.0
3.5
2.2
4.0
5.4
2.9
8.7
10.0
2.9
6.4
3.1
6.4
4.6
3.8
4.4
5.0
9.6
6.1
6.9
7.6
3.9
5.9
2.5
5.2 5.1 5.0
2.8
3.9
6.2
5.2
0
2
4
6
8
10
12
Bridge
Underp
ass
Public
drive
wayPriv
ate dr
iveway
Alley i
nterse
ction
Inters
ectio
n of ro
adway
Median
cros
sing
End-be
gin di
v. hig
hway
Interc
hang
e ram
pInt
ercha
nge s
ervice
rd.
Railroa
d cros
sing
All cras
hes
Road feature
Perc
ent o
f cra
shes
resu
lting
in fa
tal o
r A in
jury
Non-HSIS Urban Non-HSIS Rural HSIS

Figure 26. Severe crashes on urban and rural non-HSIS roads by road defect
2.52.9
4.04.6
3.1 3.1 3.22.9 2.9
4.5
5.4
11.3
5.1
4.44.0
3.7
6.2 6.1
5.0
4.1
8.7
6.7
3.54.1
5.75.2 5.2
0
2
4
6
8
10
12
Loose material Holes, deepruts
Low shoulders Soft shoulders Repairs,defects
Underconstruction
Other defects No defects All crashes
Road Defect
Perc
ent o
f cra
shes
resu
lting
in fa
tal o
r A in
jury
Non-HSIS Urban Non-HSIS Rural HSIS

53
Road surface was not a significant crash factor on HSIS routes or non-HSIS routes. The mostnotable finding was that both rural and urban non-HSIS routes with smooth and coarse asphaltsurfaces were associated with a slightly higher percentage of severe crashes than routes withconcrete and grooved concrete surfaces.
Though no traffic control features were significant severe crash factors, several were associatedwith a higher frequency of severe crashes on rural and urban non-HSIS routes. Flashing signals,railroad flashers, and railroad crossbucks were related to greater severity on both types ofroadways, though there were small samples of crashes with these features. Stop signs were alsoassociated with a higher incidence of severity on urban routes.
Crash Factors
Though head-on, pedestrian and bicycle, and run-off-road accident types, which weresignificant crash factors on all types of HSIS roadways, were also significant on urban and ruralnon-HSIS routes, the non-HSIS analysis provided several other notable findings. First, whileaccounting for under one percent of crashes on HSIS and non-HSIS urban roadways, head-oncrashes made up 4.0 percent (N=1,805) of all non-HSIS rural crashes (Figure 27). Of these1,805 crashes, 19.7 percent were severe. Another interesting finding was that while nearly 25percent of HSIS crashes were run-off-road, less than six percent of non-HSIS rural and less thantwo percent of non-HSIS urban crashes were of this type.
Different means of involvement contributed to high incidences of severe crashes on HSIS, non-HSIS rural, and non-HSIS urban routes (Figure 28). Significant factors on all HSIS and non-HSIS routes were run-off-road crashes and crashes with two or more vehicles involved. In fact,the percentage of severe crashes with two or more vehicles involved on non-HSIS ruralroadways (10.1 percent) was more than 50 percent higher than the percentage of all severecrashes on non-HSIS rural roads (6.1 percent). Similarly, while only 2.9 percent of all non-HSISurban crashes were severe, almost seven percent of run-off-road crashes in this subset of thedatabase were severe. Though hit non-fixed object crashes, which include pedestrian andbicycle crashes, were not significant on HSIS highways, they were significant on both urban andrural non-HSIS routes.
A subset of non-HSIS crashes was used to analyze which types of objects were being struck inrun-off-road crashes. Unlike the results from the HSIS database, trees were not a statisticallysignificant severe crash factor, though the non-HSIS analysis was limited by small sample sizes.The only object struck that came close to statistical significance was utility pole on urban routes.While only 4.8 percent of all urban non-HSIS run-off-road crashes were severe, 10.2 percent ofutility pole crashes on urban non-HSIS roads were severe (N=362).
Though crashes with one vehicle involved had a higher incidence of severity on rural two-laneand non-two-lane HSIS highways, single-vehicle crashes were a significant severe crash factoronly on urban non-HSIS routes. Like HSIS crashes, non-HSIS urban crashes were more likely tohave severe injuries when three or more vehicles were involved and less likely to have severeinjuries when two vehicles were involved.

Figure 27. Severe crashes on urban and rural non-HSIS roads by accident type
4.8
7.1
5.0
15.7
1.43.1
22.2
3.5
0.1
7.4
0.6
2.6
6.07.0
11.1
19.7
3.0
6.1
3.5
0.5
12.5
1.8
5.9
8.8
11.0
7.8
2.0
5.3
0.41.4
17.1
3.85.2
34.033.9 33.9
0
5
10
15
20
25
30
35
40
Ran-of
f-road
, hit f
ixed o
bject
Ran-of
f-road
, rollo
ver
Ran-of
f-road
, othe
r
Head-o
nRea
r-end
/side
swipe
Angle/
turn
Pedes
trian/b
icycle
Animal
Park/Brak
e
Train
Other
All cras
hes
Accident Type
Perc
ent o
f cra
shes
resu
lting
in fa
tal o
r A in
jury
Non-HSIS Urban Non-HSIS Rural HSIS

Figure 28. Severe crashes on urban and rural non-HSIS roads by means of involvement
6.9
2.1
7.8
1.8 1.9
3.1
7.98.2
2.9
8.0
3.3
8.6
4.04.5 4.3
10.1
4.0
6.1
8.4
3.9
5.5
3.4
4.1
6.2
5.4 5.2
0
2
4
6
8
10
12
1 vehicle, ranoff road
1 vehicle, hitfixed object
1 vehicle, hitnon-fixed
object
Car vs. car Car vs.truck/bus/van
Truck vs. truck 2+ vehiclesinvolved
Other 1,2vehicle
accident
All crashes
Means of involvement
Perc
ent o
f cra
shes
resu
lting
in fa
tal o
r A in
jury
Non-HSIS Urban Non-HSIS Rural HSIS
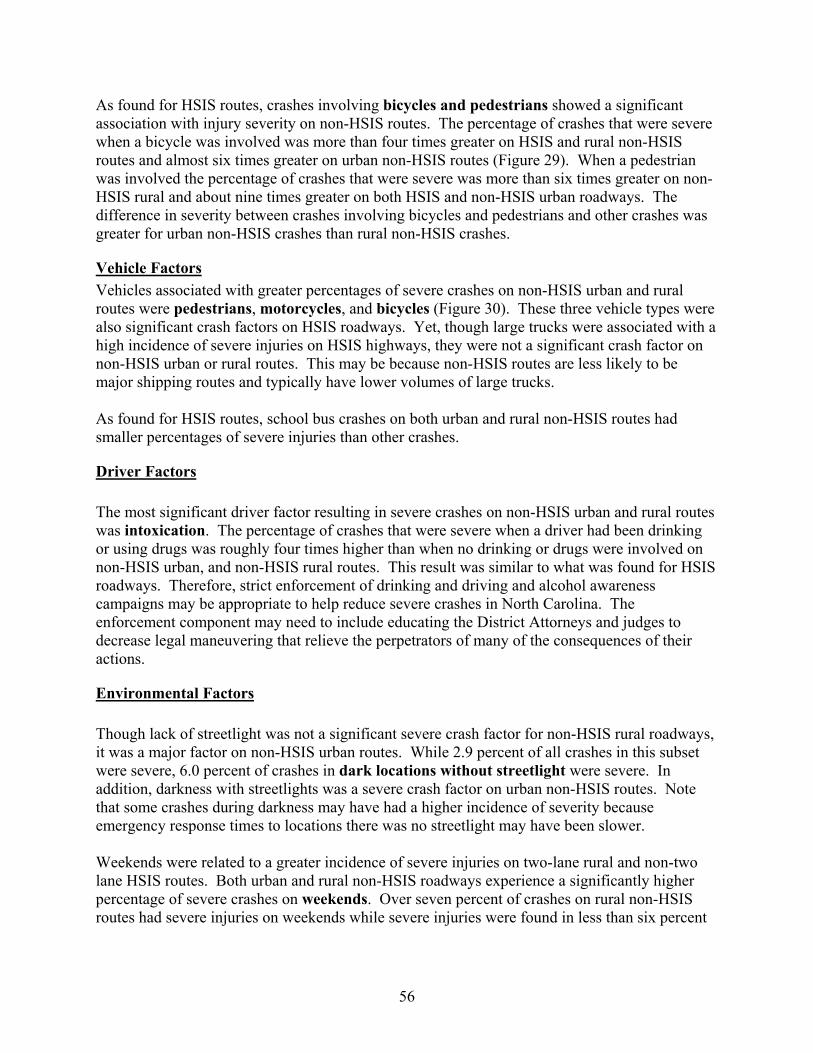
56
As found for HSIS routes, crashes involving bicycles and pedestrians showed a significantassociation with injury severity on non-HSIS routes. The percentage of crashes that were severewhen a bicycle was involved was more than four times greater on HSIS and rural non-HSISroutes and almost six times greater on urban non-HSIS routes (Figure 29). When a pedestrianwas involved the percentage of crashes that were severe was more than six times greater on non-HSIS rural and about nine times greater on both HSIS and non-HSIS urban roadways. Thedifference in severity between crashes involving bicycles and pedestrians and other crashes wasgreater for urban non-HSIS crashes than rural non-HSIS crashes.
Vehicle FactorsVehicles associated with greater percentages of severe crashes on non-HSIS urban and ruralroutes were pedestrians, motorcycles, and bicycles (Figure 30). These three vehicle types werealso significant crash factors on HSIS roadways. Yet, though large trucks were associated with ahigh incidence of severe injuries on HSIS highways, they were not a significant crash factor onnon-HSIS urban or rural routes. This may be because non-HSIS routes are less likely to bemajor shipping routes and typically have lower volumes of large trucks.
As found for HSIS routes, school bus crashes on both urban and rural non-HSIS routes hadsmaller percentages of severe injuries than other crashes.
Driver Factors
The most significant driver factor resulting in severe crashes on non-HSIS urban and rural routeswas intoxication. The percentage of crashes that were severe when a driver had been drinkingor using drugs was roughly four times higher than when no drinking or drugs were involved onnon-HSIS urban, and non-HSIS rural routes. This result was similar to what was found for HSISroadways. Therefore, strict enforcement of drinking and driving and alcohol awarenesscampaigns may be appropriate to help reduce severe crashes in North Carolina. Theenforcement component may need to include educating the District Attorneys and judges todecrease legal maneuvering that relieve the perpetrators of many of the consequences of theiractions.
Environmental Factors
Though lack of streetlight was not a significant severe crash factor for non-HSIS rural roadways,it was a major factor on non-HSIS urban routes. While 2.9 percent of all crashes in this subsetwere severe, 6.0 percent of crashes in dark locations without streetlight were severe. Inaddition, darkness with streetlights was a severe crash factor on urban non-HSIS routes. Notethat some crashes during darkness may have had a higher incidence of severity becauseemergency response times to locations there was no streetlight may have been slower.
Weekends were related to a greater incidence of severe injuries on two-lane rural and non-twolane HSIS routes. Both urban and rural non-HSIS roadways experience a significantly higherpercentage of severe crashes on weekends. Over seven percent of crashes on rural non-HSISroutes had severe injuries on weekends while severe injuries were found in less than six percent

Figure 29. Severe crashes on urban and rural non-HSIS roads by bicycle and pedestrian involvement
2.8
16.6
2.6
26.1
2.9
6.0
27.5
5.8
37.1
6.15.1
21.8
4.9
43.7
5.2
0
5
10
15
20
25
30
35
40
45
50
No bicycle involved Bicycle involved No pedestrian involved Pedestrian involved All crashes
Bicycle involvement
Perc
ent o
f cra
shes
resu
lting
in fa
tal o
r A in
jury
Non-HSIS Urban Non-HSIS Rural HSIS
Pedestrian involvement

Figure 30. Severe crashes on urban and rural non-HSIS roads by vehicle type
25.5
16.6
0.5 1.2 0.41.6
22.1
1.8 1.8
35.7
27.6
0.4
3.81.9
4.4
33.0
5.5 4.8
43.8
22.0
4.3 5.17.0
4.7
29.3
6.7 6.3
0
5
10
15
20
25
30
35
40
45
50
Pedestrian Bicycle Bus Small Truck Large Truck Car Motorcycle Other All vehicles
Vehicle Type
Perc
ent o
f veh
icle
s w
ith fa
tal o
r A in
jury
Non-HSIS Urban Non-HSIS Rural HSIS

59
of crashes on the same routes on weekdays. Urban non-HSIS roadways showed a similarpattern. About 3.4 percent of crashes on Saturday and 3.9 percent of crashes on Sunday weresevere while less than three percent of weekday crashes on urban routes were severe.
Clear weather was associated with a significantly-higher percentage of severe crashes than for allcrashes in the HSIS database. The non-HSIS analysis revealed no significant weatherconditions.
E. Summary of Severe Crash Factors on HSIS and non-HSIS Routes
Analysis of the urban and rural two-lane highway subset of the HSIS database and data fromnon-HSIS rural and urban routes revealed the roadway, crash, vehicle, driver, and environmentalfactors that were related to significantly higher percentages of severe crashes (compared to thepercentage of severe crashes on each roadway system as a whole) (Table 2). See Appendix D forthe statistical tables used to identify each significant factor. Further details from the analysis aresummarized on the following page.
Table 2. North Carolina sever crash factorsRoadway System
HSIS Non-HSISSevereCrash Factor* Overall Urban 2-lane Rural 2-lane Urban RuralRoadway Factors
Curve X X X X X
Bridge/underpass X X X
Multilane undivided X
Low shoulder X XCrash Factors
Head-on X X X X X
Run-off-road X X X X X
Single-vehicle X X X
Bicycle/pedestrian X X X X XVehicle Factors
Motorcycle X X X X X
Large truck X XDriver Factors
Alcohol X X X X XEnvironmental Factors
Night, no streetlight X X X X
Weekend X X X X*A crash factor is significant when the proportion of severe (K+A) crashes with that given characteristic is at least 2standard errors greater than the percentage of severe crashes on the roadway system as a whole (see Ex., p. 19).

60
1. Compared to the percentage of severe crashes on each roadway system as a whole, curveswere associated with a significantly higher-than-average (above the 95 percent statisticalconfidence level) proportion of severe crashes for all types of roads. For all roadway systems,the percentage of crashes that were severe on curved roadways was between 50 and 100 percenthigher than the percentage of crashes that were severe on straight roadways.
2. The most significant road defect was low shoulders, especially in rural locations. Theincidence of severe crashes on roads with low shoulders was over 50 percent higher than for allcrashes on both HSIS rural two-lane and non-HSIS rural routes.
3. The percentage of head-on crashes that were severe was between three and six times greaterthan the overall percentage of severe crashes on each type of HSIS and non-HSIS route. Thisdifference was statistically significant.
4. Run-off-road was a significant means of involvement on all types of HSIS and non-HSISroadways. For each type of roadway analyzed, the percentage of severe run-off-road crashes wasat least 30 percent higher than the overall percentage of severe crashes on the roadway system.It is especially important to address these types of severe crashes because of their frequentoccurrence.
5. The percentage of severe-injury run-off-road crashes involving trees was 40 percent higherthan the overall percentage of severe run-off-road crashes on HSIS highways. Though this wasstatistically significant, trees were not as significant severe crash factor on non-HSIS roads. Thismay indicate that the majority of the tree crashes are occurring on HSIS routes.
6. In comparison to other types of crashes on all routes, crashes involving bicycles are betweenthree and five times more likely to have a severe injury and crashes involving pedestrians arebetween six and twelve times more likely to have a severe injury. These differences arestatistically significant.
7. Crashes involving motorcycles were associated with significantly higher-than-averagepercentages of severe injuries, regardless of route. The percentage of motorcycle crashes thatwere severe compared to the percentage of all crashes that were severe ranged from about fivetimes greater on HSIS highways to over ten times greater on non-HSIS urban routes.
8. Alcohol involvement was a significant severe crash factor on all HSIS and non-HSIS routes.The percentage of crashes that were severe when alcohol was involved was about four timeshigher than when alcohol was not involved.
9. Darkness without streetlights was related to a significantly higher occurrence of severecrashes on all routes analyzed except rural non-HSIS roadways. For urban non-HSIS roadways,the percentage of severe crashes occurring in darkness without streetlights is two times higherthan the overall percentage of severe crashes on that system.

61
To summarize, the most significant factors associated with severe crashes throughout allroadway systems in North Carolina are:
• Curve• Run-off-road (including tree and utility pole)• Head-on• Pedestrian• Bicycle• Motorcycle• Alcohol• Darkness
Part III describes appropriate countermeasures to target each of these factors and reduce thenumber of severe injury crashes in North Carolina.

62
PART III COUNTERMEASURES
A. INTRODUCTION
The purpose of this section of the report is to suggest countermeasures that can be used to reducethe incidence of severe injury crashes in North Carolina. These countermeasures are intended toaddress the eight factors that are most closely associated with severe crashes on all types ofroadways, which were identified in Part I and Part II as:
1. Curve2. Run-off-road
-- Utility pole-- Tree
3. Head-on4. Pedestrian5. Bicycle6. Motorcycle7. Alcohol8. Darkness
B. RECOMMENDED TREATMENTS
Countermeasures that can be used to address the most significant severe crash factors are listedand described according to crash type. The effects of these treatments have been tested throughfield research and reported in various studies. When possible, crash reduction statistics andlimitations of each treatment will be cited. Note that the feasibility or cost-effectiveness of manyof the countermeasures will depend largely on site-specific conditions, such as the availabilityand cost of right-of-way, alignment and access requirements, and environmental impacts.
Curve Crashes8
Because of the randomness of crash occurrence, engineers must assess existing conditions,operations, and accident records before choosing countermeasures for curve crashes. Though alocation may have a sharp curve with a narrow roadway or a high number of recent crashes,implementing countermeasures may or may not be appropriate or effective. Yet, the decision toselect countermeasures (if any) at each location can be improved by evaluating factors such ascrash types, crash severity, vehicle speeds, frequency and spacing of access points, availablesight distance, encroachment, and other geometric and operational characteristics. Gatheringdata on locations with possible curve crash problems can help lead to the selection of three typesof countermeasures: 1) complete reconstruction (flatten curve, widen lanes, widen and/orsurface shoulder, provide spiral transitions to curves) 2) physical rehabilitation and/or partialreconstruction (improve superelevation, remove roadside hazards, flatten sideslope), and 3) low-cost spot improvements (add/improve signing, marking, and delineation). Countermeasuresfrom each of these categories are discussed below.

63
• Flatten curve. This strategy involves complete reconstruction of the roadway. Assumingthe central angle of the curve is fixed, a curve can be flattened by increasing the overall curvelength (increasing overall distance between the point of curve and point of tangent) so thatthe degree of curve is reduced, resulting in a less severe maneuver for drivers. Though curveflattening is costly, it has the greatest potential for reducing severe curve crashes. Forexample, flattening a 15 degree curve can be expected to reduce crashes between 24 and 78percent, depending on the amount of flattening8.
• Widen lanes. Wider roadway lanes give drivers more room for error when negotiating acurve. For example, widening 10-foot lanes to 12-foot lanes can be expected to reduce curvecrashes by 12 percent, while widening the eight-foot lanes to 12 feet can result in a 21percent reduction in curve crashes8.
• Widen and/or surface shoulder. Shoulder improvements will decrease the likelihood ofrun-off-road crashes occurring at curves. Though widening paved shoulders will result in thegreatest reduction in curve crashes, widening unpaved shoulders can also be beneficial.Widening each shoulder by between one foot and 10 feet is expected to reduce crashes byfour to 33 percent for paved shoulders and three to 29 percent for unpaved shoulders8. Notethat widening shoulders and lanes without increasing right-of-way may not be appropriate ifthe result is steeper sideslopes. Steep sideslopes (particularly steeper than 4:1) can lead tomore rollover crashes and increased crash severity.
• Provide a spiral transition. A spiral curve has a gradually-decreasing radius and may beused to connect a tangent to a curve. This type of curve corresponds to a driver’s normalturning of the steering wheel, providing drivers with a smoother transition into a curve.Everything else being equal, spiral transition curves at both ends of a curve can reduce curverelated crashes by approximately five percent8.
• Upgrade deficient superelevation. Increasing deficient superelevation to the AASHTOrecommended values can reduce the number of vehicles that run off the outside of the curve.By upgrading deficient superelevation using the AASHTO Superelevation Criterion, curvecrashes can be reduced by between five and ten percent8.
• Remove roadside hazards. Removing trees, relocating utility poles, and providingtraverseable drainage structures can increase the amount of relatively flat, unobstructed andsmooth area adjacent to the roadway, allowing more space for drivers to recover a vehiclethat has run off the road on a curve. Assuming no other improvements are made, increasingroadside recovery distance by five feet can be expected to reduce curve crashes by ninepercent, and increasing recovery distance by fifteen feet is expected to reduce curve crashesby 23 percent8.
• Flatten sideslope. Flattened sideslopes can reduce rollover crashes, which are associatedwith high injury severity. Depending on the amount of improvement, flattening sideslopescan be expected to reduce curve crashes by three to 15 percent8.

64
• Improve signing, marking, and delineation. Installing large arrow signs, chevrons,delineators on guardrails, or painting warning arrows on the pavement ahead of an upcomingcurve can provide drivers with a clearer picture of its sharpness, but these treatments can notnecessarily be expected to solve a safety problem at a hazardous curve. Proper signing,marking, and delineation in accordance with the Manual on Uniform Traffic Control Devices(MUTCD) is an essential complement to other treatments. Yet, even if it is not possible toreconstruct a poorly-designed curve, improvements to substandard signing, marking, anddelineation alone are likely reduce crash severity.
Run-off-Road Crashes (General)9
• Install shoulder or mid-lane rumble strips. Rumble strips are crosswise grooves in theroad shoulder that are about three inches deep, four inches apart, and cut in groups of four orfive. Vehicle tires passing over the grooves create a rumbling sound and make the vehiclevibrate, causing inattentive, drowsy, or sleeping drivers to become aware that they havemoved from the travel lane to the shoulder or roadside. Run-off-road crashes were reducedby 34 percent after adding shoulder rumble strips to the New York State Thruway. TheFHWA estimates that rumble strips reduce the rate of run-off-road crashes between 20 and50 percent10. Drawbacks of rumble strips include disrupting bicyclists using roadwayshoulders, increasing noise, and making snow removal and other maintenance more difficult.
• Improve delineation of curves. This technique involves providing drivers with a clearerpicture of the sharpness of an upcoming curve, causing them to reduce their speed beforeentering the curve. Strategies to enhance delineation of curves include installing large arrowsigns, chevrons, delineators on guardrails, or painting warning arrows on the pavement aheadof the curve. Each of these treatments are low cost and available for implementation. Astudy by Taylor and Foody found that curve delineators reduced run-off-road crashes by 15percent11.
• Provide new or improve existing pavement markings at appropriate locations. Betterpavement markings are intended to give drivers a more accurate picture of the true nature ofthe road and provide better guidance at locations where they may leave the roadway.Treatments such as high-contrast markings, wider lines, or raised pavement markers canachieve this goal. This strategy can be implemented at low cost and uses materials that arereadily available. Yet, it is important to note that improving markings may cause drivers toincrease speeds because they feel more comfortable with the roadway.
• Improve roadway geometrics, especially for horizontal curves. See section on curvecrashes for list of possible countermeasures.
• Provide skid-resistant pavement surfaces.
• Ensure consistency in design so that appropriate speeds are chosen.

65
Utility Pole Crashes12
• Remove poles and place utility wires underground. Undergrounding utility lines isintended to increase the recovery area adjacent to the roadway. Yet, the effectiveness of thistreatment will depend on removing other fixed objects that may be present or flattening steepsideslopes that may exist. Though removing poles and burying utility wires may beexpensive and actually increase other run-off-road crashes, this strategy has been observed toreduce the percentage of severe run-off-road crashes in urban areas from about 50 percent tounder 30 percent13.
• Relocate poles further from the roadway edge. Utility poles located closer to the edge ofthe roadway are more likely to be hit, so moving the poles back should reduce the frequencyof utility pole crashes12. Note that moving utility poles further from the roadway edge mayincrease other types of run-off-road crashes if other fixed-objects are not moved andsideslopes improved at the same time.
• Reduce the number of poles. Utility pole crashes are most strongly correlated with a highfrequency of poles along roadways12. Therefore, using multiple poles at a single point (tocarry both telephone and electric lines, for example), placing poles on only one side of thestreet instead of both, and increasing pole spacing can be used to reduce the number of polesand potential for utility pole crashes. One limitation of reducing the number of poles is thatlarger, more rigid poles may be required, which tend to be more costly and may result ingreater crash severity when hit.
• Install breakaway poles. Because rapid vehicle deceleration is a major reason for severeinjuries in utility pole crashes, breakaway poles are intended to break away upon impact andresult in lower injury levels. The total reduction in severe utility pole crashes resulting fromconversion to breakaway poles could be as high as 60 percent13. Note that while thiscountermeasure will reduce crash severity, crash frequency will not change.
• Use other countermeasures. Any treatment that reduces run-off-road crashes will have theadditional benefit of reducing utility pole crashes. Therefore, indirect measures (that do notrequire moving or changing the existing utility poles) such as improving roadway alignment,improving roadway delineation, providing advance warning signs, overlaying skid-resistantpavement, widening travel lanes and shoulders, improving roadway lighting may also beeffective.12
Tree Crashes14
• Remove trees in hazardous locations. The targets of this strategy are trees and stumpspositioned in hazardous locations and having a high probability of being struck by motorvehicles. These include trees struck by motor vehicles in the past, located close to theroadway, located on the outside of horizontal curves, and trees which are located alongpoorly designed roads with narrow lanes and shoulders, sharp horizontal curves, and/or steepsideslopes where run-off-road crashes are likely to occur. It is important to identify sectionsof roadway with past experience with tree crashes so that improvements can be made first in

66
the most hazardous locations. Trees should be removed so that a safe clear zone area resultsafter the tree removal. For example, removing all trees on a steep sideslope may beimpractical and would no longer be able to help prevent run-off-road vehicles from rollingover and falling to the bottom of the slope. In addition, though there has been a history oftree-related crashes, injuries, and deaths, it is common for citizens and environmental groupsto strongly oppose the removal of trees within highway rights-of-way.
• Provide guardrail. This countermeasure involves installing guardrail beyond the edge ofthe roadway to reduce the risk of motorists running into trees. Guardrail will typically reducethe crash severity of run-off-road crashes, especially at sites with long, steep sideslopeswhere vehicles are likely to travel to the bottom of these embankments. Though it willreduce severe crashes, guardrail may increase crash frequency in some cases because a rigidobject is placed closer to the roadway than trees or other objects.
• Modify roadside clear zone. Change to the sideslope or roadside clear zone can help reducethe likelihood and severity of tree crashes. For example, flatter sideslopes are known toreduce the probability of rollover and fixed-object collisions. In addition to flatteningsideslope, other roadside improvements include grading sideslope to allow for easier vehiclerecovery and clearing the roadside of objects. Like other countermeasures, this strategyrequires adequate funding, but it can be used as a complement to the tree removal strategy.
Head-On Crashes15
• Install centerline rumble strips on two-lane roads. The design and purpose of centerlinerumble strips is similar to that of shoulder and mid-lane rumble strips. Instead of preventingdrivers from entering the shoulder and side of the road, centerline rumble strips alert driversthat they are crossing into the opposing traffic lane on a two-lane road. As for other types ofrumble strips, snow removal, other maintenance, and increased noise are limitations ofcenterline rumble strips.
• Reconstruct roadways with a “super-two” cross-section and alignment design. This typeof design uses wider lanes, wider shoulders, and a high-speed alignment with 100 percentpassing sight distance. Yet, each of these improvements are made to a two-lane roadwayinstead of making a more costly conversion to a four-lane divided facility. Therefore, the“super-two” design is a lower-cost method of minimizing both run-off-road and head-oncrashes. Though the technique is less expensive than building a divided roadway, the cost ofreconstruction remains a constraint to this countermeasure.
• Convert four-lane undivided arterials to two-lanes with a center left-turn lane. Thisstrategy reduces head-on crashes by giving left-turning drivers a more protected location todecide when to turn into a gap in the oncoming traffic. By moving left-turning drivers out ofthe through-lane, they will be able to find an adequate gap without worrying about beinginvolved in a rear-end crash and other drivers will be able to pass the left-turning vehiclewithout changing lanes. Converting four-lane undivided roads to two with left-turn lane alsocreates a greater median clear zone between opposing directions of traffic. In addition, thistype of conversion can increase the mobility and safety of pedestrians and bicyclists,

67
especially when some of the available right-of-way is used for new bicycle lanes andsidewalks16. This type of conversion should not be used on high-traffic roadways where thecongestion resulting from the lane reduction may cause drivers to use routes that are less safethan the original four-lane design.
• Use positive separators for opposing lanes. Instead of using a “super-two” design,opposing traffic is separated by a cable barrier placed in a four-foot paved median. Thisdesign has resulted in a large reduction in serous head-on crashes in Sweden17. Constraintsto implementing this treatment include increased maintenance, difficulties with snowremoval, and a high cost due to the amount of reconstruction needed.
• Provide alternating passing zones or four-lane sections at key locations. Thiscountermeasure involves the construction of alternating passing zones or short four-lanesections at locations that have a large number of passing-related crashes. Because the majorthrough-flows of traffic would be directed to the non-passing outside lanes, the number ofhead-on crashes would be reduced because of the wider space separating opposing traffic.Though the primary target of this treatment is head-on crashes resulting from passingmaneuvers, the treatment would help prevent non-passing head-on crashes. The majordrawback to this strategy is the high cost of reconstruction and possible right-of-wayacquisition.
• Restrict truck traffic at selected locations. Because head-on crashes are more severe whena large truck is involved, decreasing the number of large trucks on high-speed, high volumeroutes without medians should reduce severe injuries. This countermeasure would targetsections of two-lane rural routes that have a high rate of head-on crashes involving trucks.Yet, restrictions of this type are limited by political constraints. Therefore, successfulimplementation of this strategy would require identification of safer alternative truck routes,and the cooperation of law enforcement agencies and the trucking industry.
• Install median barriers on narrow-width medians. Median barriers prevent vehicles fromcrossing into oncoming traffic. Though they may not reduce the frequency of crashes, theywill result in decreased injury severity.
Pedestrian Crashes
There are more than 50 specific pedestrian crash types that can be addressed by a wide variety ofcountermeasures. Yet, some treatments are inappropriate for certain crash types and highlyeffective for others. For example, installing a sidewalk will help to prevent walking-along-roadway crashes but may do little to reduce midblock dart/dash and multiple threat crashes,which involve crossing the street. Therefore, crash types must be understood before appropriatecountermeasures can be implemented. The FHWA has simplified the process of typingpedestrian crashes by consolidating the specific crash types into 13 crash groups. These crashgroups are summarized below and appropriate countermeasures for each group are given inFigure 31. For further information, see the FHWA Pedestrian Facilities User Guide, ProvidingSafety and Mobility18.

68
Pedestrian Crash Groups:
1. Midblock: Dart/Dash. The pedestrian walked or ran into the roadway and was struck by avehicle. The motorist’s view of the pedestrian may have been blocked until an instant beforethe impact.
2. Multiple Threat. The pedestrian entered the traffic lane in front of stopped traffic and wasstruck by a vehicle traveling in the same direction as the stopped vehicle. The stoppedvehicle may have blocked the sight distance between the pedestrian and the striking vehicle.
3. Mailbox or other Midblock. The pedestrian was struck while getting into or out of astopped vehicle or while crossing the road to/from a mailbox, newspaper box, etc.
4. Failure to Yield at Unsignalized Location. The pedestrian stepped into the roadway andwas struck by a vehicle at an unsignalized intersection or midblock location. The motoristfailed to yield to the pedestrian and/or the pedestrian stepped directly into the path of theoncoming vehicle.
5. Bus-Related. The pedestrian was struck by a vehicle either: (1) by crossing in front of acommercial bus stopped at a bus stop, or (2) going to or from a school bus stop.
6. Turning Vehicle at Intersection. The pedestrian was attempting to cross at an intersectionand was struck by a vehicle that was turning right or left.
7. Through Vehicle at Intersection. The pedestrian was struck at a signalized or unsignalizedintersection by a vehicle that was traveling straight ahead.
8. Walking Along Roadway. The pedestrian was walking or running along the roadway andwas struck from the front or from behind by a vehicle.
9. Working/Playing in Road. A vehicle struck a pedestrian who was (1) standing or walkingnear a disabled vehicle, (2) riding a play vehicle that was not a bicycle, (3) playing in theroad, or (4) working in the road.
10. Not in Road (Sidewalk, Driveway, Parking Lot, or Other). The pedestrian was standingor walking near the roadway edge, on the sidewalk, in a driveway or alley, or in a parking lotwhen struck by a vehicle.
11. Backing Vehicle. The pedestrian was struck by a backing vehicle on a street, in a driveway,on a sidewalk, in a parking lot, or at another location.
12. Crossing an Expressway. The pedestrian was crossing a limited access expressway orexpressway ramp when struck by a vehicle.
13. Miscellaneous. This category includes all other pedestrian crash types, such as: intentionalcrashes, driverless vehicle, a secondary crash after a vehicle-vehicle-collision, a pedestrianstruck by falling cargo, emergency vehicle striking a pedestrian, a pedestrian standing orlying in the road, or other/unknown circumstances.
The countermeasures in Figure 31 are listed along with the types of pedestrian crashes that theymay help to reduce.
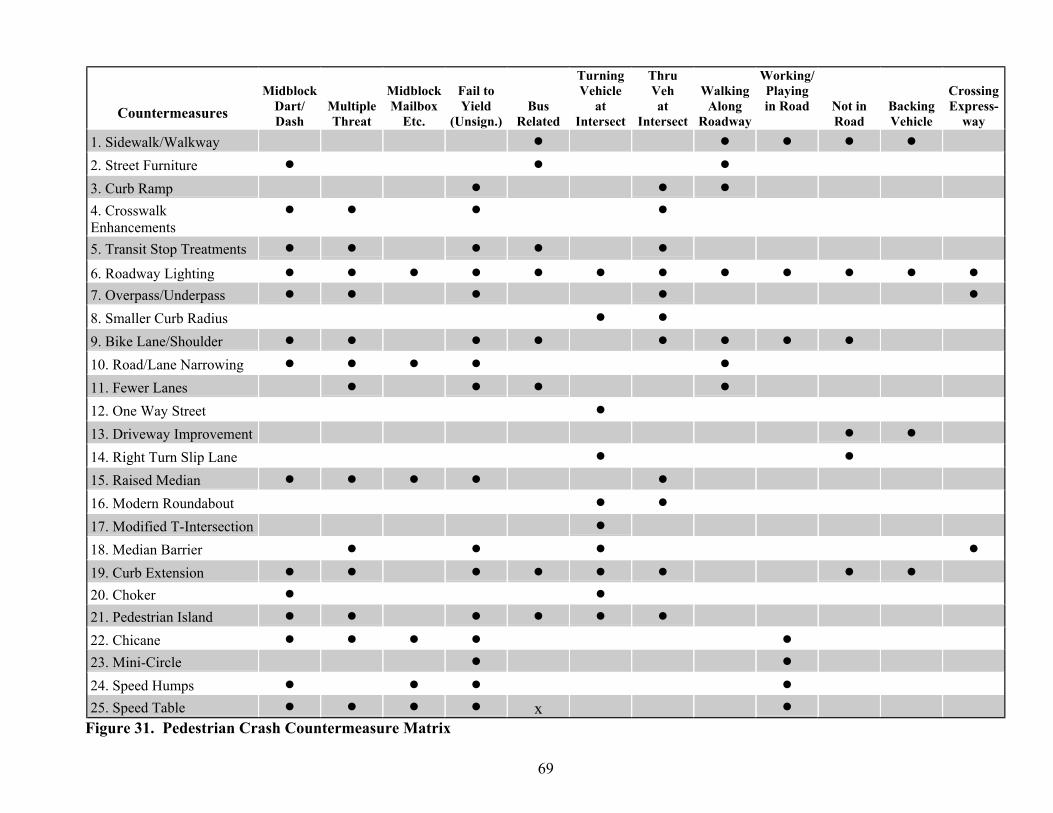
69
CountermeasuresMidblock
Dart/Dash
MultipleThreat
MidblockMailbox
Etc.
Fail toYield
(Unsign.)Bus
Related
TurningVehicle
atIntersect
ThruVehat
Intersect
WalkingAlong
Roadway
Working/Playingin Road Not in
RoadBackingVehicle
CrossingExpress-
way1. Sidewalk/Walkway ! ! ! ! !
2. Street Furniture ! ! !
3. Curb Ramp ! ! !
4. CrosswalkEnhancements
! ! ! !
5. Transit Stop Treatments ! ! ! ! !
6. Roadway Lighting ! ! ! ! ! ! ! ! ! ! ! !
7. Overpass/Underpass ! ! ! ! !
8. Smaller Curb Radius ! !
9. Bike Lane/Shoulder ! ! ! ! ! ! ! !
10. Road/Lane Narrowing ! ! ! ! !
11. Fewer Lanes ! ! ! !
12. One Way Street !
13. Driveway Improvement ! !
14. Right Turn Slip Lane ! !
15. Raised Median ! ! ! ! !
16. Modern Roundabout ! !
17. Modified T-Intersection !
18. Median Barrier ! ! ! !
19. Curb Extension ! ! ! ! ! ! ! !
20. Choker ! !
21. Pedestrian Island ! ! ! ! ! !
22. Chicane ! ! ! ! !
23. Mini-Circle ! !
24. Speed Humps ! ! ! !
25. Speed Table ! ! ! ! x !
Figure 31. Pedestrian Crash Countermeasure Matrix
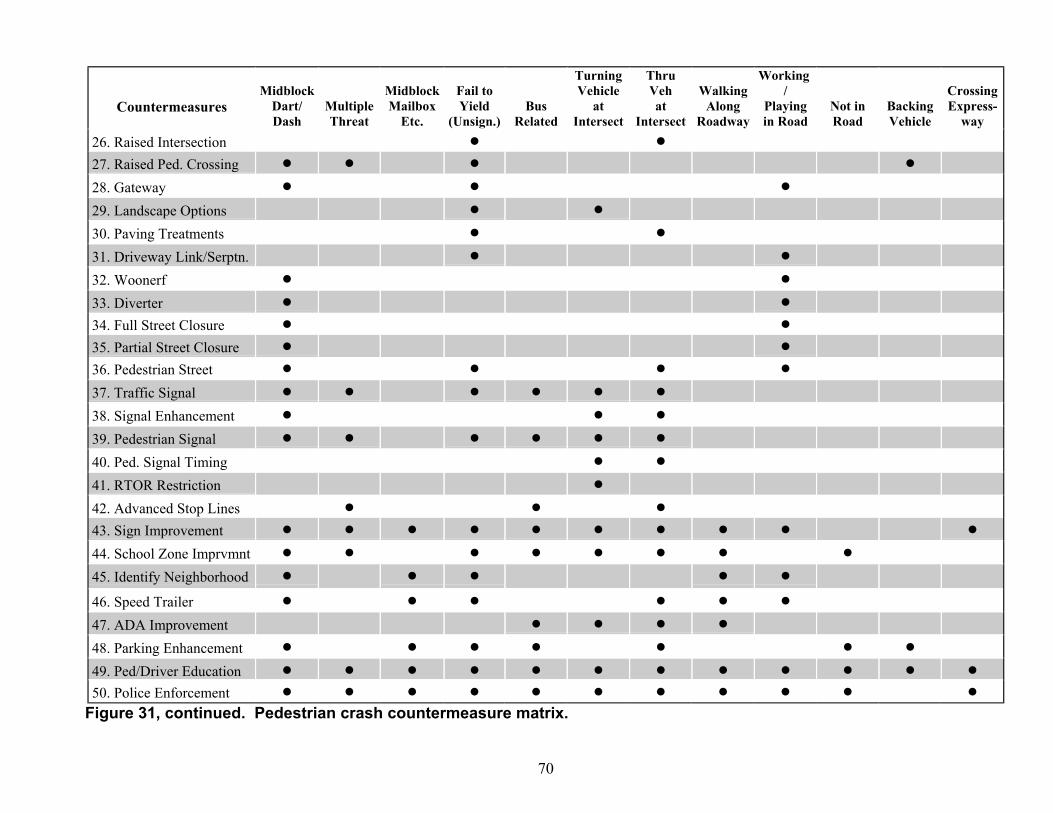
70
CountermeasuresMidblock
Dart/Dash
MultipleThreat
MidblockMailbox
Etc.
Fail toYield
(Unsign.)Bus
Related
TurningVehicle
atIntersect
ThruVehat
Intersect
WalkingAlong
Roadway
Working/
Playingin Road
Not inRoad
BackingVehicle
CrossingExpress-
way26. Raised Intersection ! !
27. Raised Ped. Crossing ! ! ! !
28. Gateway ! ! !
29. Landscape Options ! !
30. Paving Treatments ! !
31. Driveway Link/Serptn. ! !
32. Woonerf ! !
33. Diverter ! !
34. Full Street Closure ! !
35. Partial Street Closure ! !
36. Pedestrian Street ! ! ! !
37. Traffic Signal ! ! ! ! ! !
38. Signal Enhancement ! ! !
39. Pedestrian Signal ! ! ! ! ! !
40. Ped. Signal Timing ! !
41. RTOR Restriction !
42. Advanced Stop Lines ! ! !
43. Sign Improvement ! ! ! ! ! ! ! ! ! !
44. School Zone Imprvmnt ! ! ! ! ! ! ! !
45. Identify Neighborhood ! ! ! ! !
46. Speed Trailer ! ! ! ! ! !
47. ADA Improvement ! ! ! !
48. Parking Enhancement ! ! ! ! ! ! !
49. Ped/Driver Education ! ! ! ! ! ! ! ! ! ! ! !
50. Police Enforcement ! ! ! ! ! ! ! ! ! ! !
Figure 31, continued. Pedestrian crash countermeasure matrix.

71
Bicycle Crashes19
• Widen outside roadway lanes or add bicycle lanes. This strategy is used increase theamount of space for bicyclists on major urban streets with high traffic volumes and speeds.It can be achieved by widening or restriping the roadway. Wide outside roadway lanesshould be between 14 and 15 feet (compared to normal 12 foot lanes) and bicycle lanesshould be at least five feet wide. Like other improvements, wide outside lanes and bicyclelanes can also be included during roadway construction.
• Use traffic calming techniques. This countermeasure is most effective in residential areaswhere traffic volumes and speeds are high. Because children are most often involved inbicycle crashes on residential streets19, they will receive the greatest benefit from slowerautomobile speeds resulting from traffic circles, speed humps, chicanes and other trafficcalming techniques. Traffic calming measures should be implemented with the involvementof neighborhood residents.
• Construct median crossing areas on arterial roadways. Bicyclists often have difficultycrossing arterial roadways. By providing raised medians with thin curb cuts and connectingpaths, bicyclists will have a refuge for crossing high traffic, high volume streets.
• Provide funding for bicycle trail networks. By providing new trails, connecting existingsegments, and encouraging developers to include bicycle paths, there can be a greaterseparation of bicycle and vehicle traffic. This reduction in potential conflicts should result ina decrease in the overall number of bicycle crashes. In addition, trails are popular with thebicycling public. Yet, note that bicycle trails may cause safety problems at intersections.
• Modify roadway bridges. Many bridges have narrow outside lanes without shoulders,deteriorated deck surfaces, dangerous expansion joints, and high traffic volumes and speeds.These bridges can be modified to accommodate bicyclists by restriping lanes to add space forbicycles and repaving surfaces to increase bicycle stability. Though extremely costly,separate bridge facilities can be provided for bicyclists to relieve serious problems. Newbridges should be constructed with the needs of bicyclists in mind.
• Provide separate bridges or underpasses. This treatment is very expensive, but it allowsbicyclists to cross major roads at locations that can be accessed by the most bicyclists anddoes not require bicyclists to share the road with automobiles. The cost of bridges andunderpasses can be reduced by taking advantage of the topography where they are installed.
• Design signalized intersections to accommodate bicyclists. Most traffic-actuatedsignalized intersections are not able to detect bicycles, signal timing may be too short forbicyclists to complete crossing an intersection, and/or visibility of signal heads may not bevisible to bicyclists. Each of these factors may cause bicyclists to lose patience and crossagainst a red light, resulting in a higher number of bicycle crashes. Improvements that can bemade include installing bicycle-sensitive loop detectors, adjusting signal timing, and testingsignal heads for visibility. Providing bicycle-sensitive loop detectors may be relativelyinexpensive if done during initial construction.

72
• Improve rural road shoulders. Bicyclists riding on rural roads with narrow or no shouldersmust often share the roadway with high-speed, high-volume traffic and large trucks. Becausesevere bicycle crashes can result from this situation, smooth paved shoulders should beprovided on all new construction and reconstruction. If it is not possible to install shouldersduring construction, space should be provided for their addition at a later time. In addition,shoulders should be added and rumble strips should be restricted on popular bicycle routes.
Motorcycle Crashes
• Enforce mandatory helmet laws. A study by Rutledge and Stutts found that the risk ofhead injury in hospitalized motorcyclists was almost two times higher for unhelmeted riderscompared to helmeted riders. Helmet laws help prevent head injury to motorcyclists20.
• Develop special licensing requirements and require motorcycle driver training.Education may make motorcyclists develop safer riding habits so that they are involved infewer and less severe crashes.
• Improve roadway engineering. Treatments such as improving road shoulders, removingtrees and utility poles, upgrading deficient superelevation, and providing skid-resistantpavement surfaces will also improve the safety of motorcyclists.
Alcohol Crashes
• Provide engineering treatments. All engineering treatments listed in the sections above,especially those for curve, run-off-road, head-on, and nighttime crashes, will have theadditional benefit of reducing the number of crashes involving alcohol. For example,installing rumble strips may decrease the time it takes a intoxicated driver to realize that theyare in danger and to return to their lane. Straightening horizontal curves will reduce theamount of precision needed for turning so that an intoxicated driver can negotiate curvessafely. Yet, engineering treatments should be supplemented with enforcement and/oreducation countermeasures to ensure that drivers do not think that improved roadways makeit safe to drink and drive.
• Increase enforcement of drunk driving laws. Improving enforcement of drunk drivinglaws can help reduce the frequency of alcohol-related crashes. Enforcement can be improvedby increasing drunk driving penalties and increasing the frequency of random sobrietychecks.
• Use education programs. Educating drivers about the danger involved with driving whileintoxicated may prevent some drunk driving crashes. Yet, this countermeasure may not be aseffective as engineering and enforcement countermeasures.
Nighttime Crashes
• Provide new and improve existing street lighting. Improving nighttime lighting isespecially effective at preventing crashes involving pedestrians, many of which are serious orfatal.
• Provide other engineering treatments. Many engineering treatments listed above can helpreduce the number and severity of crashes occurring at night. For example, installing rumble
73
strips, adding guardrail, modifying the clear zone, and installing median barriers will helpreduce crashes where drowsy driving or alcohol are contributing factors.
CONCLUSIONS
This report summarizes the factors associated with serious and fatal injury crashes in NorthCarolina and suggests possible countermeasures to combat these contributing factors. Toachieve the greatest severe crash reduction, a systematic approach for identifying combinationsof severe crash factors should be followed. First, specific sites with a high number of severecrashes should be identified. Then, the significant contributing factors at those sites should beidentified and treated with appropriate countermeasures.
Significant severe crash factors identified earlier in the report include curve, run-off-road, utilitypole, tree, head-on, pedestrian, bicycle, darkness, and alcohol crashes. The countermeasuresrecommended in Part III can be used separately or in combination to reduce the number andseverity of crashes that occur as a result of these factors. Ultimately, reductions in these types ofcrashes will result in fewer severe injuries and fatalities on North Carolina roadways.

74
REFERENCES
1. Washington, S., J. Metarfo, I. Fomunung, R. Ross, F. Julian, and E. Moran, “An Inter-Regional Comparison: Fatal Crashes in the Southeastern and Non-Southeastern States:Preliminary Findings,” Accident Analysis and Prevention, 31, 135-146, 1999.
2. Tessmer, J. M, “Rural and Urban Crashes: A Comparative Analysis,” NHTSATechnical Report, Report No. HS-808 450, August 1996.
3. Zegeer, C. V., H. F. Huang, J. R. Stewart, and C. Williams, “Comparison of CrashRates and Characteristics in Eight States by Roadway Class,” UNC Highway SafetyResearch Center, January 1997, In Press, Transportation Research Board, 1999.
4. Leaf, W. A., D. F. Preusser, M. G. Solomon, “Analysis of Capital Beltway Crashes: Years1993-1996,” Preusser Research Group, Inc. and National Highway Traffic SafetyAdministration, December 1998.
5. Stamatiadis, S., S. Jones, and L. Aultman-Hall, “Causal Factors for Accidents onSoutheastern Low-Volume Rural Roads,” Transportation Research Record 1652, 1999.
6. Bared, J.G. and A. Vogt, "Highway Safety Evaluation System for Planning and PreliminaryDesign of Two-lane Rural Highways," Presented at 76th Annual Meeting of theTransportation Research Board, Washington, D.C., 1997.
7. Hummer, J., C. Hultgren, and Asad Khattak, "Identification of "Promising" sites onSecondary Highways Using Inventory Data," Submitted for Publication, 1999.
8. Zegeer, C., D. Reinfurt, T. Neuman, R. Stewart, and F. Council, “SafetyImprovements on Horizontal Curves for Two-Lane Rural Roads—Informational Guide,”Federal Highway Administration, Publication No. FHWA-RD-90-074, August 1991.
9. Council, F.M., “Run-off-Road Crashes,” Prepared for Draft AASHTO Strategic HighwaySafety Users Guide, UNC Highway Safety Research Center, 2000.]
10. Federal Highway Administration, HSIS Summary Report: Safety Evaluation of RolledIn Continuous Shoulder Rumble Strips Installed on Freeways, McLean, VA, Referencenumber: FHWA-RD-00-32, 1999.
11. Taylor, William C. and Thomas J. Foody, “Curve Delineation and Accidents: An Evaluationof Curve Delineation by Accident Analysis,” Prepared for Ohio Department of Highways,1966.
12. Zegeer, Charles V. and Michael J. Cynecki, “Selection of Cost-Effective Countermeasures or Utility Pole Accidents: Users Manual,” Federal Highway Administration, Publication No. FHWA-IP-84-13, July 1984.

75
13. Zegeer, Charles V. and Michael J. Cynecki, “Determination of Cost-EffectiveRoadway Treatments for Utility Pole Accidents,” Transportation Research Record 970,Transportation Research Board, National Research Council, 1984.
14. Zegeer, C.V., “Reducing Fatal Tree Crashes: A Briefing Paper,”Prepared for Draft AASHTO Strategic Highway Safety Users Guide, UNC HighwaySafety Research Center, June 20, 2000.]
15. Council, F.M., “Head-On Crashes,” Prepared for Draft AASHTO Strategic Highway SafetyUsers Guide, UNC Highway Safety Research Center, 2000.]
16. Burden, Dan and Peter Lagerway. “Road Diets: Fixing the Big Roads,” WalkableCommunies, Inc., March 1999.
17. Nettelblad, P., “Traffic Safety Effects of Passing (Climbing) Lanes: An AccidentAnalysis Based on data for 1972-1977,” Meddelande TU 1979-5, Swedish National RoadAdministration, 1979.
18. Federal Highway Administration, Pedestrian Facilities User Guide: Providing Access andSafety. Forthcoming, 2000.
19. Federal Highway Administration, Implementing Bicycle Improvements at the LocalLevel, 1998.
20. Rutledge, R., J.C. Stutts, B. Foil, D. Oller, and W. Meredith, “The Association of HelmetUse with the Outcome of Motorcycle Crash Injury When Controlling for Crash/InjurySeverity,” Accident Analysis and Prevention, 25(3): 347-353, 1993.
21. Stutts, J.C. and C. Martell, “An Examination of Motorcyclist Injuries and Costs Using NorthCarolina Motor Vehicle Crash and Trauma Registry Data,” University of North CarolinaHighway Safety Research Center, June 1992.
22. Institute of Transportation Engineers, Chapter 19, “Designing for Pedestrians,” The TrafficSafety Toolbox: A Primer on Traffic Safety, 1999.
23. Griffith, Michael S., “Safety Evaluation of Continuous Shoulder Rumble Strips Installed onFreeways,” Reference number: TRB No. 99-0162, 1999.
24. United States Department of Transportation, Bureau of Transportation Statistics. 1995Nationwide Personal Transportation Survey.

APPENDIX A COMPARISON OF NORTH CAROLINA WITH THESOUTHEAST AS A WHOLE
This appendix presents a more detailed comparison of fatal crashes in North Carolina with fatalcrashes in the eight Southeastern States that are part of FHWA Region IV, including NorthCarolina. To make this comparison, the Critical Analysis Reporting Environment (CARE)database was used. The CARE database contains 47,047 crashes in the Southeastern States as awhole (including North Carolina), occurring between 1993 and 1997. Of these, 6405 are inNorth Carolina. It should be kept in mind that a crash is fatal if one or more people in any of thevehicles involved die in the crash or within 30 days as a result of injuries suffered in the crash.Because North Carolina is contained in the eight Southeastern States, the results areconservative. According to the CARE web site (http://care.cs.ua.edu/care/sestudy.html), “thesignificance of the results of a comparison without North Carolina being included would be evenhigher than the significance indicated by the statistical test (alpha = 99 percent), since some ofthe difference is buffered out by its presence in the control.”
This section presents comparisons of North Carolina versus the eight Southeastern States(including North Carolina) for the following variables: roadway function class, first harmfulevent, manner of collision, relation to junction, relation to roadway, traffic flow, number oftravel lanes, speed limit, roadway alignment, roadway profile, roadway surface condition, trafficcontrol device, light condition, atmospheric condition, body type, rollover, vehicle maneuver,most harmful event, violations charged, driver factors, restraint system, alcohol involvement, andinjury severity. The categories that are over- or under-represented at the 99 percent level arelisted for each variable. The categories are listed in descending order according to “MAXGain”—see the “General Description of CARE Impact Outputs,” starting below. Thecomparisons do not include variable categories that are neither over- nor under-represented at the99 percent level.
A. GENERAL DESCRIPTION OF CARE IMPACT OUTPUTS (Adapted from http://care.cs.ua.edu/care/sestudy/overview.html)
The summaries given here are the result of CARE Information Mining (IMPACT) performed onFatal Accident Reporting System (FARS) data for the calendar years 1993-1997. These wereperformed to provide specific information for the SE Fatal Crash Study, and they are the result ofa complete analysis of all variables in the respective databases that have been converted toCARE. Each variable has its codes sorted such that it is in worst-first order. Thus, those factorswithin the variable that has the highest potential for crash reduction are listed at the top within
North Carolina vs.8 Southeastern States
North Carolina
NC Urban+Rural
PART I
PART II
PART III
FARS/CARE
North Carolina HSIS
NC HSIS and NC non-HSIS
Geographic Focus of Crash Analysis
Crash Database

each variable. The “MAX Gain” column is the number of crashes that would be reduced if theover-represented factor could be reduced to its expected value, all other things being equal.
For example, fatal crashes on rural minor collector roadways were over-represented in NorthCarolina compared to the Southeast as a whole (Figure A.1, Table B.1). While 9.9 percent offatal crashes were on rural minor collectors in North Carolina, only 5.6 percent of fatal crasheswere on rural minor collectors in the Southeast, meaning that North Carolina was over-represented by 77 percent (overrepresentation factor=(9.9-5.6)/5.6=0.77). If the percent of fatalcrashes on rural minor collectors was reduced to 5.6 percent, the number of fatalities in NorthCarolina would be reduced by 273. It is important to note that fatal crashes may be over-represented in North Carolina because it has more miles of rural minor collectors, because itsrural minor collectors are more dangerous than those in other states, or a combination of both.
B. ANALYSIS
Crash-level analysis
Note that the tables referenced in this section are contained in Appendix B.
1. Roadway Function Class (Table B.1)
Four roadway function classes were over-represented (at a 99 percent significance level) inNorth Carolina relative to the eight Southeastern States (Figure A.1):
1 Rural local road (19.9 percent in NC vs. 13.8 percent in the SE, meaning that NC wasover-represented by 44 percent. Therefore, the overrepresentation factor=(19.9-13.8)/13.8=0.44)
2. Rural minor collector (9.9 percent vs. 5.6 percent, 0.75)3. Rural major collector (17.6 percent vs. 14.2 percent, 0.24)4. Urban local road (11.4 percent vs. 8.1 percent, 0.40)
Five roadway function classes were under-represented in North Carolina (note that under-represented characteristics are assigned a negative value):
1. Rural principal arterial (14.2 percent in NC vs. 17.8 percent in the SE,underrepresentation factor=(5.8-4.7)/4.7=-0.25)
2. Urban principal arterial (4.2 percent vs. 9.0 percent, -1.14)3. Urban major collector (6.2 percent vs. 7.5 percent, -0.21)4. Rural minor arterial (8.3 percent vs. 10.6 percent, -0.28)5. Urban minor arterial (5.8 percent vs. 8.9 percent, -0.53)
2. First Harmful Event (Table B.2)
The first harmful events that were over-represented in North Carolina (compared to otherSoutheastern States) were (Figure A.2):

Figure A.1. Roadway function class--overrepresented and underrepresented
-1.14
-0.53
-0.25
-0.28
-0.21
0.40
0.24
0.76
0.44
-1.50 -1.00 -0.50 0.00 0.50 1.00
Roa
dway
Fun
ctio
n C
lass
Underrepresentation Factor/Overrepresentation Factor
Rural Local Road
Rural Minor Collector
Rural Major Collector
Urban Local Road
Urban Major Collector
Rural Minor Arterial
Rural Principal Arterial
Urban Minor Arterial
Urban Principal Arterial

Figure A.2. First harmful event--overrepresented and underrepresented
-0.71
-0.14
-0.83
1.23
0.39
1.35
-1.00 -0.50 0.00 0.50 1.00 1.50
Firs
t Har
mfu
l Eve
nt
Underrepresentation Factor/Overrepresentation Factor
Bridge Rail
Embankment - Unknown Type
Ditch
Overturn
Tree
Other Fixed Object

1. Ditch (8.4 percent in NC vs. 3.8 percent in the SE, overrepresentation factor = 1.23)2. Embankment—unknown (2.4 percent vs. 1.7 percent, 0.39)3. Bridge rail (1.1 percent vs. 0.5 percent, 1.35)
These first harmful events were under-represented in North Carolina:
1. Other fixed object (0.7 percent vs. 1.2 percent, -0.71)2. Tree (8.8 percent vs. 10.0 percent, -0.14)3. Overturn (4.0 percent vs. 7.3 percent, -0.83)
Both the over- and under-represented events were associated with run-off-road crashes. Treeswere under-represented as the first harmful event (8.8 percent) but over-represented as the mostharmful event (13.6 percent; Table B.18). This suggests that vehicles may hit something else,such as a guardrail or embankment, before coming to rest against a tree.
3. Manner of Collision (Table B.3)
Fatal head-on crashes were over-represented in North Carolina. This may be partly due to theexistence of more high-speed travel on two-lane rural roads in North Carolina compared to otherSoutheastern States.
4. Relation to Junction (Table B.4)
Non-intersection fatal crashes at driveways and alleys were over-represented in North Carolina.Non-intersection fatal crashes at ramps, intersections, and non-junctions were underrepresented.
5. Relation to Roadway (Table B.5)
Roadside, shoulder, and outside right-of-way were over-represented in North Carolina comparedto all Southeastern States. These happen with run-off-road crashes, which were fairly common(about one-fourth of all crashes).
6. Trafficway Flow (Table B.6)
Fatal crashes were over-represented on roads that were not divided and on roads that hadmedians with barriers, including guardrail shielding bridge piers. Perhaps North Carolina has ahigher proportion of two-lane, undivided roads, and/or head-on crashes (which often happen ontwo-lane roads and which are often severe), compared to the other Southeastern States. Orperhaps North Carolina’s two-lane roads are more dangerous than two-lane roads in otherSoutheastern States. Roads that had medians but no barriers were underrepresented.
7. Number of Travel Lanes (Table B.7)
Two-lane roads were over-represented among fatal crashes in North Carolina. This reflectseither a higher-than-average proportion of two-lane roads and/or head-on crashes (which often

happen on two-lane roads and which are often severe). Three- and six-lane roads wereunderrepresented.
8. Speed Limit (Table B.8)
Speed limits of 51 - 55 MPH and 31 - 35 MPH were over-represented in North Carolina, whereasspeed limits of 21 - 25, 61 - 65, and 46 - 50 MPH were underrepresented. Theoverrepresentation of 51 -55 MPH speed limits is likely the result of North Carolina having ahigher proportion of travel occurring on roads with a 55 MPH speed limit, compared to theSoutheastern States as a whole. It should be noted that speed limits on many rural freeways wereincreased between 1993 and 1997.
9. Roadway Alignment (Table B.9)
Fatal crashes on curves were over-represented in North Carolina, and straight roads wereunderrepresented.
10. Roadway Profile (Table B.10)
Sag, level, and hillcrest were over-represented. It is not clear why grade was underrepresented.
11. Roadway Surface Condition (Table B.11)
Compared to the Southeastern States, icy roads were over-represented in North Carolina, and dryroads were underrepresented. Ice may be more of a problem in North Carolina (especially in thepopulated Piedmont region) than in some of the other Southeastern States. Snow may be morecommon than ice in Kentucky, for example, and most of Florida is too warm for either ice orsnow.
12. Traffic Control Device (Table B.12)
Fatal crashes were over-represented at locations with no controls and at locations with controlsbut no pedestrian signals. Many of the locations with no controls were two-lane rural roads.Many locations with controls but no pedestrian signals were rural intersections. Fatal crasheswere under-represented where flash controls or controls with unknown pedestrian signal statuswere present.
13. Light Condition (Table B.13)
Dark, dawn, and dusk were over-represented, while dark but lighted was underrepresented. Darkbut lighted conditions were more common on urban roads. If North Carolina has fewer urbanroads than some of the other Southeastern States, then the proportion of fatal crashes on suchroads will also be lower than the Southeast as a whole.

14. Atmospheric Condition (Table B.14)
Rain, sleet, and sleet and fog were all over-represented. Fog and normal conditions were bothunderrepresented.Vehicle and driver level analysis
(from http://care.cs.ua.edu/care/sestudy/overview.html)“Note: the vehicle and driver variables that follow apply to the unit considered to be the causalunit. FARS does not specify the causal unit. Thus, an algorithm is applied that weights all of therelevant factors related to the unit. The unit with the highest weight is considered to be thecausal unit. For example, the presence of a high BAC would have a high weighting factor indetermining causation. This enhancement of the data is valuable since we are most interested incharacteristics of the unit that has the highest probability of being the causal unit as opposed tobeing the innocent victim unit. It is recognized that there are times when two units contributeequally, but in this case either vehicle will serve for statistical purposes. There is only onevehicle/driver considered per crash in the variables that are summarized below.”
1. Body Type (Table B.15)
Compact pickups, unknown auto types, and SUT HI GVW (single-unit truck, high gross vehicleweight) were over-represented. Three-door and two-door hatchbacks, and standard pickups wereunderrepresented.
2. Rollover (Table B.16)
Rollover as a subsequent event was over-represented. Vehicles were likely to strike a guardrailor other fixed object before rolling over.
3. Vehicle Maneuver (Table B.17)
Three maneuvers – negotiating curve, starting in lane, and unknown – were over-represented(Figure A.3). In fact, negotiating curve was the maneuver used by nearly 30 percent of the at-fault drivers. This finding is consistent with the finding that curves were over-represented infatal crashes (Table B.9). The under-represented maneuvers were stopped in lane, changinglanes, left turn, and going straight.
4. Most Harmful Event (Table B.18)
The most harmful events that were over-represented in North Carolina were:
1. Tree (13.6 percent in NC vs. 12.0 percent in the SE, overrepresentation factor = 0.13)2. Vehicle in transport – other (1.6 percent vs. 1.0 percent, 0.60)3. Immersion (1.1 percent vs. 0.7 percent, 0.45)4. Ditch (1.4 percent vs. 1.1 percent, 0.32)5. Building (0.6 percent vs. 0.3 percent, 0.90)6. Bridge rail (0.5 percent vs. 0.3 percent, 0.72)

Figure A.3. Vehicle maneuver--overrepresented and underrepresented
-0.16
-0.58
-1.70
-0.77
1.72
0.56
-2.00 -1.50 -1.00 -0.50 0.00 0.50 1.00 1.50 2.00
Vehi
cle
Mae
uver
Underrepresentation Factor/Overrepresentation Factor
Negotiate Curve
Starting in Lane
Stopped in Lane
Changing Lanes
Left Turn
Going Straight

The most harmful events that were under-represented in North Carolina were:
1. Culvert (0.6 percent in NC vs. 1.0 percent in the SE, underrrepresentation factor=-0.67)2. Utility pole (2.0 percent vs. 3.0 percent, -0.50)3. Overturn (14.1 percent vs. 15.2 percent, -0.08)
Several of the over-represented events were associated with run-off-road crashes, whichcomprised about one-fourth of all crashes, and which had higher percentages of K+A than allcrashes (see Table B.3). On the other hand, the under-represented events were also associatedwith run-off-road crashes.
Trees were under-represented as the first harmful event (8.8 percent) but over-represented as themost harmful event (13.6 percent, Table B.18). This suggests that vehicles may hit somethingelse, such as a guardrail or embankment, before coming to rest against a tree.
5. Violations Charged (Table B.19)
Among violations charged, those that were over-represented were:
1. Alcohol or drugs and speeding (8.8 percent in NC vs. 1.5 percent in the SE,overrepresentation factor = 4.72)
2. Other moving (8.1 percent vs. 4.9 percent, 0.64)3. Speeding (4.0 percent vs. 1.0 percent, 3.07)4. Alcohol or drugs (4.9 percent vs. 2.3 percent, 1.17)
These data seem to be inconsistent with alcohol involvement (Table B.24), which show thatdrivers with no alcohol involvement were over-represented. These data could suggest that NorthCarolina devotes more effort to enforcing alcohol and speeding laws than other parts of theSoutheast.
Under-represented violations were non-moving, unknown, and none.
6. First, Second, and Third Related Factors – Driver (Tables B.20, B.21, B.22)
These related factors were over-represented in North Carolina:
First (Figure A.4)Driving too fastImproper lane changeWrong side of roadHomicideErratic/recklessWrong way

Figure A.4. First related factor - driver--overrepresented and underrepresented
-1.24
-0.41
-2.25
-1.96
-0.37
1.30
0.11
1.94
2.90
3.65
1.21
-3.00 -2.00 -1.00 0.00 1.00 2.00 3.00 4.00
Firs
t Rel
ated
Fac
tor
Underrepresentation Factor/Overrepresentation Factor
Driving Too Fast
Improper Lane Change
Wrong Side of Road
Homicide
Erratic/Reckless
Wrong Way
Failure to Obey
Drowsy/Asleep
High Speed Chase
Run Off Road/Lane
Failure to Yield
SecondWrong side of roadErratic / recklessHomicideFailure to yieldHigh-speed chaseStopping in roadLocked wheelOperator inexperienceUnfamiliar with road
ThirdHomicideErratic / recklessRun off road / laneWrong side of roadEmotionalImproper lightsProhibited passingUnfamiliar with roadWrong signalAnimal
Other related factors were under-represented in North Carolina:
First (Figure A.4)Failure to obeyDrowsy, asleepHigh-speed chaseRun off road / laneFailure to yield
SecondNoneRun off road / laneDriving too fast
ThirdDriving too fast
It is not known whether North Carolina’s drivers are in fact more likely to drive too fast, changelanes improperly, etc., than their counterparts in other Southeastern States. Instead, it is likelythat states differ in how consistently these factors are noted. For example, if “driving too fast” isoften recorded as a related factor in North Carolina but not in other states, then “driving too fast”will appear to be over-represented, even if North Carolina’s drivers are not more inclined todrive too fast.

7. Restraint System – Use (Table B.23)
The use of restraints was coded for the drivers of “at-fault” vehicles. It should be kept in mindthat not every driver who “caused” the crash was killed. These categories of restraint system usewere over-represented in North Carolina.
1. Lap and shoulder (51.5 percent in NC vs. 32.8 percent in the SE, overrepresentationfactor=0.57)
2. Unknown (10.8 percent vs. 7.4 percent, 0.47)3. Lap belt (3.2 percent vs. 2.0 percent, 0.55)4. Motorcycle helmet (3.1 percent vs. 2.5 percent, 0.24)
Drivers who did not use restraints or for whom restraint use data were not available wereunderrepresented.
The overrepresentation of restraints probably reflects the fact that 80 percent or so of NorthCarolina’s drivers buckle up, thanks to high-profile education and enforcement programs. Inother words, a higher percentage of drivers in North Carolina were buckled up than in manyother states. As a result, North Carolina accounted for a bigger share of buckled-up drivers inthe Southeast than it did for total drivers in the Southeast. It is also believed that officers inNorth Carolina were more likely to record whether drivers were using restraints, than officers inother Southeastern States. Therefore, drivers who used restraints were over-represented.
8. Alcohol Involvement (Table B.24)
“Causal” vehicles in which alcohol was not involved or where alcohol involvement was notreported were over-represented. With a value of 17.0 percent, alcohol involvement wasunderrepresented, as was unknown alcohol involvement. This means that North Carolina has alower proportion of alcohol-related crashes than the Southeastern States as a whole. This may bethe result of North Carolina’s aggressive enforcement of DWI laws, leading to fewer peopledriving soon after consuming alcohol. However, the data in Table B.24 seem to be inconsistentwith violations charged (Table B.19), which show that alcohol/ drugs were over-represented.
9. Injury Severity (Table B.25)
This variable refers to injury severity for the driver of the vehicle that “caused” the crash, i.e., theat-fault driver. The over-represented categories were possible, incapacitating, and unknown. Noinjury and fatal injury were underrepresented. In other words, the driver of the vehicle thatcaused the crash was less likely to be killed in North Carolina compared to the SoutheasternStates (47.9 vs. 49.9 percent). It should be kept in mind that a crash is fatal if one or morepeople in any of the vehicles involved die in the crash or within 30 days as a result of injuriessuffered in the crash. Not every driver who “caused” the crash was killed.

APPENDIX B: CARE DATA TABLES

CARE IMPACT OUTPUT B NORTH CAROLINANORTH CAROLINA (SUBSET) VS. 8 SE STATES (OTHER)
The CARE IMPACT output given below compares the fatal crashes in North Carolina againstthose for the 8 SE States in general. This gives a conservative overview of how North Carolinadiffers from the rest of states in the SE region. The reason that it is conservative is that NorthCarolina is also contained in the 8 SE states. This means that the significance of the results of acomparison without North Carolina being included would be even higher than the significanceindicated by the statistical test (alpha = 99%), since some of the difference is buffered out by itspresence in the control.

TABLE B.1: ROADWAY FUNCTION CLASS Subset Subset Other Other OveRep MAXCode Description Freq % Freq % Factor Gain------------------------ ------ ------ ------ ------ ------ ------ 6 RUR LOCAL ROAD OR ST 1273 19.875 6514 13.846 1.435* 386.181 5 RUR MINOR COLLECTOR 634 9.899 2651 5.635 1.757* 273.092 4 RUR MAJOR COLLECTOR 1128 17.611 6696 14.233 1.237* 216.403 16 URB LOCAL ROAD OR ST 727 11.351 3808 8.094 1.402* 208.577 15 URB MINOR COLLECTOR 160 2.498 1107 2.353 1.062 9.293 20 UNKNOWN 8 0.125 508 1.080 0.116 -61.159 1 RUR PRIN ARTERIAL - 298 4.653 2710 5.760 0.808* -70.941 11 URB PRIN ARTERIAL - 173 2.701 1861 3.956 0.683* -80.357 14 URB MAJOR COLLECTOR 396 6.183 3508 7.456 0.829* -81.581 3 RUR MINOR ARTERIAL 530 8.275 4967 10.558 0.784* -146.210 2 RUR PRIN ARTERIAL - 611 9.539 5664 12.039 0.792* -160.100 13 URB MINOR ARTERIAL 372 5.808 4185 8.895 0.653* -197.748 12 URB PRIN ARTERIAL - 95 1.483 2393 5.086 0.292* -230.784
TABLE B.2: FIRST HARMFUL EVENT Subset Subset Other Other OveRep MAXCode Description Freq % Freq % Factor Gain------------------------ ------ ------ ------ ------ ------ ------ 34 DITCH 537 8.384 1769 3.760 2.230* 296.168 12 VEH IN TRANSP 2717 42.420 19624 41.711 1.017 45.380 37 EMBANK-UNK 153 2.389 807 1.715 1.393* 43.135 23 BRIDGE RAIL 71 1.109 222 0.472 2.349* 40.777 8 PEDESTRIAN 867 13.536 6107 12.981 1.043 35.590 32 CULVERT 153 2.389 986 2.096 1.140 18.766 9 PEDALCYCLE 162 2.529 1104 2.347 1.078 11.701 19 BUILDING 18 0.281 88 0.187 1.502 6.020 31 OTHER POST/POLE 53 0.827 351 0.746 1.109 5.215 13 VEH IN TRANS OTH 94 1.468 665 1.413 1.038 3.467 21 BRIDGE PIER 34 0.531 233 0.495 1.072 2.279 14 PARKED MOTOR VEH 54 0.843 383 0.814 1.036 1.858 41 SHRUBBERY 5 0.078 24 0.051 1.530 1.733 30 UTILITY POLE 193 3.013 1407 2.991 1.008 1.450 20 IMPACT ATTENUATR 3 0.047 16 0.034 1.377 0.822 22 BRIDGE PARAPET 11 0.172 75 0.159 1.077 0.789 29 LIGHT SUPPORT 3 0.047 21 0.045 1.049 0.141 2 FIRE/EXPLOSION 1 0.016 7 0.015 1.049 0.047 15 OTHER NON-MOT 5 0.078 38 0.081 0.966 -0.173 28 OVERHEAD SIGN 1 0.016 11 0.023 0.668 -0.498 26 OTHER L-BARRIER 1 0.016 12 0.026 0.612 -0.634 40 FIRE HYDRANT 2 0.031 21 0.045 0.700 -0.859 11 ANIMAL 14 0.219 114 0.242 0.902 -1.520 16 OBJ THROWN/FALL 2 0.031 26 0.055 0.565 -1.540 7 OTHER NON-COLL 3 0.047 48 0.102 0.459 -3.535 17 BOULDER 1 0.016 35 0.074 0.210 -3.765 3 IMMERSION 6 0.094 74 0.157 0.596 -4.074 36 EMBANK-ROCK 6 0.094 87 0.185 0.507 -5.844 39 WALL 14 0.219 163 0.346 0.631 -8.191 25 CONCRETE BARRIER 11 0.172 141 0.300 0.573 -8.196 5 FELL FROM VEH 34 0.531 313 0.665 0.798 -8.612

33 CURB 41 0.640 366 0.778 0.823 -8.827 18 OTH NON-FIX OBJ 21 0.328 243 0.517 0.635 -12.082 10 RAIL TRAIN 40 0.625 395 0.840 0.744 -13.775 27 HWY SIGN POST 37 0.578 395 0.840 0.688 -16.775 24 GUARDRAIL 115 1.795 977 2.077 0.865 -18.009 38 FENCE 45 0.703 464 0.986 0.712 -18.169 43 OTHER FIXED OBJ 45 0.703 576 1.224 0.574* -33.417 35 EMBANK-EARTH 8 0.125 458 0.973 0.128 -54.352 42 TREE 566 8.837 4713 10.018 0.882* -75.630 1 OVERTURN 258 4.028 3437 7.305 0.551* -209.915TABLE B.3: MANNER OF COLLISION Subset Subset Other Other OveRep MAXCode Description Freq % Freq % Factor Gain------------------------ ------ ------ ------ ------ ------ ------ 2 HEAD-ON 1345 20.999 7127 15.149 1.386* 374.727 1 REAR-END 294 4.590 2232 4.744 0.968 -9.866 6 S-SWIPE:OPP DIR 21 0.328 269 0.572 0.573* -15.622 5 S-SWIPE:SAME DIR 20 0.312 345 0.733 0.426* -26.968 0 NOT COL W/ MVIT 3594 56.112 26740 56.837 0.987 -46.396 4 ANGLE 1131 17.658 10202 21.685 0.814* -257.905
TABLE B.4: RELATION TO JUNCTION Subset Subset Other Other OveRep MAXCode Description Freq % Freq % Factor Gain------------------------ ------ ------ ------ ------ ------ ------ 4 NON-INT DR,ALLEY 625 9.758 1384 2.942 3.317* 436.582 3 NON-INT INT REL 133 2.077 917 1.949 1.065 8.159 7 NON-INT X-OVER 13 0.203 59 0.125 1.618 4.968 11 INT INTER REL 15 0.234 79 0.168 1.395 4.245 14 INT X-OVER 4 0.062 10 0.021 2.938 2.639 13 INT RAMP 16 0.250 105 0.223 1.119 1.705 12 INT DRIVEWAY 4 0.062 30 0.064 0.979 -0.084 9 NON-INT UNKNOWN 1 0.016 9 0.019 0.816 -0.225 15 INT OTHER 2 0.031 73 0.155 0.201 -7.938 6 NON-INT RAILXING 40 0.625 402 0.854 0.731 -14.728 5 NON-INT RAMP 21 0.328 278 0.591 0.555* -16.847 2 NON-INT INTERSEC 1056 16.487 8668 18.424 0.895* -124.065 1 NON-INT NON-JUNC 4475 69.867 34232 72.761 0.960* -185.360
TABLE B.5: RELATION TO ROADWAY Subset Subset Other Other OveRep MAXCode Description Freq % Freq % Factor Gain------------------------ ------ ------ ------ ------ ------ ------ 4 ROADSIDE 1155 18.033 3537 7.518 2.399* 673.471 2 SHOULDER 769 12.006 2532 5.382 2.231* 424.292 5 OUTSIDE ROW 452 7.057 903 1.919 3.677* 329.065 1 ON ROADWAY 3933 61.405 28795 61.205 1.003 12.835 3 MEDIAN 95 1.483 691 1.469 1.010 0.927 7 PARKING LANE 1 0.016 15 0.032 0.490 -1.042
TABLE B.6: TRAFFICWAY FLOW Subset Subset Other Other OveRep MAX

Code Description Freq % Freq % Factor Gain------------------------ ------ ------ ------ ------ ------ ------ 1 NOT DIVIDED 5484 85.621 33715 71.662 1.195* 894.025 3 MEDIAN W/BARRIER 440 6.870 1496 3.180 2.160* 236.334 4 ONE WAY TRAFFIC 15 0.234 89 0.189 1.238 2.883 9 UNKNOWN 1 0.016 130 0.276 0.057 -16.698 2 MEDIAN-NO BARRIER 465 7.260 11617 24.692 0.294* -1116.544
TABLE B.7: NUMBER OF TRAVEL LANES Subset Subset Other Other OveRep MAXCode Description Freq % Freq % Factor Gain------------------------ ------ ------ ------ ------ ------ ------ 2 TWO LANES 5192 81.062 36172 76.885 1.054* 267.527 5 FIVE LANES 51 0.796 340 0.723 1.102 4.712 4 FOUR LANES 903 14.098 6641 14.116 0.999 -1.109 1 ONE LANE 2 0.031 206 0.438 0.071 -26.045 7 SEVEN OR MORE LANES 10 0.156 269 0.572 0.273 -26.622 3 THREE LANES 152 2.373 1778 3.779 0.628* -90.058 6 SIX LANES 95 1.483 1473 3.131 0.474* -105.535

TABLE B.8: SPEED LIMIT Subset Subset Other Other OveRep MAXCode Description Freq % Freq % Factor Gain------------------------ ------ ------ ------ ------ ------ ------ 11 51-55 MPH 3794 59.235 20840 44.296 1.337* 956.833 7 31-35 MPH 891 13.911 4979 10.583 1.314* 213.157 4 16-20 MPH 22 0.343 106 0.225 1.525 7.569 3 11-15 MPH 2 0.031 69 0.147 0.213 -7.394 12 56-60 MPH 5 0.078 103 0.219 0.357 -9.022 16 MISSING OR OUT OF RA 2 0.031 271 0.576 0.054 -34.894 5 21-25 MPH 63 0.984 926 1.968 0.500* -63.066 14 66-70 MPH 25 0.390 653 1.388 0.281* -63.900 9 41-45 MPH 1155 18.033 8974 19.075 0.945 -66.724 13 61-65 MPH 301 4.699 2864 6.088 0.772* -88.906 10 46-50 MPH 122 1.905 1889 4.015 0.474* -135.169 6 26-30 MPH 9 0.141 2416 5.135 0.027 -319.915 8 36-40 MPH 14 0.219 2863 6.085 0.036 -375.770 0 NO STATUTORY LIMIT 0 0.000 78 0.166 0.000 0.000
TABLE B.9: ROADWAY ALIGNMENT Subset Subset Other Other OveRep MAXCode Description Freq % Freq % Factor Gain------------------------ ------ ------ ------ ------ ------ ------ 2 CURVE 2173 33.927 12748 27.096 1.252* 437.482 1 STRAIGHT 4232 66.073 34225 72.746 0.908* -427.407
TABLE B.10: ROADWAY PROFILE Subset Subset Other Other OveRep MAXCode Description Freq % Freq % Factor Gain------------------------ ------ ------ ------ ------ ------ ------ 4 SAG 195 3.044 263 0.559 5.446* 159.195 1 LEVEL 4134 64.543 29369 62.425 1.034* 135.691 3 HILLCREST 285 4.450 1801 3.828 1.162* 39.811 2 GRADE 1791 27.963 15124 32.147 0.870* -267.988
TABLE B.11: ROADWAY SURFACE CONDITION Subset Subset Other Other OveRep MAXCode Description Freq % Freq % Factor Gain------------------------ ------ ------ ------ ------ ------ ------ 4 ICE 89 1.390 248 0.527 2.636* 55.237 2 WET 1034 16.144 7337 15.595 1.035 35.138 5 SAND DIRT OIL 1 0.016 3 0.006 2.448 0.592 3 SNOW OR SLUSH 16 0.250 115 0.244 1.022 0.344 8 OTHER 1 0.016 25 0.053 0.294 -2.404 9 UNKNOWN 3 0.047 115 0.244 0.192 -12.656 1 DRY 5261 82.139 39204 83.329 0.986* -76.250

TABLE B.12: TRAFFIC CONTROL DEVICE Subset Subset Other Other OveRep MAXCode Description Freq % Freq % Factor Gain------------------------ ------ ------ ------ ------ ------ ------ 0 NO CONTROLS 5352 83.560 35189 74.795 1.117* 561.353 1 CNTL-NO PED SIG 130 2.030 157 0.334 6.082* 108.626 20 STOP SIGN 707 11.038 4817 10.239 1.078 51.211 69 RR:UNK ACTIVE DEVICE 15 0.234 21 0.045 5.247 12.141 21 YIELD SIGN 15 0.234 87 0.185 1.266 3.156 70 RR:CROSS BUCKS 14 0.219 89 0.189 1.155 1.883 38 SCH:OTHER RELATED SI 2 0.031 3 0.006 4.897 1.592 8 OTHER SIGNAL 3 0.047 14 0.030 1.574 1.094 30 SCH:SPEED LIMIT SIGN 2 0.031 7 0.015 2.099 1.047 79 RR:UNK PASSIVE DEVIC 1 0.016 7 0.015 1.049 0.047 98 OTHER 2 0.031 20 0.043 0.735 -0.723 50 OFFICER, CROSSING GU 6 0.094 54 0.115 0.816 -1.352 62 RR:TRAFFIC CONTROL S 1 0.016 20 0.043 0.367 -1.723 5 FLASH BEACON 7 0.109 70 0.149 0.735 -2.530 9 UNK SIGNAL 1 0.016 27 0.057 0.272 -2.676 99 UNKNOWN 3 0.047 69 0.147 0.319 -6.394 60 RR:GATES 2 0.031 69 0.147 0.213 -7.394 61 RR:FLASHING LIGHTS 7 0.109 117 0.249 0.439 -8.928 2 CNTL-W/PED SIG 1 0.016 84 0.179 0.087 -10.436 4 FLASH CNTRL 58 0.906 588 1.250 0.725* -22.051 40 WARNING SIGN 10 0.156 949 2.017 0.077 -119.197 3 CNTL-UNK PED SIG 51 0.796 2189 4.653 0.171* -247.011 28 OTHER REGULATORY SIG 15 0.234 2255 4.793 0.049 -291.997
TABLE B.13: LIGHT CONDITION Subset Subset Other Other OveRep MAXCode Description Freq % Freq % Factor Gain------------------------ ------ ------ ------ ------ ------ ------ 2 DARK 2358 36.815 15970 33.945 1.085* 183.837 4 DAWN 192 2.998 973 2.068 1.449* 59.535 5 DUSK 207 3.232 1160 2.466 1.311* 49.077 9 UNKNOWN 3 0.047 107 0.227 0.206 -11.567 1 DAYLIGHT 3077 48.041 23063 49.021 0.980 -62.807 3 DARK BUT LIGHTED 568 8.868 5774 12.273 0.723* -218.075
TABLE B.14: ATMOSPHERIC CONDITION Subset Subset Other Other OveRep MAXCode Description Freq % Freq % Factor Gain------------------------ ------ ------ ------ ------ ------ ------ 2 RAIN 946 14.770 4875 10.362 1.425* 282.315 3 SLEET 66 1.030 130 0.276 3.729* 48.302 7 SLEET & FOG 23 0.359 25 0.053 6.758* 19.596 6 RAIN & FOG 14 0.219 50 0.106 2.057 7.193 4 SNOW 19 0.297 162 0.344 0.861 -3.055 9 UNKNOWN 3 0.047 155 0.329 0.142 -18.102 5 FOG 37 0.578 684 1.454 0.397* -56.120 1 NORMAL 5297 82.701 40954 87.049 0.950* -278.496

TABLE B.15: BODY TYPE Subset Subset Other Other OveRep MAXCode Description Freq % Freq % Factor Gain------------------------ ------ ------ ------ ------ ------ ------ 30 COMPACT PICKUP 743 11.600 4337 9.218 1.258* 152.559 9 UNK AUTO TYPE 223 3.482 1079 2.293 1.518* 76.104 2 2DR SEDAN/HT/COUPE 1462 22.826 10332 21.961 1.039 55.397 63 SUT HI GVW 115 1.795 491 1.044 1.720* 48.155 80 MOTORCYCLE 241 3.763 1513 3.216 1.170 35.019 66 TRUCK/TRACTOR 335 5.230 2241 4.763 1.098 29.909 20 MINIVAN 166 2.592 1088 2.313 1.121 17.879 1 CONVERTIBLE 34 0.531 173 0.368 1.444 10.448 6 STATION WAGON 145 2.264 1007 2.140 1.058 7.907 81 MOPED 13 0.203 40 0.085 2.387 7.554 15 LARGE UTILITY 39 0.609 270 0.574 1.061 2.242 92 FARM EQUIPMENT 9 0.141 59 0.125 1.120 0.968 11 AUTO PANEL 1 0.016 2 0.004 3.673 0.728 100 NO VEHICLE 1 0.016 2 0.004 3.673 0.728 60 STEP VAN 6 0.094 39 0.083 1.130 0.691 91 SNOWMOBILE 2 0.031 11 0.023 1.336 0.502 29 UNKNOWN VAN TYPE 7 0.109 48 0.102 1.071 0.465 93 CONSTR EQUIPMENT 2 0.031 12 0.026 1.224 0.366 23 VAN MOTORHOME 3 0.047 20 0.043 1.102 0.277 51 X-COUNTRY/INTERCITY 3 0.047 20 0.043 1.102 0.277 73 CAMPER OR MOTORHOME 3 0.047 20 0.043 1.102 0.277 22 STEP VAN 8 0.125 57 0.121 1.031 0.240 59 UNKNOWN BUS 2 0.031 15 0.032 0.979 -0.042 58 OTHER BUS 2 0.031 16 0.034 0.918 -0.178 83 RESERVED 2 0.031 16 0.034 0.918 -0.178 97 OTHER VEHICLE 6 0.094 47 0.100 0.938 -0.399 50 SCHOOL BUS 7 0.109 55 0.117 0.935 -0.488 48 UNK LT CONVENTIONAL 1 0.016 22 0.047 0.334 -1.995 52 TRANSIT BUS 1 0.016 22 0.047 0.334 -1.995 16 UTILITY STATION WAGO 12 0.187 104 0.221 0.848 -2.159 78 UNKNOWN MED/HVY 2 0.031 32 0.068 0.459 -2.356 61 SUT LOW GVW 10 0.156 93 0.198 0.790 -2.661 28 OTHER VAN TYPE 4 0.062 53 0.113 0.554 -3.215 64 SUT UNK GVW 1 0.016 46 0.098 0.160 -5.262 40 CAB CHASSIS BASED 4 0.062 70 0.149 0.420 -5.530 49 UNK LT VEHICLE 1 0.016 51 0.108 0.144 -5.943 10 AUTO PICKUP 1 0.016 53 0.113 0.139 -6.215 62 SUT MED GVW 13 0.203 143 0.304 0.668 -6.468 21 LARGE VAN 116 1.811 926 1.968 0.920 -10.066 39 UNKNOWN PICKUP 2 0.031 103 0.219 0.143 -12.022 5 5DR/4DR HATCHBACK 19 0.297 228 0.485 0.612 -12.040 90 ATV 3 0.047 122 0.259 0.181 -13.609 14 COMPACT UTILITY 236 3.685 1867 3.968 0.928 -18.174 99 UNKNOWN BODY TYPE 89 1.390 801 1.703 0.816 -20.049 32 PICKUP W/CAMPER 1 0.016 181 0.385 0.041 -23.641 4 4DR SEDAN/HT 1730 27.010 13095 27.834 0.970 -52.759 3 3DR/2DR HATCHBACK 102 1.593 1232 2.619 0.608* -65.725 31 STANDARD PICKUP 477 7.447 4577 9.729 0.766* -146.115
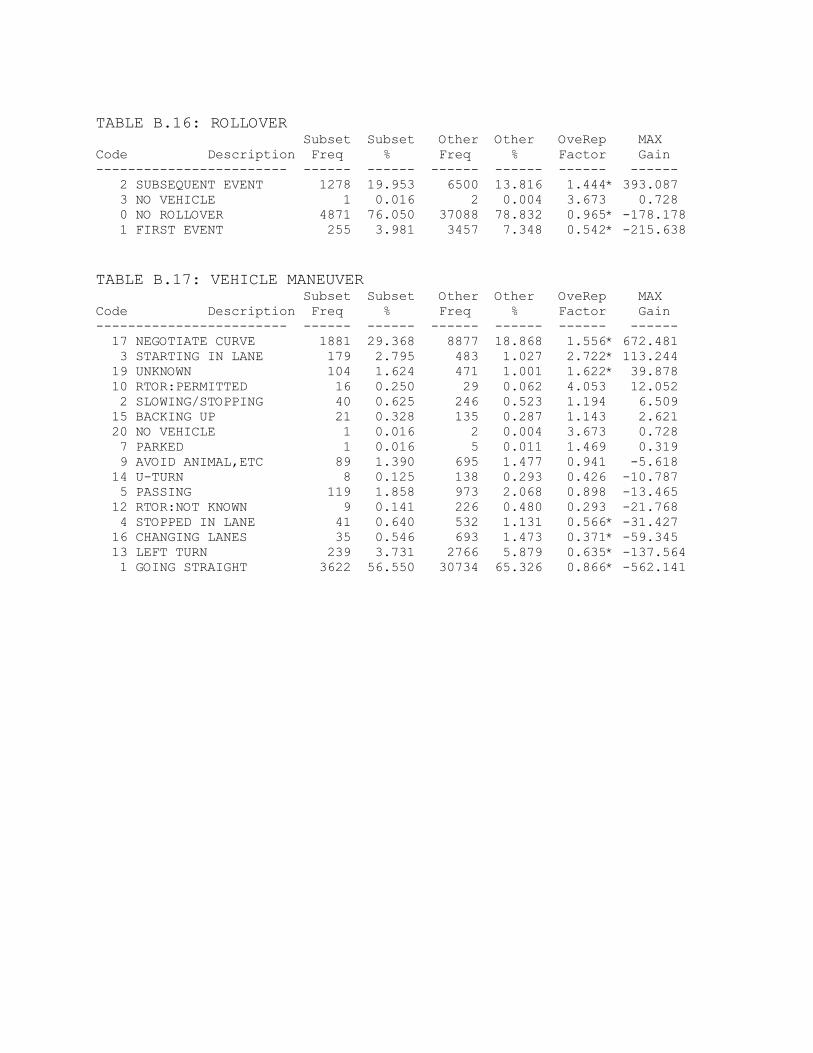
TABLE B.16: ROLLOVER Subset Subset Other Other OveRep MAXCode Description Freq % Freq % Factor Gain------------------------ ------ ------ ------ ------ ------ ------ 2 SUBSEQUENT EVENT 1278 19.953 6500 13.816 1.444* 393.087 3 NO VEHICLE 1 0.016 2 0.004 3.673 0.728 0 NO ROLLOVER 4871 76.050 37088 78.832 0.965* -178.178 1 FIRST EVENT 255 3.981 3457 7.348 0.542* -215.638
TABLE B.17: VEHICLE MANEUVER Subset Subset Other Other OveRep MAXCode Description Freq % Freq % Factor Gain------------------------ ------ ------ ------ ------ ------ ------ 17 NEGOTIATE CURVE 1881 29.368 8877 18.868 1.556* 672.481 3 STARTING IN LANE 179 2.795 483 1.027 2.722* 113.244 19 UNKNOWN 104 1.624 471 1.001 1.622* 39.878 10 RTOR:PERMITTED 16 0.250 29 0.062 4.053 12.052 2 SLOWING/STOPPING 40 0.625 246 0.523 1.194 6.509 15 BACKING UP 21 0.328 135 0.287 1.143 2.621 20 NO VEHICLE 1 0.016 2 0.004 3.673 0.728 7 PARKED 1 0.016 5 0.011 1.469 0.319 9 AVOID ANIMAL,ETC 89 1.390 695 1.477 0.941 -5.618 14 U-TURN 8 0.125 138 0.293 0.426 -10.787 5 PASSING 119 1.858 973 2.068 0.898 -13.465 12 RTOR:NOT KNOWN 9 0.141 226 0.480 0.293 -21.768 4 STOPPED IN LANE 41 0.640 532 1.131 0.566* -31.427 16 CHANGING LANES 35 0.546 693 1.473 0.371* -59.345 13 LEFT TURN 239 3.731 2766 5.879 0.635* -137.564 1 GOING STRAIGHT 3622 56.550 30734 65.326 0.866* -562.141

TABLE B.18: MOST HARMFUL EVENT Subset Subset Other Other OveRep MAXCode Description Freq % Freq % Factor Gain------------------------ ------ ------ ------ ------ ------ ------ 42 TREE 869 13.568 5650 12.009 1.130* 99.806 12 VEH IN TRANSP 2688 41.967 19289 40.999 1.024 61.987 13 VEH IN TRANS OTH 104 1.624 478 1.016 1.598* 38.925 8 PEDESTRIAN 879 13.724 6189 13.155 1.043 36.427 3 IMMERSION 69 1.077 350 0.744 1.448* 21.351 34 DITCH 89 1.390 497 1.056 1.315* 21.338 19 BUILDING 39 0.609 151 0.321 1.897* 18.443 23 BRIDGE RAIL 33 0.515 141 0.300 1.719* 13.804 9 PEDALCYCLE 161 2.514 1092 2.321 1.083 12.335 22 BRIDGE PARAPET 12 0.187 61 0.130 1.445 3.695 21 BRIDGE PIER 36 0.562 244 0.519 1.084 2.782 40 FIRE HYDRANT 2 0.031 6 0.013 2.448 1.183 41 SHRUBBERY 2 0.031 6 0.013 2.448 1.183 11 ANIMAL 8 0.125 53 0.113 1.109 0.785 4 GAS INHALATION 1 0.016 2 0.004 3.673 0.728 48 NO VEHICLE 1 0.016 2 0.004 3.673 0.728 15 OTHER NON-MOT 6 0.094 40 0.085 1.102 0.554 20 IMPACT ATTENUATR 1 0.016 6 0.013 1.224 0.183 26 OTHER L-BARRIER 1 0.016 6 0.013 1.224 0.183 28 OVERHEAD SIGN 1 0.016 10 0.021 0.735 -0.361 47 UNKNOWN 1 0.016 11 0.023 0.668 -0.498 37 EMBANK-UNK 39 0.609 297 0.631 0.965 -1.434 16 OBJ THROWN/FALL 1 0.016 18 0.038 0.408 -1.451 33 CURB 4 0.062 42 0.089 0.700 -1.718 7 OTHER NON-COLL 5 0.078 50 0.106 0.735 -1.807 14 PARKED MOTOR VEH 46 0.718 352 0.748 0.960 -1.921 27 HWY SIGN POST 7 0.109 71 0.151 0.724 -2.666 18 OTH NON-FIX OBJ 13 0.203 125 0.266 0.764 -4.018 31 OTHER POST/POLE 15 0.234 141 0.300 0.781 -4.196 36 EMBANK-ROCK 3 0.047 61 0.130 0.361 -5.305 25 CONCRETE BARRIER 6 0.094 89 0.189 0.495 -6.117 38 FENCE 21 0.328 203 0.431 0.760 -6.637 5 FELL FROM VEH 34 0.531 314 0.667 0.795 -8.748 39 WALL 9 0.141 155 0.329 0.427 -12.102 10 RAIL TRAIN 40 0.625 398 0.846 0.738 -14.184 24 GUARDRAIL 54 0.843 506 1.076 0.784 -14.887 43 OTHER FIXED OBJ 17 0.265 237 0.504 0.527 -15.265 32 CULVERT 41 0.640 465 0.988 0.648* -22.305 35 EMBANK-EARTH 4 0.062 233 0.495 0.126 -27.721 2 FIRE/EXPLOSION 16 0.250 347 0.738 0.339 -31.241 30 UTILITY POLE 126 1.967 1422 3.023 0.651* -67.592 1 OVERTURN 901 14.067 7168 15.236 0.923* -74.855
TABLE B.19: VIOLATIONS CHARGED Subset Subset Other Other OveRep MAXCode Description Freq % Freq % Factor Gain------------------------ ------ ------ ------ ------ ------ ------ 3 ALC OR DRUGS-SPD 565 8.821 725 1.541 5.724* 466.298 6 OTHER MOVING 517 8.072 2312 4.914 1.643* 202.243

2 SPEEDING 259 4.044 468 0.995 4.065* 195.286 1 ALCOHOL OR DRUGS 315 4.918 1066 2.266 2.171* 169.874 10 NO DRIVER 1 0.016 2 0.004 3.673 0.728 8 UNKNOWN OR OTHER 1 0.016 44 0.094 0.167 -4.990 5 SUSPEND/REVOKED 12 0.187 178 0.378 0.495 -12.233 4 RECKLESS DRIVING 11 0.172 292 0.621 0.277 -28.753 7 NON-MOVING 27 0.422 458 0.973 0.433* -35.352 9 UNKNOWN 94 1.468 1343 2.855 0.514* -88.837 0 NONE 4603 71.866 40159 85.359 0.842* -864.265
TABLE B.20: FIRST RELATED FACTOR - DR Subset Subset Other Other OveRep MAXCode Description Freq % Freq % Factor Gain------------------------ ------ ------ ------ ------ ------ ------ 44 DRIVING TOO FAST 1595 24.902 5295 11.255 2.213* 874.136 27 IMPR LANE CHANGE 507 7.916 801 1.703 4.649* 397.952 0 NONE 1480 23.107 8081 17.176 1.345* 379.849 51 WRONG SIDE OF RD 493 7.697 928 1.972 3.902* 366.662 91 HOMOCIDE 113 1.764 282 0.599 2.943* 74.608 36 ERRATIC/RECKLESS 587 9.165 3872 8.230 1.114* 59.864 50 WRONG WAY 20 0.312 64 0.136 2.295* 11.287 23 IMPROPER LIGHTS 15 0.234 61 0.130 1.806 6.695 24 W/O REQ EQUIP 12 0.187 41 0.087 2.150 6.418 90 HIT AND RUN 105 1.639 726 1.543 1.062 6.162 22 IMPROPER TOWING 9 0.141 29 0.062 2.280 5.052 8 PARAPLEGIC 4 0.062 8 0.017 3.673 2.911 19 INVALID LICENSE 4 0.062 10 0.021 2.938 2.639 17 RESERVED 3 0.047 8 0.017 2.755 1.911 16 RESERVED 2 0.031 3 0.006 4.897 1.592 14 FAILURE TAKE DRUGS 2 0.031 5 0.011 2.938 1.319 95 COMPUTER 2 0.031 5 0.011 2.938 1.319 7 WHEELCHAIR 2 0.031 8 0.017 1.836 0.911 15 RESERVED 2 0.031 9 0.019 1.632 0.775 18 TRAVELING PROHIBITED 2 0.031 9 0.019 1.632 0.775 94 FAX MACHINE 1 0.016 2 0.004 3.673 0.728 100 NO DRIVER 1 0.016 2 0.004 3.673 0.728 97 2-WAY RADIO 1 0.016 3 0.006 2.448 0.592 80 FLAT TIRE 10 0.156 70 0.149 1.049 0.470 13 MENTALLY CHALLENGED 1 0.016 4 0.009 1.836 0.455 20 VEH UNATTENDED 7 0.109 52 0.111 0.989 -0.079 12 DEAD FETUS 1 0.016 8 0.017 0.918 -0.089 43 WRONG SIGNAL 1 0.016 10 0.021 0.735 -0.361 3 EMOTIONAL 2 0.031 18 0.038 0.816 -0.451 45 UNDER MIN SPEED 3 0.047 27 0.057 0.816 -0.676 11 OTHER PHYSICAL 4 0.062 35 0.074 0.839 -0.765 52 OP INEXPERIENCE 1 0.016 15 0.032 0.490 -1.042 47 WRONG LANE TURN 2 0.031 24 0.051 0.612 -1.267 46 SPEED CHANGES 2 0.031 25 0.053 0.588 -1.404 77 CROSSWIND 1 0.016 18 0.038 0.408 -1.451 65 TREE,PLANTS 2 0.031 29 0.062 0.507 -1.948 71 OBSTRUCT ANGLES 1 0.016 26 0.055 0.283 -2.540 21 IMPROPER LOADING 4 0.062 63 0.134 0.466 -4.577 62 GLARE 1 0.016 74 0.157 0.099 -9.074

54 STOPPING IN RD 1 0.016 86 0.183 0.085 -10.708 87 WATER,SNOW,OIL 1 0.016 184 0.391 0.040 -24.050 48 OTHR IMPROP TURN 5 0.078 231 0.491 0.159 -26.448 2 ILL, BLACKOUT 2 0.031 222 0.472 0.066 -28.223 26 IMPROPER TAILING 1 0.016 218 0.463 0.034 -28.679 92 OTHER VIOLATION 4 0.062 311 0.661 0.094 -38.340 40 AROUND BARRIER 1 0.016 325 0.691 0.023 -43.246 34 PASS WRONG SIDE 2 0.031 396 0.842 0.037 -51.912 31 IMPR START/BACK 4 0.062 484 1.029 0.061 -61.892 39 FAILURE TO OBEY 173 2.701 1744 3.707 0.729* -64.429 1 DROWSY, ASLEEP 34 0.531 740 1.573 0.337* -66.744 99 UNKNOWN 61 0.952 966 2.053 0.464* -70.512 37 HIGH SPEED CHASE 32 0.500 765 1.626 0.307* -72.147 29 DRIVING SHOULDER 17 0.265 742 1.577 0.168 -84.016 35 PASS INSUFF DIST 6 0.094 782 1.662 0.056 -100.462 32 OPEN VEH CLOSURE 3 0.047 786 1.671 0.028 -104.006 30 IMP ENTRY/EXIT 11 0.172 875 1.860 0.092 -108.123 6 INATTENTIVE 4 0.062 1113 2.366 0.026 -147.524 33 PROHIBITED PASS 7 0.109 1307 2.778 0.039 -170.936 28 RUN OFF RD/LANE 767 11.975 7928 16.851 0.711* -312.322 38 FAILURE TO YIELD 264 4.122 4340 9.225 0.447* -326.850TABLE B.21: SECOND RELATED FACTOR - DR Subset Subset Other Other OveRep MAXCode Description Freq % Freq % Factor Gain------------------------ ------ ------ ------ ------ ------ ------ 51 WRONG SIDE OF RD 554 8.649 729 1.550 5.582* 454.754 36 ERRATIC/RECKLESS 524 8.181 1176 2.500 3.273* 363.899 91 HOMOCIDE 394 6.151 921 1.958 3.142* 268.615 38 FAILURE TO YIELD 150 2.342 547 1.163 2.014* 75.531 37 HIGH SPEED CHASE 58 0.906 178 0.378 2.393* 33.767 54 STOPPING IN RD 40 0.625 161 0.342 1.825* 18.081 57 LOCKED WHEEL 34 0.531 126 0.268 1.982* 16.846 50 WRONG WAY 37 0.578 180 0.383 1.510 12.495 35 PASS INSUFF DIST 37 0.578 190 0.404 1.430 11.133 60 ON/OFF STOP VEH 36 0.562 184 0.391 1.437 10.950 52 OP INEXPERIENCE 25 0.390 104 0.221 1.766* 10.841 30 IMP ENTRY/EXIT 34 0.531 171 0.363 1.460 10.720 53 UNFAMILIAR W/RD 26 0.406 113 0.240 1.690* 10.616 88 RESERVED 14 0.219 34 0.072 3.025 9.371 33 PROHIBITED PASS 31 0.484 161 0.342 1.414 9.081 65 TREE,PLANTS 27 0.422 138 0.293 1.437 8.213 40 AROUND BARRIER 31 0.484 170 0.361 1.339 7.856 43 WRONG SIGNAL 18 0.281 86 0.183 1.537 6.292 59 ON/OFF MOV VEH 12 0.187 42 0.089 2.099 6.282 29 DRIVING SHOULDER 9 0.141 29 0.062 2.280 5.052 32 OPEN VEH CLOSURE 25 0.390 147 0.312 1.249 4.987 89 CARRYING HAZ CARGO 5 0.078 7 0.015 5.247 4.047 34 PASS WRONG SIDE 23 0.359 141 0.300 1.198 3.804 10 DEAF 21 0.328 130 0.276 1.187 3.302 45 UNDER MIN SPEED 15 0.234 88 0.187 1.252 3.020 71 OBSTRUCT ANGLES 16 0.250 96 0.204 1.224 2.931 78 TRUCK WIND 8 0.125 38 0.081 1.546 2.827 26 IMPROPER TAILING 19 0.297 124 0.264 1.125 2.119

94 FAX MACHINE 5 0.078 27 0.057 1.360 1.324 9 PREVIOUS INJURY 11 0.172 73 0.155 1.107 1.062 100 NO DRIVER 1 0.016 2 0.004 3.673 0.728 67 PARKED VEHICLE 9 0.141 61 0.130 1.084 0.695 85 PHANTOM VEHICLE 15 0.234 106 0.225 1.039 0.569 55 UNDERRIDE TRUCK 12 0.187 88 0.187 1.002 0.020 8 PARAPLEGIC 15 0.234 111 0.236 0.993 -0.112 69 INADEQ DEFROSTER 6 0.094 45 0.096 0.979 -0.126 5 OTHER DRUGS 22 0.343 163 0.346 0.991 -0.191 98 HEAD-UP DISPLAY 3 0.047 25 0.053 0.881 -0.404 97 2-WAY RADIO 4 0.062 35 0.074 0.839 -0.765 39 FAILURE TO OBEY 111 1.733 821 1.745 0.993 -0.771 56 LOW TIRE PRESSUR 15 0.234 118 0.251 0.934 -1.065 73 OTHER MIRROR 7 0.109 60 0.128 0.857 -1.168 15 RESERVED 9 0.141 77 0.164 0.859 -1.483 21 IMPROPER LOADING 31 0.484 239 0.508 0.953 -1.538 2 ILL, BLACKOUT 28 0.437 218 0.463 0.943 -1.679 19 INVALID LICENSE 1 0.016 22 0.047 0.334 -1.995 93 CELLULAR PHONE 6 0.094 60 0.128 0.735 -2.168 70 INADEQ LIGHTS 23 0.359 185 0.393 0.913 -2.186 14 FAILURE TAKE DRUGS 13 0.203 112 0.238 0.853 -2.248 24 W/O REQ EQUIP 8 0.125 78 0.166 0.753 -2.619 13 MENTALLY CHALLENGED 16 0.250 139 0.295 0.846 -2.924 23 IMPROPER LIGHTS 9 0.141 88 0.187 0.751 -2.980 80 FLAT TIRE 21 0.328 178 0.378 0.867 -3.233 83 ANIMAL 13 0.203 120 0.255 0.796 -3.337 1 DROWSY, ASLEEP 33 0.515 267 0.568 0.908 -3.350 25 UNLAWFUL NOISE 2 0.031 43 0.091 0.342 -3.854 82 RUT IN ROAD 10 0.156 102 0.217 0.720 -3.886 3 EMOTIONAL 18 0.281 162 0.344 0.816 -4.055 79 SLIPPERY SURFACE 5 0.078 67 0.142 0.548 -4.121 42 FAIL TO SIGNAL 8 0.125 91 0.193 0.646 -4.389 16 RESERVED 10 0.156 107 0.227 0.686 -4.567 46 SPEED CHANGES 12 0.187 122 0.259 0.722 -4.609 68 SPLASH,SPRAY 5 0.078 71 0.151 0.517 -4.666 17 RESERVED 9 0.141 102 0.217 0.648 -4.886 77 CROSSWIND 8 0.125 95 0.202 0.619 -4.933 75 IMPR WINDSHIELD 7 0.109 91 0.193 0.565 -5.389 22 IMPROPER TOWING 7 0.109 92 0.196 0.559 -5.525 12 DEAD FETUS 11 0.172 123 0.261 0.657 -5.745 41 FAIL TO OBS WARN 6 0.094 89 0.189 0.495 -6.117 47 WRONG LANE TURN 7 0.109 99 0.210 0.519 -6.478 64 BLDG,BILLBOARD 7 0.109 99 0.210 0.519 -6.478 86 PEDESTRIAN 2 0.031 63 0.134 0.233 -6.577 96 NAVIGATION SYS 1 0.016 56 0.119 0.131 -6.624 81 DEBRIS IN ROAD 9 0.141 118 0.251 0.560 -7.065 95 COMPUTER 2 0.031 70 0.149 0.210 -7.530 84 VEHICLE IN ROAD 6 0.094 101 0.215 0.436 -7.750 18 TRAVELING PROHIBITED 2 0.031 72 0.153 0.204 -7.802 31 IMPR START/BACK 13 0.203 153 0.325 0.624 -7.829 7 WHEELCHAIR 8 0.125 117 0.249 0.502 -7.928 63 CURVE,HILL,ETC 7 0.109 112 0.238 0.459 -8.248 11 OTHER PHYSICAL 23 0.359 232 0.493 0.728 -8.585

4 DRUGS-MEDICATION 11 0.172 144 0.306 0.561 -8.604 72 REAR MIRRORS 2 0.031 78 0.166 0.188 -8.619 76 OTHER OBSTRUCT 2 0.031 78 0.166 0.188 -8.619 20 VEH UNATTENDED 29 0.453 281 0.597 0.758 -9.255 66 MOVING VEHICLE 6 0.094 118 0.251 0.373 -10.065 62 GLARE 5 0.078 121 0.257 0.304 -11.473 74 HEAD RESTRAINTS 5 0.078 125 0.266 0.294 -12.018 27 IMPR LANE CHANGE 5 0.078 127 0.270 0.289 -12.290 61 WEATHER 21 0.328 245 0.521 0.630 -12.354 48 OTHR IMPROP TURN 5 0.078 173 0.368 0.212 -18.552 58 OVER CORRECTING 18 0.281 360 0.765 0.367 -31.011 87 WATER,SNOW,OIL 4 0.062 261 0.555 0.113 -31.533 90 HIT AND RUN 6 0.094 287 0.610 0.154 -33.072 6 INATTENTIVE 3 0.047 310 0.659 0.071 -39.204 99 UNKNOWN 61 0.952 982 2.087 0.456* -72.690 92 OTHER VIOLATION 7 0.109 586 1.246 0.088 -72.778 0 NONE 2894 45.183 22397 47.606 0.949* -155.138 28 RUN OFF RD/LANE 334 5.215 4137 8.793 0.593* -229.213 44 DRIVING TOO FAST 112 1.749 3846 8.175 0.214* -411.596

TABLE B.22: THIRD RELATED FACTOR - DR Subset Subset Other Other OveRep MAXCode Description Freq % Freq % Factor Gain------------------------ ------ ------ ------ ------ ------ ------ 91 HOMOCIDE 178 2.779 488 1.037 2.679* 111.563 36 ERRATIC/RECKLESS 148 2.311 275 0.585 3.953* 110.561 28 RUN OFF RD/LANE 118 1.842 430 0.914 2.016* 59.460 51 WRONG SIDE OF RD 64 0.999 89 0.189 5.282* 51.883 0 NONE 4553 71.085 33120 70.398 1.010 44.028 3 EMOTIONAL 54 0.843 167 0.355 2.375* 31.265 23 IMPROPER LIGHTS 43 0.671 132 0.281 2.393* 25.029 33 PROHIBITED PASS 44 0.687 175 0.372 1.847* 20.175 53 UNFAMILIAR W/RD 36 0.562 128 0.272 2.066* 18.574 43 WRONG SIGNAL 33 0.515 148 0.315 1.638* 12.851 83 ANIMAL 27 0.422 112 0.238 1.771* 11.752 50 WRONG WAY 79 1.233 494 1.050 1.175 11.747 73 OTHER MIRROR 30 0.468 139 0.295 1.585 11.076 93 CELLULAR PHONE 30 0.468 141 0.300 1.563 10.804 63 CURVE,HILL,ETC 32 0.500 156 0.332 1.507 10.762 13 MENTALLY CHALLENGED 34 0.531 174 0.370 1.435 10.312 4 DRUGS-MEDICATION 30 0.468 147 0.312 1.499 9.987 40 AROUND BARRIER 69 1.077 435 0.925 1.165 9.779 60 ON/OFF STOP VEH 60 0.937 371 0.789 1.188 9.492 84 VEHICLE IN ROAD 24 0.375 116 0.247 1.520 8.208 24 W/O REQ EQUIP 23 0.359 115 0.244 1.469 7.344 25 UNLAWFUL NOISE 10 0.156 22 0.047 3.339 7.005 64 BLDG,BILLBOARD 19 0.297 98 0.208 1.424 5.658 75 IMPR WINDSHIELD 7 0.109 26 0.055 1.978 3.460 65 TREE,PLANTS 6 0.094 23 0.049 1.916 2.869 95 COMPUTER 5 0.078 17 0.036 2.160 2.686 29 DRIVING SHOULDER 7 0.109 32 0.068 1.607 2.644 59 ON/OFF MOV VEH 8 0.125 40 0.085 1.469 2.554 69 INADEQ DEFROSTER 8 0.125 40 0.085 1.469 2.554 34 PASS WRONG SIDE 18 0.281 114 0.242 1.160 2.480 5 OTHER DRUGS 5 0.078 19 0.040 1.933 2.413 79 SLIPPERY SURFACE 7 0.109 40 0.085 1.285 1.554 85 PHANTOM VEHICLE 4 0.062 18 0.038 1.632 1.549 45 UNDER MIN SPEED 3 0.047 11 0.023 2.003 1.502 27 IMPR LANE CHANGE 4 0.062 19 0.040 1.546 1.413 35 PASS INSUFF DIST 6 0.094 35 0.074 1.259 1.235 89 CARRYING HAZ CARGO 4 0.062 23 0.049 1.277 0.869 100 NO DRIVER 1 0.016 2 0.004 3.673 0.728 38 FAILURE TO YIELD 8 0.125 54 0.115 1.088 0.648 20 VEH UNATTENDED 57 0.890 416 0.884 1.006 0.366 21 IMPROPER LOADING 1 0.016 6 0.013 1.224 0.183 15 RESERVED 3 0.047 23 0.049 0.958 -0.131 55 UNDERRIDE TRUCK 2 0.031 16 0.034 0.918 -0.178 54 STOPPING IN RD 15 0.234 112 0.238 0.984 -0.248 56 LOW TIRE PRESSUR 1 0.016 10 0.021 0.735 -0.361 68 SPLASH,SPRAY 1 0.016 10 0.021 0.735 -0.361 9 PREVIOUS INJURY 3 0.047 28 0.060 0.787 -0.812 30 IMP ENTRY/EXIT 58 0.906 432 0.918 0.986 -0.813 74 HEAD RESTRAINTS 13 0.203 103 0.219 0.927 -1.022

19 INVALID LICENSE 5 0.078 47 0.100 0.781 -1.399 39 FAILURE TO OBEY 16 0.250 130 0.276 0.904 -1.698 70 INADEQ LIGHTS 53 0.827 402 0.854 0.968 -1.728 49 PHYS REST COMPLY 4 0.062 43 0.091 0.683 -1.854 94 FAX MACHINE 8 0.125 75 0.159 0.784 -2.211 14 FAILURE TAKE DRUGS 15 0.234 135 0.287 0.816 -3.379 1 DROWSY, ASLEEP 3 0.047 55 0.117 0.401 -4.488 37 HIGH SPEED CHASE 5 0.078 73 0.155 0.503 -4.938 80 FLAT TIRE 41 0.640 346 0.735 0.870 -6.105 90 HIT AND RUN 44 0.687 393 0.835 0.822 -9.503 72 REAR MIRRORS 9 0.141 194 0.412 0.341 -17.411

22 IMPROPER TOWING 7 0.109 182 0.387 0.283 -17.778 82 RUT IN ROAD 4 0.062 162 0.344 0.181 -18.055 10 DEAF 56 0.874 563 1.197 0.731 -20.647 52 OP INEXPERIENCE 5 0.078 189 0.402 0.194 -20.731 32 OPEN VEH CLOSURE 6 0.094 213 0.453 0.207 -22.998 62 GLARE 3 0.047 192 0.408 0.115 -23.139 42 FAIL TO SIGNAL 6 0.094 215 0.457 0.205 -23.270 2 ILL, BLACKOUT 9 0.141 255 0.542 0.259 -25.716 12 DEAD FETUS 7 0.109 273 0.580 0.188 -30.166 44 DRIVING TOO FAST 32 0.500 565 1.201 0.416* -44.919 99 UNKNOWN 64 0.999 952 2.024 0.494* -65.606 92 OTHER VIOLATION 10 0.156 1504 3.197 0.049 -194.755
TABLE B.23: RESTRAINT SYSTEM-USE Subset Subset Other Other OveRep MAXCode Description Freq % Freq % Factor Gain------------------------ ------ ------ ------ ------ ------ ------ 3 LAP AND SHOULDER 3299 51.507 15436 32.810 1.570* 1197.536 16 UNKNOWN 693 10.820 3463 7.361 1.470* 221.546 2 LAP BELT 203 3.169 961 2.043 1.552* 72.169 5 M-CYCLE HELMET 200 3.123 1187 2.523 1.238* 38.401 13 SAFETY BELT USED IMP 1 0.016 3 0.006 2.448 0.592 15 RES USED--TYPE UNK 1 0.016 6 0.013 1.224 0.183 17 NO DRIVER/PERSON REC 18 0.281 195 0.414 0.678 -8.547 0 NONE USED OR N/A 1990 31.069 22266 47.327 0.656* -1041.303
TABLE B.24: ALCOHOL INVOLVEMENT Subset Subset Other Other OveRep MAXCode Description Freq % Freq % Factor Gain------------------------ ------ ------ ------ ------ ------ ------ 0 NO (ALCOHOL NOT INVO 4176 65.199 24709 52.520 1.241* 812.106 8 NOT REPORTED 481 7.510 2990 6.355 1.182* 73.940 10 NO DRIVER/PERSON REC 18 0.281 195 0.414 0.678 -8.547 1 YES (ALCOHOL INVOLVE 1090 17.018 8602 18.284 0.931* -81.080 9 UNKNOWN 640 9.992 10551 22.427 0.446* -796.418
TABLE B.25: INJURY SEVERITY Subset Subset Other Other OveRep MAXCode Description Freq % Freq % Factor Gain------------------------ ------ ------ ------ ------ ------ ------ 1 POSSIBLE 454 7.088 2547 5.414 1.309* 107.250 3 INCAPACITATING 845 13.193 5706 12.128 1.088* 68.183 9 UNKNOWN 80 1.249 377 0.801 1.559* 28.675 2 NON INCAPACITY 598 9.336 4258 9.051 1.032 18.314 10 NO DRIVER/PERSON REC 18 0.281 195 0.414 0.678 -8.547 0 NO 1341 20.937 10466 22.246 0.941* -83.846 4 FATAL INJURY 3069 47.916 23491 49.931 0.960* -129.075

APPENDIX C: PRELIMINARY HSIS ANALYSIS HYPOTHESES ANDDATA

Table C.1. Selected hypotheses regarding risk of crashes on roadway segments
Variable Severity measures1. Severe crash rate (# of K + A crashes permillion vehicle miles).2. Relative severity of crashes (% of K + Acrashes/total crashes).
Number of lanes Due to design, vehicle, driver and collisionfactors, two lane roads are more likely to havesevere crashes.
Road speed Higher posted speeds often imply higher collisionspeeds and greater transfer of energy tooccupants, resulting in more sever injuries
Roadway shoulders Presence of shoulders provide recovery area,reducing the risk of severe collisions
Access control Greater access control is expected to reduceconflict and some severe crash types. On theother hand the higher associated speeds mayincrease severity.
Geography/Terrain Due to more curves, grades and roadsidehazards, mountainous counties may have moresevere crashes. However, driver behavior maycompensate for added danger mountainouscounties.
Primitive road surface Primitive road surface is expected to increaseinjury severity. On the other hand, drivercompensation (lowering speed) may decreaseseverity.
Rural vs urban Rural crashes are expected to be more severe(less traffic and higher actual speed).
Median Crashes on divided roads are expected to be lesssevere because of the physical separationbetween lanes.

Table C.2. Selected hypotheses regarding crashes (the hypotheses assume thata crash has occurred and that “all else being equal”).
Variable Severity measure1 Most severe injury in crash measured onKABCO scale.2 Total injuries in a crash on KABCO scale.
Driver/occupant factors Alcohol involvement is expected to increase injuryseverity.
Vehicle factors Larger vehicles involved in crashes provide moreprotection to occupants and therefore lesserinjuryPedestrians, bicyclists and motorcyclists are moreexposed and therefore more likely to be injured
Roadway/Environmentalfactors
Bad weather, lower visibility, presence of curves,grades and roadside hazards, and higher speedsincrease crash severity.Crashes on two-lane roads are more likely to besevere.
Crash factors Single vehicle run-off-road, head-on, large truckinvolved, bicycle, motorcycle involved andpedestrian involved crashes are expected to bemore severe than other crashes.
Time trends Due to improvement in vehicle technology androadway design, crash severity will decrease overtime.

Table C.3. Crashes by roadway type.
ALL CRASHESFOR EACH ROADWAY TYPE
SEVERE CRASHESFOR EACH ROADWAY TYPE
CRASHSEVERITYBYROADWAYTYPE
ROADWAY TYPE CRITERIA # OFSEGMENTS
INSAMPLE
KABCO CRASHES
# of % of totalcrashes KABCO crashes
#KABCO1,000,000
vehiclemiles
K+A CRASHES
# of % of totalcrashes K+A crashes
#K+A
1,000,000vehiclemiles
% K+AOF # OFKABCOCRASHES
Rural 2 lane highway outside urbanized areano full access control2 lanes or less
27425 269,773 56.4 2.09 15,853 64.15 0.12 5.876
Rural multilane undivided(non-freeway)
outside urbanized areano full access control3 lanes or moreundivided
2784 67,312 14.1 2.61 2,323 9.40 0.09 3.451
Rural multilane divided (non-freeway)
outside urbanized areano full access control3 lanes or moremedian
2039 50,135 10.5 1.55 1,936 7.83 0.06 3.862
Urban 2 lane highway inside urbanized areano full access control2 lanes or less
2964 34,629 7.2 2.09 2,151 8.70 0.13 6.212
others Roads with primitive,unimproved, graded anddrained, soil or gravelsurface type
2032 28,616 6.0 0.80 1,193 4.83 0.04 4.169
Rural freeway outside urbanized areafull access controlmore than 3 lanes
687 21,251 4.4 0.61 942 3.81 0.03 4.433
Urban freeway inside urbanized areafull access controlmore than 3 lanes
100 3,429 0.7 0.45 163 0.66 0.02 4.754
Urban multilane divided (non-freeway)
inside urbanized areano full access control3 lanes or moremedian
78 2,279 0.5 0.99 120 0.49 0.05 5.266
Urban multilane undivided(non-freeway)
inside urbanized areano full access control3 lanes or moreundivided
61 736 0.2 1.01 33 0.13 0.05 4.484
TOTAL 38,170 478,160 100 24,714 100 100

Table C.4. Road segment data: crashes for each county ranked by severity.County # of
segments# of KABCO
Crashes# KABCOfor county/
# of KABCOall counties
# ofKABCO
Crashes permillionvehiclemiles
# ofK+A
Crashes
# of K+Afor county/
# of K+A allcounties
# ofK+A
Crashesper million
vehiclemiles
Crashseverity (#
of K+Acrashes/
# ofKABCOcrashes)
Graham 69 445 0.0009 2.160 54 0.0022 0.262 0.121Clay 108 610 0.0013 2.033 70 0.0028 0.233 0.115Swain 92 310 0.0006 0.618 33 0.0013 0.066 0.106Stokes 233 2121 0.0044 1.632 221 0.0089 0.170 0.104Camden 47 451 0.0009 1.039 46 0.0019 0.106 0.102Columbus 391 3853 0.0081 1.852 358 0.0145 0.172 0.093Haywood 353 3537 0.0074 1.145 330 0.0133 0.107 0.093Dare 128 1236 0.0026 0.578 114 0.0046 0.053 0.092Alexander 843 2377 0.0050 2.850 217 0.0088 0.260 0.091Pamlico 98 723 0.0015 1.677 65 0.0026 0.151 0.090Richmond 427 3297 0.0069 2.023 292 0.0118 0.179 0.089Madison 191 1187 0.0025 1.861 104 0.0042 0.163 0.088Cherokee 232 1259 0.0026 1.533 108 0.0044 0.132 0.086Macon 195 1439 0.0030 1.345 124 0.0050 0.116 0.086Davie 171 2032 0.0042 1.195 175 0.0071 0.103 0.086Chowan 107 805 0.0017 1.859 65 0.0026 0.150 0.081Surry 597 5774 0.0121 1.669 466 0.0188 0.135 0.081Gates 89 885 0.0018 1.867 71 0.0029 0.150 0.080Pender 220 2722 0.0057 1.361 213 0.0086 0.107 0.078Jones 84 1142 0.0024 1.489 87 0.0035 0.113 0.076Chatham 331 3988 0.0083 2.045 298 0.0120 0.153 0.075Lenior 314 4480 0.0094 1.923 337 0.0136 0.145 0.075Perquimans 100 654 0.0014 1.580 49 0.0020 0.118 0.075Polk 148 1048 0.0022 1.323 79 0.0032 0.100 0.075Warren 150 1131 0.0024 1.586 84 0.0034 0.118 0.074Transylvania 187 1425 0.0030 1.411 103 0.0042 0.102 0.072Yadkin 253 2604 0.0054 1.447 185 0.0075 0.103 0.071Beaufort 361 4003 0.0084 2.441 282 0.0114 0.172 0.070Bertie 428 1891 0.0040 1.735 130 0.0053 0.119 0.069Washington 141 943 0.0020 1.556 65 0.0026 0.107 0.069Hyde 90 428 0.0009 1.783 29 0.0012 0.121 0.068Stanly 325 2872 0.0060 1.587 192 0.0078 0.106 0.067Currituck 74 1592 0.0033 1.409 106 0.0043 0.094 0.067Rockingham 571 6507 0.0136 1.919 427 0.0173 0.126 0.066Alleghany 194 942 0.0020 3.119 61 0.0025 0.202 0.065Randolph 768 8473 0.0177 1.896 548 0.0222 0.123 0.065Yancey 352 1010 0.0021 1.797 66 0.0027 0.117 0.065Alamance 818 7833 0.0164 1.725 511 0.0207 0.113 0.065Sampson 419 4179 0.0087 1.692 273 0.0110 0.111 0.065

Table C.4, continued. Road segment data: crashes for each county ranked byseverity.
County # ofsegments
# of KABCOCrashes
# KABCOfor county/
# of KABCOall counties
# ofKABCO
Crashes permillionvehiclemiles
# ofK+A
Crashes
# of K+Afor county/
# of K+A allcounties
# ofK+A
Crashesper million
vehiclemiles
Crashseverity (#
of K+Acrashes/
# ofKABCOcrashes)
Montgomery 323 1635 0.0034 1.434 107 0.0043 0.094 0.065Craven 322 4291 0.0090 1.421 273 0.0110 0.090 0.064Northampton 227 1734 0.0036 1.294 111 0.0045 0.083 0.064Person 203 2401 0.0050 2.377 152 0.0061 0.150 0.063Rowan 614 7529 0.0157 1.780 474 0.0192 0.112 0.063Burke 496 5877 0.0123 1.593 368 0.0149 0.100 0.063Hoke 165 1830 0.0038 2.143 115 0.0046 0.135 0.063Anson 279 1951 0.0041 2.049 121 0.0049 0.127 0.062Greene 146 1519 0.0032 2.133 93 0.0038 0.131 0.061Lincoln 220 3441 0.0072 1.978 209 0.0084 0.120 0.061Martin 208 2032 0.0042 1.881 123 0.0050 0.114 0.061Hertford 188 1492 0.0031 1.860 91 0.0037 0.113 0.061Halifax 480 4439 0.0093 1.574 269 0.0109 0.095 0.061Wilkes 434 4586 0.0096 1.960 277 0.0112 0.118 0.060Avery 222 1325 0.0028 1.813 80 0.0032 0.109 0.060Jackson 205 1830 0.0038 1.245 109 0.0044 0.074 0.060Mitchell 106 766 0.0016 1.695 45 0.0018 0.100 0.059Bladen 259 2750 0.0057 1.846 159 0.0064 0.107 0.058Rutherford 431 3848 0.0080 1.773 223 0.0090 0.103 0.058Duplin 370 4654 0.0097 2.155 264 0.0107 0.122 0.057Caldwell 448 5117 0.0107 2.225 289 0.0117 0.126 0.056Union 475 7111 0.0149 2.003 400 0.0162 0.113 0.056Vance 253 3232 0.0068 1.971 182 0.0074 0.111 0.056Carteret 332 3766 0.0079 1.427 212 0.0086 0.080 0.056Robeson 709 8399 0.0176 1.412 473 0.0191 0.079 0.056Iredell 527 7100 0.0148 1.187 397 0.0161 0.066 0.056Nash 531 5418 0.0113 1.160 304 0.0123 0.065 0.056Harnett 391 6227 0.0130 2.147 345 0.0139 0.119 0.055Edgecombe 538 4082 0.0085 2.051 223 0.0090 0.112 0.055Scotland 404 2505 0.0052 1.898 139 0.0056 0.105 0.055McDowell 240 3586 0.0075 1.587 199 0.0080 0.088 0.055Moore 550 3903 0.0082 1.561 216 0.0087 0.086 0.055Davidson 715 8286 0.0173 1.509 457 0.0185 0.083 0.055Lee 295 4243 0.0089 2.122 225 0.0091 0.113 0.053Cleveland 694 6812 0.0142 2.009 353 0.0143 0.104 0.052Wayne 564 6078 0.0127 1.917 315 0.0127 0.099 0.052Buncombe 785 11364 0.0238 1.476 586 0.0237 0.076 0.052Orange 462 6599 0.0138 1.598 330 0.0133 0.080 0.050

Table C.4, continued. Road segment data: crashes for each county ranked by severity.
County # ofsegments
# of KABCOCrashes
# KABCOfor county/
# of KABCOall counties
# ofKABCO
Crashes permillionvehiclemiles
# ofK+A
Crashes
# of K+Afor county/
# of K+A allcounties
# ofK+A
Crashesper million
vehiclemiles
Crashseverity (#
of K+Acrashes/
# ofKABCOcrashes)
Wilson 421 4904 0.0102 1.504 245 0.0099 0.075 0.050Johnston 597 8109 0.0169 1.474 407 0.0165 0.074 0.050Pasquotank 187 2207 0.0046 2.287 108 0.0044 0.112 0.049Brunswick 269 4148 0.0087 1.401 205 0.0083 0.069 0.049Franklin 190 3226 0.0067 2.210 156 0.0063 0.107 0.048Henderson 384 4827 0.0101 1.801 231 0.0093 0.086 0.048Ashe 215 1681 0.0035 2.172 78 0.0032 0.101 0.046Durham 673 15097 0.0316 1.654 696 0.0281 0.076 0.046Catawba 775 11056 0.0231 2.110 482 0.0195 0.092 0.044Forsyth 917 12029 0.0251 1.094 518 0.0209 0.047 0.043Pitt 466 8383 0.0175 2.260 347 0.0140 0.094 0.041Onslow 329 8022 0.0168 2.204 324 0.0131 0.089 0.040Gaston 849 10500 0.0219 1.659 420 0.0170 0.066 0.040Tyrrell 62 407 0.0009 2.098 15 0.0006 0.077 0.037Caswell 147 2031 0.0042 2.638 73 0.0030 0.095 0.036Granville 305 3293 0.0069 1.470 117 0.0047 0.052 0.036Cumberland 769 17999 0.0376 1.967 625 0.0253 0.068 0.035Guilford 1308 22754 0.0476 1.591 796 0.0322 0.056 0.035Wake 1601 28371 0.0593 1.405 998 0.0403 0.049 0.035Watauga 254 3060 0.0064 2.170 103 0.0042 0.073 0.034Cabarrus 549 8100 0.0169 1.971 278 0.0112 0.068 0.034Mecklenberg 1057 31940 0.0668 1.805 915 0.0370 0.052 0.029New Hanover 364 10339 0.0216 2.678 252 0.0102 0.065 0.024TOTAL 38198 478,449 1.0000 24735 1.0000 0.052

TABLE C.5 --TWENTY COUNTIES WITH HIGHEST INJURYSEVERITY (%K+A) ON RURAL TWO-LANE ROADS
COUNTY PERCENT K+A KABCOOF
CRASHESMILLION MILLION
THAT AREK+A
VEHICLEMILES
VEHICLE MILES
Graham 12.36 0.26 2.12Clay 11.74 0.23 1.99Swain 10.60 0.09 0.89Stokes 10.52 0.20 1.94Columbus 10.36 0.20 1.97Haywood 10.09 0.23 2.28Dare 9.98 0.06 0.58Camden 9.92 0.13 1.29Richmond 9.27 0.23 2.51Pamlico 8.88 0.15 1.67Alexander 8.87 0.25 2.81Cherokee 8.71 0.19 2.19Pender 8.70 0.17 1.93Lenoir 8.62 0.19 2.18Madison 8.58 0.18 2.12Macon 8.53 0.14 1.60Surry 8.52 0.21 2.46Davie 8.52 0.15 1.78Transylvania
8.23 0.11 1.32
Gates 8.07 0.15 1.86

TABLE C.6 -- TWENTY COUNTIES WITH HIGHESTINJURY SEVERITY (%K+A) ON URBAN TWO-LANEROADS
COUNTY PERCENT KABCO K+AOF
CRASHESMILLION MILLION
THAT AREK+A
VEHICLEMILES
VEHICLEMILES
Davie 15.07 1.20 0.18Rowan 10.58 2.10 0.22Alexander 10.19 3.86 0.39Burke 9.83 3.84 0.38Caldwell 8.74 2.06 0.18Randolph 8.44 1.45 0.12Nash 7.98 1.59 0.13Alamance 7.57 3.16 0.24Wayne 7.48 2.21 0.17Edgecombe
7.24 3.09 0.22
Gaston 7.24 2.03 0.15Chatham 7.17 2.63 0.19Union 7.06 2.66 0.19Buncombe 6.80 2.57 0.17Guilford 6.55 2.56 0.17Mecklenburg
6.54 0.96 0.06
Forsyth 6.44 1.74 0.11Davidson 6.44 2.09 0.13Durham 6.02 1.90 0.11Wake 5.75 2.51 0.14

APPENDIX D: CRASH FACTOR SIGNIFICANCE TABLES

Table D.1. Crash Factor Significance Levels(See Example 2.1 for further explanation)
Sample Size=Number of crashes having given characteristic (N)Proportion=Number of severe crashes divided by the total number of crashesfor each characteristic ((K+A)/(K+A+B+C+O))
Sample Size Proportion Significance=Maximum number of standard errors for the proportion of severe HSIS URBAN 2-LANE 34629 0.062 crashes that fall within the difference between the proportion of severe crashesHSIS RURAL 2-LANE 174048 0.059 for a given characteristic and the proportion of severe crashes for the HSIS OTHER 269773 0.039 roadway system as a whole
*A crash factor is significant when the percentage of severe crashes NON-HSIS URBAN 544878 0.029 associated with that given characteristic are at least 2 standard errors greaterNON-HSIS RURAL 107165 0.061 than the percentage of severe crashes on the roadway system as a wholeHSIS 478450 0.052
HSIS Analysis Urban 2-lane highway Rural 2-lane highway All other HSIS roadsSample Size Proportion Significance Sample Size Proportion Significance Sample Size Proportion Significance
OVERALL 0.062 0.059 0.039
ROAD CHARACTERISTICStraight, level 16568 0.050 0 153779 0.048 0 118766 0.036 0Straight, hillcrest 1462 0.071 0 9895 0.056 0 6661 0.037 0Straight, grade 6653 0.053 0 42039 0.054 0 30769 0.039 0Striaght, bottom 731 0.045 0 4191 0.061 0 2292 0.050 0Curved, level 4316 0.099 4 30933 0.091 5 6408 0.055 2Curved, hillcrest 428 0.101 1 2614 0.076 1 1168 0.049 0Curved, grade 4092 0.085 2 23937 0.088 5 7014 0.058 2Curved, bottom 340 0.071 0 1895 0.092 2 539 0.056 0
0.062 0.059 0.039ROAD FEATUREBridge 504 0.075 0 3573 0.101 4 4658 0.044 0Underpass 18 0.000 0 241 0.058 0 993 0.082 2Public driveway 1547 0.041 0 12672 0.042 0 6876 0.034 0Private driveway 2531 0.054 0 16186 0.061 0 1371 0.042 0Alley intersection 19 0.053 0 273 0.029 0 197 0.015 0Intersection of roadway 10320 0.061 0 79308 0.056 0 49331 0.043 1Median crossing 22 0.046 0 303 0.043 0 1587 0.052 1Begin/End divided hwy. 27 0.074 0 277 0.065 0 629 0.043 0Interchange ramp 111 0.018 0 785 0.036 0 7932 0.028 0Interchange service road 3 0.000 0 79 0.038 0 282 0.039 0Railroad crossing 90 0.111 0 713 0.067 0 382 0.042 0
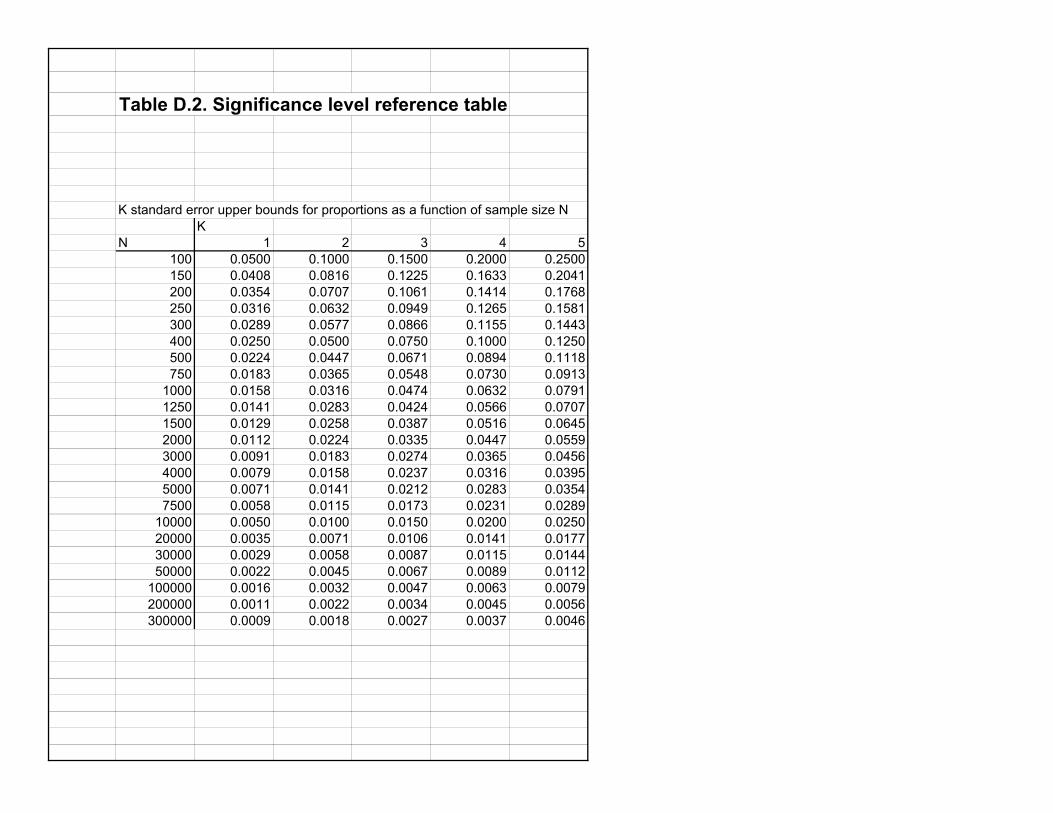
Table D.2. Significance level reference table
K standard error upper bounds for proportions as a function of sample size NK
N 1 2 3 4 5100 0.0500 0.1000 0.1500 0.2000 0.2500150 0.0408 0.0816 0.1225 0.1633 0.2041200 0.0354 0.0707 0.1061 0.1414 0.1768250 0.0316 0.0632 0.0949 0.1265 0.1581300 0.0289 0.0577 0.0866 0.1155 0.1443400 0.0250 0.0500 0.0750 0.1000 0.1250500 0.0224 0.0447 0.0671 0.0894 0.1118750 0.0183 0.0365 0.0548 0.0730 0.0913
1000 0.0158 0.0316 0.0474 0.0632 0.07911250 0.0141 0.0283 0.0424 0.0566 0.07071500 0.0129 0.0258 0.0387 0.0516 0.06452000 0.0112 0.0224 0.0335 0.0447 0.05593000 0.0091 0.0183 0.0274 0.0365 0.04564000 0.0079 0.0158 0.0237 0.0316 0.03955000 0.0071 0.0141 0.0212 0.0283 0.03547500 0.0058 0.0115 0.0173 0.0231 0.0289
10000 0.0050 0.0100 0.0150 0.0200 0.025020000 0.0035 0.0071 0.0106 0.0141 0.017730000 0.0029 0.0058 0.0087 0.0115 0.014450000 0.0022 0.0045 0.0067 0.0089 0.0112
100000 0.0016 0.0032 0.0047 0.0063 0.0079200000 0.0011 0.0022 0.0034 0.0045 0.0056300000 0.0009 0.0018 0.0027 0.0037 0.0046

APPENDIX E: HSIS AND NON-HSIS SAMPLE SIZE TABLES

HSIS Analysis Urban 2-lane highway Rural 2-lane highway All other HSIS roadsSample Size Proportion Significance Sample Size Proportion Significance Sample Size Proportion Significance
OVERALL 0.062 0.059 0.039
ROAD CONFIGURATIONUndivided, one-way 109 0.064 0 3645 0.030 0 7038 0.025 0Undivided, two-way 33617 0.063 0 249955 0.060 0 75454 0.035 0Divided 876 0.039 0 15713 0.059 0 91016 0.043 0
ROAD DEFECTLoose material 264 0.049 0 2185 0.053 0 1620 0.046 0Holes, deep ruts 48 0.083 0 347 0.035 0 293 0.041 0Low shoulders 212 0.076 0 1085 0.096 2 273 0.059 0Soft shoulders 196 0.071 0 1086 0.065 0 313 0.067 1Repairs, defects 64 0.063 0 641 0.050 0 915 0.023 0Under construction 346 0.043 0 3180 0.054 0 5920 0.033 0Other defects 62 0.032 0 472 0.064 0 314 0.051 0No defects 33420 0.062 0 260428 0.059 0 163893 0.039 0
ROAD SURFACE CONDITIONDry 25393 0.067 1 202842 0.062 3 128271 0.041 1Wet 7498 0.054 0 56169 0.049 0 38914 0.032 0Muddy 23 0.087 0 230 0.034 0 146 0.069 0Snowy 316 0.044 0 2501 0.032 0 1376 0.027 0Icy 1348 0.038 0 7377 0.040 0 4744 0.032 0Other 17 0.177 0 169 0.083 0 120 0.058 0
ROAD SURFACEConcrete 219 0.078 0 1364 0.035 0 17130 0.048 1Grooved concrete 167 0.072 0 1415 0.060 0 2795 0.045 0Smooth asphalt 26134 0.064 0 201408 0.059 0 114213 0.038 0Coarse asphalt 7864 0.055 0 63429 0.058 0 37395 0.036 0Gravel 64 0.063 0 451 0.049 0 761 0.041 0Sand 5 0.000 0 91 0.000 0 105 0.029 0Soil 123 0.033 0 1032 0.050 0 982 0.043 0Other 27 0.037 0 165 0.073 0 182 0.028 0

HSIS Analysis Urban 2-lane highway Rural 2-lane highway All other HSIS roadsSample Size Proportion Significance Sample Size Proportion Significance Sample Size Proportion Significance
OVERALL 0.062 0.059 0.039
TRAFFIC CONTROLNo traffic signal 34262 0.062 0 264476 0.059 0 165525 0.038 0Traffic signal 367 0.087 0 5297 0.059 0 8523 0.062 3
ACCIDENT TYPEROR, hit fixed object 5289 0.097 4 30087 0.101 5 17633 0.064 5ROR, rollover 141 0.135 1 1102 0.122 4 821 0.091 2ROR, other 6567 0.070 1 46840 0.079 5 9720 0.082 5Head-on 457 0.359 5 3061 0.368 5 844 0.224 5Rear-end/sideswipe 8136 0.022 0 70013 0.023 0 74501 0.016 0Angle/turn 9178 0.068 1 77682 0.058 0 56783 0.043 1Pedestrian/bicycle 386 0.329 5 3665 0.345 5 2132 0.330 5Animal 3342 0.005 0 26666 0.004 0 4532 0.004 0Park/brake 396 0.018 0 4236 0.015 0 1627 0.011 0Train 22 0.318 0 149 0.095 0 39 0.000 0Other 715 0.048 0 6272 0.045 0 5416 0.029 0
MEANS OF INVOLVEMENTRan-off-road 11039 0.081 3 71722 0.088 5 23397 0.072 5Hit fixed object 175 0.046 0 1671 0.051 0 2109 0.028 0Hit non-fixed object 540 0.072 0 4232 0.069 1 3867 0.039 0Car vs. car 8263 0.046 0 74384 0.040 0 65188 0.025 0Car vs. truck, bus 7010 0.056 0 56212 0.049 0 44983 0.028 02+ vehicles involved 1572 0.088 2 13836 0.075 3 15243 0.048 1Other 1,2 vehicle acciden 6030 0.051 0 47716 0.051 0 19261 0.062 4
RAN-OFF-ROAD, OBJECT STRUCK* 0.097 0.101 0.064Parked vehicle 123 0.041 0 890 0.045 0 488 0.103 1Tree 2497 0.126 2 13224 0.135 5 3228 0.084 2Utility pole 812 0.108 0 5161 0.099 0 1534 0.085 1Traffic island 21 0.143 0 323 0.065 0 818 0.070 0Mailbox 470 0.055 0 2163 0.051 0 132 0.068 0Fence/fence post 549 0.040 0 2739 0.045 0 431 0.033 0Other 817 0.065 0 5587 0.079 0 11002 0.055 0

HSIS Analysis Urban 2-lane highway Rural 2-lane highway All other HSIS roadsSample Size Proportion Significance Sample Size Proportion Significance Sample Size Proportion Significance
OVERALL 0.062 0.059 0.039
NUMBER OF VEHICLES1 14759 0.064 0 101966 0.065 3 31328 0.055 52 18298 0.058 0 153971 0.053 0 127477 0.034 03 1572 0.088 2 13836 0.075 3 15243 0.048 1
BICYCLE AND PEDESTRIANNo bicycle involved 34473 0.061 0 268578 0.058 0 173432 0.038 0Bicycle involved 156 0.212 3 1195 0.240 5 616 0.175 5No pedestrian involved 34443 0.060 0 267714 0.056 0 172784 0.036 0Pedestrian involved 186 0.468 5 2059 0.439 5 1264 0.431 5
VEHICLE TYPE* 0.073 0.072 0.048Pedestrian 354 0.469 5 4003 0.440 5 2418 0.431 5Bicycle 293 0.218 4 2185 0.243 5 1131 0.177 5Bus 291 0.065 0 1927 0.042 0 1107 0.040 0Small truck 26408 0.059 0 194185 0.058 0 108586 0.036 0Large truck 1526 0.083 1 16459 0.087 3 21262 0.055 1Car 8024 0.055 0 59588 0.053 0 42778 0.037 0Motorcycle 1181 0.336 5 7320 0.303 5 2774 0.247 5Other 262 0.099 1 3026 0.074 0 1839 0.052 1
ALCOHOL INVOLVEMENTNo drink or drug 31965 0.053 0 251470 0.050 0 167033 0.034 0Intoxicated 2664 0.176 5 18303 0.184 5 7015 0.146 5
LIGHTING CONDITIONDaylight 22055 0.055 0 177272 0.054 0 125903 0.033 0Dusk 864 0.074 0 6616 0.059 0 4687 0.031 0Dawn 746 0.072 0 5545 0.057 0 2718 0.047 0Dark, street lit 667 0.060 0 12428 0.057 0 19208 0.047 1Dark, not lit 10269 0.076 2 67476 0.071 5 21115 0.063 5

HSIS Analysis Urban 2-lane highway Rural 2-lane highway All other HSIS roadsSample Size Proportion Significance Sample Size Proportion Significance Sample Size Proportion Significance
OVERALL 0.062 0.059 0.039
WEEKDAYMonday 4915 0.054 0 38459 0.052 0 25574 0.037 0Tuesday 4786 0.060 0 36977 0.053 0 24335 0.037 0Wednesday 4927 0.052 0 37718 0.055 0 25299 0.036 0Thursday 5133 0.058 0 39173 0.053 0 25819 0.034 0Friday 5823 0.067 0 48082 0.054 0 34049 0.036 0Saturday 5142 0.070 1 39523 0.070 3 23016 0.045 1Sunday 3903 0.076 1 29841 0.079 5 15956 0.052 2
WEATHERClear 22083 0.066 1 174899 0.062 1 109844 0.041 1Cloudy 5687 0.061 0 43397 0.060 0 27336 0.038 0Raining 5577 0.051 0 41946 0.048 0 31877 0.032 0Snowing 420 0.043 0 3301 0.033 0 2117 0.033 0Fog, smog, smoke, dust 598 0.062 0 4361 0.062 0 1175 0.054 0Sleet, hail 229 0.022 0 1329 0.041 0 1213 0.027 0

Non-HSIS Analysis Urban Rural HSISSample Size Proportion Significance Sample Size Proportion Significance Sample Size Proportion Significance
OVERALL 0.029 0.061 0.052
ROAD CHARACTERISTICStraight, level 372419 0.026 0 49321 0.047 0 289113 0.043 0Straight, hillcrest 23965 0.031 0 2881 0.053 0 18018 0.050 0Straight, grade 89547 0.029 0 14615 0.056 0 79461 0.048 0Striaght, bottom 7531 0.041 2 1679 0.061 0 7214 0.056 0Curved, level 24318 0.055 5 19298 0.086 5 41657 0.086 5Curved, hillcrest 5361 0.051 3 1588 0.087 2 4210 0.071 2Curved, grade 18175 0.055 5 16258 0.074 2 35043 0.082 5Curved, bottom 1797 0.064 2 1342 0.092 2 2774 0.082 2
ROAD FEATUREBridge 3799 0.038 0 2349 0.087 2 8735 0.069 2Underpass 1120 0.042 0 160 0.100 0 1252 0.076 1Public driveway 58857 0.014 0 4316 0.029 0 21095 0.039 0Private driveway 16268 0.027 0 6329 0.064 0 20088 0.059 1Alley intersection 1122 0.027 0 65 0.031 0 489 0.025 0Intersection of roadway 168636 0.037 5 14621 0.064 0 138959 0.052 0Median crossing 2407 0.040 0 218 0.046 0 1912 0.051 0Begin/End divided hwy. 856 0.035 0 133 0.038 0 933 0.050 0Interchange ramp 5198 0.022 0 1125 0.044 0 8828 0.028 0Interchange service road 371 0.040 0 60 0.050 0 364 0.039 0Railroad crossing 1730 0.054 1 354 0.096 1 1185 0.062 0
ROAD CONFIGURATIONUndivided, one-way 30973 0.019 0 1818 0.040 0 10792 0.027 0Undivided, two-way 399897 0.030 1 91832 0.062 0 359026 0.055 3Divided 105684 0.031 1 12981 0.054 0 107605 0.043 0
ROAD DEFECTLoose material 6488 0.025 0 2290 0.045 0 4069 0.050 0Holes, deep ruts 1559 0.029 0 466 0.054 0 688 0.041 0Low shoulders 1014 0.040 0 514 0.113 2 1570 0.087 1Soft shoulders 769 0.046 0 789 0.051 0 1595 0.067 1Repairs, defects 1639 0.031 0 274 0.044 0 1620 0.035 0Under construction 7695 0.031 0 1838 0.040 0 9446 0.041 0Other defects 863 0.032 0 354 0.037 0 848 0.057 0No defects 523680 0.029 0 100545 0.062 0 457741 0.052 0

Non-HSIS Analysis Urban Rural HSISSample Size Proportion Significance Sample Size Proportion Significance Sample Size Proportion Significance
OVERALL 0.029 0.061 0.052
ROAD SURFACE CONDITIONDry 428071 0.030 1 80107 0.065 1 356506 0.055 3Wet 102563 0.026 0 20831 0.052 0 102581 0.043 0Muddy 675 0.021 0 392 0.043 0 399 0.048 0Snowy 2785 0.020 0 1177 0.024 0 4193 0.032 0Icy 8053 0.021 0 4414 0.032 0 13469 0.037 0Other 643 0.036 0 105 0.067 0 306 0.078 0
ROAD SURFACEConcrete 13900 0.022 0 2429 0.058 0 18713 0.048 0Grooved concrete 4426 0.026 0 817 0.045 0 4377 0.051 0Smooth asphalt 372699 0.030 1 63120 0.062 0 341755 0.053 1Coarse asphalt 142684 0.030 0 30880 0.065 1 108688 0.050 0Gravel 4502 0.019 0 6926 0.040 0 1276 0.045 0Sand 658 0.023 0 1198 0.048 0 201 0.015 0Soil 3470 0.026 0 1531 0.047 0 2137 0.046 0Other 874 0.030 0 182 0.033 0 374 0.048 0
TRAFFIC CONTROLNo traffic signal 443663 0.030 1 104866 0.061 0 464263 0.051 0Traffic signal 98455 0.028 0 2143 0.039 0 14187 0.061 1
ACCIDENT TYPEROR, hit fixed object 3526 0.048 2 980 0.060 0 53009 0.088 5ROR, rollover 367 0.071 1 57 0.070 0 2064 0.110 5ROR, other 2817 0.050 1 1599 0.111 3 63127 0.078 5Head-on 3744 0.157 5 1805 0.197 5 4362 0.339 5Rear-end/sideswipe 153889 0.014 0 16169 0.030 0 152650 0.020 0Angle/turn 200093 0.031 1 16206 0.061 0 143643 0.053 0Pedestrian/bicycle 12677 0.222 5 1463 0.340 5 6183 0.339 5Animal 312 0.035 0 85 0.035 0 34540 0.004 0Park/brake 61452 0.001 0 4102 0.005 0 6259 0.014 0Train 54 0.074 0 8 0.126 0 210 0.171 3Other 42427 0.006 0 2609 0.018 0 12403 0.038 0

Non-HSIS Analysis Urban Rural HSISSample Size Proportion Significance Sample Size Proportion Significance Sample Size Proportion Significance
OVERALL 0.029 0.061 0.052
MEANS OF INVOLVEMENTRan-off-road 42073 0.069 5 44869 0.080 5 106158 0.084 5Hit fixed object 12651 0.021 0 1404 0.033 0 3955 0.039 0Hit non-fixed object 4043 0.078 5 2198 0.086 2 8639 0.055 0Car vs. car 237809 0.018 0 16719 0.040 0 147835 0.034 0Car vs. truck, bus 136716 0.019 0 15623 0.045 0 108205 0.041 0Truck vs. truck 16746 0.031 0 3735 0.043 02+ vehicles involved 43199 0.079 5 4408 0.101 5 30651 0.062 3Other 1,2 vehicle acciden 44632 0.082 5 17351 0.040 0 73007 0.054 0
RAN-OFF-ROAD, OBJECT STRUCK* 0.048 0.060 0.088Parked vehicle 1938 0.035 0 503 0.048 0 1501 0.063 0Tree 221 0.077 0 99 0.141 0 18949 0.125 5Utility pole 362 0.102 1 50 0.040 0 7507 0.097 1Traffic island 202 0.045 0 15 0.000 0 1162 0.070 0Mailbox 115 0.087 0 46 0.065 0 2765 0.052 0Fence/fence post 129 0.047 0 45 0.044 0 3719 0.043 0Other 559 0.056 0 222 0.063 0 17406 0.063 0
NUMBER OF VEHICLES1 63521 0.055 5 62082 0.063 02 437281 0.023 0 40537 0.045 03 or more 44076 0.050 5 4546 0.062 0
BICYCLE AND PEDESTRIANNo bicycle involved 540820 0.028 0 106714 0.060 0 476483 0.051 0Bicycle involved 4058 0.166 5 451 0.275 5 1967 0.218 5No pedestrian involved 537025 0.026 0 106243 0.058 0 474941 0.049 0Pedestrian involved 7853 0.261 5 922 0.371 5 3509 0.437 5
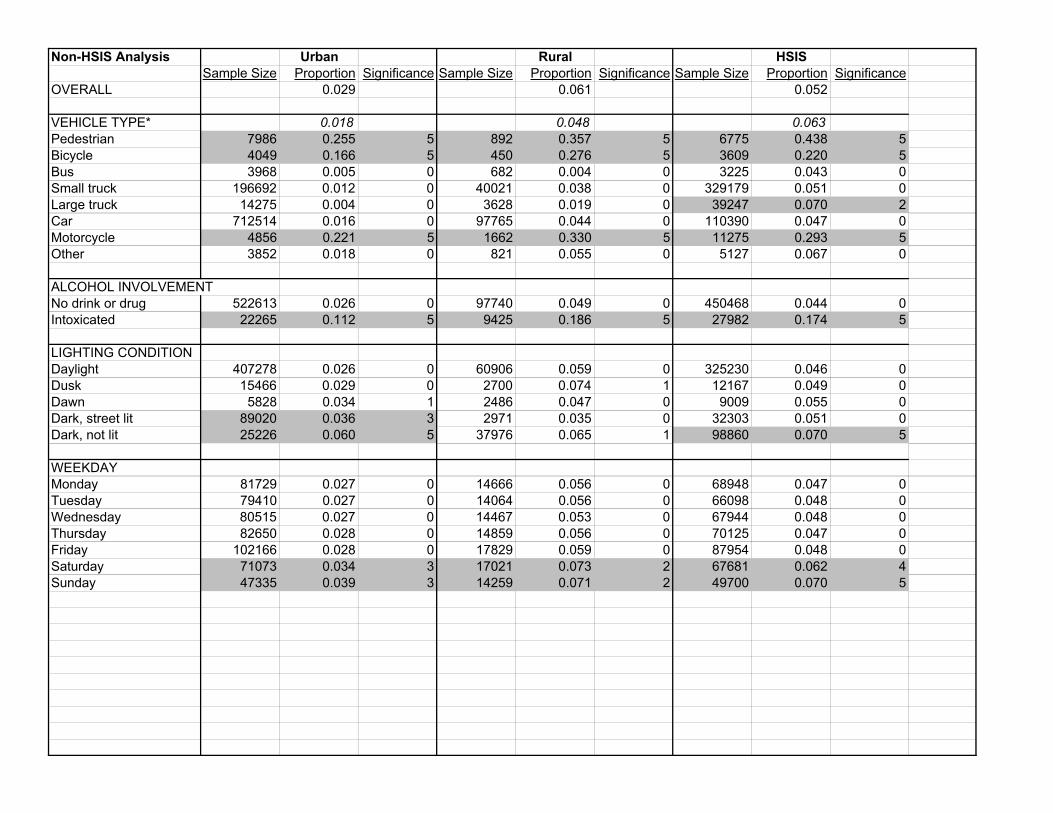
Non-HSIS Analysis Urban Rural HSISSample Size Proportion Significance Sample Size Proportion Significance Sample Size Proportion Significance
OVERALL 0.029 0.061 0.052
VEHICLE TYPE* 0.018 0.048 0.063Pedestrian 7986 0.255 5 892 0.357 5 6775 0.438 5Bicycle 4049 0.166 5 450 0.276 5 3609 0.220 5Bus 3968 0.005 0 682 0.004 0 3225 0.043 0Small truck 196692 0.012 0 40021 0.038 0 329179 0.051 0Large truck 14275 0.004 0 3628 0.019 0 39247 0.070 2Car 712514 0.016 0 97765 0.044 0 110390 0.047 0Motorcycle 4856 0.221 5 1662 0.330 5 11275 0.293 5Other 3852 0.018 0 821 0.055 0 5127 0.067 0
ALCOHOL INVOLVEMENTNo drink or drug 522613 0.026 0 97740 0.049 0 450468 0.044 0Intoxicated 22265 0.112 5 9425 0.186 5 27982 0.174 5
LIGHTING CONDITIONDaylight 407278 0.026 0 60906 0.059 0 325230 0.046 0Dusk 15466 0.029 0 2700 0.074 1 12167 0.049 0Dawn 5828 0.034 1 2486 0.047 0 9009 0.055 0Dark, street lit 89020 0.036 3 2971 0.035 0 32303 0.051 0Dark, not lit 25226 0.060 5 37976 0.065 1 98860 0.070 5
WEEKDAYMonday 81729 0.027 0 14666 0.056 0 68948 0.047 0Tuesday 79410 0.027 0 14064 0.056 0 66098 0.048 0Wednesday 80515 0.027 0 14467 0.053 0 67944 0.048 0Thursday 82650 0.028 0 14859 0.056 0 70125 0.047 0Friday 102166 0.028 0 17829 0.059 0 87954 0.048 0Saturday 71073 0.034 3 17021 0.073 2 67681 0.062 4Sunday 47335 0.039 3 14259 0.071 2 49700 0.070 5

Non-HSIS Analysis Urban Rural HSISSample Size Proportion Significance Sample Size Proportion Significance Sample Size Proportion Significance
OVERALL 0.029 0.061 0.052
WEATHERClear 366692 0.030 1 70395 0.064 1 306826 0.055 4Cloudy 90963 0.028 0 17492 0.060 0 76420 0.052 0Raining 77106 0.026 0 14944 0.050 0 79400 0.041 0Snowing 3762 0.024 0 1466 0.027 0 5838 0.034 0Fog, smog, smoke, dust 2380 0.041 1 2076 0.058 0 6134 0.061 1Sleet, hail 1769 0.022 0 653 0.031 0 2771 0.004 0
*Data set used for variable is different from roadway system crash files used for other variables. Percent of crashes that are K+A forthe data set is given in parentheses.